
Analysis of deep convolutional GAN-based data augmentation for early detection of Alzheimer’s disease
- Published
- Accepted
- Received
- Academic Editor
- Aurora Saibene
- Subject Areas
- Artificial Intelligence, Computer Vision, Data Mining and Machine Learning, Data Science, Neural Networks
- Keywords
- Alzheimer’s disease, Deep convolutional GAN, Synthetic MRI generation, Data augmentation, CNN, Medical image analysis, Good health and Well being
- Copyright
- © 2026 Shetty et al.
- Licence
- This is an open access article distributed under the terms of the Creative Commons Attribution License, which permits unrestricted use, distribution, reproduction and adaptation in any medium and for any purpose provided that it is properly attributed. For attribution, the original author(s), title, publication source (PeerJ Computer Science) and either DOI or URL of the article must be cited.
- Cite this article
- 2026. Analysis of deep convolutional GAN-based data augmentation for early detection of Alzheimer’s disease. PeerJ Computer Science 12:e3453 https://doi.org/10.7717/peerj-cs.3453
Abstract
Early and accurate detection of Alzheimer’s disease (AD), particularly at the very mild and mild cognitive impairment stages, remains a significant clinical challenge due to subtle anatomical changes and overlapping imaging features between classes. This study evaluates the effectiveness of synthetic MRI image augmentation using Deep Convolutional Generative Adversarial Networks (DCGANs) to improve the classification performance of deep learning models for early-stage AD detection. The dataset consists of Magnetic Resonance Imaging (MRI) scans categorized into “No Dementia,” “Very Mild Dementia,” “Mild Dementia,” and “Moderate Dementia” classes, sourced from a publicly available repository. A baseline Convolutional Neural Network (CNN) was initially trained on traditionally augmented images and evaluated on a validation set. To address class imbalance and improve sensitivity for the “Very Mild Dementia” class, a DCGAN was trained on this subset to generate synthetic MRI images. Generator models were checkpointed based on their Frechet Inception Distance (FID) scores, and 500 synthetic images from each selected generator were incorporated into the training set. Comparative analysis revealed that while the baseline CNN achieved a validation accuracy of 98% and a precision of 0.97 for the “Very Mild Dementia” class, the augmented model utilizing synthetic images from the Epoch 72 generator improved performance to 99% accuracy with a macro F1-score of 1.00. Statistical significance was confirmed via McNemar’s test (p < 0.05), highlighting the potential of GAN-based augmentation for enhancing early AD classification. These findings underscore the importance of strategic checkpoint selection in GAN-based data augmentation to ensure clinically meaningful performance improvements.
Introduction
Alzheimer’s disease (AD) is a progressive neurodegenerative disorder that primarily impairs memory, reasoning, and cognitive abilities, particularly affecting the aging population worldwide. Early-stage detection is critical, as timely diagnosis can slow the progression of the disease, enhance patient care, and improve overall quality of life. Among neuroimaging modalities, Magnetic Resonance Imaging (MRI) has proven to be particularly valuable for the early diagnosis of AD due to its high-resolution depiction of anatomical changes in the brain. However, manual interpretation of MRI scans is both time-consuming and subject to inter-observer variability, often limiting its clinical utility.
In recent years, deep learning models have gained significant traction for automating the classification of AD stages from MRI data (Tufail et al., 2024; Rahman et al., 2024; Gunawardena et al., 2017). These methods have demonstrated impressive performance, particularly in distinguishing between normal and diseased brain structures. Despite these advances, class imbalance remains a persistent challenge in publicly available AD MRI datasets. Specifically, categories such as “Moderate Dementia” is significantly underrepresented compared to “No Dementia”, leading to biased model training and poor generalization on minority classes (Tufail et al., 2024).
To mitigate class imbalance, conventional data augmentation techniques, such as image rotations, brightness adjustments, blurring, and noise injection have been applied to increase dataset diversity synthetically (Sabha, Mehta & Kumar, 2023; Liu et al., 2022). While these methods offer improvements, handcrafted transformations often fall short in replicating the complex anatomical variations inherent in real MRI data, which can limit the robustness of trained models (Hernandez et al., 2023).
The proposed study presents a baseline Convolutional Neural Network (CNN) model which exhibited notable misclassifications among the early stages of AD, particularly between the “No Dementia”, “Very Mild Dementia” and “Mild Dementia” categories. This overlap indicated that the model is yet to establish a clear decision boundary between these closely related classes, likely due to subtle feature differences or overlapping features and class imbalance within the dataset. To address this limitation, a Deep Convolutional Generative Adversarial Network (DCGAN) is presented to synthetically generate additional samples for the “Very Mild Dementia” class as it is the middle stage between “No Dementia” and “Mild Dementia”. By increasing the representation of this class, the goal was to enhance the discriminative capability of the classifier and refine the decision boundaries, thereby improving the model’s ability to distinguish between the early stages of AD progression.
Unlike prior studies that applied Generative Adversarial Networks (GAN)-based augmentation without rigorously assessing model variability and reliability, the present work introduces a comprehensive evaluation framework. This includes checkpoint-wise performance tracking using Fréchet Inception Distance (FID), statistical comparison via McNemar’s test, and qualitative visual inspection of generated images. This multipronged approach ensures both statistical validity and practical improvements in model performance, contributing to more reliable early-stage AD detection systems.
Related works
Class imbalance in medical imaging datasets significantly hinders the performance of diagnostic models, particularly in AD classification. Tufail et al. (2024) addressed this issue using a GAN-based data augmentation technique to enhance minority class representation, resulting in improved diagnostic accuracy. Similarly Karnati & Reddy (2024) integrated GANs to balance datasets, demonstrating enhanced feature learning and classification performance. Krishna, Sahu & Balaji (2024) employed a Synthetic Minority Over-sampling Technique (SMOTE)-based augmentation framework to accurately classify AD progression across multiple stages, mitigating class imbalance. Ryspayeva & Nishan (2024) preprocessing a Breast Ultrasound Images dataset and using a DCGAN with Wasserstein Gradient Penalty and Transfer Learning (via VGG19) to generate synthetic images, producing high-quality synthetic images suitable for medical applications. In dermatology, Setiawan et al. (2024) utilized GANs to generate synthetic skin images, enriching underrepresented classes and enhancing diagnostic model accuracy.
Sabha, Mehta & Kumar (2023) conducted a comparative analysis of oversampling techniques, including SMOTE, Adaptive Synthetic Sampling (ADASYN), and GAN-based methods, on small and imbalanced medical datasets. The study found that deep learning models trained on augmented datasets showed improved accuracy, precision, and recall, underscoring the effectiveness of GANs and SMOTE in mitigating class imbalance. Rahman et al. (2024) employed a hybrid CNN-Support Vector Machine (SVM) approach on enhanced MRI data for AD classification. By leveraging the feature extraction capabilities of CNNs and the robust classification power of SVMs, the model achieved high accuracy and precision. This study highlighted the effectiveness of combining deep learning and traditional machine learning techniques for medical image classification. Saravanan, Karthikeyan & Karthik (2024) applied ADASYN to streamline deep learning-based AD classification. By adaptively oversampling minority classes, ADASYN improved model sensitivity and balanced the class distribution, leading to more accurate and generalizable predictions. Uysal & Ozturk (2020) explored the classification of early and late mild cognitive impairment stages by analyzing different brain areas. The study demonstrated that targeted regional analysis improves diagnostic accuracy, highlighting the importance of localized feature extraction in AD classification.
Gunawardena et al. (2017) utilized CNN on structural MRI data for pre-detection of AD. By leveraging the deep feature extraction capabilities of CNNs, the study achieved high accuracy and early detection, paving the way for more accurate and timely diagnoses. A lightweight CNN framework enhanced with a novel Spatial Attention Module (SAM) tailored for AD detection from MRI images was proposed by Roy et al. (2024). The core innovation lies in replacing conventional spatial filters with dilated convolutions, allowing the extraction of multi-scale spatial features while maintaining computational efficiency. The SAM is connected in parallel to the CNN and maps high-dimensional features to a lower-dimensional spatial space without reducing spatial resolution.
Yao et al. (2025) combined the localized extraction capabilities of CNNs with the powerful context-awareness of transformer modules for global feature fusion. Feature engineering is performed through triplet attention mechanisms to optimize channel, spatial height, and width dimensions, maximizing the synergy between Positron Emission Tomography (PET) and MRI data. Collectively, these studies underscore the significance of advanced data augmentation techniques, including GANs, SMOTE, and ADASYN, in addressing class imbalance in medical imaging. They demonstrate the effectiveness of deep learning models, particularly CNNs, attention models and hybrid architectures, in enhancing classification performance and generalization. These approaches provide a comprehensive framework for developing robust predictive models for early AD detection.
Materials and Methods
The AD MRI dataset https://www.kaggle.com/datasets/uraninjo/augmented-alzheimer-mri-dataset-v2 utilized in this study was divided into two subsets: a training set, consisting of traditionally augmented images created through techniques such as rotation, brightness and contrast adjustment, zooming, blurring, and cropping, and a validation set, comprising exclusively original, unaltered MRI images (Sait & Nagaraj, 2024; Venkatraman et al., 2025; Xun, Yin & Zhang, 2022). Their class distribution is shown in Table 1. All images were resized to 176 208 pixels and processed in grayscale to ensure consistency across baseline and augmented model experiments. The dataset closely mimics real-world clinical settings by providing brain MRI images across progressive stages of cognitive decline, which has been primarily sourced from Alzheimer’s Disease Neuroimaging Initiative (ADNI), thereby making it highly relevant for early-stage AD research. The overall methodology is illustrated in Fig. 1 and steps are summarized in Algorithm 1.
| Set | Moderate dementia | Mild dementia | Very mild dementia | No dementia |
|---|---|---|---|---|
| Train | 6,464 | 8,960 | 8,960 | 9,600 |
| Val | 64 | 896 | 2,240 | 3,200 |
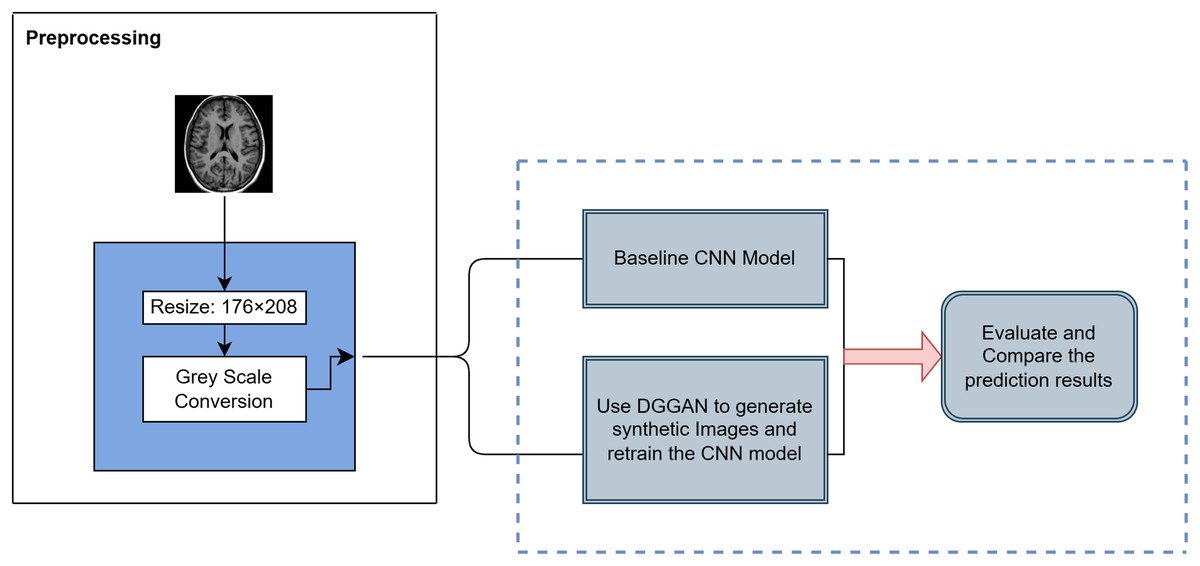
Figure 1: Overview of the proposed methodology for AD classification.
| 1. Preprocessing: Normalize images to [0, 1] using ImageDataGenerator. Set batch size = 32 with sparse labels for training and validation. |
| 2. Baseline CNN Construction: |
| • 3 Conv blocks: Conv2D (32→64→128) → ReLU → BatchNorm → MaxPooling. |
| • Flatten → Dense(128) → ReLU → Dropout(0.5) → Dense(4) → Softmax. |
| • Train with Sparse Categorical Crossentropy, Adam optimizer ( ), Accuracy metric, Early stopping (patience = 3), max 40 epochs. |
| 3. DCGAN for Synthetic Image Generation: |
| • Generator: Dense → Reshape → Conv2DTranspose → BatchNorm → LeakyReLU → Output (176 × 208 × 1, tanh). |
| • Discriminator: Conv2D → LeakyReLU → Dropout → Dense → Sigmoid. |
| • Train with Adam (Generator: , Discriminator: ), Binary crossentropy, label smoothing, Gaussian noise. |
| • Run 100 epochs, evaluate FID, save five best generator checkpoints. |
| 4. CNN Retraining with GAN-Augmented Data: |
| • Generate 500 synthetic “Very Mild Dementia” images per selected generator. |
| • Augment training set, keep validation set real. |
| • Add L2 regularization, increase dropout, retrain with previous settings. |
| 5. Evaluation: |
| • Accuracy and loss curves. |
| • Precision-Recall curves. |
| • Class-wise Precision, Recall, F1-score. |
| • McNemar’s test for significance. |
Baseline CNN model
A baseline CNN model was constructed for multiclass classification of AD MRI images. The dataset was normalized by rescaling pixel values to the [0, 1] range using Keras ImageDataGenerator. Separate ImageDataGenerators were created for training and validation data, both with a batch size of 32, and labels encoded sparsely to match the use of sparse categorical crossentropy loss.
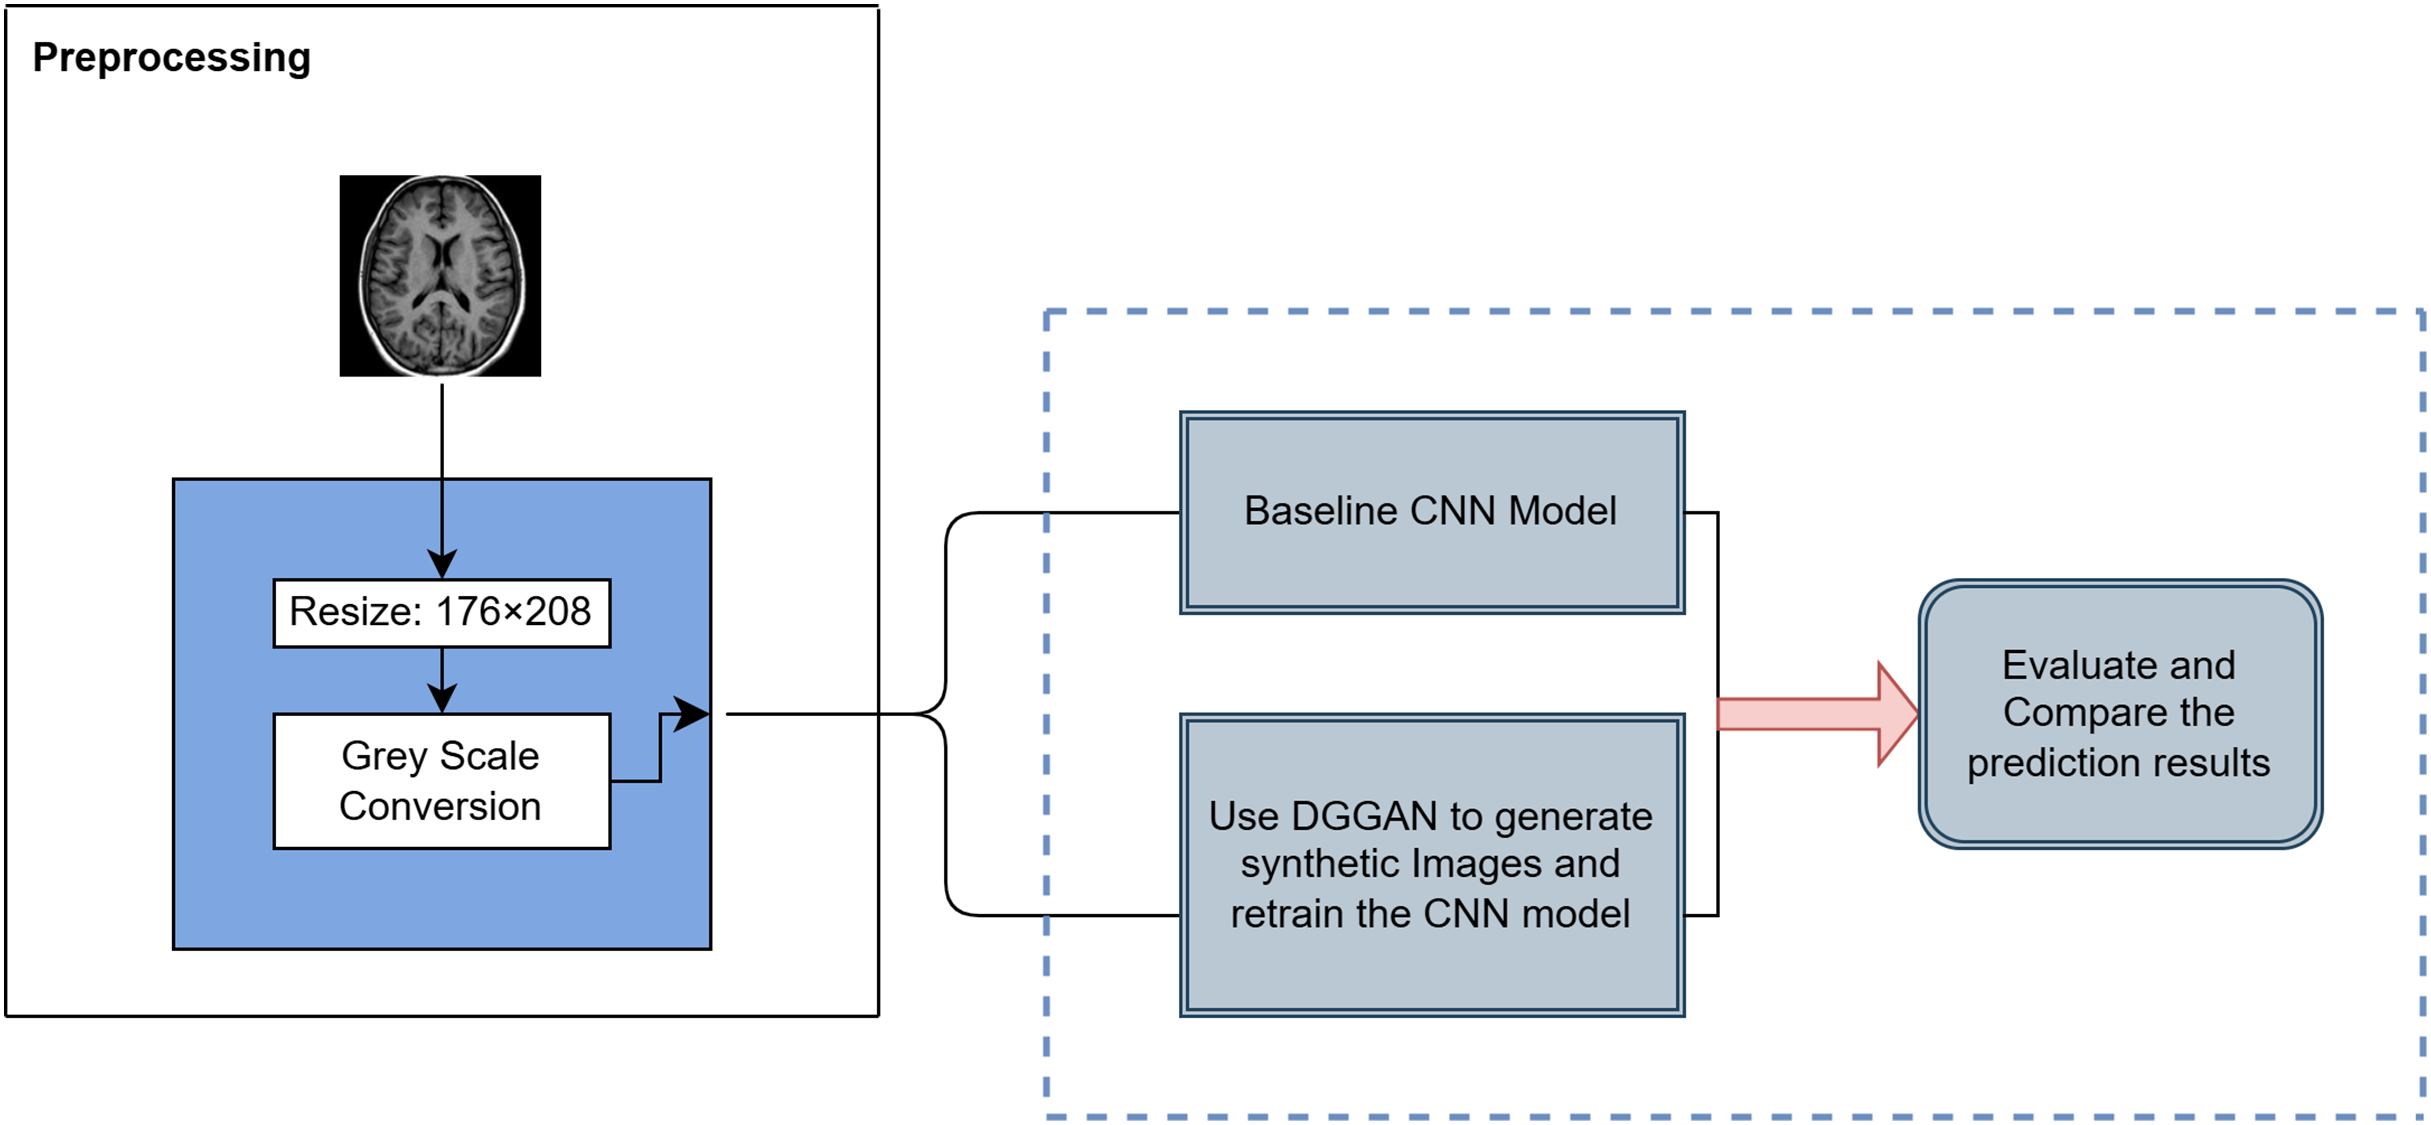
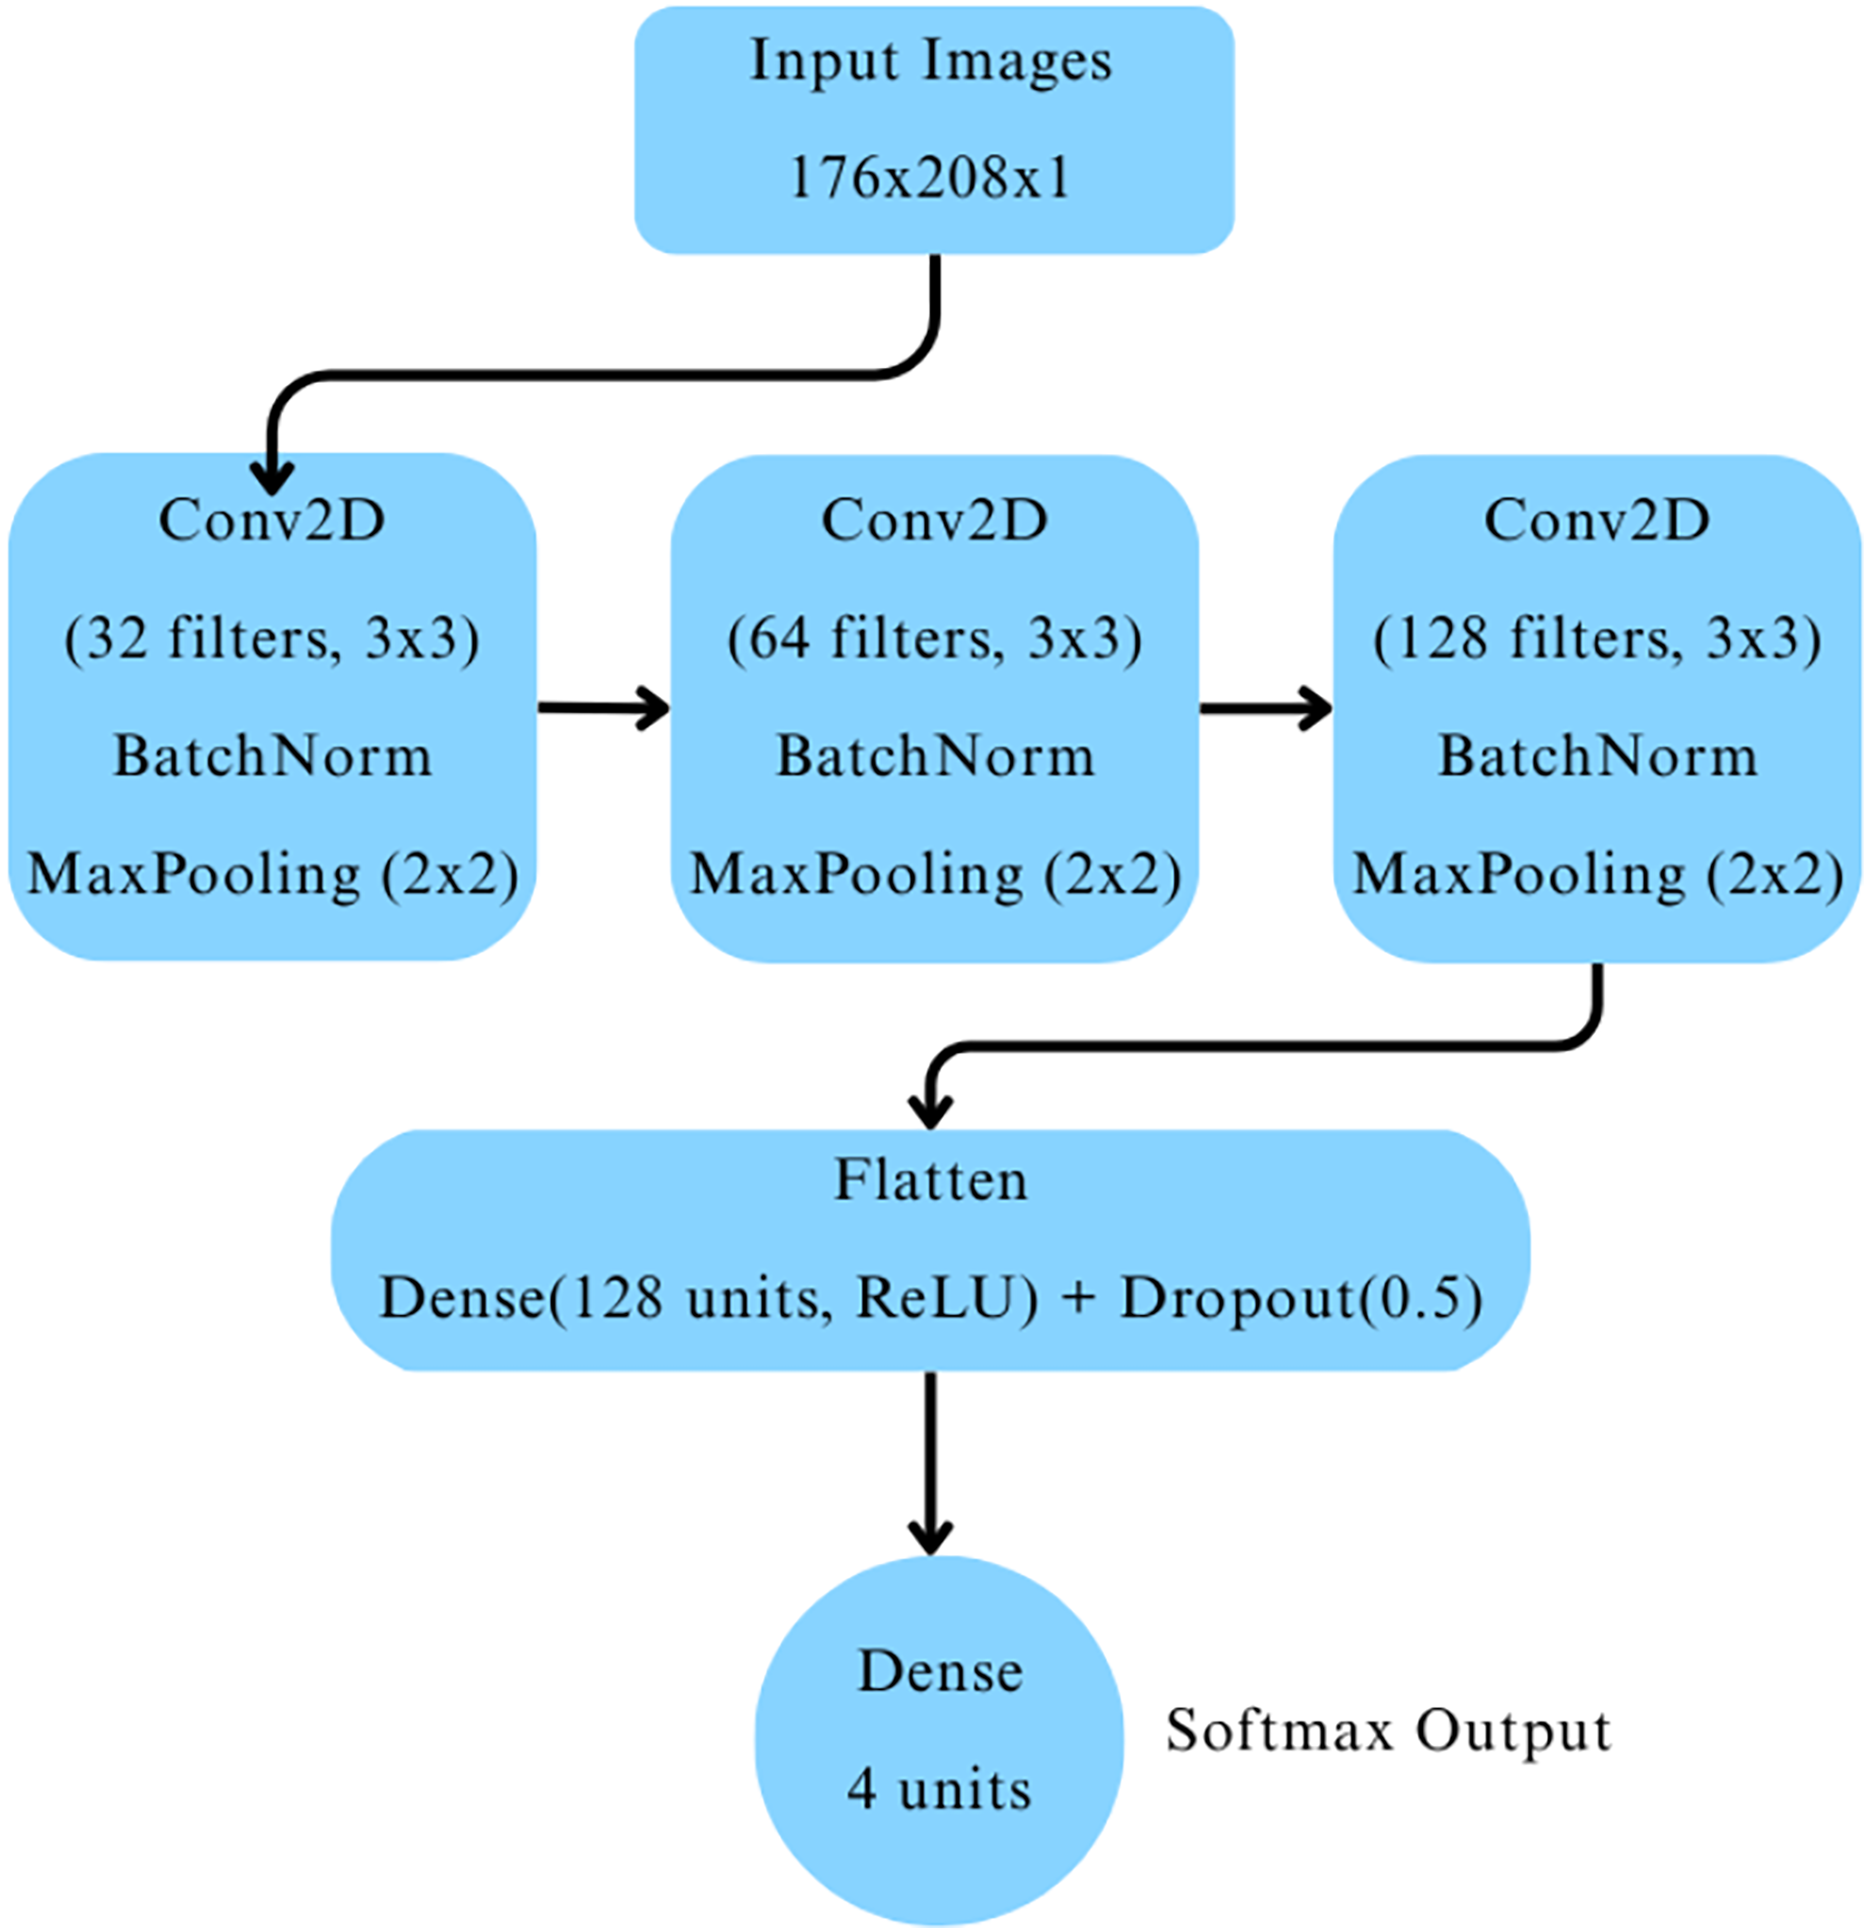
The CNN architecture comprised three convolutional blocks as depicted in Fig. 2. Each block included a two-dimensional convolutional layer with ReLU activation, followed by batch normalization and max-pooling layers. The convolutional layers had 32, 64, and 128 filters, respectively. The output was flattened and passed through a dense layer with 128 neurons activated by ReLU, followed by a dropout layer with a dropout rate of 0.5 to mitigate overfitting. Finally, a dense output layer with four neurons and softmax activation was used to classify images into the four cognitive categories.
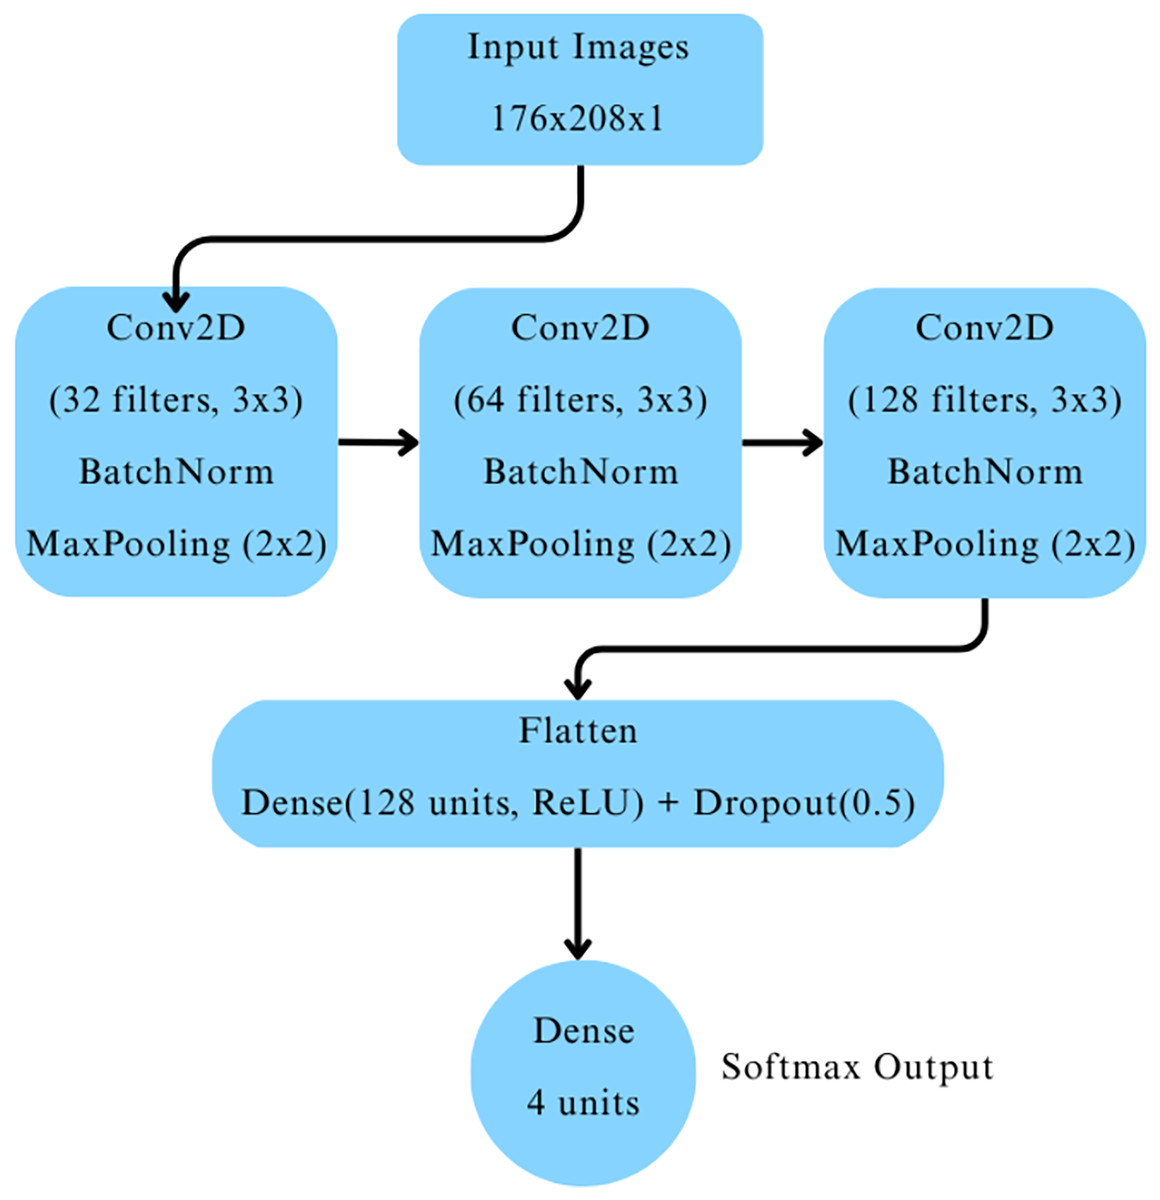
Figure 2: Baseline CNN model architecture.
The model was compiled with the Adam optimizer (learning rate ), using sparse categorical crossentropy as the loss function, and accuracy as the evaluation metric. Early stopping was employed with a patience of three epochs, restoring the best model weights based on validation loss to prevent overfitting. The model was trained for up to 40 epochs, with training monitored using the validation dataset.
DCGAN for synthetic data generation
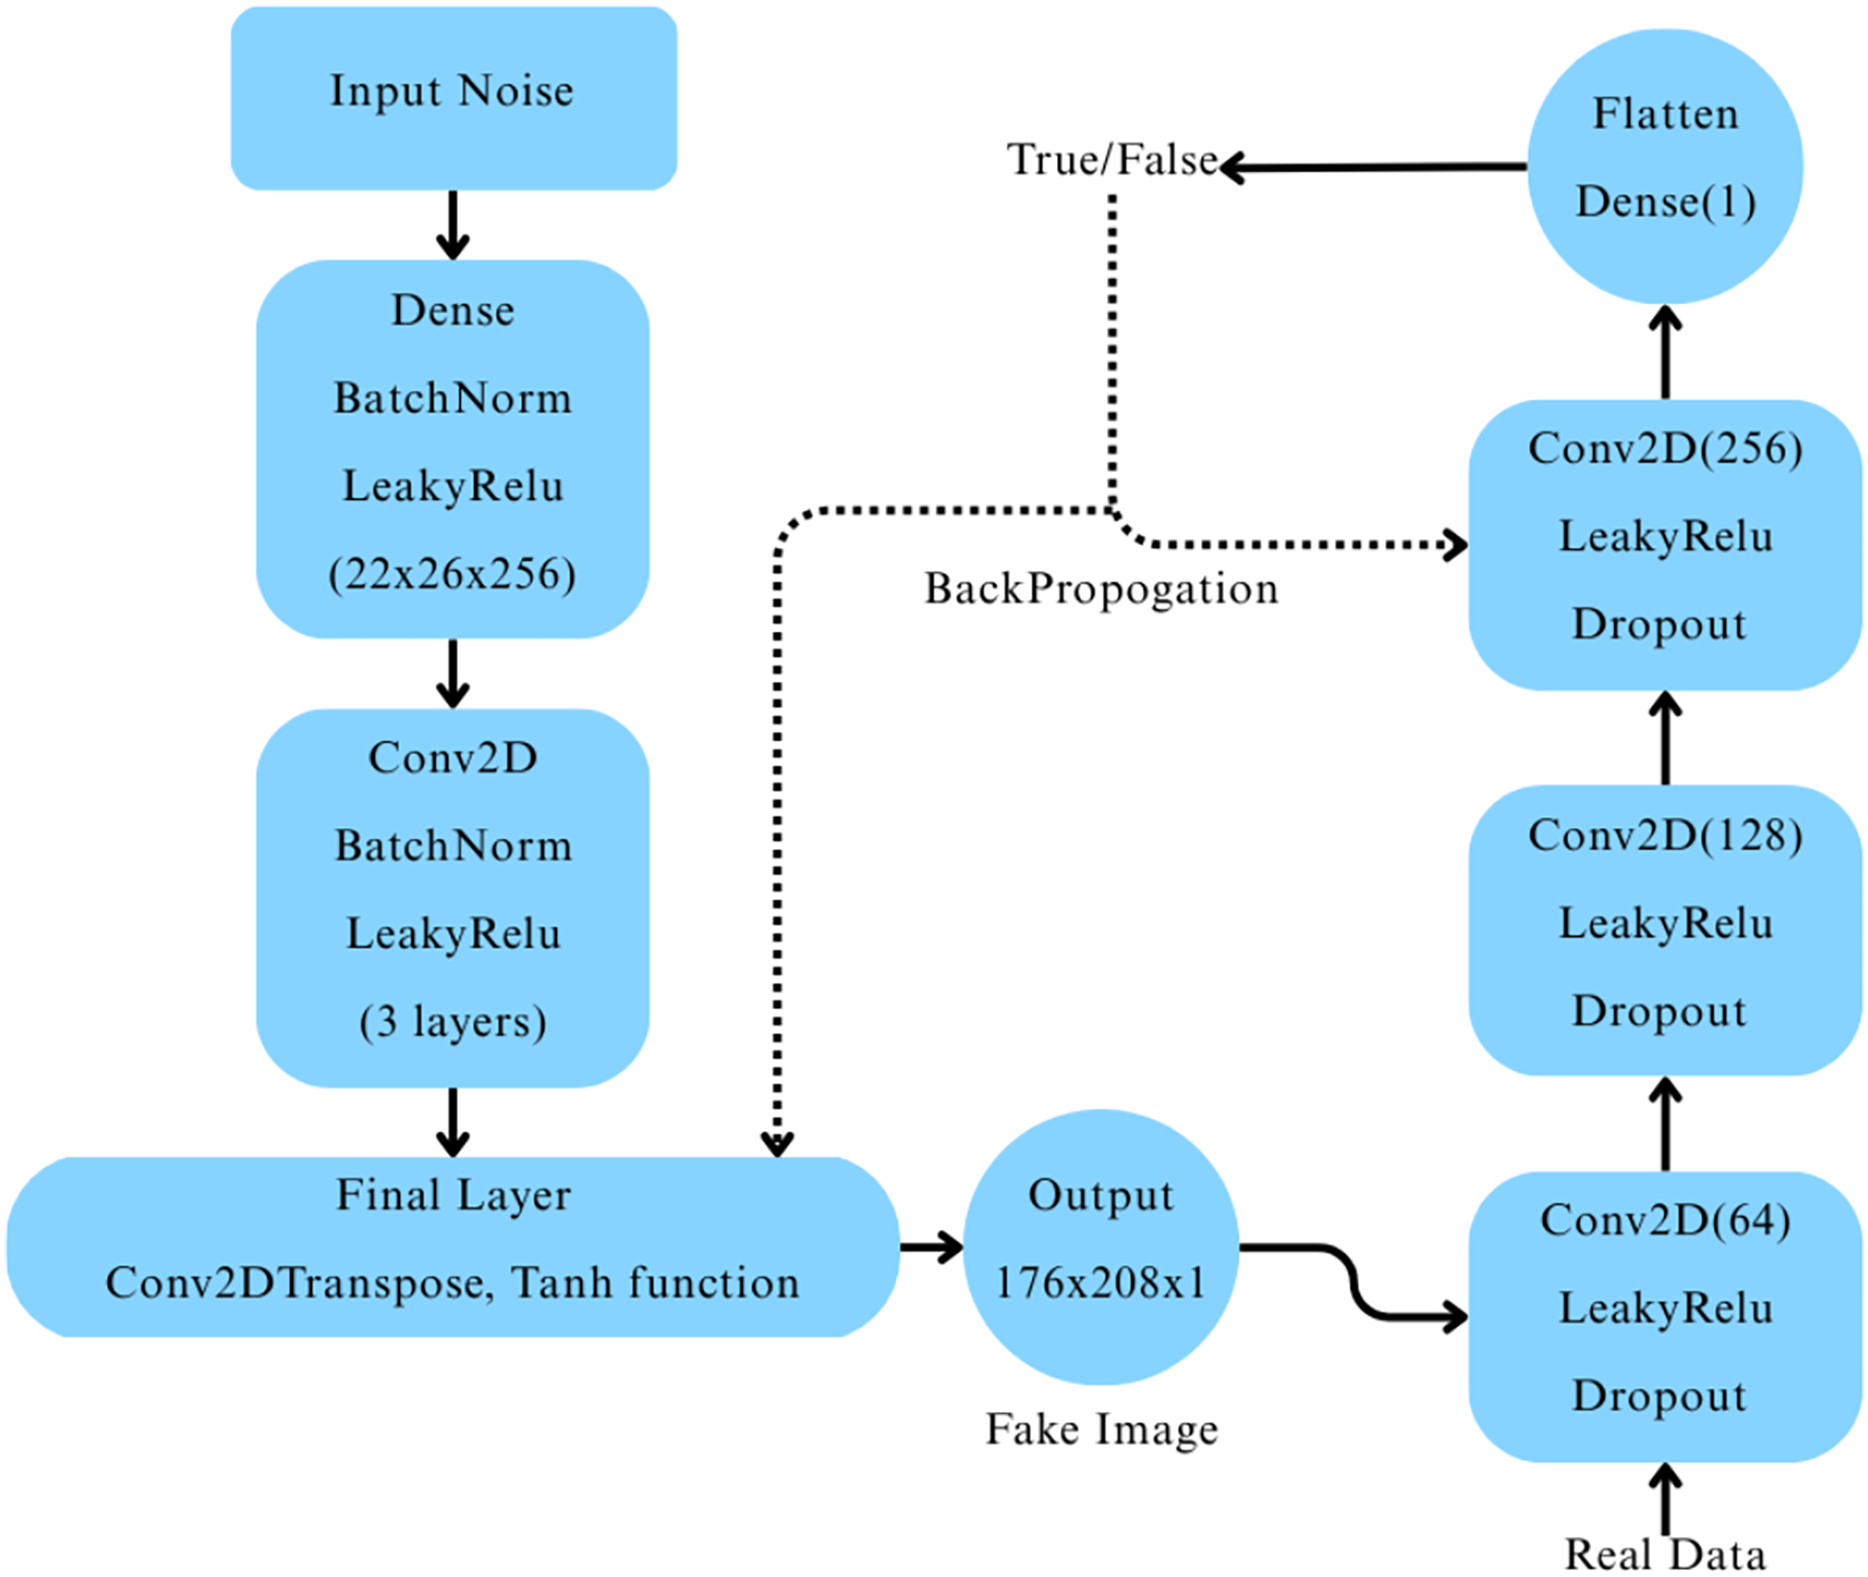
A Deep Convolutional Generative Adversarial Network (DCGAN) was constructed (Ryspayeva & Nishan, 2024) to generate synthetic MRI images for the “Very Mild Dementia” class. The generator network began with a dense layer that reshaped a 256-dimensional random noise vector into a 22 26 256 feature map, which was progressively upsampled through a series of transposed convolutional layers, each followed by batch normalization and LeakyReLU activation. The final output was a 176 208 1 grayscale image with pixel values scaled between [−1, 1] using a tanh activation function. The discriminator network consisted of three convolutional layers with LeakyReLU activations and dropout layers, followed by a fully connected layer producing a single output with a sigmoid activation to classify real vs. fake images, as depicted in Fig. 3.
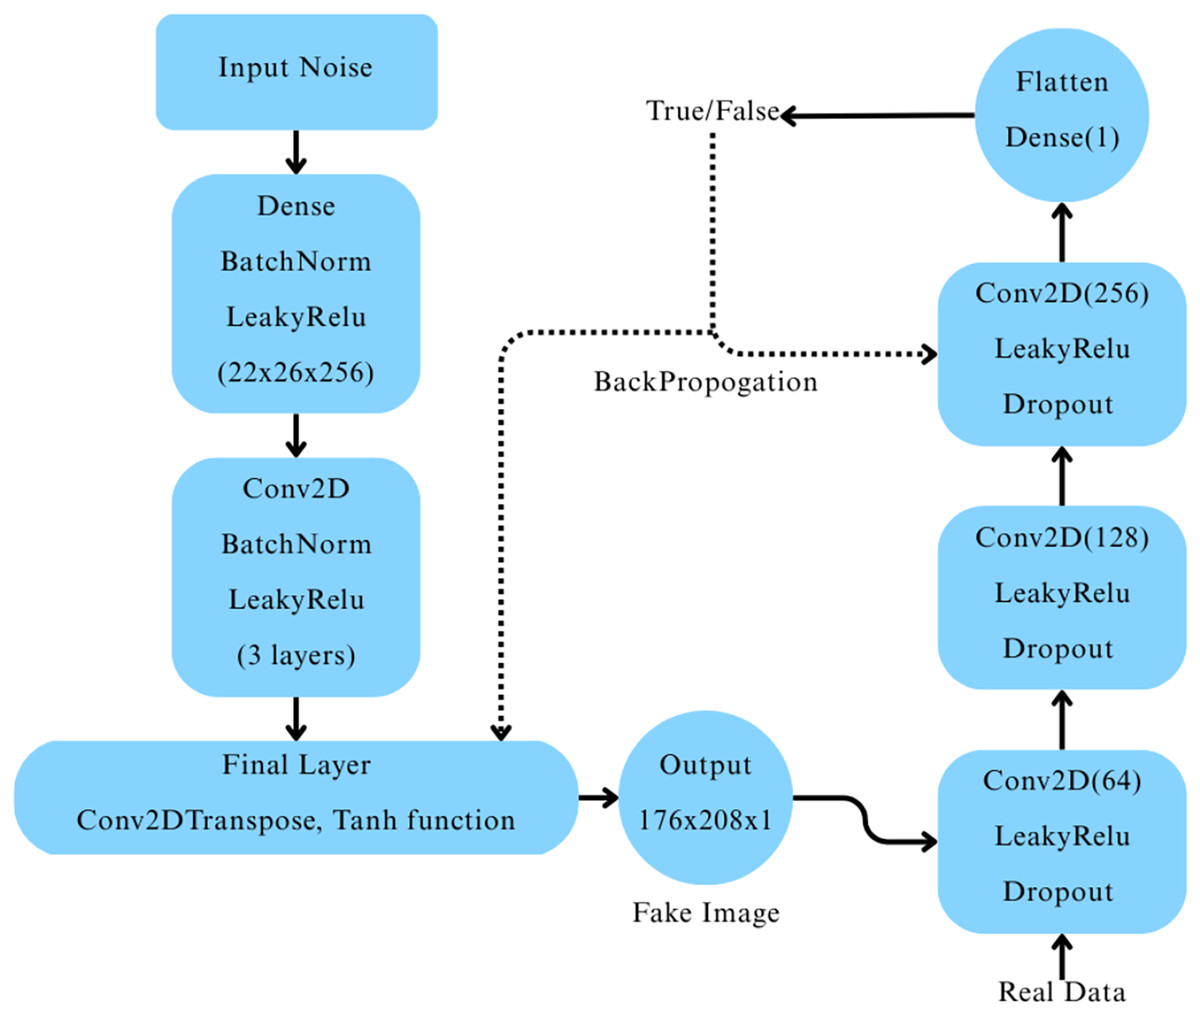
Figure 3: Architecture of the deep convolutional GAN and its workflow.
The DCGAN was trained using the Adam optimizer with separate learning rates for the generator ( ) and the discriminator ( ), and binary crossentropy loss. Label smoothing was applied to the real images during discriminator training to improve model stability. We trained the model over 100 epochs with mini-batch stochastic gradient descent, where random Gaussian noise was added to real images as a regularization technique. The quality of the generated images was evaluated using Fréchet Inception Distance (FID) (Ryspayeva & Nishan, 2024) after every epoch. Five generator checkpoints were selected based on their lowest FID scores throughout training.
Retraining with GAN-augmented data
To evaluate the impact of DCGAN-generated synthetic data, five separate CNN models were retrained. For each generator checkpoint selected based on its lowest Fréchet Inception Distance (FID) score, 500 synthetic “Very Mild Dementia” images were generated and added, augmenting the original training dataset (Tufail et al., 2024; Krishna, Sahu & Balaji, 2024), while the other classes remained unchanged. The validation dataset was kept entirely real, without any synthetic samples, to ensure fair comparison against the baseline model.
To account for the increased training data size and potential overfitting risk due to augmentation, slight modifications were made to the baseline CNN architecture during retraining. Specifically, L2 regularization was applied to two convolutional layers, and the dropout rates were moderately increased after convolutional blocks. The core structure and optimizer settings remained unchanged.
Performance comparison with existing approaches
Table 2 summarizes the performance of the proposed methodology in comparison with previously reported techniques for AD MRI classification. Conventional class balancing methods, such as SMOTE and ADASYN, typically generate synthetic samples by interpolating between existing data points, which may limit the diversity of augmented data. In contrast, the DCGAN-based augmentation strategy employed in this study generates entirely new, structurally diverse images, introducing richer variations within underrepresented classes. This approach notably improved the F1-score for the “Very Mild Dementia” category—a class that traditionally presents the greatest classification challenge due to its clinical proximity to healthy controls. The results highlight the potential of DCGANs to act as a data-driven augmentation strategy that goes beyond simple duplication or interpolation. While traditional techniques are easier to implement, they may lack the complexity needed to simulate real anatomical variations seen in progressive cognitive decline.
| Study | Dataset | Model | Accuracy | Techniques used |
|---|---|---|---|---|
| Tufail et al. (2024) | ADNI | GAN + InceptionV3 + CNN | 68% | GAN + CNN |
| Krishna, Sahu & Balaji (2024) | Public MRI | SMOTE + SVM | 98.54% | SMOTE data balancing |
| Rahman et al. (2024) | ADNI | Hybrid CNN-SVM | 98.59% | Feature extraction + SVM |
| Saravanan, Karthikeyan & Karthik (2024) | Kaggle | ADASYN + CNN | 98.32% | ADASYN balancing |
| Hernandez et al. (2023) | Kaggle | CV + PCA + Extra Trees | 99% | PCA, Cross-validation |
| Roy et al. (2024) | Kaggle | CNN + Attention module | 99% | Spatial ATTention module inside CNN |
| Yao et al. (2025) | ADNI | CNN + Transformers | 99% | SWIN trasformer blocks in pipeline |
| Venkatraman et al. (2025), Xun, Yin & Zhang (2022) | Kaggle | CNN | 98.9% | Granular feature integration method |
| Proposed method | Kaggle | CNN + DCGAN | 99.44% | Targeted GAN augmentation |
Assessment metrics (justification)
Accuracy: This is the ratio of correct predictions to the total number of predictions made. However, accuracy can be misleading when there’s an imbalance in class distribution. It essentially reflects how many predictions were correct out of all the predictions the model produced.
Precision: Precision indicates the proportion of positive predictions that were actually correct. In other words, it tells us what percentage of the predicted positive cases were truly positive. This metric is useful when it’s important that positive predictions are accurate.
Recall (Sensitivity): Recall measures the proportion of actual positive cases that were correctly identified by the model. It highlights the model’s ability to capture all relevant positive instances within a dataset.
F1-score: The F1-score represents the harmonic mean of precision and recall, providing a balanced measure of both. It is particularly useful when there’s a need to balance the trade-off between precision and recall, especially in cases of uneven class distribution.
Computing infrastructure
All experiments were conducted on Kaggle Notebooks, which provided free GPU acceleration using NVIDIA T4 x2 GPUs. The development environment was based on Python 3.8 with the following libraries like TensorFlow, 2.11, Keras, NumPy, Pandas, Matplotlib, scikit-learn, seaborn (for visualizations), The code was implemented and run in a Linux-based containerized Jupyter environment provided by Kaggle.
Result and discussion
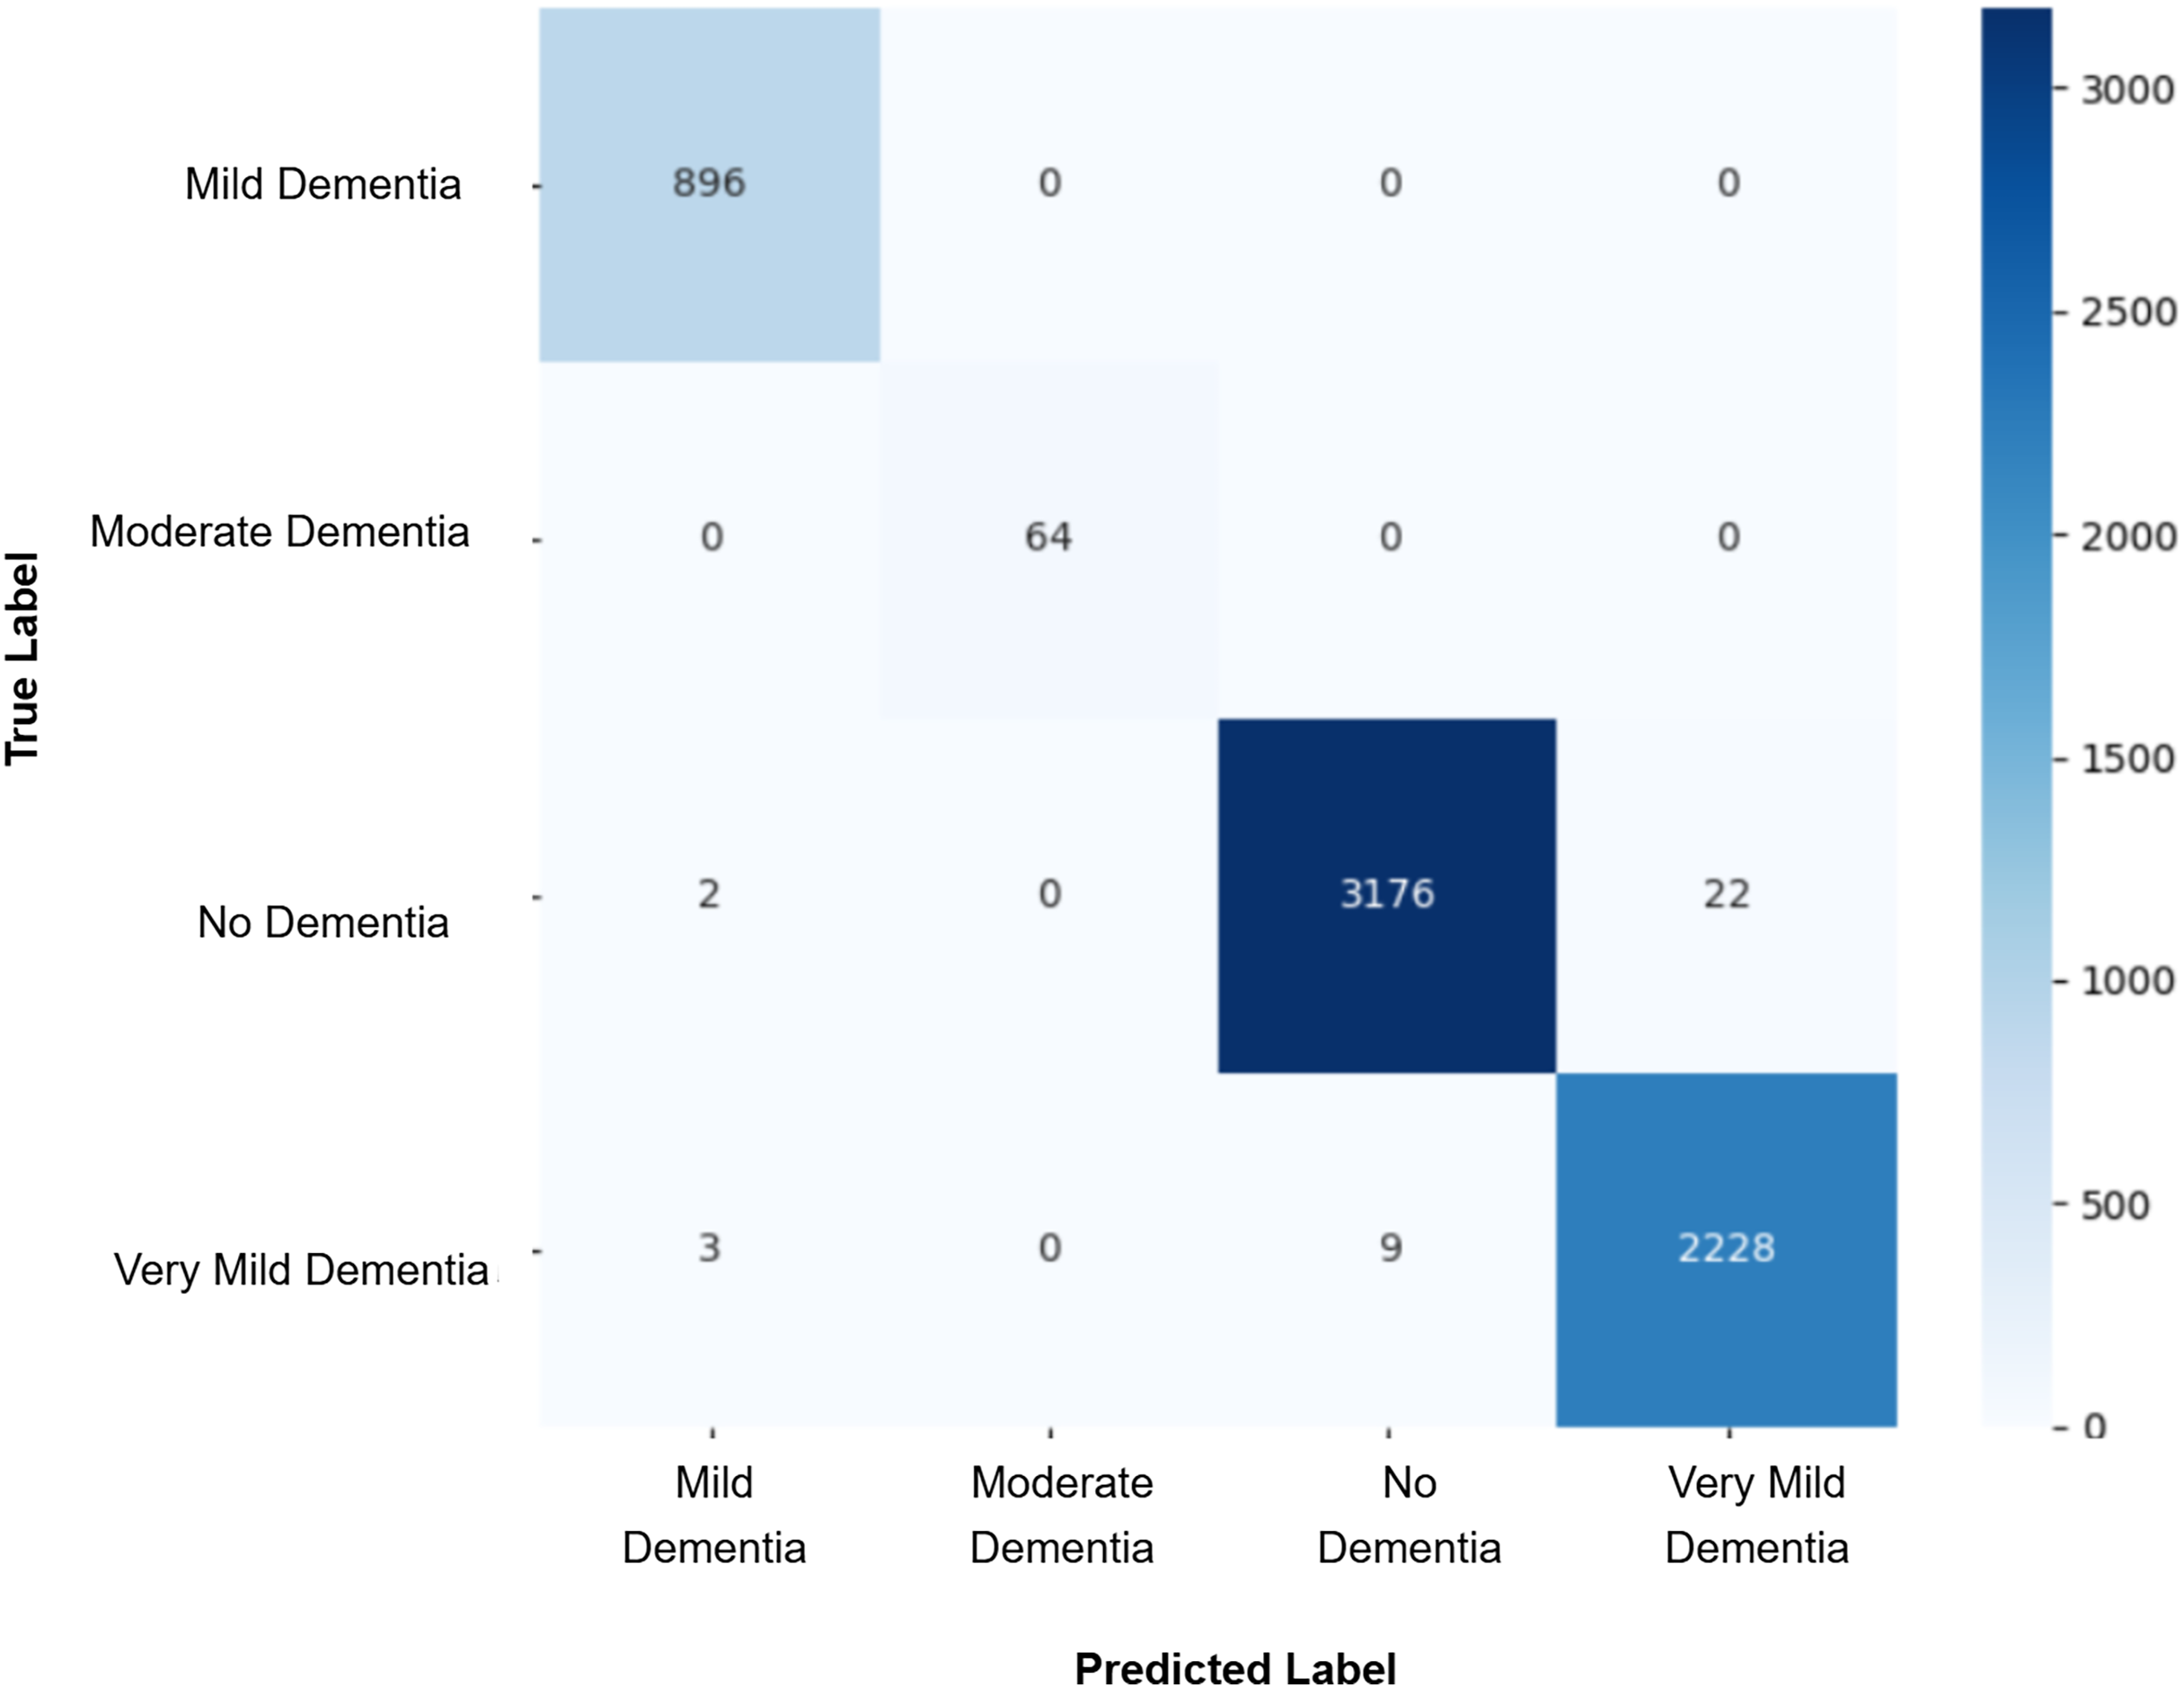
Model evaluation was conducted on the real validation set using multiple metrics: overall accuracy, class-wise precision, recall, and macro-averaged F1-score were computed to assess classification performance. Confusion matrices were constructed to visualize prediction patterns and analyze misclassification across cognitive stages. Furthermore, McNemar’s test was applied to statistically compare the prediction agreement between each GAN-augmented CNN model and the baseline CNN model, with a significance threshold set at p-value < 0.05. This comprehensive evaluation pipeline enabled a systematic assessment of whether synthetic data augmentation improved early AD classification and refined the decision boundaries between closely related cognitive categories. The baseline CNN achieved a validation accuracy of 98%, with macro-averaged precision, recall, and F1-score of 0.99. While the “Mild Dementia”, “Moderate Dementia”, and “No Dementia” classes were classified with near-perfect accuracy, the “Very Mild Dementia” class showed slightly lower performance, precision 0.97 and recall 0.98. The confusion matrix shown in Fig. 4 revealed misclassification of 39 “Very Mild Dementia” and 61 “No Dementia” samples, suggesting a blurred decision boundary between healthy individuals and those with very early cognitive impairment. To address this, we used DCGAN-based augmentation to improve class separability. A total of 500 synthetic images were generated for the “Very Mild Dementia” class using each of five generator checkpoints. The lowest Fréchet Inception Distance (FID) score achieved when comparing generated images to the training set was 7.46 (Epoch 85), indicating excellent realism. When compared against validation images, the best FID was 29.26 (Epoch 65), reflecting reasonable generalization. A visual inspection of the synthetic images indicated the anatomical consistency of the synthetic images with minimal artifacts.

Figure 4: Confusion matrix for baseline CNN model.
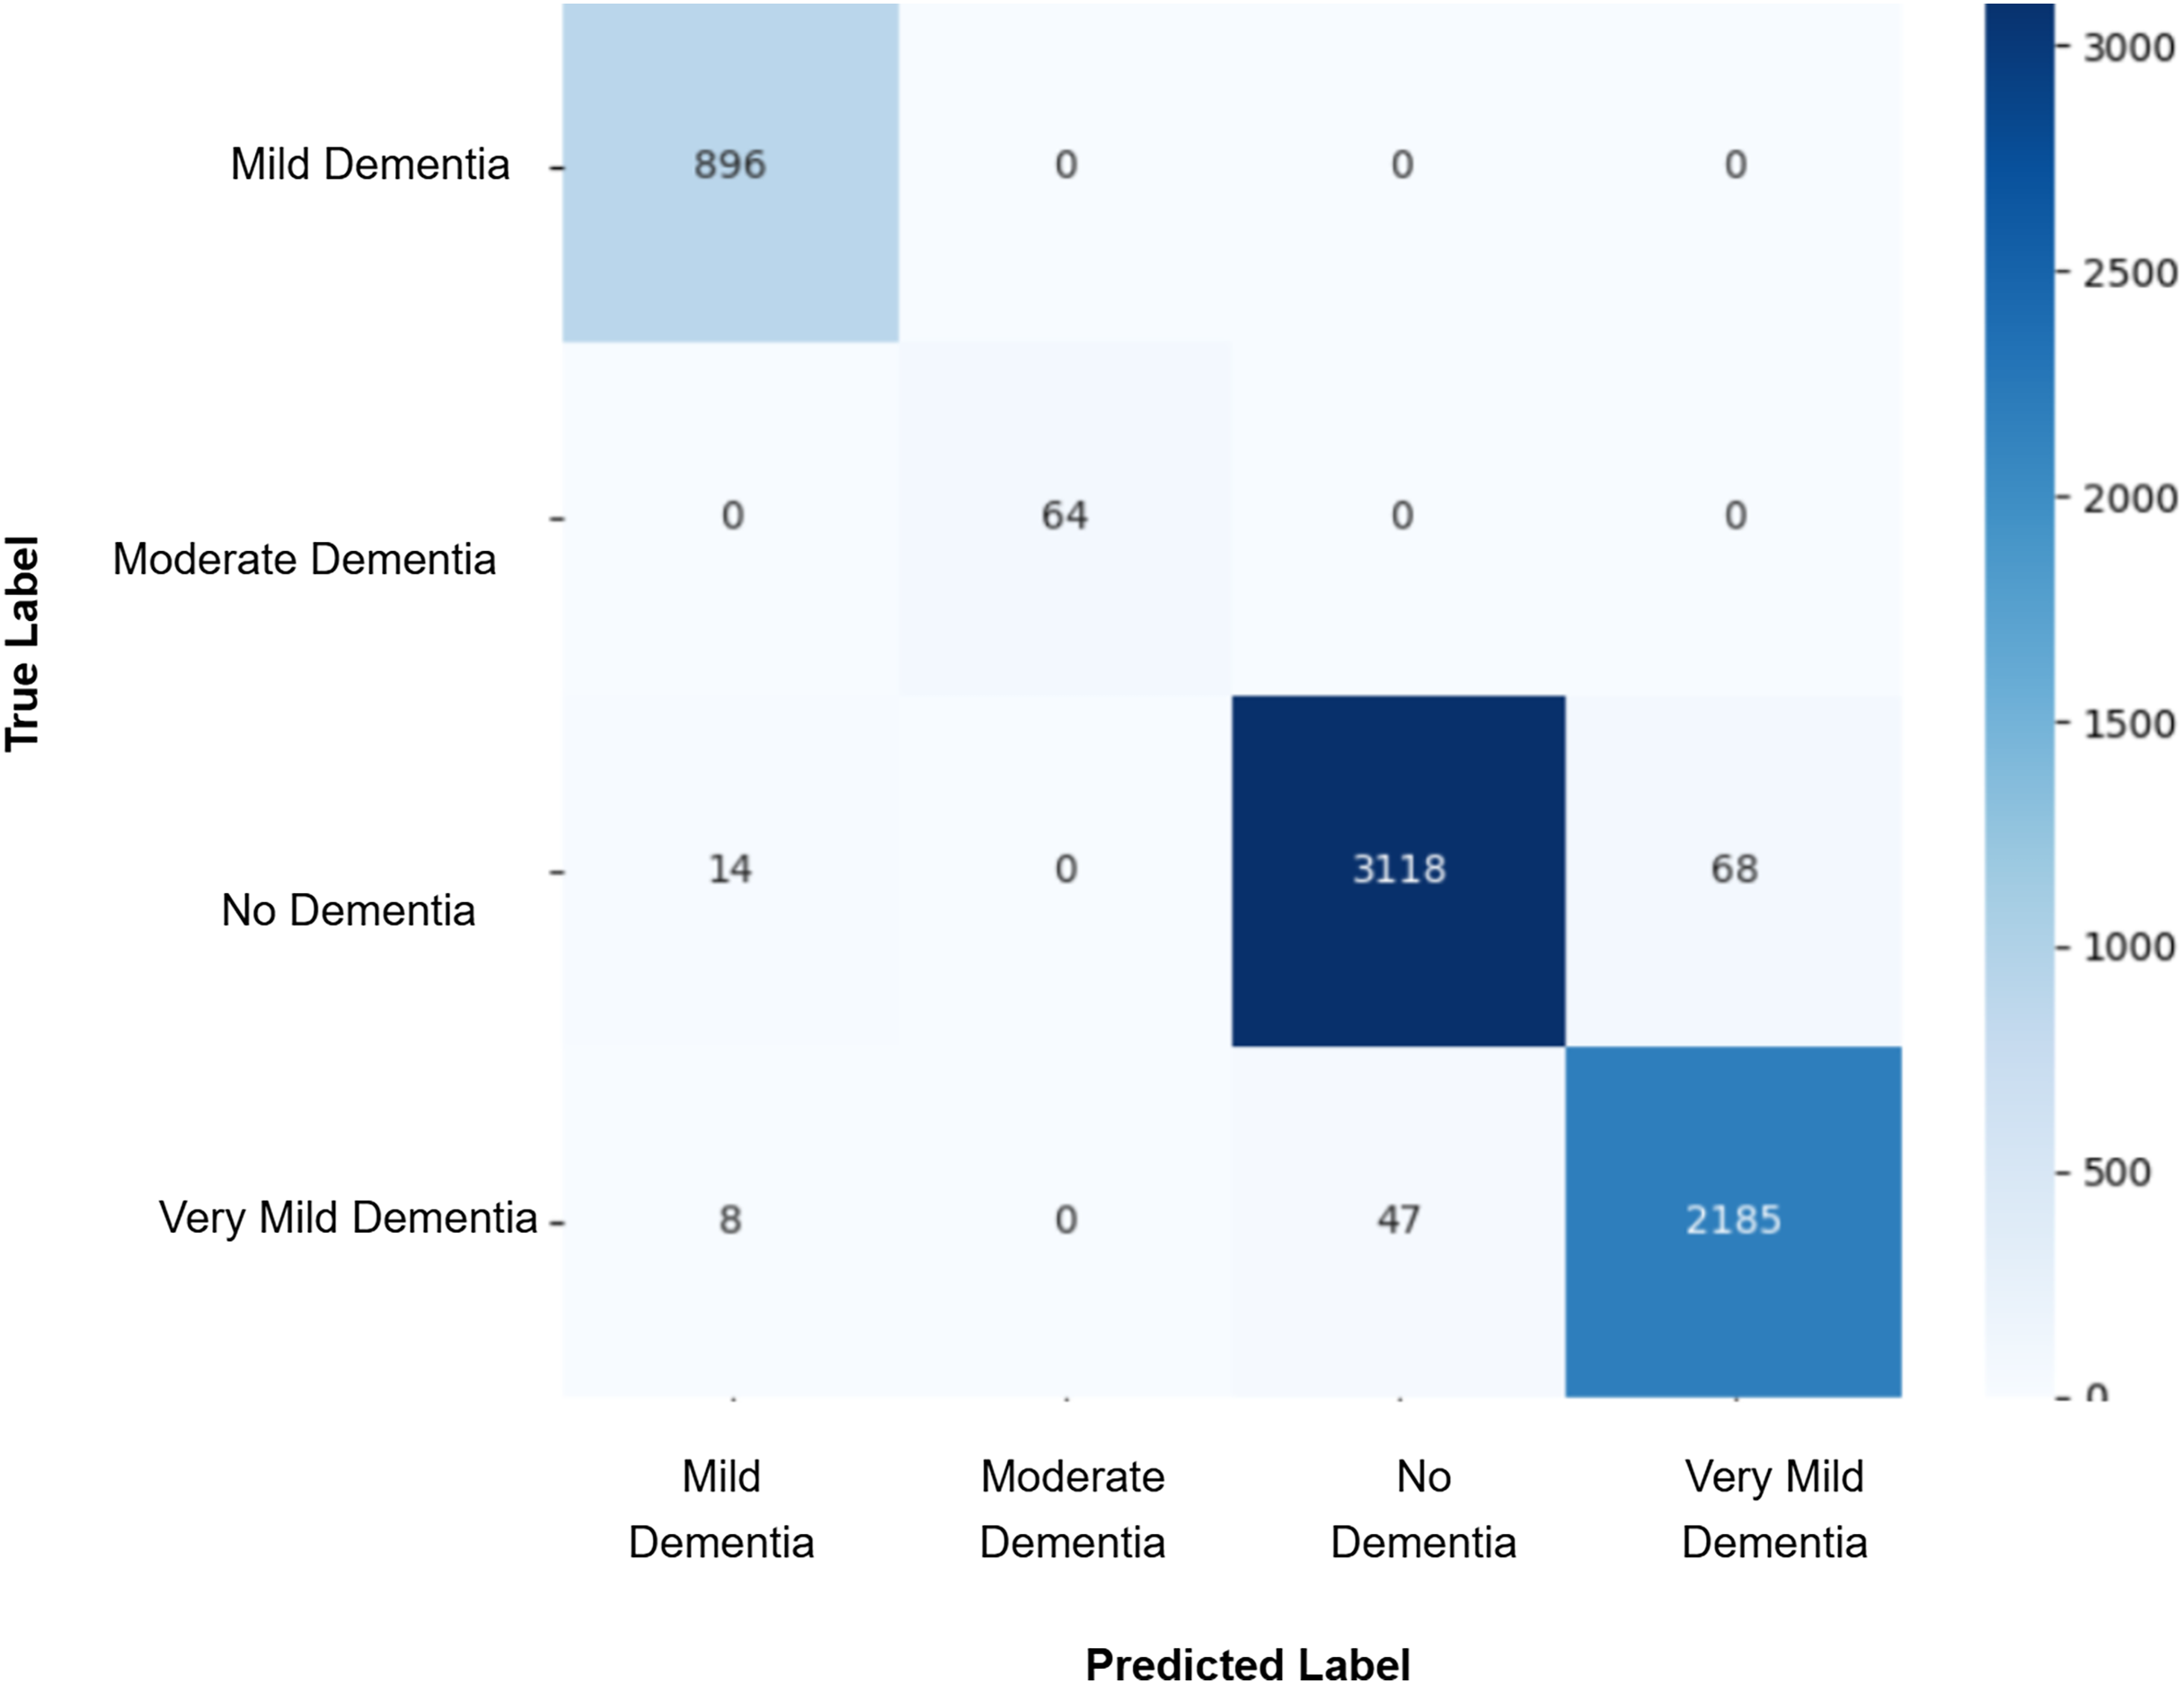
After augmenting the training data with synthetic images, retrained CNN models showed mixed results as shown in Figs. 5, 6, 7, 8, 9 and Table 3. Epoch 85 and Epoch 75 generators maintained 98% validation accuracy, though Epoch 75 showed a minor drop in precision. The Epoch 72 generator yielded the best performance: 99% accuracy with perfect precision and recall for the “Very Mild Dementia” class, indicating refined class boundaries. In contrast, Epoch 70 dropped to 95% accuracy, and Epoch 65 achieved 96%, both showing signs of overfitting.
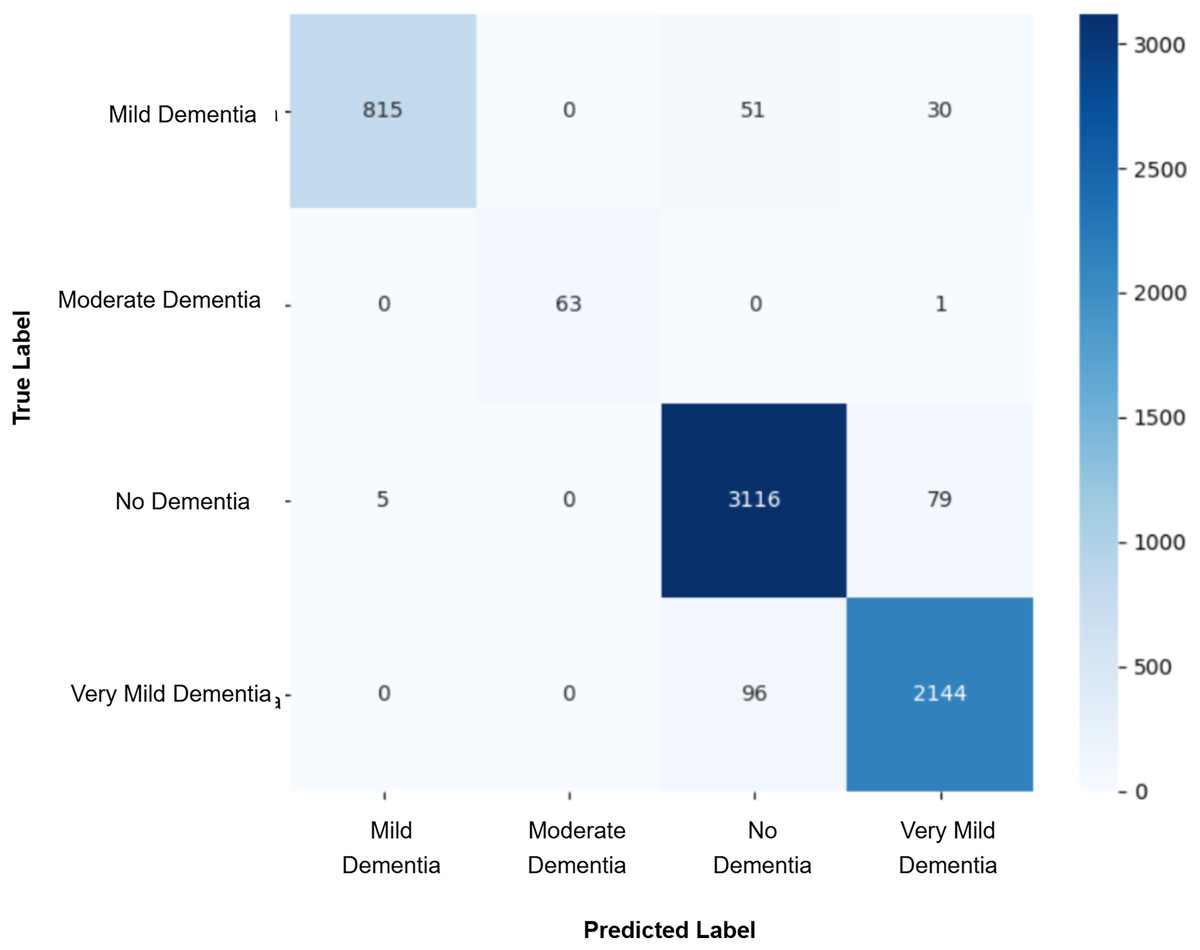
Figure 5: Confusion matrix for EPOCH65 after augmenting the training data with synthetic images.
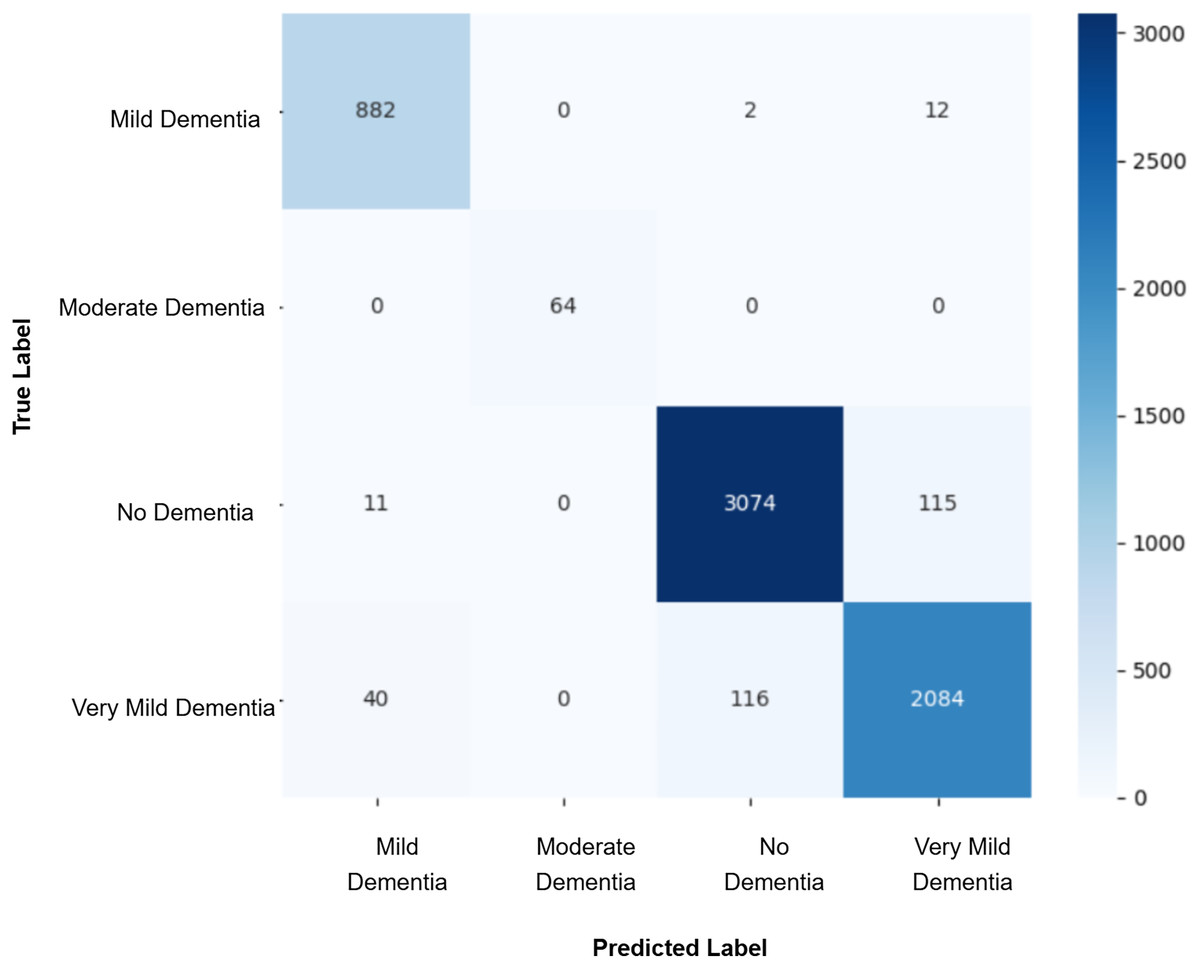
Figure 6: Confusion matrix for EPOCH70 after augmenting the training data with synthetic images.
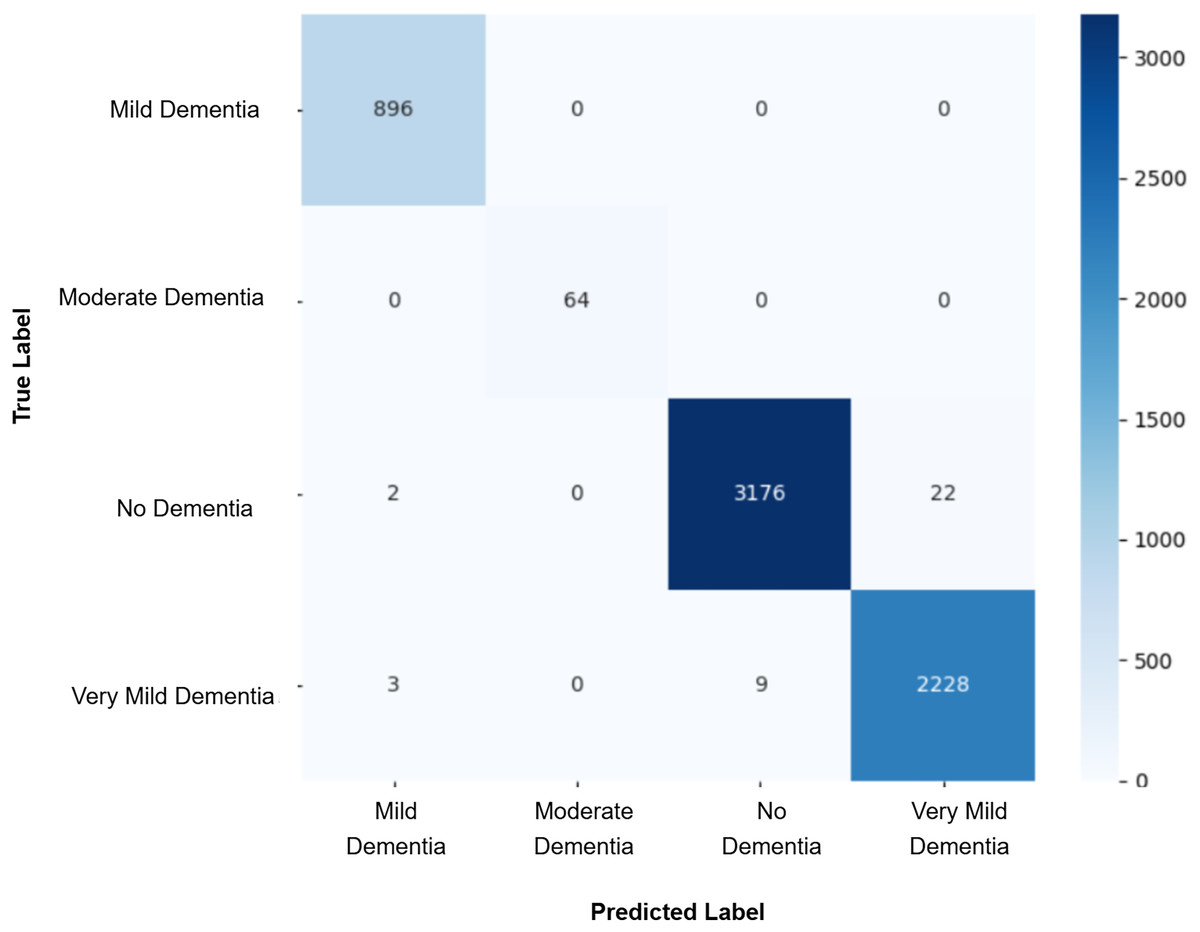
Figure 7: Confusion matrix for EPOCH72 after augmenting the training data with synthetic images.
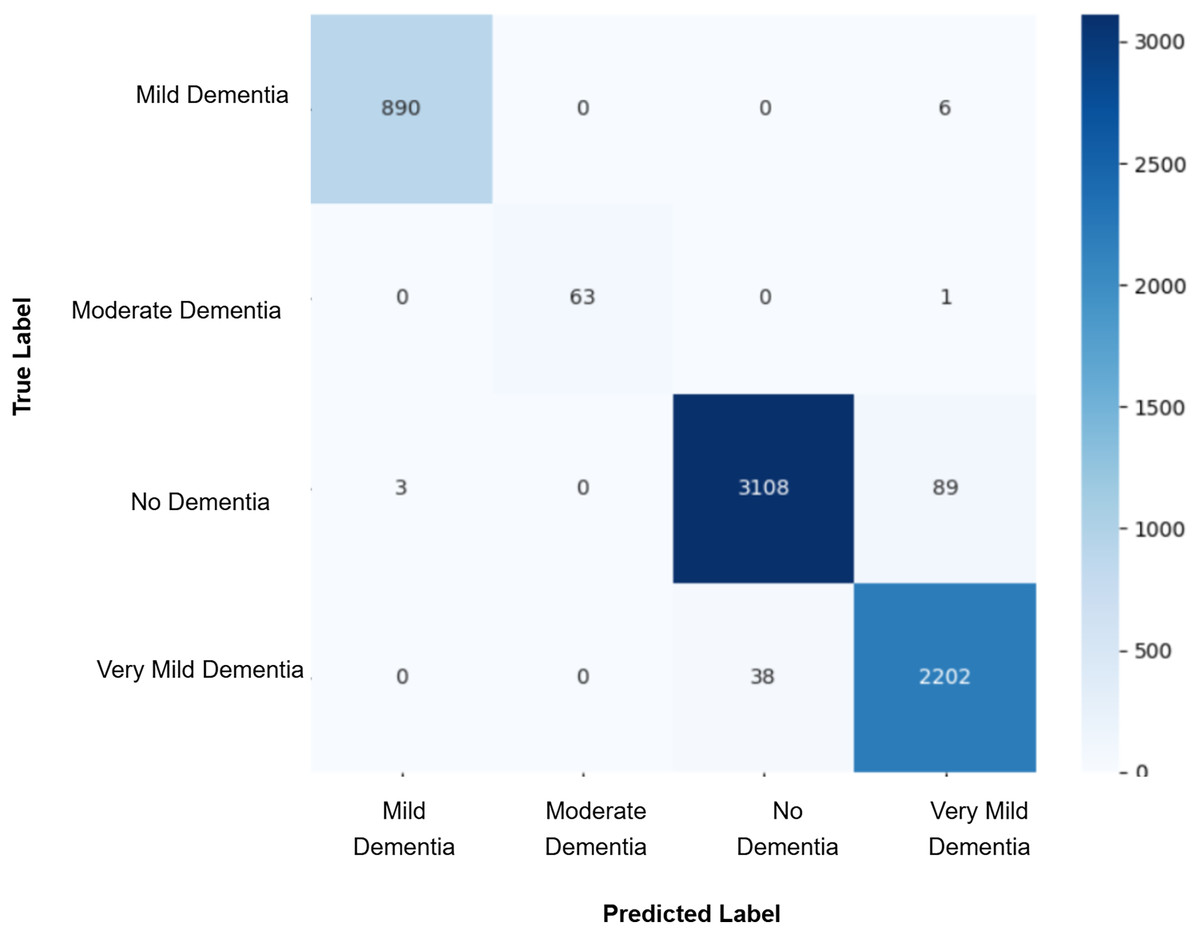
Figure 8: Confusion matrix for EPOCH75 after augmenting the training data with synthetic images.
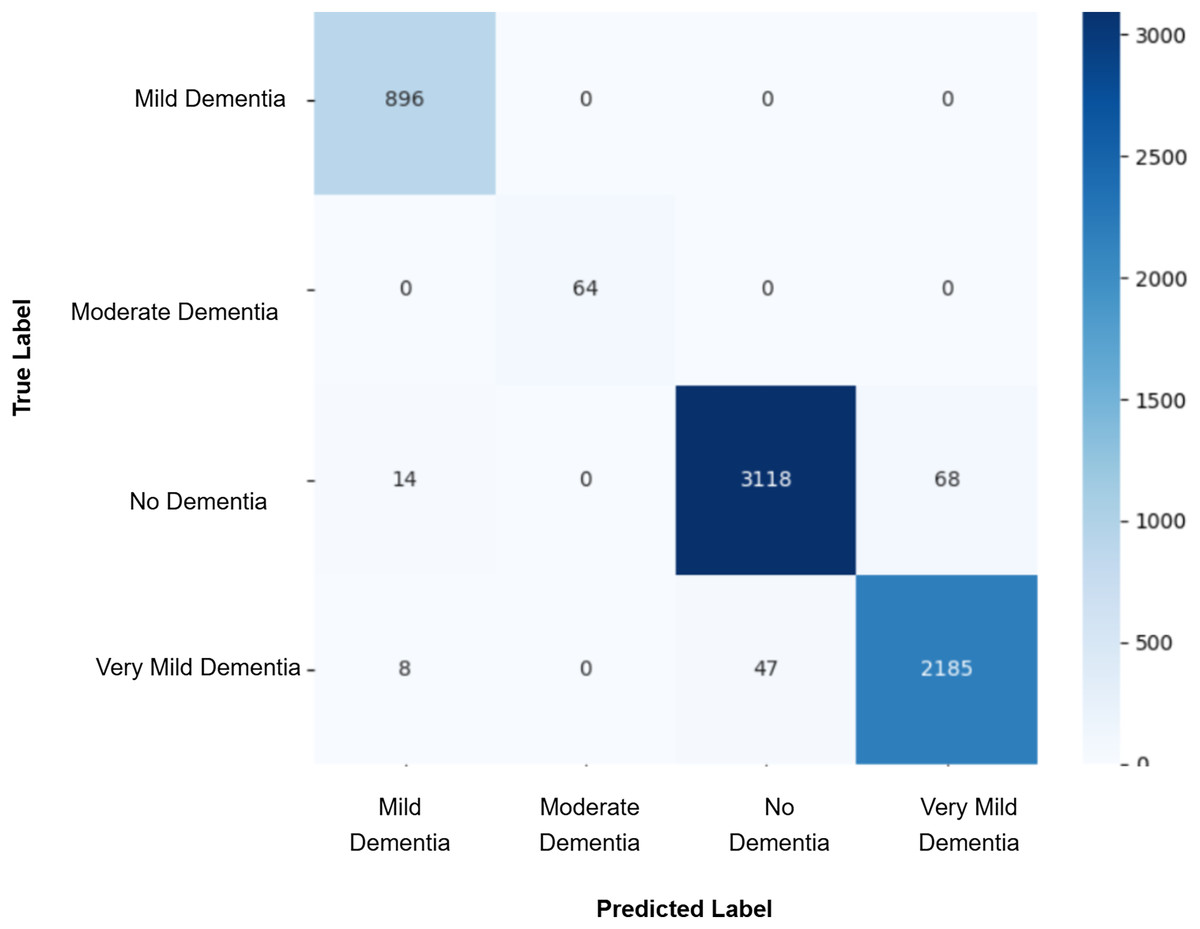
Figure 9: Confusion matrix for EPOCH85 after augmenting the training data with synthetic images.
| Training metrics | Validation metrics | |||||||
|---|---|---|---|---|---|---|---|---|
| Model | Accuracy | Precision | Recall | F1-score | Accuracy | Precision | Recall | F1-score |
| Baseline CNN | 0.98 | 0.98 | 0.98 | 0.98 | 0.98 | 0.99 | 0.99 | 0.99 |
| EPOCH 85 + CNN | 0.94 | 0.94 | 0.94 | 0.94 | 0.98 | 0.98 | 0.99 | 0.99 |
| EPOCH 75 + CNN | 0.94 | 0.95 | 0.94 | 0.95 | 0.98 | 0.99 | 0.98 | 0.98 |
| EPOCH 72 + CNN | 0.99 | 0.99 | 0.99 | 0.99 | 0.99 | 1.00 | 1.00 | 1.00 |
| EPOCH 70 + CNN | 0.90 | 0.92 | 0.91 | 0.91 | 0.95 | 0.96 | 0.97 | 0.97 |
| EPOCH 65 + CNN | 0.98 | 0.98 | 0.98 | 0.98 | 0.96 | 0.98 | 0.96 | 0.97 |
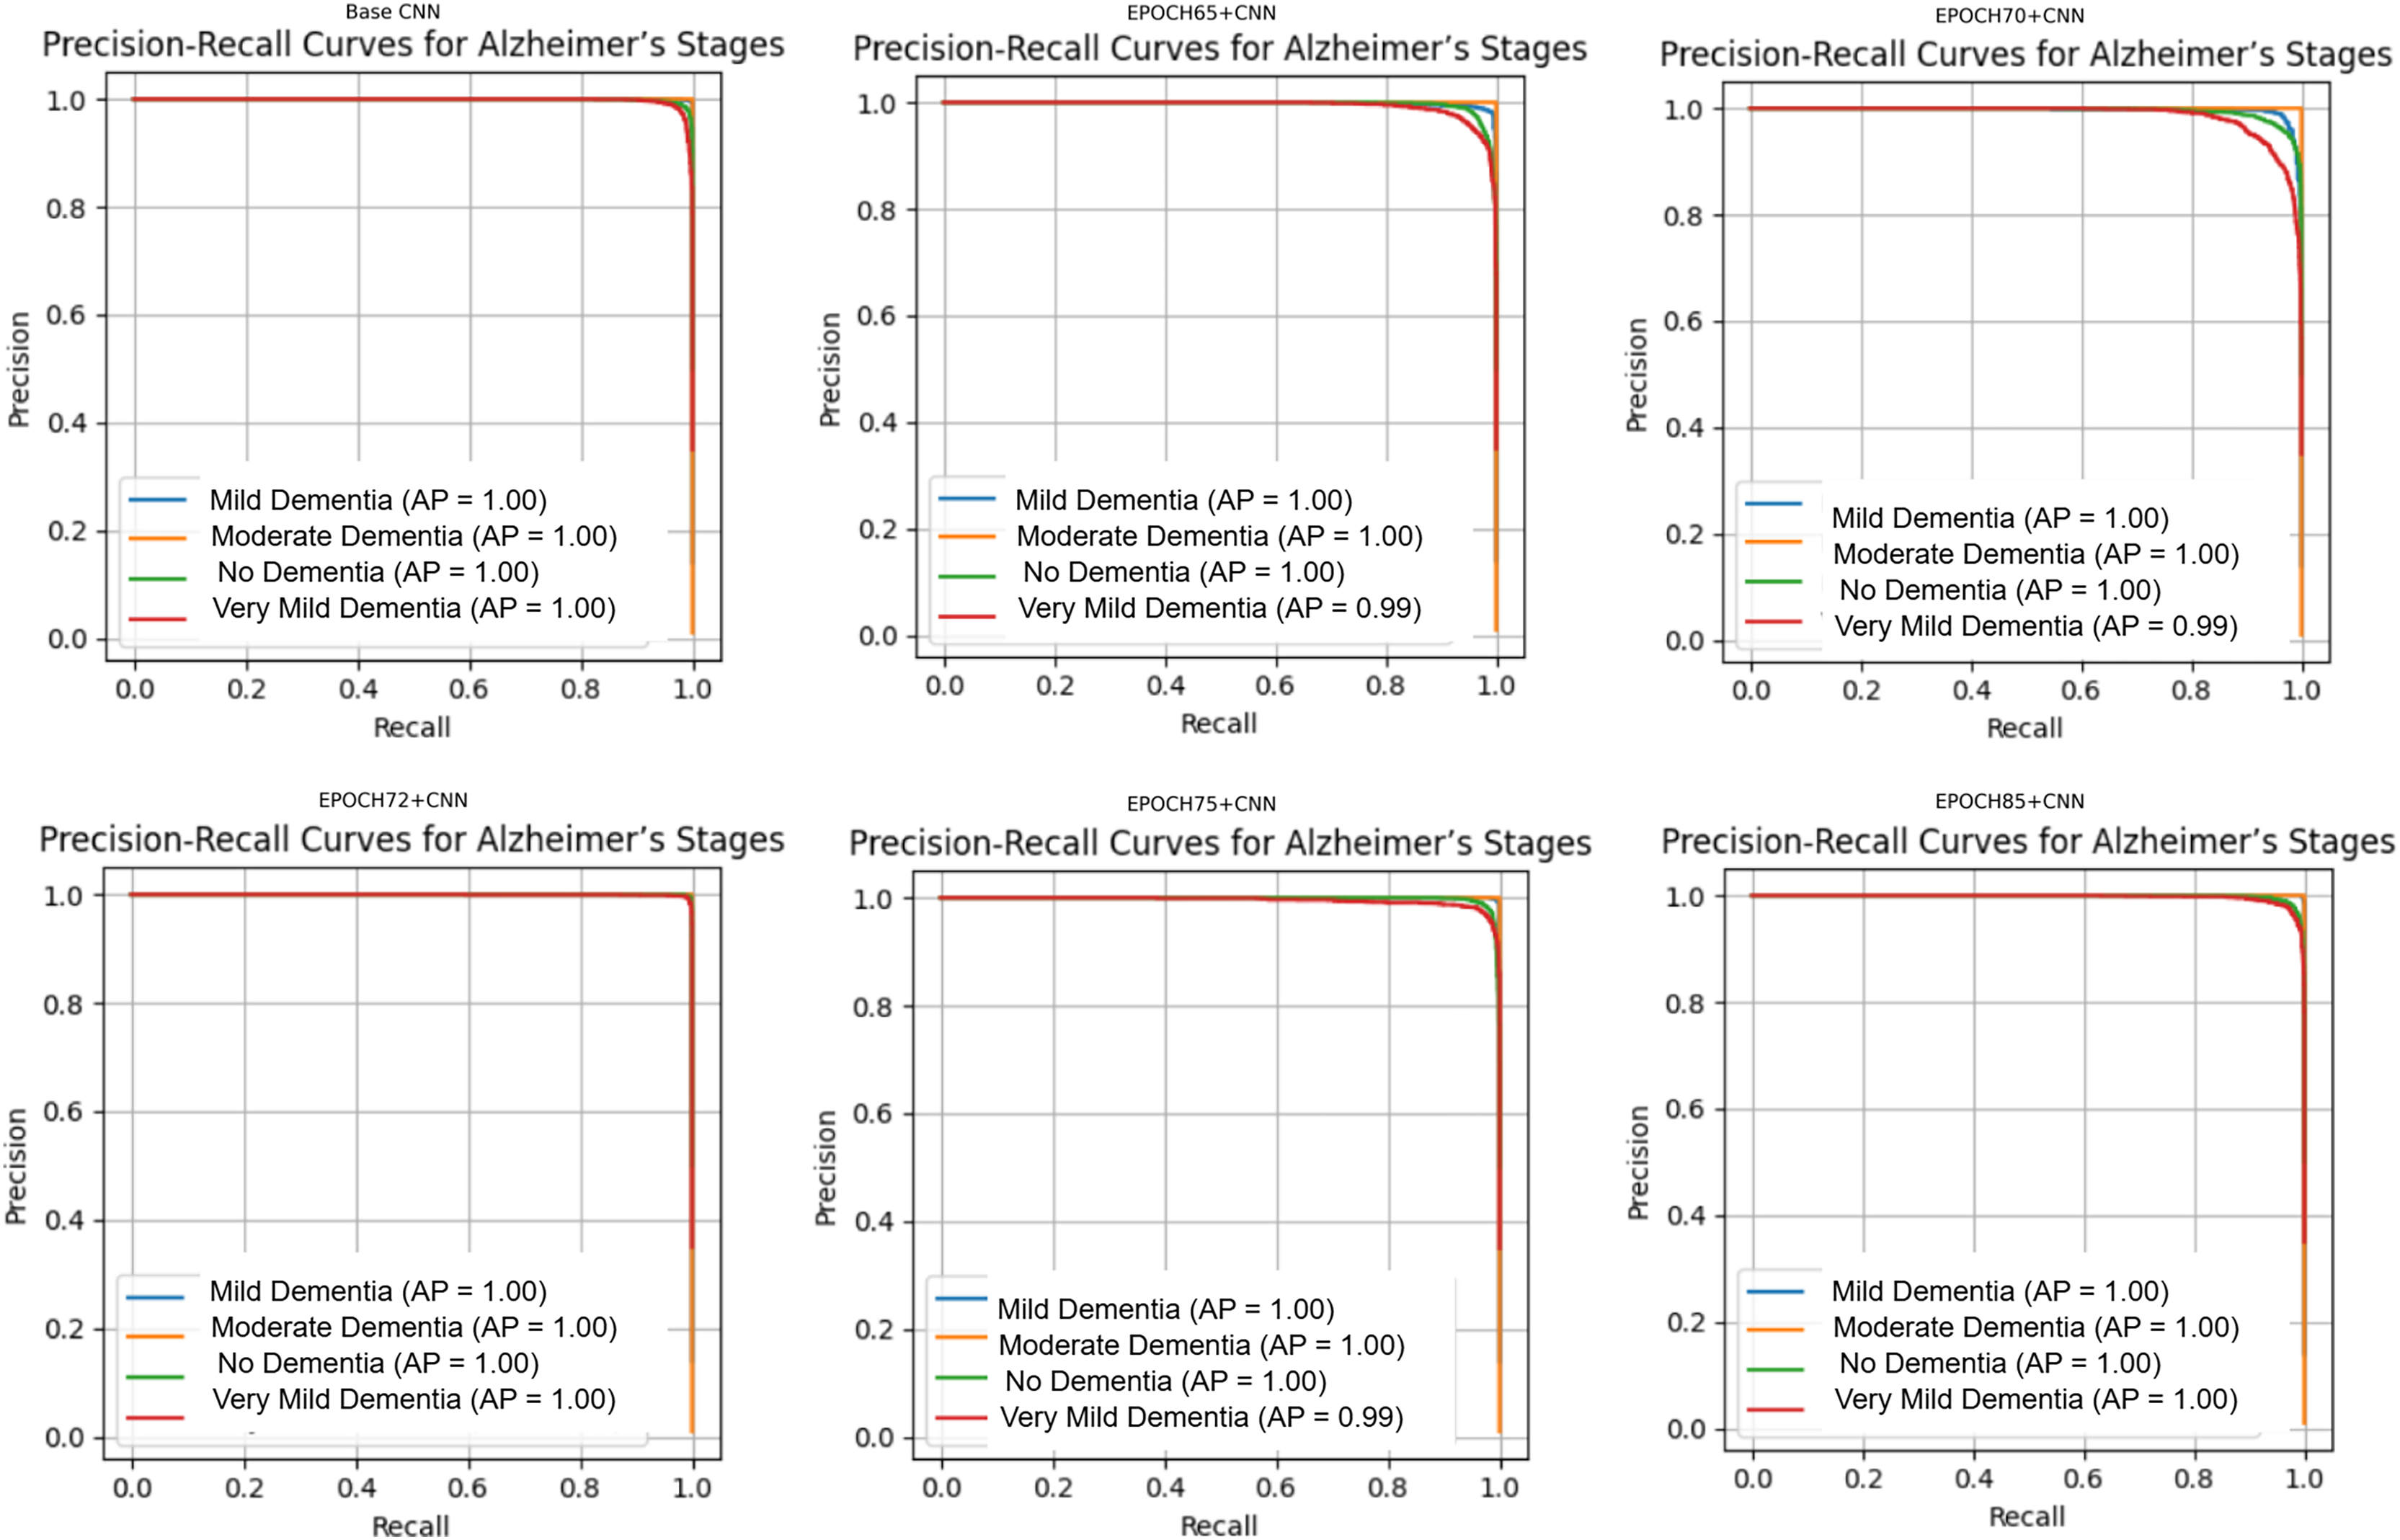
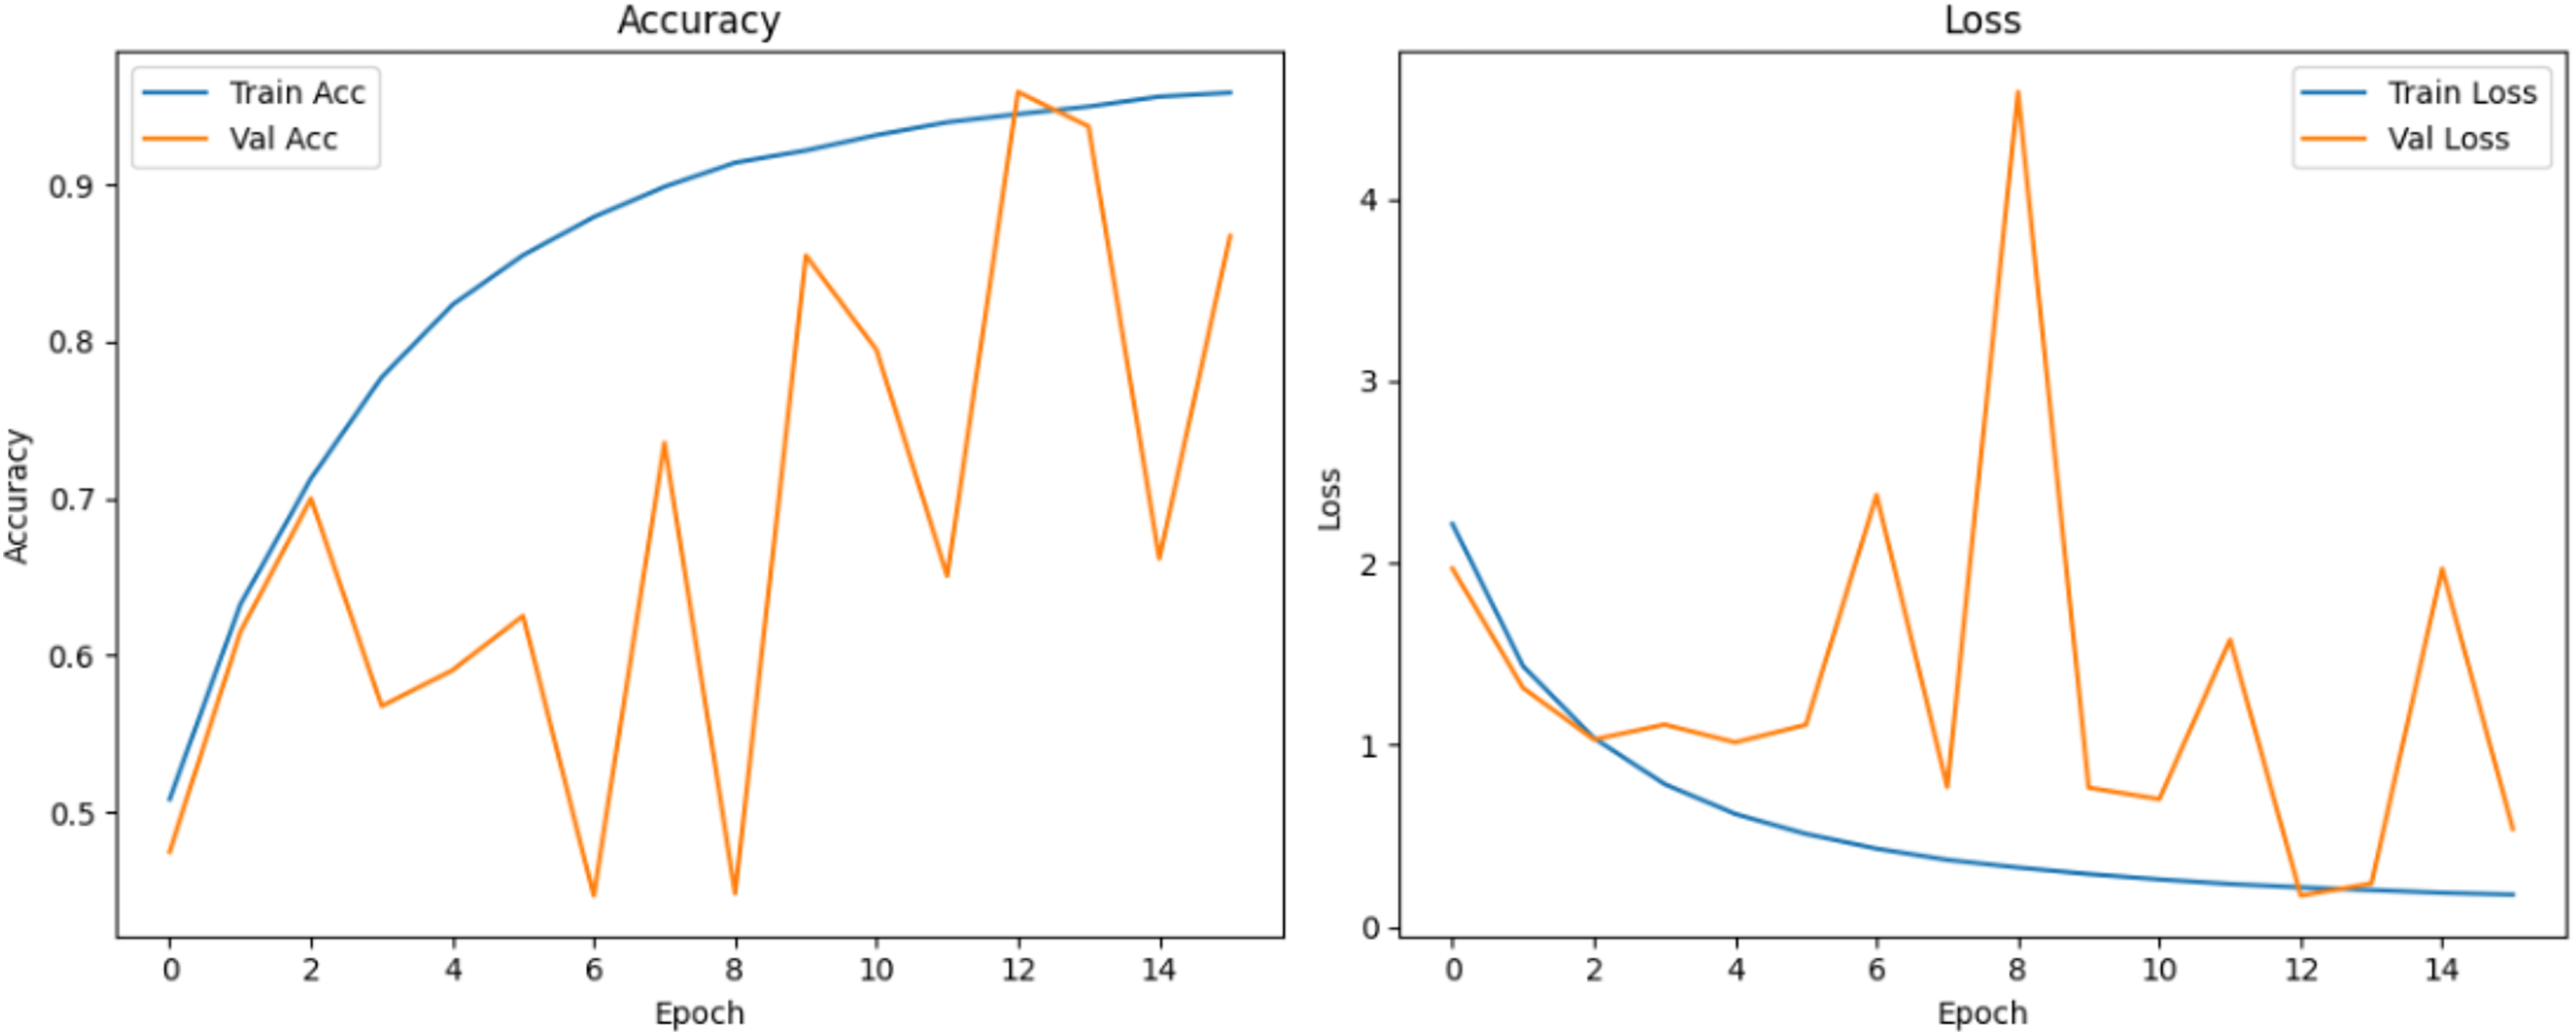
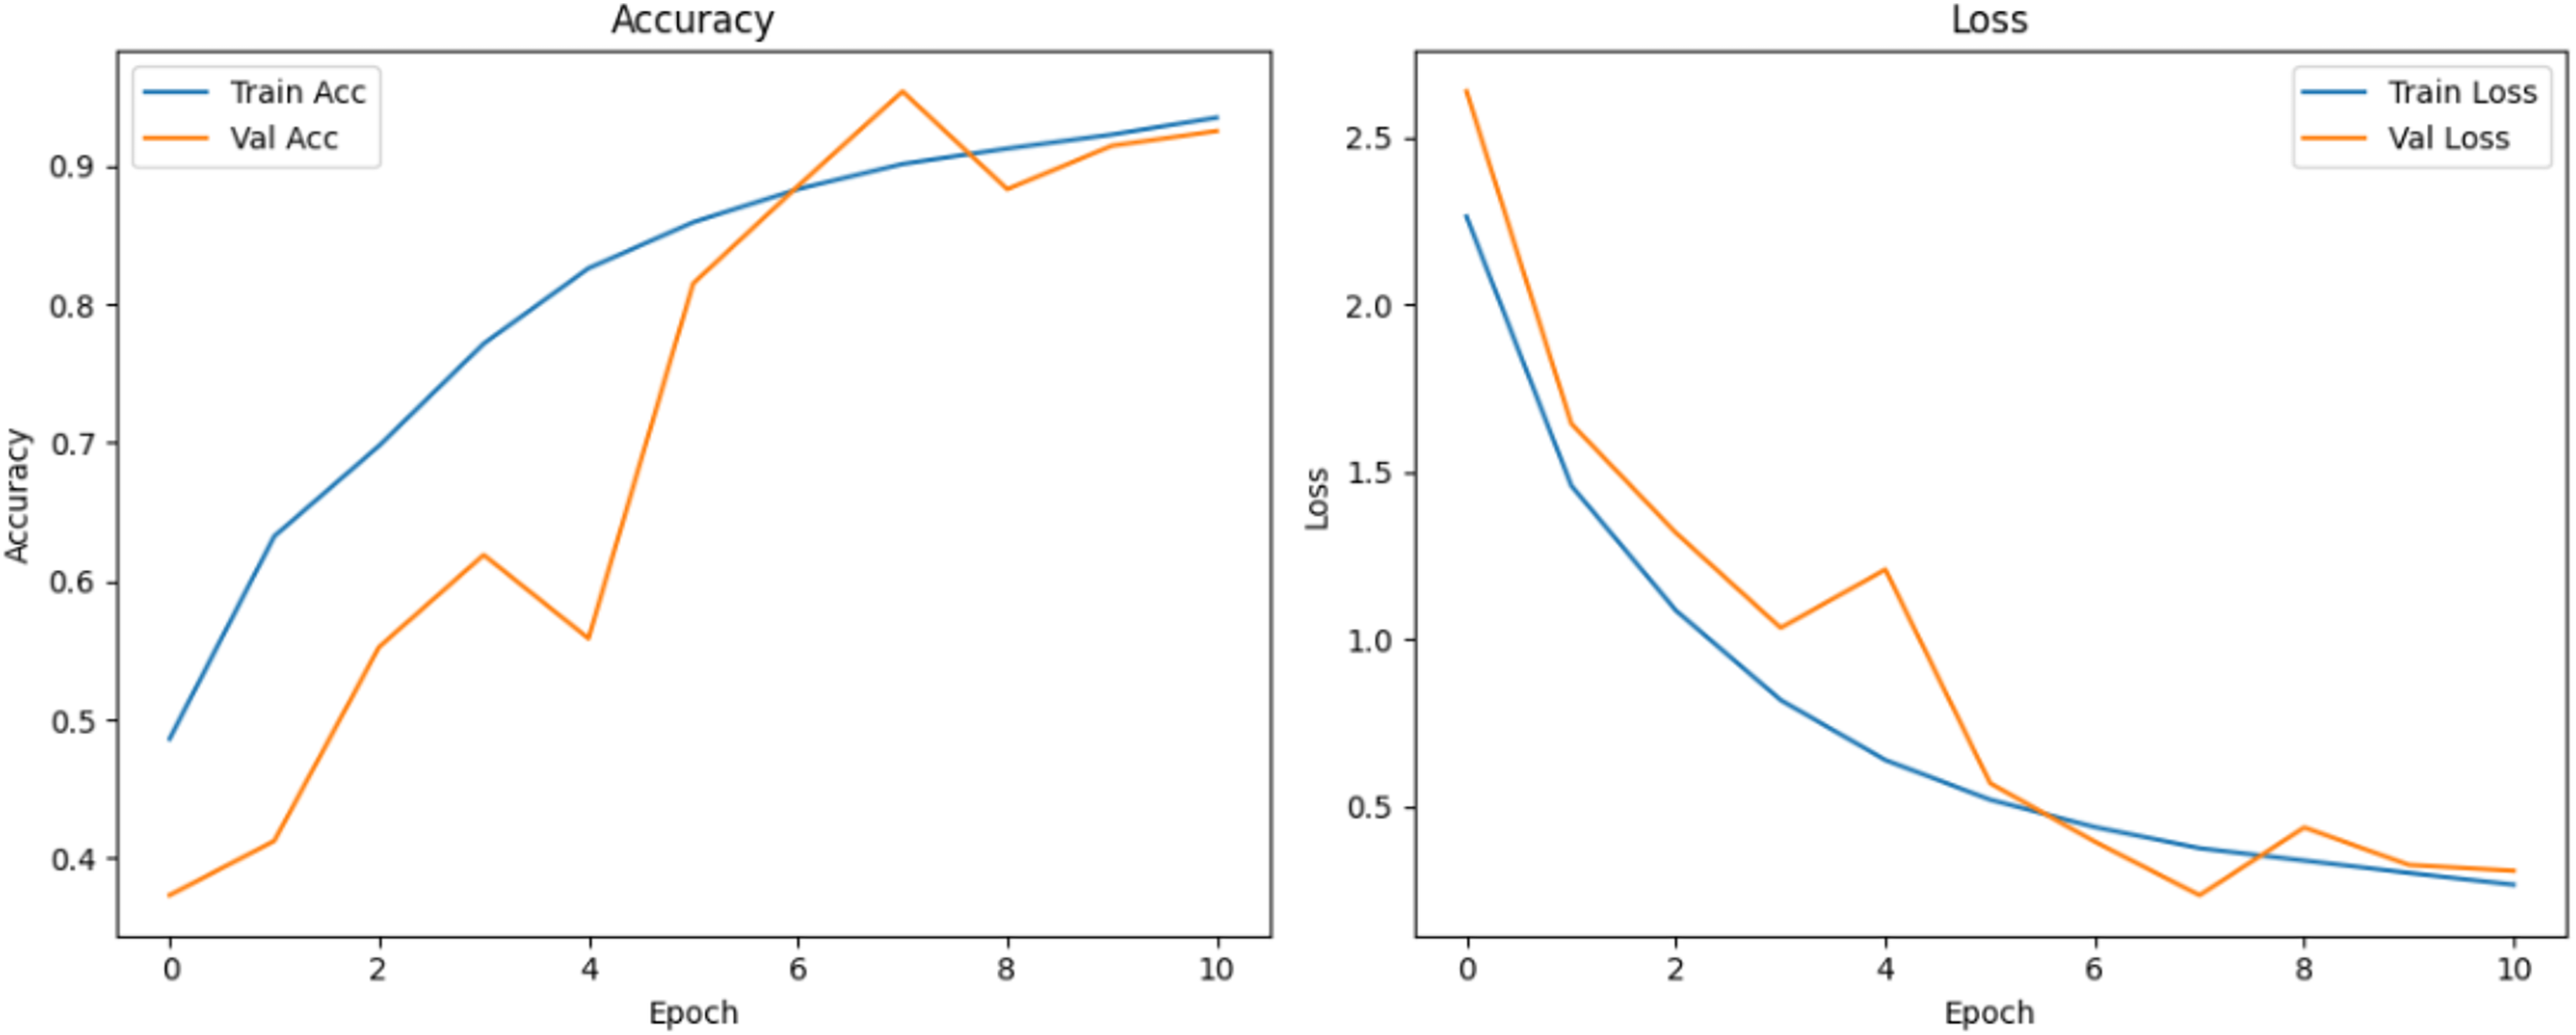
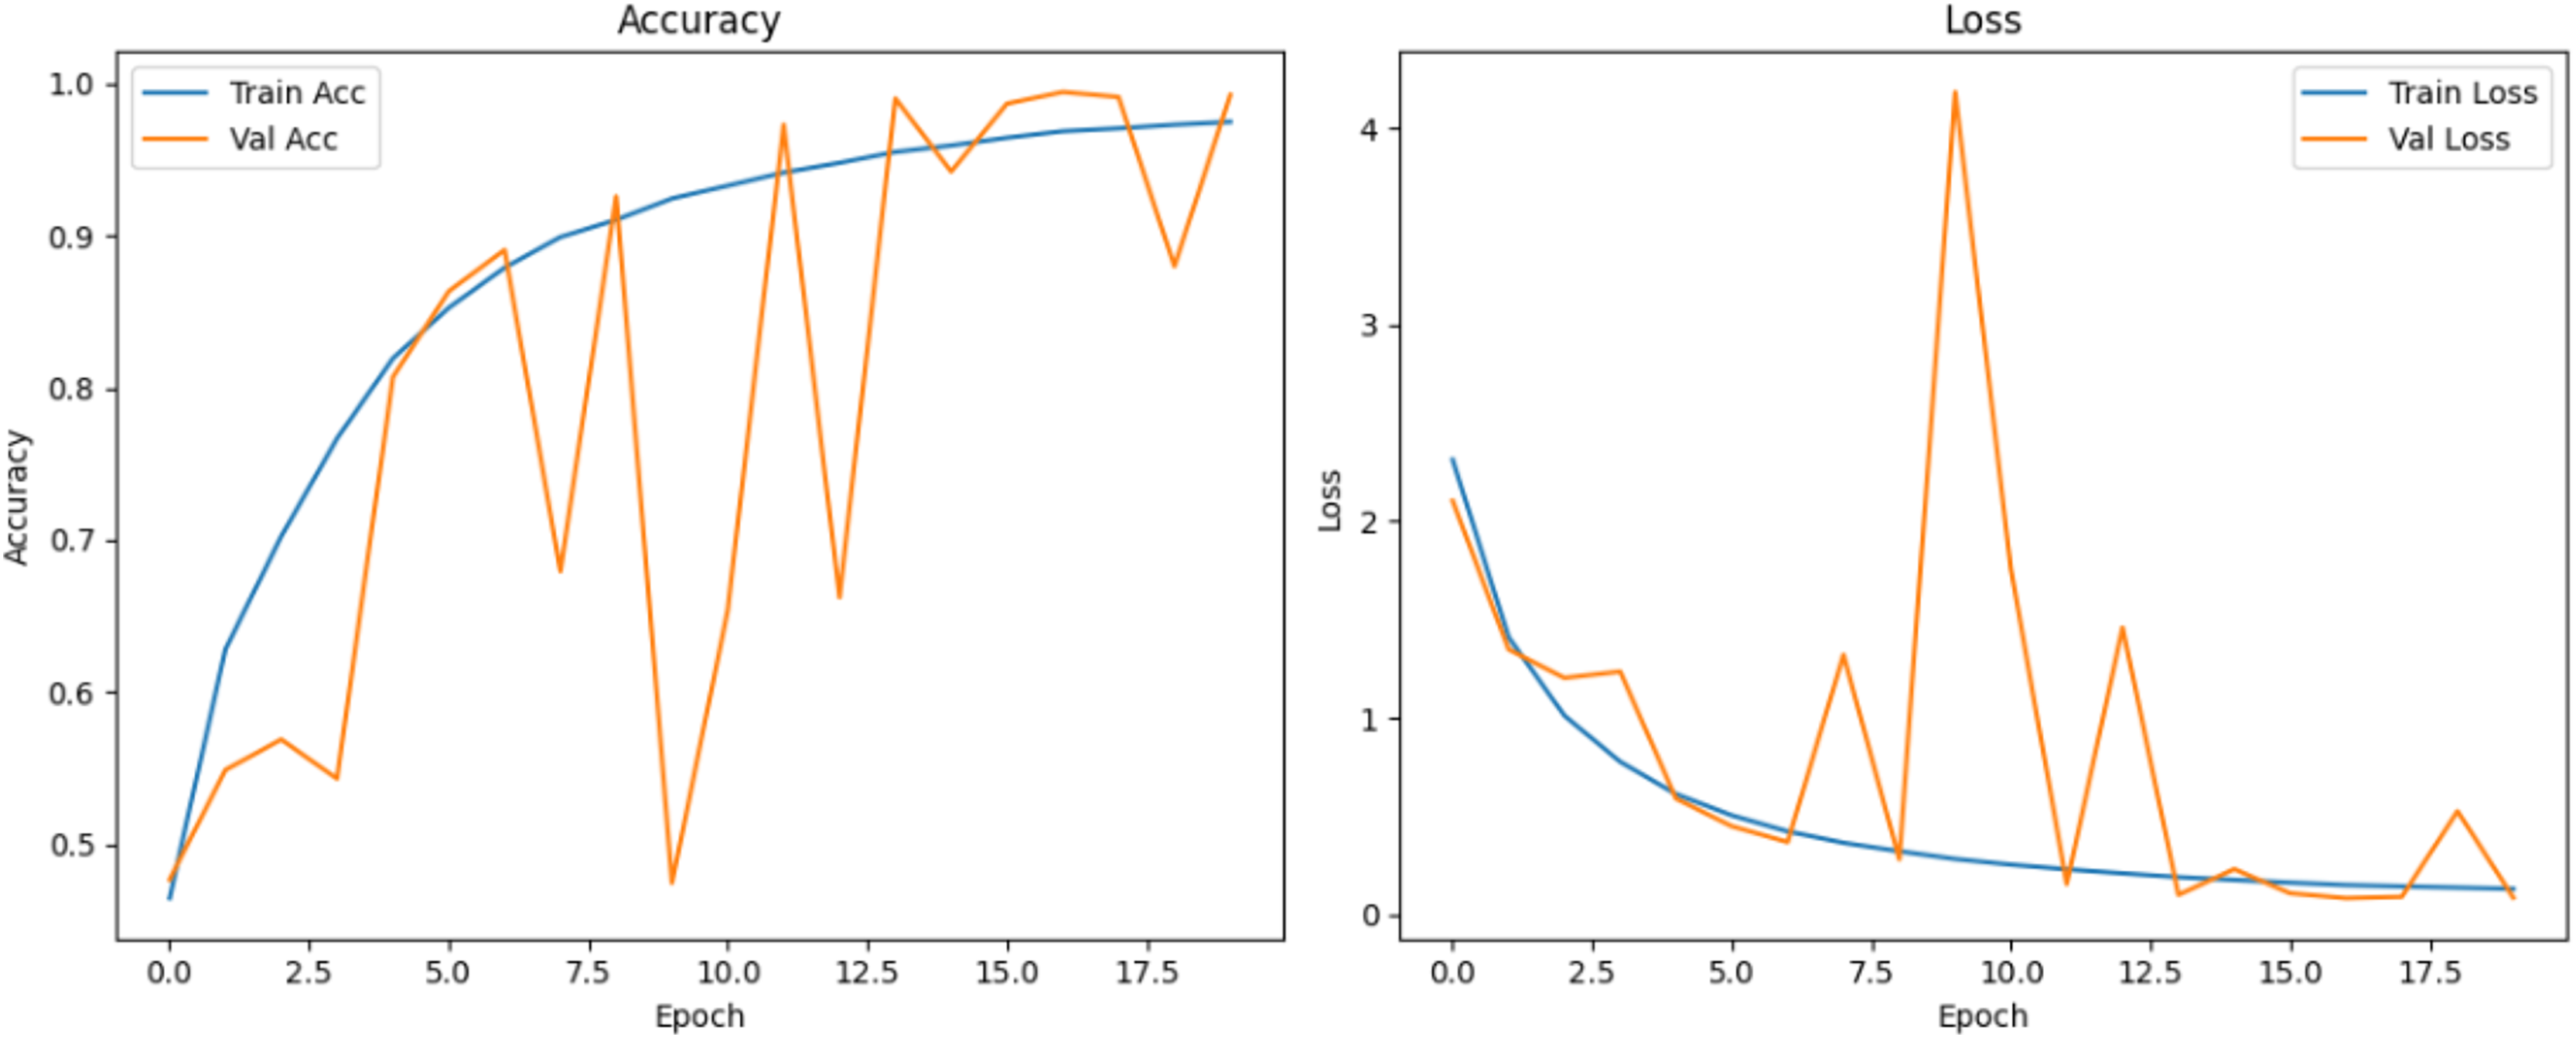
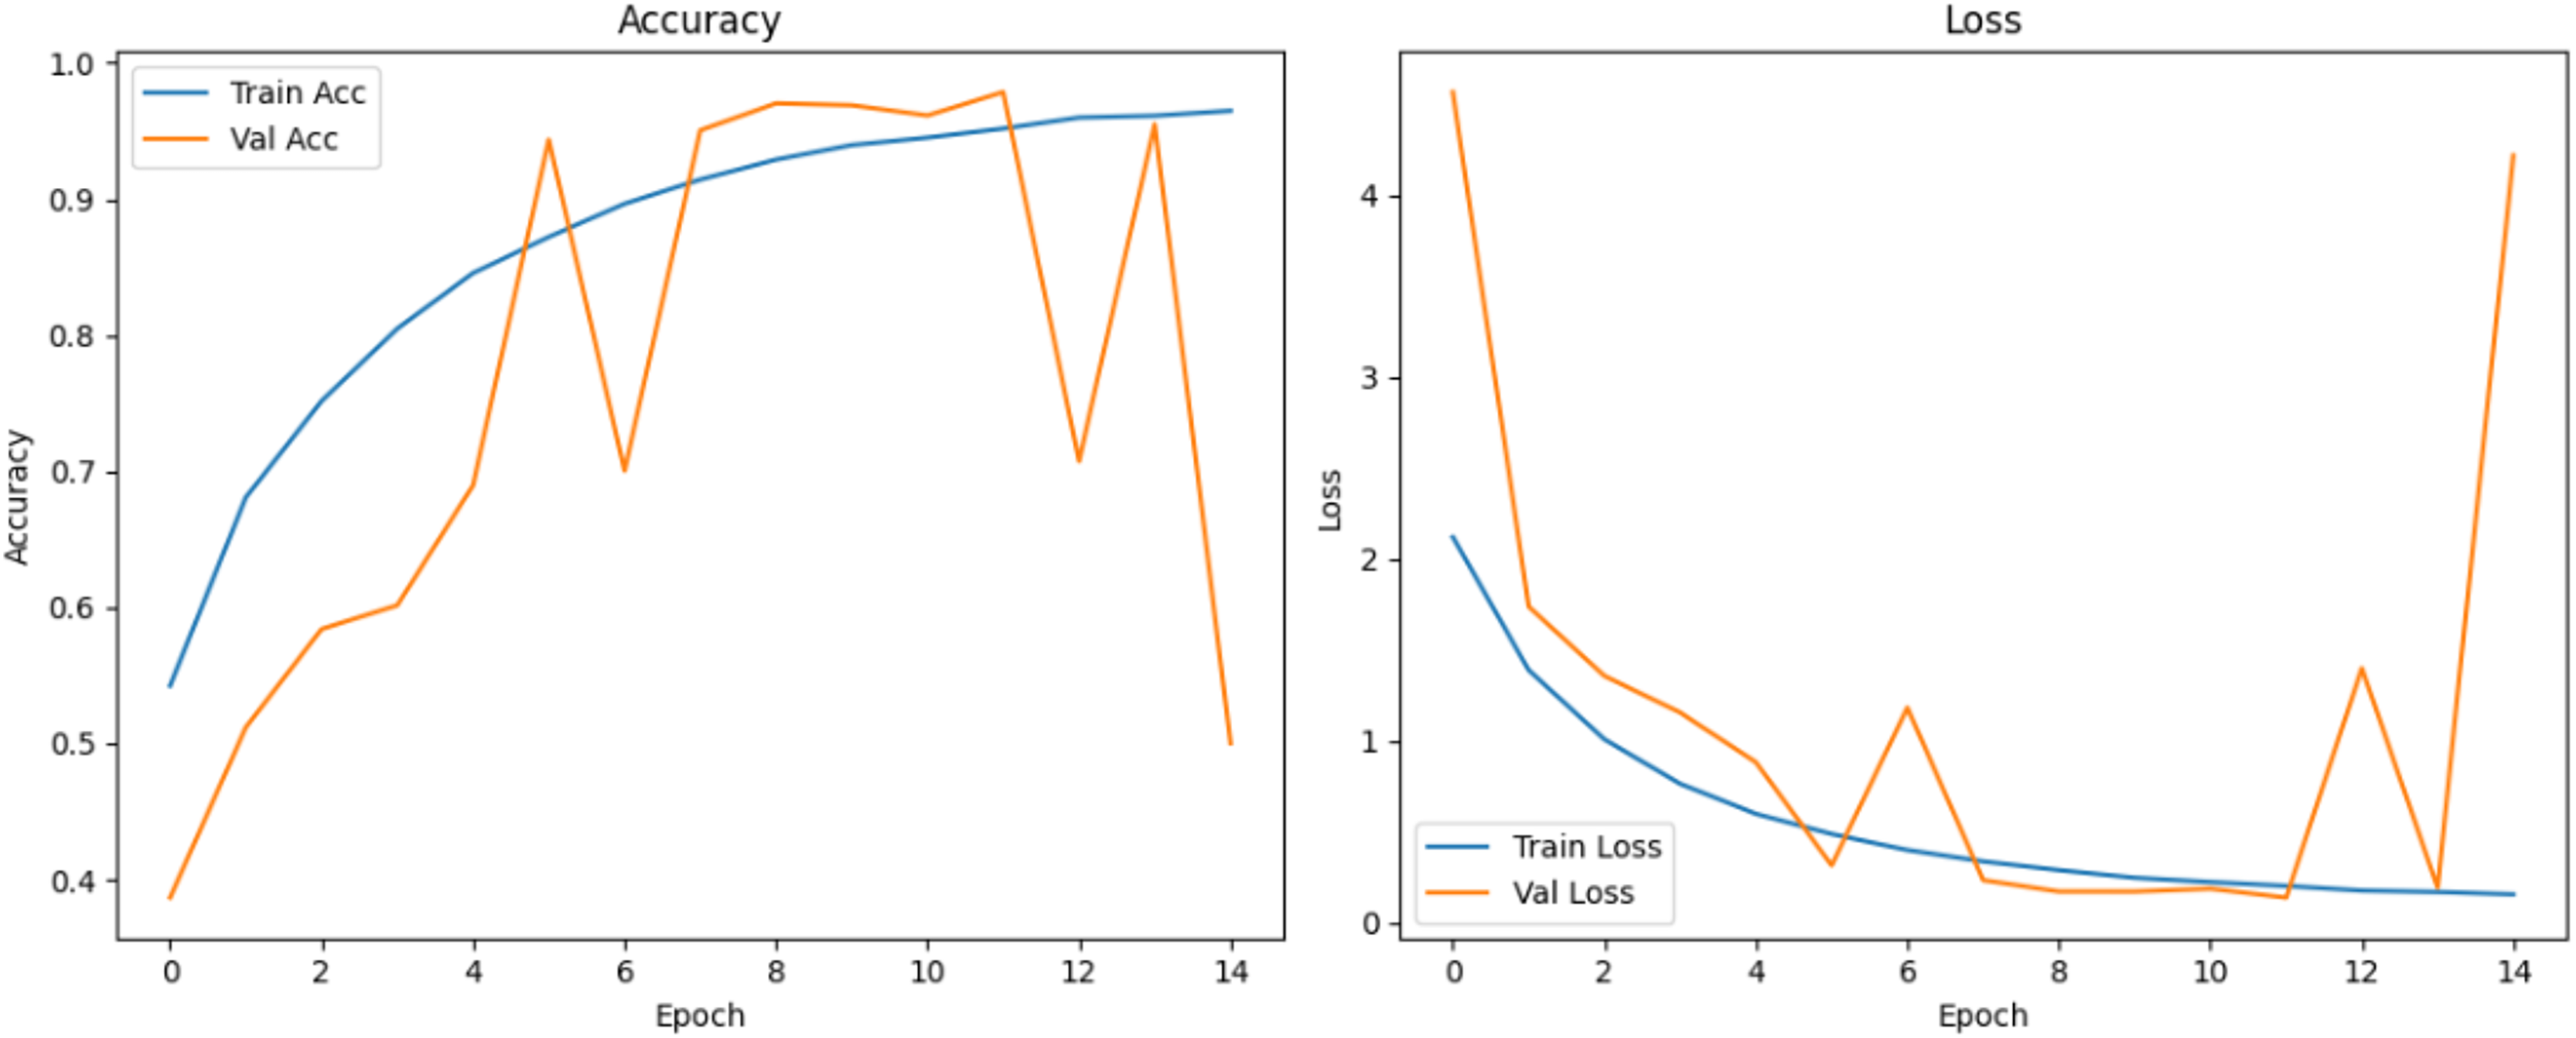
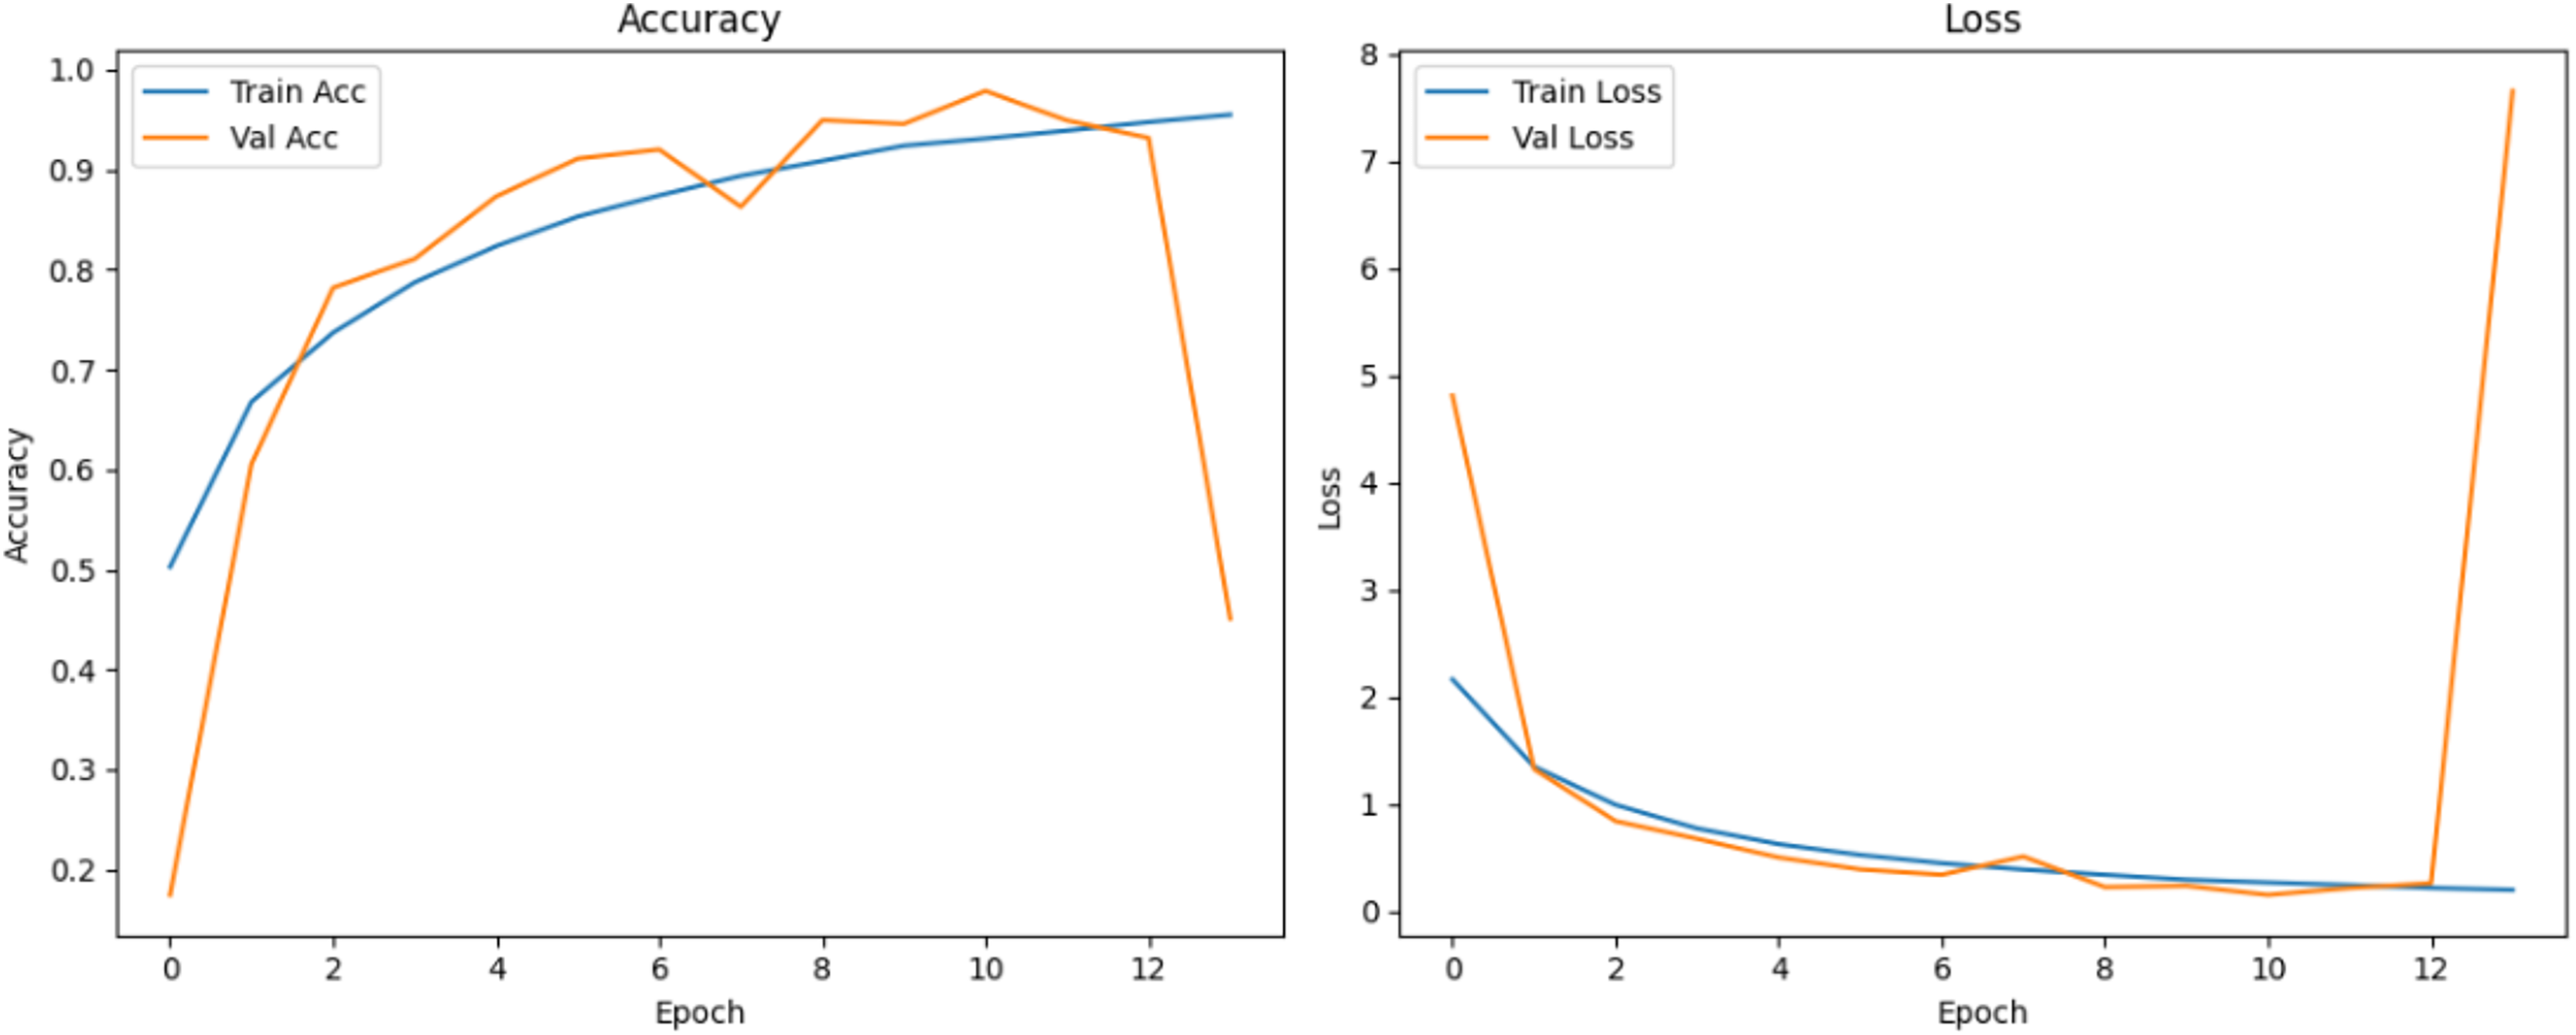
Figure 10 shows that all models maintained high precision and recall, and also shows that Epoch72+CNN model performing the best overall. As shown in Figs. 11, 12, 13, 14, 15 and 16, the training and validation accuracy/loss curves for the GAN-augmented CNN models highlight the convergence behavior. The saw like fluctuations in validation accuracy after adding synthetic images could arise from several possible factors. One possibility is that the synthetic images, though realistic, may not perfectly match the true data distribution, leading the CNN to occasionally overfit synthetic specific features that do not generalize well to the real validation set. Another possibility is that the inclusion of synthetic data increases intra-class variability, making the optimization process more complex and temporarily unstable across epochs. It may also result from greater stochasticity in training due to changes in batch composition and feature variance.
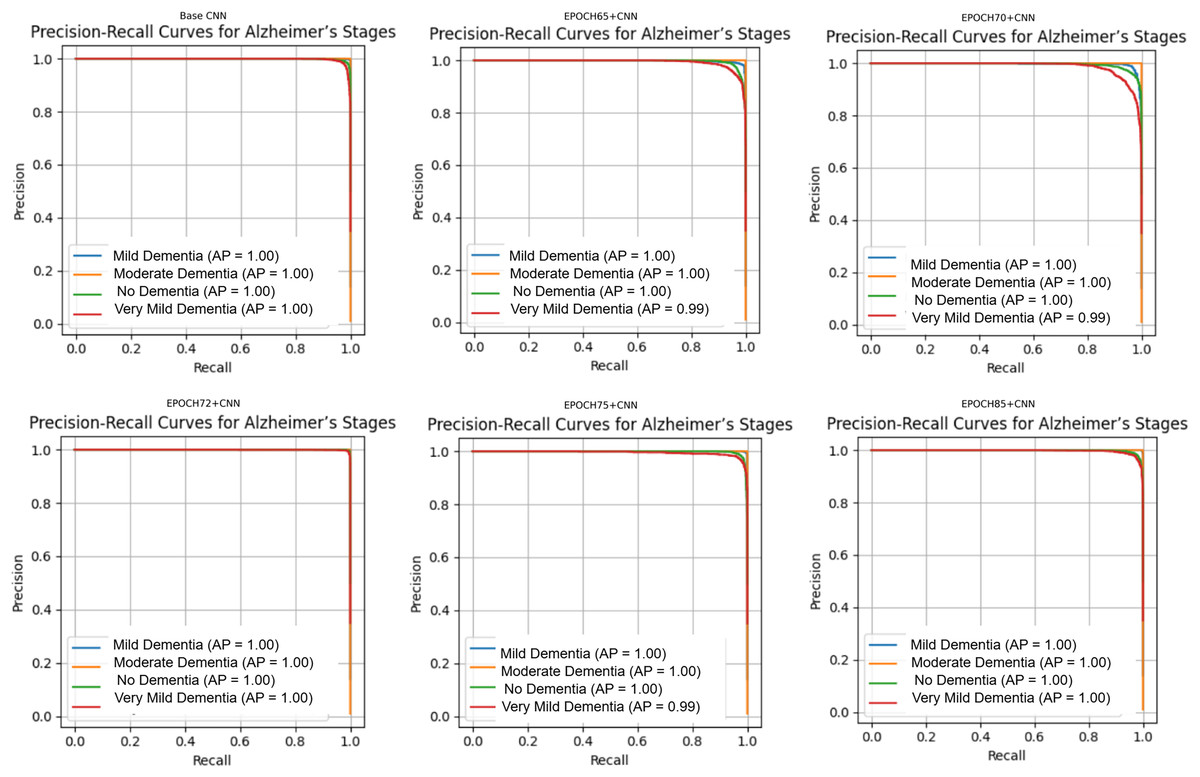
Figure 10: Precision Recall curves for models.
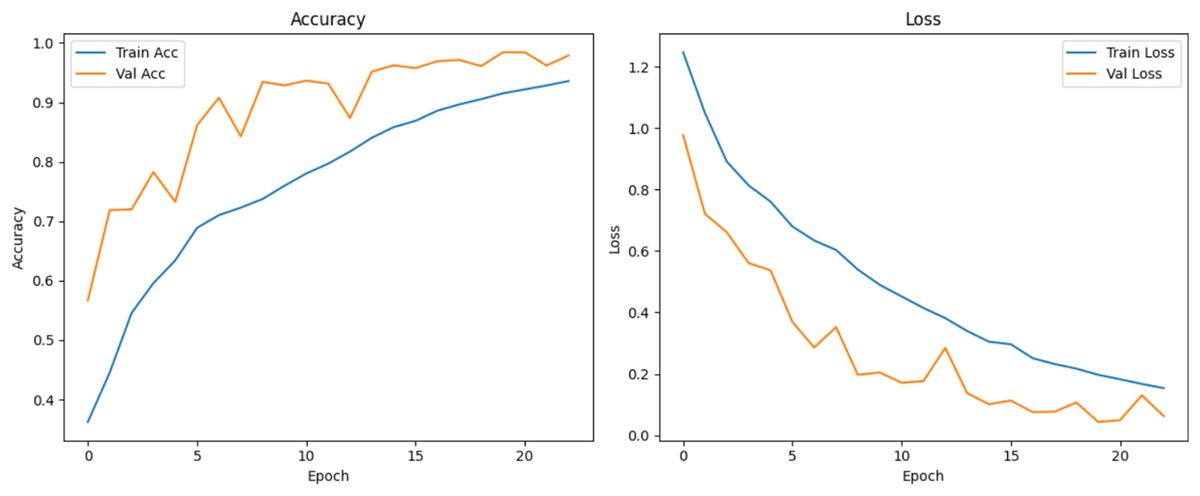
Figure 11: Accuracy and loss curves for baseline CNN model.
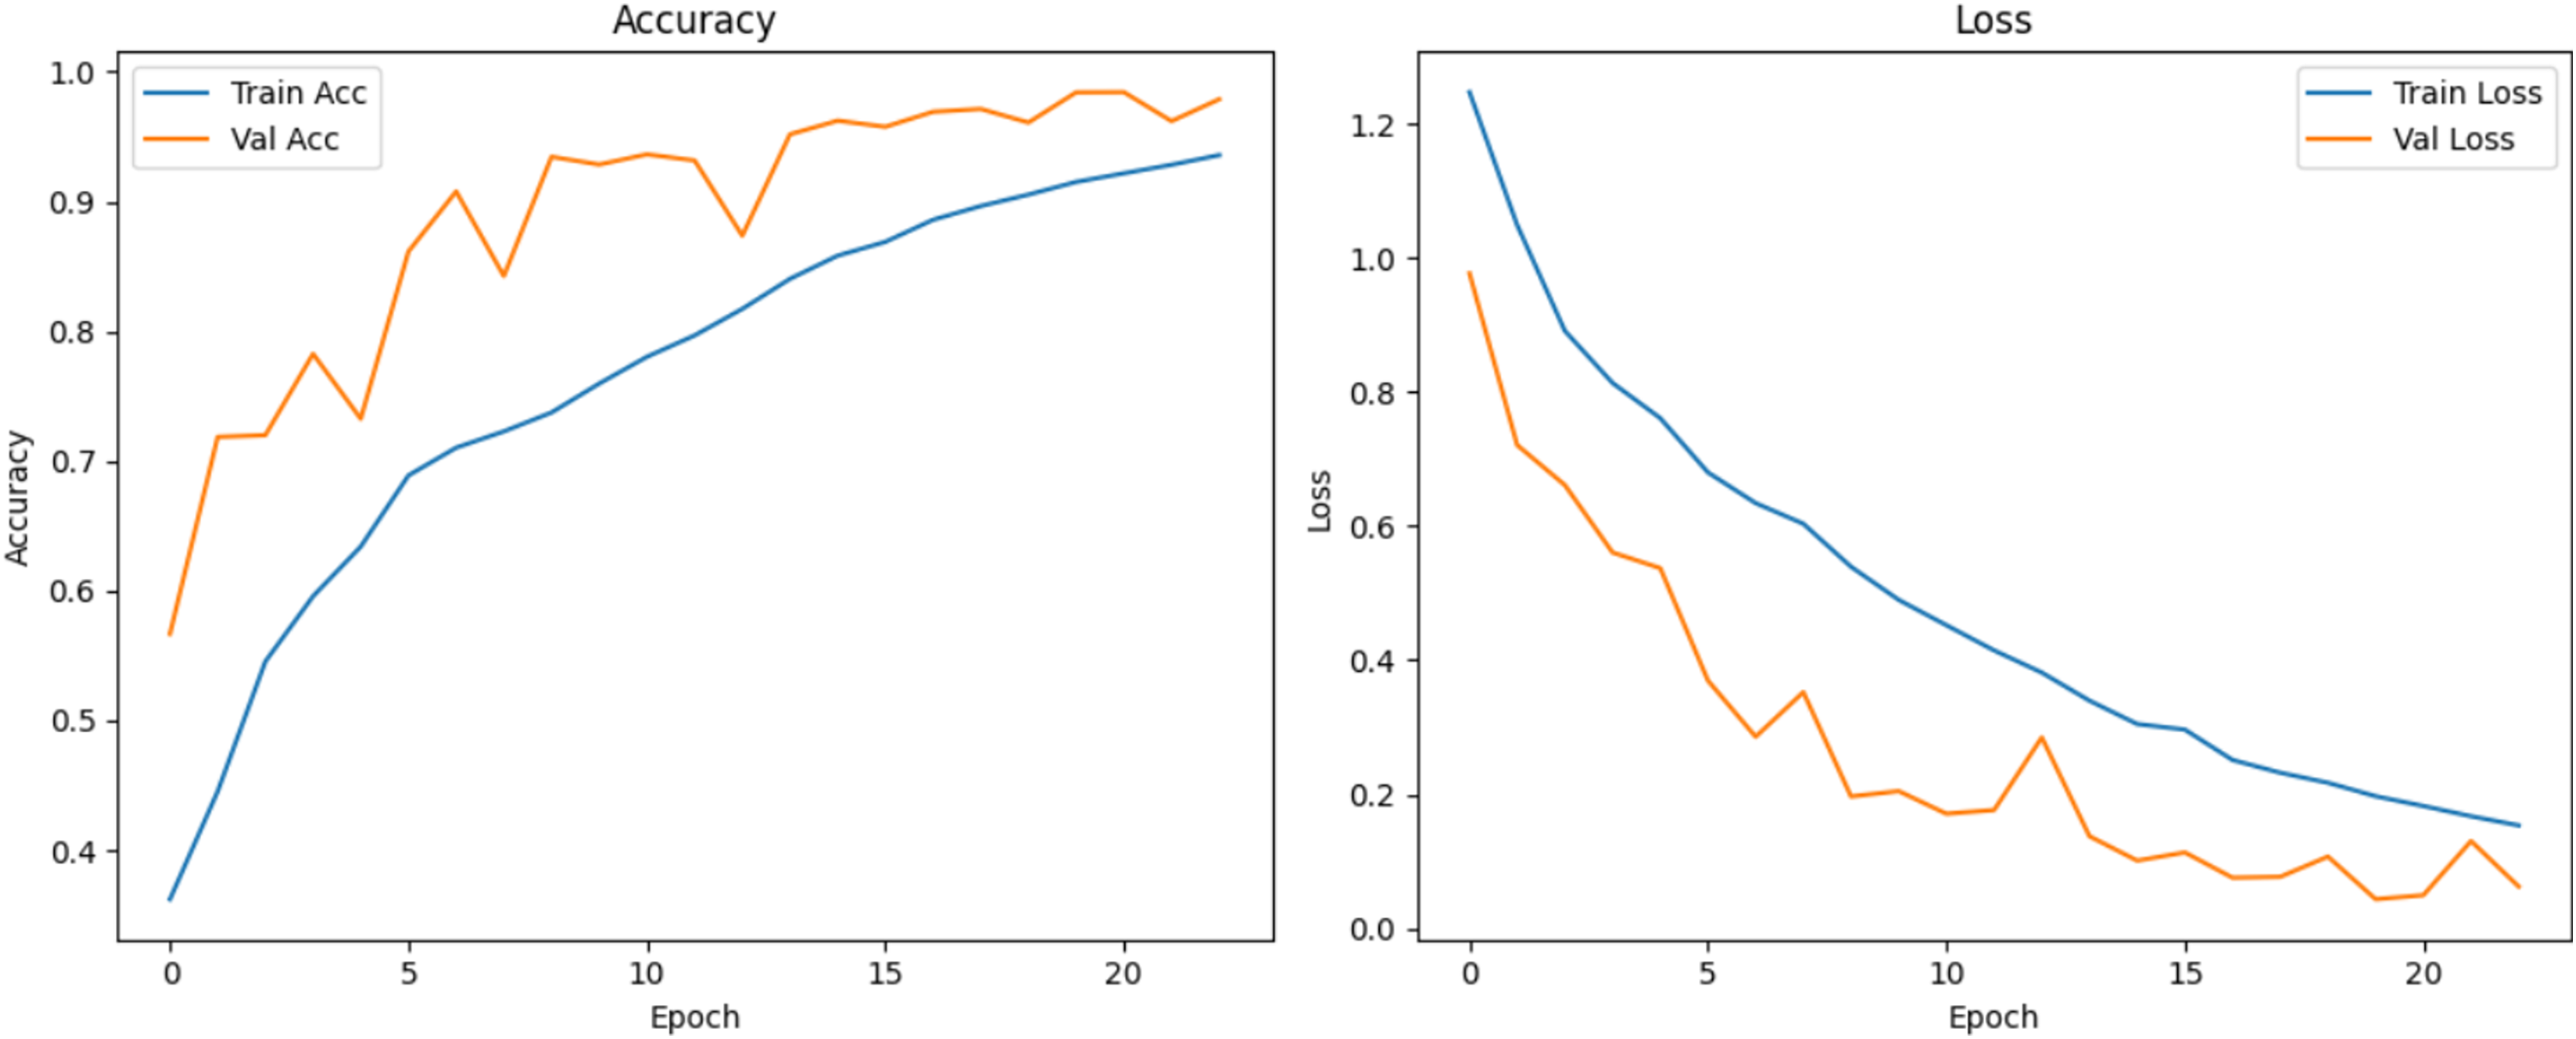
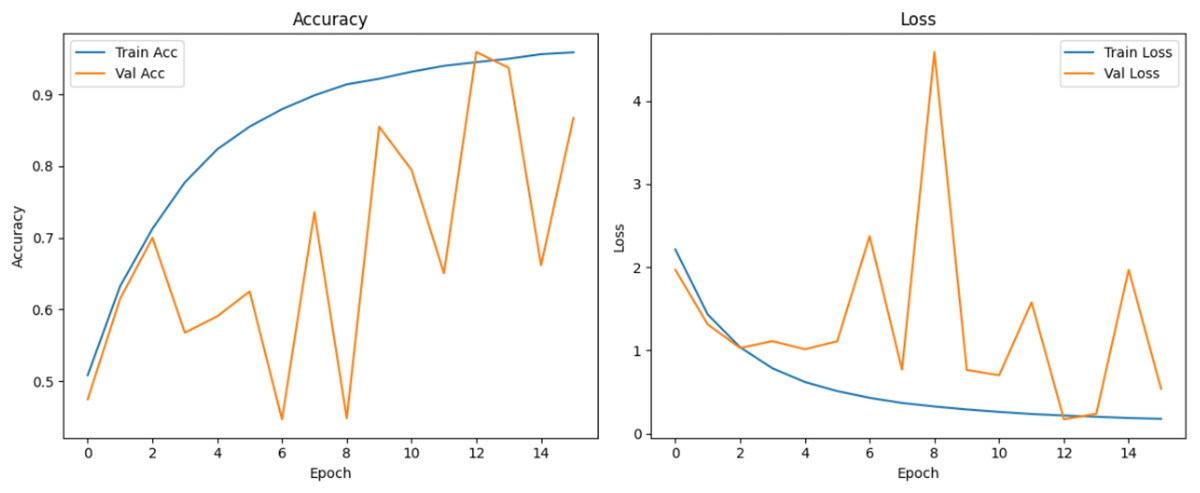
Figure 12: Accuracy and loss curves for EPOCH65 generator.
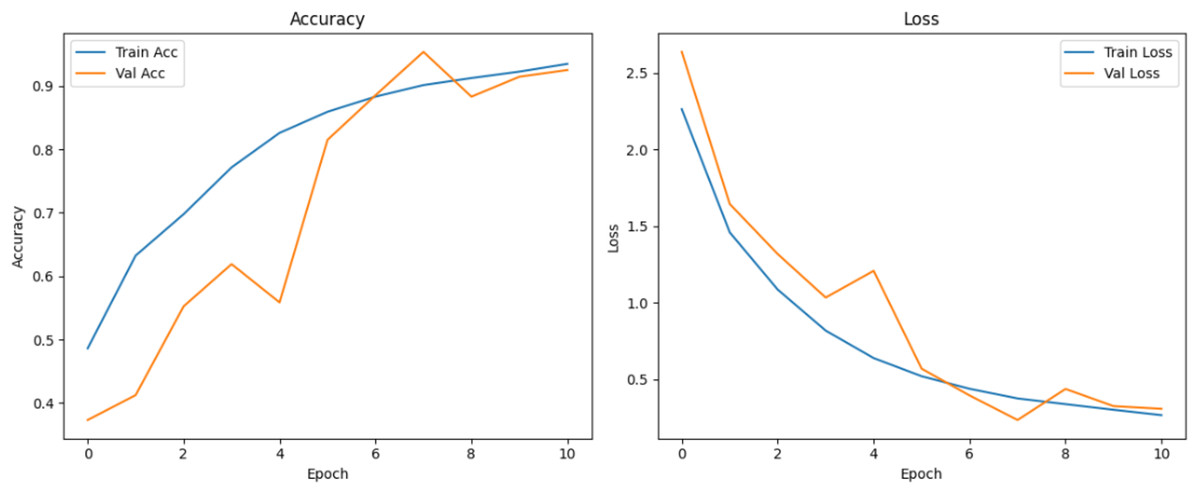
Figure 13: Accuracy and loss curves for EPOCH70 generator.
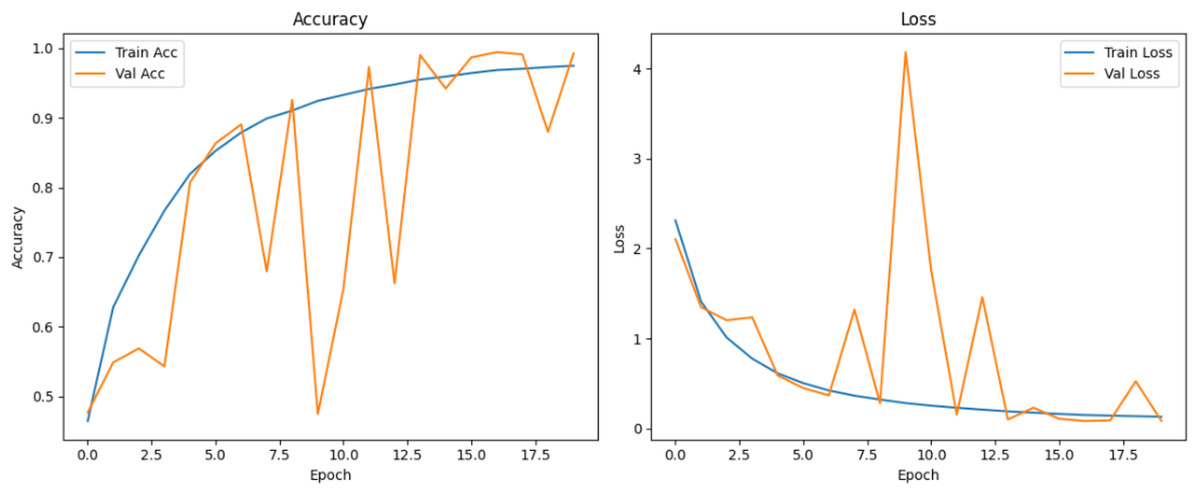
Figure 14: Accuracy and loss curves for EPOCH72 generator.
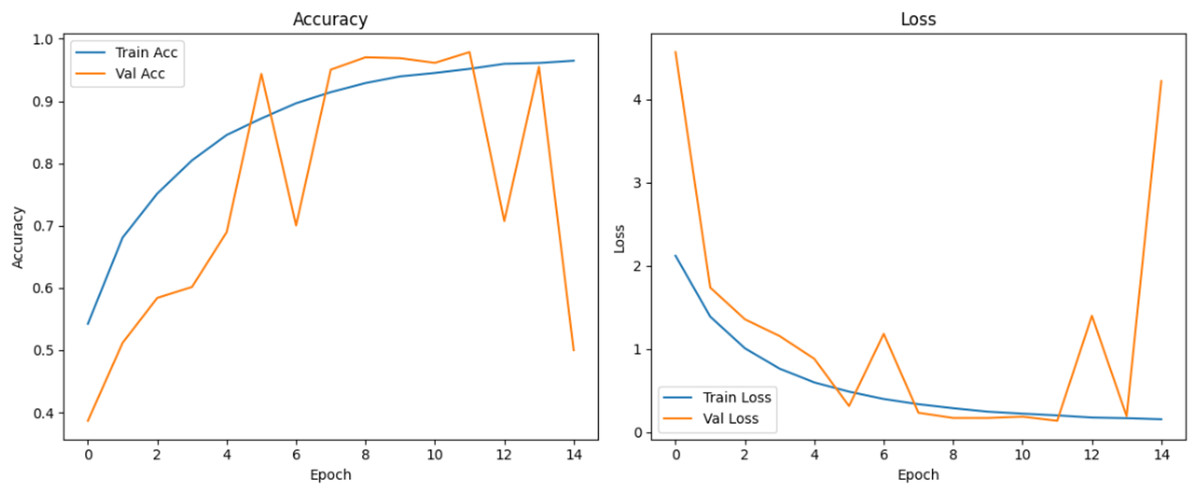
Figure 15: Accuracy and loss curves for EPOCH75 generator.
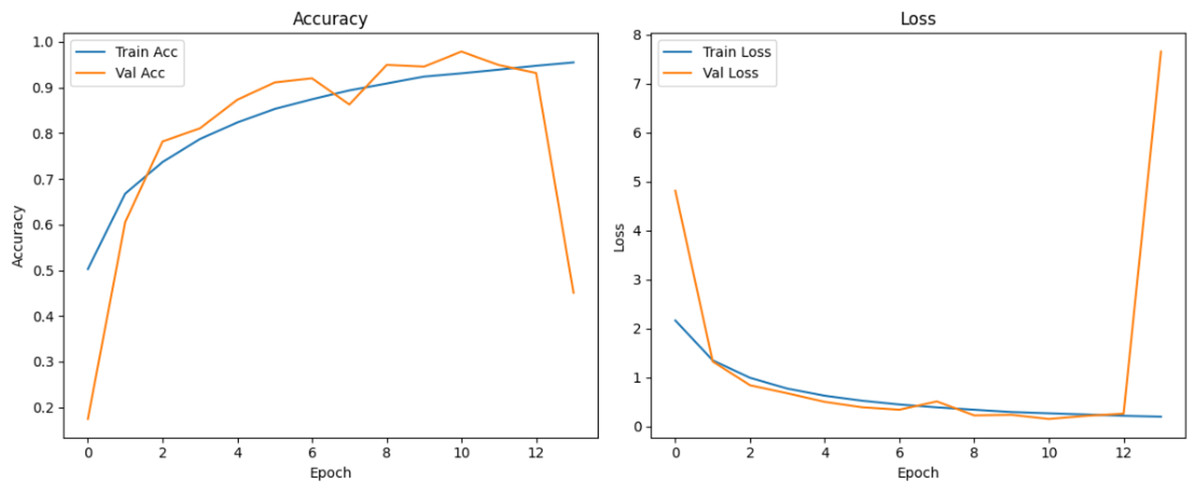
Figure 16: Accuracy and loss curves for EPOCH85 generator.
To statistically validate model differences, McNemar’s test was conducted comparing each GAN-augmented CNN to the baseline. Results are shown in Table 4. Exact p-values are reported, along with counts of discordant predictions, : samples correctly classified by the baseline but misclassified by the GAN model, and : samples misclassified by the baseline but correctly classified by the GAN model.
| Comparison | df | p-value | Significant? | |||
|---|---|---|---|---|---|---|
| Baseline vs. GAN85 | 116 | 80 | 6.2500 | 1 | 0.0124 | Yes |
| Baseline vs. GAN75 | 117 | 81 | 6.1869 | 1 | 0.0129 | Yes |
| Baseline vs. GAN72 | 28 | 93 | 33.8512 | 1 | 0.0000 | Yes (Best) |
| Baseline vs. GAN70 | 261 | 66 | 115.0948 | 1 | 0.0000 | Yes (Baseline better) |
| Baseline vs. GAN65 | 247 | 86 | 76.8769 | 1 | 0.0000 | Yes (Baseline better) |
McNemar’s test reporting
To assess whether the observed differences in classification outcomes between the baseline CNN and the GAN-augmented models were statistically significant, McNemar’s test was applied to each model pair. The test compared the number of instances that were correctly predicted by only one of the two models, using a 2 2 contingency table of the form [[0, b], [c, 0]], where b is the count of samples correctly classified by the baseline but misclassified by the GAN model, and c is the reverse. Each comparison yielded statistically significant results (p < 0.05), as shown in Table 4. Notably, the GAN72 model demonstrated the strongest performance improvement over the baseline, with a high number of corrections (c = 93) and a much lower number of baseline-only correct predictions (b = 28). The Epoch 72 generator stood out by achieving the best balance between realism (FID), model stability, and classification performance. Its synthetic images exhibited higher anatomical consistency and diversity, particularly capturing subtle variations in “Very Mild Dementia” class as seen in Fig. 17. In contrast, models such as GAN70 and GAN65, although statistically significant, exhibited more cases where the baseline outperformed the GAN model (b > c), suggesting overfitting or instability despite synthetic augmentation, reinforcing the importance of generator quality. Although all models showed statistical significance, only GAN72 exhibited both statistical and practical superiority over the baseline. These results reinforce that statistical tests should be interpreted in tandem with model performance metrics such as accuracy and F1-score to ensure meaningful improvements in clinical prediction tasks. These findings confirm that DCGAN augmentation can improve classification performance, but generator selection must be based on both statistical metrics (like FID and p-value) and practical model behavior (e.g., confusion matrices, validation F1).
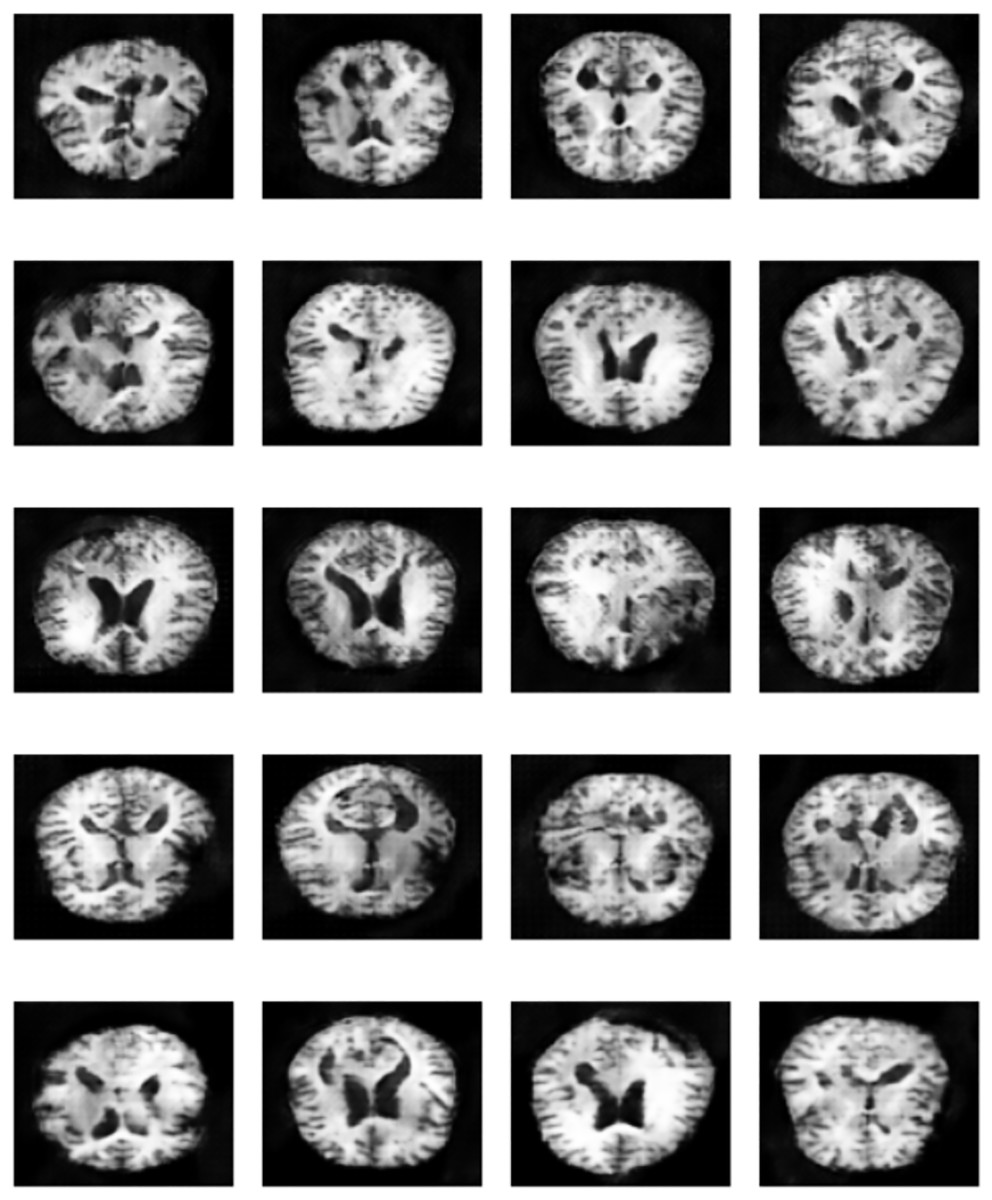
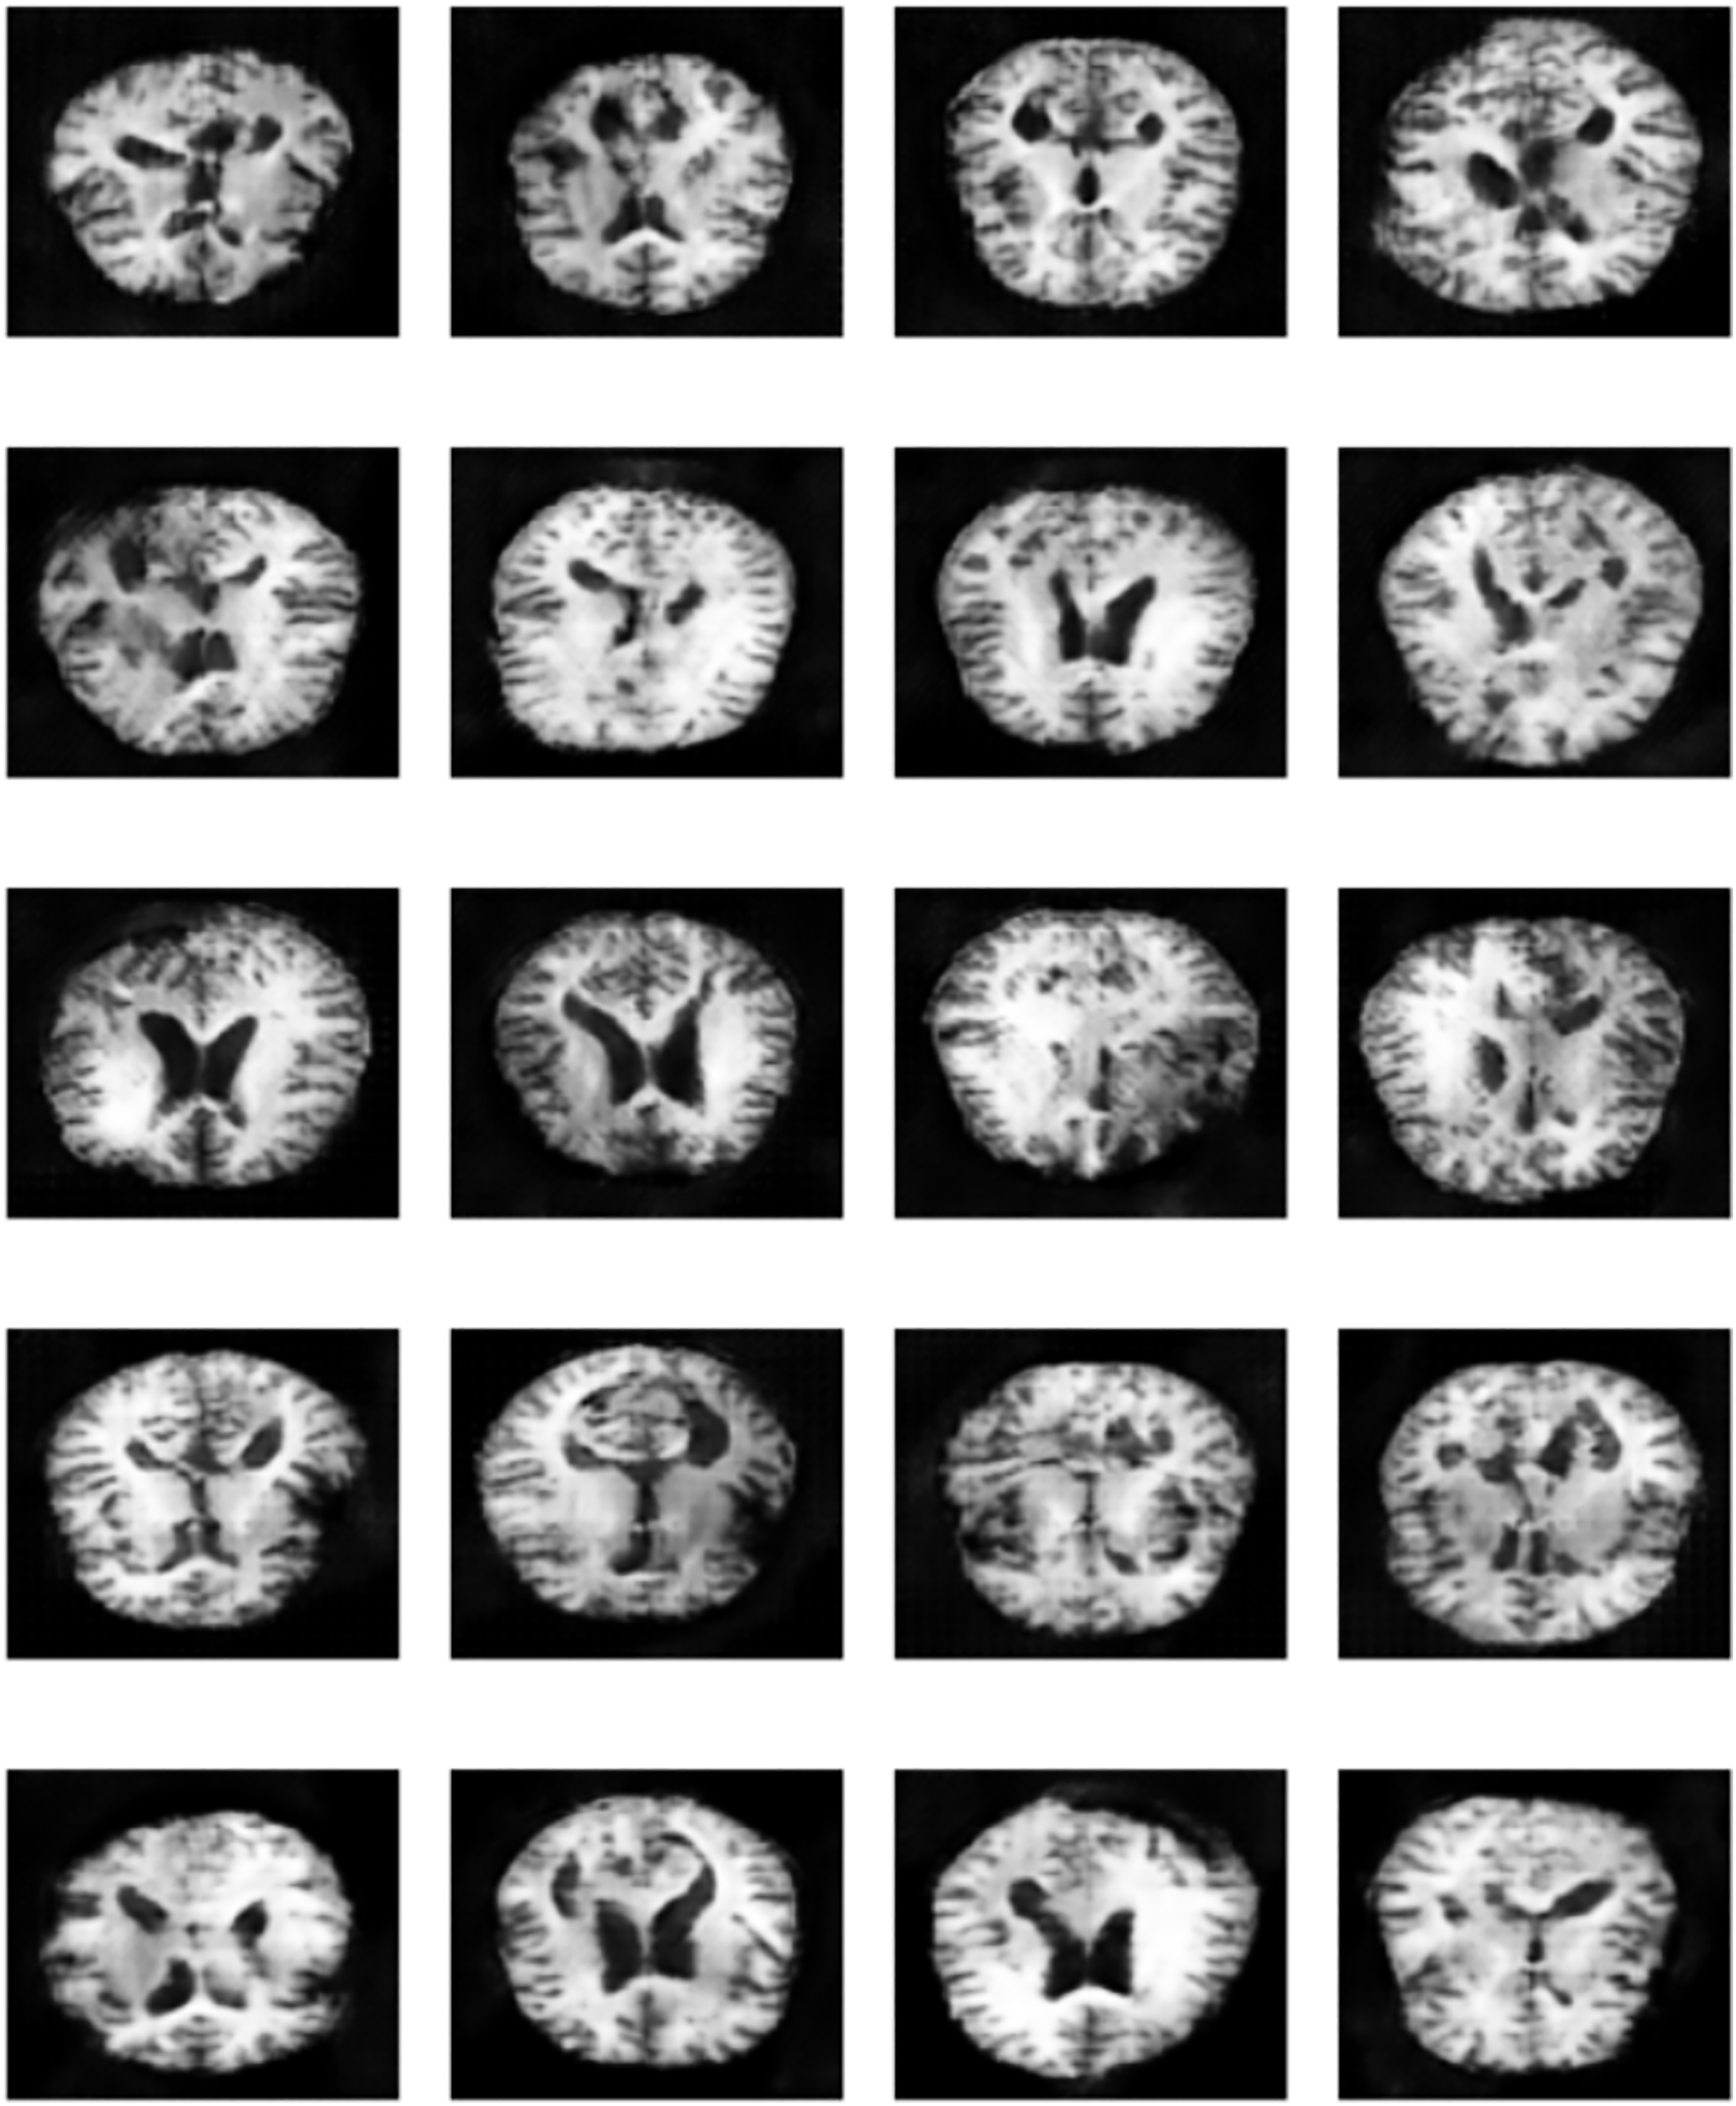
Figure 17: Sample of “Very Mild Dementia” class images produced by EPOCH72 generator.
In summary, while DCGAN-generated images significantly influenced classification performance, the choice of generator plays a crucial role. The best-performing model (Epoch 72) achieved a 99% accuracy and perfect F1-score, particularly improving “Very Mild Dementia” class predictions, thereby enhancing early AD detection. The study demonstrates that high-quality synthetic data generated by DCGANs can introduce subtle yet critical variations that are often missed by traditional augmentation techniques such as rotation, contrast adjustment, or zooming. The most important finding is that GAN-based augmentation, when carefully applied, can significantly enhance the model’s ability to distinguish between closely related classes such as “Very Mild Dementia” and “No Dementia”, leading to improved early-stage AD classification.
While synthetic data generation using DCGANs provides significant advantages in addressing class imbalance, it also introduces potential risks. Poorly trained generators may produce anatomically implausible or unrealistic images, leading to hallucinations or misleading patterns that can bias the classifier. These risks emphasize the importance of rigorous visual inspection and quantitative quality control before integrating synthetic data into the training pipeline.
A unique contribution of our method is the use of selective GAN checkpointing. Instead of relying solely on the final generator checkpoint, we systematically evaluated intermediate checkpoints and selected the one that produced the most realistic and diverse samples, as determined by both quantitative FID scores and qualitative visual inspection. A key insight from this analysis is that p-values alone are not sufficient to determine model superiority. A statistically significant result (e.g., ) only confirms that the models behave differently, but does not imply one is better than the other. The results reinforces that blindly augmenting datasets with synthetic images, without quality control, can degrade model generalization and introduce bias. Figure 17 illustrates qualitative differences in the synthetic images generated by various checkpoints. These findings also support a more selective approach to GAN-based augmentation targeting underrepresented or borderline classes where real data scarcity most affects classifier uncertainty. This targeted strategy not only reduces noise but maximizes the effectiveness of synthetic data in improving classification boundaries.
Ablation study
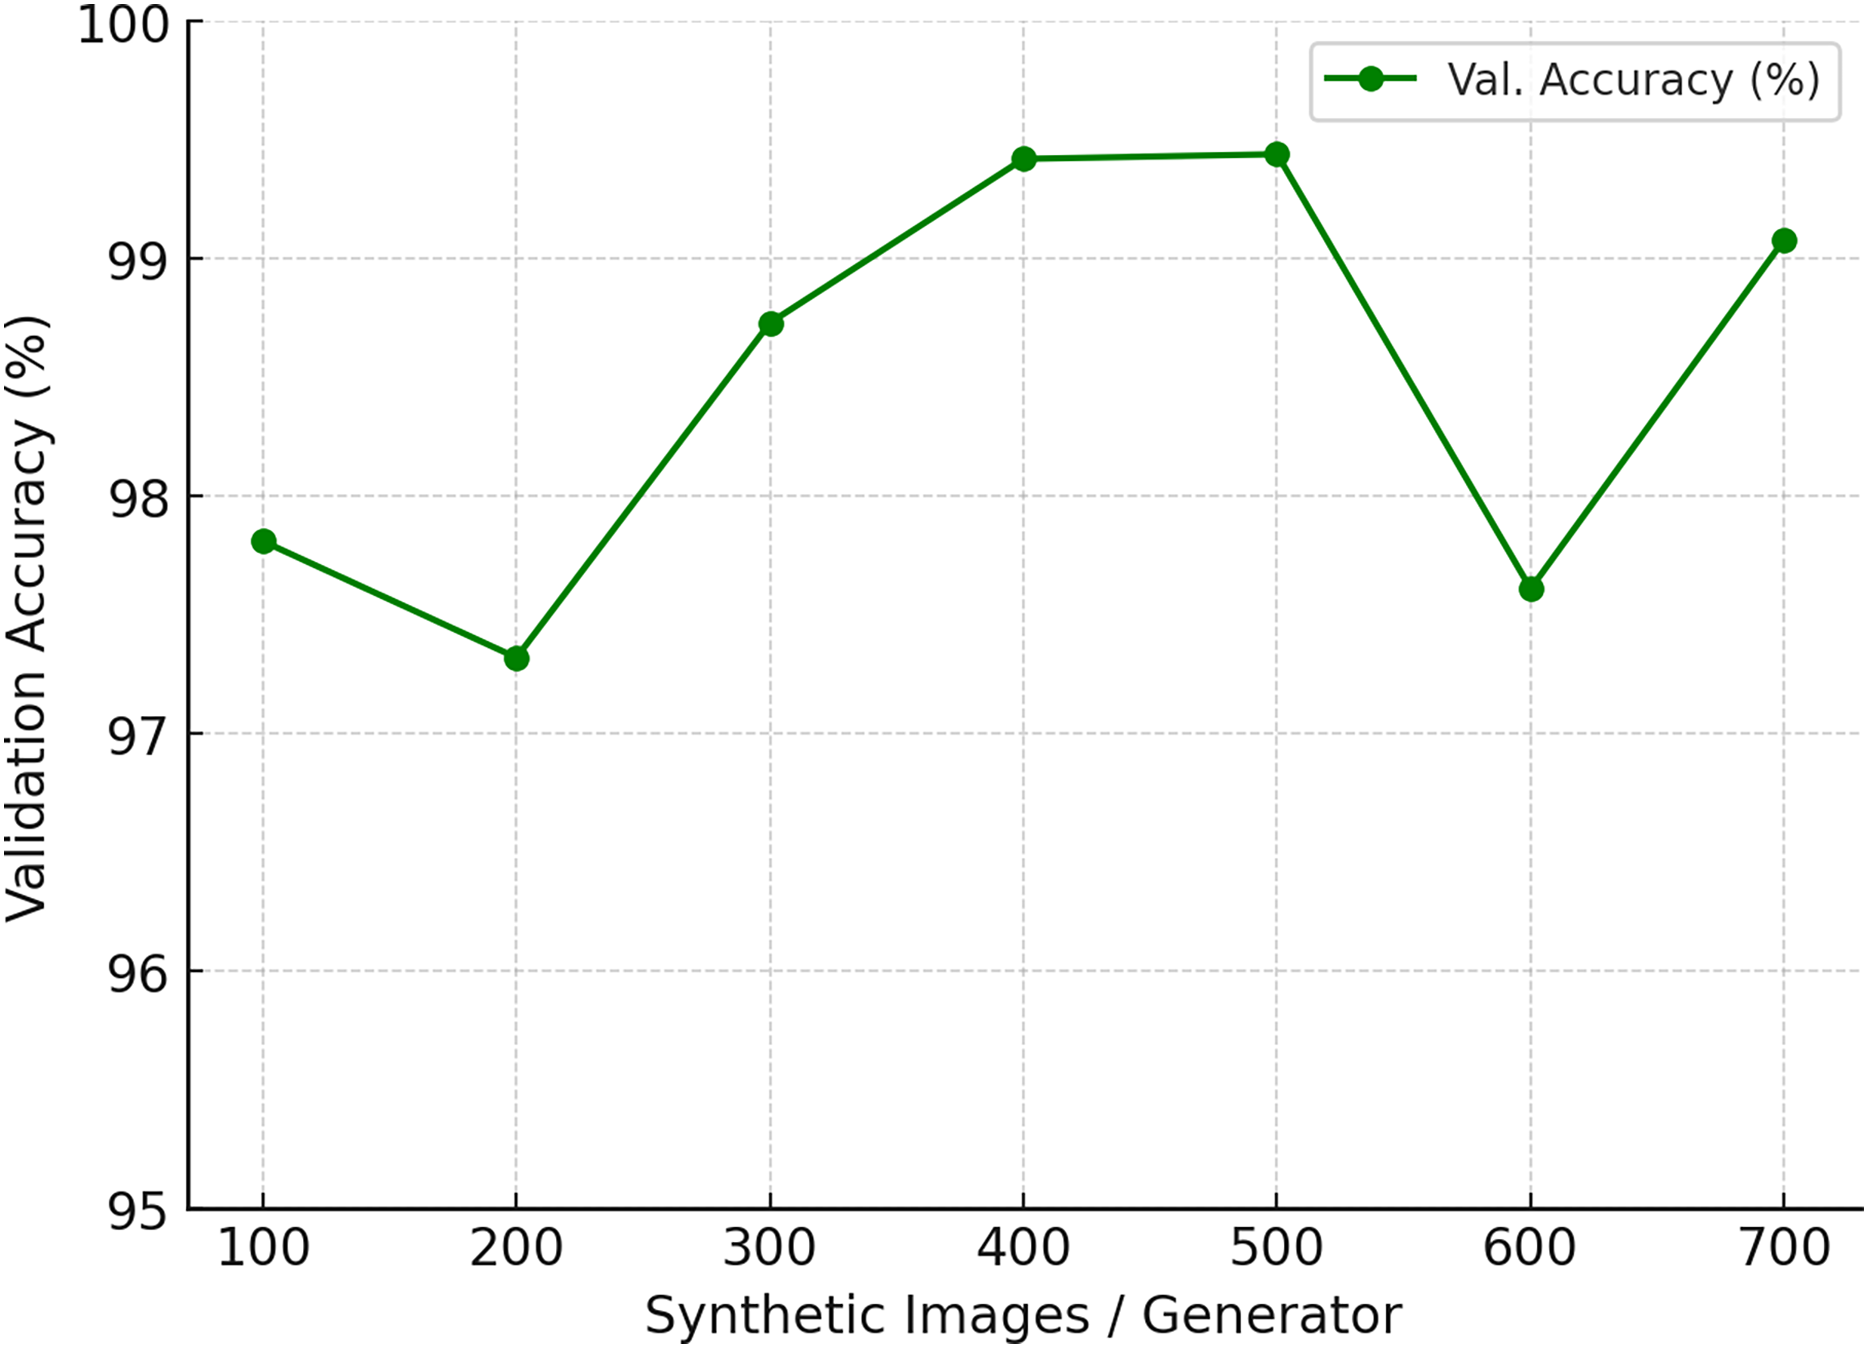
To assess the impact of synthetic data augmentation, we varied the number of generated images per generator from 100 to 700 while keeping all other factors constant (model architecture, optimizer, training schedule, and data splits).The results are summarized in Table 5 and illustrated in Fig. 18. Accuracy steadily improves when moving from 100 to 400 synthetic images, with a sharp gain between 300 and 400. At 500 images, the model achieves its highest validation accuracy of 99.44%, alongside stable precision and recall values (0.99). Beyond this point, performance either plateaus or even declines: at 600 images accuracy drops to 97.61%, while 700 partially recovers to 99.08%. Precision and recall remain high (0.98–1.00), suggesting that sensitivity is already saturated, and the additional synthetic images may introduce redundancy or artifacts that disrupt generalization.
| Synthetic images/Generator | Precision | Recall | Val. accuracy (%) |
|---|---|---|---|
| 100 | 0.97 | 0.99 | 97.81 |
| 200 | 0.95 | 0.98 | 97.32 |
| 300 | 0.97 | 1.00 | 98.73 |
| 400 | 0.99 | 1.00 | 99.42 |
| 500 | 0.99 | 0.99 | 99.44 |
| 600 | 0.96 | 0.99 | 97.61 |
| 700 | 0.98 | 1.00 | 99.08 |
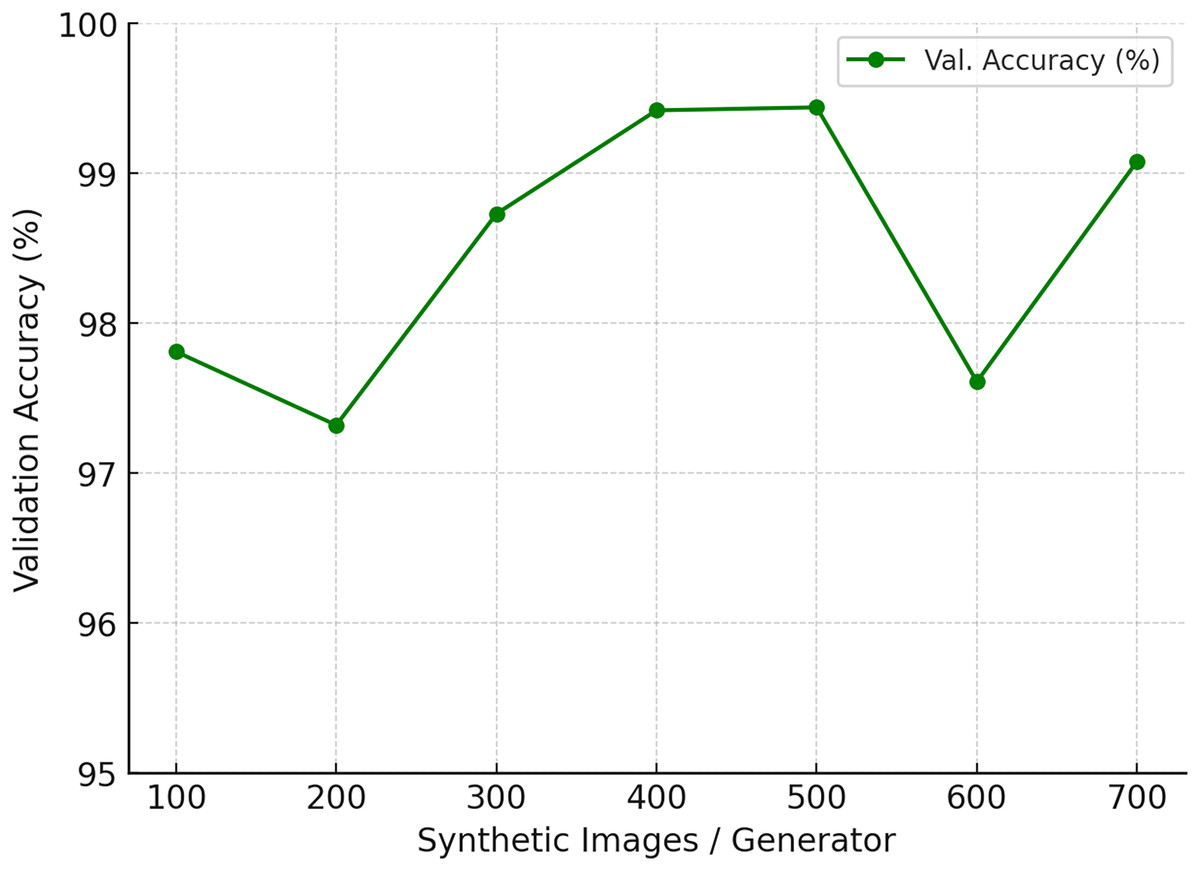
Figure 18: Ablation study on the number of synthetic images generated per generator.
Clinical relevance and limitations
The improved decision boundary between “Very Mild Dementia” and “No Dementia” is particularly important in clinical settings, as early and accurate diagnosis of cognitive decline allows for timely intervention, improved care planning, and potentially slower disease progression. Reducing misclassification risk in these early stages directly addresses a persistent challenge in diagnostic neurology.
In real-world healthcare settings, such improvements in classifying “Very Mild Dementia” patients could support early triage systems, enabling clinicians to flag high-risk individuals before cognitive decline becomes severe. Integration into decision support tools for radiologists and neurologists may reduce diagnostic delay and improve personalized care planning. Despite these strengths, several limitations exist. First, DCGAN performance is highly dependent on checkpoint quality, poorly trained generators can introduce misleading features. Second, this study used only 500 synthetic images per model for augmentation. While this was sufficient for controlled experiments, scaling to larger clinical datasets would require more extensive validation. Third, the use of a single modality (structural MRI) limits generalizability, incorporating multi-modal data could further improve performance.
Conclusions
This study demonstrated that Deep Convolutional Generative Adversarial Networks (DCGANs) can effectively enhance the early detection of AD from structural MRI scans through targeted data augmentation. By integrating high-quality synthetic images, particularly those generated by the Epoch 72 checkpoint generator, our CNN model achieved a notable improvement in classification accuracy and a sharper decision boundary between “Very Mild Dementia” and “No Dementia” stages. This distinction is clinically valuable, as accurate identification of early cognitive decline is essential for initiating timely interventions and optimizing patient care.
The results validate our hypothesis that GAN-based augmentation, when applied strategically and with appropriate quality control, can significantly improve the performance and generalizability of deep learning models in medical imaging tasks. While not all GAN-generated data yielded performance gains—highlighting the importance of selective checkpoint use—the approach proved beneficial when carefully managed. This work contributes to the growing evidence supporting generative models as powerful tools for addressing class imbalance and feature sparsity in neuroimaging datasets. However, limitations remain, including reliance on a single imaging modality and the variable effectiveness of GAN checkpoints. Future research should explore the integration of multi-modal inputs (e.g., PET scans or clinical metadata), the use of advanced generative models such as Diffusion or StyleGANs, and real-time discriminator feedback to guide augmentation dynamically. Speculatively, such developments could lead to more personalized diagnostic tools capable of identifying cognitive decline even before over symptoms manifest, thus enabling proactive clinical strategies.