
R-NTN: a robust detection method for Ethereum phishing attacks based on multi-dimensional transaction features
- Published
- Accepted
- Received
- Academic Editor
- Vicente Alarcon-Aquino
- Subject Areas
- Cryptography, Security and Privacy, Cryptocurrency, Blockchain
- Keywords
- Ethereum, Phishing attack, Transaction, Network embedding
- Copyright
- © 2026 Ma et al.
- Licence
- This is an open access article distributed under the terms of the Creative Commons Attribution License, which permits unrestricted use, distribution, reproduction and adaptation in any medium and for any purpose provided that it is properly attributed. For attribution, the original author(s), title, publication source (PeerJ Computer Science) and either DOI or URL of the article must be cited.
- Cite this article
- 2026. R-NTN: a robust detection method for Ethereum phishing attacks based on multi-dimensional transaction features. PeerJ Computer Science 12:e3445 https://doi.org/10.7717/peerj-cs.3445
Abstract
Blockchain technology and cryptocurrencies have attracted significant attention in recent years, yet remain susceptible to cyber threats such as phishing attacks. Existing detection approaches often suffer from high computational costs and limited robustness, especially when facing varying data distributions and sparse structures. To address these issues, we propose Robust, Node behavior, Transaction structure, and Network (R-NTN), a detection framework for Ethereum phishing accounts that leverages multi-dimensional transaction features. R-NTN first constructs 2-hop ego graphs via random walks, then extracts features from three complementary dimensions: behavioral attributes, transaction-based structural features, and network embeddings. These features are integrated into a unified representation for downstream classification. Experiments show that R-NTN consistently outperforms baseline methods and maintains high accuracy across datasets of different scales and compositions, demonstrating strong robustness and generalizability.
Introduction
Blockchain technology, proposed by Satoshi Nakamoto in 2008, has garnered widespread attention due to its characteristics of decentralization, immutability, transparency, anonymity, security, and programmability (Nakamoto, 2008). Blockchain does not rely on any central authority or third-party trust; instead, it maintains a reliable database through a distributed ledger system, with all participants jointly maintaining the integrity of the database (Iansiti & Lakhani, 2017). It serves as the technological foundation for a variety of cryptocurrencies.
Ethereum is one of the largest cryptocurrency platforms built on blockchain technology. According to data released on the DeFi Llama website as of October 4, 2024, Ethereum’s market value is approximately $316.307 billion, with daily transaction counts reaching 12.3 million. However, phishing attacks targeting Ethereum pose a significant risk of economic losses. Within Ethereum, phishing differs from traditional financial fraud, typically involving lower costs, broader reach, and larger sums of money (Lin et al., 2023). For instance, as disclosed by Bitrace, a phishing incident in June 2024 led to a victim being defrauded of over $200,000 worth of Ether and Ethereum staking vouchers (Chen et al., 2020a). These phishing scams have caused enormous economic losses and have become a primary threat to the security of Ethereum transactions. Therefore, detecting phishing accounts is urgently needed to ensure the healthy development of Ethereum (Trozze et al., 2022; Anita & Vijayalakshmi, 2019). However, the anonymity of blockchain poses an obstacle to the detection of phishing accounts. Registration of Ethereum accounts generally does not require identity verification, providing phishing attackers with the opportunity to create and control numerous phishing accounts for fraudulent activities. Fortunately, Ethereum’s transaction records are public, allowing us to identify phishing accounts by analyzing the patterns in their transactions through Ethereum’s transaction data.
Identifying phishing accounts on Ethereum is currently a research hotspot. Some scholars detected phishing accounts based on traditional machine learning methods (Zhao, 2023), but this requires manual feature selection, which heavily relies on the researcher’s experience and may neglect the topological characteristics of accounts due to the independence between accounts (Farrugia, Ellul & Azzopardi, 2020). Other scholars have implemented detection using graph embedding methods (Chen et al., 2020c; Wang et al., 2022; Chen et al., 2020b; Xia, Liu & Wu, 2022), where these methods often model Ethereum transaction data as a directed graph, with accounts as nodes and transactions as directed edges. Then, graph embedding techniques are used to obtain embedding values for each node as features, and finally, downstream classifiers are used for classification. However, these methods do not consider the transaction behavior patterns of nodes, which can easily lead to the loss of important information. There are also scholars using graph neural networks (GNNs) methods (Sun et al., 2024; Liu et al., 2024), which also model Ethereum transactions as the input of neural networks. The GNN-based methods can achieve high classification performance, but the issue of extreme data imbalance makes these methods lack sufficient robustness. The number of accounts in the Ethereum transaction network is very large, while the number of ground truth labeled phishing nodes is very limited and widely distributed, making it difficult to construct a complete strongly connected graph that includes all phishing nodes, and it is also challenging to maintain a reasonable ratio of normal accounts to phishing accounts.
To address the aforementioned challenges, we propose Robust, Node behavior, Transaction structure, and Network (R-NTN; the source code of R-NTN has been released at: https://github.com/AuroraBorealis222/R-NTN.), a robust phishing accounts detection framework. Based on Ethereum transaction data, R-NTN constructs a 2-hop ego graph through random walks. It then uses a combination of traditional machine learning and graph embedding methods to build features and hand them over to downstream classifiers for phishing account identification. Specifically, we organize features from three dimensions: node behavior features, graph-based transaction features, and network features. The node behavior features and graph-based transaction features are extracted using prior knowledge, while the network features are obtained through graph embedding methods. By concatenating these features, we obtain features that can capture global information, and finally use downstream classifiers for identification. R-NTN can effectively utilize information from different dimensions in Ethereum transaction data, thereby overcoming the problem of data sample imbalance and enhancing the robustness of the detection model. Additionally, the design of global features also compensates for the shortcomings of traditional machine learning in capturing high-order information.
The main contributions of this article are summarized as follows:
Based on the characteristics of Ethereum transaction data, we extract features from three distinct dimensions, node behavior, transaction patterns, and network structure, thereby constructing more comprehensive node features.
We have designed a series of biased random walk strategies for feature augmentation, which can effectively circumvent the camouflage behavior of phishing nodes and uncover deep hidden information within transaction data.
We have conducted experimental validation on public Ethereum transaction data. The results demonstrate that our method outperforms baseline methods as well as state-of-the-art (SOTA) methods. Additionally, we performed experiments on small-scale datasets to evaluate robustness, and the results indicate that our method exhibits the best robustness among similar methods.
In the next section, we review the latest research advancements related to Ethereum phishing detection. ‘Research Preparations’ outlines the preparatory work for this study, while ‘Proposed Framework’ presents the framework of R-NTN, detailing specific metrics and algorithms. ‘Experiments’ describes the experimental process and the corresponding results. Finally, ‘Conclusion and Future Work’ concludes this article and discusses directions for future work.
Related work
Traditional machine learning-based methods
Traditional machine learning-based detection methods primarily identify Ethereum phishing accounts by extracting relevant features and applying downstream machine learning classifiers. Farrugia, Ellul & Azzopardi (2020) extracted 42 account features from collected transaction data and applied eXtreme Gradient Boosting (XGBoost) for classification. Using the XGBoost model, the authors assessed the most important features for distinguishing between normal and fraudulent accounts, such as the total duration of account usage, the average minimum amount of Ether sent, and the account balance. Bian et al. (2020) constructed features in two parts: one based on manually summarized features from transaction history, and the other consisting of statistical features generated with the automated feature construction tool Featuretools. They then applied various classifiers, including K-Nearest Neighbors (KNN), Logistic Regression (LR), Support Vector Machine (SVM), Random Forest (RF), Adaptive Boosting (AdaBoost), and Light Gradient Boosting (LightGBM) to detect fraudulent Ethereum accounts. Ibrahim, Elian & Ababneh (2021) used a feature selection protocol to highlight the most important features, ultimately obtaining a dataset with 26 features. They then applied three classification models—XGBoost, SVM, and logistic regression—to identify phishing nodes. Despite these methods achieving certain results, they fail to capture the full range of potential features within the Ethereum transaction network.
Graph embedding-based methods
The primary objective of graph embedding is to transform nodes in a graph into low-dimensional vector representations, thereby enabling the execution of downstream tasks. Common methods for graph embedding include matrix factorization, random walks, and deep learning techniques. On the Ethereum platform, random walks and deep learning methods are most frequently used for node embedding. Wu et al. (2020) conducted biased random walks based on transaction information, such as transaction amounts, timestamps, and their combinations. They then employed the Skip-gram model to learn node embeddings and used an SVM classifier for the downstream identification task. In Wang et al.’s (2022) work, embeddings for nodes, edges, and attributes were learned based on walk sequences, which proved particularly effective for heterogeneous networks. In contrast to graph embedding methods based on random walks, deep learning-based graph embeddings do not require walks; instead, they use deep learning techniques to directly learn embeddings. Chen et al. (2020b) proposed a detection method based on graph convolutional networks (GCN) and autoencoders. Specifically, the GCN acts as an encoder, and its output is used as a decoder to approximate the adjacency matrix, thereby generating node embeddings. These embeddings are then concatenated with the original node features for classification. Xia, Liu & Wu (2022) proposed an attribute-based ego graph embedding framework to detect phishing accounts on Ethereum by integrating both structural and attribute characteristics of Ethereum transaction records.
Graph neural networks-based methods
GNNs first compute the node features in the transaction graph and then input these features directly into the GNN for model training. Once the model is trained, it outputs the predicted results for the nodes. Sun et al. (2024) proposed the Attention-Based Graph Representation Learning (ABGRL) method, which utilizes multi-channel feature extraction for nodes and integrates these features through an adaptive attention mechanism, focusing on the most relevant information for the task. It also employs a self-supervised regression model to enhance the feature representation of nodes with low degrees, addressing the long-tail distribution problem and improving the accuracy of phishing account detection. Huang et al. (2024) proposed a novel framework called PEAE-GNN, which introduces a feature enhancement strategy based on structural features, transaction features, and interaction strength, to learn ego-graph representations through GNNs. Additionally, they proposed a graph-level representation method that sorts the updated node features in descending order and averages the top- node features, thereby preserving key information while minimizing noise. Liu et al. (2024) introduced a heterogeneous GNN method based on neighbor relationship filtering, which uses random walks and reinforcement learning to assess the similarity between Ethereum transaction accounts and select the best neighbor nodes. By aggregating internal and external relationships to represent neighborhood connections and introducing an initial residual in the cross-relationship aggregation to prevent overfitting, this approach ensures the suitability of the neighbor aggregation process for deeper GNN architectures.
In addition to adaptive and heterogeneous GNN models, Jin & Yang (2024) explored phishing detection in Ethereum smart contracts by constructing a contract-level transaction graph. They applied Synthetic Minority Oversampling Technique–Edited Nearest Neighbors (SMOTE-ENN) to handle class imbalance and compared various backbone models, including Multi-Layer Perceptron (MLP) and GCN. Their results reveal that, under specific contract-level transaction structures, simpler models like MLP can surpass GCN in both efficiency and scalability, offering valuable insights into model selection for fraud detection in contract-based environments. Furthermore, Chang et al. (2024b) introduced an improved GAT-based model for detecting anomalous nodes in blockchain graphs. By integrating subtree-level attention and a bagging-stacking ensemble framework, their approach effectively captures multi-hop neighborhood dependencies and enhances detection robustness, especially under noisy or sparse transaction conditions.
Recently, contrastive learning has also been introduced into Ethereum fraud detection to enhance representation quality under limited supervision. Jin, Wang & Li (2024) proposed Meta-IFD, a generative-and-contrastive self-supervised learning framework that captures latent behavioral semantics by aligning node representations across multiple interaction views. The method leverages contrastive loss to distinguish phishing accounts from normal ones by maximizing mutual information between consistent node views while minimizing similarity with unrelated samples. Experimental results demonstrate that incorporating contrastive objectives significantly improves detection performance, especially under imbalanced or noisy data conditions.
Research preparations
Data acquisition
We utilized the blockchain dataset published on the XBlock (Data is available at https://xblock.pro/#/dataset/13.). Website and curated it throughout the research process. We refer to the dataset construction method proposed in literature (Xiang et al., 2023). However, unlike a completely random approach, we aim to capture more nodes that have strong relationships with the source node. Specifically, we assume that nodes with higher transaction volumes with the source node are more closely related. Given a weighted transaction graph as input (where represents the transaction amount on each edge), we generate the target subgraph using an improved weighted random walk strategy.
-
1.
Designing a probability-based sampling mechanism based on transaction amount proportions, where the probability of selecting node given node is defined as: (1) The summation in the denominator runs over all nodes in the set .
-
2.
Introducing a bidirectional edge-weight merging operator to ensure graph symmetry, formulated as: (2)
-
3.
Implementing a progressive neighborhood expansion under a dynamic path exclusion constraint.
The algorithm controls the maximum number of sampled nodes using parameter K and limits the walk depth with . The final output is a refined subgraph that contains the source node and its highly weighted transaction-related nodes, providing a high-value subgraph construction method for phishing node detection. The detailed procedure is illustrated in Algorithm 1.
| Input: Weighted transaction graph where , source nodes , max nodes , hop threshold |
| Output: Pruned k-hop subgraph |
| 1: procedure PruneGraph ( ) |
| 2: merges edge weights |
| 3: Global neighborhood set |
| 4: For each do |
| 5: Local accumulator |
| 6: while do |
| 7: Amount-proportional sampling |
| 8: Weighted walk path |
| 9: for to k do |
| 10: |
| 11: |
| 12: Propagate weighted walk |
| 13: end for |
| 14: |
| 15: end while |
| 16: |
| 17: end for |
| 18: |
| 19: |
| 20: return |
| 21: end procedure |
Ethereum’s transaction structure
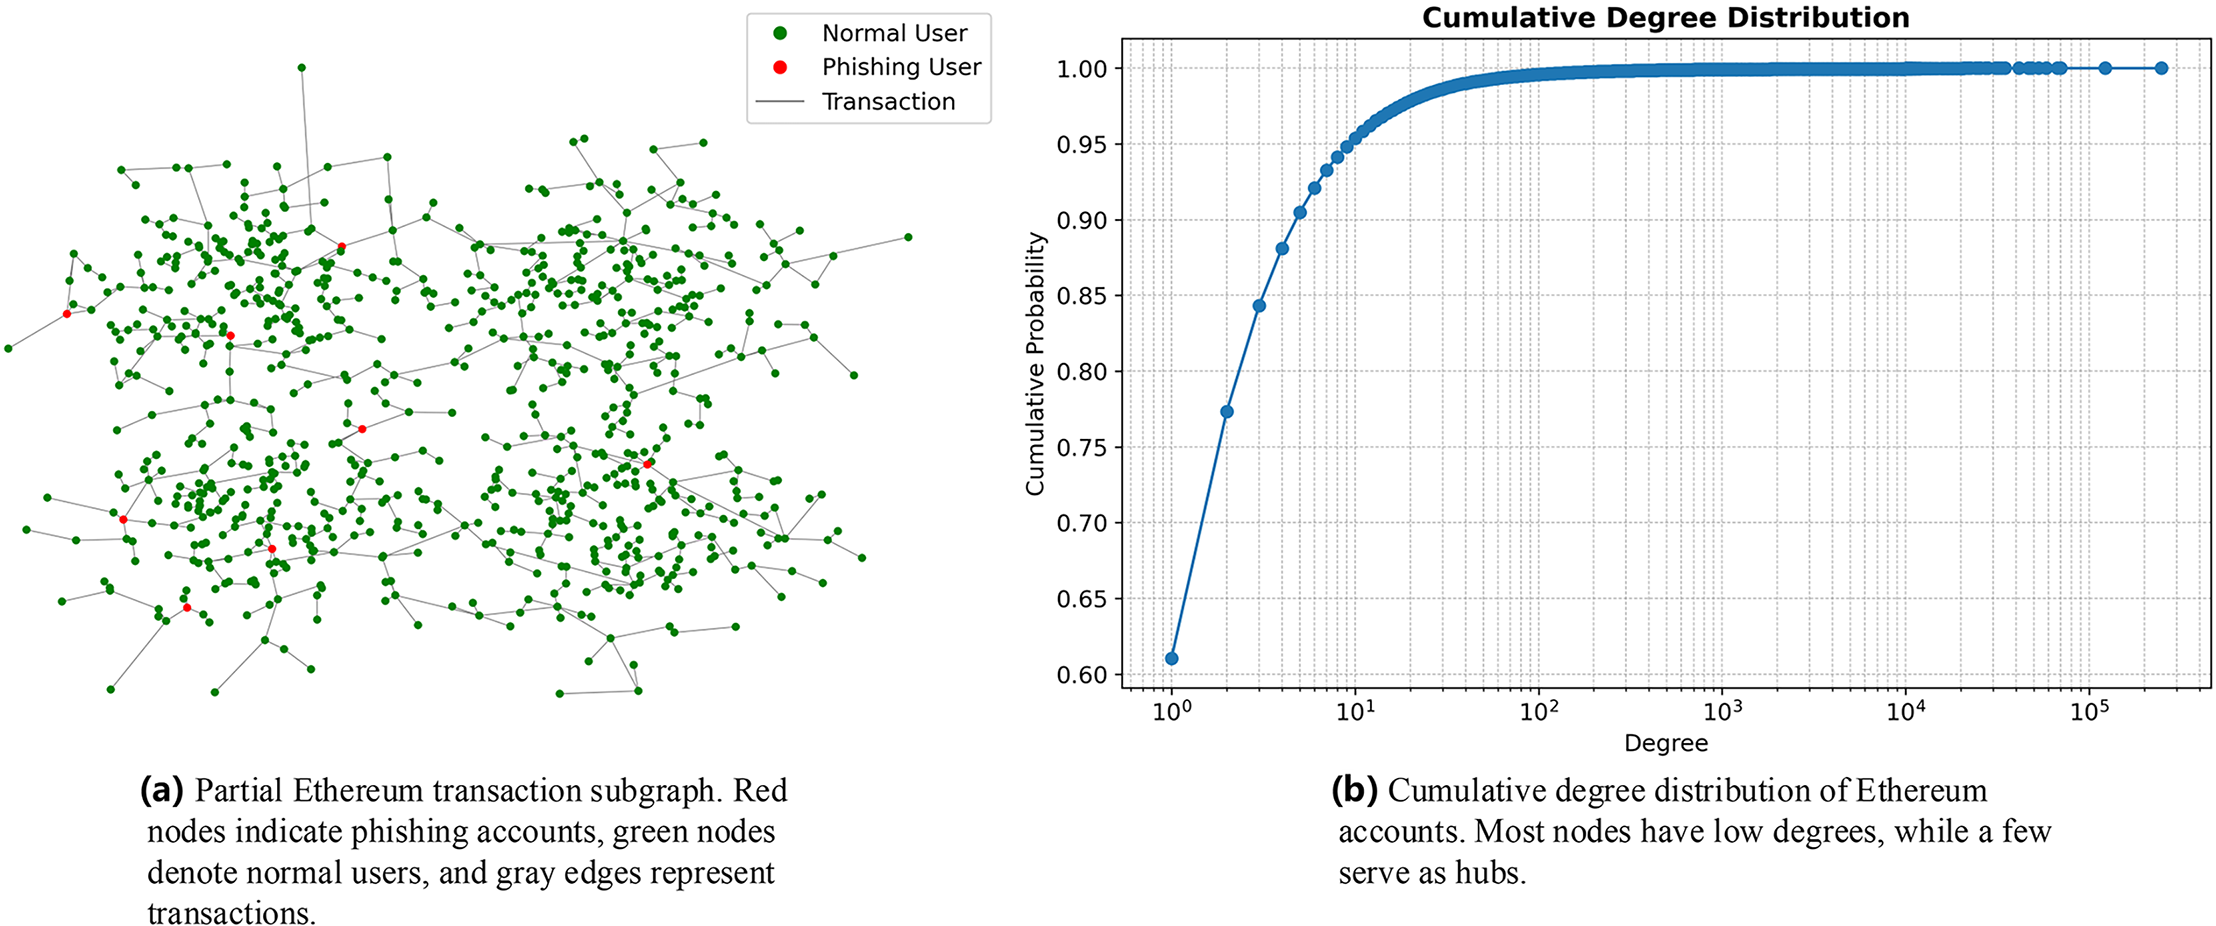
We visualized a subset of Ethereum’s transactions and nodes, where red nodes represent phishing nodes and green nodes represent normal nodes, as shown in Fig. 1A. The distribution of nodes in Ethereum exhibits the following characteristics: First, the network contains a large number of nodes, with low-degree nodes constituting 90% of the total, as illustrated in Fig. 1B. Most of these low-degree nodes tend to connect with high-degree nodes. Second, the number of ground-truth phishing nodes is significantly smaller than that of normal nodes, resulting in a highly imbalanced sample ratio of 1:2576.5. Finally, Ethereum transactions display community-like structures, where most nodes tend to connect with other nodes within the same community.
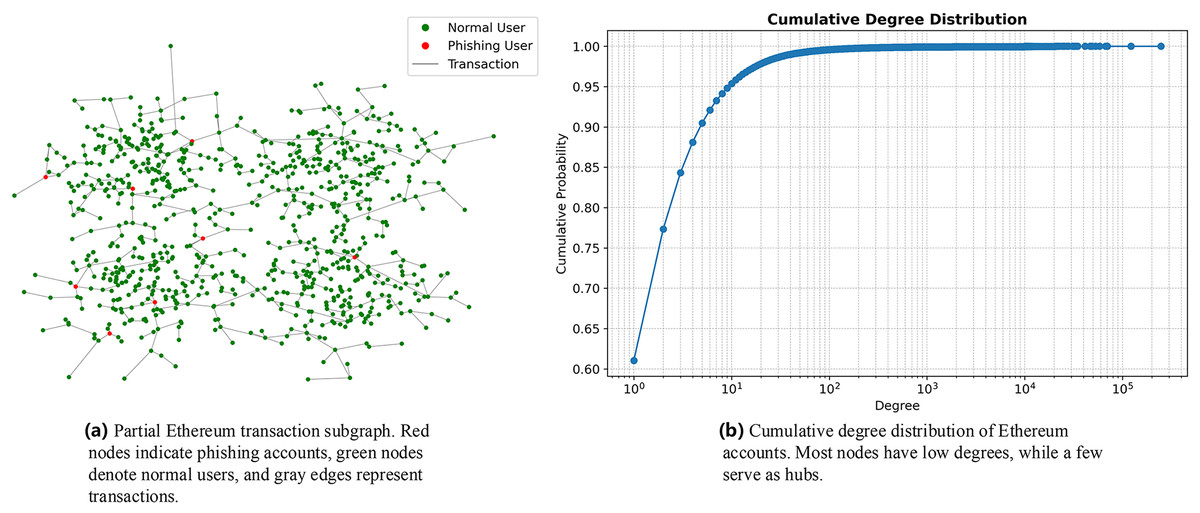
Figure 1: (A) Partial Ethereum transaction subgraph. (B) Cumulative degree distribution of Ethereum accounts. Most nodes have low degrees, while a few serve as hubs.
Formal definition
Building on the directed transaction network and the distribution characteristics of Ethereum nodes obtained in ‘Data Acquisition’, we formally define the problem. The identification of phishing accounts can be viewed as a fully supervised node classification task. We represent the transaction network as , where V is the set of nodes in the transaction network, i.e., the set of account addresses within the network, and E is the set of directed edges representing transactions. Each directed edge signifies a transaction from the source node, the initiator of the transaction, to the target node, the recipient of the transaction. In our study, is defined as a set of ordered pairs , where is the node’s address and is the label of the node with . The label 0 indicates a normal node, while the label 1 indicates a phishing node, which is the positive example we aim to identify. is defined as a quadruple , where represents the initiating node of the transaction, represents the destination node, denotes the amount of the transaction, and denotes the timestamp of the transaction.
In the context of Ethereum phishing detection, anomalies are defined as accounts whose transactional behaviors and network structures significantly deviate from those of legitimate users. These anomalies typically exhibit suspicious patterns such as abnormally high transaction frequency, disproportionate incoming and outgoing fund flows, or frequent interactions with newly created or blacklisted addresses. In this work, we focus on point anomalies, where individual accounts demonstrate behavior that is statistically irregular in comparison to the majority of accounts. This includes accounts that act as hubs in short timeframes, or those forming peculiar structures in the transaction graph. Unlike collective or contextual anomalies, which require modeling group behavior or external conditions, point anomalies are more prevalent and practical in Ethereum fraud detection scenarios.
Our proposed method primarily focuses on feature engineering to capture more comprehensive information. We divide the feature construction process into three components, Node Behavior Features , Graph-based Transaction Features , and Network Features . These three feature sets are normalized and concatenated into a feature matrix where represents the total dimensionality, which is the sum of the dimensions of , , and features.
Proposed framework
In this section, we propose R-NTN, a robust framework for detecting Ethereum phishing accounts, which leverages multi-dimensional features. By integrating downstream classifiers, we achieve effective detection of phishing nodes while addressing the challenge of insufficient robustness in detection models when handling imbalanced datasets. The architecture of the proposed framework is illustrated in Fig. 2. First, we obtain on-chain real data from the Ethereum network and construct a dataset based on this data. Features are then extracted from three dimensions and subsequently normalized. Finally, the normalized features from all three dimensions are input into a classifier for classification.
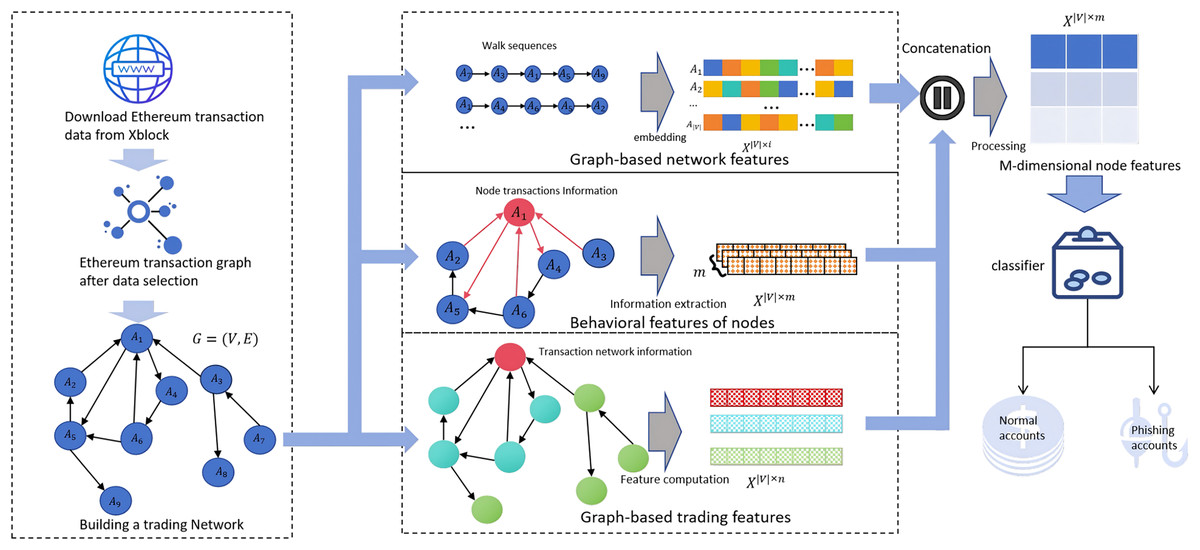
Figure 2: Overview of the R-NTN framework.
The dataset is constructed from the Ethereum transaction network. Features are extracted from three perspectives—behavioral, structural, and temporal—and then fused and fed into the detector for phishing account identification.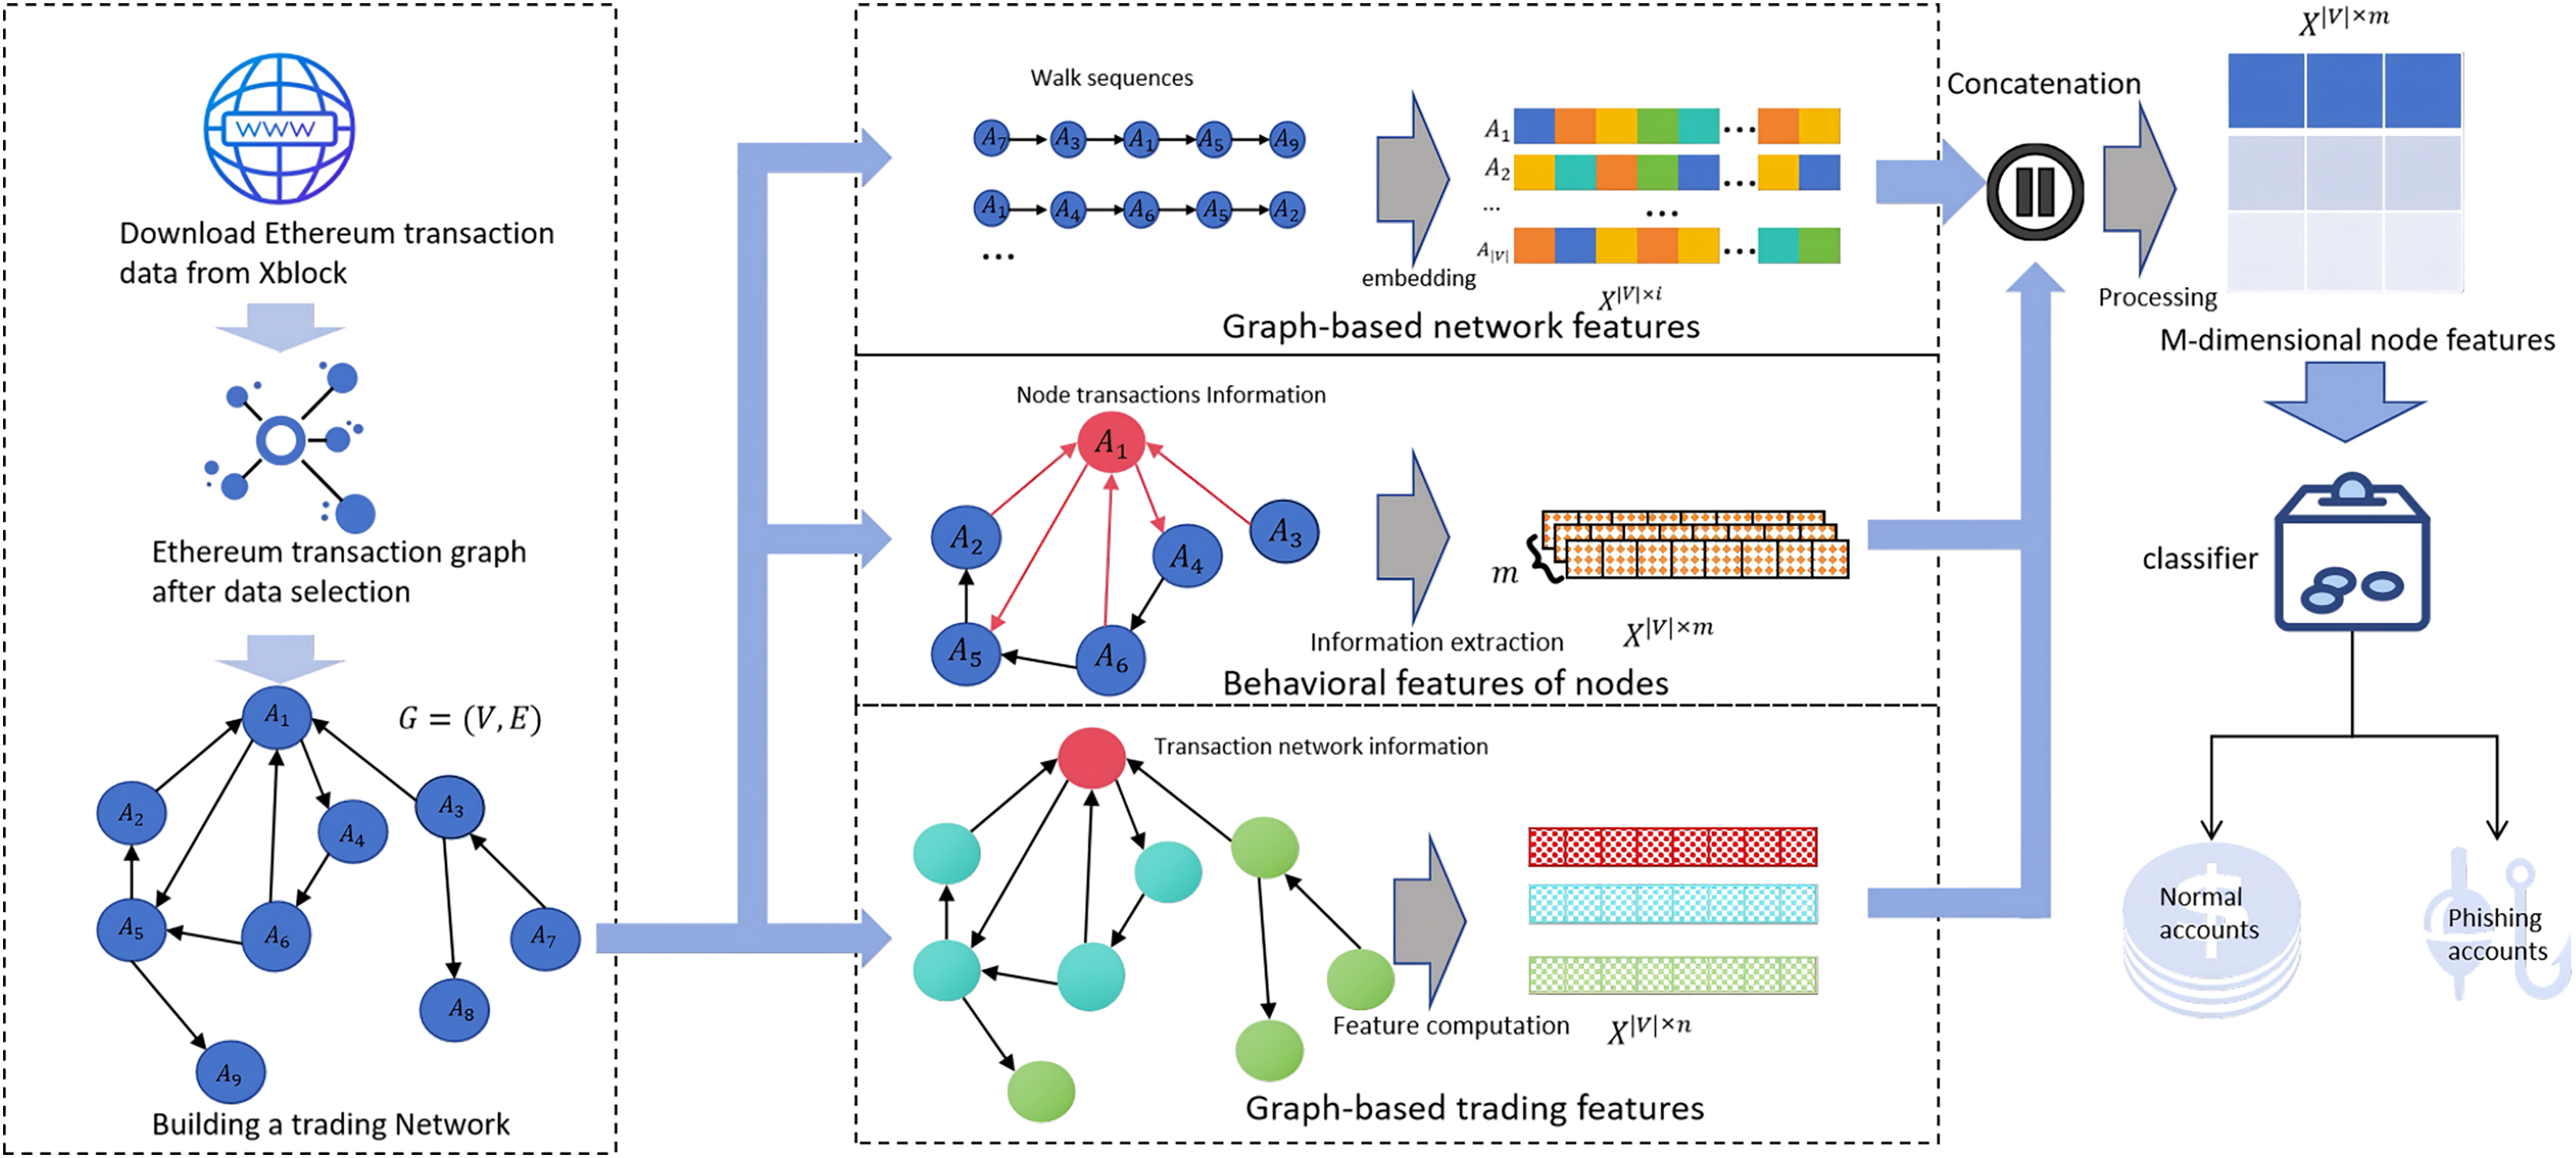
Node behavioral features
This section focuses on features that capture the transactional behavior of nodes. We define nine features, including out-degree, in-degree, total degree, total amount received, total amount sent, overall transaction volume, transaction frequency, frequency variability, and anomaly matching score.
Node degree. The degree of a node is a basic property in graph theory. The out-degree denotes how many times the node sends ether to others, while the in-degree indicates how many times it receives ether. The total degree represents the total number of transactions involving the node. These are formally defined as:
(3)
(4)
Node transaction amounts. Transaction amounts are vital features that reflect fund flows and activity levels on the Ethereum network. The total transaction amount refers to the sum of all transactions associated with a node. The incoming transaction amount captures the total value of ether received by the node, while the outgoing transaction amount denotes the total value sent. These metrics help reveal economic behavior, detect potential phishing activity, and analyze fund movement patterns. Their formal definitions are as follows:
(5)
(6)
In the formula, represents the amount associated with the edge , where denotes the directed transaction between nodes and . The condition indicates that is either the source node or the target node .
Node transaction features. We extract three transaction-based features for each node: transaction frequency, frequency variability, and anomaly matching degree. Transaction frequency measures the ratio between the number of transactions and the active duration of the node. It serves as a key indicator of abnormal behavior. For example, phishing nodes may initiate numerous transactions within a short period to increase their visibility and deceive other users. Transaction frequency variability captures fluctuations in transaction activity over time. A high variability suggests inconsistent behavior, such as sudden spikes in transaction volume or connections to many new nodes, which may indicate malicious intent. While high transaction volume and large amounts often suggest normal activity, phishing nodes may instead issue many small-value transactions to avoid detection. To identify such anomalies, we define the anomaly matching degree as a value between 0 and 1, representing the consistency between transaction amount and count. This feature helps distinguish phishing nodes that exhibit unusual transaction patterns. The formal definitions of transaction frequency , frequency variability , and anomaly matching score are as follows:
(7)
In this formula, and represent the timestamps of the last and first transactions of node in the dataset, respectively. denotes the total degree of the node.
(8)
In this formula, quantifies the variability of transaction frequency for node . Here, refers to the time interval between the -th and -th transactions, which represents the time difference between two consecutive transactions. indicates the average value of all transaction intervals, while represents the number of transaction intervals for the node.
(9)
In this context, represents the total transaction amount associated with a given node , while denotes the degree of the node, which is defined as the total number of transactions the node has participated in.
After completing the above steps, we construct the feature matrix , which captures the transactional behavior of each node. Here, |N| denotes the number of nodes, and is the number of behavioral features. We then apply min-max normalization to scale all feature values to a consistent range. Finally, this feature matrix is concatenated with additional feature sets to support the analysis of more complex behavior patterns, providing a strong foundation for downstream tasks.
Graph-based transaction features
Graph-based transaction network features capture complex interactions and structural patterns in transaction networks. These features reveal node connectivity, transaction distribution, and potential community structures. We categorize them into six groups: subgraph features, Pearson correlation coefficients, betweenness centrality, closeness centrality, PageRank scores, and graph density.
Subgraph features. Ethereum transaction networks are often imbalanced. To handle this, we preprocess by constructing subgraphs. Since phishing nodes may be spatially distant—possibly linked to different organizations or deliberately avoiding direct connections—strongly connected graphs are difficult to form. Thus, multiple subgraphs naturally exist. To understand their importance, relationships, and transaction behavior, we analyze specific subgraph metrics. These include average and standard deviation of in-degree, out-degree, and total degree, as well as maximum degrees for each subgraph. Given a subgraph S with node set and edge set , for any node , the following definitions apply:
(10) where , , and are the average in-degree, out-degree, and total degree of nodes in subgraph S, respectively. Here, counts edges directed to node , counts edges originating from , and .
(11) where , , and measure the dispersion of node degrees in S. The terms , , and denote the average in-degree, out-degree, and total degree of all nodes in S. The denominator ensures unbiased estimation of the population standard deviation.
Let denote the set of nodes within the subgraph S. The notation represents the number of nodes in S. The maximum degrees , , and are defined as the highest in-degree, out-degree, and total degree observed among nodes in S, respectively.
Pearson correlation coefficient. We use the Pearson correlation coefficient to measure the linear relationship between a node’s degree and the degrees of its neighbors. A coefficient near 1 indicates a strong positive correlation, meaning high-degree nodes tend to connect to other high-degree nodes, suggesting clustering. A value near −1 shows a strong negative correlation, where high-degree nodes link to low-degree nodes, reflecting specific connection preferences. A value close to 0 implies no clear linear correlation, indicating more complex or random connection patterns. Small absolute values of may also signal nonlinear or stochastic network behaviors. The Pearson correlation coefficient is defined as follows:
(12) where represents the Pearson correlation coefficient. denotes the number of neighboring nodes. is the degree of the neighboring node . is the average degree of all neighboring nodes. refers to the degree of the current node (constant across all neighbors). is the average degree of the current node (a constant value). Notably, The term remains constant because the current node’s degree is uniform for all its neighbors.
Betweenness centrality. Betweenness centrality identifies nodes that occupy key positions in transaction pathways. A high value means the node plays a critical role in controlling the flow of information and funds. A low value indicates the node has a minor role and limited influence. We calculate betweenness centrality for each node using the following formula:
(13)
Here, represents the betweenness centrality of node . The term denotes the total number of shortest paths between nodes and , while represents the number of such paths that pass through node . The summation is performed over all node pairs , where neither nor is equal to .
Closeness centrality. Closeness centrality measures how central a node is by calculating the average shortest path length from the node to all others in the network. A smaller average distance means the node is more central and can spread information faster. A larger distance indicates the node is more peripheral. For a node , its closeness centrality is defined as:
(14)
Here, represents the total number of nodes in the network, denotes the length of the shortest path from node to node , and the summation is taken over all nodes where .
PageRank. PageRank evaluates the importance of nodes within a network. Originally developed by Larry Page for ranking web pages in Google’s search engine, it assigns higher importance to nodes with many or high-quality incoming links. A high PageRank means a node is influential, having more or stronger incoming connections. A low PageRank indicates less influence due to fewer or weaker links. In network analysis, PageRank captures both the quantity and quality of incoming links. In this study, we use PageRank to measure node significance in transaction networks. The PageRank for a node is defined as:
(15) where represents the PageRank value of node , denotes the total number of nodes in the network, and is the damping factor. The damping factor, in this context, reflects the probability that a random surfer will continue to follow the transaction path, indicating the persistence of fund flow and the level of transaction activity within the network. represents the set of nodes that link to node , while denotes the out-degree of node . The summation is performed over all nodes that point to .
Graph density. In the Ethereum transaction network, density reflects the degree of connectivity within the network. A high-density network indicates numerous transaction relationships among addresses, whereas a low-density network may suggest that transaction activities are more dispersed. The density of subnetworks is considered a feature to reveal the intensity of transaction relationships between nodes within the network. High-density subnetworks indicate frequent internal transactions and close connections between nodes, which help capture the importance of different subnetworks and the relationship between transaction volumes in subgraphs and phishing nodes. The density of a transaction subgraph is defined as follows:
(16) where is the number of edges in the subgraph, and is the number of nodes in the subgraph.
We extract the aforementioned features and apply min-max normalization to construct a feature matrix of size , where is a constant set to 14. These features not only capture the structural information of the network but also reveal dynamic relationships and behavioral patterns between nodes, thereby offering a valuable perspective for the model to comprehensively understand the network’s characteristics.
Graph-based network features
Although feature engineering can identify a large portion of phishing nodes, some malicious accounts in Ethereum transactions deliberately mimic legitimate user behavior to evade detection. These deceptive strategies pose significant challenges for traditional detection methods. Inspired by the work of Xiang et al. (2023), we propose a feature augmentation method based on a biased Skip-Gram model. This approach enables a deeper analysis of transaction patterns in the Ethereum transaction network, helping to uncover hidden structures and detect anomalous behavior.
In our method, transactions between Ethereum accounts and their neighbors are converted into random walk probabilities. These probabilities reflect variations in transaction amounts and timestamps. Specifically, a biased random walk is initiated from a randomly selected node in graph G, generating a sequence of nodes with a fixed length. The Skip-Gram model is then employed to learn low-dimensional vector representations for each node, resulting in a feature matrix . This process uses a gradient ascent algorithm to optimize the embedding parameter , thereby learning representations that maximize the co-occurrence probability between a node and its surrounding context nodes:
(17) where represents the embedding vector of node , denotes the conditional probability of node given , is the set of contextual nodes of .
The algorithm maps sequential node information into a vector space, ensuring that adjacent nodes in the original network remain geometrically close. This facilitates the understanding and prediction of transaction behaviors between nodes. Key hyperparameters are included. T: Controls the number of walks per node. L: Defines the length of generated node sequences.
Furthermore, we have designed two types of biased random walk strategies, one based on transaction amounts and the other based on timestamps.
Transaction-amount-based biased random walk. During the Ethereum transaction process, it is generally assumed that the larger the transaction amount, the stronger the connection between the two parties. To compute the probabilities for the random walk, we pre-calculate the transaction amounts associated with each node. The transition probability for the random walk is defined as follows:
(18) where represents the transaction volume from node to its neighbor , denotes the set of neighbor nodes of , and is the number of neighbors of .
If the total transaction volume for node is greater than zero, the transition probability to neighbor is proportional to relative to the total transaction volume across all neighbors of . Conversely, if the total transaction volume of is zero (i.e., no transactions occur), the transition probability is uniformly distributed among all neighbors. This process normalizes the transaction volumes among neighbors, ensuring that the sum of transition probabilities from node equals 1. This allows the random walk to explore the network with bias determined by the magnitude of transaction volumes.
Timestamp-based biased random walk. Similarly, it is generally believed that the later the timestamp, the closer the connection between two nodes. Suppose we have a current node and its set of all neighboring nodes . Each neighboring node has an associated timestamp for the last transaction with node . We define the probability of node transitioning to the next node as follows:
Similarly, it is commonly assumed that the more recent the timestamp, the stronger the connection between two nodes. Let us consider a current node and its set of neighboring nodes . Each neighboring node is associated with a timestamp , representing the time of the most recent transaction involving node and node . The transition probability , which defines the likelihood of transitioning from node to the next node , is given as follows:
(19)
(20)
Here, denotes the last transaction timestamp of node , and represents the last transaction timestamp between nodes and . The decay factor controls how temporal differences affect random walk probabilities. refers to the set of neighbors of node . The resulting probability reflects the recency of transactions, favoring nodes with more recent interactions. This time-aware strategy enables the random walk to capture dynamic and time-dependent patterns in the network.
To ensure feature consistency, we normalize the extracted features , , and . This normalization improves model efficiency and accuracy during training. The normalized features are then concatenated to form a unified feature matrix . This integration not only preserves feature relationships but also provides the classifier with a richer set of information, which is crucial for improving overall model performance.
Experiments
In this section, we present the experimental evaluation of our methodology, followed by a comparison, analysis, and discussion of the results in relation to relevant methods.
Dataset
We utilized the Ethereum phishing transaction network dataset provided by XBlock for our experiments. This dataset originally contains 2,973,489 nodes and 13,551,303 edges. Among these, 1,154 nodes are labeled as phishing accounts based on data collected from the Etherscan labeled cloud, while the rest are regarded as normal user accounts. To ensure computational efficiency while focusing on relevant structural information, we applied a 2-hop subgraph extraction centered on the labeled phishing nodes, following the network construction strategy described in the previous section. After filtering, the resulting subgraph consists of 69,227 nodes and 231,999 edges, preserving all 1,154 phishing nodes. Detailed statistics of the processed dataset are provided in Table 1.
| Account type | Nodes | Mean in-deg. | Avg. Out-deg. | Avg. Input amount | Avg. Output amount |
|---|---|---|---|---|---|
| Fishing account | 1,154 | 18.5363 | 5.48613 | 56.6362 | 39.3702 |
| Normal account | 68,073 | 3.0938 | 3.3150 | 49.6651 | 49.9578 |
Experimental setup
We evaluated the performance of the proposed method by comparing it with eight relevant approaches, including both classical and state-of-the-art techniques. Among these, Transaction to Vector (Trans2Vec) (Wu et al., 2020) is a classic node embedding model, while GCN (Kipf & Welling, 2017) and Graph Sample and Aggregate (GraphSAGE) (Hamilton, Ying & Leskovec, 2017) are traditional GNN-based models. GAT (Veličković et al., 2018), Graph Transformer (Graphormer) (Ying et al., 2021), Graph Attention Network Version 2 (GATv2) (Brody, Alon & Yahav, 2021), EGAT (Edge Aggregated Graph Attention Networks) (Wang, Chen & Chen, 2021), and Multi-level Graph Transformer (M-Graphormer) (Chang et al., 2024a) are state-of-the-art GNN models that incorporate attention mechanisms. The detailed descriptions of these methods are as follows:
Trans2Vec: A method for detecting Ethereum phishing nodes that simultaneously considers transaction timestamps and amounts for node embedding.
Graph Convolutional Network: Utilizes information from adjacent nodes in graph-structured data to learn node representations. GCN updates each node’s features by aggregating the features of neighboring nodes, thereby capturing complex relationships between nodes.
GraphSAGE: A graph neural network algorithm for generating node embeddings. It generates fixed-size embeddings for target nodes by sampling and aggregating the features of neighboring nodes, making it suitable for large-scale graph data. GraphSAGE can effectively embed any node in a graph, demonstrating good performance even in graphs with a large number of nodes.
GAT: Introduces an attention mechanism that dynamically assigns different weights to neighboring nodes. This enables GAT to more effectively aggregate information from neighboring nodes, improving the learning of node representations.
Graphormer: A graph neural network model based on the Transformer architecture, specifically designed for processing graph-structured data. It extends the self-attention mechanism to the graph domain, allowing the model to consider global dependencies when processing node representations. Graphormer captures complex graph patterns and long-range dependencies by effectively aggregating information from the entire graph, demonstrating excellent performance in various graph learning tasks.
GATv2: An improved version of the original GAT model, designed to enhance the flexibility and expressiveness of GNNs in node feature aggregation. It introduces a more powerful attention mechanism, allowing the model to consider richer contextual information when aggregating features from neighboring nodes, thereby improving the quality of node representations and overall model performance.
EGAT: Enhances the model’s capabilities by applying an attention mechanism to the edges of a graph, enabling dynamic adjustment of information flow based on the importance of different edges.
M-Graphormer: An enhanced version of the Graphormer model, designed for multi-channel graph transformers in node representation learning.
Hyperparameter settings
During the random walk phase, the parameters are configured as follows: Walk length: , Number of walks per node: ,Embedding dimension: . For the downstream classification task, an XGBoost (XGB) classifier is adopted with the following hyperparameters: Learning rate: , Number of estimators: , Maximum tree depth: .
To evaluate the classification performance, four metrics are used:
(21)
(22)
(23) where TP represents true positives (correctly predicted positive cases), FP represents false positives (incorrectly predicted positive cases), FN represents false negatives (incorrectly predicted negative cases), and TN represents true negatives (correctly predicted negative cases). The AUC (Area Under the Receiver Operating Characteristic (ROC) Curve) is approximated via numerical integration. A common implementation uses the trapezoidal rule to estimate the area under the ROC curve. Specifically, we have a sorted list of true positive rates (TPR) and false positive rates (FPR), and AUC can be approximated through the following steps:
-
1.
Plot pairs of false positive rate (FPR) and true positive rate (TPR) as points , where:
-
•
: FPR of the -th point,
-
•
: TPR of the -th point.
-
-
2.
Sort all points by their -values (FPR) in ascending order.
-
3.
Approximate the area under the curve using the trapezoidal rule. For each pair of adjacent points and , calculate the trapezoid area: (24) The total AUC is then the sum of all trapezoidal areas: (25) Area of the trapezoid between the -th and -th points.
Experimental results and analysis
Detection performance. In this subsection, we conduct a comprehensive evaluation and analysis of the model we proposed. Specifically, we employ classification methods to assess our model, with the results presented in Table 2 and Fig. 3.
| Method | Precision | Recall | F1-score | AUC |
|---|---|---|---|---|
| GCN | 0.6217 0.0300 | 0.7217 0.0250 | 0.6680 0.0280 | 0.6462 0.0350 |
| GraphSAGE | 0.7719 0.0200 | 0.9244 0.0150 | 0.8413 0.0180 | 0.8885 0.0200 |
| GAT | 0.6983 0.0220 | 0.9156 0.0180 | 0.7923 0.0210 | 0.8220 0.0250 |
| Trans2Vec | 0.7459 0.0280 | 0.6926 0.0300 | 0.7007 0.0250 | 0.6805 0.0350 |
| Graphormer | 0.7794 0.0170 | 0.9258 0.0130 | 0.8463 0.0150 | 0.9199 0.0180 |
| GATv2 | 0.7674 0.0190 | 0.9296 0.0120 | 0.8408 0.0160 | 0.8823 0.0220 |
| EGAT | 0.6977 0.0240 | 0.9233 0.0200 | 0.7985 0.0230 | 0.8440 0.0270 |
| M-Graphormer | 0.7805 0.0150 | 0.9161 0.0170 | 0.8533 0.0140 | 0.9159 0.0190 |
| Ours | 0.9152 0.0050 | 0.9412 0.0040 | 0.9237 0.0050 | 0.9618 0.0050 |
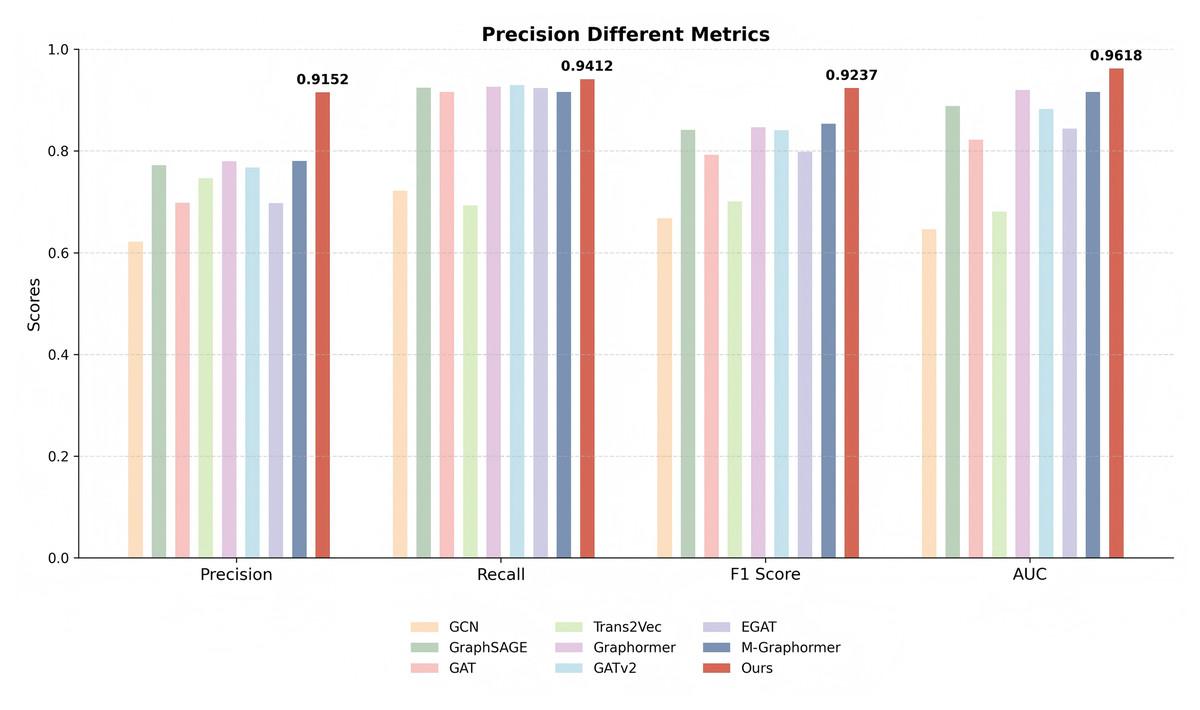
Figure 3: Comparison of precision, recall, F1-score, and AUC metrics across different models.
The proposed model consistently outperforms baselines, particularly in terms of F1 and AUC, indicating superior overall detection capability.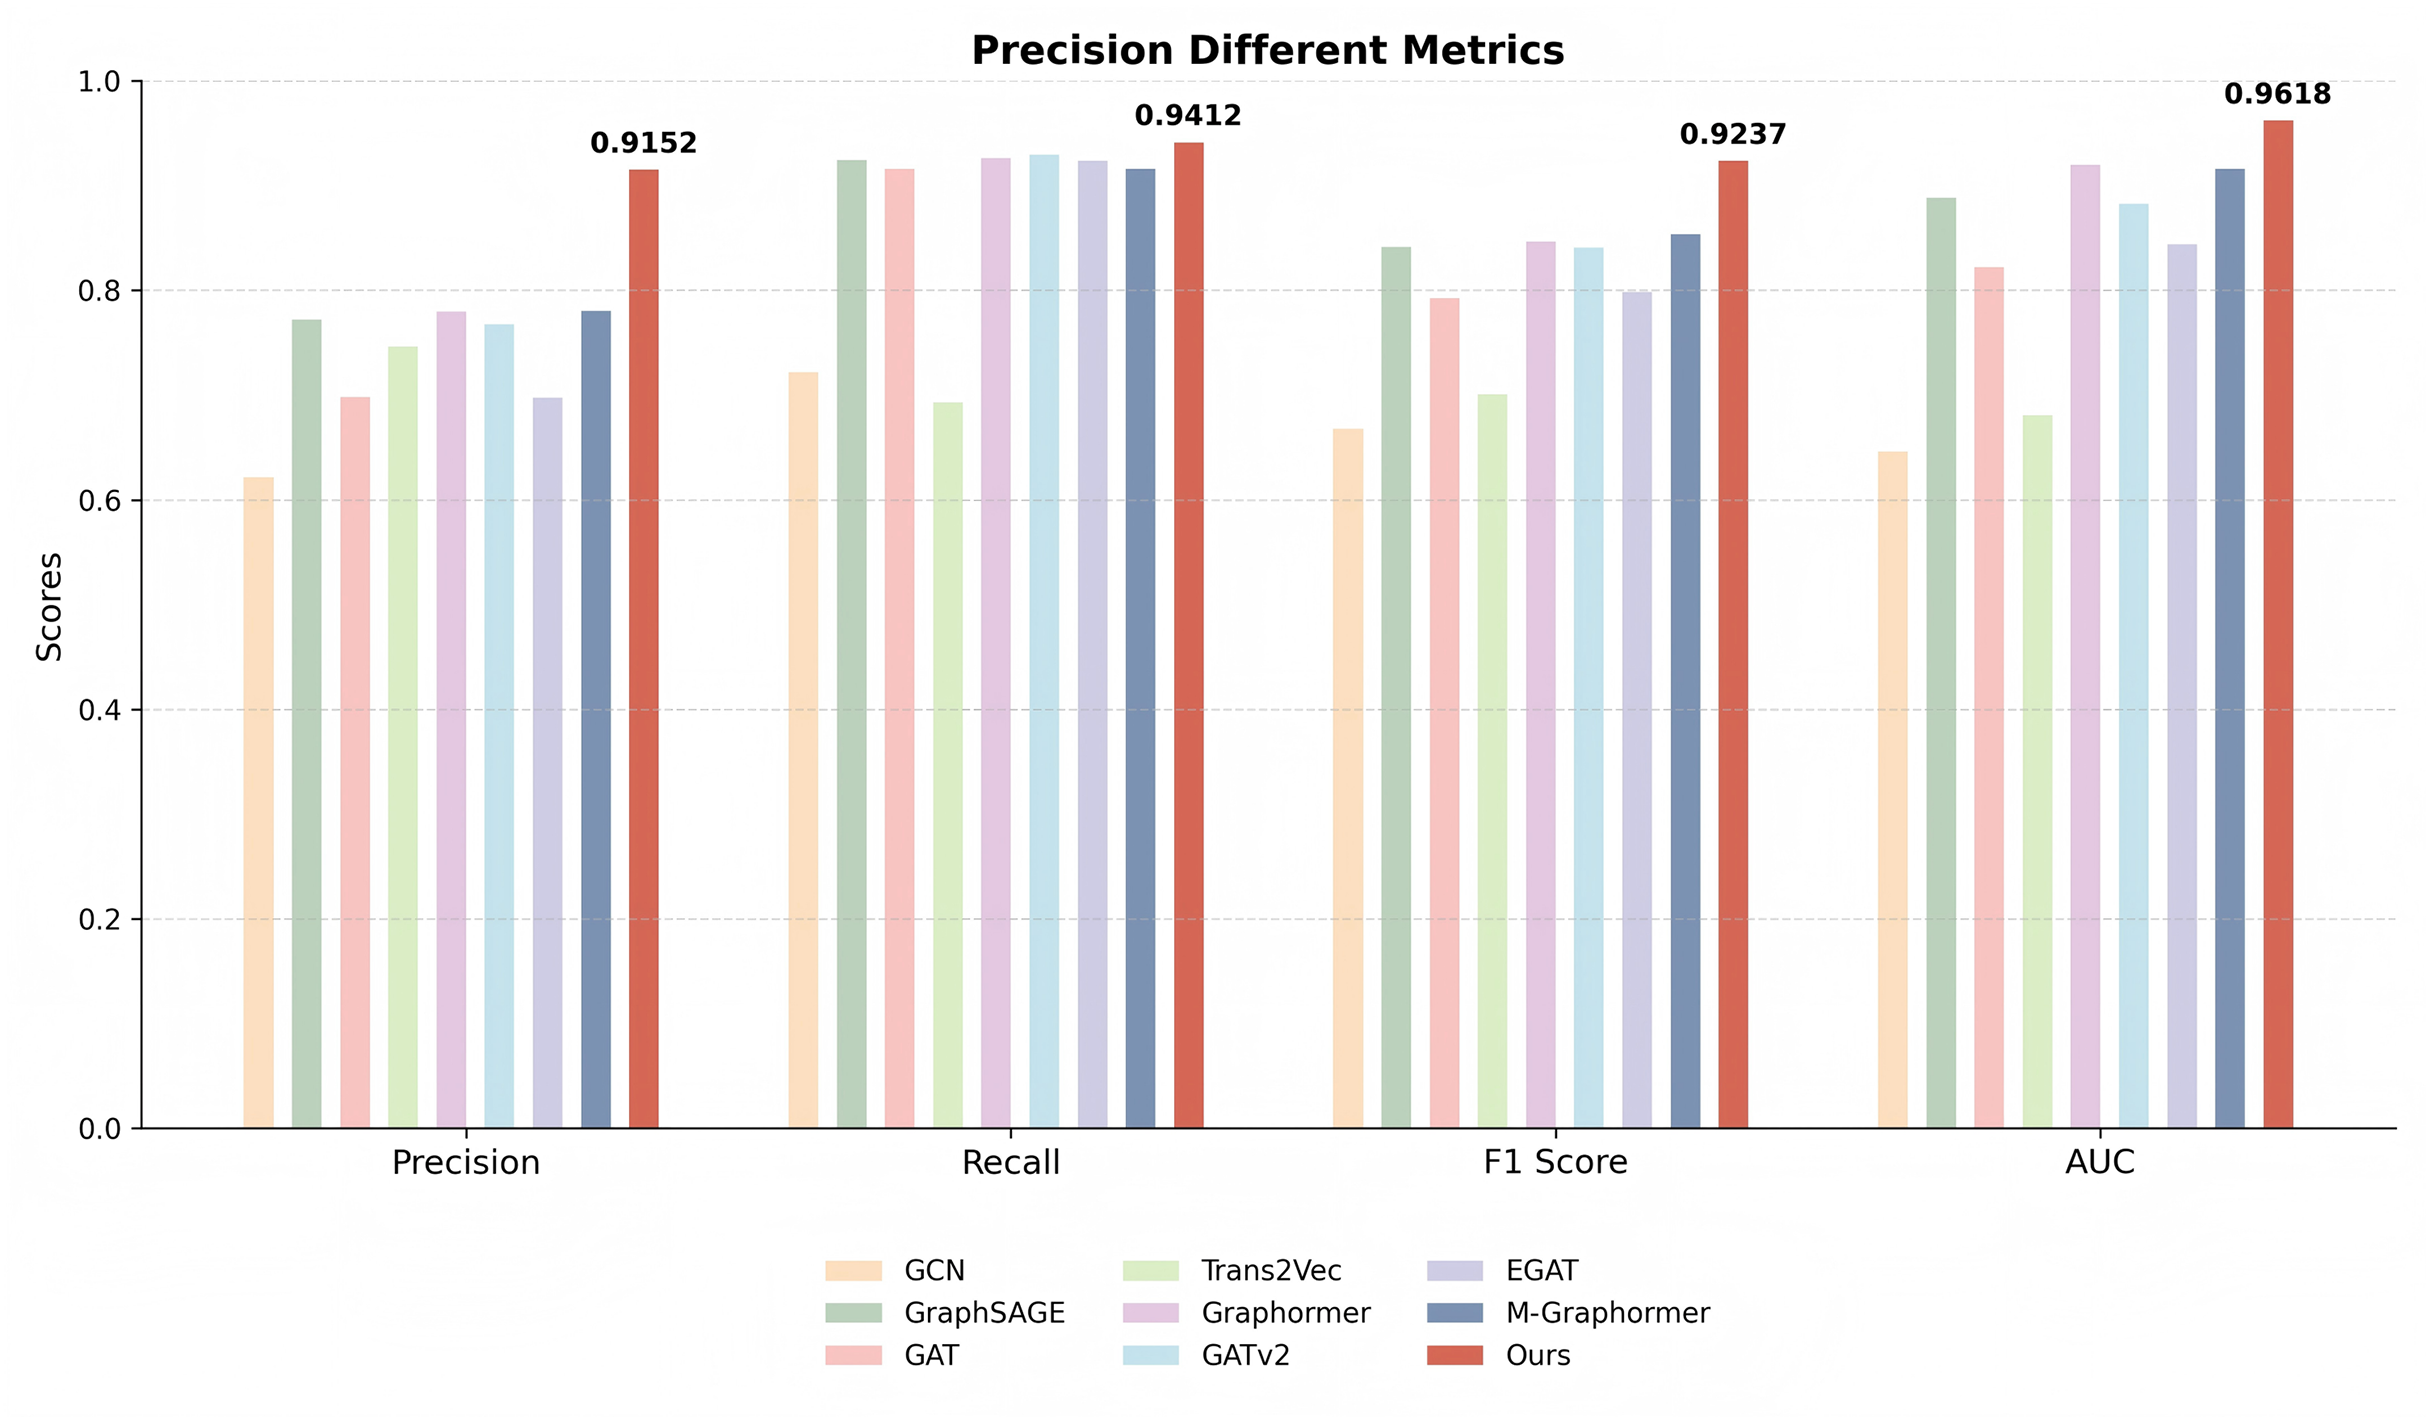
Our method demonstrates significant advantages in terms of precision, recall, F1-score, and AUC, outperforming the second-best method by 14.33%, 1.16%, 7.04%, and 4.19%, respectively. This is primarily attributed to our approach’s ability to capture comprehensive features, enabling not only effective identification of positive samples but also accurate detection of negative samples. Among all the comparison methods, GCN and Trans2Vec performed poorly. Specifically, GCN aggregates neighbor information by smoothing the adjacency matrix and node features. However, due to the complex interaction patterns between phishing accounts, GCN struggles to capture these intricate dependencies, thereby limiting its performance. On the other hand, Trans2Vec is a low-dimensional representation learning method that trains embedding vectors based on the similarity information of adjacent nodes. Although it considers transaction timestamps and amounts during the random walk process, it neglects behavioral information of nodes and graph-based trading features, extracting only local information. While GraphSAGE effectively handles large-scale graph data and supports inductive learning, it randomly samples neighbor nodes. This sampling strategy is effective for identifying phishing nodes but fails to capture sufficient information for normal nodes, as edge nodes often lack enough informative neighbors. Both GAT and GATv2 leverage attention mechanisms, but their performance is constrained due to the sparse distribution of phishing nodes and their significantly smaller proportion compared to normal nodes. Notably, GATv2 outperforms GAT, likely because its improved dynamic attention mechanism is more adept at capturing the complex information inherent in Ethereum transaction networks.
To further validate the robustness of our model, we conducted experiments using 60% and 30% of the total dataset to evaluate performance on smaller-scale datasets. The detailed numerical results are presented in Table 3, which summarizes precision, recall, F1-score, and AUC for all baseline models and our method (Ours). As shown in the table, reducing the dataset size generally results in performance degradation for most models, indicating sensitivity to data volume. Nevertheless, our model consistently achieves the highest values across all metrics, demonstrating superior generalization even with limited data.
| Method | 60% data | 30% data | ||||||
|---|---|---|---|---|---|---|---|---|
| Precision | Recall | F1-scores | AUC | Precision | Recall | F1-score | AUC | |
| GCN | 0.6095 0.0300 | 0.6195 0.0280 | 0.6572 0.0270 | 0.6377 0.0330 | 0.5902 0.0350 | 0.5333 0.0400 | 0.5604 0.0380 | 0.5582 0.0420 |
| GraphSAGE | 0.7317 0.0220 | 0.8117 0.0200 | 0.8014 0.0210 | 0.8114 0.0190 | 0.6667 0.0240 | 0.7452 0.0220 | 0.7040 0.0230 | 0.7865 0.0210 |
| GAT | 0.6411 0.0250 | 0.8066 0.0220 | 0.8126 0.0200 | 0.7611 0.0280 | 0.6001 0.0320 | 0.5577 0.0330 | 0.5782 0.0310 | 0.7483 0.0260 |
| Trans2Vec | 0.7497 0.0280 | 0.6697 0.0300 | 0.7072 0.0290 | 0.6705 0.0340 | 0.5699 0.0370 | 0.6412 0.0360 | 0.6032 0.0340 | 0.6061 0.0350 |
| Graphormer | 0.7662 0.0190 | 0.8522 0.0160 | 0.8176 0.0170 | 0.9014 0.0180 | 0.6921 0.0200 | 0.8049 0.0220 | 0.7446 0.0210 | 0.8930 0.0200 |
| GATv2 | 0.7148 0.0210 | 0.8848 0.0180 | 0.8482 0.0190 | 0.8548 0.0220 | 0.7057 0.0230 | 0.8365 0.0210 | 0.7660 0.0220 | 0.8111 0.0230 |
| EGAT | 0.6910 0.0250 | 0.8631 0.0220 | 0.7672 0.0230 | 0.8274 0.0240 | 0.6212 0.0280 | 0.7275 0.0260 | 0.6706 0.0270 | 0.7668 0.0250 |
| M-Graphormer | 0.7303 0.0200 | 0.8503 0.0180 | 0.8398 0.0170 | 0.8638 0.0190 | 0.7016 0.0220 | 0.7977 0.0200 | 0.7466 0.0210 | 0.8363 0.0190 |
| Ours | 0.9202 0.0050 | 0.9400 0.0040 | 0.9256 0.0050 | 0.9608 0.0050 | 0.9308 0.0060 | 0.9515 0.0050 | 0.9434 0.0050 | 0.9698 0.0040 |
To better illustrate these results, we also visualized the performance of each model using bar charts for each metric, as shown in Figs. 4 and 5. Each bar represents the performance of a specific model on the 60% or 30% dataset, and error bars indicate the standard deviation across repeated experiments, reflecting performance variability. The visualizations highlight that our model not only achieves the highest mean performance but also exhibits smaller error bars compared to other models, indicating strong stability and robustness under reduced dataset sizes.
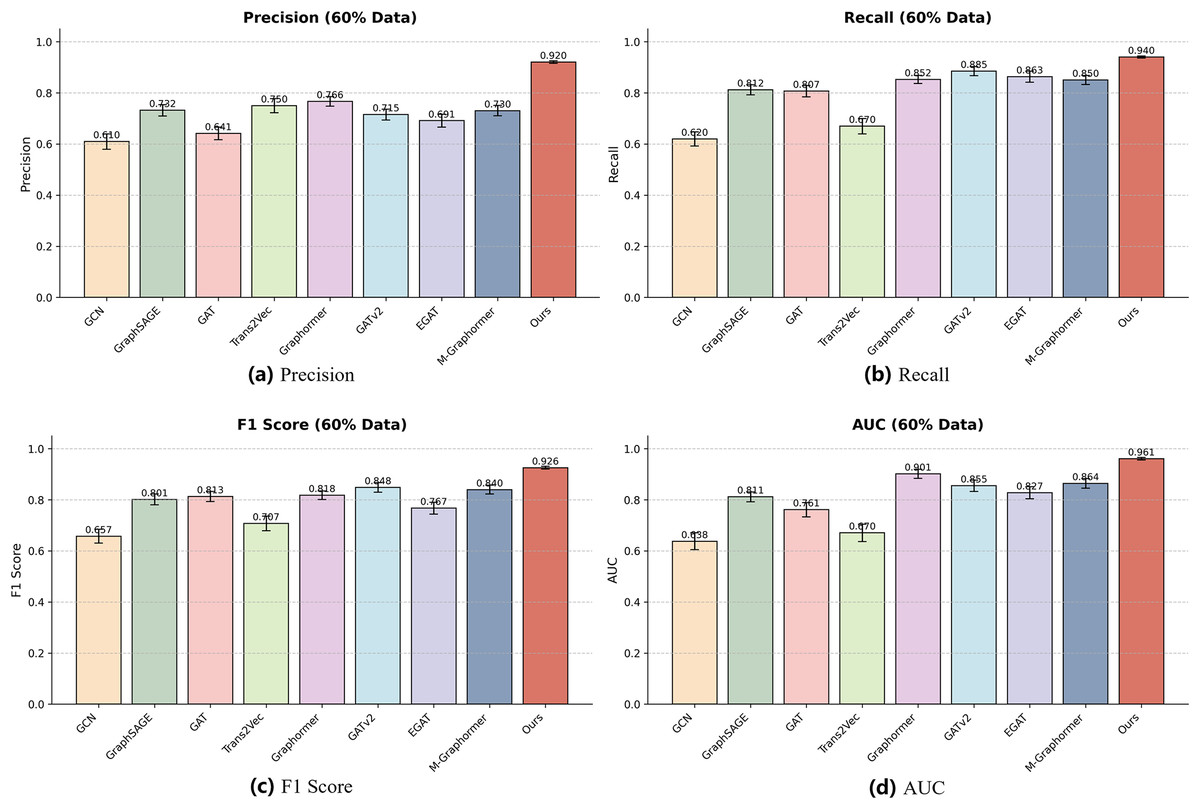
Figure 4: Performance of different models on the 60% dataset.
Each subfigure represents one evaluation metric: (A) Precision, (B) Recall, (C) F1-score, and (D) AUC. Our model achieves consistently superior results across all metrics on this subset.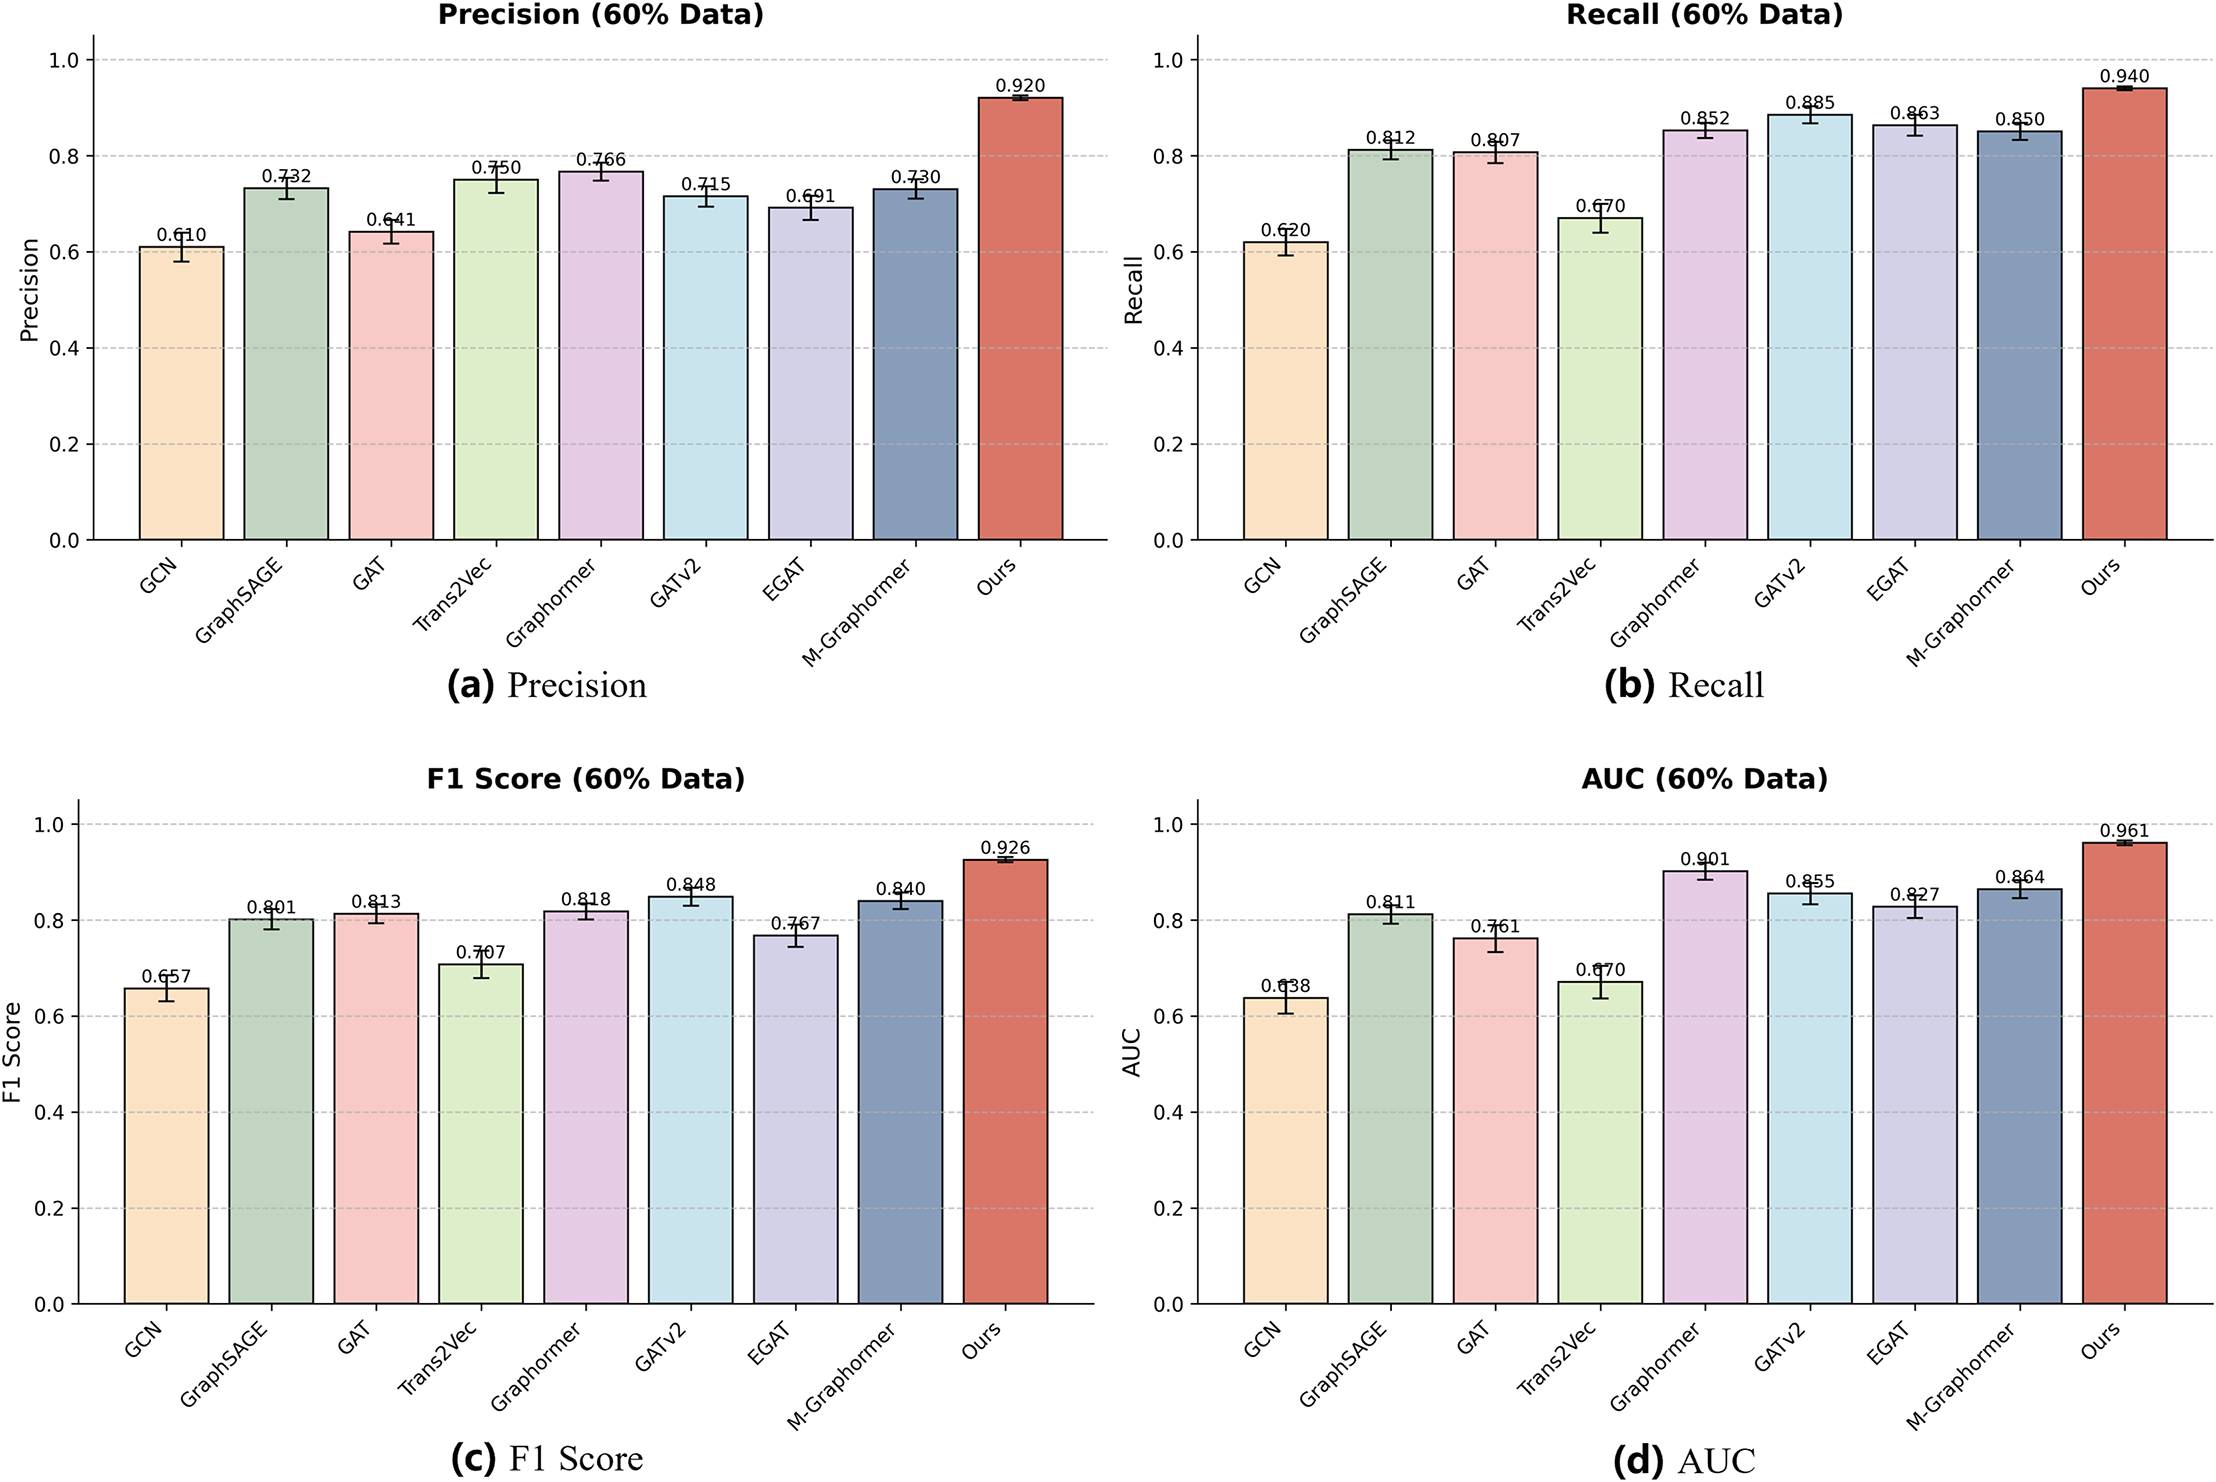
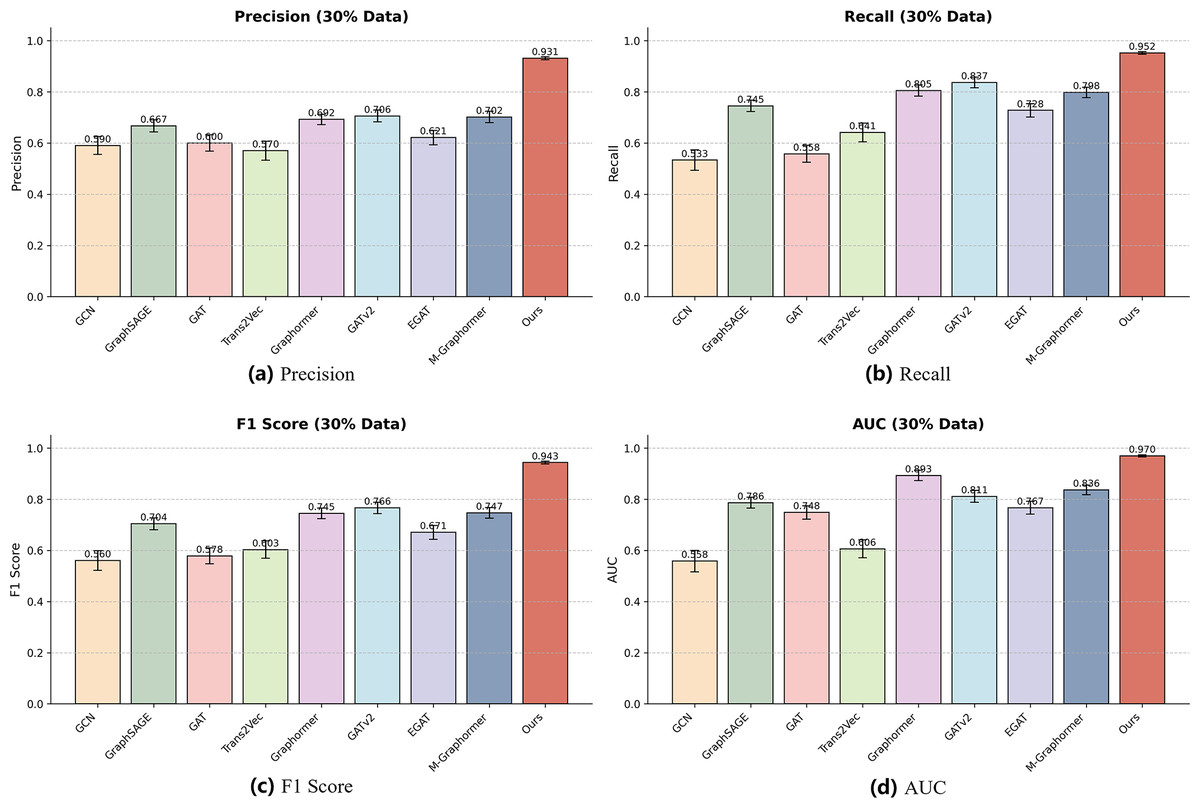
Figure 5: Performance of different models on the 30% dataset.
Each subfigure represents one evaluation metric: (A) Precision, (B) Recall, (C) F1-score, and (D) AUC. The results show that even with limited training data, our model maintains robust and accurate performance across all metrics.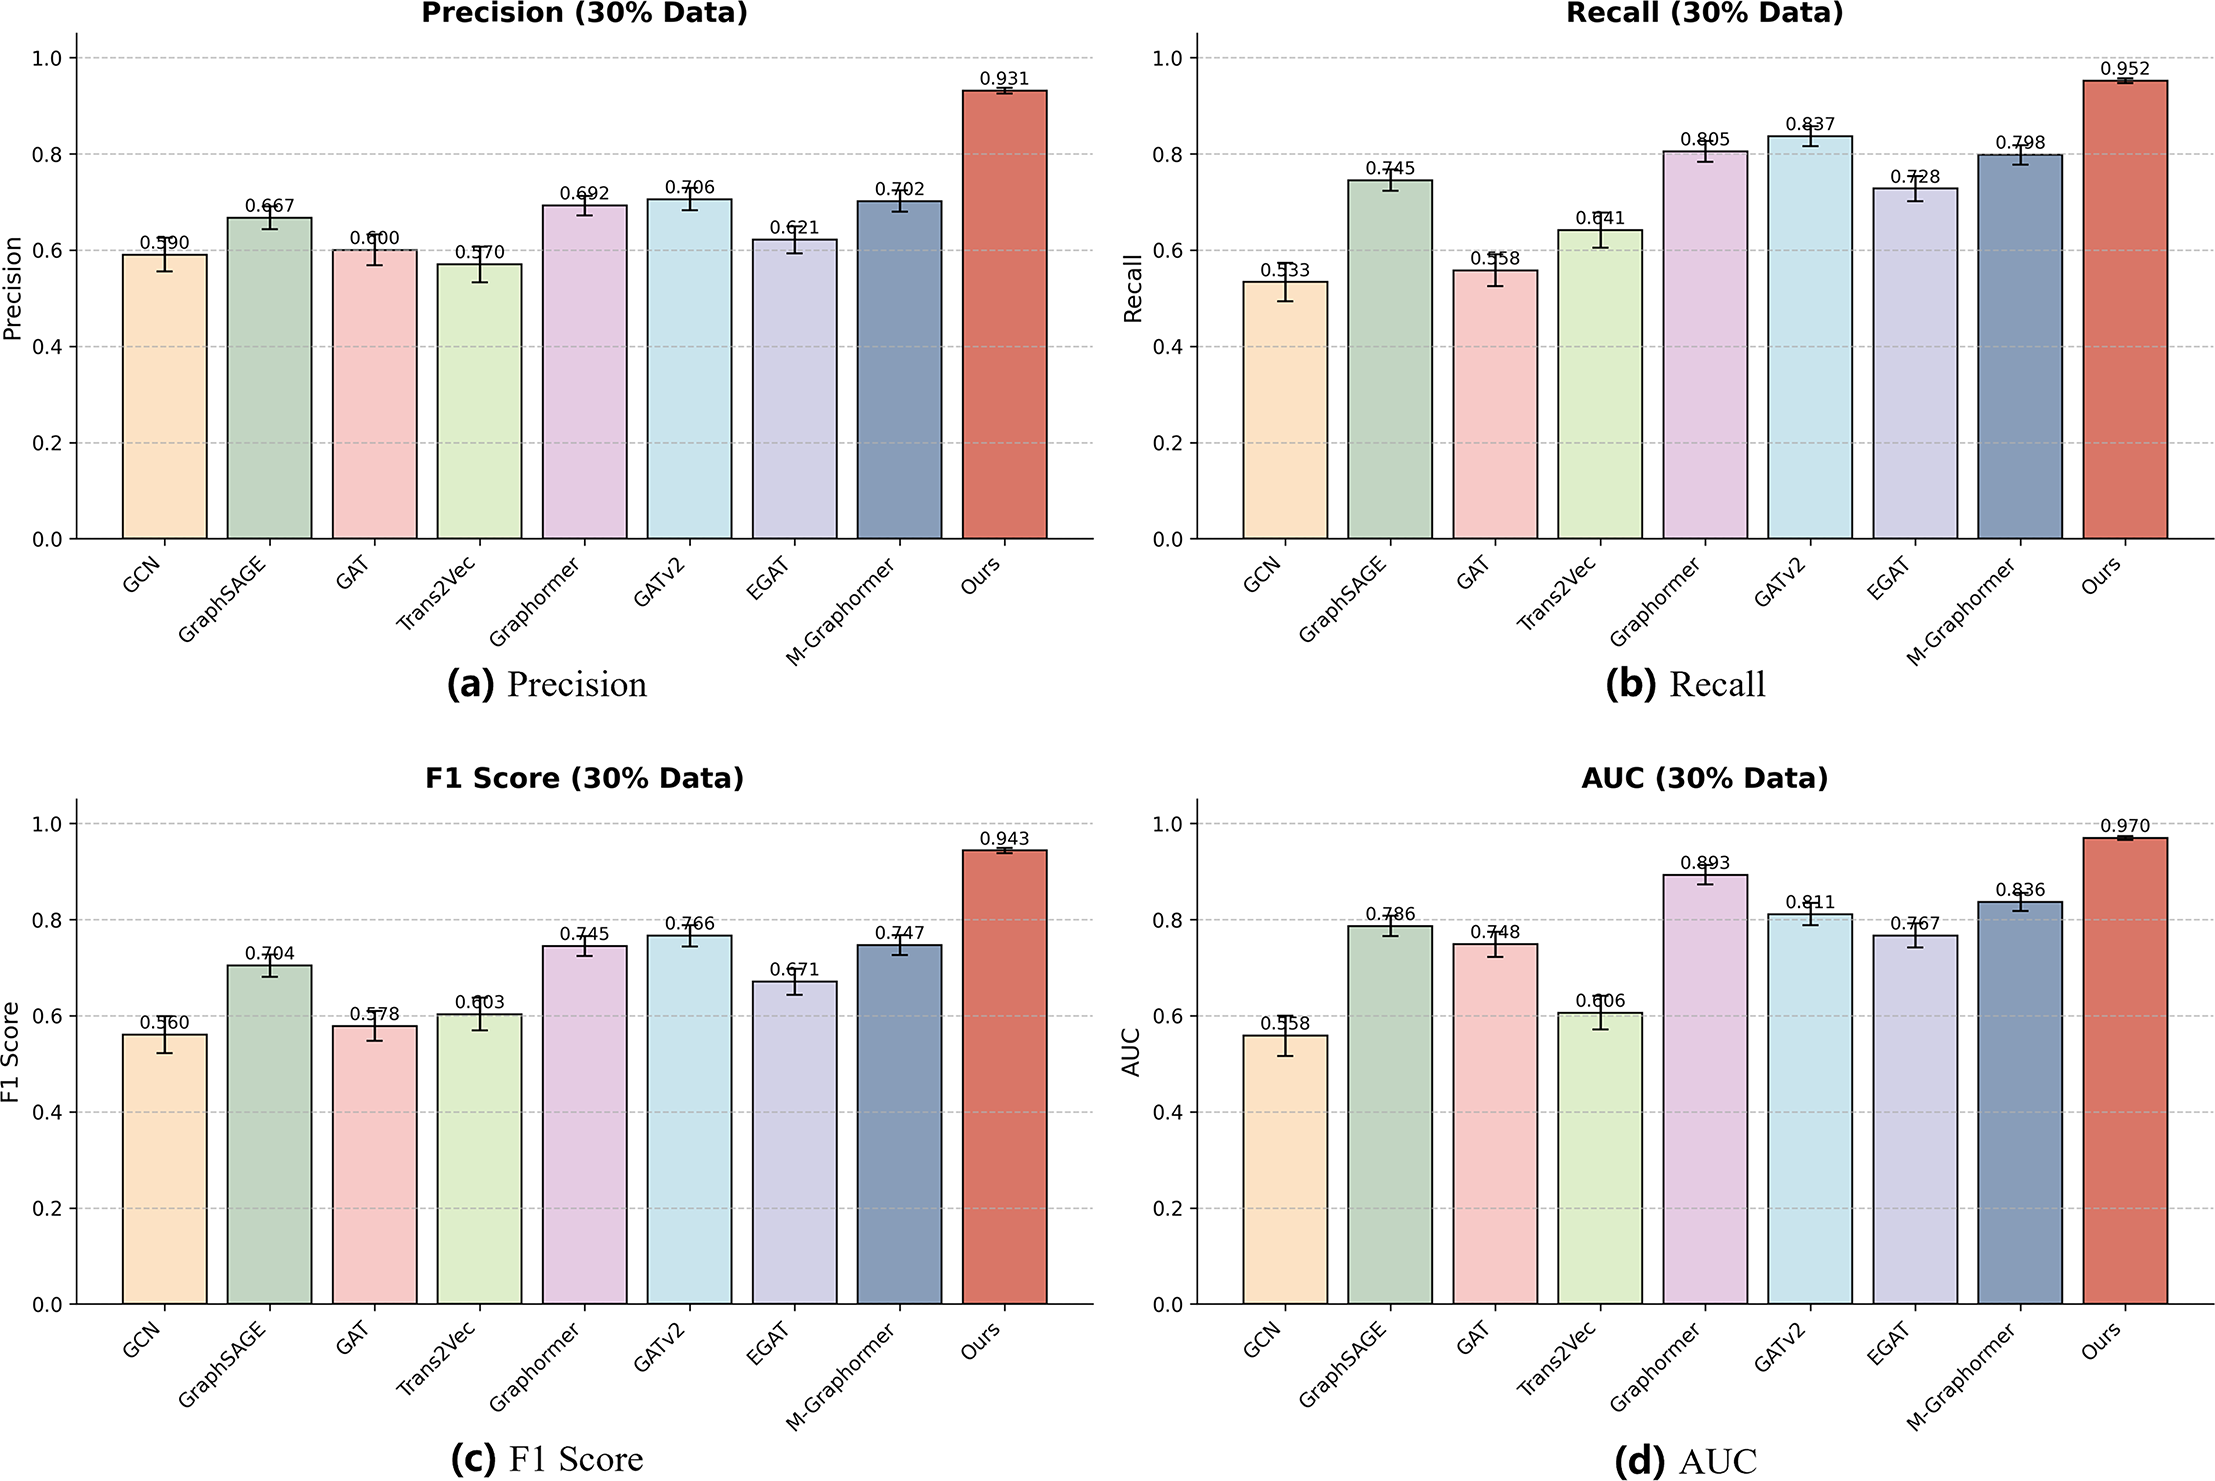
Specifically, in the F1-score and AUC charts, Ours maintains a clear advantage over all baselines for both 60% and 30% datasets, while some models such as GAT show larger fluctuations due to sensitivity to reduced data. Other baseline models, including GCN, GraphSAGE, and EGAT, exhibit moderate variability, whereas Graphormer, GATv2, and M-Graphormer remain relatively stable. Overall, the combination of tabular results in Table 3 and the visual bar charts in Figs. 4, 5 provides a comprehensive evaluation of model performance and confirms the effectiveness and robustness of our approach across different dataset scales.
Ablation study
To explore the contributions of the three feature modules, we conducted ablation experiments on our model. The performance of each single feature module is presented in Table 4. Specifically, the node behavior feature module achieves an F1-score of 0.8566, the graph-based transaction network structure feature achieves 0.9024, and the global feature module achieves 0.8699, while the full model incorporating all three modules achieves 0.9237. Among the single-feature modules, shows the greatest contribution, followed by , and contributes the least.
| Precision | Recall | F1-score | AUC | |
|---|---|---|---|---|
| 0.8571 0.0200 | 0.8569 0.0210 | 0.8566 0.0190 | 0.9225 0.0220 | |
| 0.9034 0.0180 | 0.9024 0.0200 | 0.9024 0.0170 | 0.9541 0.0190 | |
| 0.8701 0.0190 | 0.8701 0.0200 | 0.8699 0.0180 | 0.9067 0.0210 | |
| Full | 0.9152 0.0050 | 0.9412 0.0040 | 0.9237 0.0050 | 0.9618 0.0050 |
Based on these results, we analyzed the characteristics of each module. The graph-based transaction network structure feature contributes the most due to its ability to capture the unique network structure of the Ethereum transaction network and the behavior patterns of phishing nodes. Nodes in the Ethereum transaction network exhibit varying importance, and phishing nodes often perform a large number of transactions to increase visibility for fraudulent purposes. Consequently, these nodes are easily identified by graph-based structural features. The global feature module contributes secondarily, which can be attributed to the construction of 2nd-order subgraphs during Ethereum transaction data organization. The distribution of labeled phishing nodes is scattered, leading to multiple subgraphs, and nodes cannot always obtain high-quality embeddings during random walks. Nonetheless, embeddings of phishing nodes within subgraphs still retain significance. The node behavior feature contributes the least, as it is unable to fully capture complex transaction patterns. While alone achieves a moderate F1-score, it is less effective than the other modules in recognizing phishing nodes with complex or atypical transaction behaviors.
To provide a more rigorous evaluation, we further conducted combination ablation experiments, where one feature module is removed at a time. The results are visualized in Fig. 6, showing the performance of module combinations , , and in comparison to the full model. The F1-scores, Precision, Recall, and AUC all decrease when any single module is removed, confirming that each module contributes positively to the overall performance. Notably, removing the graph-based transaction network feature results in the largest performance drop (F1 = 0.8958), highlighting its critical role in the model. Removing or also leads to performance degradation, though to a lesser extent, indicating that these modules provide complementary information. Overall, these results demonstrate that all three feature modules are necessary for achieving the best performance, and the combination ablation study provides a more reliable assessment of their contributions than evaluating single modules alone.
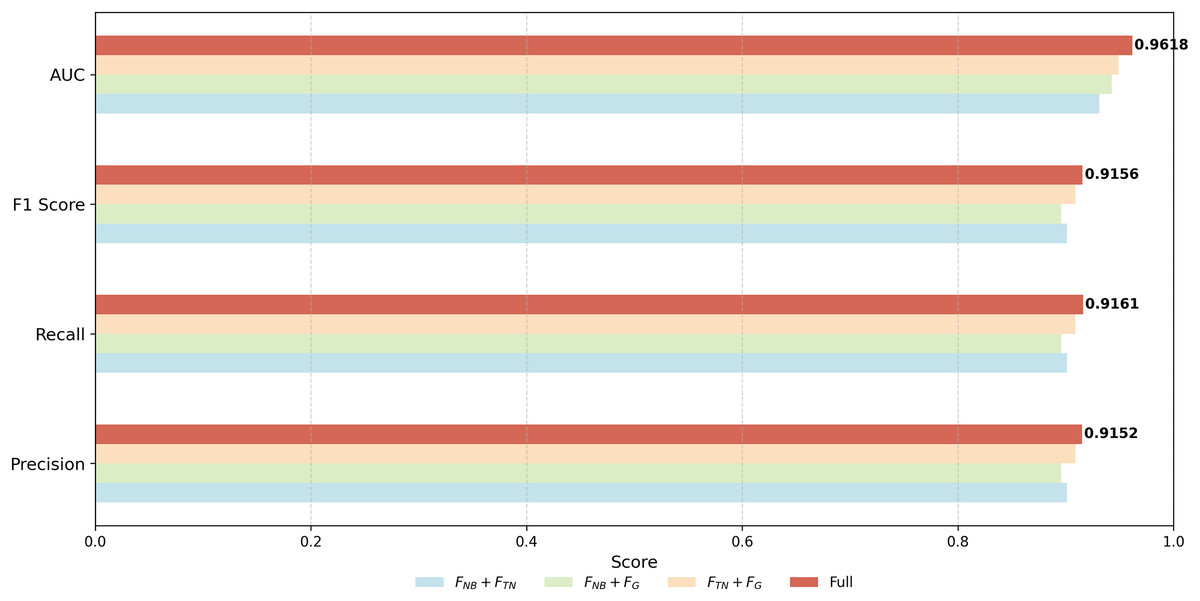
Figure 6: Performance comparison of different module combinations in the proposed framework.
Each bar represents a module or combination of modules ( , , , Full). The results demonstrate that all components contribute positively, and their integration leads to the best overall performance.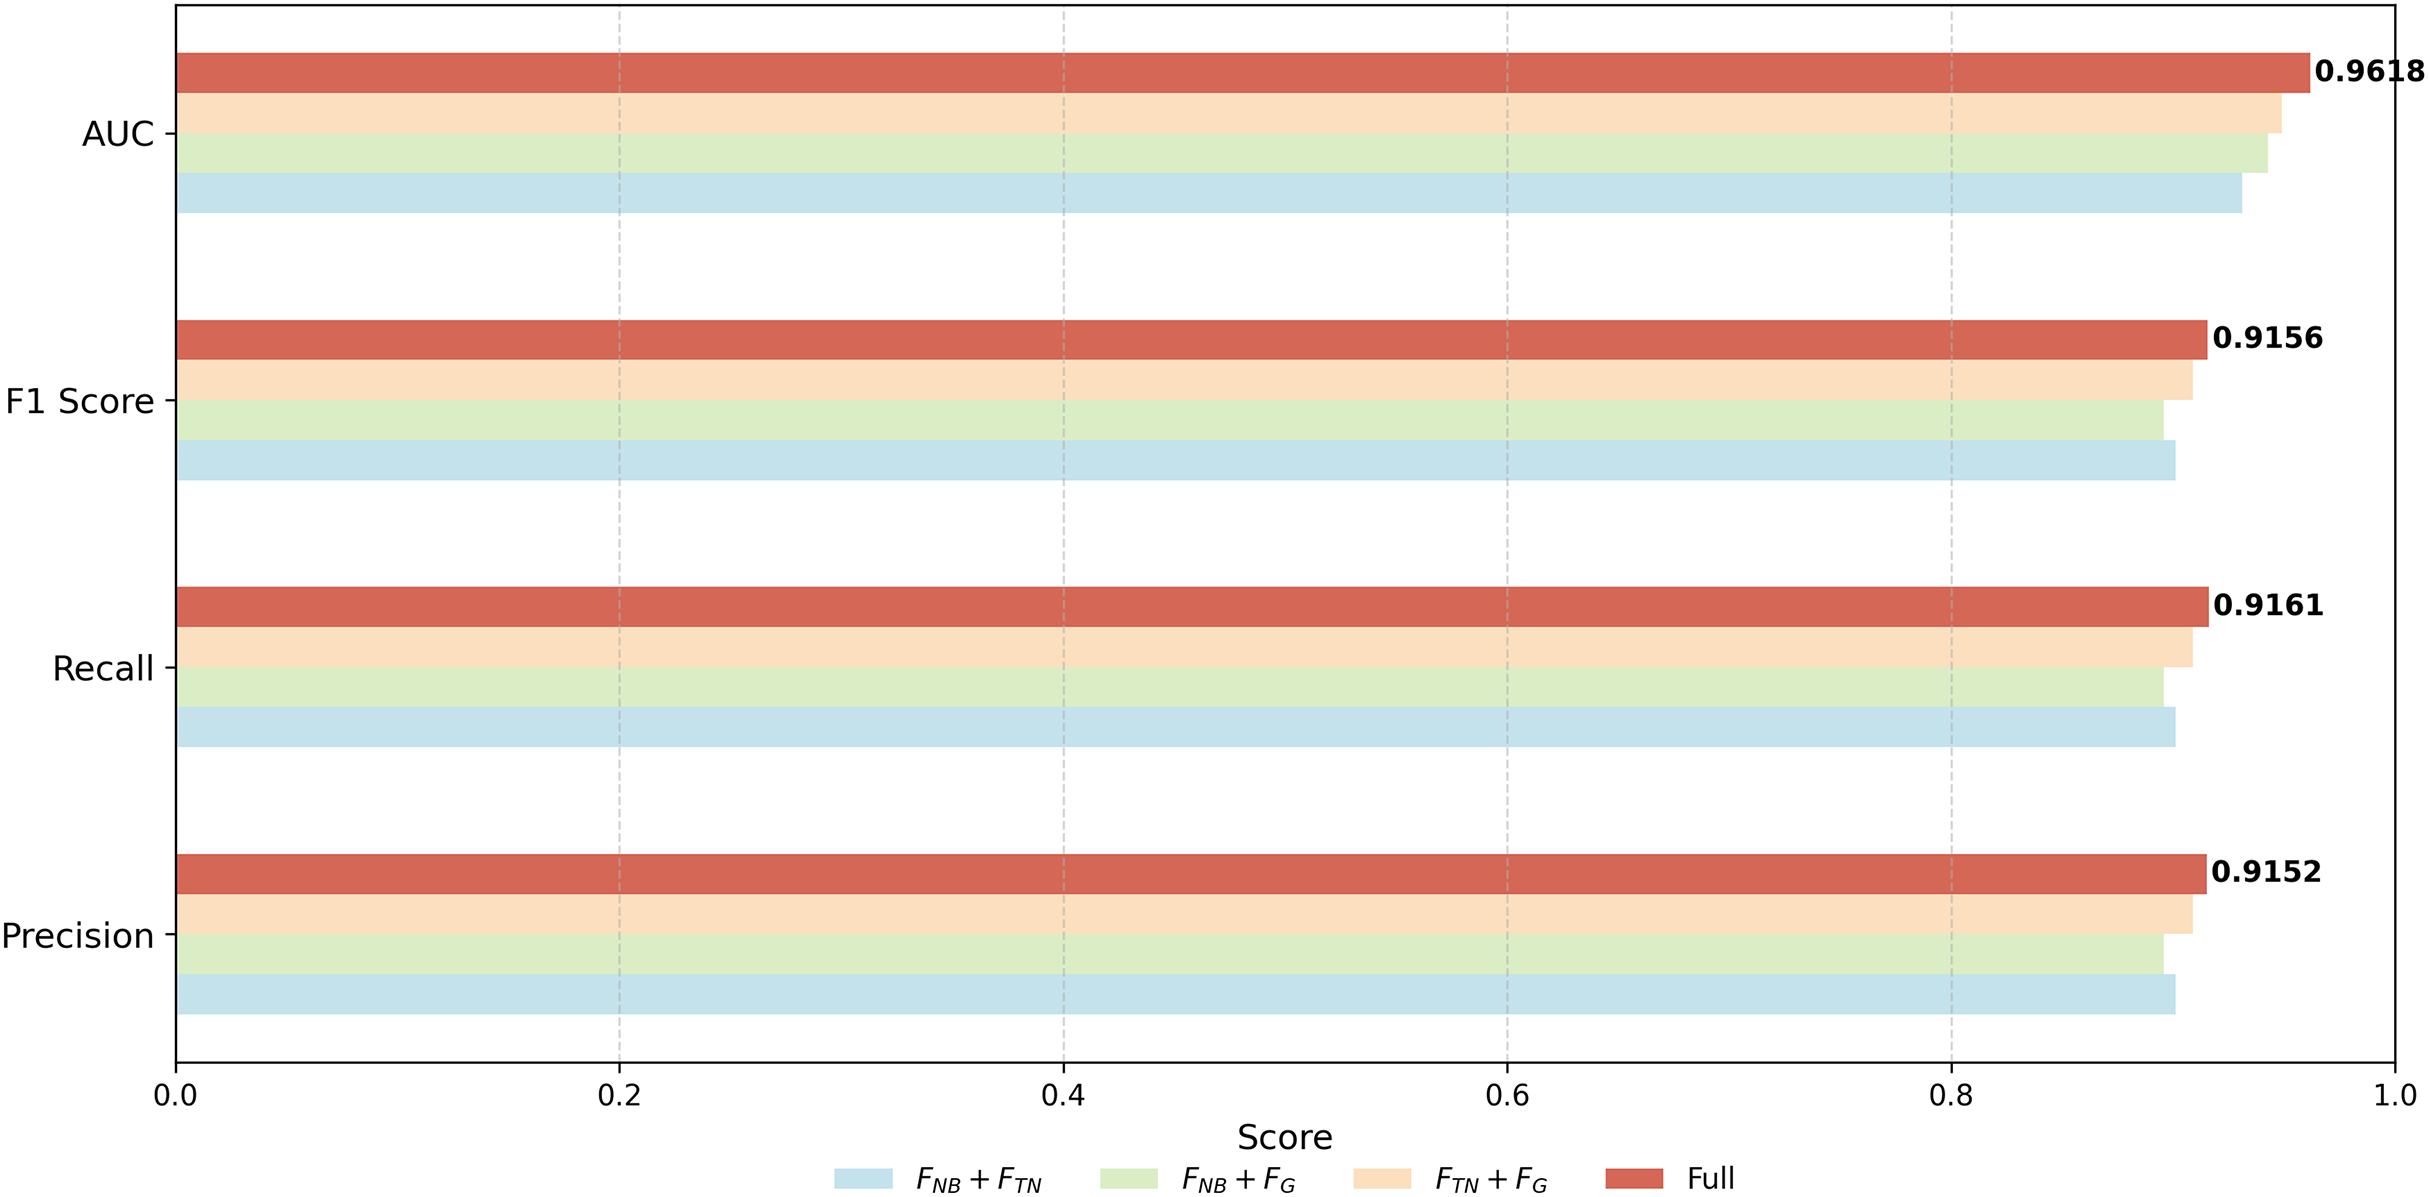
Parameter sensitivity analysis
We conduct a sensitivity analysis to investigate the influence of key hyperparameters involved in the biased random walk and representation learning process. Specifically, we focus on three parameters: walk length L, number of walks per node T, and embedding dimension . The evaluation considers both classification performance (measured by F1-score) and memory usage.
As shown in Fig. 7, increasing the walk length L (Fig. 7A) from 10 to 40 yields a consistent improvement in F1-score, indicating that longer walks capture more informative structural context. However, further increasing L to 60 leads to diminishing returns and a slight performance drop, likely due to noise accumulation. Additionally, memory usage grows linearly with L, highlighting a trade-off between effectiveness and resource cost. Based on this, we set as the optimal choice.
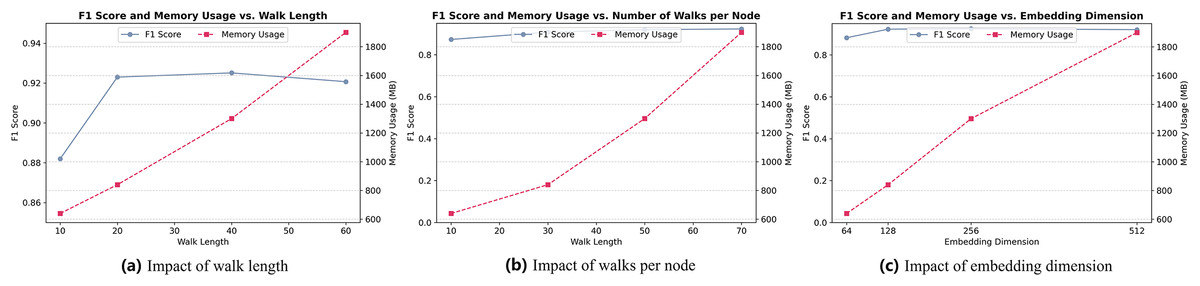
Figure 7: (A) Impact of walk length. (B) Impact of walks per node. (C) Impact of embedding dimension.
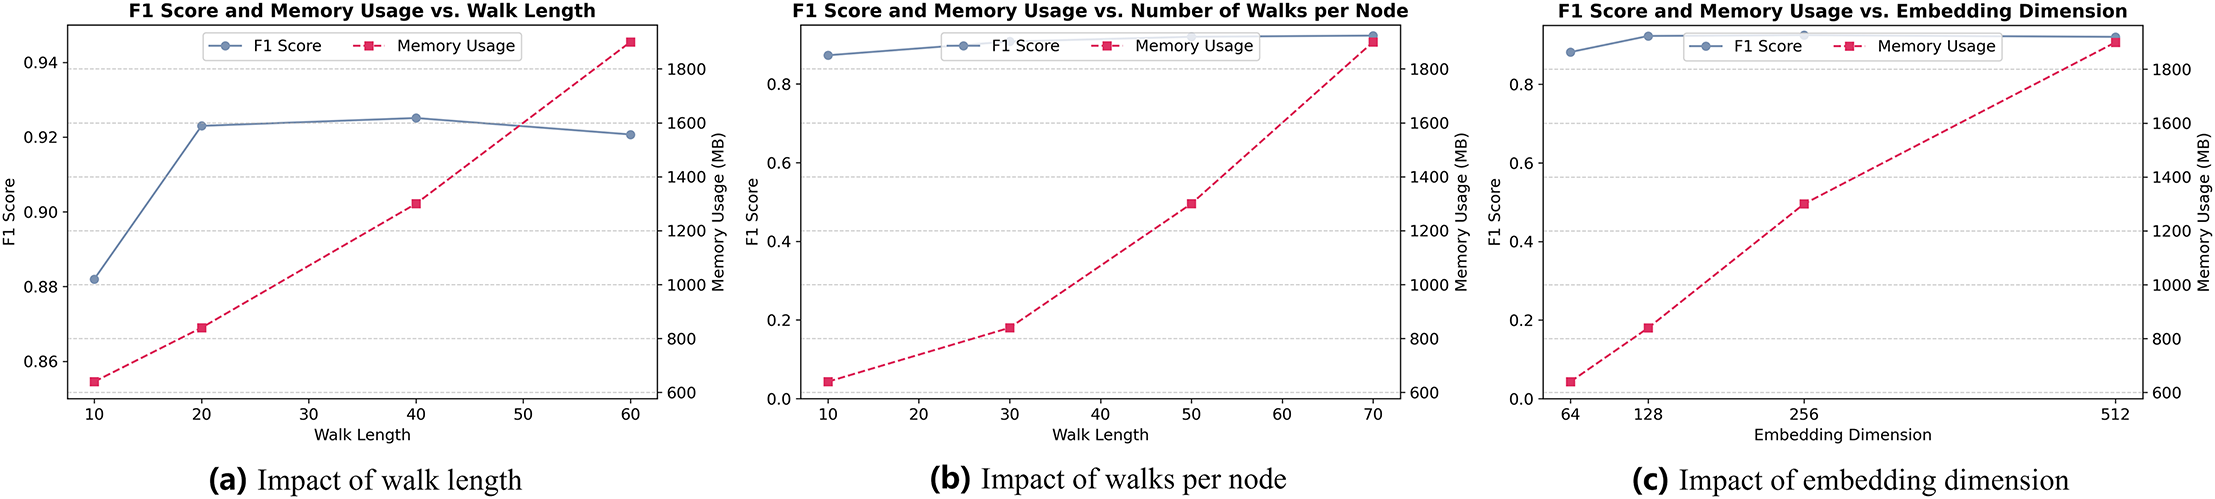
Similarly, Fig. 7B shows that increasing the number of walks per node T improves model performance up to , beyond which the gain becomes marginal while memory usage continues to grow. Thus, achieves a good balance between performance and efficiency.
For embedding dimension (Fig. 7C), the results indicate that performance benefits from increasing dimensionality up to . Beyond this point, the improvement plateaus while memory consumption increases sharply. Therefore, we fix in our experiments to ensure expressive node representations without excessive resource consumption.
These observations support the choice of , , and as default settings, balancing detection performance with computational efficiency.
Conclusion and future work
Conclusion
In this work, we propose R-NTN, a novel phishing detection framework for Ethereum that models Ethereum accounts by extracting features from three distinct dimensions. This approach enables global and comprehensive detection, demonstrating robust performance under conditions of highly imbalanced data. Experimental results show that R-NTN outperforms both baseline and state-of-the-art methods in terms of detection accuracy. Furthermore, experiments on smaller-scale datasets confirm the superior robustness of our method compared to existing approaches.
Future work
Although the multi-dimensional feature extraction employed by R-NTN alleviates the issue of extreme data imbalance in Ethereum data samples to some extent, this challenge remains and continues to present difficulties. As a result, our future work will focus on leveraging graph self-supervised learning techniques, specifically through graph contrastive learning, to construct positive and negative samples. This will aim to improve the precision of Ethereum phishing node detection.