
A railway monitoring data sharing incentive scheme based on reputation value and smart contracts
- Published
- Accepted
- Received
- Academic Editor
- Vincent Cicirello
- Subject Areas
- Human-Computer Interaction, Optimization Theory and Computation, Scientific Computing and Simulation, Internet of Things, Blockchain
- Keywords
- Data sharing, Evolutionary game theory, Reputation model, Smart contracts, Blockchain
- Copyright
- © 2025 Zhang et al.
- Licence
- This is an open access article distributed under the terms of the Creative Commons Attribution License, which permits unrestricted use, distribution, reproduction and adaptation in any medium and for any purpose provided that it is properly attributed. For attribution, the original author(s), title, publication source (PeerJ Computer Science) and either DOI or URL of the article must be cited.
- Cite this article
- 2025. A railway monitoring data sharing incentive scheme based on reputation value and smart contracts. PeerJ Computer Science 11:e3442 https://doi.org/10.7717/peerj-cs.3442
Abstract
The current data sharing incentive scheme based on evolutionary game theory generally adopts a two-party evolutionary game without reward and punishment management for member nodes and lacks a reputation mechanism. A three-party dynamic incentive mechanism for railway disaster prevention and monitoring data sharing based on reputation value is established, and an evolutionary game stabilization strategy analysis is carried out based on the credibility mechanism and gain matrix. A tripartite dynamic incentive mechanism for railway disaster prevention data based on evolutionary game theory is proposed. Finally, the scheme proposed in this article is encapsulated into a smart contract for invocation by all parties, which finally realizes a high data sharing user participation rate within the whole system. Simulation experiments show that the scheme can dynamically adjust the parameters in the data sharing process, thus changing the evolutionary direction of the data sharing process and ensuring that the interests of all parties are maximized.
Introduction
With the high-speed development of the railway industry nowadays, the demand for efficient sharing of monitoring data along the railway lines (Wang et al., 2024; Gu et al., 2022; Dai, Li & Du, 2024) is also gradually increasing, The railway industry suffers from severe “data silos,” which significantly hinder decision-making efficiency, threaten operational safety, and constrain improvements in service quality, so designing an effective program to promote effective sharing within the railway sector (Zhang et al., 2023) has become a hot issue for research in recent years. Due to its decentralized and tamper-proof characteristics, more and more scholars have begun to study blockchain-based data sharing schemes (Ma, Huang & Xu, 2024; Gong et al., 2018; Liu & Zheng, 2022). Issues such as insufficient economic incentives, privacy security, and lack of reputational regulation have led to the fact that most railway monitoring centers are still reluctant to share data voluntarily (Zou et al., 2024). However, to maximize the interests of all parties involved in data sharing, effective incentive mechanisms are crucial. Current incentive schemes based on evolutionary game theory (EGT) generally suffer from limitations. Many adopt a two-party game model, which not only restricts the diversity of strategic choices but also fails to adequately capture the complex dynamics of multi-party interactions in real-world scenarios.
In contrast, the three-party evolutionary game model offers a more comprehensive and in-depth analytical framework, better simulating data-sharing ecosystems involving key third parties such as regulators. Yet this alone is insufficient. Merely designing a multi-party game model cannot fully resolve trust issues in long-term cooperation. A robust and dynamic reputation mechanism is equally indispensable. By linking participants’ historical behavior to their future rewards, such a mechanism effectively incentivizes data providers to consistently engage in sharing and deliver high-quality data with integrity.
In order to solve the current two-party data sharing, the incentive scheme that exists in the dynamic evolution process analysis is insufficient due to a lack of reputation regulation, the user’s privacy protection is insufficient and other problems (Gao, Wang & Huang, 2024; Wang et al., 2024). This article proposes a three-party evolutionary game method based on reputation value and smart contract to realize the dynamic incentive mechanism for railway disaster prevention and monitoring data sharing, which can greatly promote the honest participation of the railway monitoring department in the data sharing by combining the Beta-distribution-based reputation mechanism model with the three-party evolutionary game model of the railway supervisory department and the railway monitoring data-sharing department A and B for the data sharing incentive process simulation. Data sharing, and through dynamic parameter adjustment in the data sharing process to verify the impact of each parameter on the data sharing process, to ensure that the benefits of all parties are maximized. Finally, the scheme proposed in this article is encapsulated into a smart contract for all parties to invoke. The smart contract has the characteristics of automatic execution and non-tampering, which ultimately achieves a high user participation rate in the system and maximizes the revenue of the whole system. The main contributions of this article are as follows:
-
A novel tripartite evolutionary game model has been constructed. In view of the limitations of the existing data sharing incentive schemes that generally adopt a two-party game and ignore the regulatory role, this model innovatively introduces the “railway regulatory department” as an independent game party, which, together with “railway data sharing party A” and “data sharing party B”, forms a game system. This tripartite structure can more truly and comprehensively analyze the dynamic incentive process and multi-party strategic interaction in the railway data sharing ecosystem, especially how the strategic choices of regulatory authorities affect data sharing behavior.
-
This article proposed and integrated a dynamic reputation mechanism based on Beta distribution. To address the general lack of effective reputation regulation mechanism in existing schemes, a reputation model based on Beta distribution is developed in this study. The core novelty of the mechanism is that it can not only dynamically update the reputation value of nodes according to their historical interactions (honest/dishonest sharing), but more importantly, it dynamically couples the reputation value as a key parameter k into the payoff matrix of the tripartite evolutionary game. This establishes a “reputation-payoff” closed-loop feedback system, in which the historical reputation of a node directly affects its future payoff, thereby fundamentally incentivising participants to choose honest sharing strategies.
-
A framework of automation and trusted execution of incentive mechanism based on smart contract is designed. To ensure that the above theoretical model and incentive mechanism can be executed transparently, automatically and credibly, we encapsulate the payoff logic and reputation update rules of the three-party game into a smart contract. Taking advantage of the tamper-proof and automatic execution features of blockchain and smart contracts, the framework ensures that all rewards and punishments can be automatically settled according to the preset rules (i.e., the payoff matrix of the model) without the intervention of a central authority. This not only guarantees the security of the data sharing incentive process, but also solves the trust problem between the participants, and finally promotes the overall participation rate of the system.
Related work
Evolutionary game theory serves as a vital mathematical tool for studying and analyzing individual behavior and strategy selection within social systems (Greiner et al., 2016). In data sharing processes, it not only aids in designing rational incentive mechanisms to encourage data providers to share data and engage in collaboration but also provides an effective framework for understanding strategy selection and outcome evolution among participants (Ahmad, Shah & Al-Fagih, 2023). Tang et al. (2024) proposed an evolutionary game model to investigate how to promote data sharing within manufacturing big data alliances. Meng & Li (2022) proposed a blockchain-based machine learning solution for secure data sharing in distributed energy storage networks. Wang, You & Zhao (2024) combined blockchain technology with game theory techniques to propose an efficient data sharing incentive method based on the Stackelberg game, enhancing data sharing efficiency among smart factories. Shen et al. (2022) established a blockchain-based evolutionary game model to analyze information-sharing incentive mechanisms for cold-chain logistics enterprises, continuously encouraging corporate participation in information sharing. Zhang, Shen & Bai (2023) proposed a smart contract-based, data quality (DQ)-driven incentive mechanism to promote the efficient and secure sharing of perception data from Internet of Things (IoT) devices with limited resources. Zhang et al. (2023) introduced a dynamic incentive mechanism for smart grid data sharing based on evolutionary game theory, offering novel insights for effective incentives in smart grid data sharing.
Chen et al. (2022) proposed a reputation- and payment-based incentive mechanism, introducing “reputation coins” as a cryptocurrency for data sharing transactions to encourage users to participate honestly in federated learning-based data sharing processes. Xuan et al. (2020) introduced a blockchain- and smart contract-based data sharing incentive mechanism that dynamically adjusts incentive levels and participation costs to encourage active data contributions. Wang et al. (2021) proposed a blockchain-supported data trust incentive model and a trustworthy data transaction scheme involving device providers, data trustees, and general users. Kang, Li & Zhu (2024) analyzed blockchain’s role in patent transactions, constructing a three-party evolutionary game model comprising transaction applicants, transaction platforms, and prospective assignees to facilitate shared patent transactions. Wen et al. (2024) proposed a multi-group data sharing network model based on consortium blockchain and IPFS for peer-to-peer (P2P) sharing. Han et al. (2025) adopted a novel three-party blockchain architecture, introducing a separate social blockchain to enable privacy-preserving data sharing with authorized external entities. Zhang et al. (2022) designed various incentive models based on evolutionary game theory and developed corresponding smart contracts to encourage diverse enterprises to participate in “bookkeeping” operations, thereby enhancing trust and maintaining the operational stability of the Blockchain-based Social Monitoring Network (BSMN). Zhu (2024) designed an information-sharing incentive strategy based on blockchain smart contracts, establishing an evolutionary game model for digital twin data sharing with both reputation-based and non-reputation-based incentives to promote information sharing. Dong, Liu & Mi (2023) constructed a three-party stochastic evolutionary game model to motivate multiple departments to participate more actively in cross-departmental data sharing. Although related research has advanced to three-party games, fundamental flaws exist in the design of “trust” or “reputation” mechanisms.
Kassab & Nassabi (2025) combined smart contracts with token-based incentives to investigate blockchain-driven incentive models. Chen et al. (2023) designed a blockchain-based distributed data sharing system for urban rail transit systems and formulated an evolutionary game model for data nodes with bounded rationality. Alamer (2024) proposed a novel Secure and Privacy Blockchain Sharing (SPB-DS) system based on mobile edge caching (MEC) systems.
In existing research, the data sharing ecosystem has been oversimplified into a two-party game, where the interaction occurs solely between the “data provider” and the “data requester” (Tang et al., 2024; Shen et al., 2022; Zhu, 2024). Zhang et al. (2023) constructed an incentive mechanism based on EGT and smart contracts, but their game participants were limited to “Data Center A” and “Data Center B.” While this two-party model is concise, it overlooks the indispensable role of “regulators” in critical infrastructure sectors such as railways, healthcare, and finance. In these industries, data sharing transcends mere peer-to-peer transactions between parties A and B, constituting a complex ecosystem involving industry regulations, public safety, and multi-stakeholder coordination. The regulator serves as an indispensable third party in the game, guiding the system toward stability by establishing rules, overseeing enforcement, and imposing penalties. Consequently, the two-party game model exhibits structural limitations when analyzing such complex systems.
To address the limitations of two-party models, some studies have begun constructing three-party game models by incorporating a “regulator” or “platform operator” into the analytical framework (Kang, Li & Zhu, 2024; Dong, Liu & Mi, 2023). However, these models generally exhibit a second critical limitation when handling “trust” or ‘reputation’ mechanisms: they treat “trust” as a static, exogenous parameter rather than a dynamic, endogenous variable. Specifically, Dong, Liu & Mi (2023) constructed a three-party stochastic evolutionary game model incorporating a regulator, but within their design, “inter-departmental trust” was treated as a fixed parameter. The authors observed different evolutionary outcomes by manually setting various fixed values for trust. This approach essentially treats ‘trust’ as a pre-set “condition” rather than an outcome shaped by historical behavior during the game process. This is fundamentally at odds with reality. In the real world, reputation is not static. It dynamically evolves based on participants’ (honest/dishonest) behavior in the previous interaction and provides real-time feedback into subsequent game decisions. Therefore, there is an urgent need for a new model that incorporates a “regulator” (a three-party game) while treating “reputation” as an endogenous dynamic variable—coupled with real-time feedback and feedback from game payoffs—rather than a static parameter. The comparison of the current research proposals is shown in Table 1.
| Research | The game players | Model type | Reputation mechanism | Implementation framework |
|---|---|---|---|---|
| Tang et al. (2024) | Two parties | Evolutionary game | Static parameters | None |
| Zhang et al. (2023) | Two parties | Evolutionary game | Static parameters | Smart contract |
| Dong, Liu & Mi (2023) | Three parties | Random game | Static parameters | None |
| Kassab & Nassabi (2025) | None | None | Static reputation | Smart contract |
| The method proposed in this article | Three parties | Evolutionary game | Dynamic and endogenous | Smart contract |
Program description
A dynamic incentive model for railway disaster prevention and monitoring data sharing based on evolutionary game theory (Su, Xiao & Su, 2017) proposed in this article is shown in Fig. 1.
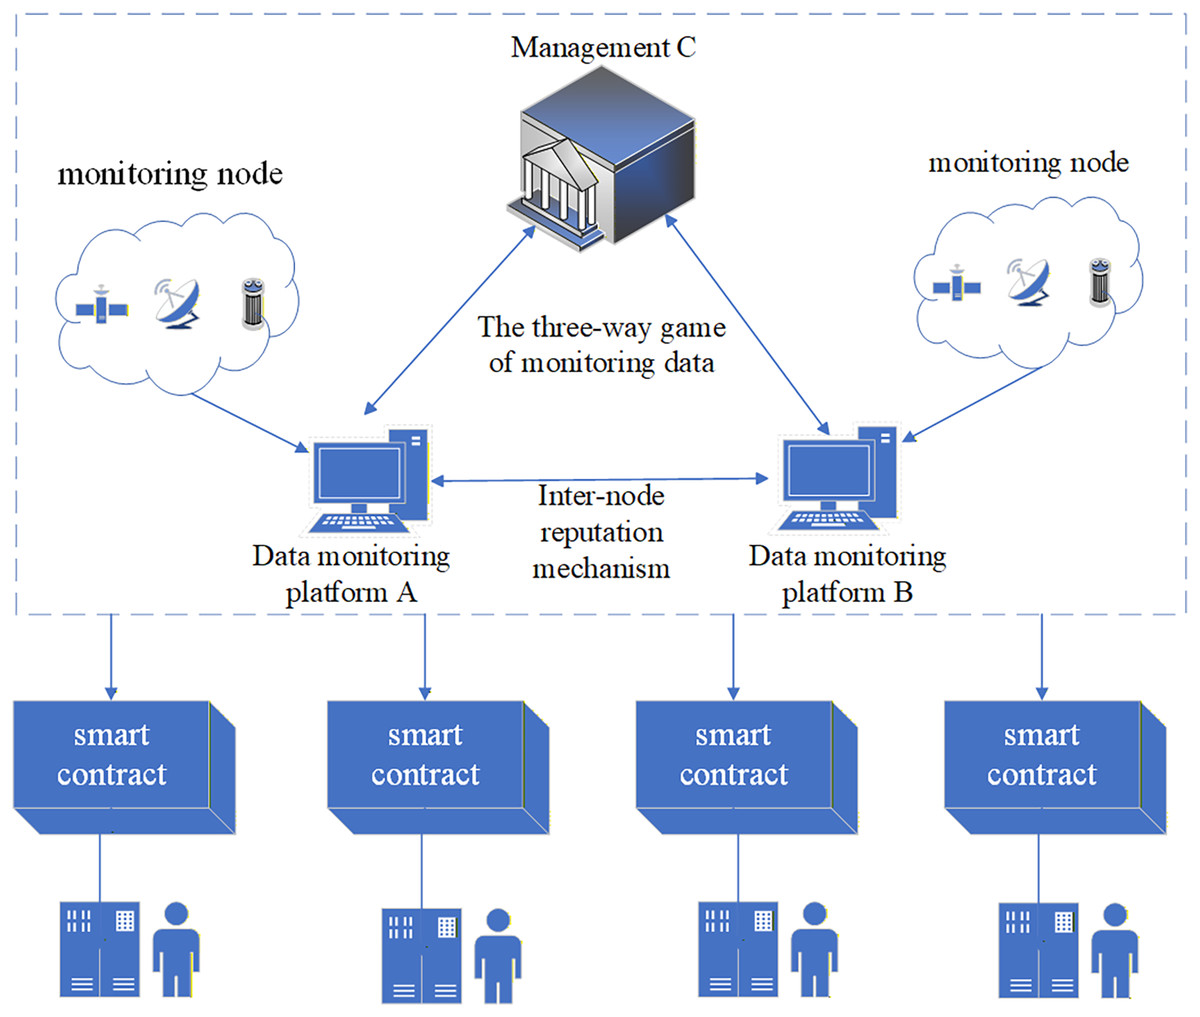
Figure 1: System model of the three-party evolutionary game for railway data sharing.
The proposed system architecture, illustrating the three game participants: Management C (the regulator), Data Monitoring Platform A (sharer 1), and Data Monitoring Platform B (sharer 2). The model highlights the key interactions, including the “three-way game,” the “inter-node reputation mechanism” connecting the sharers, and the “smart contract” layer that automates the incentive and data sharing process for all parties.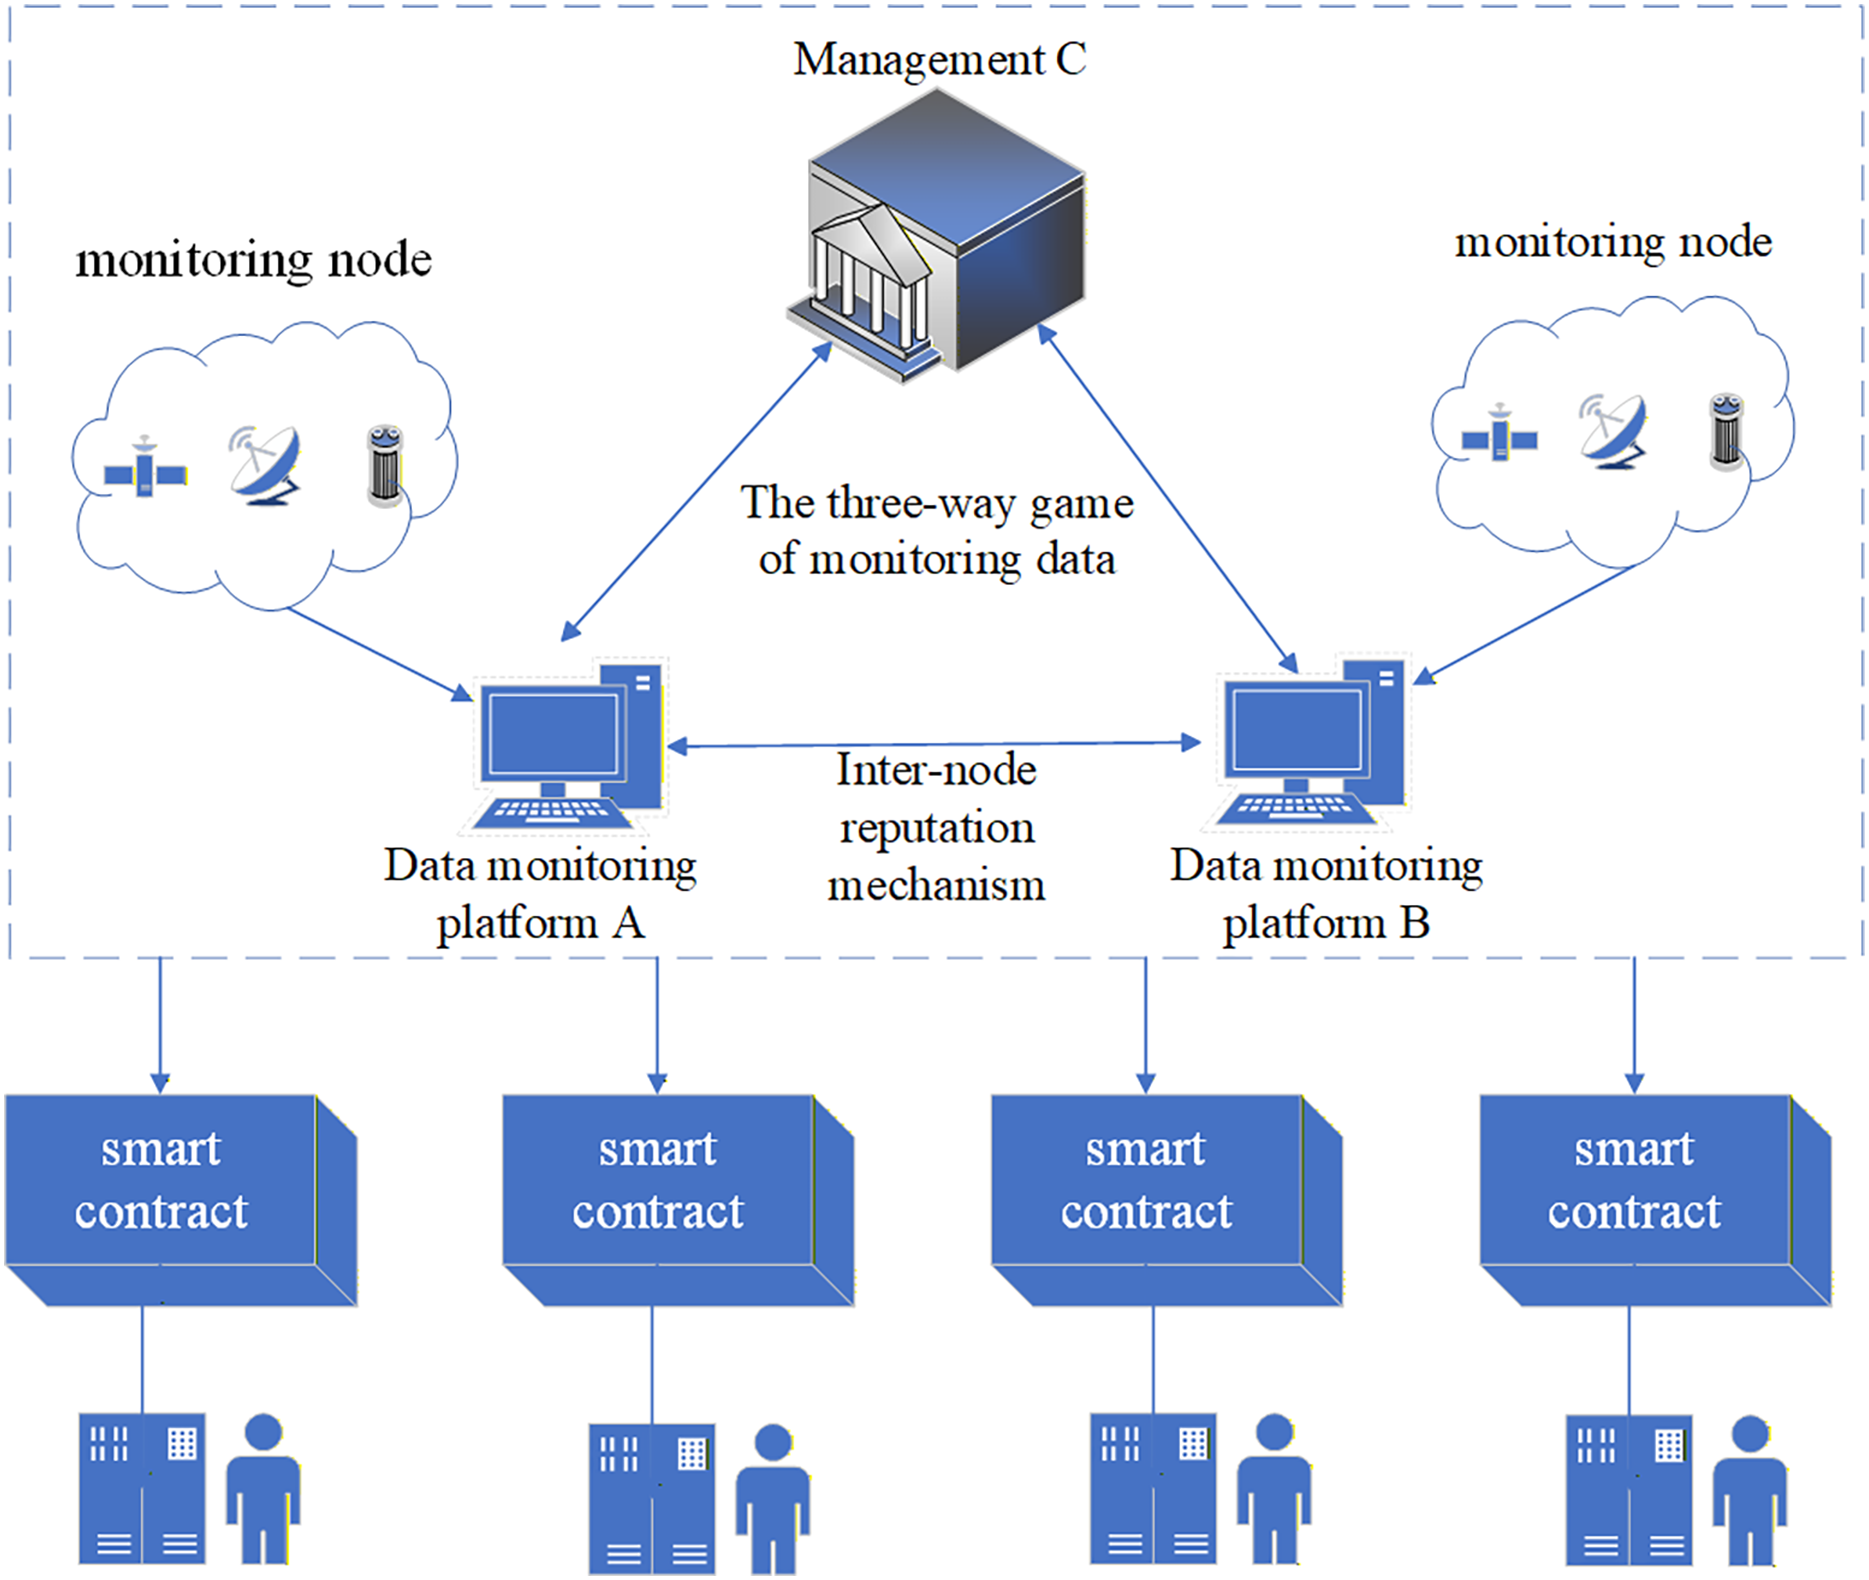
The system model proposed in this article mainly includes the design of a three-party data sharing incentive mechanism based on evolutionary game theory and the design of a smart contract based on the incentive mechanism. In the railway data provider, data receiver and regulator establish an evolutionary game model based on the reputation value of Beta distribution, and analyze the evolutionary game strategy in different situations. Afterward, based on the previous analysis results, the smart contract is responsible for the automatic implementation of the scheme proposed in this article in the system, and the system determines the incentive situation in the current state, and dynamically carries out inter-system incentives by invoking the smart contract, so that the whole system achieves the maximization of revenue.
Reputation modeling
This model utilizes a Beta distribution-based approach to calculate the reputation value of a data sharer (Chidawa & Mambo, 2021). Intuitively, the reputation value rep of a data sharing party is the credibility value credentials of a data sharing party in the process of railway disaster prevention and monitoring data sharing; the higher the Reputation Value, the more likely the data sharer is to engage in honest railway disaster prevention and monitoring data sharing, and at the same time, the benefit of a successful data sharing session will be higher for a reputable railway disaster prevention and monitoring data sharing party. Meanwhile, the number of ratings in each rating class reflects the reliability and certainty of the behavior of the bidder represented by that rating class. In this article, the Beta probability density function is used to dynamically assess the credibility of users.
(1)
When , the parameters and Beta are set according to the ratings, assuming the reputation vector of the data sharing party, which indicates that user A has conducted a+b times of data sharing before the current data sharing, including a times of honest data sharing, and b times of non-honest data sharing due to their reasons. According to the Bayesian formula and the nature of Beta, it is easy to see that the distribution after the inclusion of the reputation vector also satisfies the Beta distribution, and the parameters a and b contain the updates of a, b in the current reputation vector, respectively, so that every time the data sharer has a new data sharing transaction completed, it will be updated for the new transaction that has just been observed. Since the reputation of user A is a prediction of the probability P that the user is a trusted sharer, the expected value of P is denoted as : In the initial state, user A has not performed any data sharing transaction yet, then both a and b take the initial value of 1. At this time, the reputation value of user is 0.5, which indicates that the probability that user A is the one who performs honest data sharing and dishonest data sharing is the same. When the user has ended a data sharing process, the values of a and b will be updated to obtain a dynamic assessment of the user’s reputation value.
Figure 2A shows the Beta probability density functions when a user submits five trustworthy data shares and two dishonest data shares (a = 5, b = 2) and when a user submits five trustworthy data shares and three dishonest data shares (a = 5, b = 3). Based on the Beta distribution calculations, the corresponding user credibility scores are 0.71 and 0.625, respectively. These credibility scores indicate that while it is impossible to determine whether the user is trustworthy, it is at least possible to assess the user’s past credibility based on their previous seven or eight data shares, with scores of 0.71 and 0.625, respectively. Similarly, Fig. 2B shows the Beta probability density function after the user has performed two trustworthy data shares and five dishonest data shares (a = 2, b = 5) and after the user has performed three trustworthy data shares and five dishonest data shares (a = 3, b = 5). The user’s credibility values are 0.287 and 0.375, respectively. It can be seen that the user’s credibility value decreases dynamically after performing dishonest data shares. The Beta-based reputation mechanism can dynamically update the reputation value Rep for each data sharing transaction performed by the user.
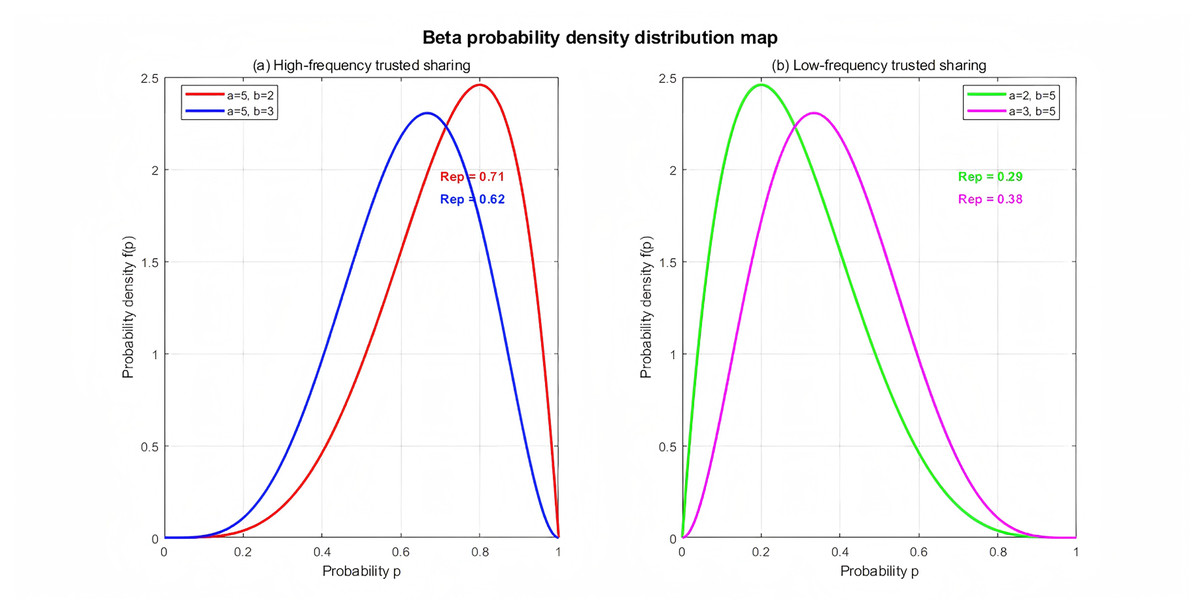
Figure 2: Beta probability density distribution map for the dynamic reputation (Rep) model.
Visualization of the Beta probability density function (f(p)) used to calculate dynamic reputation. (A) “High-frequency trusted sharing” scenarios, comparing the distribution for (a = 5, b = 2), which yields a reputation (Rep) of 0.71, with (a = 5, b = 3), which yields Rep = 0.62. (B) “Low-frequency trusted sharing” scenarios, comparing (a = 2, b = 5) (Rep = 0.29) with (a = 3, b = 5) (Rep = 0.38). The parameters a and b represent the historical counts of honest and dishonest sharing transactions, respectively.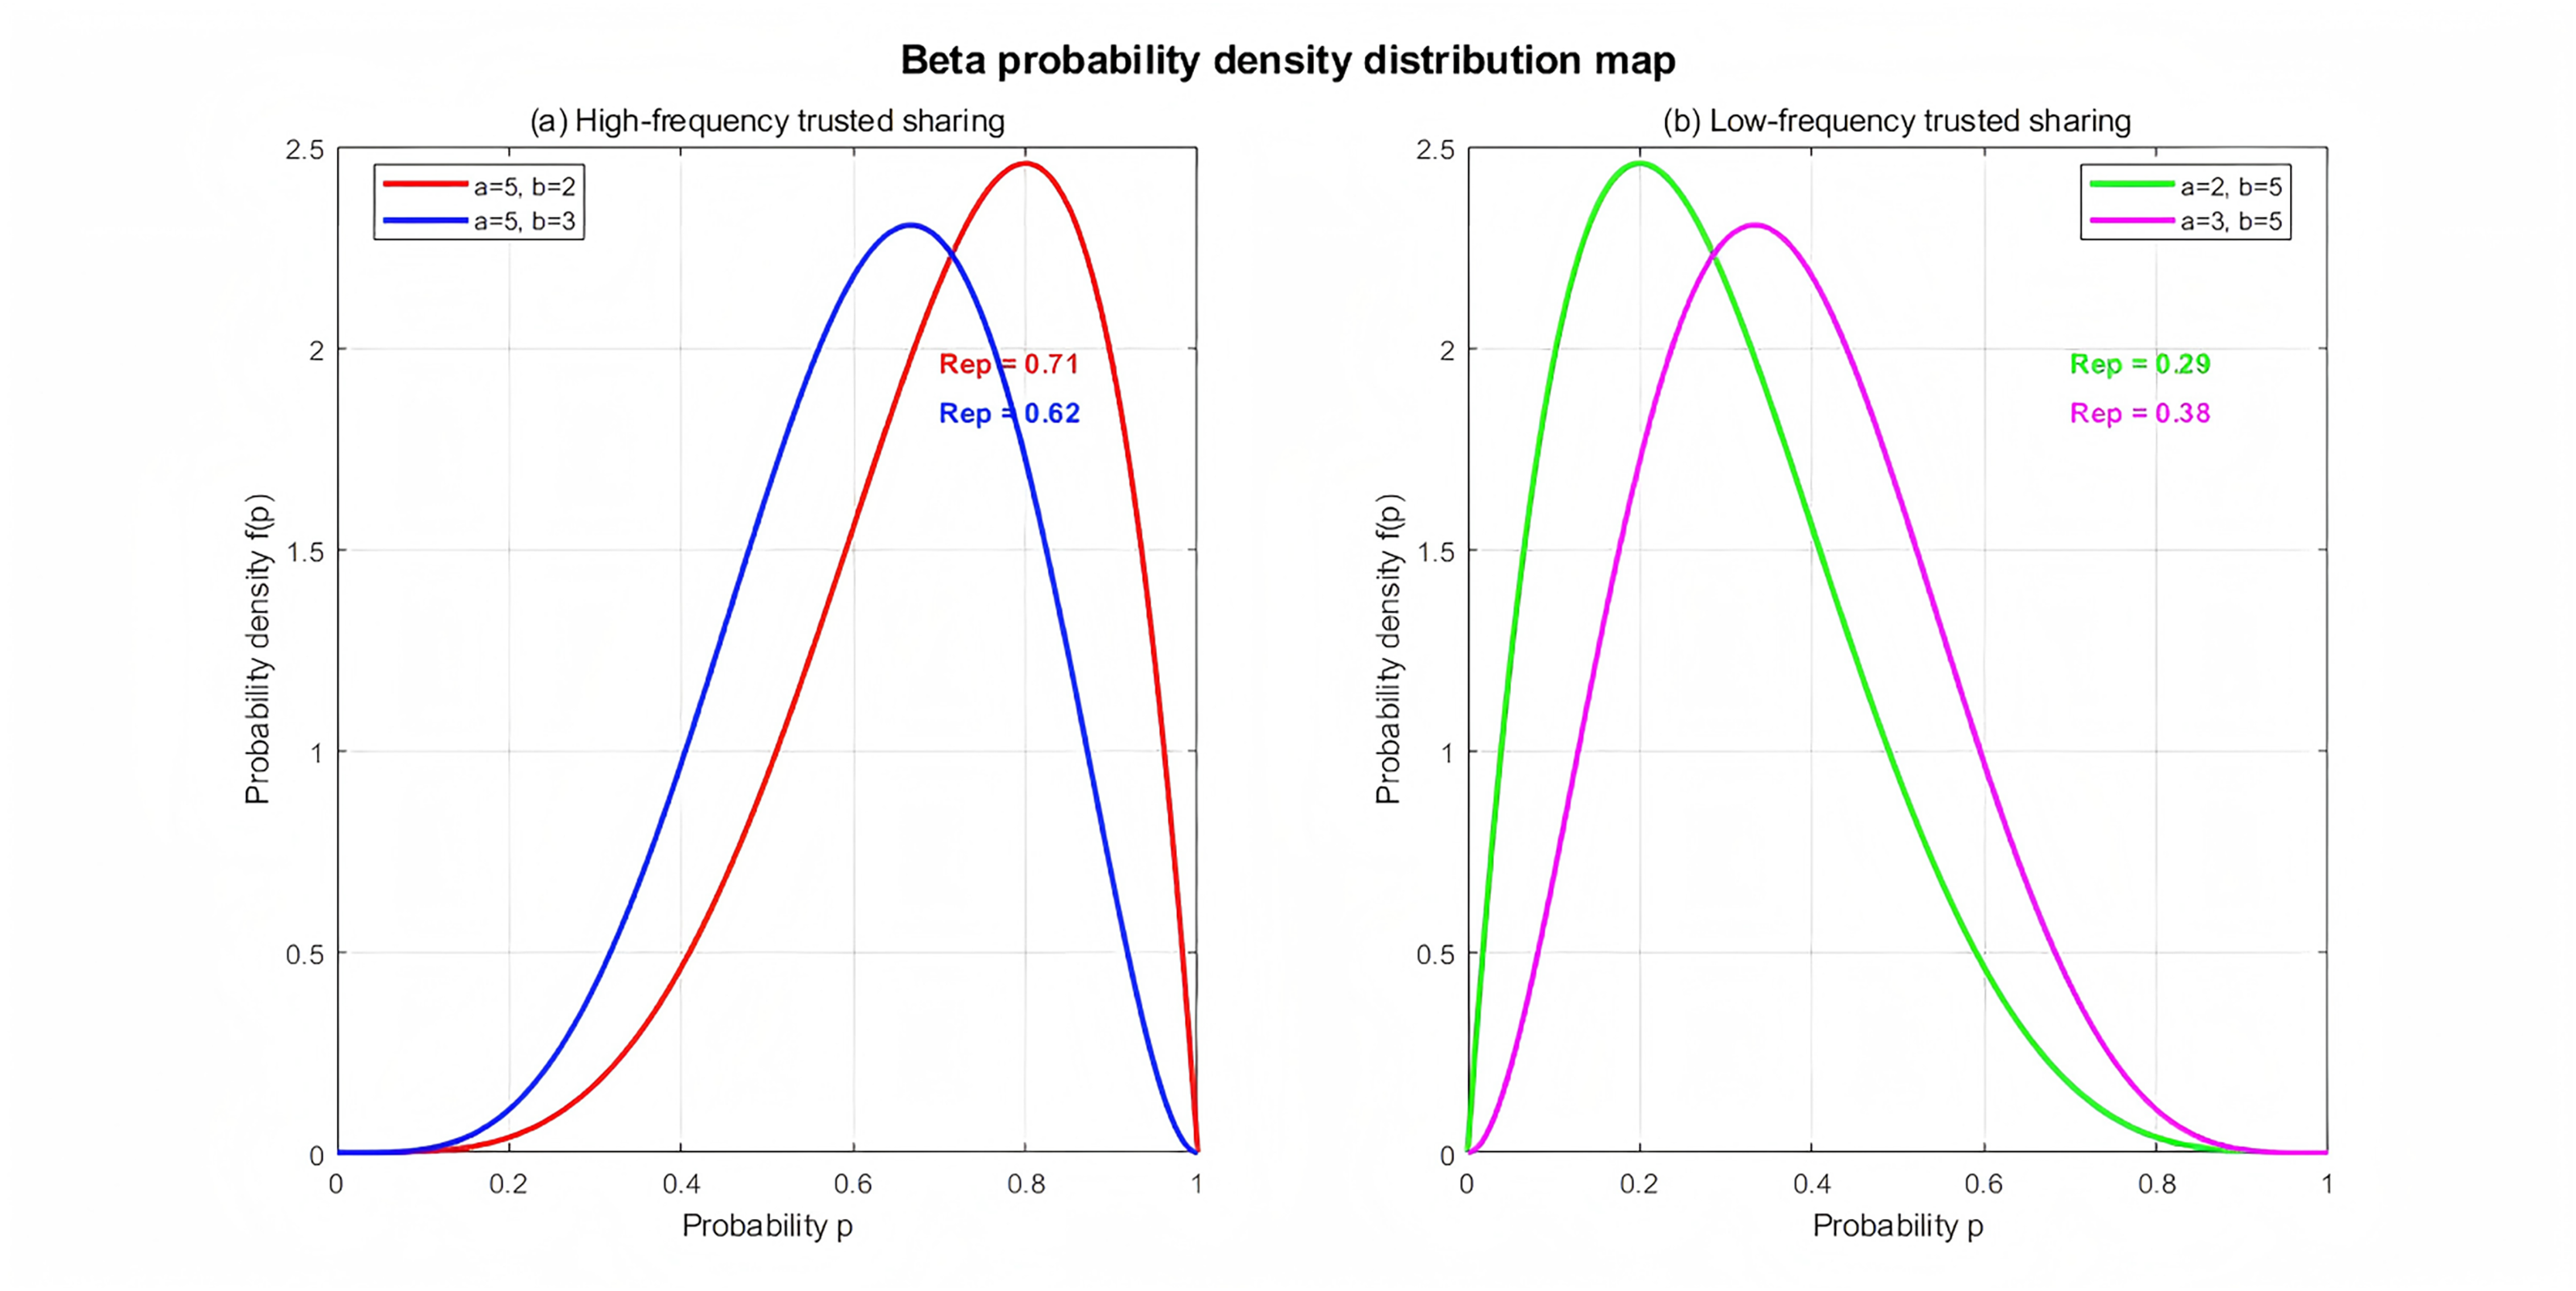
Three-party evolutionary game modeling
Based on the tripartite evolutionary game method, the gains and optimal choices between rail-road disaster prevention and monitoring data sharing party A, railway regulators and railway disaster prevention and monitoring data sharing party B. Disaster prevention and monitoring data sharing parties A and B usually consist of data centers of each railway bureau station section or directly under the agency, for relevant parameter settings, see Table 2.
| Symbol | Description | Symbol | Description |
|---|---|---|---|
| x | The probability that the railway regulator chooses “strict regulation” | P1 | The additional revenue provided by the platform when both parties share honestly |
| y | The probability that data sharing party A chooses “honest sharing” | E | Complementary factors in data sharing |
| z | The probability that data sharing party B chooses “honest sharing” | aN | Concealment costs of dishonest sharing parties |
| N | Illegal gains obtained by the sharing party through “non-honest sharing” | C1 | Basic platform maintenance costs borne by the sharing party |
| C2 | The regulatory platform is used to maintain the costs associated with the data sharing process. | C3 | Additional regulatory costs incurred when the regulatory platform selects “strict regulation” |
| B | Fixed base income of the platform | P | Losses incurred by the platform due to dishonest trading behavior |
| D | Additional profits earned by the platform under strict regulatory oversight | M | Additional penalty cost to dishonest sharing parties under strict supervision |
| s | Size of shared data | Re P | User Reputation Score |
| C | One party’s dishonest sharing causes losses to the honest party | k | Reputation-related revenue parameters |
The regulator’s policy set is {strict regulation, normal regulation}. Assume the probability that the regulator chooses strict regulation is , and the probability of choosing normal regulation is . Data sharing parties A and B have a strategy set {honest sharing, dishonest sharing}. The probability that parties A and B engage in honest data sharing are and , and the probability of dishonest sharing are and . Here, x, y, z are all functions of time t.
The logical relationship between the benefits and costs for each party in this model is as follows (see Table 1 for detailed definitions):
Data sharing parties (A and B): The revenue of sharing parties primarily consists of three components: base revenue, additional rewards, and illegal gains. The base benefit is positively correlated with the size of the shared data and its complementarity . To incentivize honest behavior, when both parties share honestly, the platform provides an additional reward based on their reputation value . If a party chooses dishonest sharing, they gain illicit benefits . The costs for sharing parties include fixed costs, losses, and penalties. All sharing parties must pay the platform’s basic maintenance cost upon participation. If one party chooses dishonest sharing, the honest sharing party incurs a loss . The dishonest sharing party also bears concealment costs , which are negatively correlated with reputation value —meaning lower reputation results in higher concealment costs (penalty coefficient). Additionally, under “strict regulation,” dishonest sharing parties face harsher penalties .
Railway regulatory platform: The platform’s benefits and costs depend on its regulatory strategy. The platform’s fixed baseline benefit is . When the platform adopts “strict regulation” and facilitates honest sharing, it gains an additional benefit . Its costs include baseline maintenance cost and the additional cost under the “strict regulation” strategy. If dishonest transactions cause losses to the platform, the loss is recorded as . The evolutionary game payoff matrix is shown in Table 3.
| Railroad regulator | Monitoring data-sharing parties A | Monitoring data-sharing parties B | |
|---|---|---|---|
| Honest sharing z | Dishonest sharing (1 − z) | ||
| Strict supervision x | Honest sharing y | B + D − C2 − C3 | B + D − C2 − C3 − p |
| sE + k1P1 − C1 | sE − C1 − C | ||
| sE + k2P1 − C1 | sE + N − C1 − aN − M | ||
| Dishonest sharing (1 − y) | B + D − C2 − C3 − p | B + D − C2 − C3 − p | |
| sE + N − C1 − aN − M | sE + N − C1 − aN − M | ||
| sE − C1 − C | sE + N − C1 − aN − M | ||
| General supervision (1 − x) | Honest sharing y | B − C2 | B − C2 − p |
| sE + k1P1 − C1 | sE − C1 − C | ||
| sE + k2P1 − C1 | sE + N − C1 − aN | ||
| Dishonest sharing (1 − y) | B − C2 − p | B − C2 − p | |
| sE + N − C1 − aN | sE + N − C1 − aN | ||
| sE − C1 − C | sE + N − C1 − aN | ||
Analysis of evolutionary strategies
Earnings and expected earnings
The railway regulator, monitoring data sharer A, and monitoring data sharer B all choose the best strategy based on their actual gains and losses. Setting the expected gains of the railway regulator using strict and ordinary regulation as and , and the average gain as , it can be obtained:
(2)
(3)
(4) Similarly, monitoring the expected payoffs of data sharing party A for choosing honest data sharing and fraudulent trading in the data sharing game as and , respectively, with an average payoff of , it can be obtained:
(5)
(6)
(7) Similarly, monitoring the expected payoffs of data sharing party A for choosing honest data sharing and fraudulent trading in the data sharing game as and , respectively, with an average payoff of , it can be obtained:
(8)
(9)
(10)
Revenue and evolutionary direction analysis
Analysis of the evolutionary direction of the railway regulator
Based on the above analysis, the replication dynamic equation for the application strategy of the railway regulator is:
(11)
The first-order derivatives of x is respectively:
(12)
The phase diagram of the strategy evolution of the railway regulatory platform is shown in Fig. 3A. The upper half of the curve indicates that the railway regulatory platform tends to be strictly regulated, and the lower half of the curve indicates that the railway regulatory platform tends to be non-strictly regulated. See the Supplementary file Appendix A for a detailed analysis process.
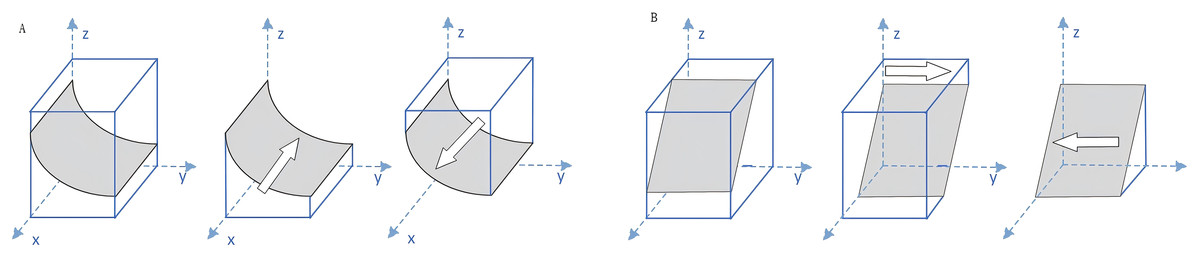
Figure 3: Conceptual phase diagrams for the strategy evolution of the regulator and sharing party A.
(A) Phase diagram illustrating the strategy evolution for the railway regulatory platform (x-axis). (B) Phase diagram illustrating the strategy evolution for monitoring data sharing party A (y-axis). In both diagrams, the grey surface represents the stability threshold (saddle point manifold), and the white arrows indicate the direction of strategy evolution (e.g., towards 0 or 1) based on the system’s current state relative to the threshold.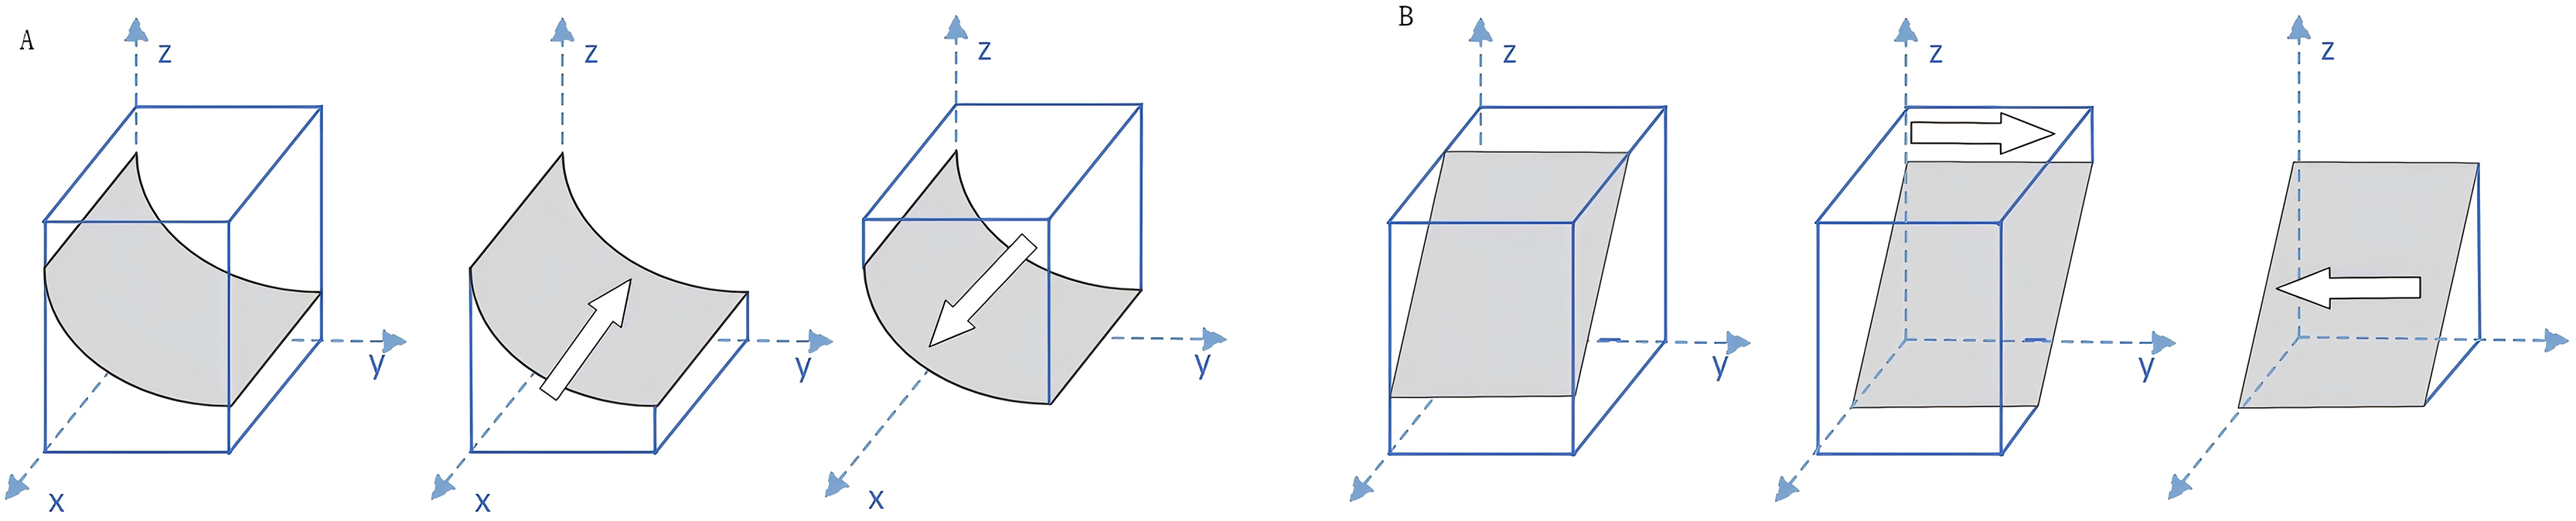
Monitoring data sharing party A evolutionary path analysis
Based on the above analysis, the replication dynamic equation for monitoring the sharing strategy of data sharer A is:
(13)
The first-order derivatives of y is respectively:
(14)
The phase diagram of the strategy evolution of the transaction requesting party can be obtained, as shown in Fig. 3B. In the region of the upper half of the surface, y tends to be 1, monitoring that data sharing party A tends to share honestly; in the region of the lower half of the surface, y tends to be 0, monitoring that data sharing party A tends to share dishonestly. See the Supplementary file Appendix B for a detailed analysis process.
Monitoring data sharing party B evolutionary path analysis
Based on the above analysis, the replication dynamic equation for monitoring the sharing strategy of data sharer B is:
(15)
The first-order derivatives of z and is respectively:
(16)
The phase diagram of the strategy evolution of the intended transferee can be obtained, as shown in Fig. 4. In the region of the first half of the surface, z tends to 1, monitoring that data sharing party B tends to share honestly; when in the second half of the surface, z tends to 0, monitoring that data sharing party B tends to share dishonestly. See the Supplementary file Appendix C for a detailed analysis process.

Figure 4: Conceptual phase diagram for the strategy evolution of monitoring data sharing party B.
Phase diagram illustrating the strategy evolution for monitoring data sharing party B (z-axis). The grey surface represents the stability threshold. The white arrows indicate the direction of strategy evolution, showing the system tending towards honest sharing or dishonest sharing based on system conditions.
Stability analysis of equilibrium points in evolutionary games
The equilibrium points of the three-party evolutionary game system can be obtained from . Based on the theory of evolutionary game, when the eigenvalues of the Jacobi matrix are all negative, the corresponding local equilibrium point is the Evolutionary Stability Point (ESS). Calculate the eigenvalues of the Jacobi matrix corresponding to each equilibrium point, and analyze the sign and stability of the eigenvalues to get the Jacobi matrix of the three-party evolutionary game, and the analysis based on the Jacobi eigenvalues is shown in Table 4. Please see the Supplementary file Appendix D for the Jacobi Matrix.
| Balance point | Eigenvalue | Eigenvalue | Eigenvalue | Satisfaction of ESS | |
|---|---|---|---|---|---|
| E1(0, 0, 0) | d − C3 | a * n − n − c | a * n − n − c | When condition 1 is met | |
| E2(0, 0, 1) | d − C3 | C + n − a * n | a * n − n + k1p1 | Destabilization point | |
| E3(0, 1, 0) | d − C3 | C + n − a * n | a * n − n + k2p1 | Destabilization point | |
| E4(0, 1, 1) | n − a * n − k1p1 | n − a * n − k2p1 | C2 − C3 + C2 * d | When condition 2 is met | |
| E5(1, 0, 0) | C3 − d | m − C − n + a*n | m − C − n + a * n | When condition 3 is met | |
| E6(1, 0, 1) | C3 − d | m − n + a * n + k1p1 | C − m + n − a * n | Destabilization point | |
| E7(1, 1, 0) | C3 − d | m − n + a * n + k2p1 | C − m + n − a * n | Destabilization point | |
| E8(1, 1, 1) | C3 − C2 − C2 * d | n − m − a * n − k1p1 | n − m − a * n − k2p1 | When condition 4 is met | |
The ESSs requiring conditions in Table 4 are: condition 1: , ; condition 2: , and ; condition 3: and ; condition 4: , and . The ESS of the equilibrium point is analyzed point E1(0, 0, 0), E4(0, 1, 1), E5(1, 0, 0), E8(1, 1, 1) matrix eigenvalues can be transformed into the ESS evolutionary stability point under certain conditions, the four points are discussed, and the analysis of the three-party game of the evolution of the railway disaster prevention and monitoring data is carried out in four cases. When the parameters satisfy the condition one, the cost C3 of the regulating department to carry out strict regulation is higher than the benefit D of the platform after strict regulation. cost C3 is higher than the benefit D after strict regulation by the platform, the railway disaster prevention and monitoring data sharing parties A, B will tend to choose the strategy of non-honest sharing, and the three parties of the game will evolve in the direction of {non-strict regulation, non-honest sharing, and non-honest sharing} choices, i.e., the direction of point E1(0, 0, 0). When the parameters satisfy condition two, the three parties of the game will evolve towards the choice of {non-strict regulation, honest sharing, honest sharing} i.e., point E4(0, 1, 1). When the parameters satisfy condition three, the three parties of the game will evolve towards the choice of {strict regulation, non-honest sharing, non-honest sharing} i.e., point E5(1, 0, 0). When the parameter condition IV. The three parties of the game will evolve towards the choice of {Strict Regulation, Honest Sharing, Honest Sharing}, i.e., the direction of point E8(1, 1, 1).
Simulation analysis
To explore the correctness and validity of the analysis of the above four scenarios, and at the same time to explore the direction of the evolution strategy of different parameters in different situations in a more detailed and specific way, this section carries out the simulation analysis of the tripartite evolution game of railway disaster prevention and monitoring based on this scheme, to explore the strategic impact of different parameters on the evolution. The hardware configuration of the simulation experiment is Intel Core i5-7300HQ 2.50 GHz CPU, 8 GB RAM, and the software is configured in Matlab R2024, and the ODE45 ordinary differential equation solver is applied to numerically solve the replicated dynamic equations to carry out the simulation of the evolution process, and the parameters of the model are assigned concerning the literature (Shen et al., 2022) to meticulously explore the different The parameters of the model are assigned values, and the evolution of strategies in the evolutionary game process is carefully explored in different cases, so that the subsequent system can dynamically regulate the parameters to maximize the expected benefit of the whole evolutionary game system. For the railway disaster prevention data sharing parties A, B, by studying the effect of the parameter k related to the reputation value and the masking cost N on the evolutionary game process. For the regulator, it mainly explores the influence of the cost C3 of strict regulation of the platform and the benefit D of strict regulation of the platform on the evolutionary game process.
Analysis of the direction of the tripartite evolution of railway monitoring data
The initial parameter assignments are shown in Table 5. In this section, the model of the evolutionary game is set to four groups, corresponding to the four cases of condition 1, condition 2, condition 3, and condition 4, respectively, and for each case, the simulation of the evolutionary game is carried out for 20 times, and the results of the evolutionary simulation are shown in Fig. 5.
| Parameter | k1 | C2 | d | C3 | p1 | C | m | a | n | k2 |
|---|---|---|---|---|---|---|---|---|---|---|
| 1 | 1 | 5 | 80 | 100 | 200 | 40 | 50 | 0.5 | 50 | 1 |
| 2 | 1 | 2 | 80 | 200 | 200 | 40 | 50 | 0.5 | 50 | 1 |
| 3 | 1 | 10 | 100 | 80 | 200 | 40 | 50 | 0.5 | 100 | 1 |
| 4 | 1 | 10 | 30 | 100 | 200 | 40 | 50 | 0.5 | 80 | 1 |
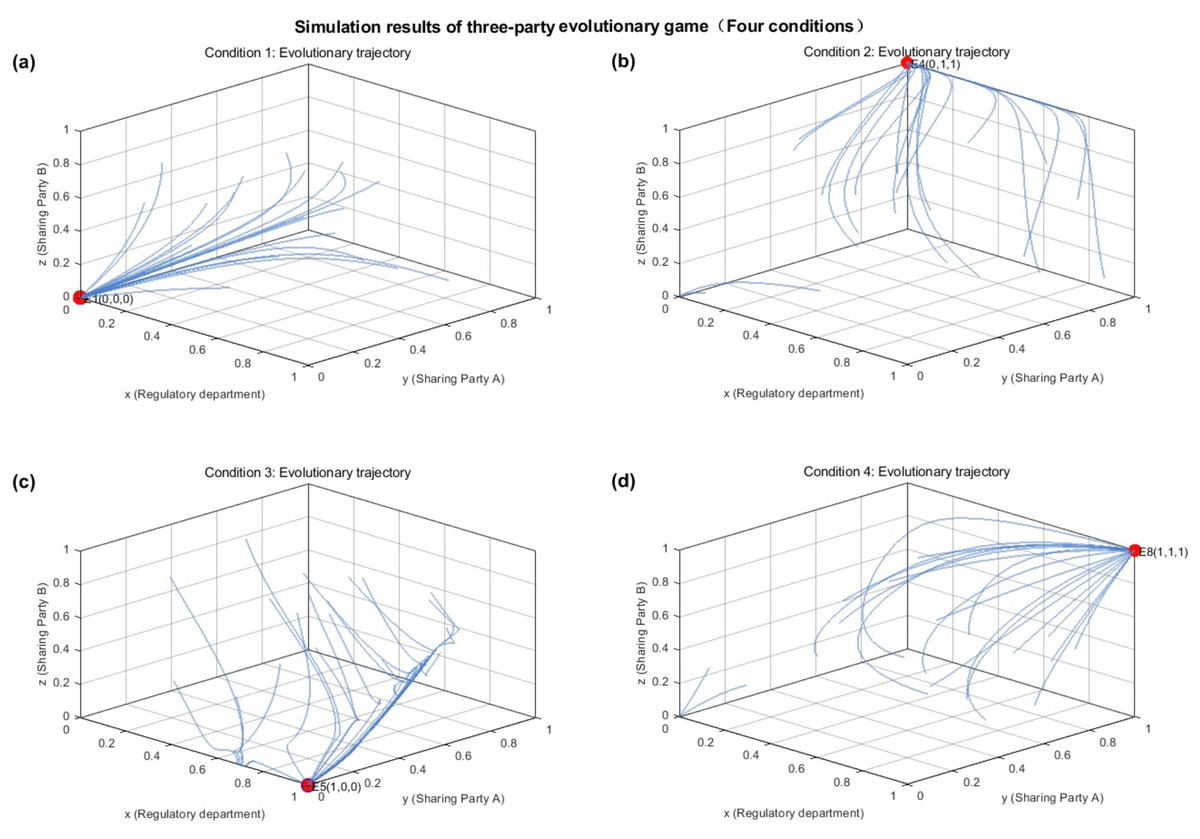
Figure 5: Simulation results of the three-party evolutionary game under four different parameter conditions.
Evolutionary trajectories from 20 random initial states, demonstrating convergence to the four distinct Evolutionary Stable Strategies (ESS) based on the parameters in Table 5. (A) Condition 1: Trajectories converge to the stable point E1(0, 0, 0). (B) Condition 2: Trajectories converge to the stable point E4(0,1,1). (C) Condition 3: Trajectories converge to the stable point E5(1, 0, 0). (D) Condition 4: Trajectories converge to the stable point E8(1, 1, 1). The axes represent the strategy probabilities for the regulatory department (x), sharing party A (y), and sharing party B (z).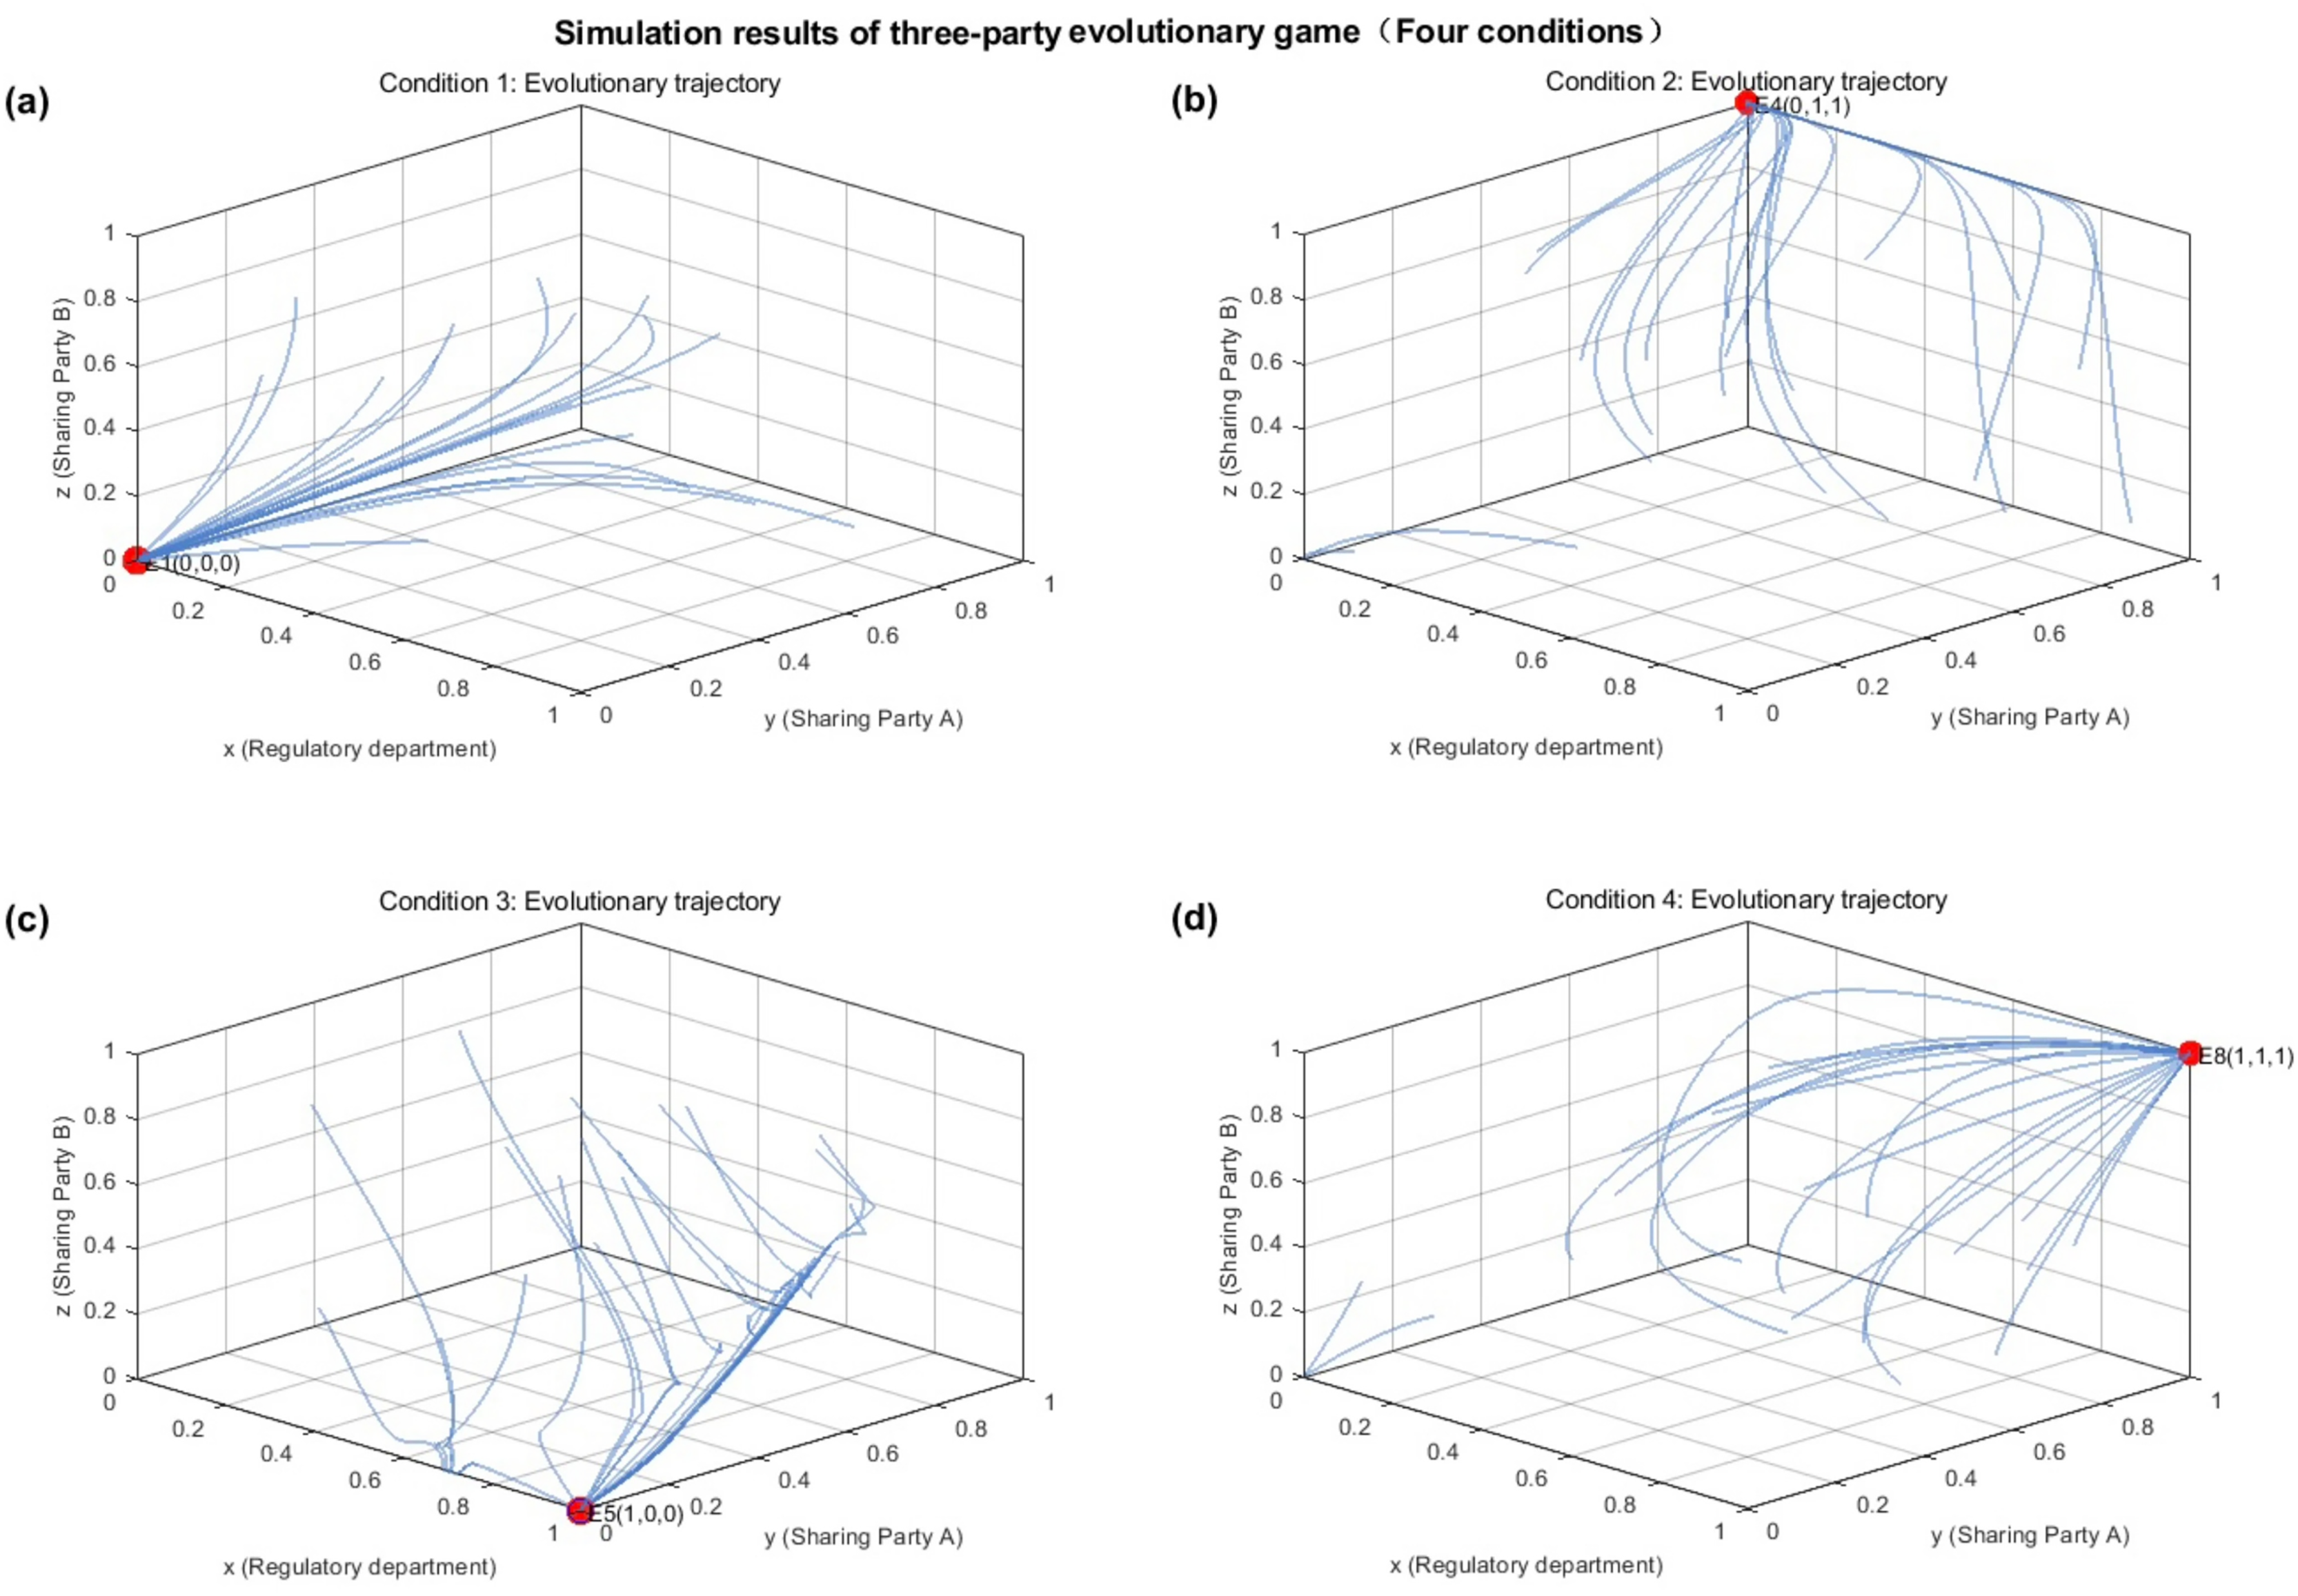
Figure 5A shows through the assignment of parameters, when the conditions of , are satisfied, the evolution direction of x, y, z is x tends to 0, y tends to 0, z tends to 0, respectively, and the evolution direction is consistent with the analysis results in Condition 1. In the case of satisfying the condition of Condition 1, the system will evolve in the direction of the point and tends to be stabilized, i.e., the current evolutionary stabilization strategy is {non-strict regulation, honest sharing, honest sharing}, Fig. 5B shows when the conditions of , and are satisfied, the evolution direction of x, y, and z is that x tends to 0, y tends to 1, and z tends to 1, respectively, and the evolution direction is consistent with the analysis results in Condition 2, and in the condition of Condition 2 is satisfied, the system will evolve in the direction of the point and tends to be stabilized, i.e., the current evolution stabilization strategy is {non-strictly regulated, honestly sharing, honest sharing}.
Figure 5C through the assignment of parameters, when the conditions of , are satisfied, the evolution direction of x, y, and z is x tends to 1, y tends to 0, and z tends to 0, respectively, and the evolution direction is in line with the analysis results in Condition 3, in the case of satisfying Condition 3, the system will evolve towards the point and tend to be stabilized, i.e., the current evolutionary stabilization strategy is {strict regulation, non-honest sharing, non-honest sharing}. Figure 5D shows when the parameters satisfy , and , the evolution direction of x, y and z is x tends to 1, y tends to 1 and z tends to 1, respectively, and the evolution direction is consistent with the analysis of condition 4, and in the case of satisfying condition 4, the system will evolve and stabilize towards the point , i.e., the current evolution stabilization strategy is {Strict Regulation, Honest Sharing, Honest Sharing}.
Figure 5 illustrate the evolutionary simulation results of the initial parameter settings to verify the validity of the blockchain-based tripartite evolutionary game stability analysis of railway disaster prevention and monitoring data sharing proposed in this article, where the system can dynamically regulate the parameters through the smart contract and the numerical relationship of the variables affects the evolutionary stability strategy of the railway disaster prevention and monitoring data sharing, which carries out the honest and active participation of railway disaster prevention and monitoring platforms in the data sharing process.
Analysis of parameters related to railway monitoring data sharers A and B
This section focuses on exploring the impact of different parameters on the specific incentive process of sharing railway disaster prevention and monitoring data. For the railway disaster prevention data sharing parties A and B, it mainly explores the impact of the parameters k related to the credibility value, as well as the masking cost N on the evolutionary game process. For the regulator, it mainly explores the impact of the cost C3 of strict supervision by the platform and the benefit D of strict supervision by the platform on the evolutionary game process.
Analysis of parameters related to creditworthiness
For the railway monitoring data platform, this section focuses on exploring the parameter of the reputation value Rep off, and the impact of illegal gains and cover-up cost on the evolutionary game process with the railway disaster prevention data monitoring platforms A, B. The experimental parameters in this section are set as , . Keeping other parameters unchanged, changing the value of , and observing the influence of the change of reputation value on the evolution process of railway monitoring data platform A. The experiments on in this section are divided into three parts, and the value intervals of are {0.8, 1, 1.2}, {1, 1.2, 1.6}, {0.4, 0.6, 0.8} in the simulation process of this section. Explore the effect of these three cases on the evolutionary game process, and set the parameters in such a way that both the three values in the credibility value Rep below 0.5, the three values above 0.5, and the three values above and below 0.5 are taken, set up the three control groups, and combine the three-dimensional and two-dimensional evolutionary processes, to make the simulation of the more adequate and more comprehensive.
It can be obtained from Fig. 6A that in the case where takes the value of {0.8, 1, 1.2}, which corresponds to the Rep reputation value of {0.4, 0.5, 0.6}, and from Fig. 6A, it can be obtained that in the case where the value equals to 1 and 1.2, which corresponds to the scenarios where Rep reputation values are 0.5 and 0.6, the nodes with high reputation value tends to be in the evolutionarily stable state of {1, 0, 0} when the reputation value is larger than 0.5, the because the current situation has low masking cost and high cost of strict regulation by the platform, nodes with high reputation value tend to be tightly regulated by the system, while they may increase their revenue through dishonest behaviors. In Fig. 6B the node with value of 0.8 tends to {1, 1, 1} evolutionary stable state, the current system honest sharing transaction gain is high, low reputation node tends to continue to carry out honest sharing to improve their reputation value, so as to maximize their revenue. The system nodes can dynamically adjust the relevant system parameters at this time, such as continuing to increase the honest sharing gains, increase the cost of masking and so on to continue to promote the nodes to carry out honest data sharing. Through the right diagram of Fig. 6B, it can be obtained that in the case of k1 taking the value of {1, 1.2, 1.6}, corresponding to the Rep reputation value of {0.5, 0.6, 0.8}, at this time, all the nodes involved in the evolution of the nodes with high reputation value, due to their evolutionary incentives for the gain has been sufficient, and the masking cost is low, the nodes are inclined to {strict regulation, non-honest sharing, non-honest sharing} of the evolution of the stable state, and the higher the value of k1 the tendency to {1, 0, 0} is stronger.
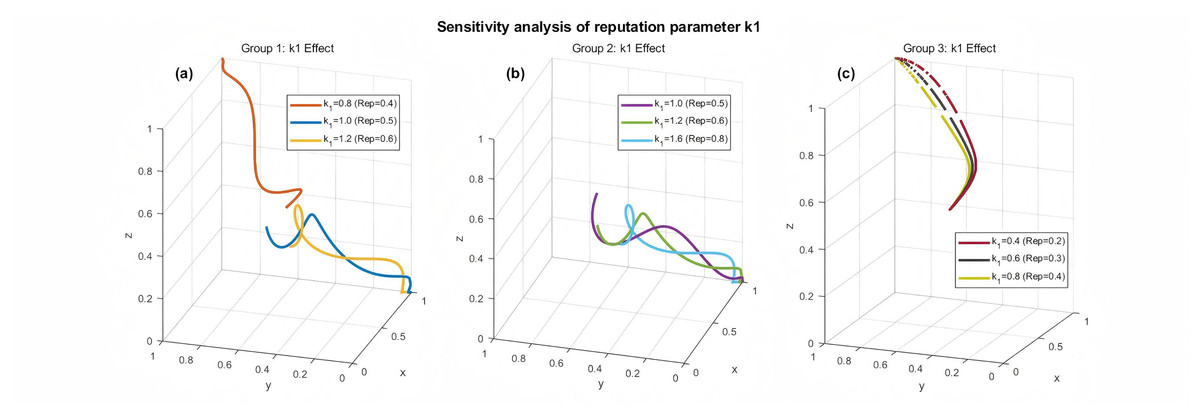
Figure 6: Sensitivity analysis of the reputation parameter k1 on the system’s evolutionary trajectory.
Simulation results showing the impact of varying the reputation-related parameter k1 (where Rep = k1/2) on the evolutionary path. The simulations are divided into three groups based on different base parameters. (A) Group 1: k1 values of {0.8, 1.0, 1.2}. (B) Group 2: k1 values of {1.0, 1.2, 1.6}. (C) Group 3: k1 values of {0.4, 0.6, 0.8}. Different colors and line styles represent different k1 values, demonstrating how reputation value significantly affects the final stable strategy.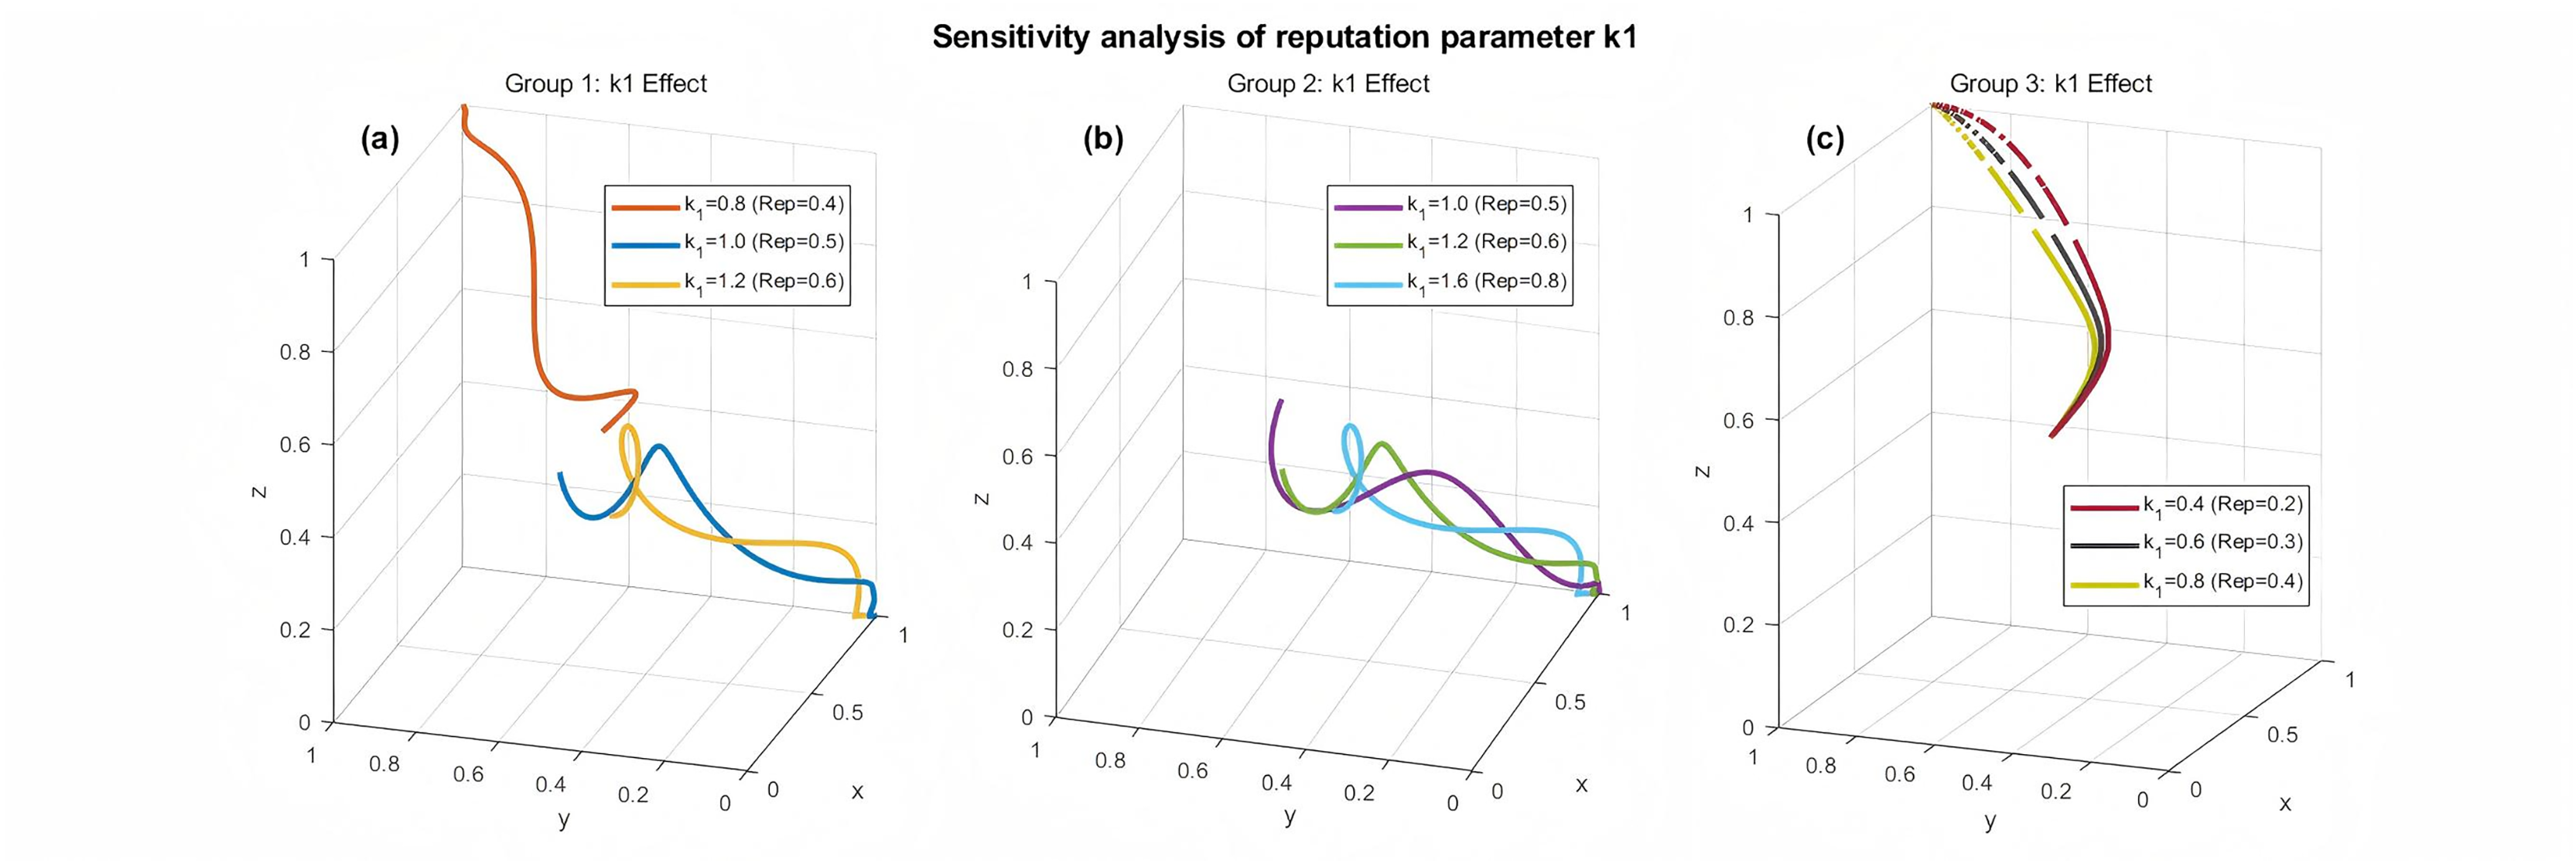
As can be seen from Fig. 6C, when k1 takes the value of {0.4, 0.6, 0.8}, corresponding to the Rep reputation value of {0.2, 0.3, 0.4}, due to the current situation of carrying out honest data sharing based on the higher gains, for the nodes with low reputation value due to the lower reputation value, the additional gains based on honest data sharing is lower, the nodes tend to improve their reputation by carrying out honest sharing value, to obtain more honest sharing gains, so the nodes tend to {strict regulation, honest sharing, honest sharing} evolutionary stable state, and the lower the value of k1, the tendency to {1, 1, 1} is stronger, the system at this time can carry out a positive intervention, prompting these low-reputation-value nodes to participate in the honest data sharing many times, to improve their gains and improve the node’s reputation value.
Analysis of parameters related to dishonest gains and masking costs
For the railway disaster prevention data monitoring platform, this section focuses on exploring the impact of the illicit gains N from dishonest sharing conducted by the disaster prevention data monitoring platform on the evolutionary game process, as N involves the masking cost of the nodes to conduct dishonest sharing. The experiments in this section set up two groups with different parameter settings as a control, and the base parameters of the two groups are: k1 = 1, C2 = 50, D = 60, C3 = 50, p1 = 200, C = 40, m = 100, a = 0.5, n = 50, k2 = 1; Keeping the other parameters constant and varying the value of N, the effect of the parameters of the illegal gains of the nodes on the evolutionary process. This section of the experiment is divided into two groups, the first group of parameter settings only satisfies condition four, the second group of parameter settings meets the conditions of condition three and condition four, to explore in the evolutionary direction tends to {1, 1, 1} and {1, 0, 0} direction of the process of the three values of N on the process of the evolutionary game, the first group of N value setting interval are {50, 70, 100}, the second group of N value setting interval are {100, 150, 200} setting three control groups.
As can be seen from Fig. 7, under the condition of satisfying condition four, i.e., the direction of the evolutionary game tends to {1, 1, 1}, and the evolutionary strategy is {strict regulation, honest sharing, honest sharing}, no matter the value of N is taken to be any one of the values of {50, 70, 100}, the direction of the system’s evolution tends to be {1, 1, 1}, and as can be seen in Fig. 7, the bigger the value of N is, the less the nodes tend to evolve in the direction of {1, 1, 1}, this is because the larger the value of N, the node’s gain from dishonest sharing increases, all other things being equal, nodes with larger values of N may tend to share dishonestly, while nodes with smaller values of N may tend to share honestly because the gain from dishonest sharing is relatively low, and at the same time, they have to pay the corresponding penalties.
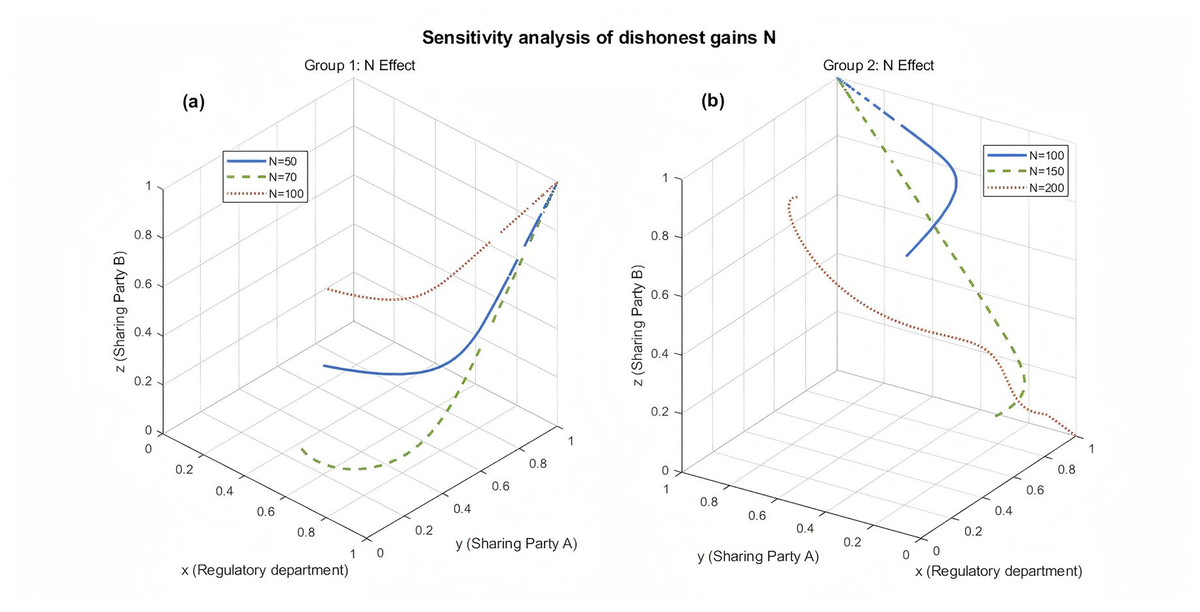
Figure 7: Sensitivity analysis of the dishonest gain parameter N on the system’s evolutionary trajectory.
Simulation results showing the impact of varying the dishonest gain parameter N on the evolutionary path. (A) Group 1 analysis with N values of {50, 70, 100} under one set of base parameters. (B) Group 2 analysis with N values of {100, 150, 200} under a second set of base parameters. Different colors and line styles represent different N values, demonstrating how high illicit gains can destabilize honest cooperation and shift the system to a dishonest stable strategy.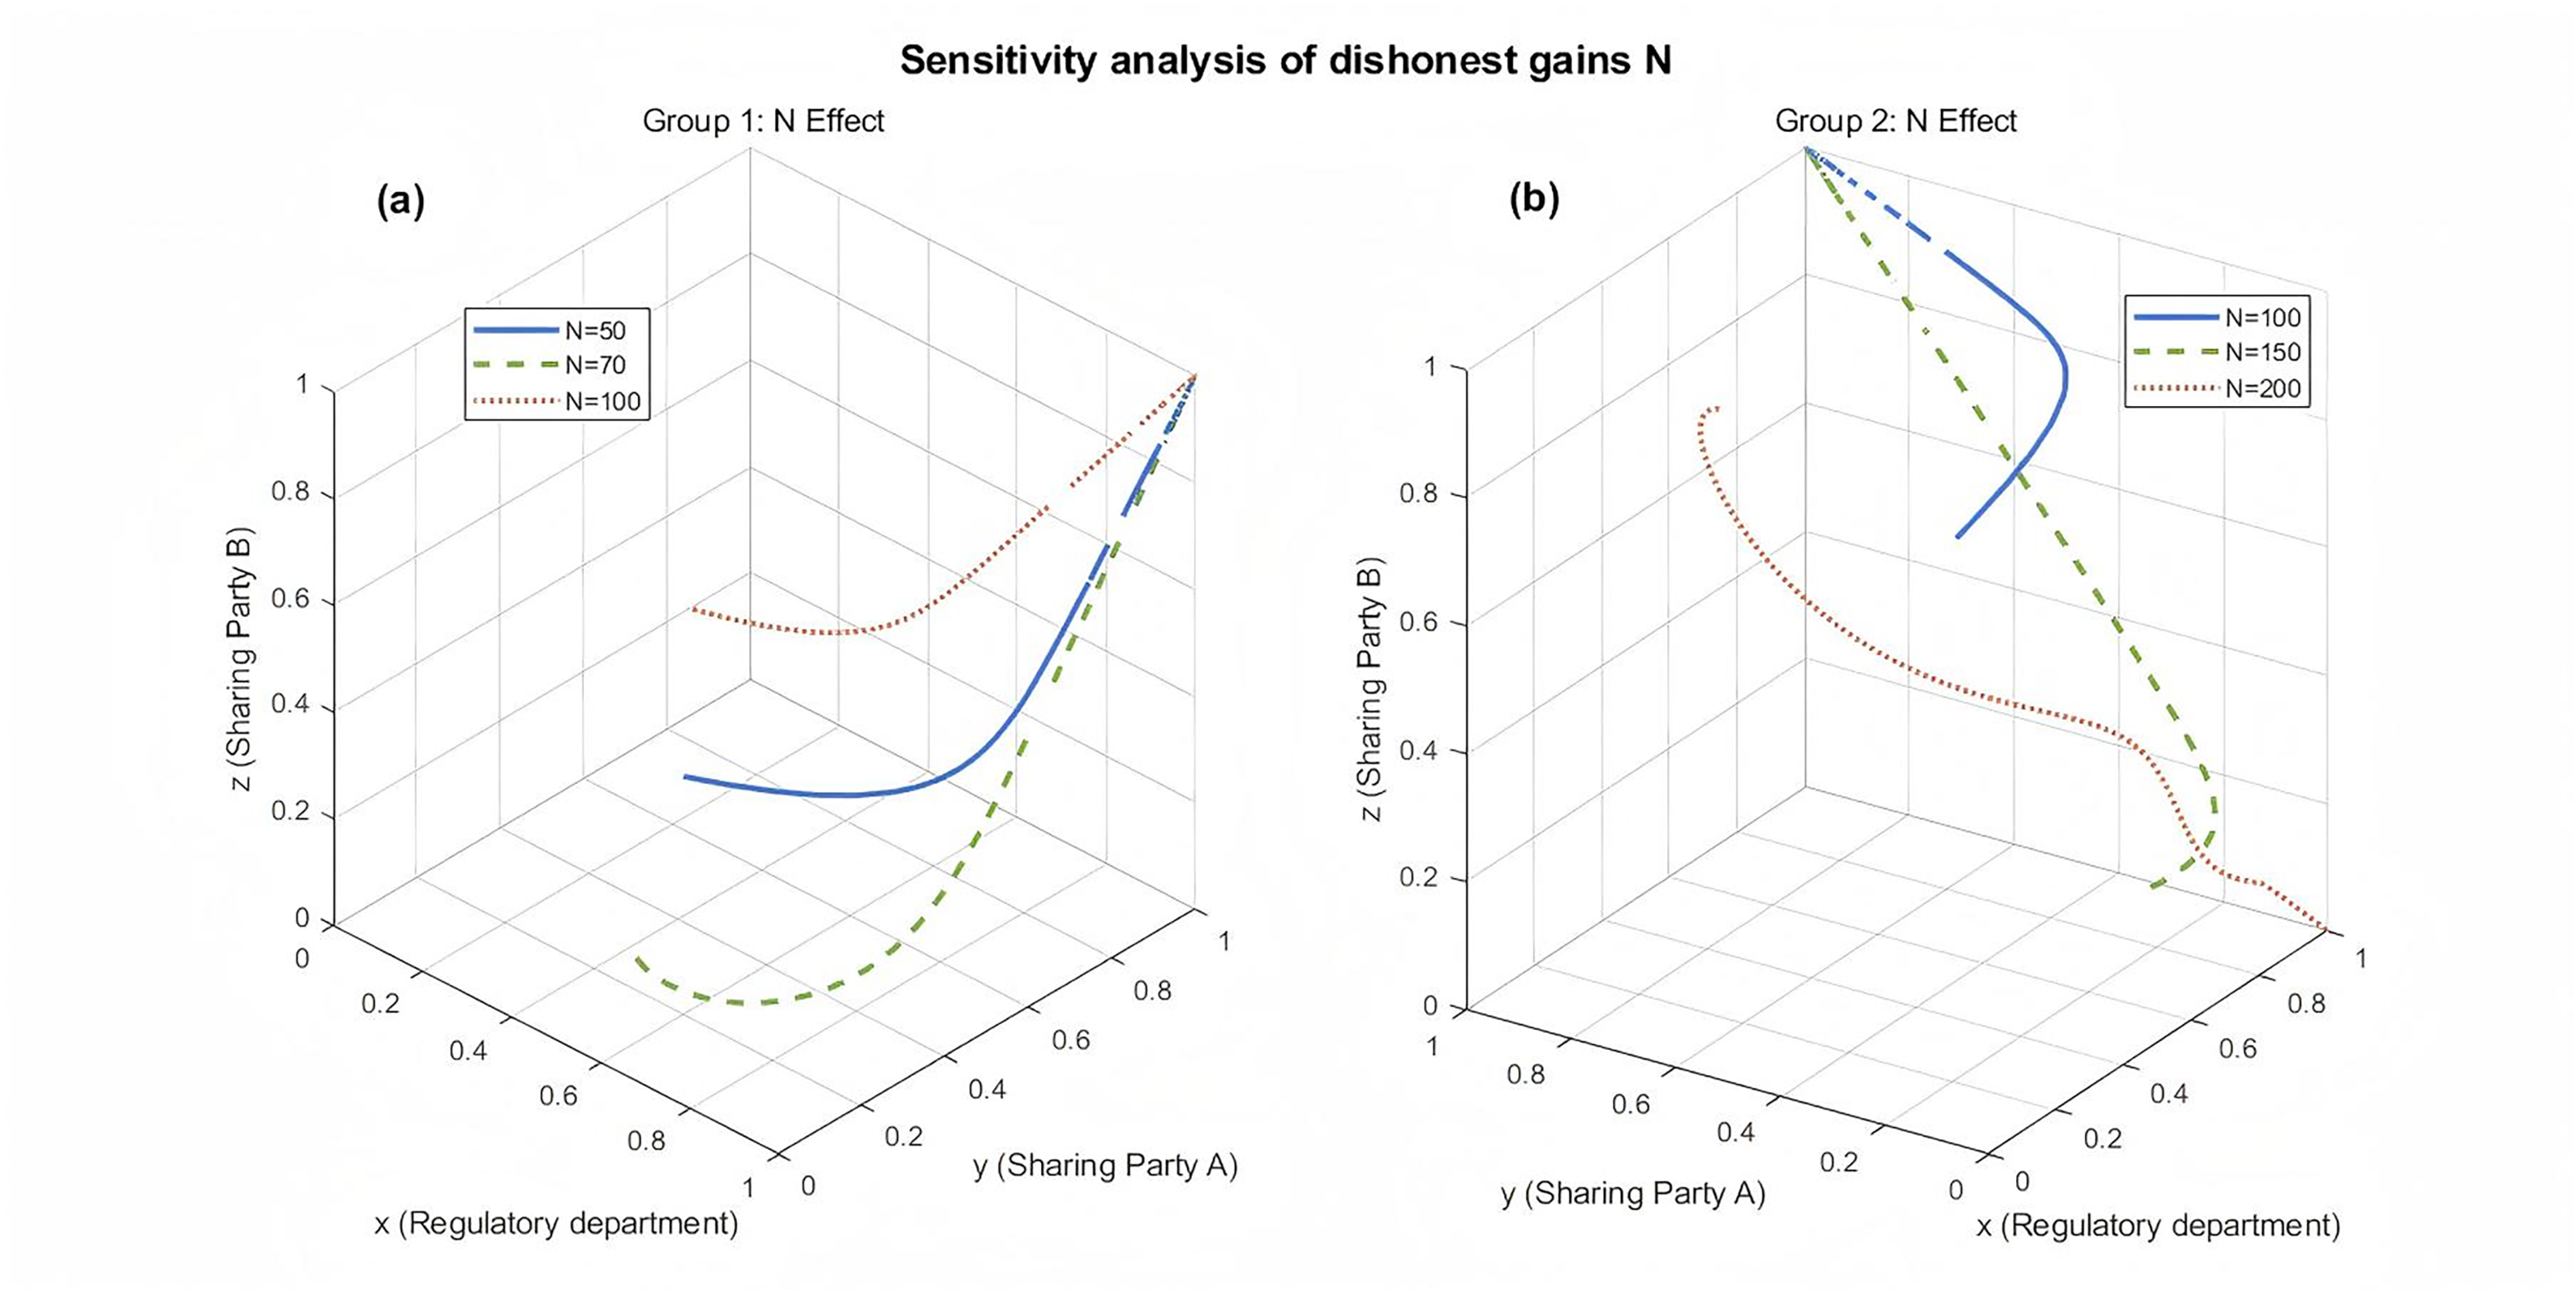
When the set of parameters is set with different N values in satisfying condition four that is the direction of the evolutionary game tends to {1, 1, 1}, in satisfying condition three the direction of the evolutionary game tends to {1, 0, 0}, at N = 100 and 150 and and is consistent with the analytical results of Fig. 7 and N = 150 tends to be more slowly evolved than N = 100, which also agrees with the analytical process of Fig. 7. When N = 200, the direction of evolutionary game tends to {1, 0, 0}, which is because the node’s gain from performing dishonest sharing is large enough that it has exceeded the sum of the cover-up cost and the loss of the other party performing dishonest sharing, so the node tends to perform dishonest sharing to maximize the node’s gain. However, if the node carries out dishonest sharing for a long time, on the one hand, it is detrimental to its reputation value, and in the long run, it is also harmful to the revenue of the whole system. At this time, the system must modify the parameters, which can be adjusted to adjust the value of N or adjust the extra revenue of the node based on its reputation value to incentivize nodes to carry out honest data sharing, and to achieve the maximization of the nodes and the whole data-sharing incentive system.
Parametric analysis of regulatory sector-related benefits
For the railway regulator, this section focuses on exploring the impact of the gains D from strict regulation by the platform on the evolutionary game process. Two sets of experiments with different parameter settings are set up as controls in this section. the first set of parameters are: k1 = 1, C2 = 50, D = 50, C3 = 20, p1 = 200, C = 40, m = 50, a = 0.5, n = 80, k2 = 1. The second set of experiments are set up with the following parameters: k1 = 1, C2 = 30, D = 50, C3= 20, p1 = 200, c = 40, m = 50, a = 0.5, n = 80, k2 = 1; keep the other parameters unchanged, change the value of d, and observe the effect of the platform’s revenue parameters on the evolutionary process after strict regulation. The experiments in this section are divided into two groups, the parameter settings of the first group only satisfy condition three, and the parameter settings of the second group satisfy condition two and condition three, to explore the influence of three values of d on the evolutionary game process in the process of the evolutionary direction converging to the direction of {1, 1, 1} and {1, 0, 0}, and the d values of the two groups are set in the interval of {50, 100, 150}, and three control groups are set up to combine with the three-dimensional evolutionary diagrams, so as to make the simulation of d simulation more fully and comprehensively.
It can be seen that under the condition of satisfying condition three from Fig. 8A, i.e., the direction of the evolutionary game tends to {1, 1, 1}, and the evolutionary strategy is {Strict Regulation, Honest Sharing, Honest Sharing}, no matter the value of D is taken to be any one of the values of {50, 100, 150}, the direction of the system’s evolution is tending to {1, 1, 1}, and as the value of D increases, the nodes in the evolutionary game tend to {1, 1, 1} The trend is stronger, while the difference in the speed of convergence to {1, 1, 1} is not very obvious when D increases to a certain degree, which can be shown that the system can prompt the platform to carry out strict supervision by adjusting the platform’s revenue D after the platform is strictly supervised, thus prompting honest data sharing between railway monitoring platforms, while D can be adjusted to a certain value and then does not need to be increased, because in Fig. 8A The trend of evolution is close to the same when D is taken as 100, 150, and the convergence speed is obviously faster compared to D = 50, i.e., the system can reach a certain threshold by increasing D to prompt the platform to carry out strict supervision, and the nodes in the system will also converge towards the evolution direction of the ESS quickly, so as to provide more adequate theoretical support for the system to dynamically regulate the parameters.
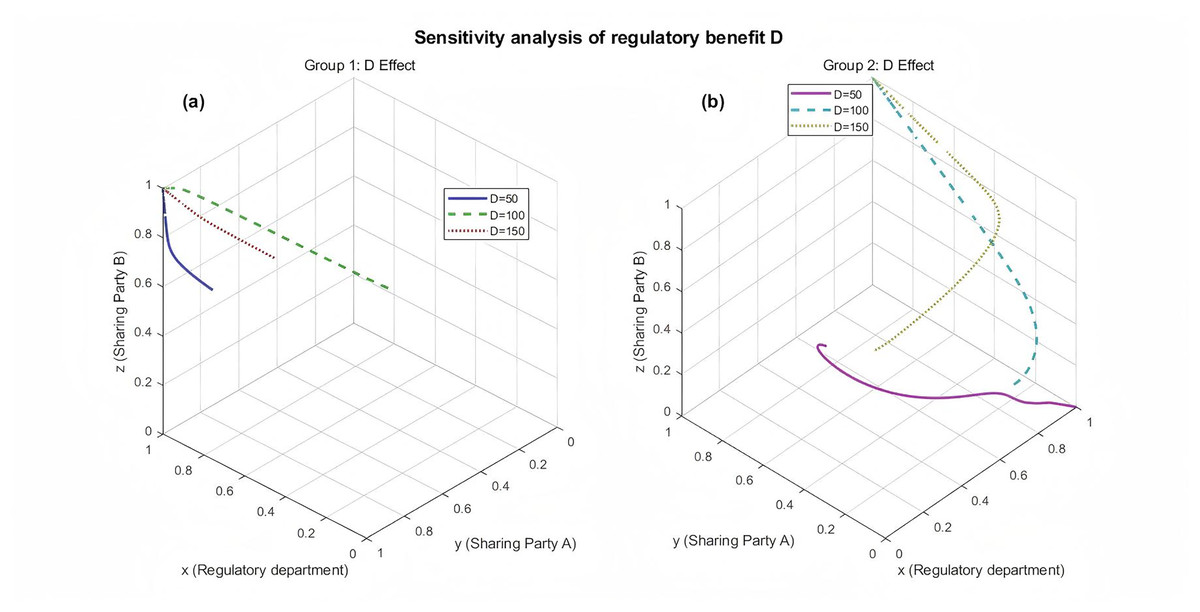
Figure 8: Sensitivity analysis of the regulatory benefit parameter D on the system’s evolutionary trajectory.
Simulation results showing the impact of varying the regulatory benefit parameter D on the evolutionary path. (A) Group 1 analysis with D values of {50, 100, 150} under one set of base parameters. (B) Group 2 analysis with D values of {50, 100, 150} under a second set of base parameters. Different colors and line styles represent different D values, demonstrating how increasing the regulator’s own incentives (D) is crucial for motivating strict supervision and achieving a stable, honest-sharing state.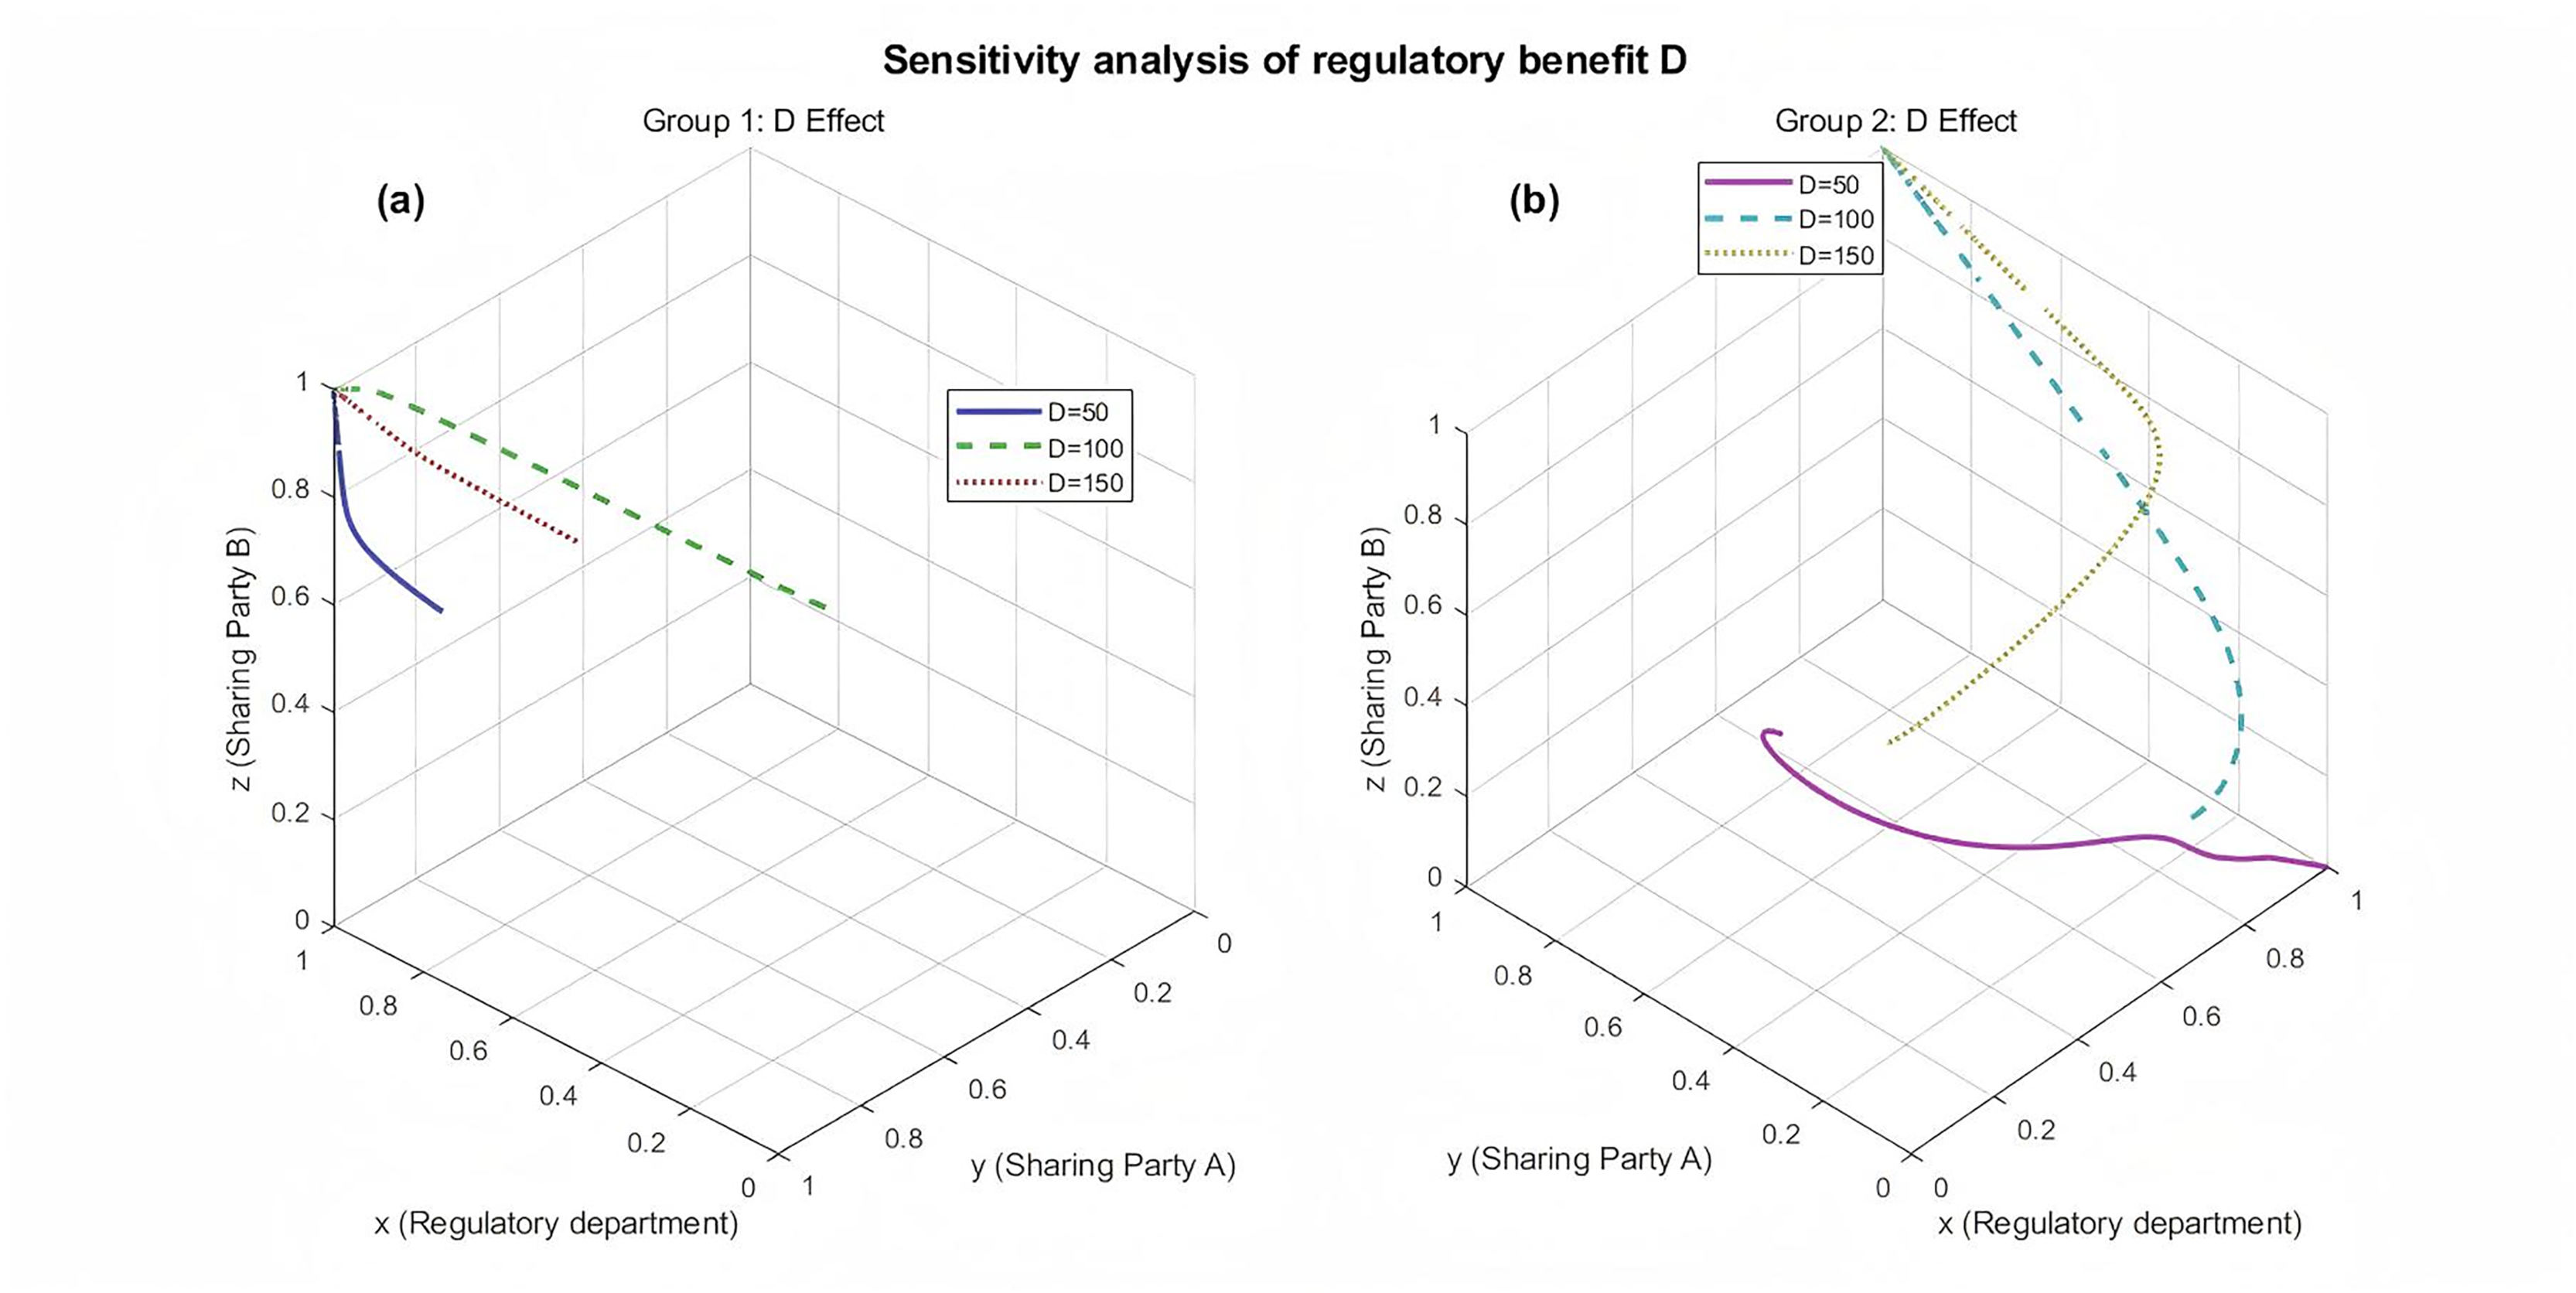
It can be known from Fig. 8B, the group of parameter settings with different D values in the satisfaction of condition three that is, the direction of the evolutionary game tends to {1, 1, 1}, in the satisfaction of condition two, the direction of the evolutionary game tends to {1, 0, 0}, in the D = 100 and 150 time and with the results of the second group of analysis are consistent with the second group of results are similar convergence of the speed of evolution, tends to {1, 0, 0}, the evolutionary strategy for the {strict regulation, honesty sharing, honest sharing}. When D = 50, the parameter setting satisfies condition two, i.e., the evolution direction tends to {1, 0, 0}, and the evolution strategy is {strict regulation, non-honest sharing, non-honest sharing}, which indicates that the nodes of the evolutionary game tend to non-honest sharing when the platform’s gain from strict regulation is very low. The second set of results illustrates that changing the value of D can change the node selection strategy within the evolutionary game system, and the system can be changed by changing the platform’s strictly regulated revenue D dynamically regulates the stable direction of evolution. If the nodes within the platform maintain the evolutionary direction in the figure for a long time, the strategy combination is not beneficial either to the system as a whole or to the gains of the nodes of the railway disaster prevention and monitoring, at this time, the system is required to modify the parameters, to dynamically regulate the strategy and direction of the evolution, and to motivate the nodes to carry out honest data sharing, to achieve the maximization of the gains of the whole and the nodes of the two parts of the system.
Smart contract design based on three-party evolutionary games
To ensure the incentive mechanism proposed in this article can be executed automatically, transparently, and tamper-proof, we encapsulate the three-party game model and reputation mechanism into a smart contract. The contract’s program code is deployed on the blockchain to coordinate the actions of regulators and data-sharing parties A and B. Its core logic comprises the following key components:
-
(1)
Initialization and parameter configuration: The contract is deployed by the regulator (Management C), which is responsible for initializing system parameters stored in array U (such as , etc.).
-
(2)
Transaction triggering and reward settlement: The core functionality of the smart contract is implemented by the ‘completeTransaction’ function. This function is triggered under the following conditions: When the regulator completes an off-chain evaluation of a data sharing interaction, it calls this function and submits the behaviors of sharing parties A and B (‘isA_Honest’, ‘isB_Honest’) along with its own regulatory strategy (‘isStrictReg’).
-
(3)
Automatic execution: Once triggered, the contract will immediately read parameters from storage and automatically calculate and settle each party’s rewards and penalties in strict accordance with the payoff logic specified in Table 2 (Evolutionary Game Payoff Matrix).
-
(4)
Reputation dynamic update: After profit settlement, the contract automatically invokes the internal function ‘updateReputation’. This function updates the participants’ ‘successCount’ and ‘totalCount’ counters based on the Beta distribution model defined in ‘Reputation Modeling’, and recalculates their reputation values .
-
(5)
Dynamic parameter adjustment: The contract provides the ‘platformAdjustment’ function, enabling regulators to dynamically adjust parameters within U based on the system’s current macro state (such as the honestSharingRatio). This guides the system toward convergence to the desired Evolutionarily Stable Strategy (ESS).
The detailed contract pseudocode is shown in Table 6. Through this design, the theoretical model is transformed into credible code logic, ensuring the effective implementation of the incentive mechanism.
| Algorithm 1 Smart contract |
|---|
| Input: _U(System parameter array), addrA, addrB, isA_Honest, isB_Honest, isStrict |
| Output: Success or Error |
| Function Initialization(_U):{ |
| regulator = Get_Transaction_Sender(); |
| Contract.U = _U; return success} |
| Function completeTransaction(addrA, addrB, isA_Honest, isB_Honest, isStrict): |
| If Get_Transaction_Sender() != regulator Then Return Error |
| (rewardA, rewardB) = Internal_CalculateRewards(isA_Honest, isB_Honest, isStrict, Contract.U) |
| Call Internal_UpdateReputation(addrA, isA_Honest); |
| Call Internal_UpdateReputation(addrB, isB_Honest);return success;} |
| Function platformAdjustment(_newU):{ |
| If Get_Transaction_Sender() != regulator Then Return Error |
| Contract.U = _newU; return success} |
Conclusion
This article validates the model’s effectiveness through simulation analysis and draws key conclusions: Illegal gains emerge as the primary negative factor driving the system toward dishonest sharing; Regulators’ own returns must be sufficiently high to incentivize them to fulfill their “strict oversight” responsibilities. These findings indicate that a successful railway data sharing system must be dynamic, not only rewarding and penalizing sharing parties but also designing explicit incentive mechanisms for regulators. The smart contract framework designed in this article provides automated and tamper-proof technical safeguards to achieve this dynamic, trustworthy incentive loop, ultimately promoting high participation rates and maximized returns within the system. Future work should focus on validating the model using real railway operational datasets to enhance its credibility in practical applications. Additionally, further research could explore the deployment costs (gas fees) and performance of smart contracts on specific blockchain platforms.
Supplemental Information
MATLAB function for the sensitivity analysis of the dishonest gain parameter N.
This function performs the sensitivity analysis for the dishonest gain parameter N (corresponding to Figure 7 in the manuscript). It defines base parameters and two groups of N values. For each group, it runs 10 simulations with random initial conditions for each N value, solving the ODEs defined in the local evolutionary_dynamics_N function. The primary output is a 1x2 subplot figure showing the 3D evolutionary trajectories. An additional function generate_N_2D_analysis plots the 2D time-series evolution for each strategy.
MATLAB function for the sensitivity analysis of the regulatory benefit parameter D.
This function performs the sensitivity analysis for the regulatory benefit parameter D (corresponding to Figure 8 in the manuscript). It defines two different sets of base parameters (params1 and params2) and a set of D values {50, 100, 150}. It runs 10 simulations with random initial conditions for each D value under both parameter sets, solving the ODEs in the local evolutionary_dynamics_D function. The main output is a 1x2 subplot figure showing the 3D trajectories. It also includes functions to plot the 2D time-series evolution.
MATLAB function for the sensitivity analysis of the reputation parameter k1.
This function performs the sensitivity analysis for the reputation parameter k1 (corresponding to Figure 6 in the manuscript). It defines a set of base parameters and three distinct groups of k1 values to be tested. For each group, it simulates the evolutionary trajectory from a fixed initial state ([0.5, 0.5, 0.5]) for each k1 value, using the ODEs defined in the local evolutionary_dynamics_k1 function. The output is a 1 × 3 subplot figure showing the 3D trajectories for each group. It also includes a function to generate 2D projections of the final stable points.
MATLAB function to analyze and visualize the Beta reputation mechanism.
This function generates the visualizations for the Beta reputation model (Figure 2). It contains a local function plot_beta_distribution that plots the probability density function (PDF) for given ’a’ (honest) and ’b’ (dishonest) counts and calculates the corresponding reputation (Rep) value. The main function calls this to create the 1x2 subplot for Figure 2. It also includes additional functions for a deeper sim
Main MATLAB script for simulating the four-condition three-party evolutionary game.
This MATLAB script defines the four primary parameter sets (params 1-4) corresponding to the four stability conditions discussed in the article. It then runs 20 simulations with random initial conditions for each parameter set, solving the ODEs defined in the local evolutionary_dynamics function. The primary output is a 2 × 2 subplot figure showing the 3D evolutionary trajectories (Figure 5). The script also subsequently calls generate_2D_evolution_plots(),
MATLAB function to perform stability analysis of the evolutionary game model’s equilibrium points.
This function calculates the stability of the eight equilibrium points (E1 to E8) for a given set of parameters. It takes a parameter structure (params_for_condition) as input. The script computes the Jacobi matrix (compute_jacobian function) and its eigenvalues (eig) at each point, then determines if the point is an Evolutionary Stable Strategy (ESS) by checking if all eigenvalue real parts are negative. It also generates a visualization of the stability results and checks which of the article’s four theoretical conditions are met.
Master MATLAB script to run all simulations and generate all figures for the study.
This is the main runnable script for the entire simulation study. It initializes by clearing the workspace, defines the four sets of parameters (for Condition 1, 2, 3, and 4), and then sequentially calls all necessary functions to (1) analyze the Beta reputation mechanism (beta_reputation_analysis.m), (2) run the main 3D evolutionary game simulations (local function run_main_simulation), (3) perform stability analysis (stability_analysis.m), and (4) conduct sensitivity analyses for the k1, N, and D parameters. This script contains the local functions run_main_simulation and evolutionary_dynamics and will reproduce all simulation figures (Figures 2, 5-8) and save them to a ’results’ folder.
Influence of Reputation Value Parameter (k₁) on Evolutionary Stability.
This corresponds to the analysis in section "Analysis of parameters related to creditworthiness" and the results depicted in Figures 7 and 8. It shows how the evolutionary direction changes based on the reputation parameter k₁ (where k₁ = 2 * Rep).
Influence of Dishonest Gains Parameter (N) on Evolutionary Stability.
This corresponds to the analysis in section "Analysis of parameters related to dishonest gains and masking costs" and the results depicted in Figure 9. It demonstrates the impact of varying the illicit gains (N) from dishonest sharing on the system’s evolution.
Influence of Regulatory Benefit Parameter (D) on Evolutionary Stability.
This corresponds to the analysis in section "Parametric analysis of regulatory sector-related benefits" and the results depicted in Figure 10. It shows how the platform’s gains (D) from performing strict regulation affect the evolutionary outcome.