
The advantages of our proposed Saturn coefficient over continuity and trustworthiness for UMAP dimensionality reduction evaluation
- Published
- Accepted
- Received
- Academic Editor
- Siddhartha Bhattacharyya
- Subject Areas
- Computational Biology, Algorithms and Analysis of Algorithms, Data Mining and Machine Learning, Data Science
- Keywords
- UMAP, Dimensionality reduction, Uniform manifold approximation and projection, Result evaulation
- Copyright
- © 2026 Chicco et al.
- Licence
- This is an open access article distributed under the terms of the Creative Commons Attribution License, which permits unrestricted use, distribution, reproduction and adaptation in any medium and for any purpose provided that it is properly attributed. For attribution, the original author(s), title, publication source (PeerJ Computer Science) and either DOI or URL of the article must be cited.
- Cite this article
- 2026. The advantages of our proposed Saturn coefficient over continuity and trustworthiness for UMAP dimensionality reduction evaluation. PeerJ Computer Science 12:e3424 https://doi.org/10.7717/peerj-cs.3424
Abstract
Understanding the structure of a dataset is an easy task when the dimensions are two or three, but it can become extremely difficult when a dataset consists of tens, hundreds, or thousands of variables. Dimensionality reduction methods are computational techniques with solid mathematical foundations that allow for the projection of high-dimensional datasets into smaller data spaces. These low-dimensional representations of the original data, usually consisting of two variables, can then be plotted and inspected by researchers to gain an understanding of the original data structure. Uniform Manifold Approximation and Projection (UMAP) is one of the most effective and popular algorithms for dimensionality reduction, and has been proven effective on biomedical datasets, in particular. Even though UMAP is commonly utilized by thousands of researchers worldwide, no consensus has been reached on how to assess the output of dimensionality reduction informatively: to date, researchers often evaluate UMAP’s outcomes by eyeballing its two-dimensional plots each time. Of course, this approach is rather arbitrary, as different individuals might interpret a 2D plot in a different way. Some numerical coefficients for assessing UMAP’s conservation of global and local structure exist (continuity and trustworthiness, respectively), but they suffer from several flaws and can be misleading in multiple cases. To address these issues, we present here our Saturn coefficient, a new simple statistical metric that expresses the conservation of local structure and the conservation of global structure in UMAP through a real value ranging from 0 (no preservation) to 1 (complete preservation). In this study, we describe the rationale behind our Saturn coefficient and validate its results compared to continuity and trustworthiness on four artificial datasets and ten real-world biomedical datasets. Additionally, we propose a novel validation procedure based on the preservation of the clusters found by HDBSCAN (hierarchical density-based spatial clustering of applications with noise) in the original dataset within its dimensionality reduction representation (HDBSCANess). Our results demonstrate the validity of our Saturn coefficient across all artificial datasets and in seven out of fifteen real-world biomedical datasets. We therefore recommend the use of our Saturn coefficient to anyone wishing to assess UMAP results: our statistic, for example, can be used to test several sets of UMAP hyperparameters and to select the best configuration among them. Moreover, we also provide the software implementation of our Saturn coefficient as a standalone R package openly available on CRAN at https://doi.org/10.32614/CRAN.package.SaturnCoefficient. SaturnCoefficient and as a standalone Python package openly available on PyPI at https://pypi.org/project/SaturnScore.
Introduction
Background. When a series of data points contain only one dimension, a straight line in a 1D space is sufficient to represent them. When the data is made of two dimensions, a line in a Cartesian bidimensional space can be sufficient for their representation. If the data consists of three variables, a heatmap can be an effective way to visualize its content. Modern data science even provides tools to get useful 4D, 5D, and 6D representations which can help understand the inner structure of a dataset (Ostwal, 2019).
However, when the dataset consists of tens, hundreds, or thousands of variables, it is impossible to have a complete visualization of all its internal structure. To solve this problem, scientists have invented a series of computational-mathematical methods for dimensionality reduction (DR), which project the “most important” components of a dataset from its original high-dimensional space to a low-dimensional space, by trying to preserve its original structure (Nguyen & Holmes, 2019; Wani, 2025). Dimensionality reduction methods are particularly suitable and common in bioinformatics, especially when single-cell RNA-seq data are involved, because often datasets have thousands of variables, and a dimensionality reduction is the only way to get some sense out of it.
One of the most famous method of this group is principal component analysis (PCA) (Pearson, 1901), but it can capture only linear relationships between data. To solve this issue, scientists have proposed other techniques that are capable of providing more precise low-space approximations of complex datasets, such as -distributed stochastic neighbor embedding (t-SNE) (Van der Maaten & Hinton, 2008) and uniform manifold approximation and projection (UMAP) (McInnes, Healy & Melville, 2018; McInnes et al., 2018; Healy & McInnes, 2024).
A recent study by Becht et al. (2019) explained the higher effectiveness of UMAP over -SNE when applied to single-cell RNA-seq bioinformatics data.
UMAP is based on concepts from manifold learning and topology: it models the data as a high-dimensional manifold, which is a mathematical space that locally resembles Euclidean space but can have a more complex global structure. Additionally, UMAP constructs a weighted graph representation of the data using fuzzy simplicial sets. This step involves creating a neighborhood graph where each point is connected to its nearest neighbors, with weights reflecting the distance between points. The algorithm then aims to preserve the structure of the high-dimensional data in a lower-dimensional space by minimizing the difference between the original and the projected data’s neighborhood structures. This goal is achieved through a stochastic gradient descent optimization process. All these phases, built on manifold learning and topological concepts, allow UMAP to represent non-linear relationships between data in its dimensionality reduction results (Healy & McInnes, 2024). UMAP is also available as a standalone open source software package in Python and in R (McInnes et al., 2018).
To assess the quality of the outputs of UMAP and other dimensionality reduction methods, scientists have mainly employed visual inspections so far: one applies UMAP on the dataset, generates a 2D plot, and then eyeballs it to see what comes out. This in-person evaluation, done by sight, although surprising is still quite common among bioinformaticians and health informatics analysts. Needless to say, this evaluation is extremely arbitrary and subjective, can change based on who is observing the plot, and can lead to mistakes and errors. Some statistical measures, such as continuity and trustworthiness, have been used by machine learning researchers, but no consensus on which metric can be more informative has been reached yet (GitHub, 2017).
To avoid these problems, we present here a new statistical score, called Saturn coefficient, which can express the preservation of the local structure and the preservation of the global structure of the original dataset after the application of UMAP by providing a single value between zero and one. Two other metrics to assess the global and local structure preservation of UMAP exist (continuity and trustworthiness), but we show here in this study that our Saturn coefficient can be more informative than them most of the time.
Scientific literature review. Multiple studies have proposed methods to assess dimensionality reduction methods applied to high-dimensional data, particularly in bioinformatics.
Roca et al. (2023) developed a statistical test using cross-entropy to compare -SNE (Van der Maaten & Hinton, 2008) and UMAP representations quantitatively. The authors have developed a statistical test based on cross-entropy error (Jurman, Riccadonna & Furlanello, 2012) to evaluate the difference between dimensionality-reduced datasets generated through -SNE or UMAP, and they claim this test is robust and can identify true biological variation between gene expression datasets.
Smets et al. (2019) applied UMAP to mass spectrometry imaging (MSI) data, finding it competitive with -SNE in visualization quality but faster. The authors state that UMAP is computationally more efficient than -SNE and Barnes-Hut -SNE for dimensionality reductions applied to MSI datasets with a nearly fourfold decrease in runtime. According to the study authors, UMAP produces embeddings of at least the same quality as -SNE and Barnes-Hut -SNE (Van der Maaten, 2013), as evidenced by similar spatial autocorrelation patterns. Smets et al. (2019) also explored alternative distance metrics for UMAP. In fact, the authors state that the choice of distance metric, such as cosine or correlation, can significantly impact the resulting embeddings and visualization, and the cosine distance metric appears to perform well across different methods and tissues.
Atitey, Motsinger-Reif & Anchang (2024) proposed the MIBCOVIS framework for benchmarking DR methods without relying on ground truth, integrating multiple metrics into a Bayesian model. The authors applied this framework to various single-cell RNA-seq datasets, emphasizing the importance of joint evaluation of visualization and interpretability, rather than relying on separate metrics. The authors claimed that MIBCOVIS compares accuracy distributions across methods, explaining that prioritizing average performance could obscure method feature performance. The article (Atitey, Motsinger-Reif & Anchang, 2024) provides recommendations for optimal parameters and features, as well as specific methods like the optimized variational contractive autoencoder, for targeted dynamic and spatial visualization and interpretation (DSVI) for data with varying complexities.
As we know, dimensionality reduction techniques are crucial for visualizing high-dimensional data, but assessing their quality remains challenging. Lee & Verleysen (2009) propose rank-based criteria for evaluating dimensionality reduction methods, introducing the co-ranking matrix to compare ranks in original and embedded spaces.
Venna et al. (2010) introduced an information retrieval perspective for evaluating visualizations, defining a specific task of finding similar data points based on displayed similarities. The authors proposed NeRV, a method optimizing visualizations by minimizing the cost of precision-recall trade-offs. These approaches offer complementary solutions to the challenge of assessing dimensionality reduction quality, with rank-based criteria, topographic maps, and information retrieval metrics providing diverse tools for evaluating the effectiveness of visualizations in representing high-dimensional structures and relationships.
Both the approaches presented by Lee & Verleysen (2009) and by Venna et al. (2010) seem effective, but they were not intended for UMAP.
Thrun & Ultsch (2020a) presented a topographic map approach using the generalized U-matrix to uncover high-dimensional structures in projections, revealing clusters and distance-based relationships. Even if interesting, however, their approach works only in a supervised manner: ground truth containing label information of a classification or clustering needs to be available. Therefore, their approach cannot work in an unsupervised context, that is the common framework of dimensionality reductions. Thrun & Ultsch (2020a), Thrun et al. (2017) also proposed a visualization tool for dimensionality reduction, released as an R package called GeneralizedUmatrix. This tool allows the selection of the most suitable UMAP visualization, but does not provide any quality metric. The same authors presented another study (Thrun & Ultsch, 2020b) where they show how dimensionality reduction, if done correctly, can enhance the identification of the “right” cluster structure, confirming the synergy between clustering methods and dimensionality reduction techniques.
More recently, Jeon et al. (2023a, 2023b) published a public open source Python library, called ZADU, for the assessment of DR results (Jeon, 2023). This Python packages provides seventeen metrics to evaluate dimensionality reductions, that the authors call distortion measures: ZADU uses these indices to tell how distorted the DR output is from the original dataset. Even though the presented software library can be useful, the authors did not select a specific metric to be considered more reliable than the others, leaving this decision to the readers and users.
Some surveys on dimensionality reduction techniques were published in the last years as well. The review by Jeon et al. (2025a), for examples, focuses on the unreliability of visual analytics analyses of dimensionality reduction methods.
Several dimensionality reduction methods can be also combined for some specific tasks. It is the case of the sc-PHENIX technique and software package developed by Cristian et al. (2024): in their study, the authors combined PCA and UMAP to reduce over-smoothing and maintain the local, global, and continuum structures of single-cell RNA-seq (scRNA-seq) data. Missing data, in fact, are common among RNA-seq data, and sc-PHENIX was design to impute realistic, meaningful new data points by preserving the structures of the original dataset.
Relevant studies also warn readers against an excessive trust in 2D or 3D visual representations of high-dimensional data, in particular in the single-cell RNA-seq landscape (Chari & Pachter, 2023; Lause, Berens & Kobak, 2024). Although this topic is worth mentioning, here we focus on quantitative assessment of dimensionality reduction results, and not on visual interpretation of the global and local structure of a dataset.
Several other studies on differences between dimensionality reduction methods and their evaluation exist. The study by Gisbrecht & Hammer (2015), for example, provided an overview of dimensionality reduction techniques for data visualization, discussing their properties, behavior on benchmarks, and current research challenges such as handling non-vectorial data, user preference integration, and suitability for big data sets. The study by Atzberger et al. (2025) presents a sensitivity study on the stability of two-dimensional scatterplot layouts for text corpora, analyzing changes in input data, hyperparameters, and randomness, and provides guidelines for using text embeddings and dimensionality reduction techniques to enhance stability. Tian et al. (2021) presented a comprehensive survey of dimension reduction techniques, evaluating 44 methods on 18 datasets with seven quality metrics, and provides a publicly accessible benchmark and methodology for future extensions and contributions. Another survey by Nonato & Aupetit (2019) provided a comprehensive overview of multidimensional projection techniques, covering their main aspects, distortions, evaluation mechanisms, guidelines for selection, layout enrichment methods, and future research directions.
Regarding the assessment of projections, Castelein et al. (2023) proposed a viewpoint-dependent definition of 3D projection quality and an interactive exploration tool, showing that these metrics can predict user preferences and increase user preference for 3D over 2D projections. Tian et al. (2024) described techniques to enhance the exploration and quality measurement of 3D projections by extending 2D quality metrics to account for user viewpoints and occlusion, showing that these metrics can predict good viewpoints and increase user preference for 3D over 2D projections. Van Der Maaten, Postma & Jaap Van Den Herik (2009) presented a comprehensive review and comparison of nonlinear dimensionality reduction techniques, highlighting their strengths on artificial tasks but weaknesses on real-world tasks, and suggests future improvements to address these limitations. Benato, Falcão & Telea (2023) proposed a novel approach to assess the visual separation quality of 2D projections using a semi-supervised optimum-path forest classifier (OPFSemi) and Cohen’s Kappa, which they find to be more effective than existing projection-quality metrics in capturing visual separation. Joia et al. (2011) introduced Local Affine Multidimensional Projection (LAMP), a novel multidimensional projection technique that is more flexible and versatile than existing methods, offering high accuracy, robustness, and computational efficiency, making it suitable for interactive applications and surpassing state-of-the-art methods in handling high-dimensional data. Regarding -SNE, Gove et al. (2022) presented new guidelines for choosing t-SNE hyperparameters, introduces a neural network method for predicting optimal hyperparameters, and finds that useful ranges for these hyperparameters are narrower and include smaller values than previously reported, leading to more accurate embeddings.
Some of the presented studies provided evaluation statistics of dimensionality reductions generated through PCA or other methods, but not for outcomes generated by UMAP. And some other studies present tools to assess UMAP’s results, but only visually or without recommending a particular metric over the others. To the best of our knowledge, only one article proposes an effective attempt to statistically evaluate the global structure preservation and the local structure preservation of dimensionality reduction methods: the study by Huang et al. (2022).
A detailed comparative study on dimensionality reduction methods assessment. Huang et al. (2022) conducted a comprehensive evaluation of eight popular dimensionality reduction (DR) methods, considering local and global structure preservation, parameter sensitivity, and computational efficiency. The study conducted a systematic evaluation of PCA (Pearson, 1901), -SNE with the FIt-SNE variant (Van der Maaten & Hinton, 2008), art-SNE (Kobak & Berens, 2019), UMAP (McInnes, Healy & Melville, 2018), TriMap (Amid & Warmuth, 2019), PaCMAP (Wang et al., 2021), ForceAtlas (Jacomy et al., 2014), and PHATE (Moon et al., 2019) across five key criteria: local structure preservation, global structure preservation, sensitivity to parameter choices, sensitivity to preprocessing, and computational efficiency. The evaluation aims to help users select the most appropriate DR method based on their specific scientific goals. Huang et al. (2022) did not select a single method as best method, but rather specified which technique has advantages and disadvantages.
To assess the preservation of the local structure of a dataset after dimensionality reduction, the authors employed a supervised approach and an unsupervised technique. The supervised part involved a support vector machine (SVM) and a variant of the -nearest neighbors ( -NN) machine learning method. The unsupervised step employed -NN as well, by checking if groups of nearest neighboring points in the original high dimensional space were also preserved in the low dimensional space, after the application of a DR phase. Then, the authors computed the proportion of points matching in the “neighborhood”, and the average number of preserved points of each original dataset point.
Huang et al. (2022) also performed an additional step to assess the global structure conservation. The authors utilized a qualitative approach (by manually looking at the visualization generated by the dimensionality reduction method) and a quantitative approach based upon the random triplet accuracy evaluation. Random triplet accuracy is the percentage of all combinations of data points whose relative distance in the high-dimensional space and low-dimensional spaces keep their relative order (Wang et al., 2021).
To the best of our knowledge, this study by Huang et al. (2022) is the only one, among the articles studied and presented here, that has the merit to define and use statistical ways to assess the conservation of the local and global structures after dimensionality reduction. Even if interesting and useful, however, their approach has several pitfalls.
First, the use of a supervised step for local structure preservation assessment in clearly unsupervised context such as DR is out of context: supervised approaches strongly rely on the labels that are used as ground truth, and that most of the times are unavailable, especially in biomedical research. Supervised machine learning applications say nothing about the assessment of dimensionality results. Unsupervised scientific problems should be treated with unsupervised machine learning methods.
Second, we found that qualitatively observing the results of dimensionality reduction by eye and then stating which method performed well and how, by sight, is too arbitrary and subjective to be considered reliable. A dimensionality reduction outcome could be considered well done by a person and poorly done by another observer.
Moreover, even if their unsupervised assessment approaches ( -nearest neighbors preservation and random triplet accuracy) have some merit and provide some insights about the local and global structure conservation, they rely on numbers that might not be suitable for all the experiments: five nearest neighbors and three data points. One might say: why five and why three? And it would be a legitimate question.
Our proposed Saturn coefficient, instead, involves the average distance between all the data points (not 3 or 5) and is fully unsupervised.
Our proposal: a trade-off between global and local structures preservation. Here we propose our Saturn coefficient for assessing UMAP dimensionality reduction results, that is a simple statistical score that can asses the preservation of the local structure and of the global structure of a UMAP dimensionality result with a single real numeric value between zero and one. Our method compares the relative distances between data points of the original dataset with the relative distances between data points of the reduced-dimensions projection generated by UMAP on the same dataset, through the Adjusted RV coefficient. Our Saturn index eventually produces a real value ranging from 0 (bad dimensionality reduction) to 1 (perfect dimensionality reduction). We compare the effectiveness of our proposed score with other two coefficients commonly employed in UMAP result assessment: continuity and trustworthiness. We provide our Saturn coefficient as a standalone R package publicly available on CRAN as SaturnCoefficient and as a standalone Python package publicly available on PyPI as SaturnScore (Software Availability section). We organize the rest of this article as follows. After this Introduction, we explain the main concepts of UMAP, its commonly used evaluation metrics (continuity and trustworthiness), the formula and the rationale of our proposed Saturn coefficient, and how we demonstrate the effectiveness of our approach, in ‘Methods’. We then report and describe the results we obtained on artificial data and on real-world biomedical datasets in ‘Results’. We finally formulate some key take-home messages and outline some conclusions in ‘Discussion and Conclusions’.
Methods
In this section, we first describe the UMAP method and continuity and trustworthiness statistical scores for UMAP results assessment (UMAP, Continuity, and Trustworthiness), we present the formula and the mathematical foundations of our proposed Saturn coefficient (Our Proposed Saturn Coefficient), and we describe the validation procedure based on HDBSCAN clustering that we utilized to compare the results obtained by the Saturn coefficient, continuity and trustworthiness in artificial and real-world biomedical datasets (Validation).
UMAP, continuity, and trustworthiness
UMAP is a dimensionality reduction technique that offers both visualization capabilities and general non-linear dimension reduction (McInnes, Healy & Melville, 2018; McInnes et al., 2018; Healy & McInnes, 2024; Ghojogh et al., 2021). Based on Riemannian geometry and algebraic topology, UMAP is a scalable algorithm which can compete with -SNE in visualization quality, by better preserving global structure (Becht et al., 2019). UMAP’s advantages include faster implementation compared to most -SNE versions, no computational restrictions on embedding dimension, and the capability to transform unseen data into a pretrained embedding space (Coenen, Pearce & Google PAIR, 2023). Moreover, UMAP is known to be more efficient than -SNE (Pal & Sharma, 2020). Because of these assets, UMAP has become one of the most used dimensionality reduction methods employed on bioinformatics, health informatics, and cheminformatics (Yang et al., 2021; Trozzi, Wang & Tao, 2021; Diaz-Papkovich et al., 2019; Xia, Lee & Li, 2024; Ehiro, 2023; Diaz-Papkovich, Anderson-Trocmé & Gravel, 2020). For these reasons, we decided to choose UMAP as standard dimensionality reduction method and to develop a new statistical coefficient able to assess the quality of its results.
However, some statistics for evaluating UMAP’s outcomes already exist in the scientific literature. Continuity and trustworthiness are statistical scores which quantify the preservation of the global structure of the dataset (continuity) and of the local structure (trustworthiness), respectively (Venna & Kaski, 2005; Stasis, Stables & Hockman, 2016; Frenzel, 2021). Continuity indicates how much the points that are close together in the high-dimensional space remain close together in the lower-dimensional representation after the application of UMAP. Trustworthiness, on the other hand, measures how well the local relationships are preserved in the embedding. A high trustworthiness score indicates that if two points are neighbors in the original dataset space, they are likely to remain neighbors in the UMAP-reduced space (Venna & Kaski, 2005; Stasis, Stables & Hockman, 2016; Frenzel, 2021). Both continuity and trustworthiness range from 0 (worst possible outcome) and 1 (best possible outcome).
Our proposed Saturn coefficient
We called our new coefficient Saturn because it is the name of the most distant planet that can be seen with the naked eye and without a telescope: in a similar way, our coefficient allows anyone to “see” the quality of a UMAP dimensionality reduction easily, without additional computational technologies. Our Saturn coefficient is also conceptually related to the Venus score (Chicco, Fabris & Jurman, 2025), a coefficient we recently introduced for biomedical data quality assessment: the Venus score indicates whether the quality of biomedical data is high or low, while our Saturn score indicates whether the quality of dimensionality reduction is high or low.
The rationale beyond the formula of our Saturn coefficient is about the preservation of the distances between data points (table rows) before applying UMAP and after applying UMAP. Basically, the Saturn coefficient answer this question: How much the UMAP application was able to preserve the distances between data points?
The design of our Saturn coefficient follows the Johnson–Lindenstrauss lemma (Johnson & Lindenstrauss, 1984), which is central to the theoretical foundation for structure preservation in dimensionality reduction. This lemma suggests that to preserve the geometric structure when projecting from high to low dimensions, pairwise distances must be approximately maintained (Bartal, Fandina & Larsen, 2021; Dorrity et al., 2020).
Given A as input data matrix (having rows as data instances and columns as features or variables), we first scale it per-dimension:
(1) so that all the columns of X only contains values between –1 and +1. We then calculate the matrix of all the distances between all the rows of X, where the distance between (that is the ith row of X) and (that is the jth row of X) is defined as:
(2) where and go from 1 to , which is the total number of data rows. The resulting is a lower triangular matrix containing real values between 0 and the maximum possible Euclidean distance between two -dimensional rows, that is .
If the dataset is represented as a table, we call data points the rows of the table, and features, variables, or attributes the columns of the table. Afterwards, we apply UMAP (by specifying its hyperparameter values for number of neighbors and minimal distance) to X and save its result in U, and then scale its features from –1 to +1 per-dimension, as we did for X:
(3) We repeat the Eq. (2) step on Y, by calculating the distances between all the data rows of the output of UMAP:
(4) where and go from 1 to , which is the total number of data rows. The resulting is again a lower triangular matrix containing real values between 0 and the maximum possible Euclidean distance between two -dimensional rows.
At this point, both and are lower triangular matrices with rows and columns. At this point, we need to statistically compare these two matrices to estimate how similar they are: that is, how well the distances between data points of the original matrix are preserved in the UMAP-reduced low-dimensional projection. We calculate the similarity between these two matrices by using the Adjusted RV coefficient (Mayer, Lorent & Horgan, 2011):
(5)
We decided to use the Adjusted RV coefficient over the original RV coefficient (Robert & Escoufier, 1976) and over the Modified RV (Smilde et al., 2009) coefficient because the Adjusted RV coefficient works well both on small and on big datasets and because it produced reliable results on biomedical data by its original creators (Mayer, Lorent & Horgan, 2011). The Adjusted RV coefficient quantifies the similarity between the two matrices in a real value from 0 and 1, and its calculation is the last step of our Saturn coefficient computation. The Adjusted RV coefficient is an unbiased estimator for measuring similarity between high-dimensional data sets, particularly in cases of complete independence (Mayer, Lorent & Horgan, 2011). A high Adjusted RV indicates that the rows of the two matrices retain a similar structure between them: proximity relationships, distances and directions are consistent between the two spaces. Therefore, our Saturn coefficient ranges from 0 (worst possible value) and 1 (best possible value).
Global and local structure preservation. The global structure preservation in our Saturn coefficient design is given by the calculation of the distances among all the points of the original dataset (Eq. (2)) and by the calculation of the distances among all the points of the reduced-dimensionality projection (Eq. (4)).
The local structure preservation in our Saturn coefficient formula, instead, is granted by the use of the Adjusted RV coefficient. The Adjusted RV coefficient, a refinement of the original RV coefficient introduced by Robert & Escoufier (1976), measures the similarity between two multivariate datasets based on the structure of their sample configurations. Like the original RV, it assesses the alignment between the cross-product matrices of two datasets, thereby capturing second-order relationships. However, the Adjusted RV corrects for biases that may arise due to dimensionality or sample size, making it more robust for practical comparisons.
When the Adjusted RV returns high values, this indicates that the pairwise relationships among the rows (that are the samples) are well preserved across the two datasets. This means that objects that are close to each other in one dataset tend to remain close in the other, and the global arrangement of the samples in terms of distances, proximities, and even orientations is consistently maintained. Importantly, this holds even if the datasets reside in different vector spaces or have undergone global transformations such as scaling or rotation.
Therefore, the Adjusted RV can be interpreted as a measure of local structural preservation. It reflects how well the local geometry of the sample configuration is retained, rather than just matching global features or means. This interpretation aligns with its use in multivariate analysis, where it is often employed to compare embeddings, dimensionality reduction results, or matched representations across modalities. Its high values thus support the conclusion that local structures—such as clusters, neighborhoods, or relative positions—are preserved between datasets. In other words, the Adjusted RV considers local neighborhoods made of subsets of two points.
Several studies has taken advantage of the RV coefficient for local structure preservation in past (Josse & Holmes, 2016; Urain & Peters, 2019).
Validation
Being our Saturn coefficient calculated in a completely unsupervised manner, it is difficult to evaluate its results. To validate its performances, we first had to define a ground truth against which to compare the outcome of our Saturn coefficient.
We introduce a new coefficient, called HDBSCANess, to assess the preservation of HDBSCAN clustering before and after applying UMAP to a particular dataset.
We decided to use HDBSCAN (Ricardo, Davoud & Jörg, 2013) rather thank -means or hierarchical clustering because HDBSCAN is a density-based non-parametric algorithm able to identify both convex-shaped and concave-shaped nested clusters. The usage of HDBSCAN is also suggested by the Leland McInnes, the author of UMAP, in the official UMAP documentation (McInnes, 2018).
Our HDBSCANess calculation works as follows (Fig. 1). We first apply HDBSCAN to the original dataset, then we apply UMAP to the original dataset, and eventually apply HDBSCAN to the output of UMAP. If HDBSCAN found the same number of clusters on the original dataset and on UMAP’s output, we calculate the Adjusted Rand Index (Rand, 1971; Zhang, Wong & Shen, 2012; Badescu et al., 2011) between the clusters found by HDBSCAN on the original dataset and the clusters found by HDBSCAN on UMAP’s results. If the numbers of clusters identified by the two applications of HDBSCAN are different, the algorithms return not applicable (NA). In fact, we calculate the HDBSCANess only if the same number of clusters was found before and after applying UMAP. The Adjusted Rand Index tells us how similar the two clustering results are (Fig. 1) (Jin et al., 2023).
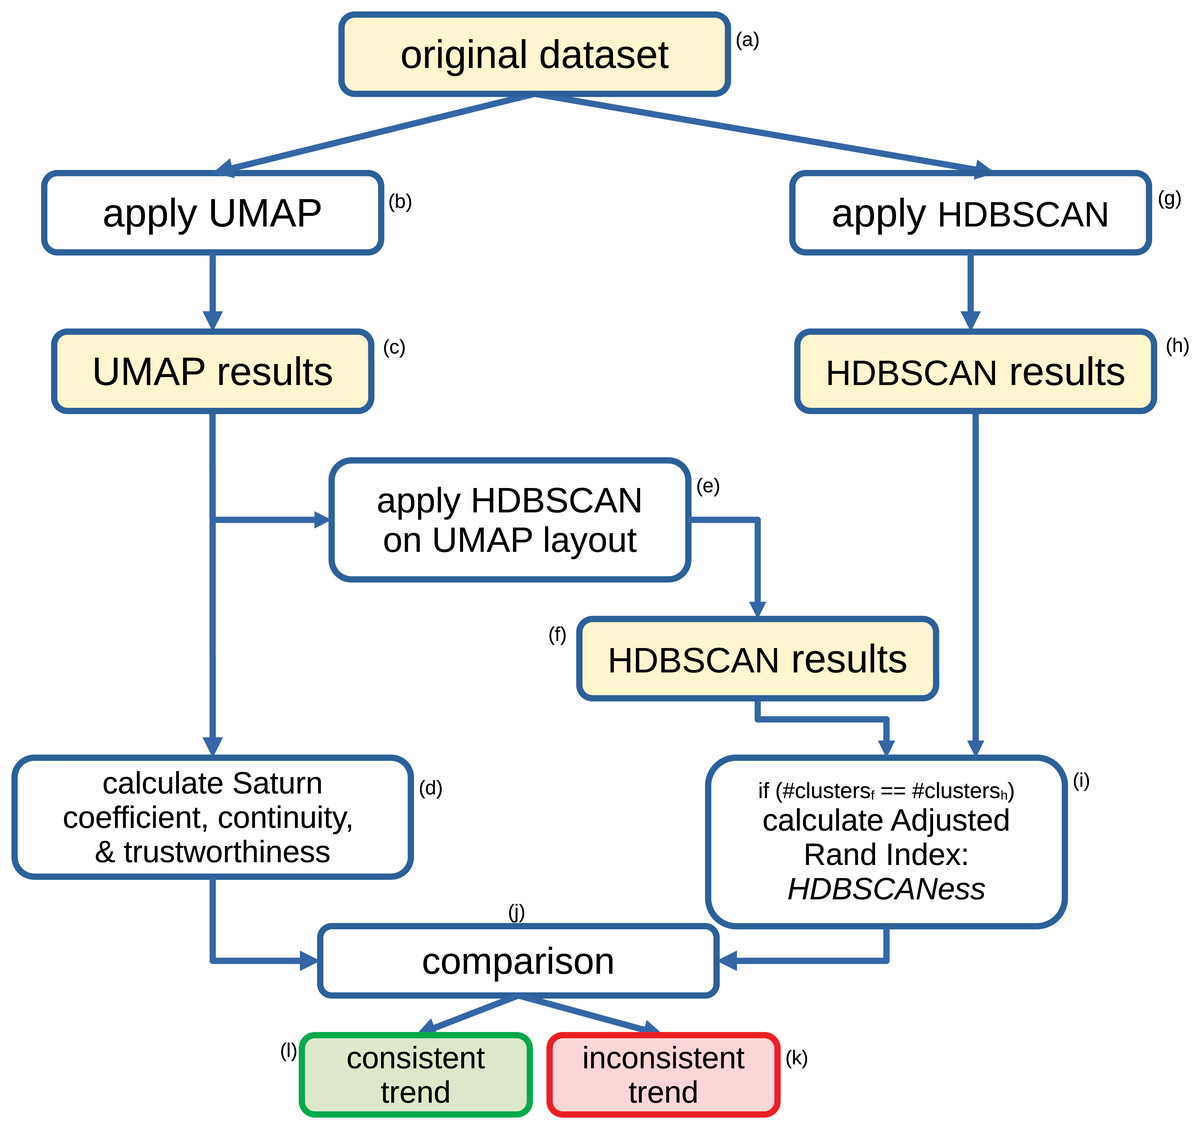
Figure 1: Flowchart of our method for assessing the validity of the Saturn coefficient.
Recap of the steps we employ to assess the validity of our proposed Saturn coefficient. We compute the Adjusted Rand Index between the HDBSCAN results obtained on the original dataset and the HDBSCAN results obtained on the UMAP output, and we call it HDBSCANess. Eventually, we compare the value of the Saturn coefficient with the HDBSCANess value: the smaller their difference, the more the global and local structures of the dataset was preserved after applying UMAP.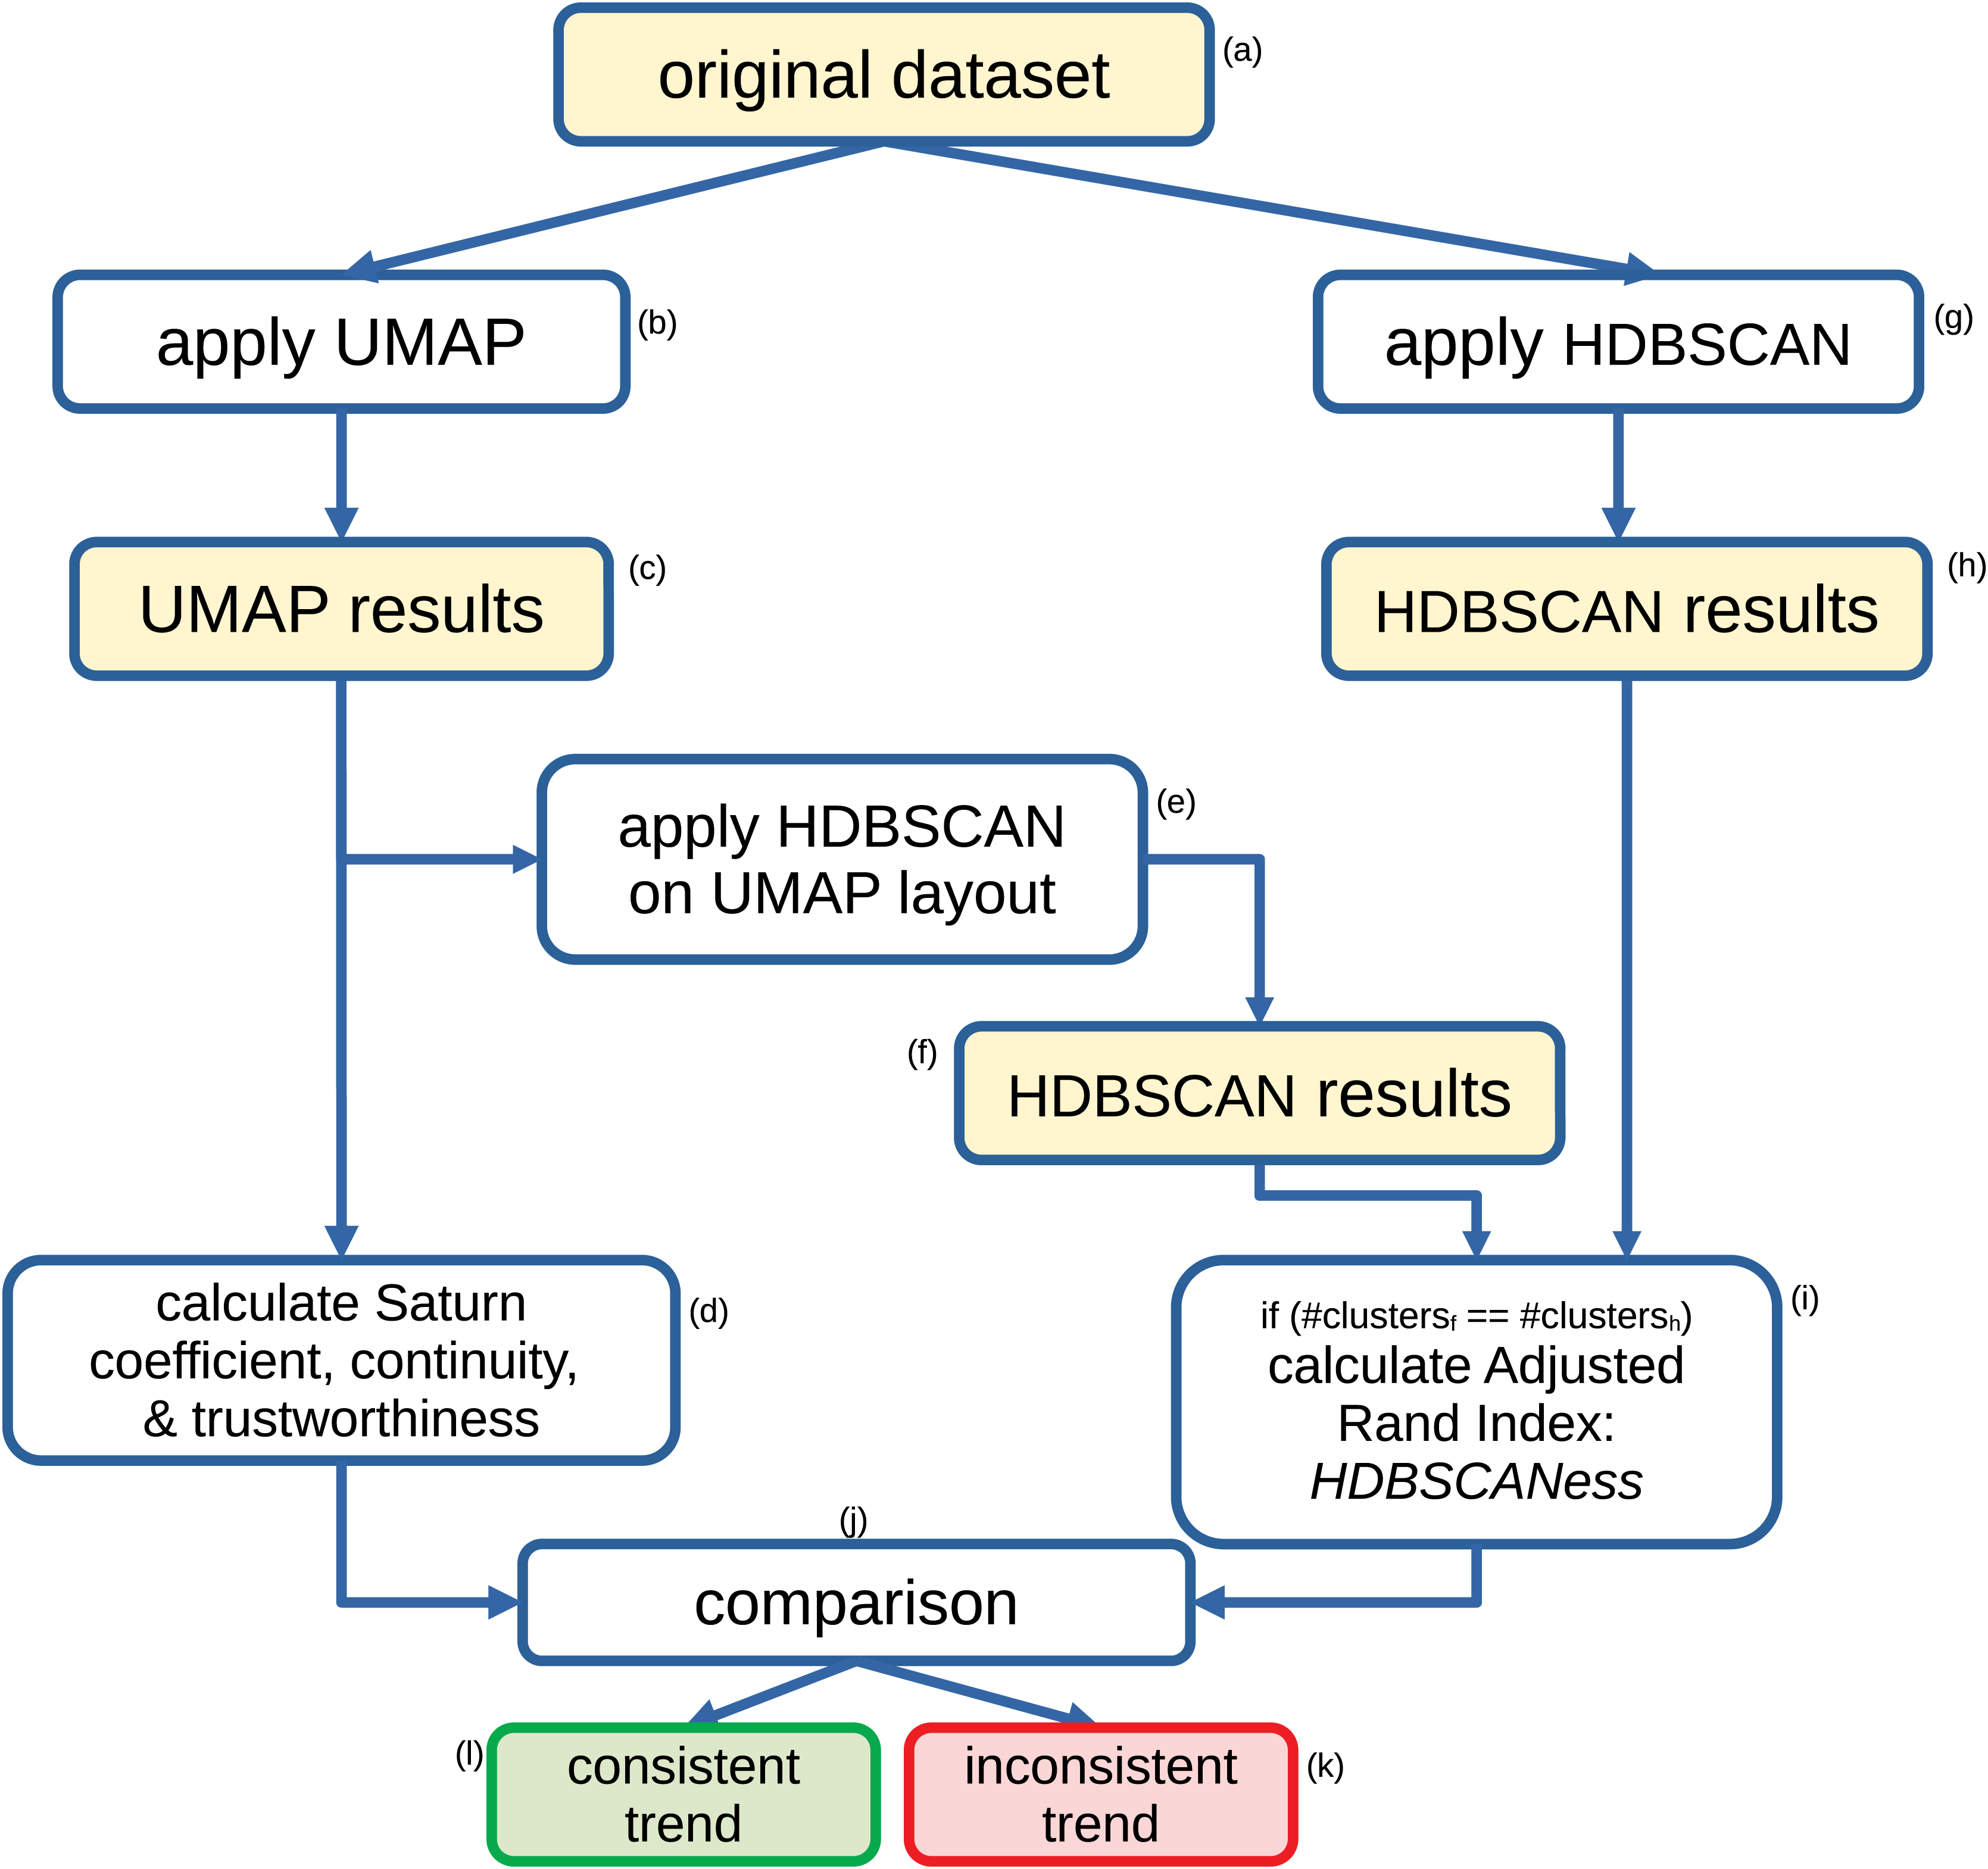
While HDBSCANess is calculated, we also compute Saturn coefficient, continuity and trustworthiness, and eventually compare them through the Euclidean distance (Fig. 1). Saturn coefficient, HDBSCANess, continuity, and trustworthiness all range from 0 (worst possible value) to 1 (best possible value). We calculate the absolute difference between Saturn coefficient and HDBSCANess, between continuity and HDBSCANess, and between trustworthiness and continuity. We eventually select the score having the smallest absolute difference with HDBSCANess as most informative score, which we consider consistent with HDBSCANess.
We tested several combinations of hyperparameters for HDBSCAN’s minimal points (2, 5, 10, 15, 20, 30, 40, 50), UMAP’s number of neighbors (2, 5, 10, 15, 30, 50), and UMAP’s minimal distance (0.0001, 0.001, 0.01, 0.1, 0.4, 0.5, 0.99). We then picked the test having the highest HDBSCANess.
The rationale beyond HDBSCANess is that a UMAP dimensionality reduction that preserves the clusters found by HDBSCAN in the original dataset is a good dimensionality reduction. A positive value of HDBSCANess states the clustering correspondence between the original dataset and the clustering made on the dimensionality-reduced projection of the same dataset with a value between 0 and 1. The Saturn score also generates a value between 0 and 1. We hypothesize a linear relationship between HDBSCANess and Saturn coefficient: if a specific test produced HDBSCANess and Saturn score equal to 0.7, for example, we can state that the level of HDSCAN clustering and the preservation of distances between points are both approximately good at a 70% level.
Results
To test our proposed Saturn coefficient, we calculated it together with continuity, trustworthiness, and HDBSCANess on four artificial datasets where we conducted controlled experiments (Controlled Experiments) and on fifteen real-world independent datasets of biomedical data derived from electronic health records of patients or microarray gene expression with different diseases (Real-World Biomedical Datasets).
Controlled experiments
We applied our approach (Validation) to test our Saturn coefficient against continuity and trustworthiness on four artificial datasets: neat data, spiral data (Fig. 2), multishapes data, and chameleon data (Fig. 3).
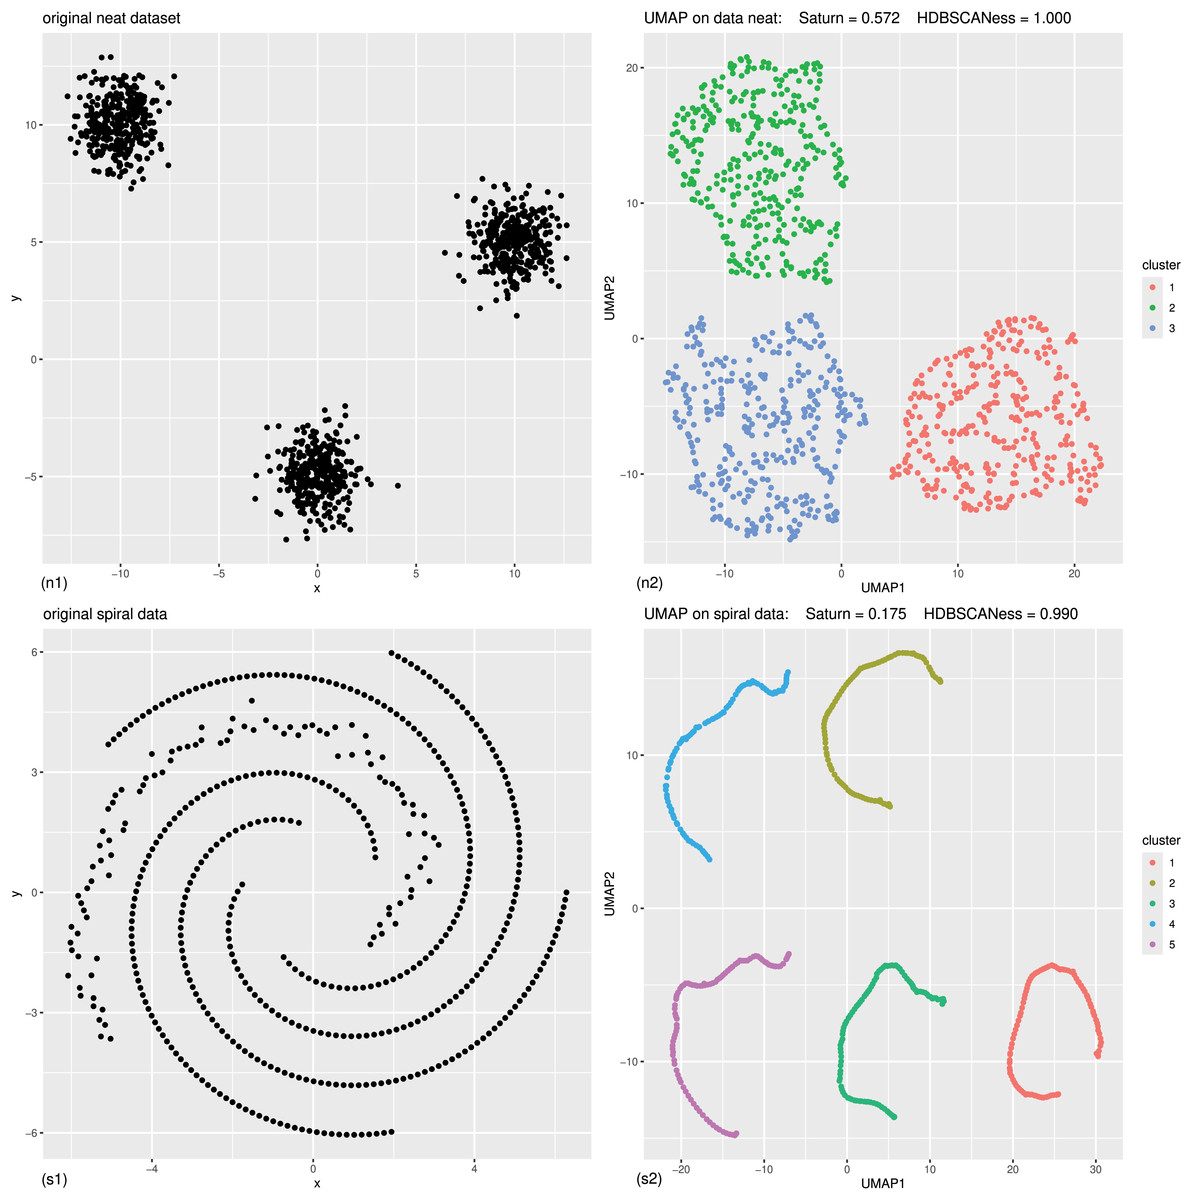
Figure 2: Controlled experiments: original data (left) and UMAP dimensionality reduction (right) of neat data and spiral data.
(n1) Original neat dataset. (n2) UMAP representation of the neat dataset, generated with 0.4 minimal distance and 50 neighbors, colored according to the HDBSCAN clusters found with five minimal points. (s1) Original spiral dataset. (s2) UMAP representation of the spiral dataset, generated with 0.4 minimal distance and five neighbors, colored according to the HDBSCAN clusters found with five minimal points. The colors in the UMAP plots (right) represent the clusters found by HDBSCAN. Saturn coefficient, trustworthiness, continuity, and HDBSCANess range from 0 (worst possible outcome) to 1 (best possible outcome).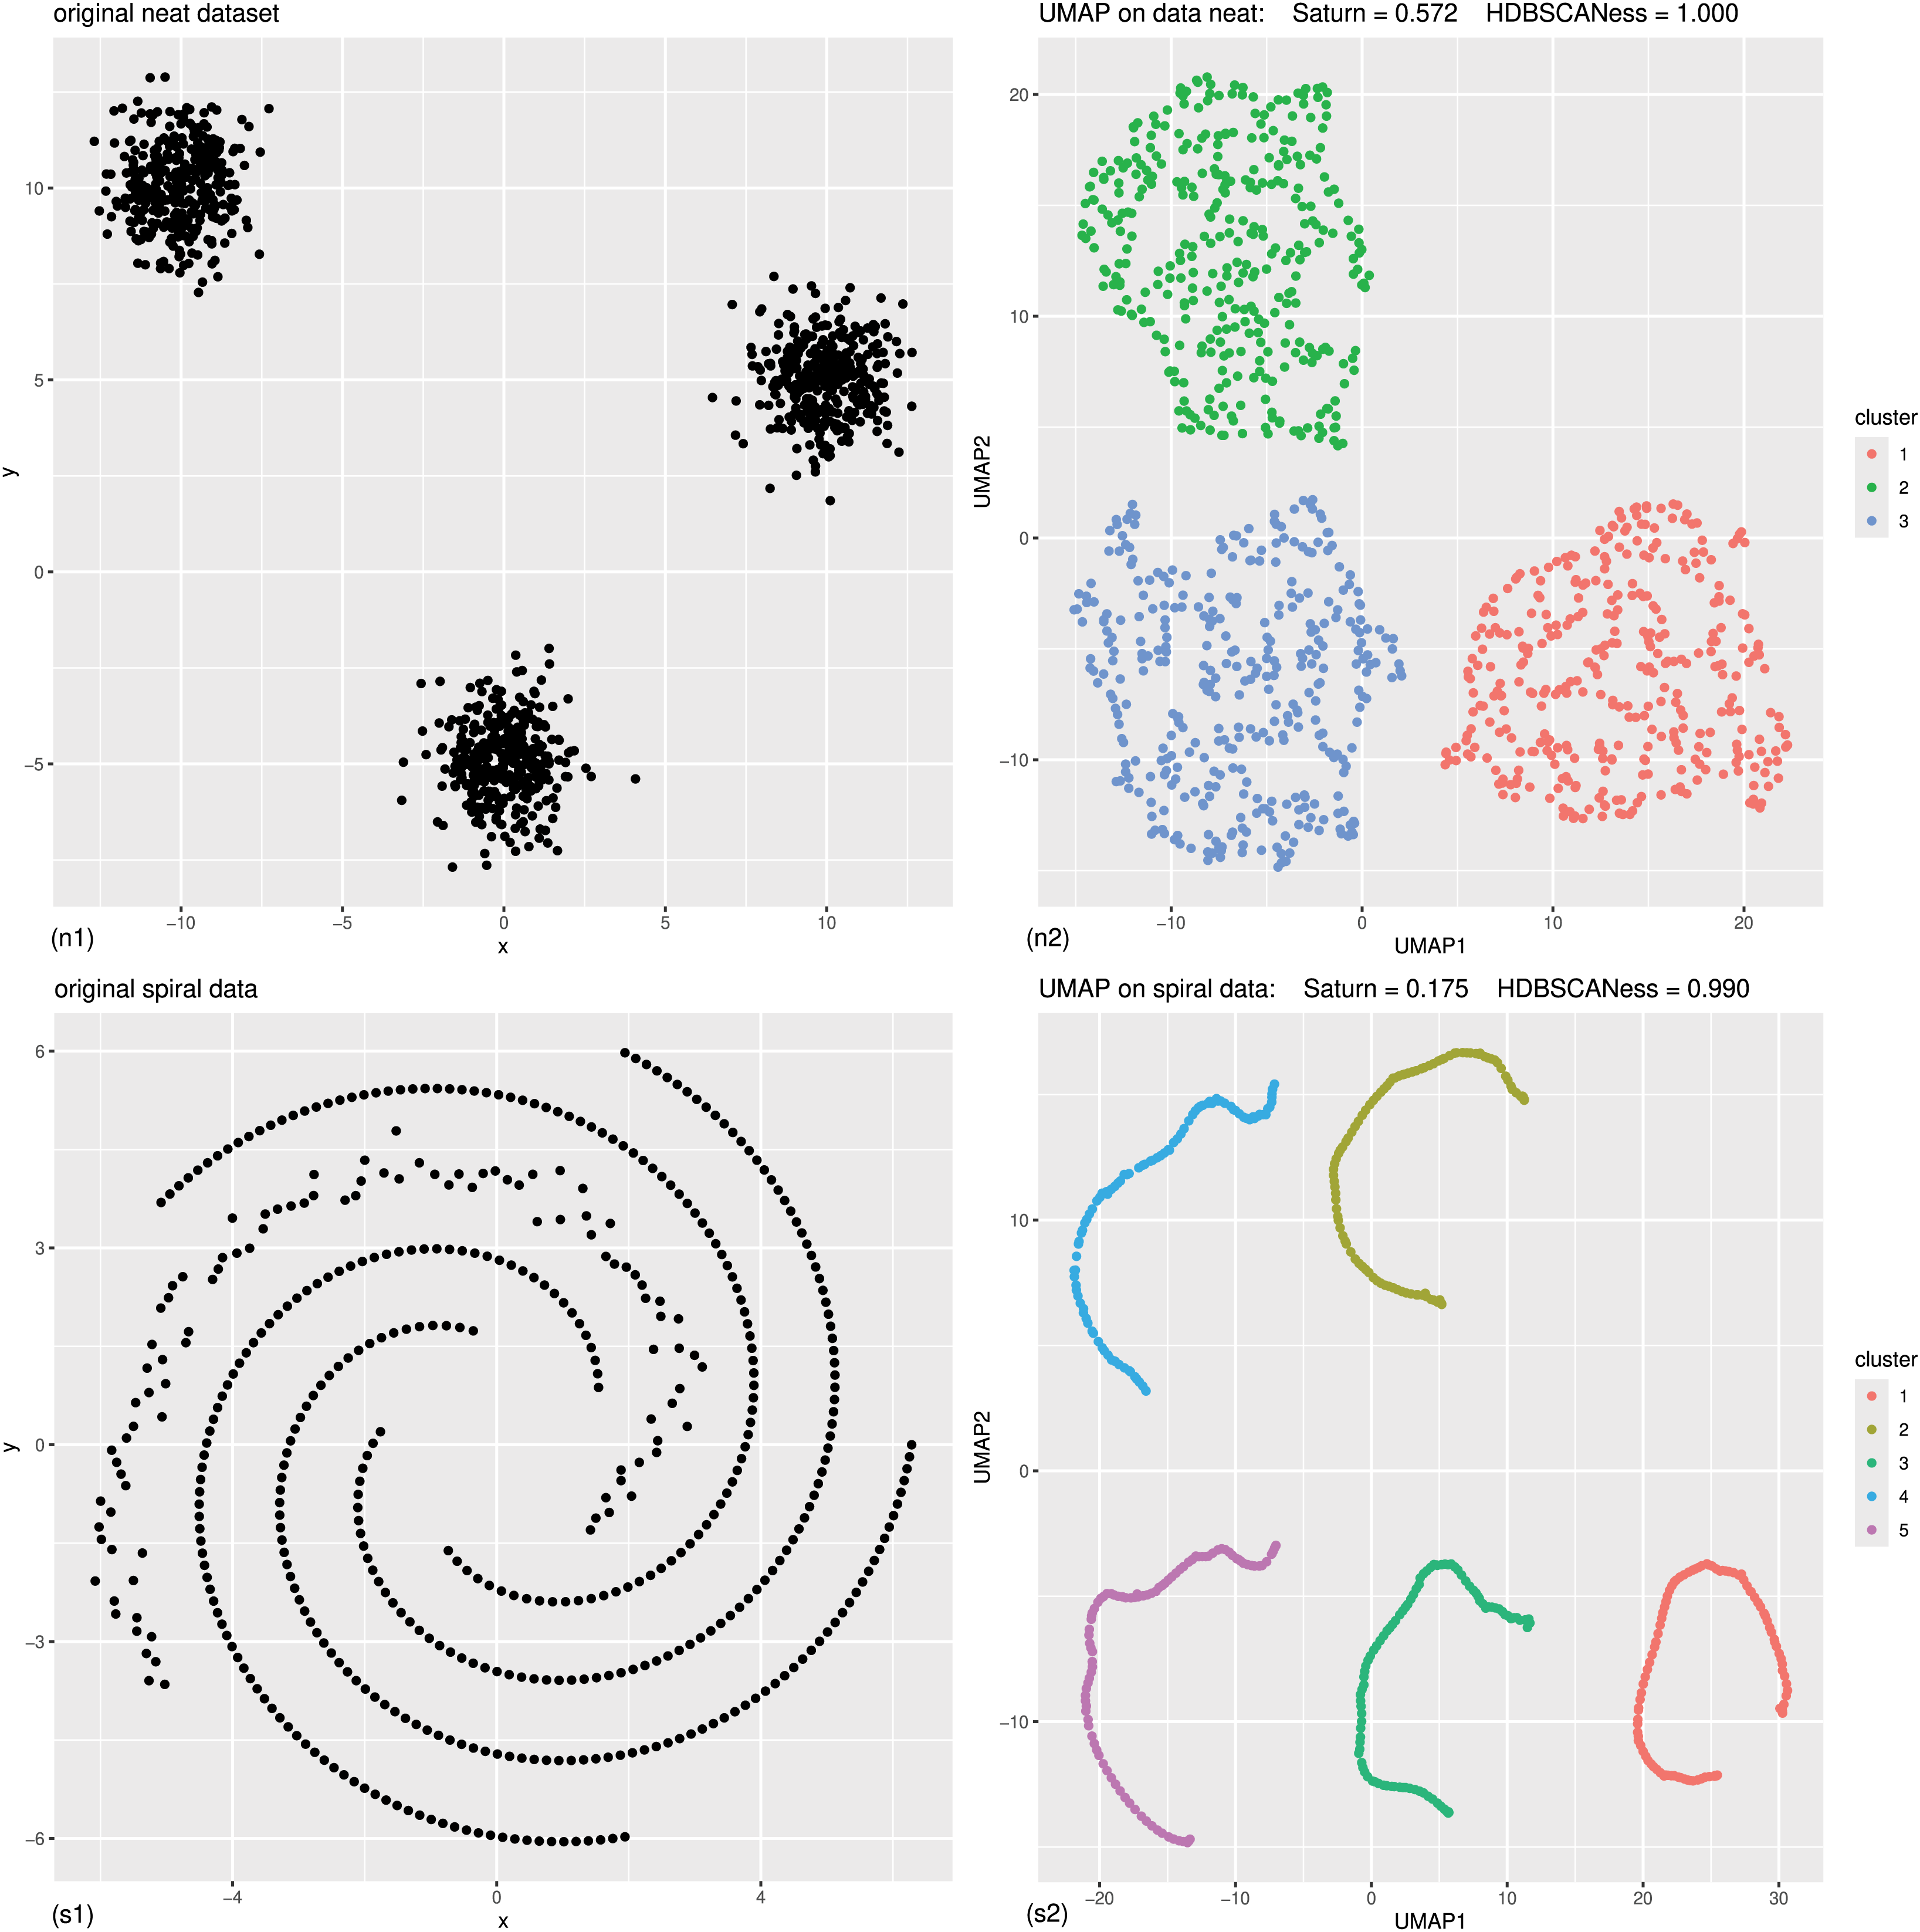
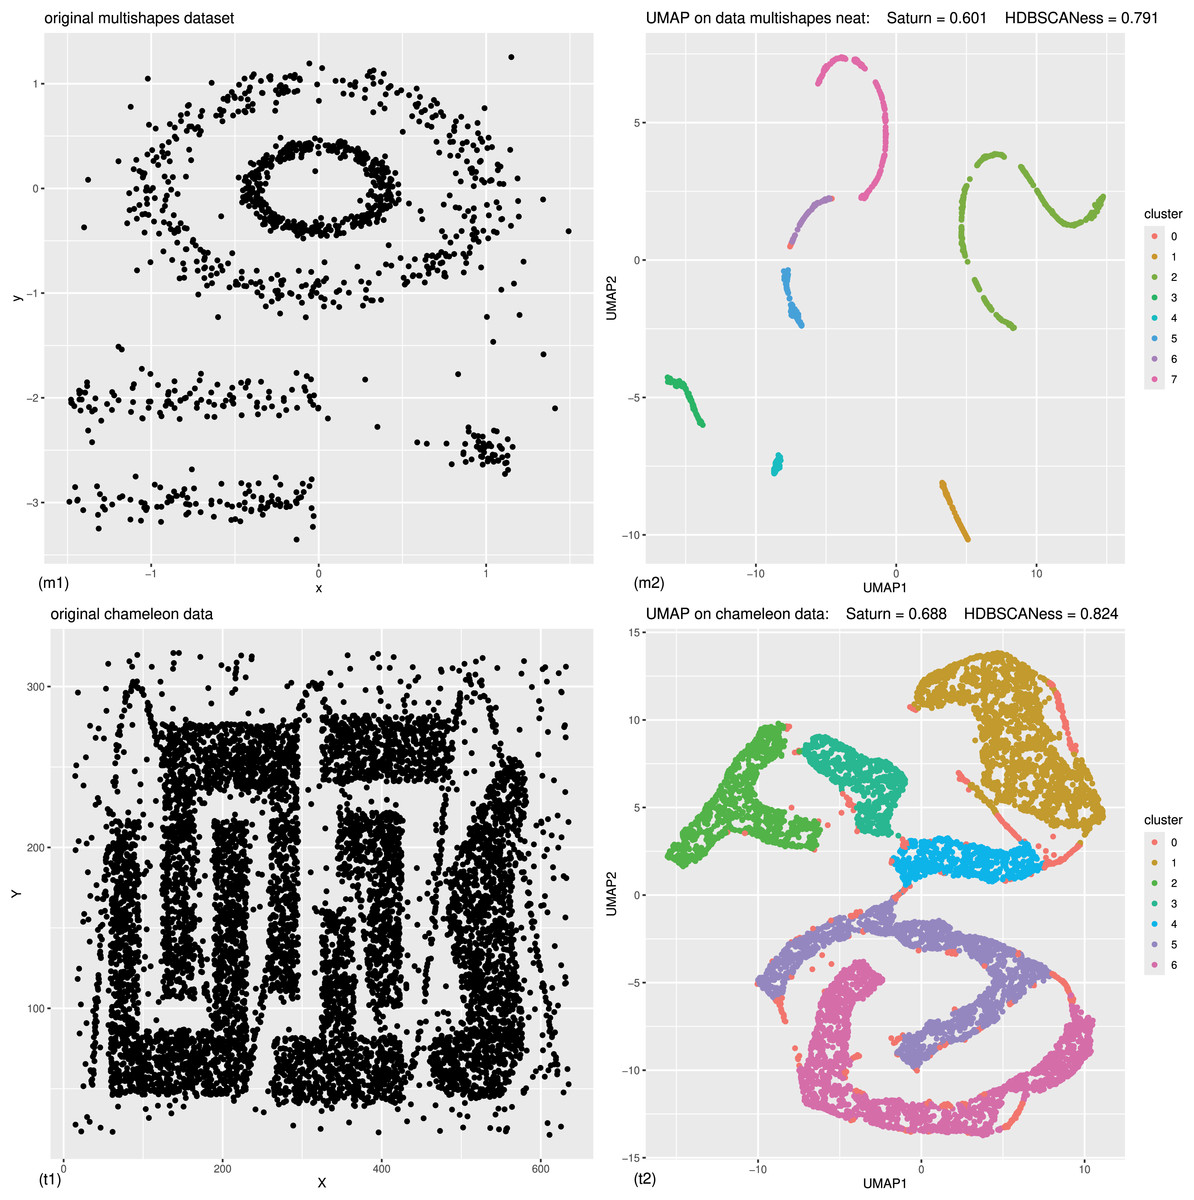
Figure 3: Controlled experiments: original data (left) and UMAP dimensionality reduction (right) of multishapes data and chameleon data.
The colors in the UMAP plots represent the clusters found by HDBSCAN. (m1) Original multishapes dataset. (m2) UMAP representation of the multishapes dataset, generated with 0.01 minimal distance and 30 neighbors, colored according to the HDBSCAN clusters found with 30 minimal points. (t1) Original chameleon dataset. (t2) UMAP representation of the chameleon dataset, generated with 0.4 minimal distance and 50 neighbors, colored according to the HDBSCAN clusters found with 50 minimal points. We report the precise results obtained on these datasets in Table 1.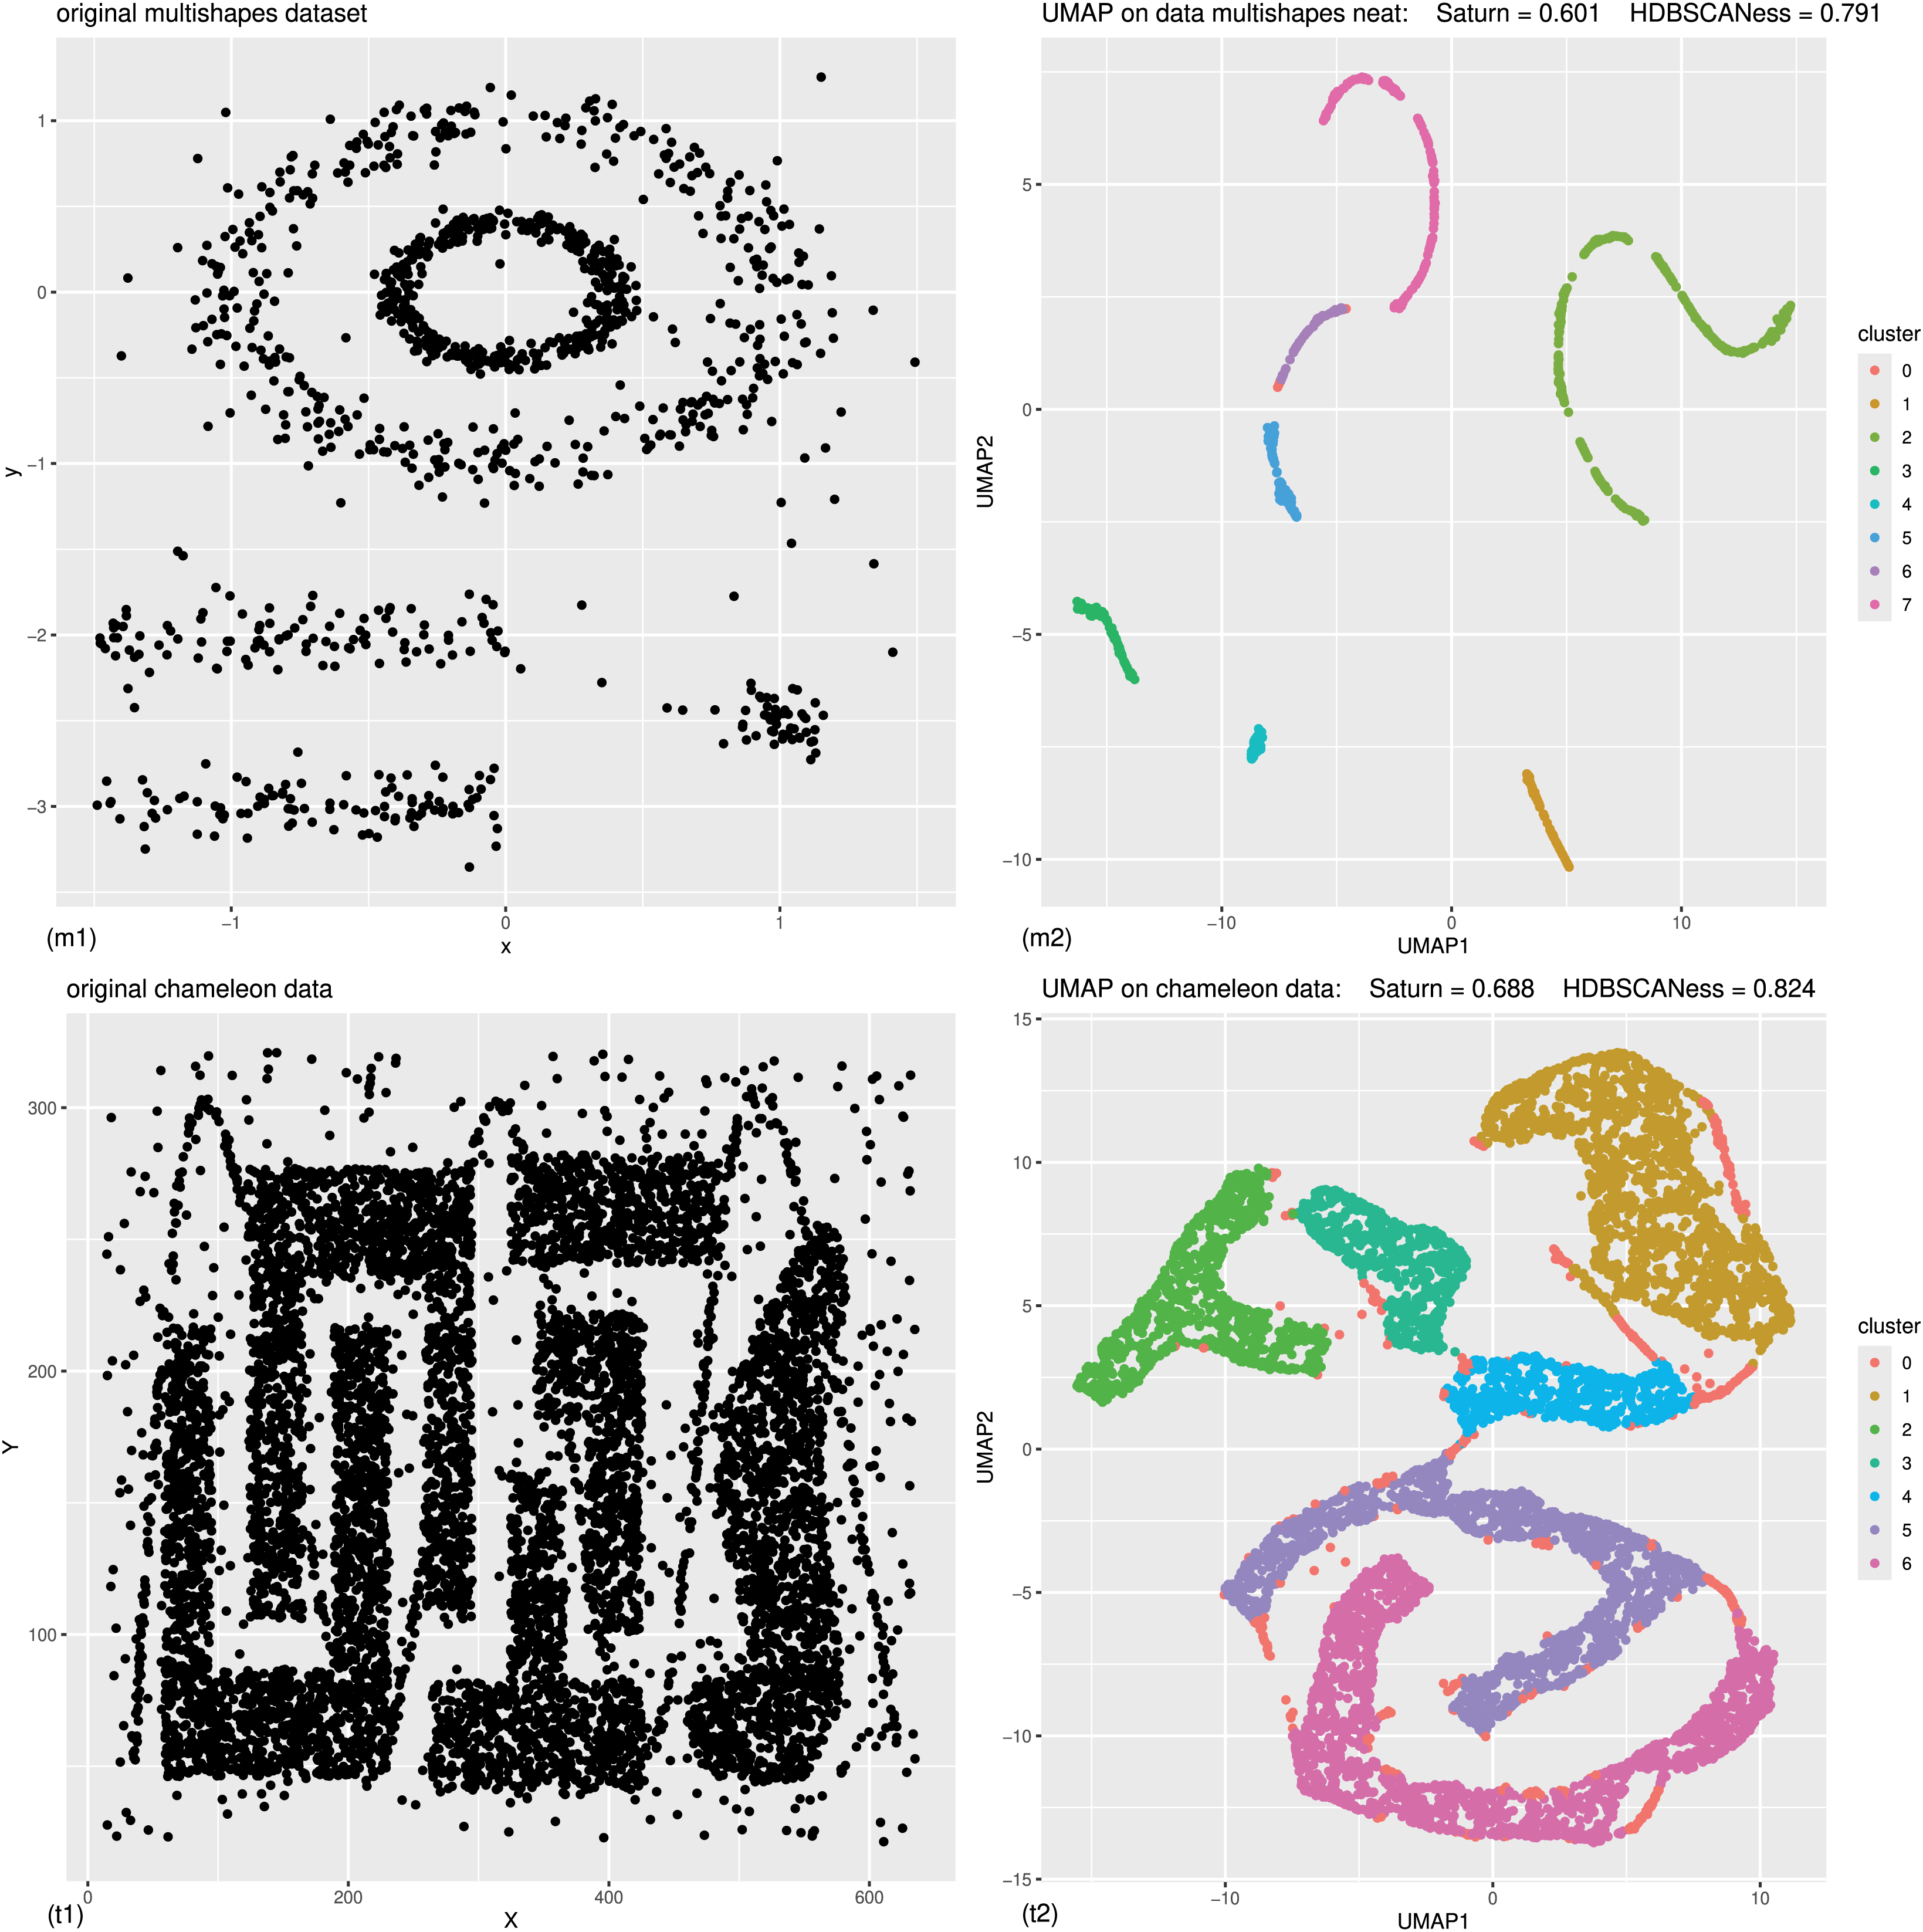
| Dataset | #Rows | #Cols | Saturn | Con | tw | HDBSCANess | Saturn best metric |
|---|---|---|---|---|---|---|---|
| (n) Neat | 1,050 | 2 | 0.5843046 | 0.002663299 | 0.0007567174 | 1.0000000 | ✓ |
| (s) Spiral | 500 | 2 | 0.1795446 | 0.000225579 | 0.0001732125 | 0.9898846 | ✓ |
| (m) Multishapes | 1,100 | 2 | 0.6011429 | 0.005338888 | 0.0036160510 | 0.7909988 | ✓ |
| (t) Chameleon | 8,000 | 2 | 0.6884659 | 0.000354616 | 0.0003618927 | 0.8239774 | ✓ |
| Dataset | #cl | d(S,H) | d(c,H) | d(t,H) | Figure | Noise cluster % | Saturn best metric |
|---|---|---|---|---|---|---|---|
| (n) Neat | 3 | 0.4156954* | 0.9973367 | 0.9992433 | Figure 2n | 0.00% | ✓ |
| (s) Spiral | 5 | 0.8103400* | 0.9896590 | 0.9897114 | Figure 2s | 0.80% | ✓ |
| (m) Multishapes | 7 | 0.1898558* | 0.7856599 | 0.7873827 | Figure 3m | 0.36% | ✓ |
| (t) Chameleon | 6 | 0.1355115* | 0.8236228 | 0.8236155 | Figure 3t | 6.65% | ✓ |
Note:
Saturn coefficient, continuity, and trustworthiness range from 0 to 1, where 0 is the worst possible value and 1 is the best possible value. cols, Columns; con, continuity; cl, clusters; tw, trustworthiness; #clusters, number of clusters found by HDBSCAN both on the original dataset and on the corresponding post-UMAP dimensionality reduction dataset. Saturn best metric, the absolute difference between Saturn coefficient and HDBSCANess is smaller than the absolute difference between continuity and HDBSCANess and than the absolute distance between trustworthiness and HDBSCANess. The asterisk * indicates the smallest distance between Saturn, continuity, and trustworthiness against HDBSCANess. We represent the scores as barcharts in Fig. 4; d(S,H), absolute difference between Saturn coefficient and HDBSCANess; d(c,H), absolute difference between continuity and HDBSCANess; d(t,H), absolute difference between trustworthiness and HDBSCANess.
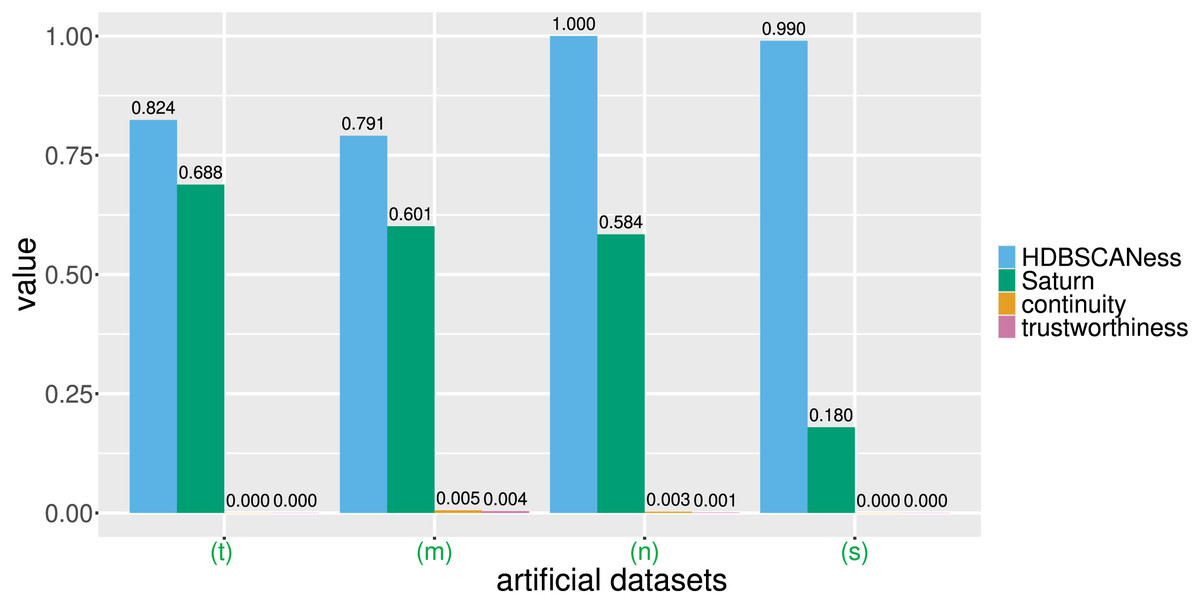
Figure 4: Barcharts of the values of HDBSCANess, Saturn coefficient, continuity, and trustworthiness calculated on the four artificial datasets.
We list all the precise scores in Table 1. (n) Neat data. (m) Multishapes data. (s) Spiral data. (t) Chameleon data. We depict the UMAP dimensionality reductions of these five datasets in Fig. 3. Saturn coefficient, HDBSCANess, trustworthiness, and continuity range from 0 (worst possible outcome) to 1 (best possible outcome).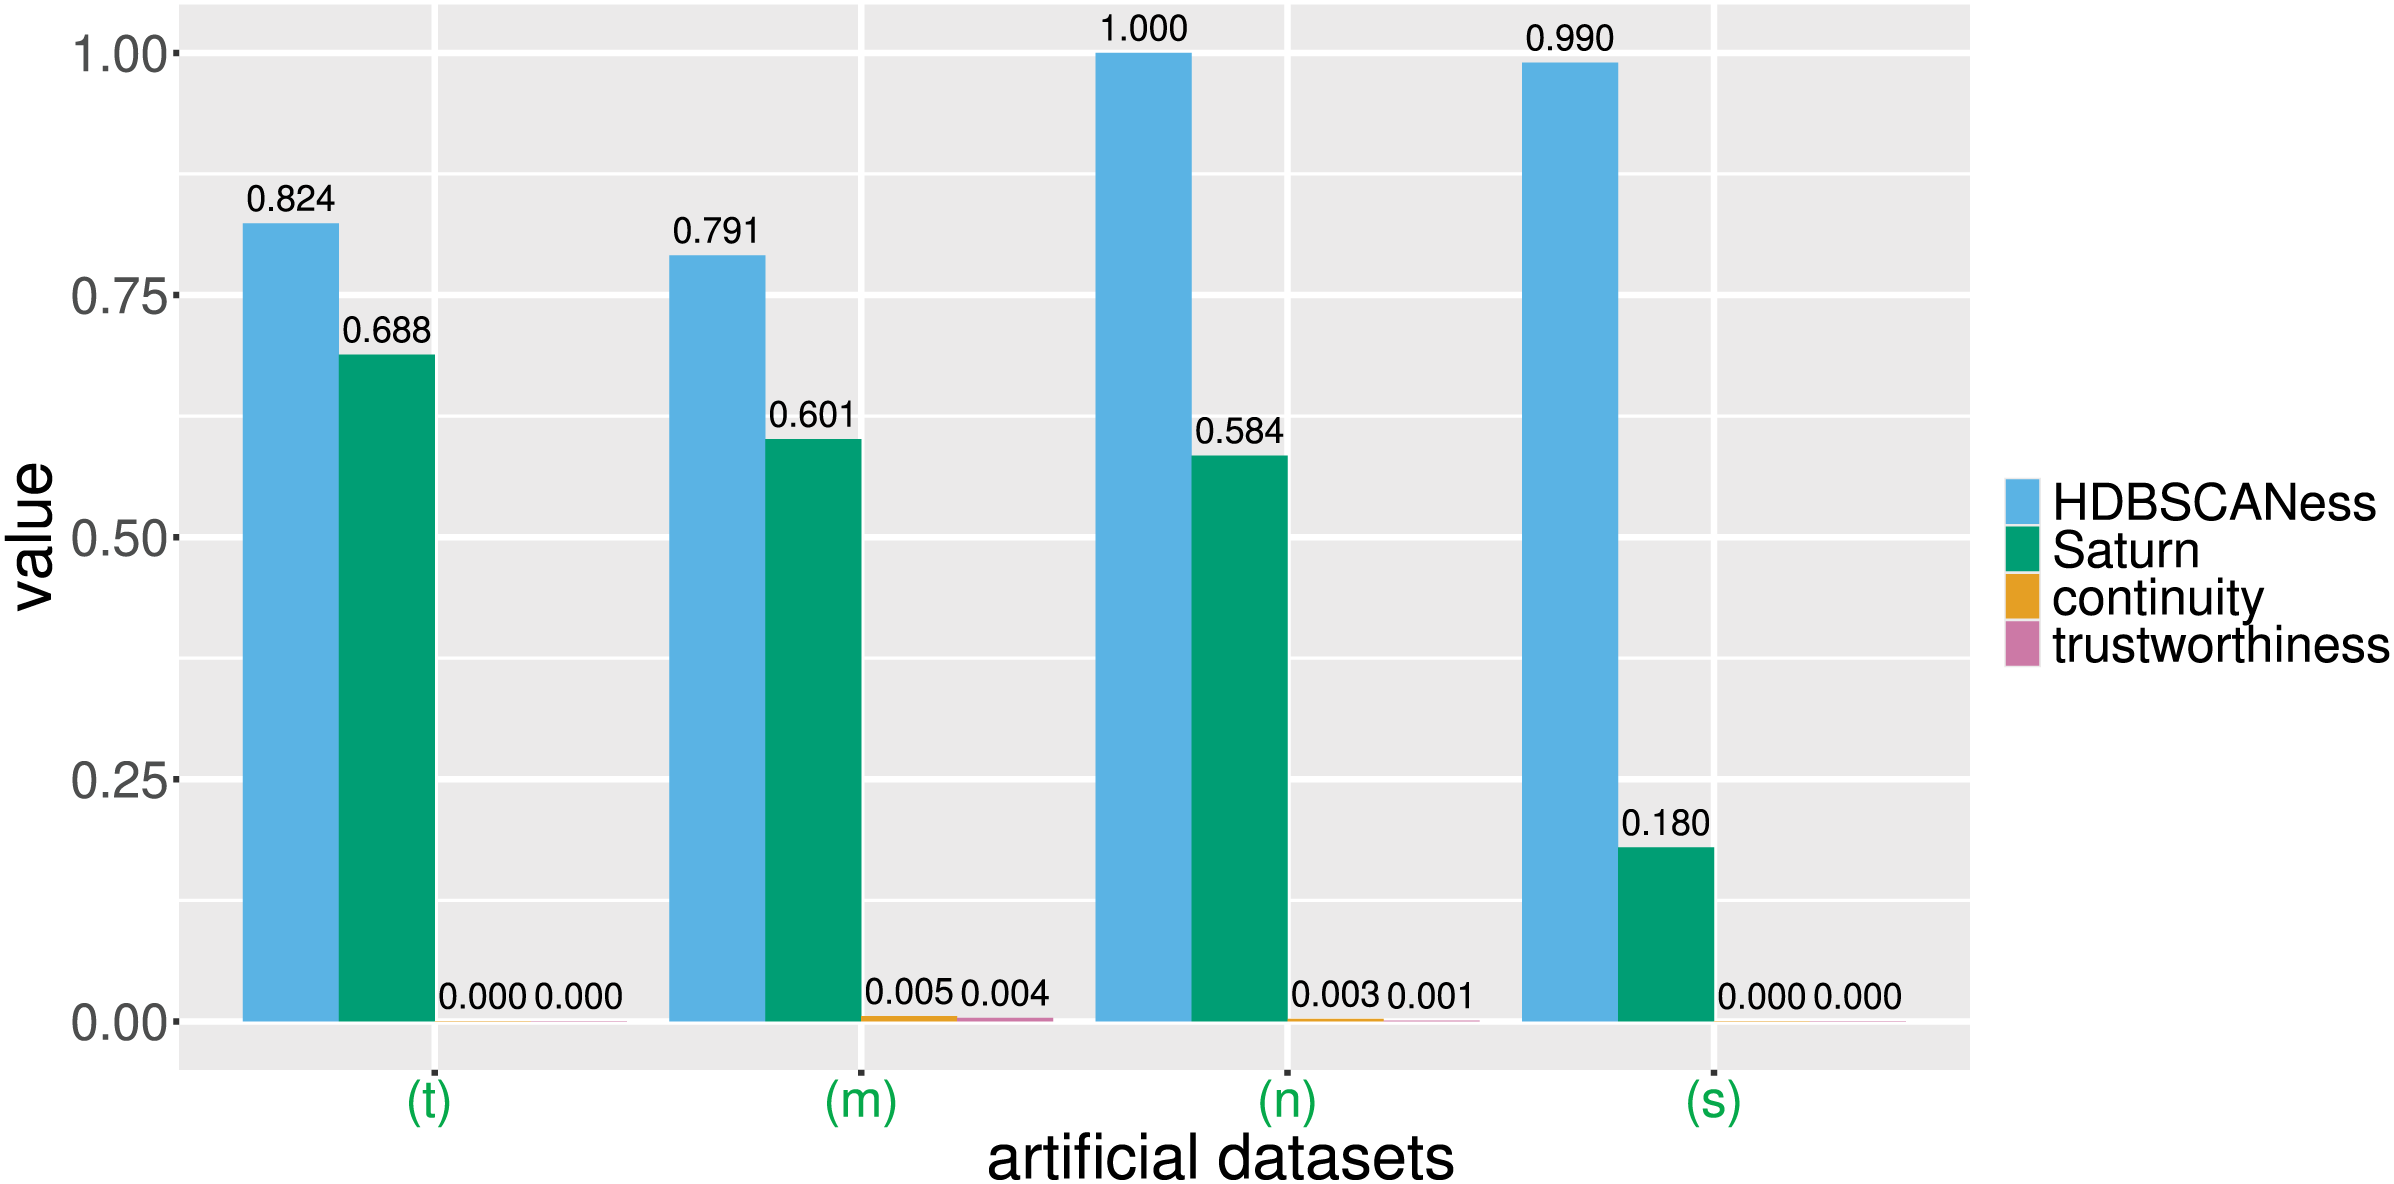
Each of these artificial datasets had 2 columns and varying number of rows (Table 1 and Fig. 4). In all these cases, HDSBCAN identified clear clusters both in the original datasets and in the UMAP low-dimensional projections, generating high HDBSCANess ranging from 0.79 to 1. Our Saturn coefficient outperformed continuity and trustworthiness in all these four cases, producing values in the interval for neat data, multishapes data, and chameleon data, and 0.18 for the spiral data (Table 1 and Fig. 4).
Continuity and trustworthiness had values around 0 for all these four examples, indicating no preservation of the global structure and of the local structure in the UMAP dimensionality reduction (Table 1 and Fig. 4). The results of our Saturn coefficient were consistent with the HDBSCANess results, except in the case of spiral data (Fig. 2s): here our Saturn coefficient resulted being only 0.18 and, even it is closer to the HDBSCANess value than continuity and trustworthiness, indicates a scarce preservation of both global and local structures. We hypothesize that this outcome is due to the circular shape of the spiral dataset (Fig. 2s).
The visual representations of the UMAP results, colored according to the HDBSCAN clusters, clearly indicate that UMAP produced a reasonable low-dimensional representation of the original data and that HDBSCAN was able to correctly identify significant clusters (Figs. 2 and 3). HDBSCAN identified small numbers of clusters for all these datasets (from 3 to 7) and assigned few data points to the noise cluster (from 0% to 6.65%), as we listed in Table 1.
These tests show that our Saturn coefficient resulted being more consistent with the outcomes of HDBSCAN than continuity and trustworthiness in these four particular artificial datasets.
Real-world biomedical datasets
To test our computational pipeline described in Fig. 1, we selected several biomedical datasets from different data types, from different diseases, and from different places of the world.
We applied our approach on 20 datasets, and obtained real results on 15 of them: on 14 datasets derived from electronic health records and one derived from microarray gene expression (Table 2), we obtained values for HDBSCANess to compare with our Saturn coefficient, but on five datasets HDBSCANess resulted being NAs because of the different cluster numbers found. We report the results of our tests on these fifteen datasets in Table 3, we depicted their UMAP representations in Figs. 5 and 6, and represented their results in Fig. 7.
Note:
ICU, Intensive care unit; SIRS, systemic inflammatory response syndrome. #patients, number of rows; #features, number of columns; Saturn best metric, the absolute difference between Saturn coefficient and HDBSCANess is smaller than the absolute difference between continuity and HDBSCANess and than the absolute difference between trustworthiness and HDBSCANess. We used the subset of the GSE38832 colon cancer dataset (Tripathi et al., 2014; Tripathi et al., 2019) made of microarray gene expression by employing only 207 genes of a pan-cancer signature (Chicco et al., 2022) and a prognosis variable.
| Dataset | Saturn | Con | tw | HDBSCANess | Noise cluster % | Saturn best metric |
|---|---|---|---|---|---|---|
| (a) Cardiac arrest | 0.159 | 0.011 | 0.022 | 0.764 | 0% | ✓ |
| (b) Depression and heart failure | 0.326 | 0.015 | 0.011 | 0.960 | 23% | ✓ |
| (c) GSE38832 colon cancer | 0.692 | 0.000 | 0.000 | 0.374 | 1% | ✓ |
| (d) Lung cancer | 0.044 | 0.033 | 0.006 | 0.389 | 28% | ✓ |
| (e) Neuroblastoma Genoa | 0.180 | 0.041 | 0.029 | 0.739 | 0% | ✓ |
| (f) Neuroblastoma Shanghai | 0.246 | 0.005 | 0.003 | 0.546 | 12% | ✓ |
| (g) Glioblastoma Munich | 0.360 | 0.068 | 0.035 | 0.607 | 5% | ✓ |
| (h) Glioblastoma Tainan | 0.112 | 0.068 | 0.028 | 0.540 | 51% | ✓ |
| (i) Sepsis and SIRS | 0.075 | 0.022 | 0.011 | 0.152 | 15% | ✓ |
| (j) Sepsis ICU | 0.037 | 0.028 | 0.005 | 0.389 | 28% | ✓ |
| (k) Preterm sepsis neonates | 0.160 | 0.005 | 0.003 | 0.920 | 1% | ✓ |
| (w) Diabetes type one Sabadell | 0.004 | 0.448 | 0.445 | 0.836 | 2% | ✗ |
| (x) Mesothelioma | 0.017 | 0.029 | 0.014 | 0.375 | 38% | ✗ |
| (y) Neuroblastoma Valencia | 0.122 | 0.675 | 0.675 | 0.771 | 0% | ✗ |
| (z) Neuroblastoma TARGET-NBL | 0.041 | 0.378 | 0.385 | 0.595 | 4% | ✗ |
| Dataset | d(S,H) | d(c,H) | d(t,H) | #Clusters | #Patients/#clusters | Saturn best metric |
|---|---|---|---|---|---|---|
| (a) Cardiac arrest | 0.605* | 0.752 | 0.742 | 2 | 211 | ✓ |
| (b) Depression and heart failure | 0.634* | 0.946 | 0.950 | 2 | 213 | ✓ |
| (c) GSE38832 colon cancer | 0.318* | 0.374 | 0.374 | 2 | 61 | ✓ |
| (d) Lung cancer | 0.344* | 0.355 | 0.382 | 3 | 88 | ✓ |
| (e) Neuroblastoma Genoa | 0.560* | 0.699 | 0.710 | 2 | 1,250 | ✓ |
| (f) Neuroblastoma Shanghai | 0.300* | 0.541 | 0.543 | 3 | 56 | ✓ |
| (g) Glioblastoma Munich | 0.247* | 0.539 | 0.572 | 16 | 4 | ✓ |
| (h) Glioblastoma Tainan | 0.429* | 0.472 | 0.512 | 3 | 28 | ✓ |
| (i) Sepsis and SIRS | 0.077* | 0.129 | 0.141 | 3 | 419 | ✓ |
| (j) Sepsis ICU | 0.352* | 0.361 | 0.384 | 3 | 88 | ✓ |
| (k) Preterm sepsis neonates | 0.760* | 0.915 | 0.917 | 14 | 88 | ✓ |
| (w) Diabetes type one Sabadell | 0.832 | 0.389* | 0.391 | 17 | 5 | ✗ |
| (x) Mesothelioma | 0.358 | 0.346* | 0.361 | 2 | 162 | ✗ |
| (y) Neuroblastoma Valencia | 0.649 | 0.096* | 0.096* | 4 | 5 | ✗ |
| (z) Neuroblastoma TARGET-NBL | 0.554 | 0.217 | 0.210* | 29 | 3 | ✗ |
Note:
Saturn coefficient, continuity, and trustworthiness range from 0 to 1, where 0 is the worst possible value and 1 is the best possible value. con, continuity; SIRS, systemic inflammatory response syndrome; tw, trustworthiness; #clusters, number of clusters found by HDBSCAN both on the original dataset and on the corresponding post-UMAP dimensionality reduction dataset. The asterisk * indicates the smallest distance between Saturn, continuity, and trustworthiness against HDBSCANess. , average number of patients (data points) for each cluster found by HDBSCAN; Saturn best metric, if the absolute difference between Saturn coefficient and HDBSCANess is smaller than the absolute difference between continuity and HDBSCANess and than the absolute distance between trustworthiness and HDBSCANess. The asterisk * indicates the smallest distance between Saturn, continuity, and trustworthiness against HDBSCANess. #patients: number of rows. d(S,H), absolute difference between Saturn coefficient and HDBSCANess; d(c,H), absolute difference between continuity and HDBSCANess; d(t,H), absolute difference between trustworthiness and HDBSCANess. We report the references and the dimensions of the datasets in Table 2 and represent the scores as barcharts in Fig. 7.
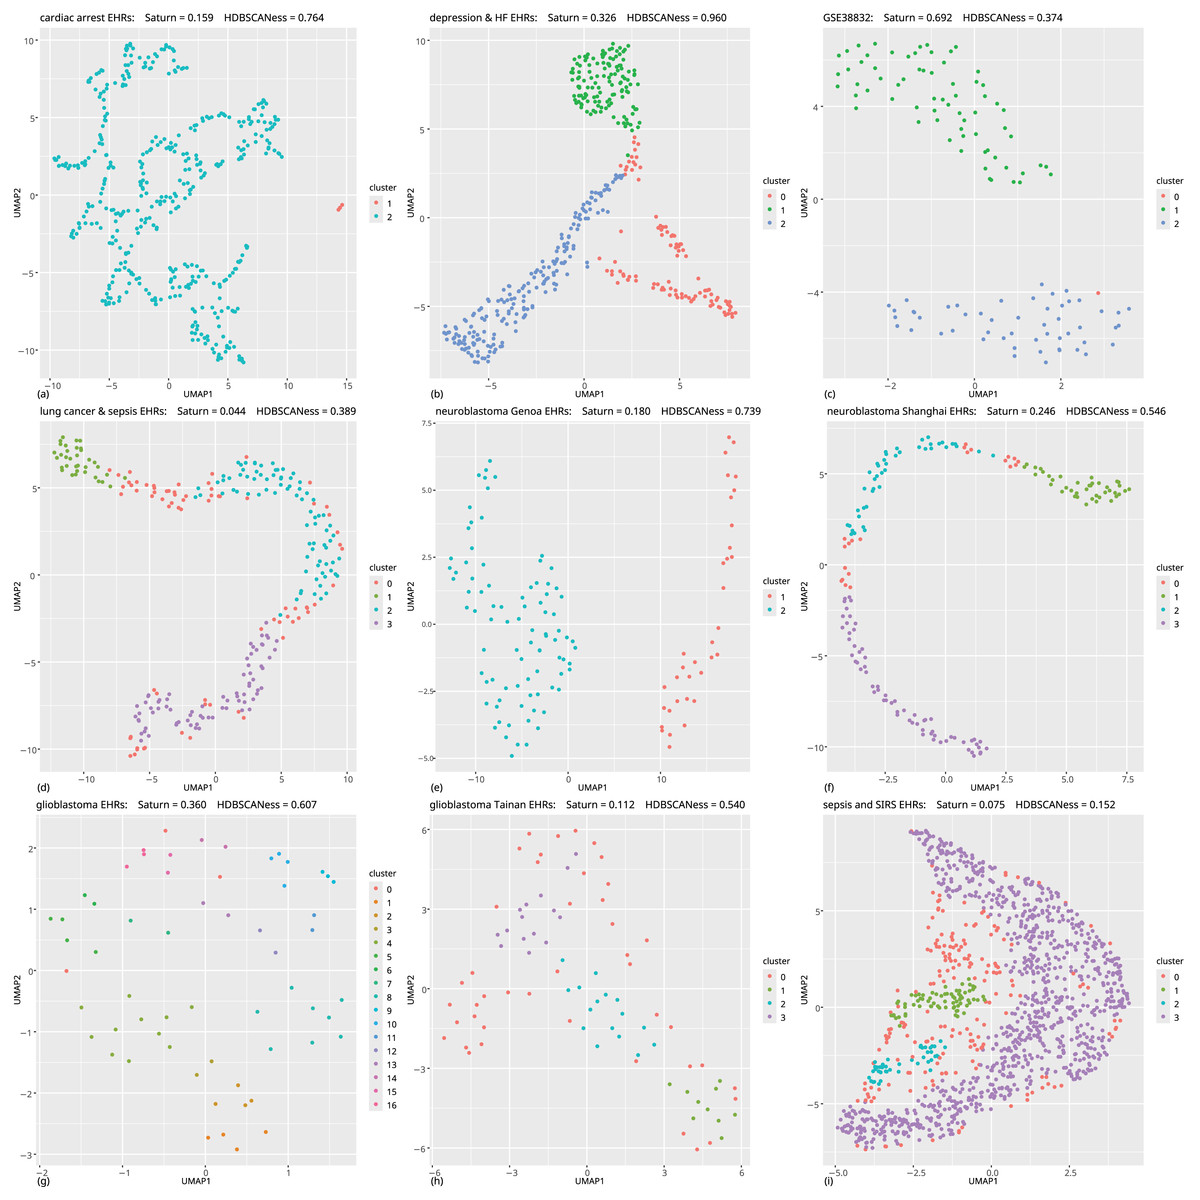
Figure 5: Biomedical datasets: UMAP dimensionality reductions of multiple datasets of real-world biomedical data (first part).
In all these tests the Saturn coefficient outperformed continuity and trustworthiness. (A) Cardiac arrest (Requena-Morales et al., 2017): HDBSCAN 5 miminal points, UMAP 5 neighbors, UMAP 0.5 minimal distance. (B) Depression and heart failure (Jani et al., 2016; Cerono, Melaiu & Chicco, 2024): HDBSCAN 40 minimal points, UMAP 30 neighbors, UMAP 0.5 minimal distance. (C) GSE38832 colon cancer gene expression (Tripathi et al., 2014; Chicco et al., 2022): HDBSCAN 5 minimal points, UMAP 15 neighbors, UMAP 0.5 minimal distance. (D) Lung cancer (Song et al., 2019): HDBSCAN 20 minimal points, UMAP 30 neighbors, UMAP 0.99 minimal distance. (E) Neuroblastoma Genoa dataset (Chicco et al., 2023): HDBSCAN 5 minimal points, UMAP 5 neighbors, UMAP 0.99 minimal distance. (F) Neuroblastoma Shanghai (Ma et al., 2018; Chicco, Cerono & Cangelosi, 2022): HDBSCAN 15 miminal points, UMAP 30 neighbors, UMAP 0.4 minimal distance. (G) Glioblastoma Munich (Lämmer et al., 2019; Cerono, Melaiu & Chicco, 2024): HDBSCAN 2 minimal points, UMAP 30 neighbors, UMAP 0.1 minimal distance. (H) Glioblastoma Tainan (Shieh et al., 2020; Cerono, Melaiu & Chicco, 2024): HDBSCAN 10 minimal points, UMAP 30 neighbors, UMAP 0.99 minimal distance. (I) Sepsis and SIRS (Gucyetmez & Atalan, 2016; Mollura et al., 2024): HDBSCAN 20 minimal points, UMAP 50 neighbors, UMAP 0.4 minimal distance. The colors in the UMAP plots represent the clusters found by HDBSCAN. Saturn coefficient, trustworthiness, continuity, and HDBSCANess range from 0 (worst possible outcome) to 1 (best possible outcome).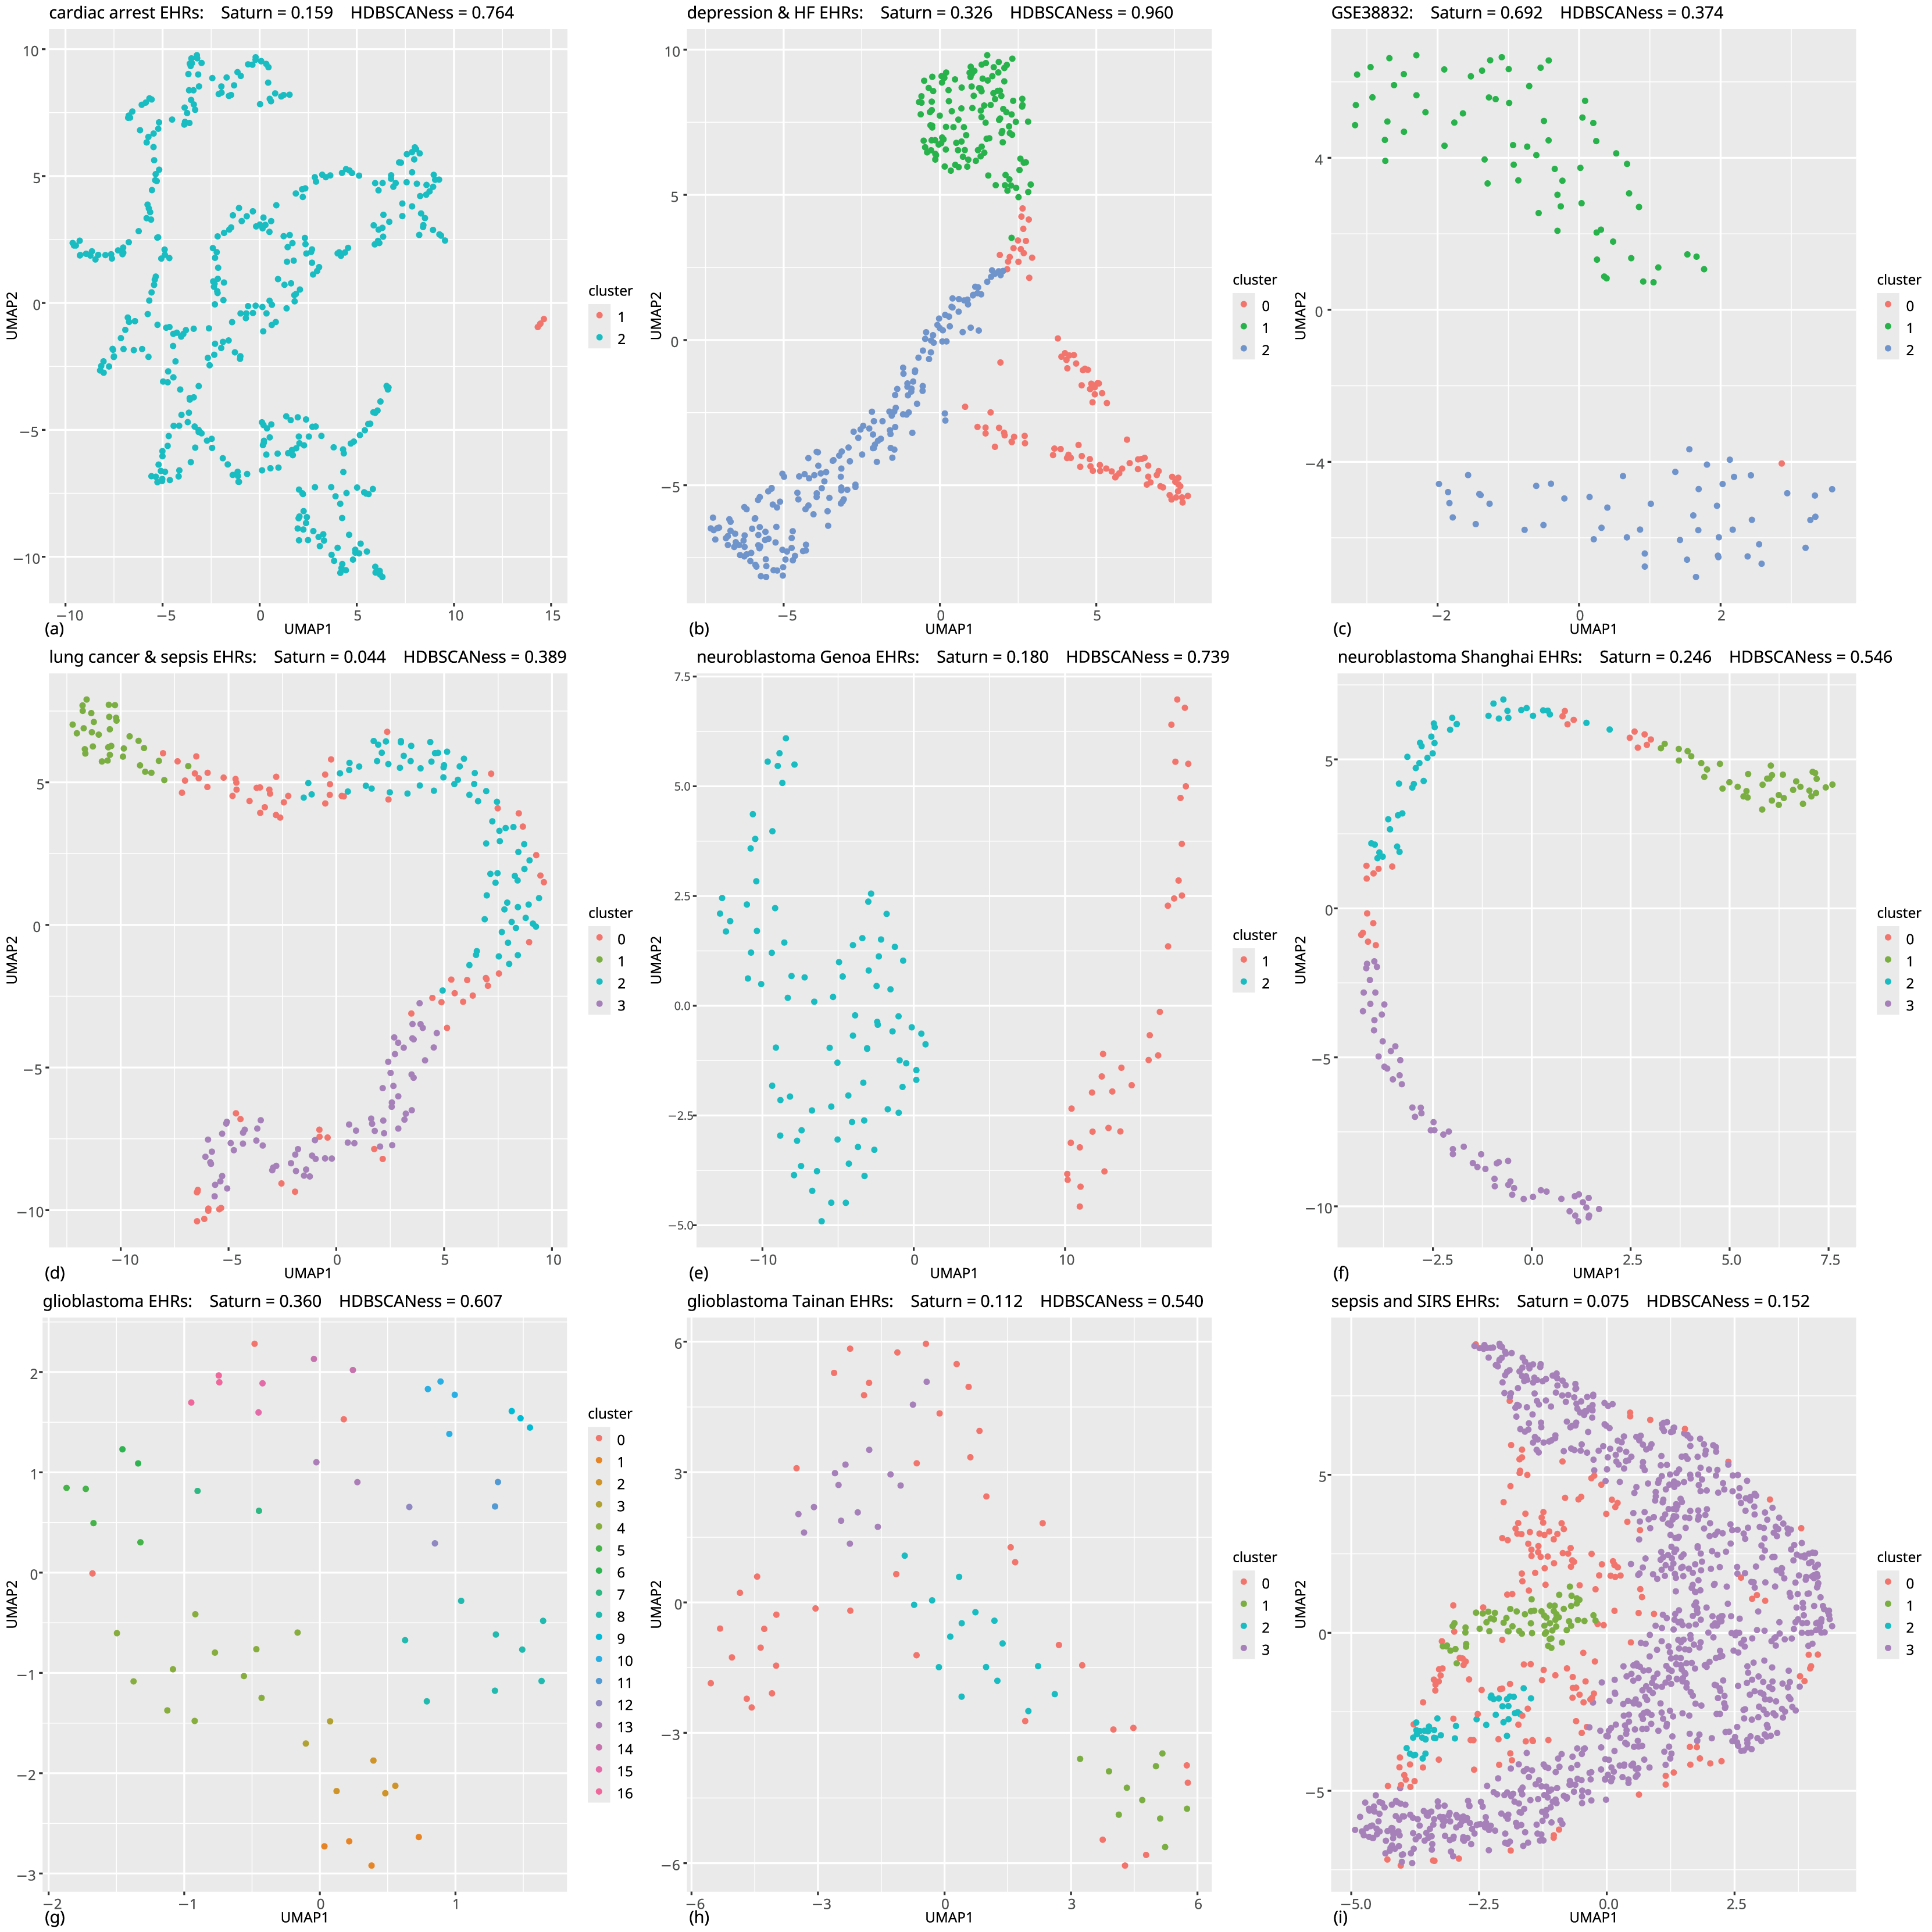
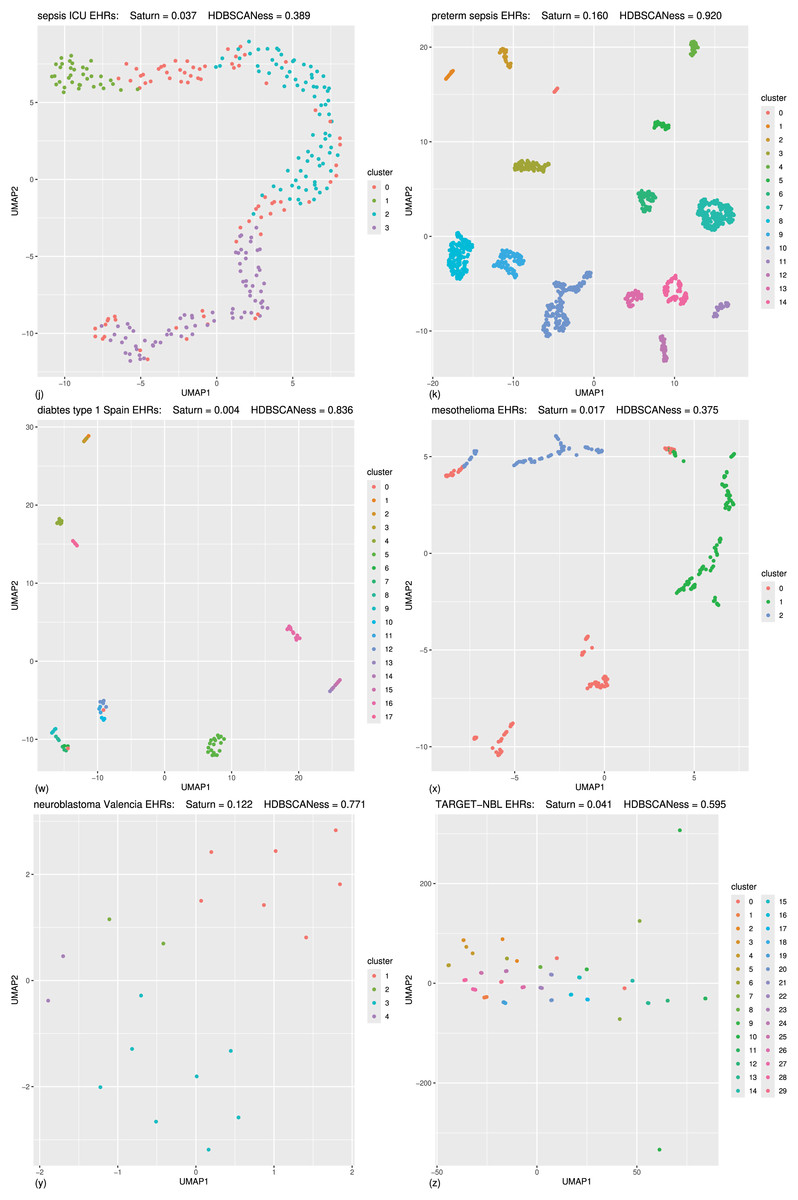
Figure 6: Biomedical datasets: UMAP dimensionality reductions of multiple datasets of real-world biomedical data (second part).
In the following (J) and (K) tests the Saturn coefficient outperformed continuity and trustworthiness. (J) Sepsis ICU (Gao et al., 2024): HDBSCAN 20 minimal points, UMAP 30 neighbors, UMAP 0.99 minimal distance. (K) Preterm sepsis neonates (McArdle et al., 2016; Chicco & Jurman, 2020): HDBSCAN 20 minimal points, UMAP 30 neighbors, UMAP 0.5 minimal distance. In the following (W), (X), (Y), and (Z) tests the Saturn coefficient is outperformed by continuity and trustworthiness. (W) Diabetes type one Sabadell (Llauradó et al., 2017): HDBSCAN 2 minimal points, UMAP 5 neighbors, UMAP 0.4 minimal distance. (X) Mesothelioma (Er et al., 2012; Chicco & Rovelli, 2019): HDBSCAN 50 minimal points, UMAP 10 neighbors, UMAP 0.001 minimal distance. (Y) Neuroblastoma Valencia (Villamón et al., 2013): HDBSCAN 2 minimal points, UMAP 10 neighbors, UMAP 0.5 minimal distance. (Z) Neuroblastoma TARGET-NBL (National Cancer Institute, 2022; National Cancer Institute, Center for Cancer Genomics, 2024; Kimura et al., 2021): HDBSCAN 2 minimal points, UMAP 0.4 minimal distance, UMAP 2 neighbors. The colors in the UMAP plots represent the clusters found by HDBSCAN. Saturn coefficient, trustworthiness, continuity, and HDBSCANess ranges from 0 (worst possible outcome) to 1 (best possible outcome).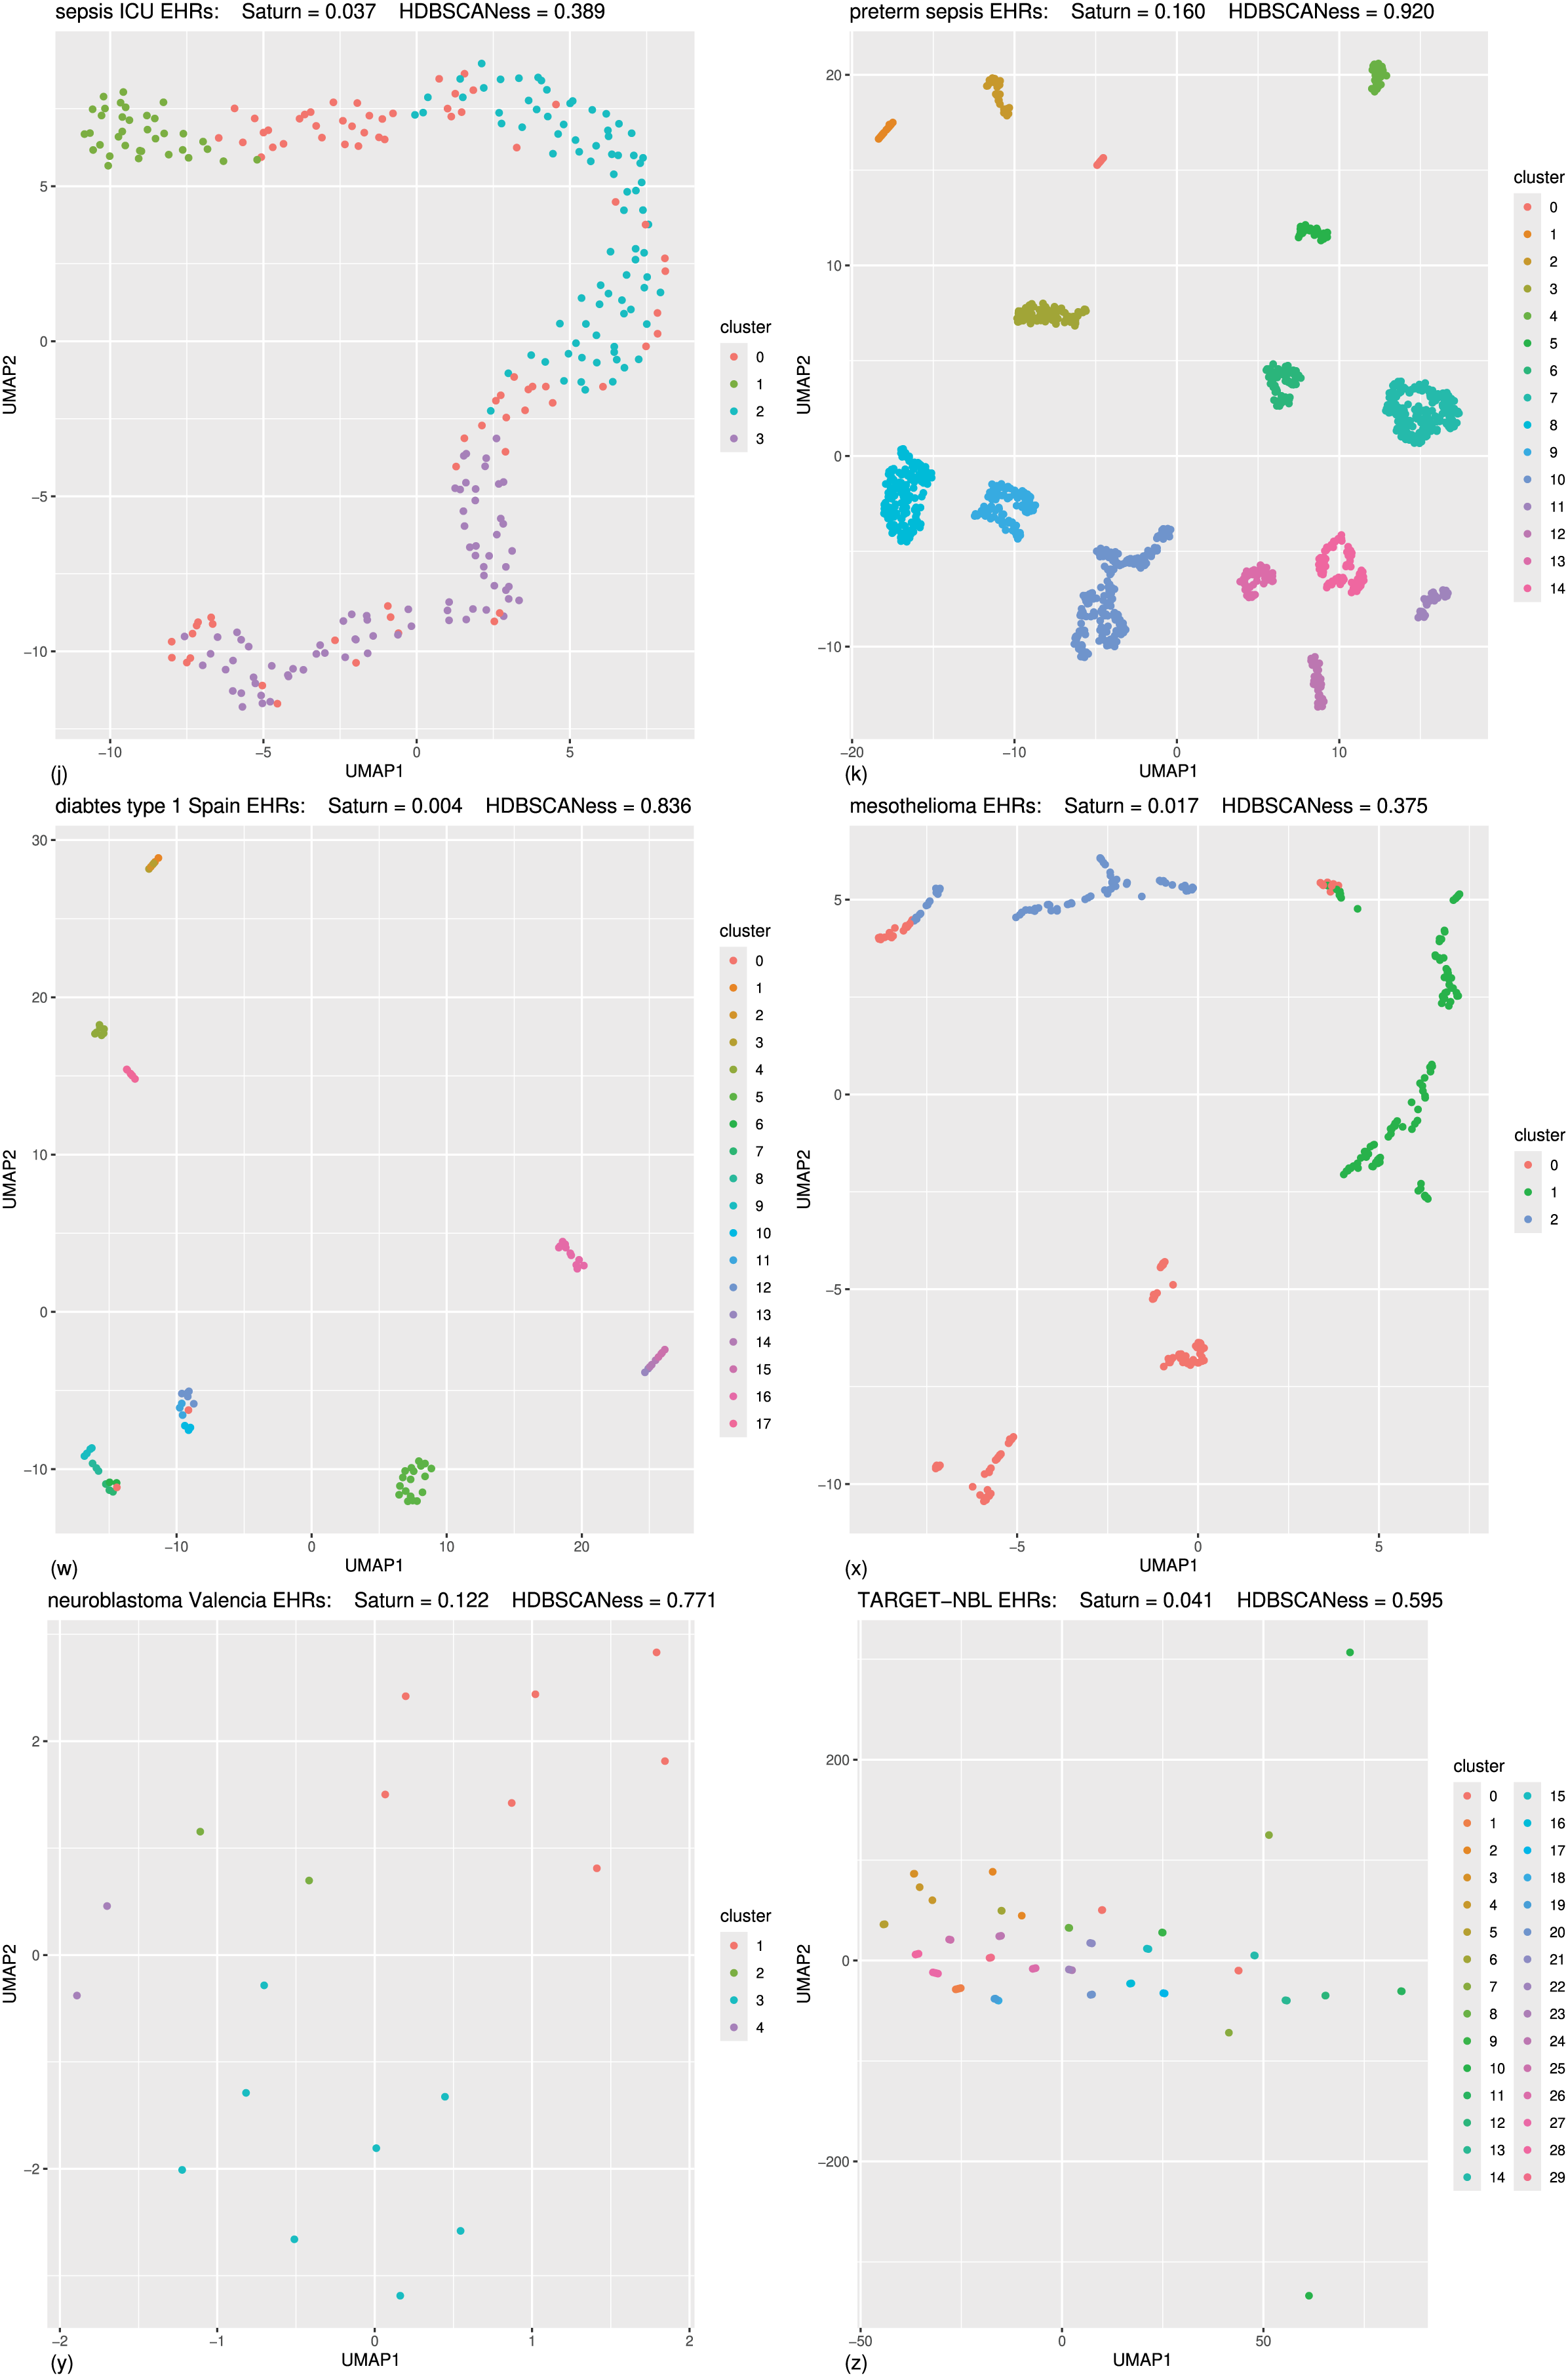
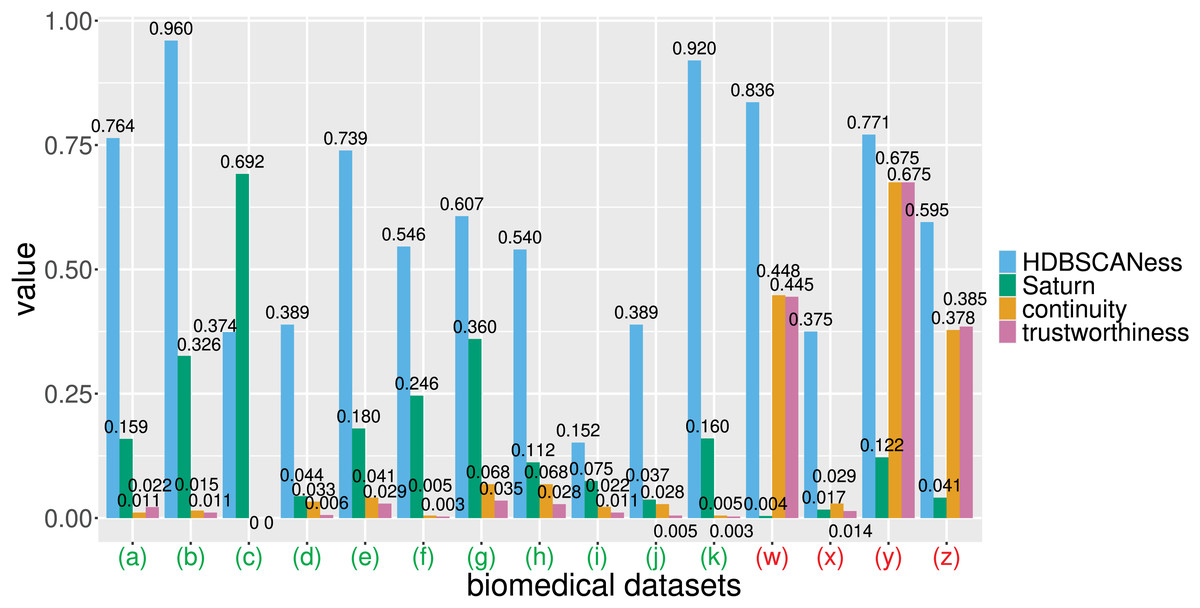
Figure 7: Barcharts of the values of HDBSCANess, Saturn coefficient, continuity, and trustworthiness calculated on the fifteen biomedical datasets.
We listed all the precise scores in Table 2. (A) Cardiac arrest dataset (B) depression and heart failure dataset. (C) GSE38832 colon cancer microarray dataset. (E) Neuroblastoma Genoa dataset. (F) Neuroblastoma Shanghai dataset. (G) Glioblastoma Munich dataset. (H) Glioblastoma Tainan dataset. (I) Sepsis and SIRS dataset. (J) sepsis ICU dataset. (K) Preterm sepsis neonates dataset. (W) Diabetes type one Sabadell dataset. (X) Mesothelioma dataset. (Y) Neuroblastoma Valencia dataset. (Z) Neuroblastoma TARGET-NBL dataset. We depicted the UMAP dimensionality reductions of these five datasets in Figs. 5 and 6. Saturn coefficient, HDBSCANess, trustworthiness, and continuity range from 0 (worst possible outcome) to 1 (best possible outcome).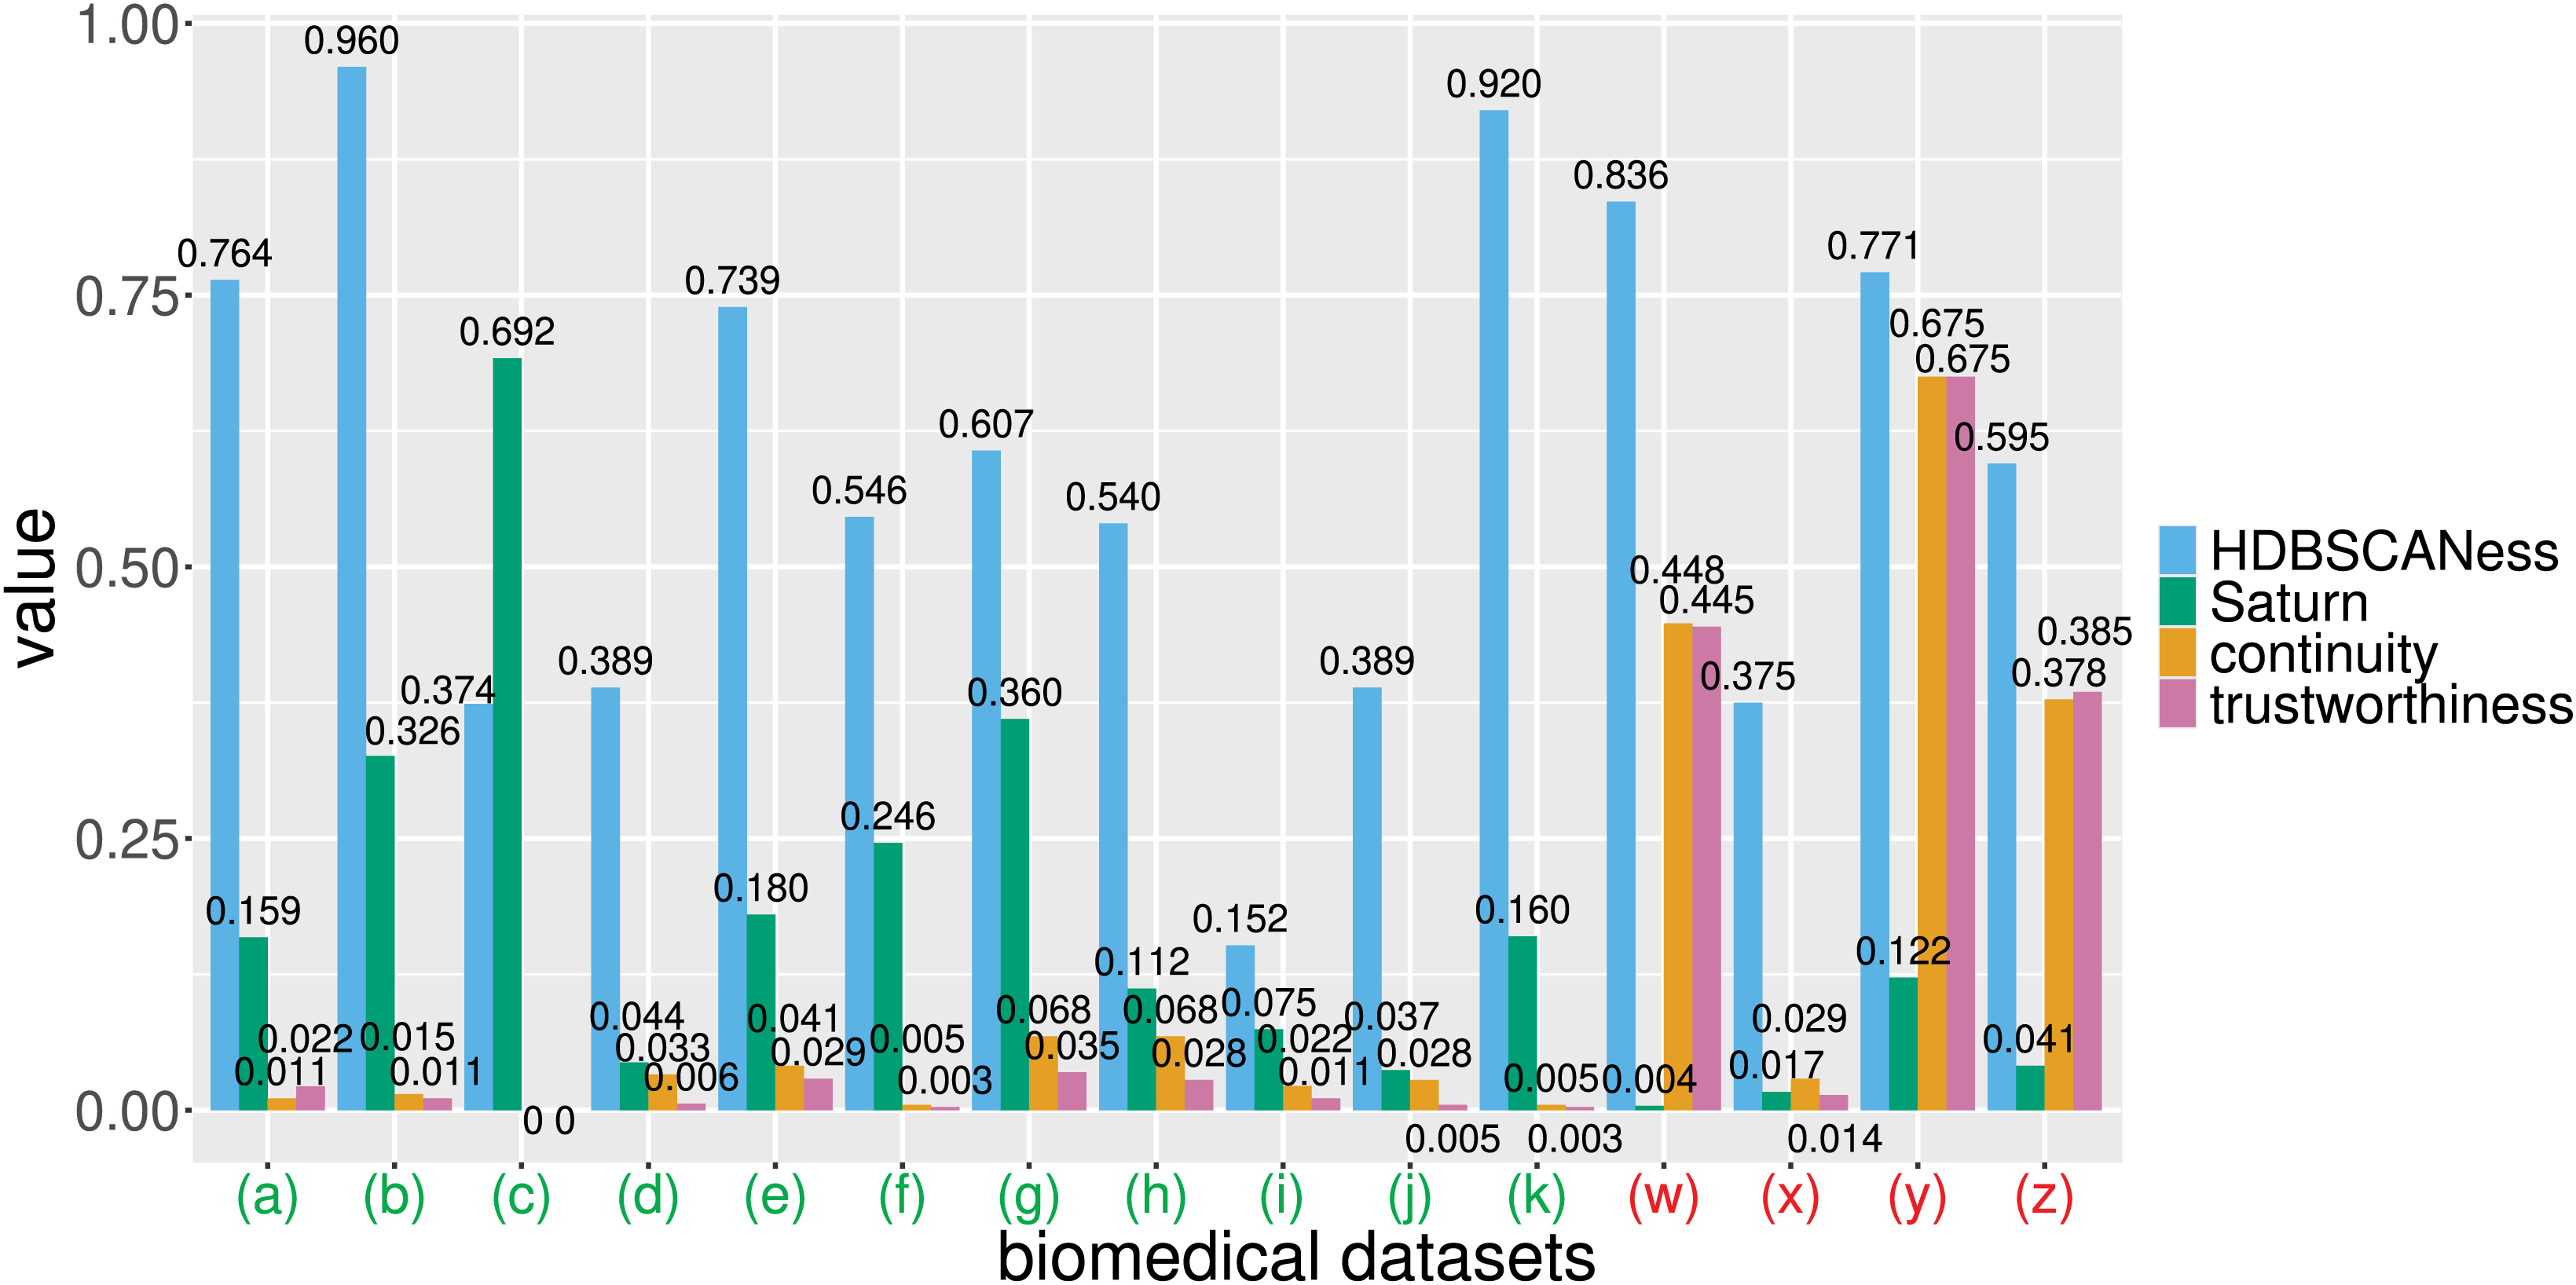
All these datasets are represented through tables, where patients’ profiles are in the rows and clinical features are in the columns.
Our Saturn coefficient outperformed continuity and trustworthiness on 11 datasets out of 15, meaning on 73% of all cases (Table 3 and Fig. 7). Saturn coefficient, continuity, trustworthiness all did not work on the mesothelioma (x) dataset, all getting values around 0 while HDBSCANess was around 0.4 (Table 3).
Our Saturn coefficient was outperformed by trustworthiness in (z) and (w) seemingly because there are many clusters (29 and 17) and few patients per cluster (3 and 5). The (g) dataset test also has many clusters (16) and few patients per cluster (4), though, but our Saturn beats continuity and trustworthiness there.
Our Saturn coefficient performed poorly on the (y) dataset probably because it is tiny: only 19 data records; Curiously, for the GSE38832 colon cancer microarray dataset continuity and trustworthiness are 0 and Saturn coefficient is higher than HDBSCANess (it is the only case).
The noise cluster percentage does not seem to influence the three scores.
A clear data structure seems to be present for the UMAP representations of most of the datasets: in Figs. 5A–5F, 5I, 6J, 6K, and somehow also in Fig. 6X. Our Saturn coefficient was able to capture the HDBSCAN cluster consistency in all these cases except on the (x) dataset.
We see no clear structure in Figs. 6W, 6Y, and 6Z, which are also the tests where continuity and trustworthiness outperformed our Saturn coefficient.
From the visual plots generated for the UMAP outcomes and colored by the HDBSCAN clusters, we can notice that our Saturn coefficient suffered when the clusters are densely sparse, as we can see in the Figs. 6W, 6Y, and 6Z cases.
Attempted tests on other biomedical datasets. We also attempted to execute our validation approach on other biomedical datasets, but these tests all resulted NA: HDBSCAN was unable to find relevant clusters on the original datasets or in the low-space dimensional projection, or the number of clusters found by HDBSCAN on UMAP’s output was different from the number of clusters found by HDBSCAN on the original dataset. These datasets included data derived from electronic health records (chronic kidney disease (Al-Shamsi, Regmi & Govender, 2018; Chicco, Lovejoy & Oneto, 2021)), cerebrovascular arterial disease (Le Gall et al., 2018; Chicco & Jurman, 2021), glioblastoma (Berendsen et al., 2019; Cerono, Melaiu & Chicco, 2024), physiological data derived from electrograms (brain electroencephalography epileptic seizures from PhysioNet (Kaggle, 2021), bioinformatics data derived from microarray gene expression (GSE58445 dataset of leukemia (Iqbal et al., 2014)). We applied our computational pipeline described in Fig. 1 by using several values for the hyperparameter of HDBSCAN (minimal points) and UMAP (number of neighbors and minimal distance), but we could not generate any real value for HDBSCANess, which resulted being always NA. We therefore discarded these tests. It is relevant to notice that our Saturn coefficient always generates a real result between 0 and 1, and produced a result also in all these discarded tests, where HDBSCANess resulted being NA.
Discussion and conclusions
UMAP result assessment. Clustering and dimensionality reductions are two families of unsupervised machine learning methods, where the ground truth labels are unavailable. In this context, there is no real truth that can be employed to assess the validity of the results obtained, making this evaluation particularly challenging.
Dimensionality reduction methods are an useful tool to generate a low-dimensional version of the original high-dimensional dataset, and UMAP is one of the most effective techniques of this family. Researchers usually evaluate the results of UMAP by sight, by eye balling the plot of the 2D representation of the dataset produced by UMAP. Continuity and trustworthiness are statistical metrics sometimes employed to statistically evaluate the preservation of the local structure and of the global structure, but can be misleading or ineffective.
In this study, we solve this problem by proposing our Saturn coefficient, a statistical score which says how much the dimensionality reduction structure is consistent with the original dataset structure. Our Saturn coefficient represents a balance between local structure conservation and global structure conservation, and ranges from 0 (no conservation) to 1 (perfect local and global conservations). We provide our Saturn coefficient both as a standalone open source R package on CRAN and as a standalone open source Python package on PyPI. Our proposed statistic offers multiple application possibilities: for example, it can be employed to evaluate a set of UMAP’s hyperparameters, helping a researcher to pick the best configuration.
HDBSCANess. To assess the validity of our proposed statistic in this purely unsupervised scenario, we invented another metric called HDBSCANess. This score evaluates the consistency between the clusters found by HDBSCAN on the original dataset and the clusters found by HDBSCAN on the UMAP low-dimensional representation. We used this newly introduced HDBSCANess as ground truth to assess the performance of our Saturn coefficient and its competitors, continuity and trustworthiness. For each dataset, we tested our approach by using multiple combinations of hyperparameters of HDBSCAN and of UMAP.
Saturn coefficient: an effective UMAP outcome evaluation tool. We executed tests both on artificial data and on real-world biomedical datasets, derived from electronic health records and microarray gene expression of various diseases. Our Saturn coefficient outperformed continuity and trustworthiness on all the four artificial datasets and on eleven out of fifteen biomedical datasets.
Our tests also indicated that our Saturn coefficient is less effective than continuity and trustworthiness when there are many clusters found by HDBSCAN (29 and 17, for example) and when the data points are few (19 data rows, for example). In these few cases, we recommend using continuity and trustworthiness together with our proposed Saturn coefficient.
As mentioned earlier, only the study of Huang et al. (2022), to the best of our knowledge, proposes a way to assess the preservation of global and local structures after dimensionality reduction. Even if that study has some merit, our approach has several advantages, since it takes into account the distances between all the data points of a dataset, and not only three or five neighboring points.
Continuity and trustworthiness: more shadows than lights. By observing the results of the tests we performed both on the artificial datasets and on the biomedical datasets, we noticed that the values of continuity and trustworthiness were often extremely low. Among all the tests on the four artificial datasets, continuity and trustworthiness were always around zero, which actually meant no local structure preservation and no global structure preservation: this result is inconsistent with the clear presence of geometrical structures of in the artificial datasets and of the clusters identified by HDBSCAN. In that case, reliable metrics would have generated a high outcome, as Saturn coefficient did. These results clearly indicate that continuity and trustworthiness can often be unreliable statistics.
On the biomedical data tests, continuity and trustworthiness generated very low values between 0 and 0.028 for the (a), (b), (c), (d), (e), (f), (g), (h), (i), (j), (k), and (x) datasets, values around 0.45 for the (w) dataset, values around 0.38 for the (z) dataset, and values equal to 0.675 for the (y) dataset. That means that most of the times, continuity and trustworthiness claimed the absence of preservation of global structure and local structure, even if HDBSCANess noticing a preservation of the density-based clusters before and after applying UMAP. These results show that continuity and trustworthiness can be misleading statistics.
Limitations and future developments. We tested our Saturn coefficient only on biomedical datasets, and did not apply to other scientific domains such as physics, finance, social science, or anything else. We made the decision to use only health datasets because biomedical informatics is the scientific theme that we know better, but we believe our approach can be effective on any data type.
Moreover, we did not test our metric and the HDBSCANess on high-dimensional datasets such as the ones derived from single-cell RNA-seq technologies, which typically might have around 20 thousand genetic features (Saliba et al., 2014). We plan to perform tests on these datasets in the future.
Our decision to employ the Euclidean distance for the computation of the Saturn coefficient can also been questioned. Other geometrical distances, such as the cosine distance, the Minkowski distance, or the Manhattan distance could be considered in the future.
We acknowledge that our invented coefficient of HDBSCANess, that we employed as gold standard, measures something slightly different from our Saturn coefficient. That being said, we consider it as the best possible option for our present conditions.
Regarding generalizability, we recognize that our Saturn coefficient might not be limited to UMAP, but could work well with dimensionality reduction results produced by other methods such as PCA or t-SNE, as well. However, the exploration of these possibilities goes beyond the scope of our study.
In the future, we look forward to receiving feedback from users and researchers to develop a new, improved version of our Saturn coefficient. We also plan to compare the behavior of our Saturn score with other dimensionality reduction coefficients (Nonato & Aupetit, 2019; Machado, Behrisch & Telea, 2025; Jin et al., 2023; Bae, Jeon & Seo, 2025; Jeon et al., 2025b).
Ethics approval and consent to participate
Permission to collect and analyze the data from patients involved in this study has been obtained from the original dataset curators, as stated in the datasets original articles (Requena-Morales et al., 2017; Jani et al., 2016; Cerono, Melaiu & Chicco, 2024; Lämmer et al., 2019; Cerono, Melaiu & Chicco, 2024; Shieh et al., 2020; Cerono, Melaiu & Chicco, 2024; Ma et al., 2018; Chicco, Cerono & Cangelosi, 2022; McArdle et al., 2016; Chicco & Jurman, 2020; Gucyetmez & Atalan, 2016; Mollura et al., 2024; Er et al., 2012; Chicco & Rovelli, 2019; National Cancer Institute, 2022; National Cancer Institute, Center for Cancer Genomics, 2024; Kimura et al., 2021).