
A Gaussian SVR-based intelligent framework for investment risk assessment in green finance
- Published
- Accepted
- Received
- Academic Editor
- Osama Sohaib
- Subject Areas
- Bioinformatics, Algorithms and Analysis of Algorithms, Data Mining and Machine Learning, Data Science, Software Engineering
- Keywords
- SVR, Gaussian kernel function, Regression analysis, Intelligent risk assessment, Data science, Social computing
- Copyright
- © 2025 Gong and Arshad
- Licence
- This is an open access article distributed under the terms of the Creative Commons Attribution License, which permits unrestricted use, distribution, reproduction and adaptation in any medium and for any purpose provided that it is properly attributed. For attribution, the original author(s), title, publication source (PeerJ Computer Science) and either DOI or URL of the article must be cited.
- Cite this article
- 2025. A Gaussian SVR-based intelligent framework for investment risk assessment in green finance. PeerJ Computer Science 11:e3422 https://doi.org/10.7717/peerj-cs.3422
Abstract
To enhance the efficiency and objectivity of investment risk assessment in green finance, this article proposes an intelligent evaluation model based on Gaussian kernel Support Vector Regression (SVR). The methodology begins by constructing a three-dimensional risk indicator system grounded in ESG (Environmental, Social, Governance) principles. Weights for each dimension are derived using the Analytic Hierarchy Process (AHP), and expert scores for 50 green industry projects are collected and normalized to generate standardized investment probability labels. These scores form three-dimensional feature vectors that serve as inputs to the SVR model. A Gaussian kernel function is employed to improve nonlinear mapping and address feature discreteness and weak inter-indicator correlation. The model is trained and validated via five-fold cross-validation to ensure robustness and generalizability. Experimental results demonstrate that the proposed model achieves the lowest Root Mean Square Error (RMSE = 0.096) compared to linear regression, tree-based regression, neural networks, and linear-kernel SVR. This confirms the effectiveness of the approach for small-sample scenarios and highlights its potential as a reliable and scalable tool for intelligent risk assessment in early-stage green finance applications.
Introduction
Since the end of World War II, the economy has entered the fast track of development, but serious environmental pollution has followed. At the same time, in order to pursue economic development and unrestrained activities, carbon dioxide and greenhouse gas emissions have soared year by year, posing a great threat to the life system on the earth (Bhatt et al., 2023). In order to cope with the economic development problem under the global warming environment, countries around the world have slowed down greenhouse gas emissions through global agreements, so China has proposed the goals of carbon peak and carbon neutrality. In order to accomplish this task, China has vigorously developed the green economy and regarded it as one of its long-term development strategies, emphasizing the pursuit of a win-win high-quality growth model that coordinates economic and social development with low-carbon environmental protection. In today’s economic development, the financial system plays an important role and is an important lever for macroeconomic regulation. Therefore, it is imperative to vigorously develop green finance if we want to realize the green and low-carbon transformation of the economy (Sun, 2022). The earliest theoretical exploration of the green finance theory can be traced back to the 1980s. It was not an independent scientific theoretical system in its early days. It was not until the late 1990s that it became independent, and emphasized the need to pay attention to low-carbon and sustainability in the process of financial development overshoot (Salazar, 1998).
The development of green finance can’t be separated from the support of science and technology. Artificial intelligence, Internet of Things and cloud computing technology have played a great role in the transformation of the green finance industry (Hemanand et al., 2022). At present, the green investment industry is at the initial stage of development, lacking systematic investment evaluation, and there are certain barriers in the investment process, which hinder the rapid development of green finance (Khan et al., 2024). Taking green credit as an example, commercial banks need to constantly develop and innovate credit products and services in the process of providing credit services for green industries, but the new model of the industry makes investors lack confidence and worries that the appearance of bad debts is extremely unfavorable to industrial transformation (Agrawal & Nargund, 2024). Whether green finance can continue to develop healthily or not, the risk level assessment of the investment project background plays a vital role. In risk assessment, a large number of human and material resources are usually used. After background investigation, a large number of professionals are required to conduct a comprehensive assessment of project information from multiple dimensions. Its workload, assessment efficiency and energy consumption run counter to the original intention of green development. Therefore, a rapid and intelligent risk evaluation system is urgently needed to determine the risk level of project investment, provide reference for investors, and accelerate the investment process (Berrou, Dessertine & Migliorelli, 2019).
Investment risk assessment can be regarded as a regression problem of multi-objective decision-making, and the final decision is achieved through the assessment of the social impact of the project and its own ability (Anadu et al., 2020). Therefore, the best way to solve this kind of problem is to quantify the common indicators in investment by levels and complete intelligent decision-making through machine learning methods. Such problems are very suitable to be solved by statistical learning methods in machine learning. Statistical learning theory is a theory that studies the statistical laws when the sample data volume is limited, and is suitable for regression prediction learning of small samples (Gerbelot et al., 2024). Common statistical regression methods include linear regression method, tree regression method and Support Vector Regression (SVR) method. These methods are machine learning algorithms established based on convex optimization principle, which have good mathematical theoretical basis and interpretability. SVR has high advantages in dealing with nonlinear and small sample problems. Its principle is to map the non-linear samples in the low-dimensional space to the high-dimensional feature space, and construct a linear function in the high-dimensional feature space to describe the change law of sample data, which can effectively overcome the problem of dimension disaster and avoid falling into local extreme (Chen et al., 2021). At the same time, with the improvement of computer computing power in recent years, neural network regression methods are also gradually rising. Probabilistic neural network (Srivastava et al., 2022), partial logistic regression artificial neural network (Ben Jabeur, Stef & Carmona, 2023), synaptic plasticity neural network and hybrid neural network and other improved neural network (Florini et al., 2022) technologies have played an important role in risk assessment and credit evaluation, but the way based on neural network has weak interpretability. At the same time, the improved neural network needs to be constantly adjusted during model building and generalization, greatly reducing its applicability.
Therefore, this article starts from the risk evaluation indicators in green finance, fully takes into account the abstract characteristics of indicator data, completes the quantification and formation of various evaluation indicators by using the weighted statistical method of Analytic Hierarchy Process (AHP) and the expert system, converts the scores of experts into investment probability by using the numerical normalization technology, realizes the digitalization of abstract indicators, forms discrete eigenvalues, and completes the regression analysis of investment probability by using the statistical learning method.
The contributions of this study are as follows:
1. We employ the AHP to transform expert-based ESG evaluations into quantitative indicators, providing a transparent and systematic approach to incorporate sustainability factors into risk modeling.
2. We develop a Gaussian kernel SVR model specifically adapted to green finance risk assessment, allowing the capture of nonlinear and heterogeneous relationships between ESG features and investment risk that conventional regression methods may overlook.
3. We optimize and validate the SVR model through parameter tuning and robustness checks, demonstrating its effectiveness as a decision-support tool for green financial investment.
The novelty of this work lies in the integration of AHP-based Environmental, Social and Governance (ESG) quantification with machine learning, which introduces a structured way to embed ESG scoring into financial risk evaluation. This coupling goes beyond applying SVR in a generic setting and provides a new methodological perspective for green finance.
Method
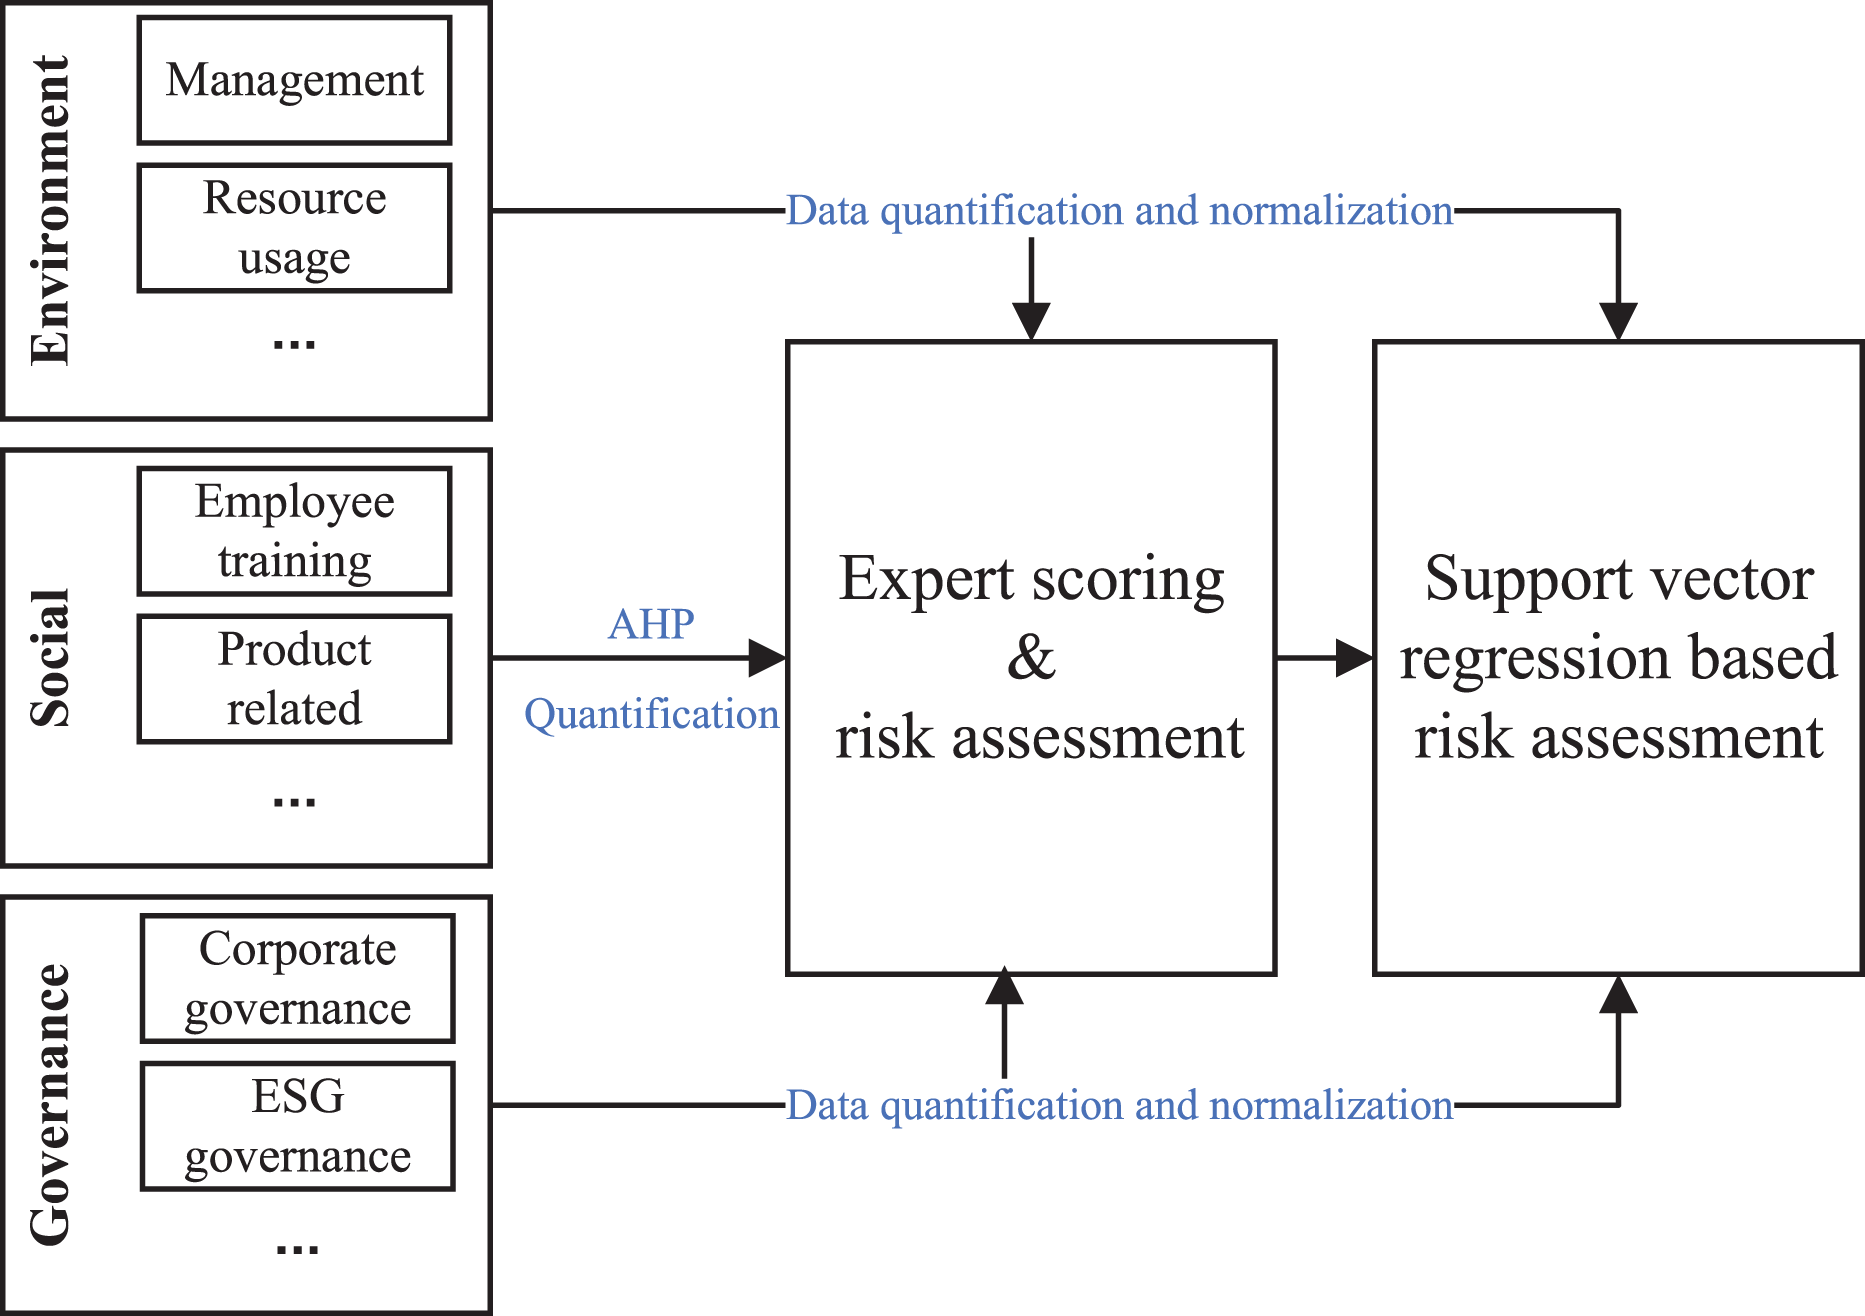
The financial risk intelligent assessment model to be established in this article is shown in Fig. 1. Through financial experts scoring ESG multiple quantitative indicators of enterprise projects, risk assessment features are formed to complete the risk assessment prediction tag based on expert system, and regression of risk assessment is completed through machine learning related methods to achieve rapid and intelligent risk assessment, thus greatly improving the efficiency of the green finance industry and reducing the consumption of other resources.
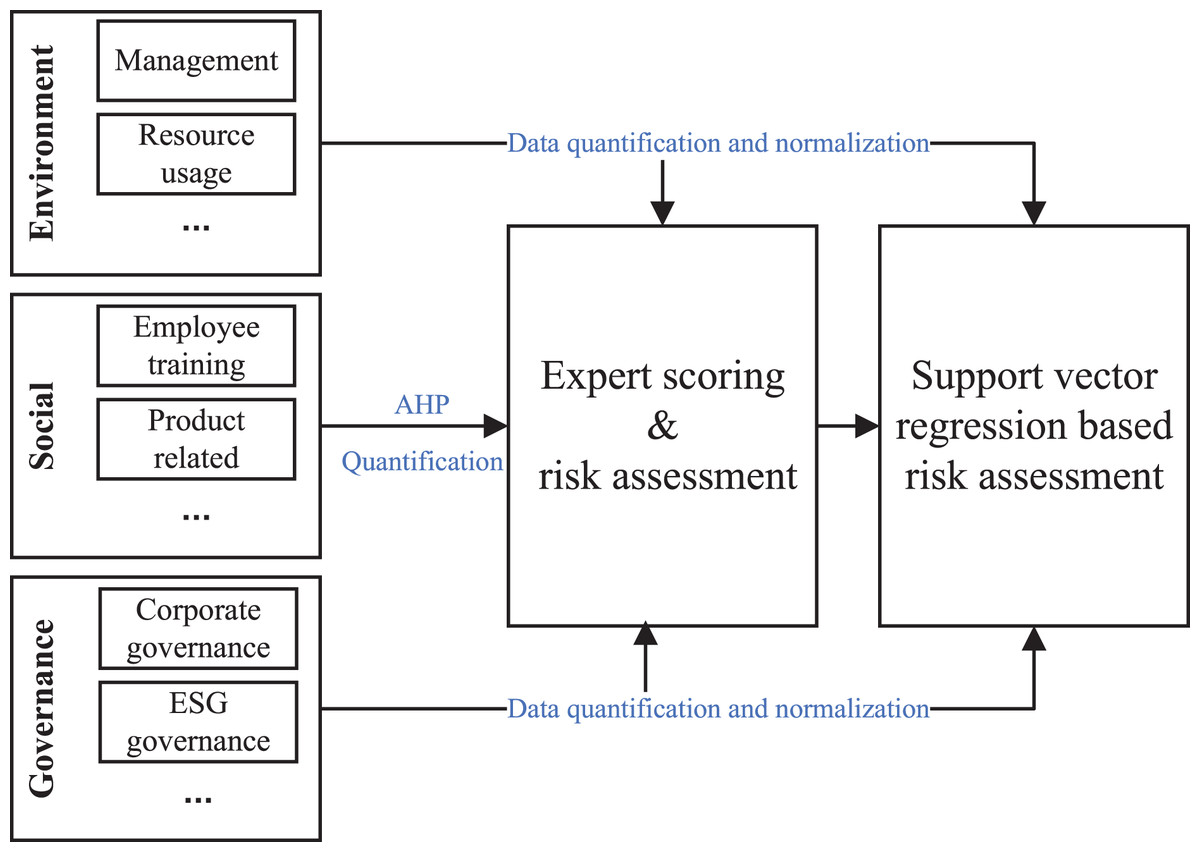
Figure 1: The flowchart of the risk assessment in green finance.
Establishment of risk assessment indicators
In the process of establishing indicators, we need to fully consider the characteristics of the current green finance industry. Therefore, this article builds a risk assessment model from the ESG indicators commonly used by financial experts in assessing venture capital. ESG represents Environmental, Social and Governance respectively to investigate the medium and long-term development potential of enterprises (Gillan, Koch & Starks, 2021). When selecting the company’s ESG development indicators, it is necessary to adapt to the company’s current reality, fully consider the current economic, social, environmental and management indicator systems, and include them as important references. Credit risk is the most important link in the development of green finance. Accurate review of social and environmental risks can help investment institutions better control dual risks. Specifically, the establishment of a sound risk index evaluation system can not only facilitate investors’ investment, but also escort the development of the whole green finance system.
Based on the demand for risk indicators and the connotation of ESG indicators, the ESG development indicators selected in this article are composed of three indicators, namely, environmental responsibility indicators, social responsibility indicators and management responsibility indicators. Management responsibility indicators are mainly corporate governance. The above three indicators are weighted by AHP (Yuying, 2021; Alrawad et al., 2023; Kaur et al., 2023) and expert evaluation. The calculation method is shown in Formula (1):
(1)
Experts score according to the three indicators to judge the risk characteristics of their objects. Large difference will cause great difference in model training and regression. Therefore, normalize the score of the sample to form [0, 1] interval score probability, so as to ensure the accuracy of risk assessment. The data normalization is given in Formula (2)
(2) where X is the original score, Xmin is the minimum value, and Xmax is the maximum value. Through normalization, the training efficiency and accuracy of the model can be greatly improved. To mitigate the risk of information leakage arising from using the same expert pool for both features and labels, this study separates the construction of features and the determination of labels. Specifically, ESG dimension ratings are provided by Expert Group A and aggregated through the AHP, while investment outcomes are defined either by a different expert group (Expert Group B) or by ex-post performance measures (e.g., default/return after 1–2 years). If the same group of experts is retained, a temporal separation is enforced—ESG features are assessed at time T, whereas investment outcomes are validated at time T + 1. In applying the AHP weighting, the Consistency Ratio (CR) values were all below the accepted threshold of 0.1, indicating satisfactory consistency of expert judgments. In addition, robustness checks with perturbed pairwise comparisons yielded stable weight structures, confirming the reliability of the assigned weights.
Support vector regression model
Generalized support vector regression models are divided into linear separable support vector regression and nonlinear support vector regression (Kurani et al., 2023; Dash et al., 2023; Thumu & Nellore, 2024). Given a set of training samples , the objective of SVR is to find a regression function that approximates the underlying relationship between the input features and the output variable . The model seeks to construct an optimal hyperplane such that the predicted values remain as close as possible to their true counterparts, thereby minimizing the overall deviation. To achieve this, a tolerance margin of width is introduced around the regression plane. If the absolute deviation between the predicted value and the actual value does not exceed , the prediction is considered satisfactory. This principle defines the so-called ε-insensitive loss function, which helps reduce sensitivity to small perturbations in the data and prevents overfitting.
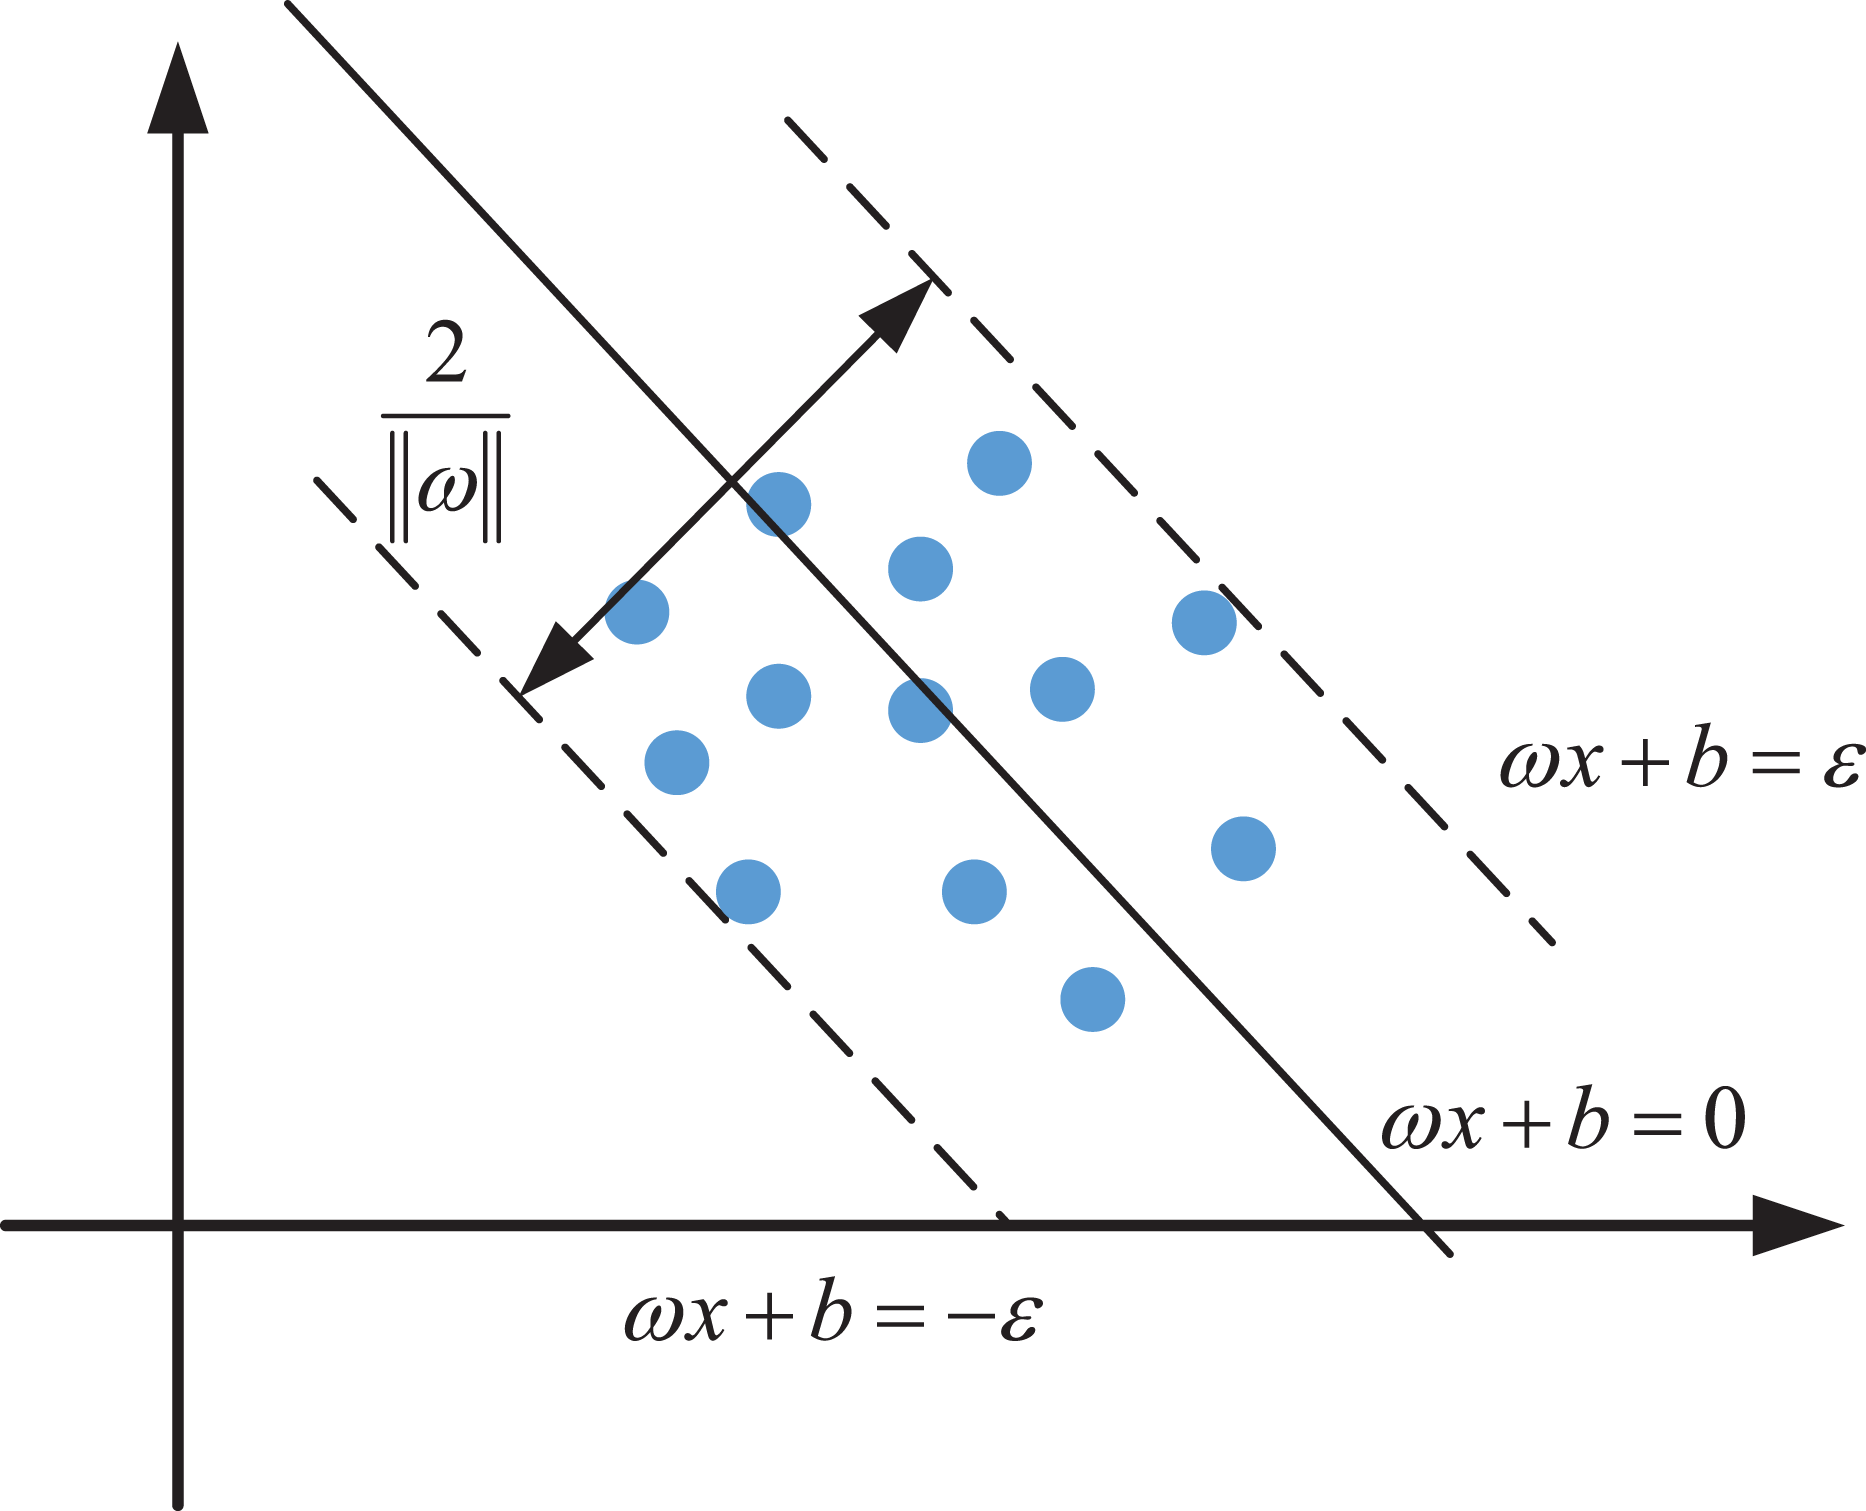
Geometrically, SVR constructs a tube centered around the regression plane, as illustrated schematically in Fig. 2. The aim is to include as many data points as possible within this tube while keeping the model complexity low. Unlike the traditional SVM used for classification—which seeks to maximize the margin between classes—SVR attempts to minimize the deviation between the hyperplane and data samples, emphasizing prediction accuracy over separation.
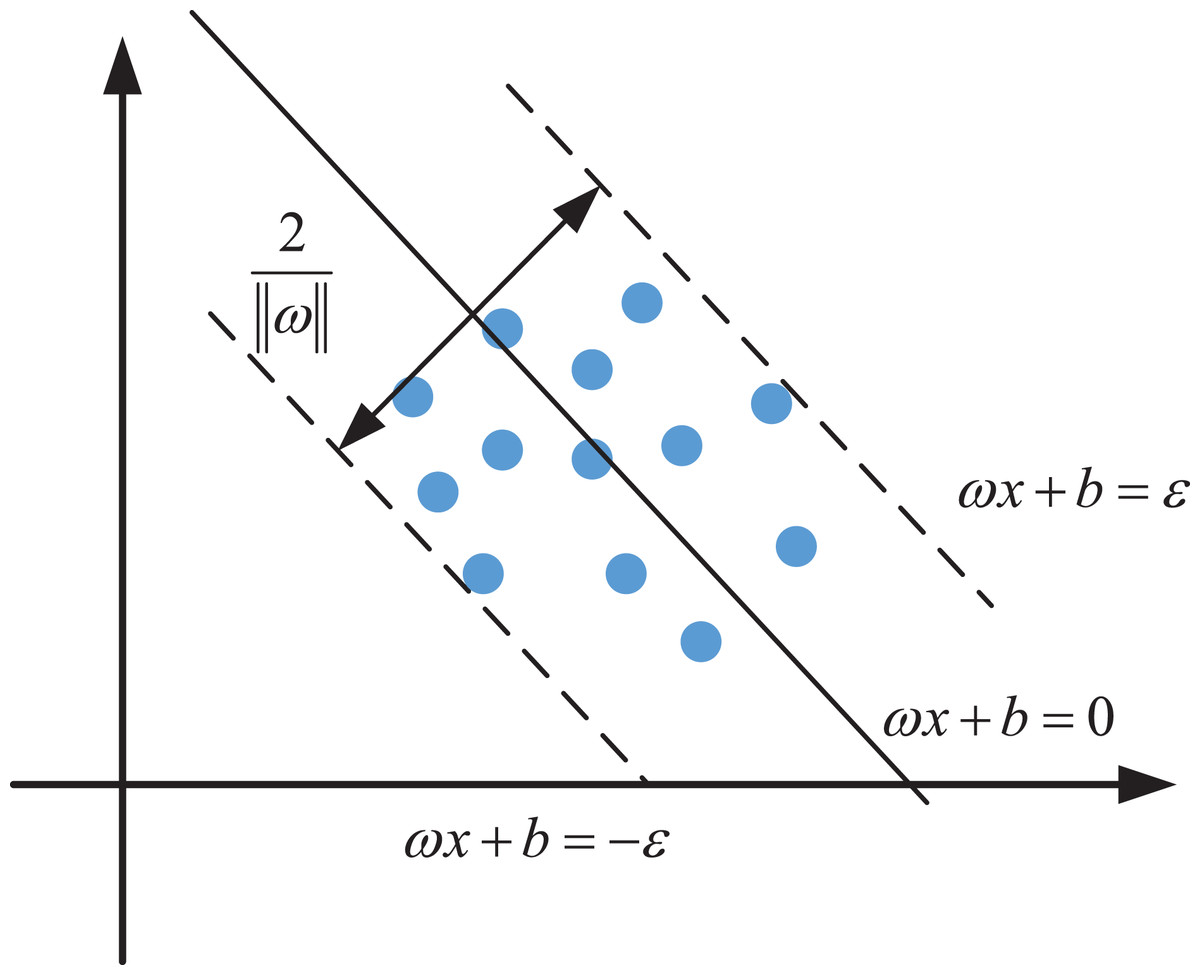
Figure 2: The principle of the SVR.
For samples outside the regression plane (Huang, Wei & Zhou, 2022), the loss function is calculated as shown in Eq. (3):
(3)
By determining the weight and compiling in the model to minimize the loss function, the optimization objective Eq. (4) can be obtained by introducing a relaxation factor into the regression model to make the regression surface a soft interval:
(4)
(5)
By introducing Lagrange multiplier, the original problem can be transformed into:
(6)
Find the partial derivative of it, and when the derivative is zero, the dual problem can be obtained:
(7)
Finally, the optimal solution of the support vector regression model can be obtained by solving the optimal solution of the dual problem
(8)
(9)
SVR risk assessment based on Gaussian kernel function
To effectively model the nonlinear and abstract characteristics of risk data, this study employs a kernel-based nonlinear regression approach. Conventional statistical learning techniques are primarily designed for structured, continuous, and linearly correlated data; however, risk features often exhibit discrete distributions, complex interdependencies, and uncertain correlations even after expert quantification. Such conditions hinder the accuracy and stability of traditional regression models. To address these challenges, kernel methods are introduced to extend the data representation from the original feature space to a high-dimensional reproducing kernel Hilbert space (RKHS), where nonlinear relationships can be approximated as linear mappings. This transformation enables the regression model to capture hidden structures and nonlinear boundaries without explicitly defining transformation functions.
In this framework, the kernel function serves as the mathematical bridge that computes inner products in the transformed space while preserving computational efficiency in the original domain. Various kernel types exist—such as linear, polynomial, sigmoid, and Gaussian functions—each defining a different notion of similarity between data samples. In this work, the Gaussian kernel is selected because of its ability to provide smooth mappings, local adaptability, and strong generalization across heterogeneous datasets. The scale parameter of the Gaussian kernel controls the sensitivity of the regression surface: a smaller value enhances local fitting but increases the risk of overfitting, whereas a larger value yields smoother approximations but may reduce model precision.
To ensure reliable performance, a parameter optimization process is performed to determine the kernel width and regularization coefficients that minimize model error while preserving generalization capability. The final kernel regression model effectively captures nonlinear feature interactions, reduces bias introduced by expert scoring, and improves the accuracy and robustness of the overall risk evaluation.
SVR is adopted in this study not only as a generic regression tool but also because of its specific advantages in the context of green finance risk assessment. Compared with traditional regression approaches, SVR is well suited to handle high-dimensional, nonlinear, and relatively small-sample datasets, which are common characteristics of ESG-related financial data. The ε-insensitive loss function and kernel-based mapping allow SVR to capture complex relationships while maintaining good generalization ability and robustness against noise. These properties make SVR particularly appropriate for assessing investment risks in green finance, where data heterogeneity and limited historical records are frequent challenges.
Experiment result and analysis
Data acquisition and processing
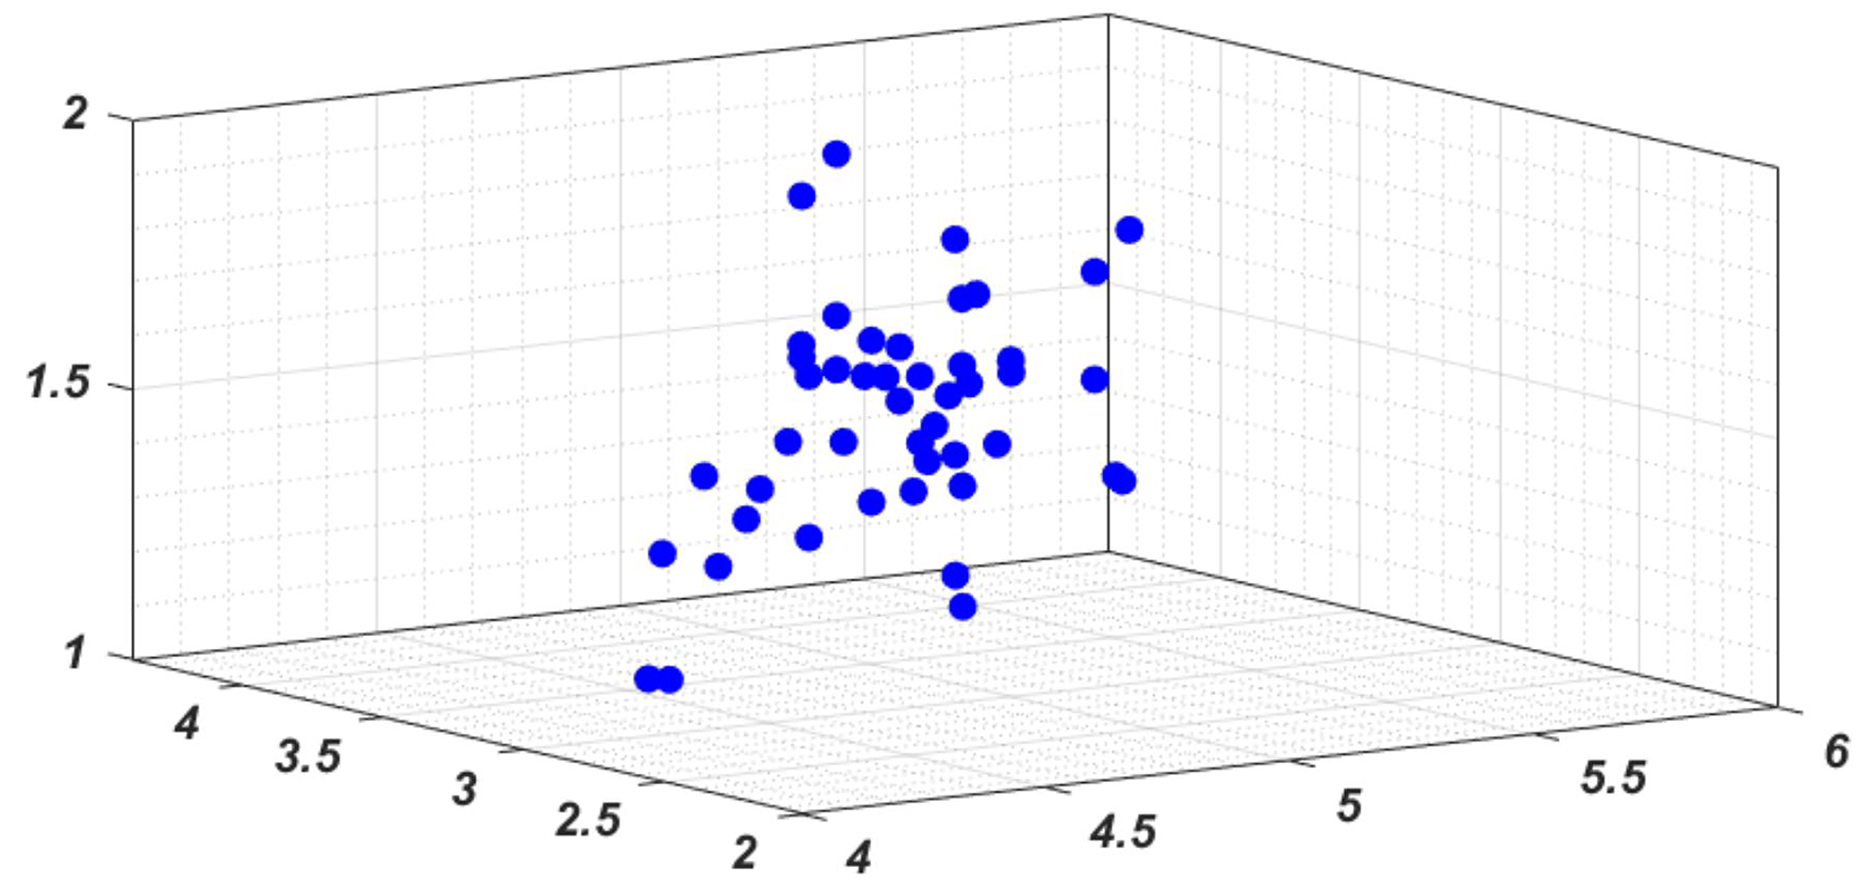
In line with the industrial investment requirements of green finance and relevant green credit policies, this study selects a dataset comprising corporate green projects from the past five years (doi: 10.5281/zenodo.12563169). The sample includes 50 projects spanning multiple sectors such as green insurance, renewable energy, and other green industries, thereby ensuring industry diversity. To assess investment risks, 10 domain experts were invited to provide evaluations based on the hierarchical evaluation and weighted scoring method described in ‘Establishment of Risk Assessment Indicators’. The expert scores were then aggregated using the assigned weights (Eq. (1)). Prior to normalization (Eq. (2)), the highest and lowest scores were trimmed to mitigate the influence of outliers and reduce extreme deviations. This process ensures both the robustness of the assessment and the reproducibility of the dataset description in terms of sample size, time span, and industry coverage. The numerical features of the three categories of indicators established according to ESG indicators are processed according to the original data, and 50 sample points are plotted through three-dimensional features. The results are shown in Fig. 3. It can be found that it is difficult to form effective classification regression judgment from the perspective of their feature distribution alone.
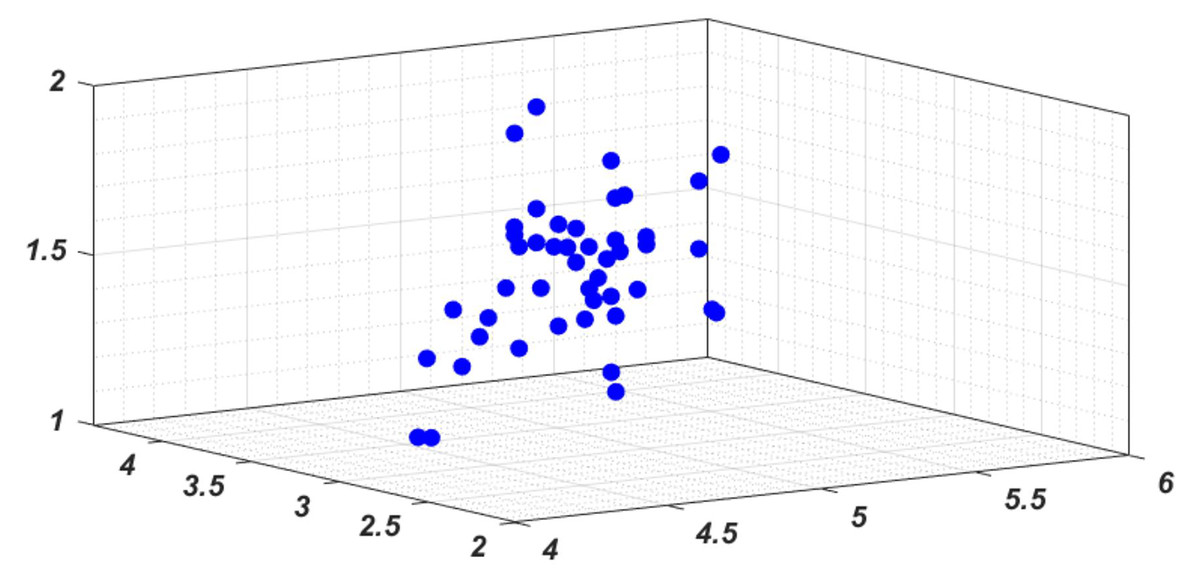
Figure 3: The feature distribution in 3D space.
Model establishment and training
According to the collected data, this article takes the characteristic indicators of its three dimensions as input and the normalized investment probability as output. For machine learning methods based on statistical learning, the proportion of training set, verification set and test set needs to be strictly divided in the process of model verification. According to the dimensional characteristics of the data and the size of the data sample, this article completes the training and establishment of the model through 5-fold cross validation, so as to optimize the parameters of the algorithm model and get the final model. The so-called 5-fold crossover experiment means that the 50 sample data collected in this article are divided into five parts, 10 samples for each part, one of which is used as the test set and the other four are used as the training set, and the model with the smallest loss function is selected. In the process of model training, in order to verify whether the Gaussian kernel function used has the advantage of regression accuracy, the commonly used linear kernel, that is, the kernel function, is also verified and tested. In order to ensure the rationality of algorithm comparison, the methods used in this article all use default parameters, and do not use network search, particle filter and other parameter optimization methods to improve the model. For the SVR model, a grid search procedure was conducted to tune the key hyperparameters C, , and . Candidate values were systematically evaluated, and the combination yielding the best cross-validation performance was selected for the final model, thereby ensuring that the reported results are not based on default settings but on optimized parameters.
Experimental results and comparative analysis
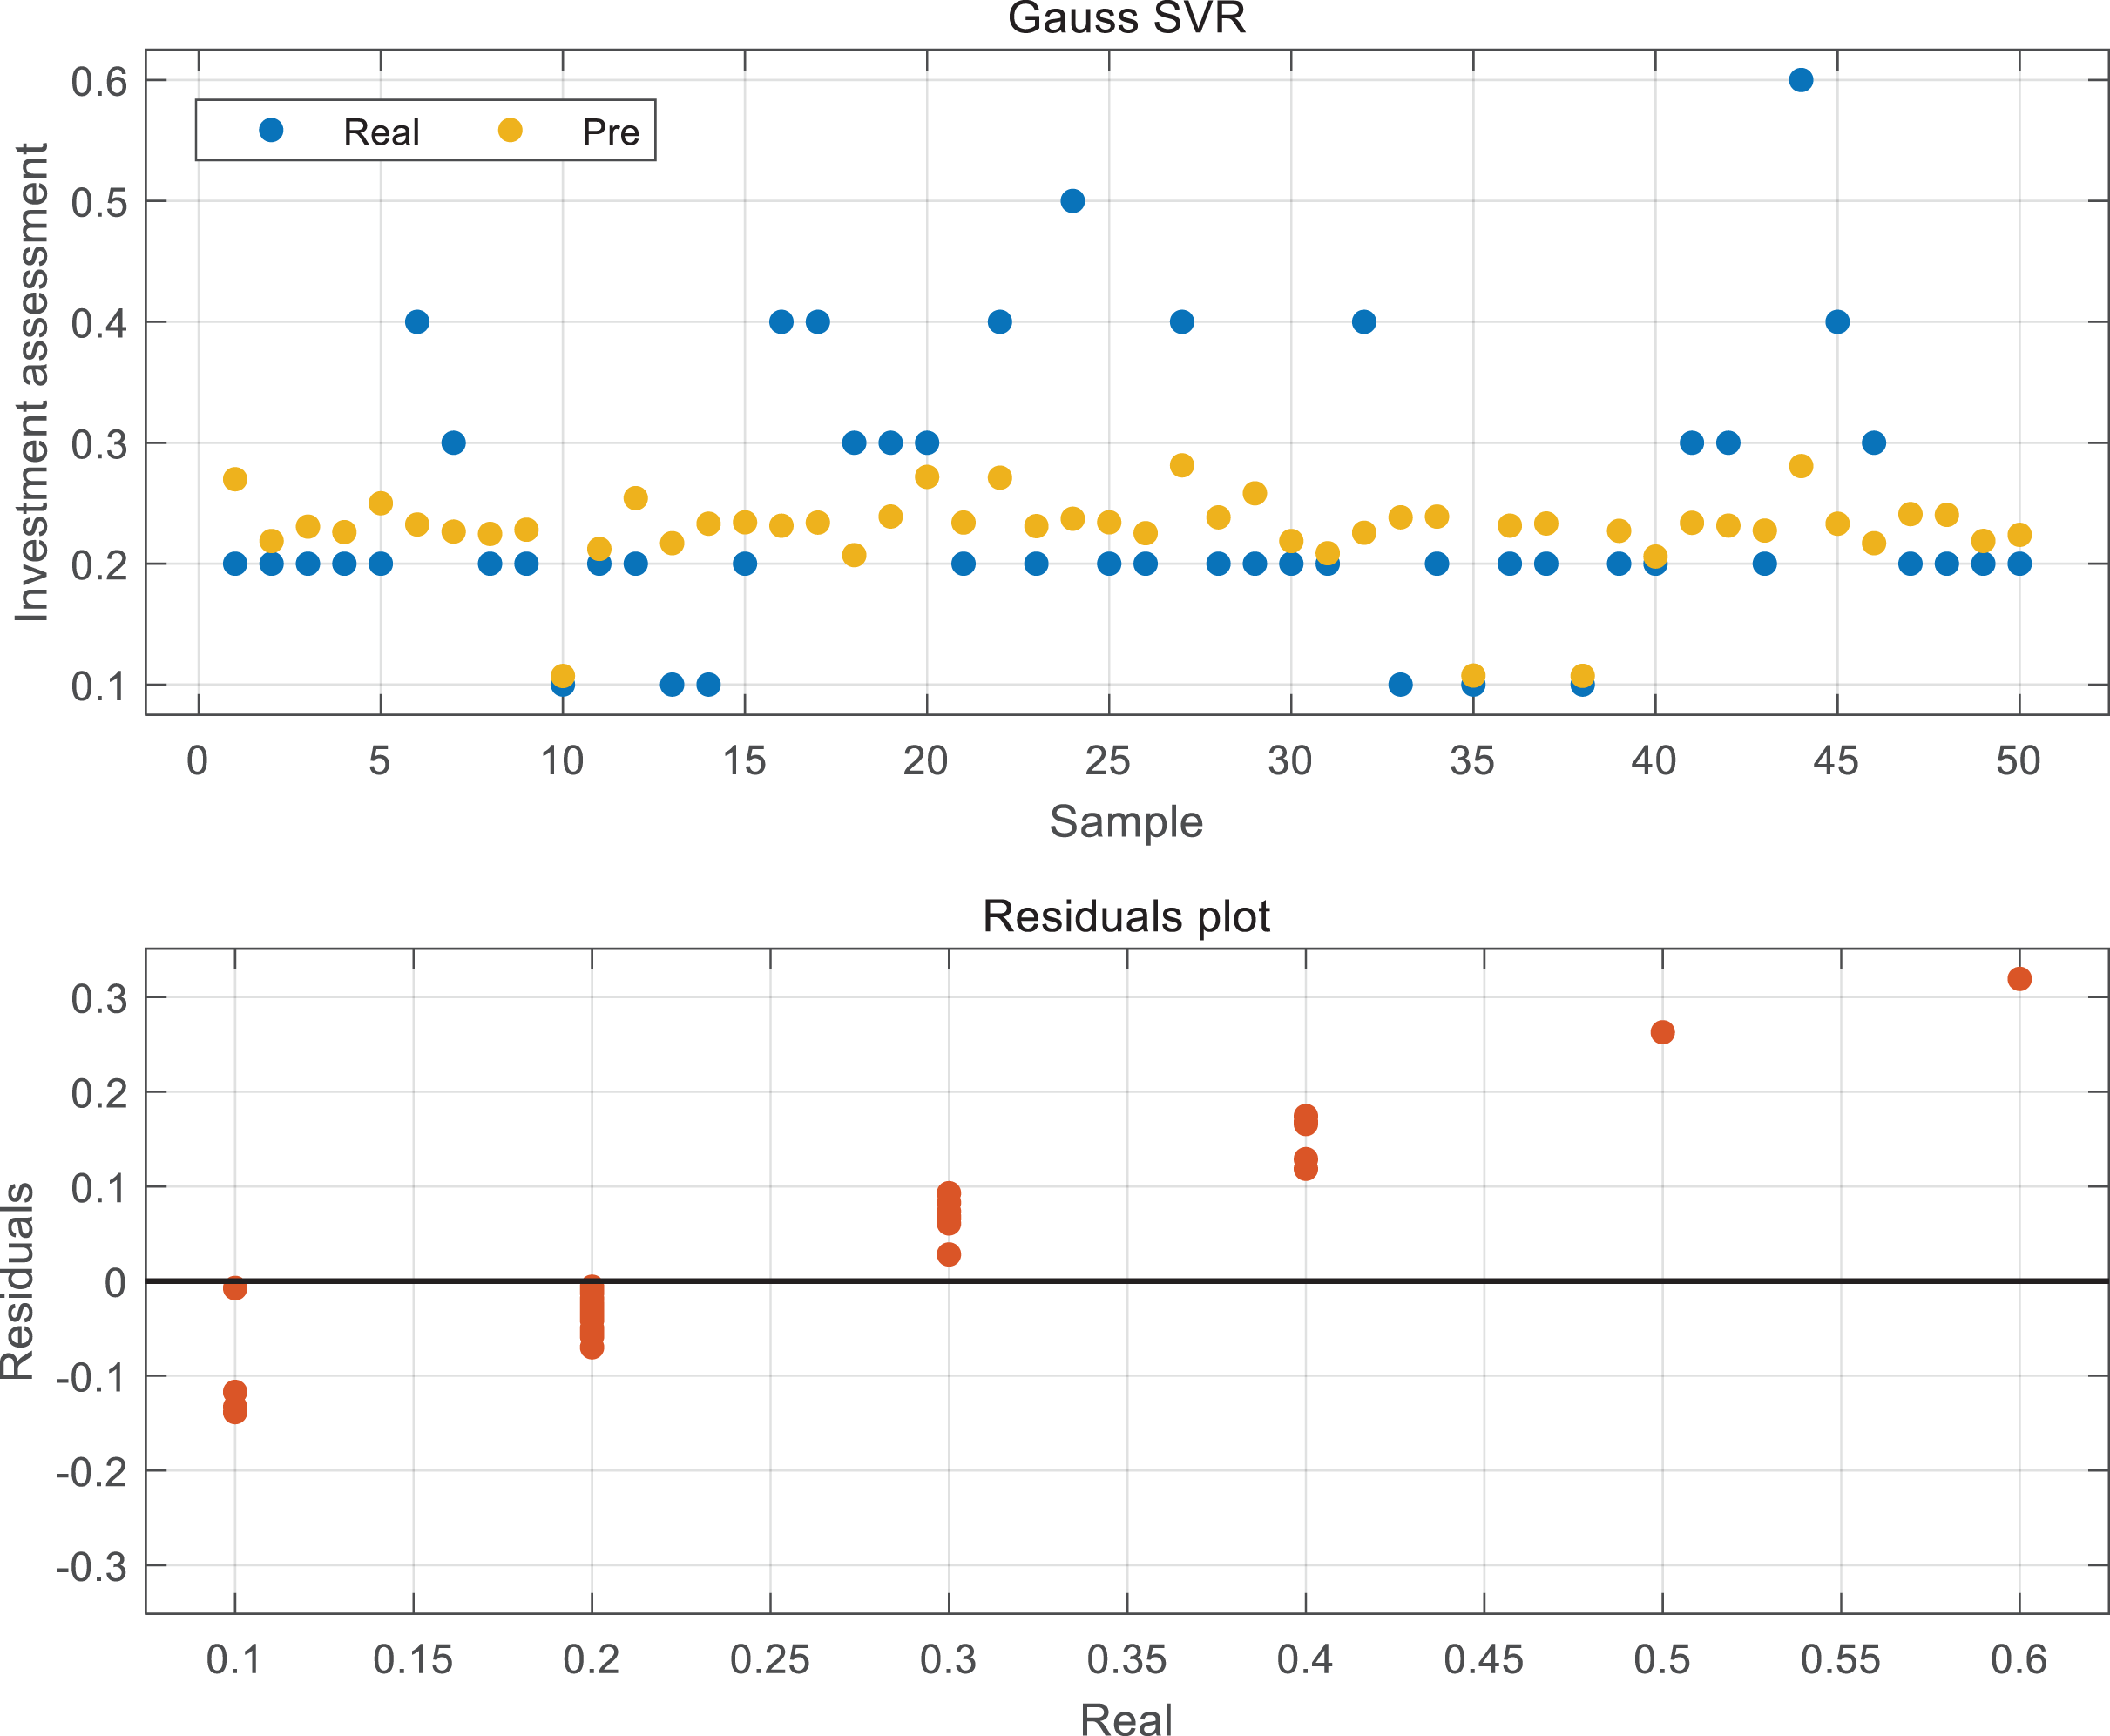
The regression results of the optimal model obtained in this article according to the 50% cross validation introduced in ‘Model establishment and training’ are shown in Fig. 4. It can be found that the regression results of this model are relatively average, except for the 44th sample, which has a high investment probability due to the favorable opinion of experts and has a large gap with the predicted value. By observing the distribution of the predicted value and the true value of yellow and blue, it is not difficult to see that the overall predicted model is relatively conservative, and its value distribution is stable around 0.2, which is also the error caused by the small sample size of large deviation values in statistical regression. Although the extreme value has been removed in the initial scoring process of the data, in order to ensure the minimum loss function, it has to sacrifice some abnormal values to optimize the model in order to include more sample data into the model.
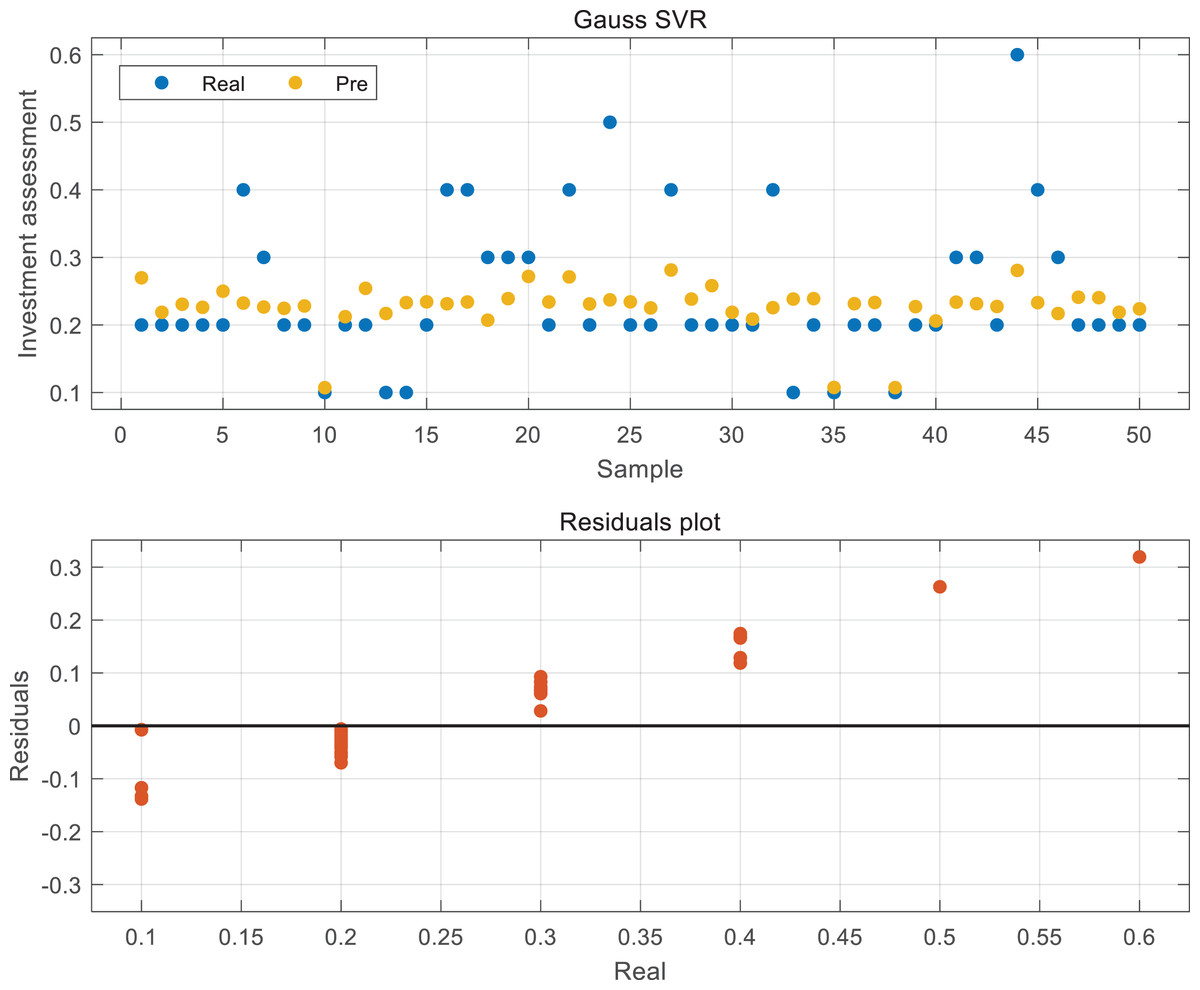
Figure 4: The result of Gauss SVR and residuals.
We can better understand the error distribution of the data in this article through the residual diagram of the real value of the label and the abscissa. We can see that the residual error of the sample data with the investment probability of 0.2 is relatively small, which shows that the sample advantage is a factor that can not be ignored in the prediction based on the regression method. For the samples with a small number of investment probabilities of 0.5 and 0.6, there will be a large deviation, but from the prediction results of the whole sample, that is, when only the prediction value in Fig. 4 is concerned, it still has certain advantages over others.
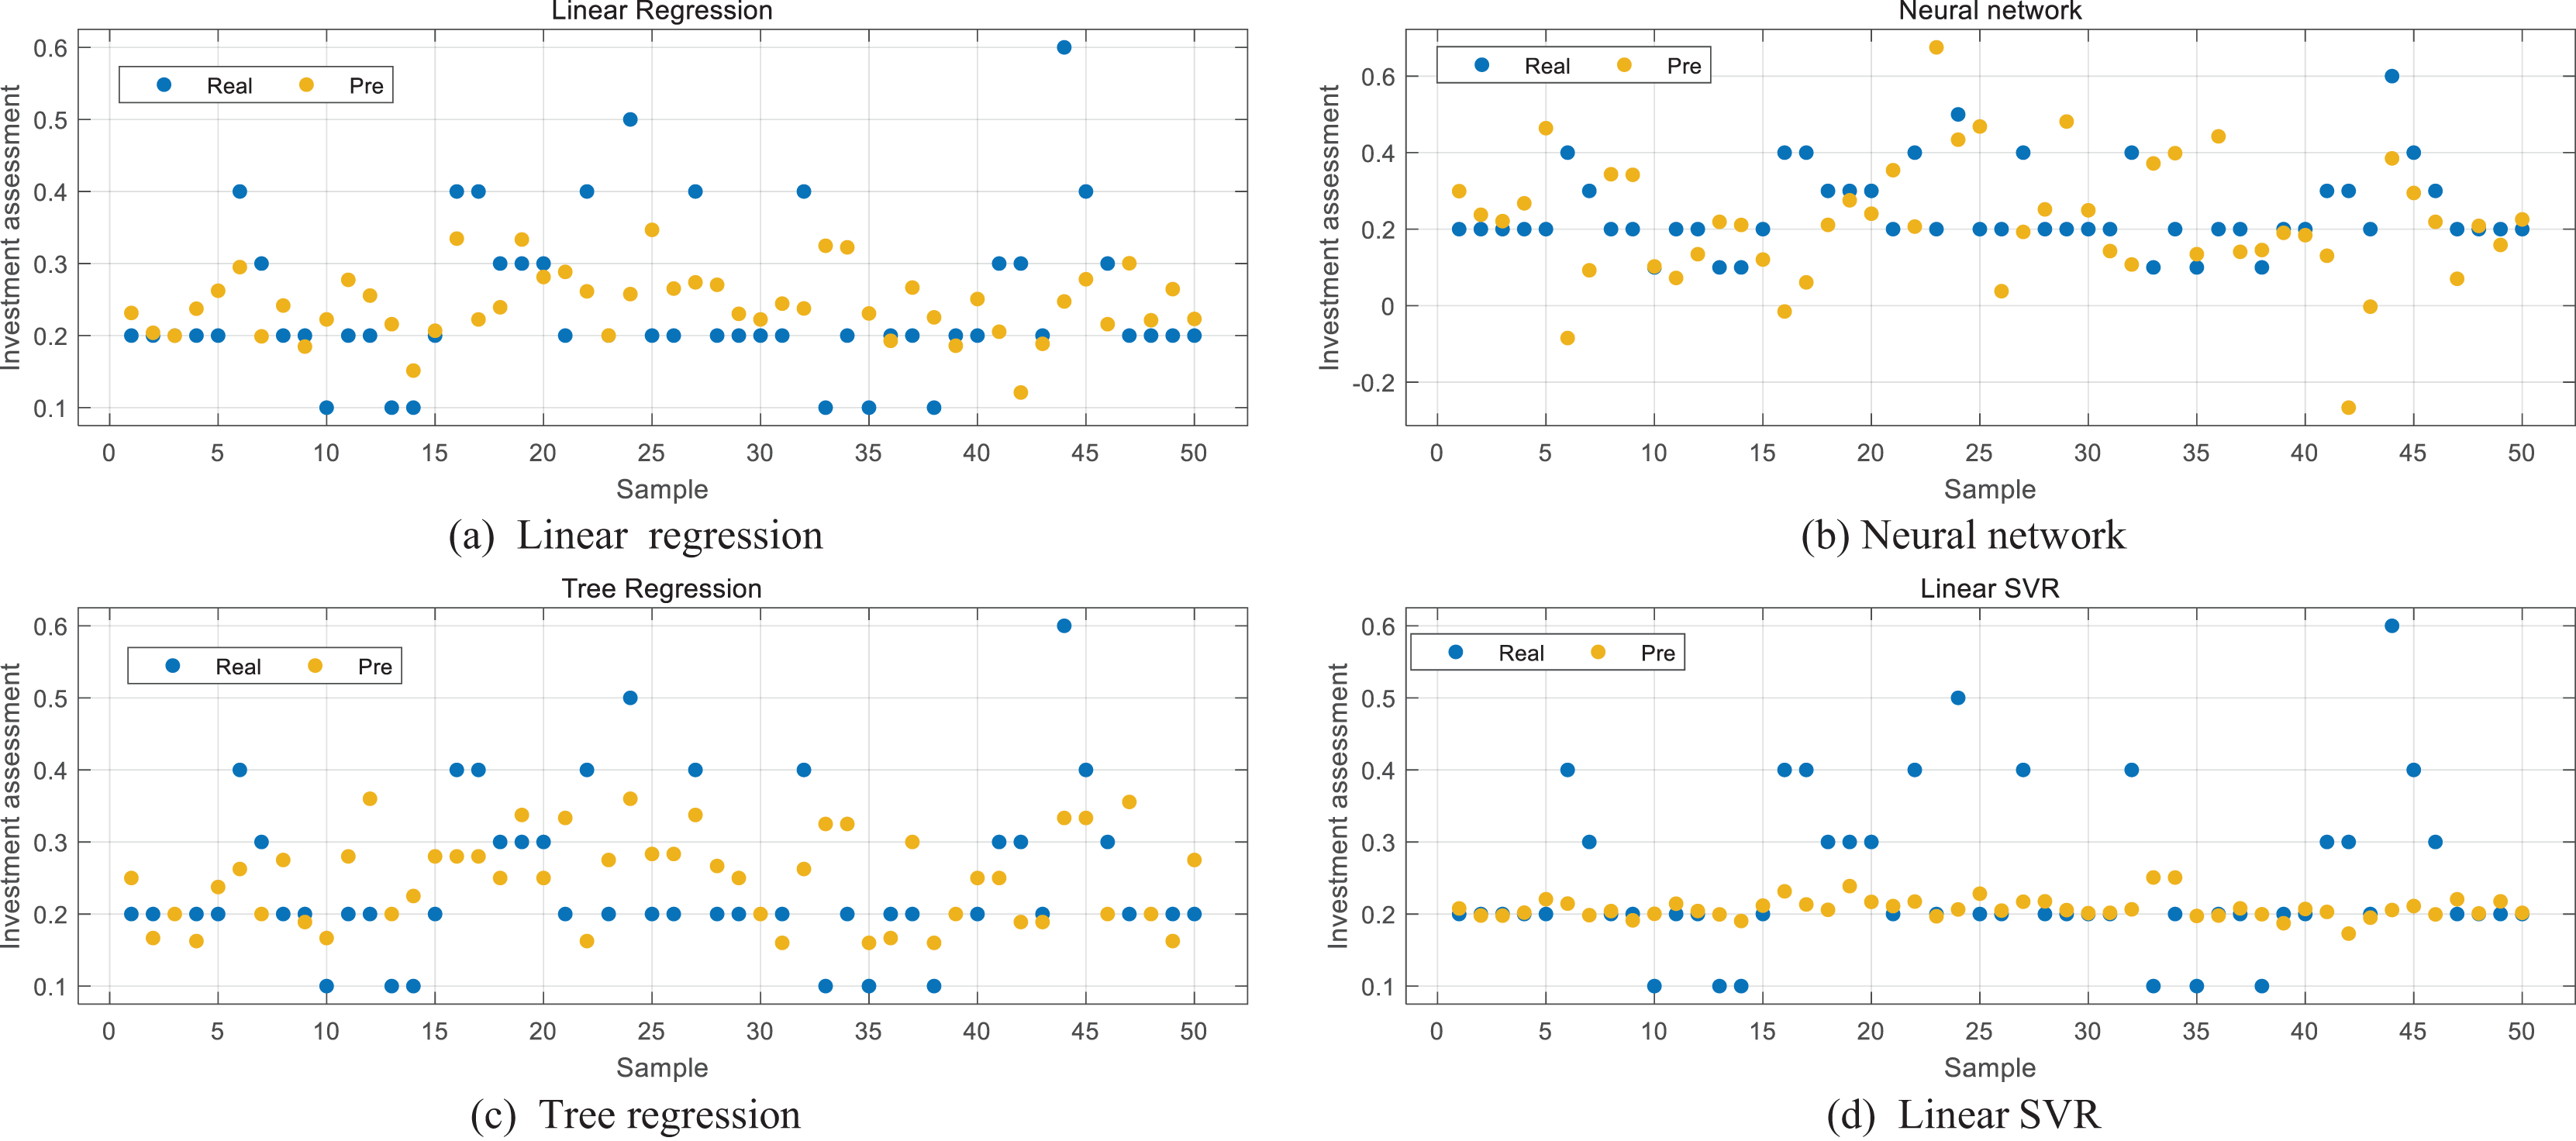
In order to verify the accuracy of the algorithm, the linear regression, tree regression and neural network methods commonly used in statistical regression methods are selected in this article for data regression test. The training method is also five-fold cross validation. The results are shown in Figs. 5A, 5B and 5C. In order to test the SVR method itself, the method based on linear kernel function is also selected in this article for validation test. From the way, we can see that the distributions of the predicted values in Figs. 5A and 5C are more discrete, the regression results are not ideal, and the problem of extreme values in the sample is not well solved. For the neural network (NN) method in Fig. 5B, its nonlinear characteristics make it more accurate to predict some extreme points, but it can be seen that the prediction and regression results are not stable as a whole. Although it is sensitive to extreme values, the deviation for most samples is large, and the loss is not minimized. In the SVR prediction based on linear kernel shown in Fig. 5D, it can be seen that its overall regression result is moderate, not much different from Gauss SVR, but its sensitivity to extreme values is worse. In order to more intuitively compare the differences among results, this article selects Root Mean Square Error (RMSE) as an index to compare the listed methods. Although the Gaussian kernel was adopted as the primary specification, we also conducted comparative experiments using a linear kernel. The results showed that the Gaussian kernel consistently outperformed the linear kernel in terms of prediction accuracy, suggesting that it is better suited to capture the nonlinear structures present in ESG-related features.
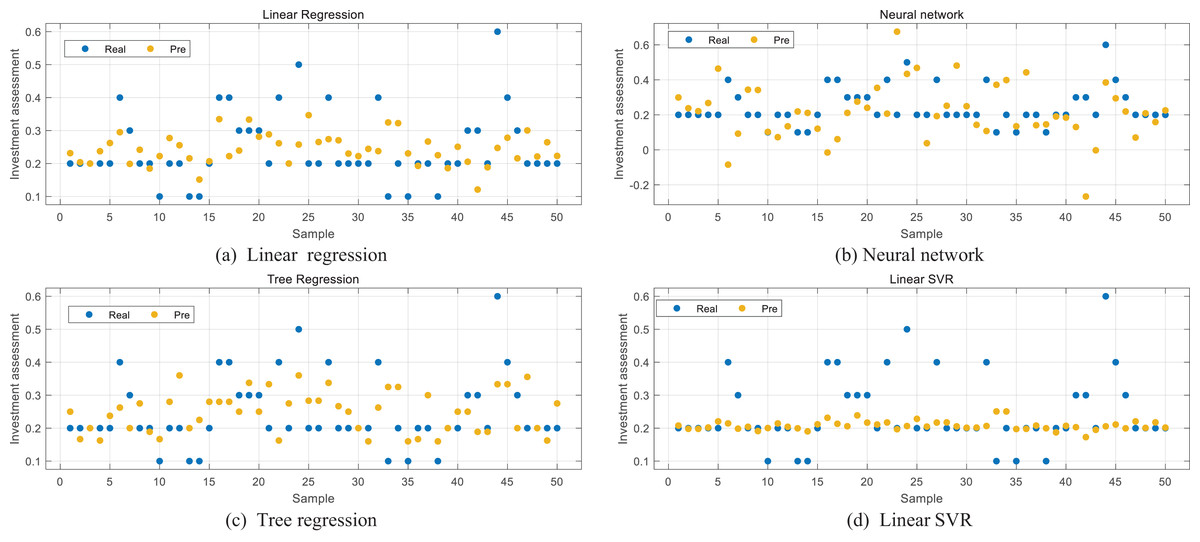
Figure 5: (A–D) Comparison with other methods.
According to the RMSE results listed in Table 1, it can be seen that the SVR method based on Gaussian kernel function proposed in this article has the smallest regression deviation. At the same time, through the above discussion, it can be found that this method can not only meet the regression accuracy of most data, but also take into account the influence of extreme values to a certain extent, ensure the accuracy of the regression model, and provide reliable data support for risk assessment in the investment process.
| Method | RMSE |
|---|---|
| Linear regression | 0.108 |
| Neural network | 0.201 |
| Tree regression | 0.101 |
| Random forest | 0.107 |
| XGBoost | 0.105 |
| Linear SVR | 0.111 |
| Gauss SVR | 0.096 |
Discussion
In recent years, green finance has attracted increasing attention due to global environmental pressures, evolving from early practices such as green insurance and credit toward broader applications including green financial technology and green industrial investment (Irfan et al., 2022; Yin & Xu, 2022). The empirical results of this study, reflected in performance metrics such as RMSE and Mean Absolute Error (MAE), demonstrate that the proposed AHP–SVR framework can effectively capture ESG-related risks and provide reliable estimates of investment outcomes. From a practical perspective, this indicates that the model can serve as a decision-support tool in several aspects of green finance. First, in investment screening, financial institutions can apply the model to identify projects with lower ESG-related risk profiles, ensuring that resources are directed toward enterprises genuinely committed to sustainable practices. Second, in portfolio risk management, the model’s predictive accuracy enables investors to better balance financial returns with environmental responsibility by quantifying the potential downside risks associated with green projects. Finally, by enhancing the transparency and reliability of risk assessment, the approach can support regulators and policymakers in strengthening disclosure mechanisms, optimizing the allocation of financial resources, and incentivizing enterprises that comply with environmental standards.
From the above aspects, it is not difficult to see that if we want to vigorously develop the green finance industry, careful risk assessment of the whole industry is the most fundamental link. Only accurate assessment and investment can make the industry develop more smoothly, thus providing fertile ground for the implementation of various policies. According to the sample data collected in this article (Fig. 4) and the expert scoring results, it is clear that experts are generally cautious in their risk assessments. Only two projects obtained investment probabilities greater than 50%, while most projects were rated with relatively low investment likelihoods. This reflects both the early stage of green finance development and the limited confidence of market participants. On the one hand, the immaturity of the industry contributes to conservative judgments (Lee & Lee, 2022); on the other hand, while this study establishes a quantitative system based on ESG indicators, the weighting structures in an emerging industry may differ from those in traditional financial assessments, an issue that requires careful refinement in future work.
Importantly, the predictive capability of the proposed AHP–SVR model carries practical implications. For financial institutions, the model can be used as a screening tool to identify promising projects, reduce misallocation of capital, and enhance portfolio stability by quantifying ESG-related risks. For ESG-focused investors, the model provides a systematic and data-driven way to balance financial returns with sustainability objectives, thus supporting the construction of portfolios that align with both profitability and responsibility. For policymakers and regulators, the model offers a methodological basis to evaluate whether green finance instruments (e.g., loans, bonds, insurance) are effectively channeled toward environmentally responsible enterprises. By providing transparent and reproducible risk scores, the model also supports the design of incentive mechanisms—such as preferential credit rates or tax benefits—for genuinely green firms, while deterring the flow of resources toward high-polluting industries.
Finally, in terms of methodology, while the Gaussian SVR model shows better performance than linear regression, tree-based regression, and other baseline methods, its insensitivity to singular values may limit its generalizability in some scenarios. Conversely, although neural networks exhibit larger RMSE values in our experiments, their nonlinear activation functions allow for broader generalization potential as data availability and indicator systems expand (Samal, Dash & Bisoi, 2022; Dahish et al., 2023). Therefore, in the current initial stage of development and small-sample conditions, the Gaussian SVR model remains the most appropriate tool; yet, with the accumulation of larger datasets and the maturation of green finance evaluation systems, advanced neural network approaches are likely to offer greater potential in the future.
Conclusion
As a new direction of future development, the green finance industry needs to ensure safety and stability in the investment process. The investment risk assessment model based on Gaussian kernel function SVR proposed in this article realizes the regression analysis of investment probability by using quantified ESG index parameters and expert scoring. Its RMSE is better than linear kernel SVR, linear regression and NN regression evaluation methods, and completes the assessment of investment probability better. However, due to the limited sample of this study, especially the lack of projects with good prospects in the green finance industry, some deviations occurred in the training process of the model, and the data type needs to be improved in future research.