
A robust graph-based computational model for predicting drug-induced liver injury compounds
- Published
- Accepted
- Received
- Academic Editor
- Binh Nguyen
- Subject Areas
- Bioinformatics, Artificial Intelligence, Data Mining and Machine Learning, Data Science, Neural Networks
- Keywords
- Drug-induced liver injury, DILI, Graph neural networks, Graph attention networks, Molecular toxicity prediction, Drug discovery
- Copyright
- © 2025 Yao et al.
- Licence
- This is an open access article distributed under the terms of the Creative Commons Attribution License, which permits unrestricted use, distribution, reproduction and adaptation in any medium and for any purpose provided that it is properly attributed. For attribution, the original author(s), title, publication source (PeerJ Computer Science) and either DOI or URL of the article must be cited.
- Cite this article
- 2025. A robust graph-based computational model for predicting drug-induced liver injury compounds. PeerJ Computer Science 11:e3416 https://doi.org/10.7717/peerj-cs.3416
Abstract
Drug-induced liver injury (DILI) is a leading cause of drug development failures and post-market withdrawals, presenting significant challenges to both pharmaceutical safety and clinical care. Conventional screening methods, such as laboratory-based cell assays and animal models, are limited in their ability to accurately predict human hepatotoxicity. To address this, we propose a robust graph-based deep learning model that combines graph attention networks (GAT) and graph convolutional networks (GCN) for the prediction of DILI-associated compounds. Molecular structures are represented as graphs, where atoms and bonds are encoded with rich chemical and topological features derived from molecular formulas. The model effectively learns complex interaction patterns within each compound and demonstrates superior performance over existing machine learning and deep learning baselines. It achieves an area under the receiver operating characteristic curve (ROC-AUC) of 0.8481, an area under the precision–recall curve (PR-AUC) of 0.9008, and an F1-score of 0.8017. Furthermore, evaluation across twenty independent trials confirms strong reproducibility. These findings highlight the model’s reliability and potential as a practical tool for early-stage hepatotoxicity screening in drug discovery.
Introduction
Drug-induced liver injury (DILI) refers to abnormal damage to hepatic cells resulting from the use of medications, dietary supplements, or various chemical agents (Andrade et al., 2019). The liver is one of the most important organs, playing a crucial role in metabolizing compounds to reduce their toxicity or neutralize harmful effects before excretion from the body (Leise, Poterucha & Talwalkar, 2014). However, as the liver is constantly exposed to various types of molecules, hepatic cells are particularly vulnerable to damage due to their metabolic functions (Campbell, 2006). The metabolic processes in the liver help the human body quickly eliminate accumulated toxins (Shao et al., 2020). Diagnosis of DILI remains a significant challenge, especially as its early symptoms are often vague, variable, and nonspecific (Ahmad et al., 2021). This complicates clinical assessment, as the symptoms of DILI can overlap with those of other liver disorders and common conditions, leading to misdiagnosis or delays in appropriate management (Shen et al., 2019). Therefore, comprehensive approaches for effective diagnosis and management of DILI are essential. The incidence of DILI has risen significantly over recent decades, with current estimates ranging from 12.9 to 24.0 cases per 100,000 individuals annually (Wang et al., 2022). A systematic review indicated a peak incidence of 15.14 per 100,000 person-years between 2010 and 2020, attributed to better diagnostic criteria, increased awareness, and enhanced reporting mechanisms (Li et al., 2023). Key factors contributing to this trend include an aging population, particularly individuals over 35, who show higher rates of liver injury due to declining liver function and greater co-morbidities (Fontana et al., 2015; Ali, Gupta & Saravu, 2020). Older patients, especially those over 60, are at increased risk, with prevalence rates reported as high as 33% (Ali, Gupta & Saravu, 2020). Prevention strategies increasingly use artificial intelligence (AI) and machine learning (ML) to predict the hepatotoxicity of drug candidates (Vorrink et al., 2018; Pu et al., 2019; Hurben & Erber, 2022). The integration of AI and ML in drug discovery enhances early drug development stages and improves patient safety by identifying potential liver toxicity before clinical trials (Hurben & Erber, 2022). Recent advances in ML algorithms enable effective analysis of large datasets containing chemical properties and biological activities, leading to accurate predictions of hepatotoxicity. Despite the promising potential of AI and ML, regulatory acceptance remains a challenge, as predictive models must be properly developed and validated to ensure their reliability in compound screening (Tran et al., 2023). Overall, these approaches represent a significant advancement in pharmacology, helping to prevent costly late-stage drug failures and enhance patient outcomes.
Traditional methods for detecting DILI compounds include in vitro (Cheng et al., 2017) and in vivo (Sakatis et al., 2012; Nguyen et al., 2017) experiments, biochemical diagnostics (Bishop et al., 2019), and histopathological evaluations. In in vitro methods, researchers grow human hepatocyte cell lines or primary hepatocytes for compound testing at multiple concentration levels to assess hepatotoxicity (Cheng et al., 2017). However, these methods do not accurately simulate the complexity of human responses due to variability in cell lines and tissue growth conditions. In contrast, in vivo methods focus on developing animal models, primarily using rodents, to observe their responses to the effects of drugs and drug interactions after intake (Sakatis et al., 2012; Nguyen et al., 2017). Although testing on living systems can better simulate complex biological conditions, animal responses differ significantly from humans, exhibiting large variations among test samples. Biochemical markers, such as aspartate transaminase (AST) and alanine transaminase (ALT), serve as routine diagnostics for DILI, where elevated enzyme levels indicate liver injury. However, individual variability in drug responses can be significant and may lead to potential misclassification (Björnsson, 2010). Histopathological examination of liver biopsies offers critical insights into liver injury through the assessment of necrosis, inflammation, and other characteristics, but this invasive method is typically reserved for severe cases with uncertain diagnoses (Reuben, Koch & Lee, 2010). Despite their contributions to understanding hepatotoxicity, traditional screening methods possess unaddressed limitations. Future approaches aim to integrate high-throughput screening and computational methods to develop more predictive, human-relevant models for assessing DILI risk, ultimately improving the safety testing of pharmaceuticals.
To address the limitations of traditional screening methods, researchers have increasingly developed computational approaches for the early identification of DILI compounds. In 2010, Ekins, Williams & Xu (2010) published a Bayesian model for preliminary DILI drug screening, using chemical fingerprints to encode compound data. However, this method showed low performance and needed further improvement. In 2012, Sakatis et al. (2012) conducted a large-scale study that evaluated the predictivity of in vitro bioactivation data across more than 200 compounds. This study established foundational insights that laid the groundwork for ML methods by identifying which compounds exhibit hepatotoxicity based on biochemical data. The findings from this research have been essential in advancing follow-up studies using computational models. In 2013, Zhang et al. (2013) used data mining techniques to uncover a network of early-response genes linked to drug-induced toxicity, providing valuable predictive insights into hepatotoxicity mechanisms. This work demonstrated the integration of computational analysis with experimental data to enhance the understanding and prediction of DILI. In 2015, Xu et al. (2015) presented a model that used deep learning (DL) to develop a multi-level prediction model for DILI compounds. One year later, Zhang et al. (2016) developed computational models to predict DILI compounds using substructural patterns with support vector machines (SVM) and FP4 fingerprints. In 2017, Kotsampasakou, Montanari & Ecker (2017) conducted a study emphasizing the importance of data curation in quantitative structure–activity relationship (QSAR) models, revealing that compounds inhibiting specific liver transporters tend to be associated with a higher likelihood of being DILI-positive. Their study highlighted the necessity of selecting appropriate training data and descriptors, which significantly improve model performance. In 2018, Ai et al. (2018) introduced an advanced ensemble model for predicting DILI compounds by combining multiple ML algorithms with diverse molecular fingerprints. Some approaches situate DILI as one endpoint within a broader landscape of molecular property prediction and systems pharmacology (Zhou et al., 2019; Nguyen-Vo et al., 2024). In 2020, Li et al. (2020) introduced DeepDILI, a hybrid model combining ML and DL techniques. Their findings identified 21 structural alerts that are strongly associated with hepatotoxicity. In the same year, Minerali et al. (2020) conducted a comparative study using various ML algorithms to predict the consequences of drug-induced liver injury from drug compounds. Their findings showed that different models varied in their ability to classify known DILI compounds. Among the models tested, Bayesian approaches achieved the best performance, demonstrating the effectiveness of probabilistic models in DILI prediction. In 2024, Lee & Yoo (2024) developed an interpretable prediction model for DILI using permutation feature importance and an attention mechanism. Their model was designed to generate predictions and provide insights into which molecular features significantly contribute to DILI risk. Mostafa, Howle & Chen (2024) highlighted that different endpoints in DILI models yield varying predictions due to the diversity of underlying biological mechanisms. They adjusted the DILI prediction frameworks to account for endpoint variability, thereby improving the model’s predictive capacity. In recent years, graph neural networks (GNNs) have shown strong performance on biomedical graphs and molecular graphs by leveraging topology-aware message passing and task-specific supervision (Meng et al., 2023; Hu et al., 2023). For DILI specifically, convolutional networks operating on fingerprint-style representations have demonstrated that deep models can outperform classical QSAR baselines, motivating more expressive graph-based approaches (Nguyen-Vo et al., 2020).
Despite the promising results of computational methods for predicting DILI compounds, significant gaps remain. The complex mechanisms underlying DILI involve numerous interactions among molecular and biological pathways. Furthermore, the limited availability of training data limits the use of more advanced approaches, such as DL, while traditional ML methods often struggle to effectively analyze large and complex datasets. Consequently, researchers continue to investigate more effective computational approaches to address these challenges. In our study, we propose a robust graph-based computational model for predicting potential DILI compounds. Our model is based primarily on graph attention networks (GAT), which effectively capture molecular toxicity by focusing on interaction patterns between atoms in molecules. The attention mechanism in GAT allows the model to focus selectively on the most relevant and distinctive features of compounds.
Materials and Methods
Dataset
To train our prediction model, we obtained data from Ai et al. (2018) and Lee & Yoo (2024). The data was merged and then carefully curated to obtain a unified dataset of 1,829 samples, including 1,024 DILI compounds (positive samples) and 805 non-DILI compounds (negative samples). Data curation was performed using a protocol developed by Fourches, Muratov & Tropsha (2010). The curated dataset was used to create an independent test set and a modeling set with a ratio of 1:9. The modeling set was then divided into a training set and a validation set comprising 90% and 10%, respectively.
Data pre-processing
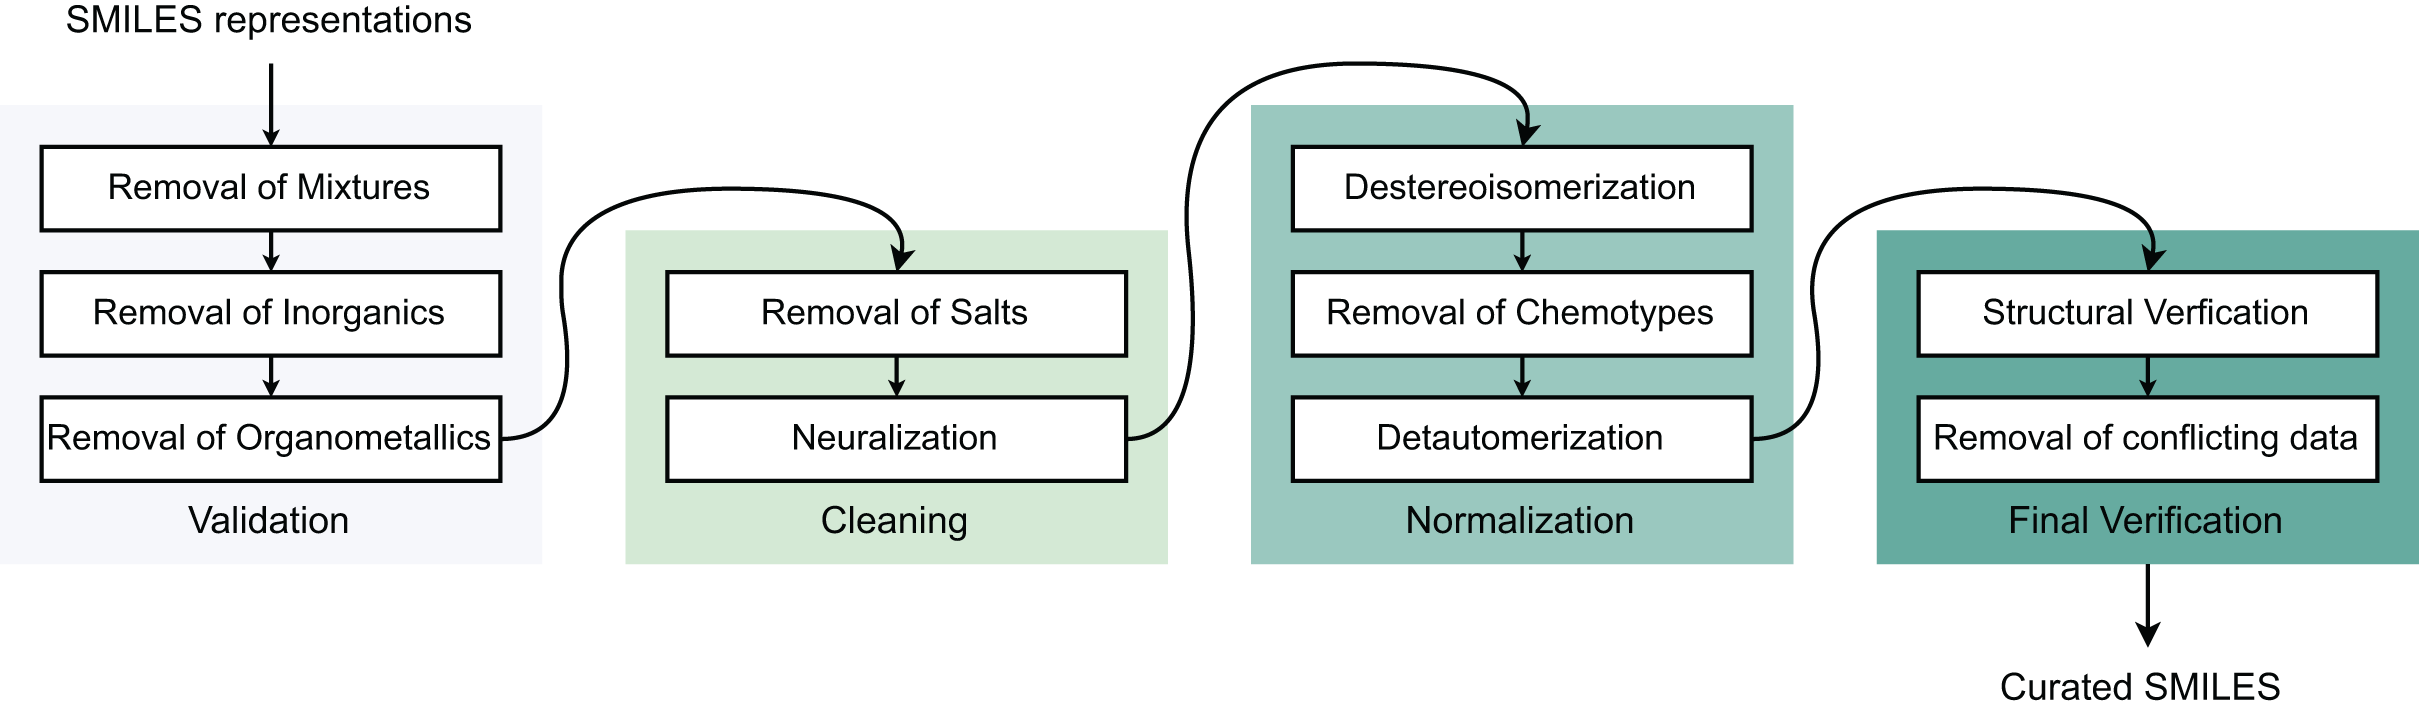
To ensure data quality for molecular modeling, we developed a preprocessing framework to eliminate poor-quality compounds and improve model performance with four sequential steps: (I) Validation, (II) Cleaning, (III) Normalization, and (IV) Final verification (Fourches, Muratov & Tropsha, 2010). Initially, all Simplified Molecular Input Line Entry System (SMILES) structures are converted to canonical forms. Step (I) removes inorganic compounds, mixtures, and organometallics. Step (II) addresses salt forms and charged species—metal-containing molecules are excluded while charged fragments undergo neutralization, though this remains controversial in drug discovery as neutralization may alter molecular properties. Step (III) standardizes stereoisomers and tautomers into canonical forms, with tautomers converted to their most stable structures to prevent interchange between different states. Step (IV) validates molecular identities using CAS registry numbers, removing duplicates and resolving conflicting labels. Duplicate entries with identical labels are merged, while those with contradictory labels are eliminated. Final structural verification occurs through cross-referencing with PubChem and ChEMBL databases. Table 1 summarizes the post-processing data distribution for modeling (Fig. 1).
| Data | Number of samples | ||
|---|---|---|---|
| DILI compounds | Non-DILI compounds | Total | |
| Training | 830 | 652 | 1,482 |
| Validation | 92 | 72 | 164 |
| Independent test | 102 | 81 | 183 |
| Total | 1,024 | 805 | 1,829 |
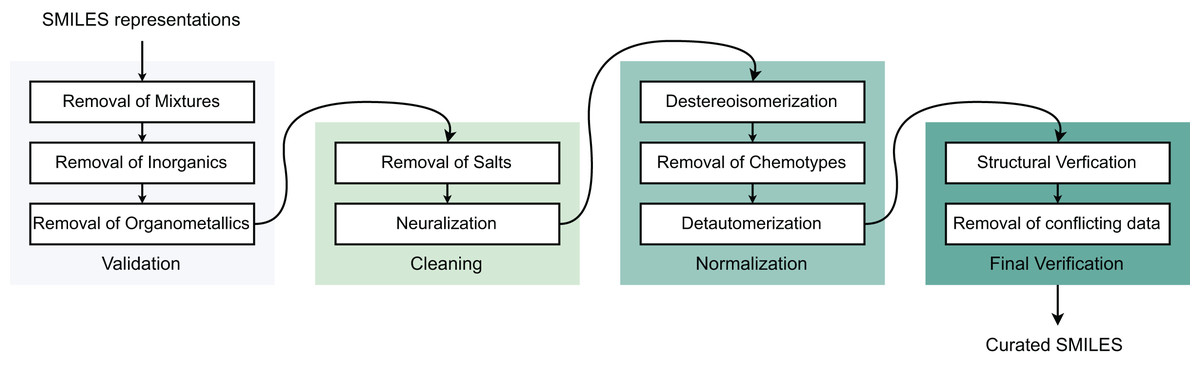
Figure 1: Data pre-processing stages.
Molecular graph representation
The transformation of molecular structure into a molecular graph begins with the SMILES string representation of the molecule. During this conversion process, atoms are mapped to graph nodes, while bonds are represented as edges connecting these nodes. Each atom node is represented by a comprehensive 27-dimensional feature vector that captures critical molecular properties including atom type (one-hot encoded for 14 possible types such as carbon and oxygen), degree (number of bonds formed), formal charge, hybridization state (sp, sp2, sp3), aromaticity status, hydrogen count, and scaled atomic mass. Similarly, each bond edge is represented by an 11-dimensional feature vector encoding bond type (single, double, triple, aromatic), conjugation status, ring membership, and stereo configuration. The resulting molecular graph structure consists of node features as a tensor of shape [num_atoms, 27], edge indices as a tensor of shape [2, num_bonds] representing atomic connectivity, and edge attributes as a tensor of shape [num_bonds, 11] containing bond-specific information. This graph representation preserves the essential structural and chemical information of the original molecule while providing a format suitable for graph neural network processing. The comprehensive feature encoding encompasses both atomic and bond-level descriptors as detailed in Table 2.
| Feature type | Feature | Description |
|---|---|---|
| Atom features | Atom type | One-hot encoded element identity (C, N, O, S, etc.) |
| Degree | Number of bonded neighbors | |
| Formal charge | Charge state of the atom | |
| Hybridization | sp, sp2, sp3 hybridization states | |
| Aromaticity | Whether atom is in aromatic system | |
| Hydrogen count | Number of attached hydrogen atoms | |
| Ring membership | Whether atom is part of ring structure | |
| Atomic mass | Scaled atomic mass of the element | |
| Bond features | Bond type | Single, double, triple, aromatic bonds |
| Conjugation | Whether bond is conjugated | |
| Ring membership | Whether bond is part of ring system | |
| Stereochemistry | Cis/trans stereo configuration |
Model architecture
Graph attention networks
GAT represent a powerful neural architecture that leverages attention mechanisms to effectively aggregate information from neighboring nodes in a graph structure. The core innovation of GAT lies in their ability to assign different importance weights to different neighbors during the message passing process. For a given node , the attention mechanism computes attention coefficients between node and its neighbor using a learnable attention function. The attention coefficient is calculated as:
(1) where represents a learnable weight matrix, and are the feature vectors of nodes and respectively, is a learnable attention vector, and denotes concatenation. These raw attention scores are then normalized using the softmax function:
(2) where represents the neighborhood of node . The final node representation is computed as a weighted combination of neighbor features:
(3) where is a nonlinear activation function. This attention-based aggregation enables the network to focus on the most relevant molecular substructures while maintaining the flexibility to adapt to different chemical contexts.
Proposed model
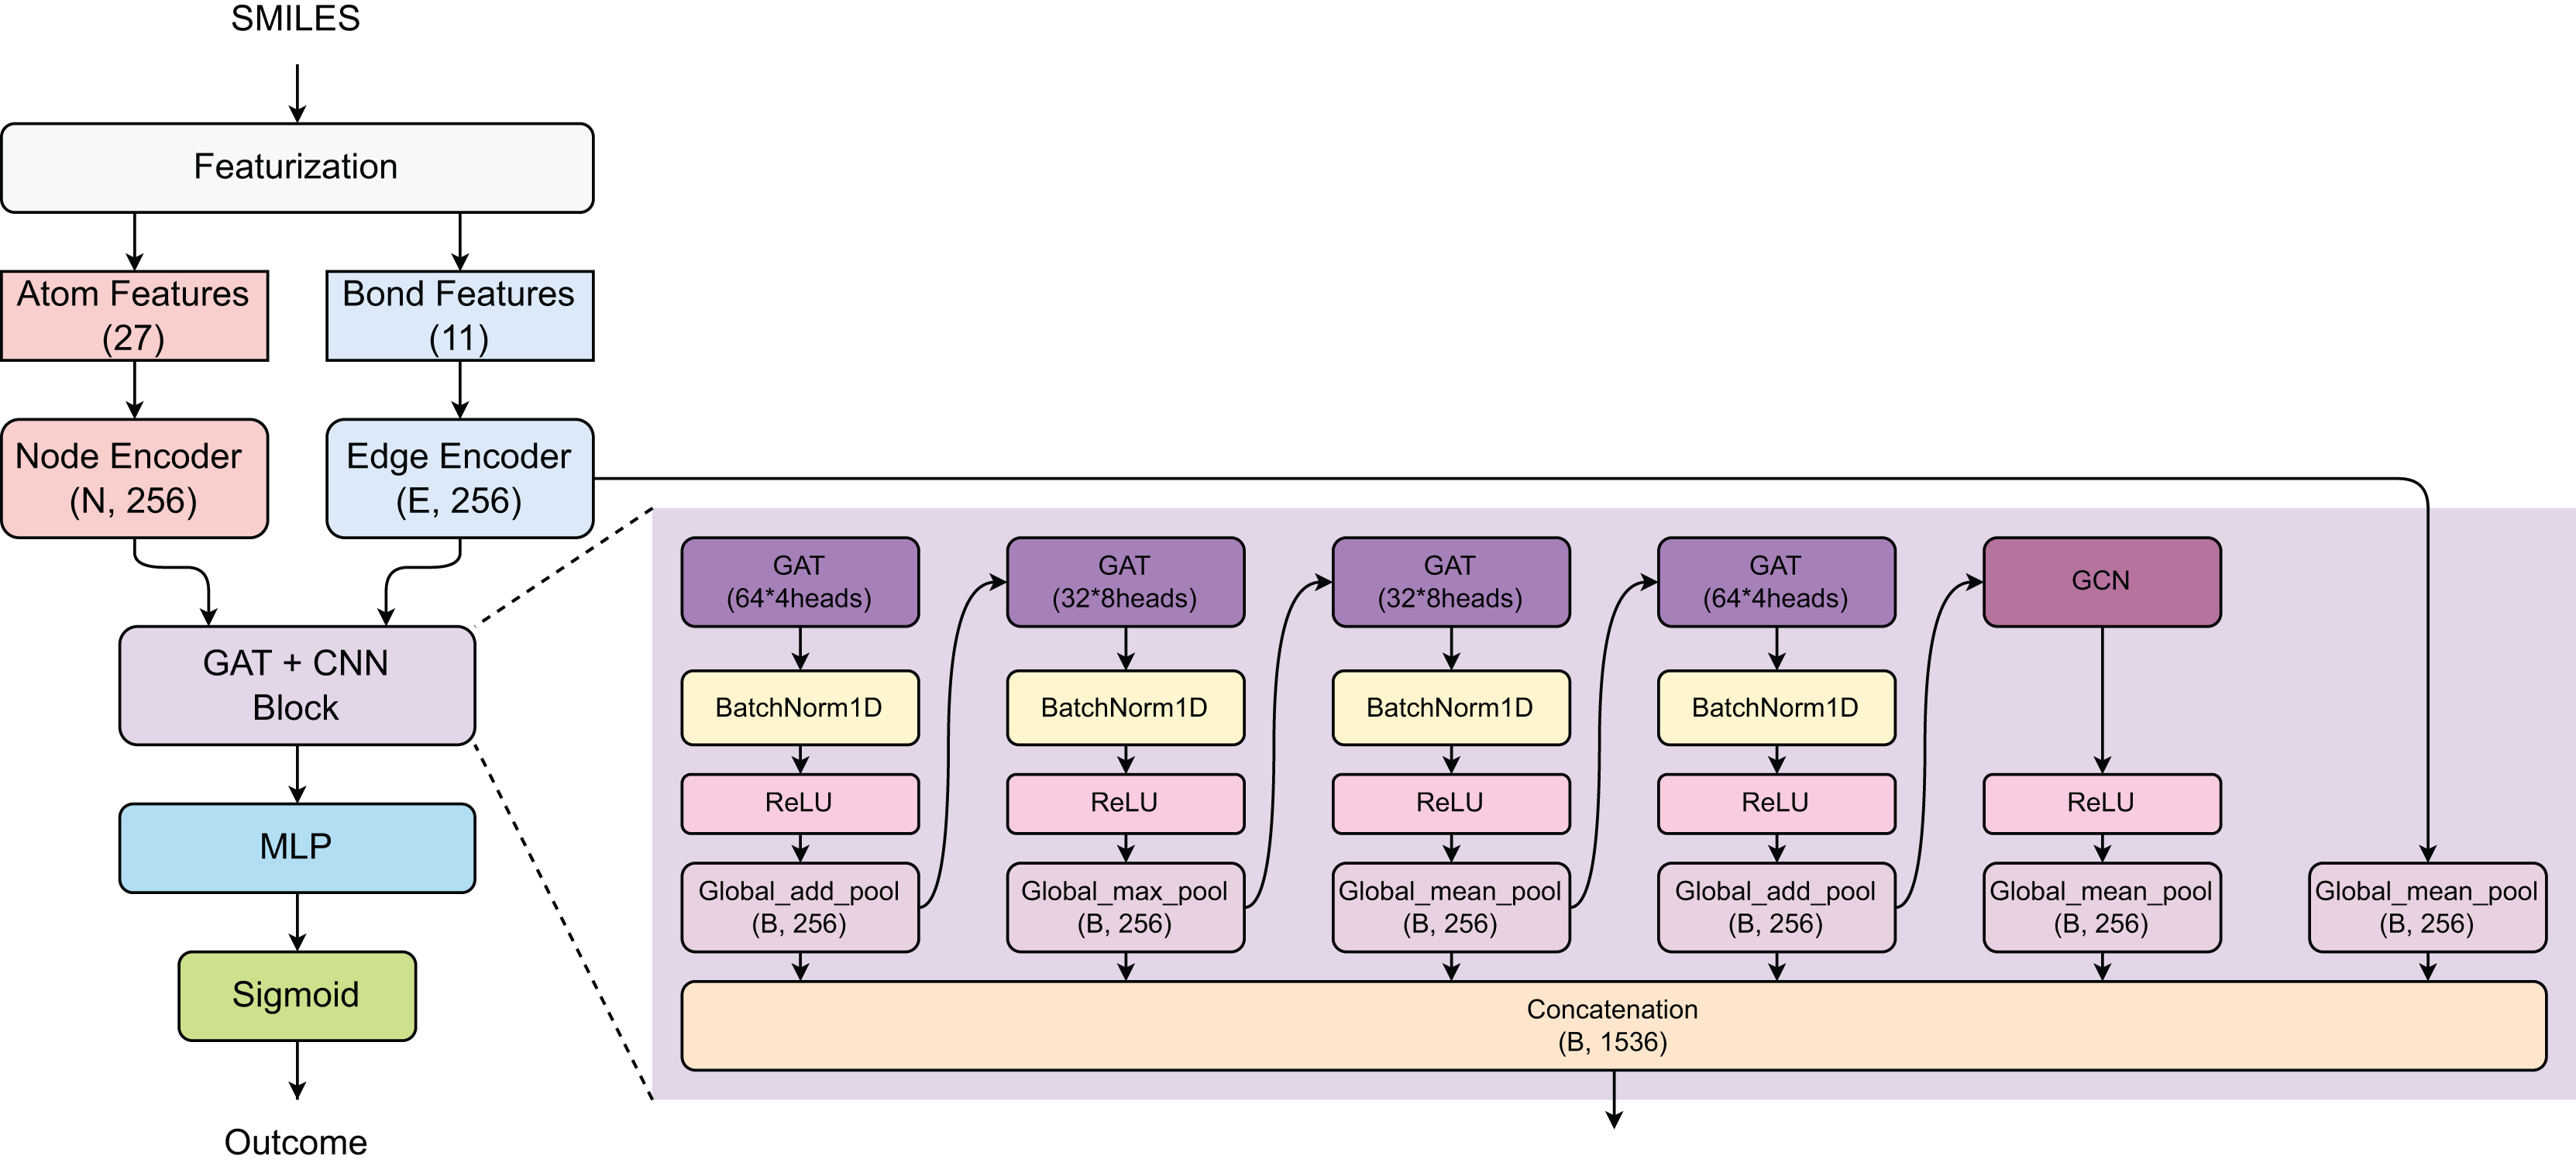
The proposed model employs a hybrid GAT and graph convolutional network (GCN) architecture for prediction task (Fig. 2). Initially, the SMILES of compounds were converted into atom features (27 dimensions) and bond features (11 dimensions), which are processed through Node and Edge encoders to generate 256-dimensional representations. The core architecture consists of a GAT+CNN block with multiple parallel branches: four GAT layers with varying configurations (64 × 4 heads, 32 × 8 heads, 32 × 8 heads, and 64 × 4 heads) using different pooling strategies (Global_add_pool, Global_max_pool, Global_mean_pool), and one GCN component with Global_mean_pool, all followed by BatchNorm1D and ReLU activations. The outputs from all parallel branches are concatenated to form a comprehensive feature representation of size (B, 1,536), which is then processed through a multi-layer perceptron (MLP) and sigmoid activation for binary classification.
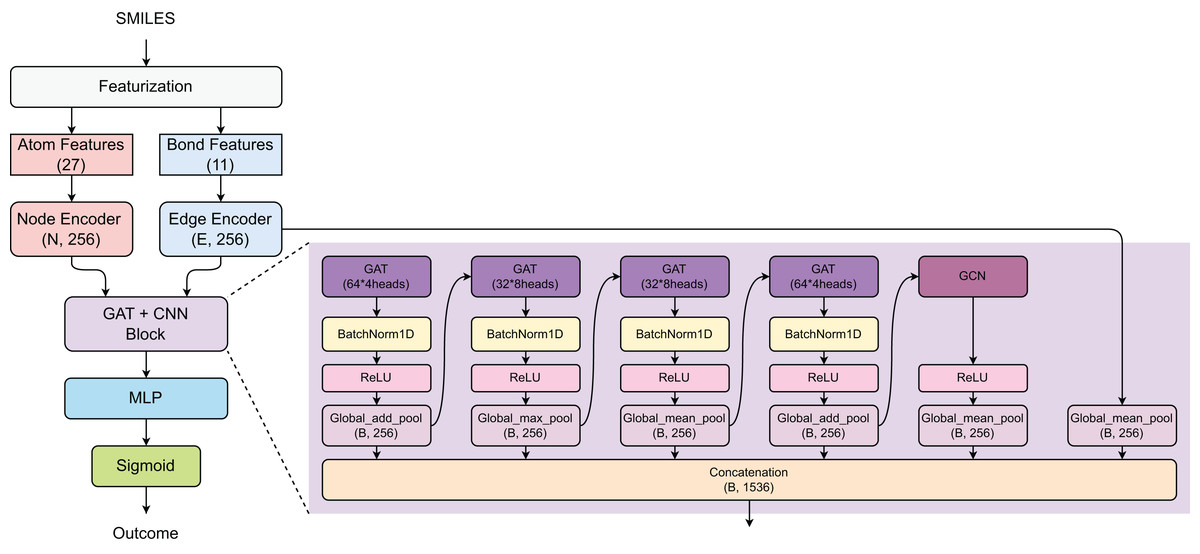
Figure 2: Model architecture.
This architecture leverages multiple attention mechanisms and diverse pooling strategies to capture comprehensive molecular representations while maintaining computational efficiency for practical toxicity screening applications.
Modeling settings
The model is trained using Binary Cross-Entropy loss with the Adam optimizer (learning rate = 0.0001, weight decay = ). A ReduceLROnPlateau scheduler reduces the learning rate by half when validation performance plateaus for 10 epochs. Early stopping is implemented based on validation ROC-AUC with a patience of 20 epochs to prevent overfitting. Training is limited to 100 epochs, with the best model checkpoint saved automatically based on validation performance.
Implementation configurations
All computational experiments were performed using the PyTorch 2.1 framework on an NVIDIA GeForce RTX 4080 GPU with 16 GB of VRAM. Data preprocessing and feature extraction tasks were carried out on an Ubuntu 22.04 LTS system running an AMD Ryzen 9 5900X processor (3.7 GHz base frequency, 4.8 GHz boost) with 64 GB of DDR4 RAM.
Evaluation method
Evaluation metrics
To evaluate model performance, we used Area Under the ROC Curve (ROC-AUC), Area Under the Precision-Recall Curve (PR-AUC), and F1-score. ROC-AUC measures the model’s discriminative ability:
(4)
(5)
PR-AUC evaluates the precision-recall trade-off, where:
(6)
(7)
F1-score represents the harmonic mean of precision and recall:
(8) where TP, TN, FP, and FN denote true positives, true negatives, false positives, and false negatives, respectively.
Baseline models
To contextualise our approach, we compare against a diverse baseline suite spanning classical ML and molecular DL/graph baselines: Random Forests, SVM, Logistic Regression, MolecularGNN, MD-GNN, and ChemBERT+MLP. This mix probes whether generic tabular learners, pretrained chemistry models, or alternative graph architectures best capture DILI signal. Our method is evaluated under the same data split and metric protocol as these baselines.
Experimental protocol
We follow a fixed, stratified three-way split: an independent test set held out once; the remaining modelling set split into training and validation partitions. Early stopping and learning-rate scheduling are governed by validation ROC-AUC. After training, we report test-set ROC-AUC, PR-AUC, and F1 for each method under identical preprocessing and evaluation code paths, ensuring like-for-like comparison.
To quantify robustness to random initialisation and sampling noise, we repeat training 20 independent trials with different seeds and report mean with standard deviation for all metrics. This protocol demonstrates narrow variance bands across trials and supports the statistical reliability of the observed ranking.
Results and discussion
Table 3 shows the performance of our model compared to baseline machine learning, large language models, and graph deep learning approaches. The experimental results demonstrate that our proposed model significantly outperforms all baseline methods across all evaluation metrics. Our approach achieves an ROC-AUC of 0.8481, substantially exceeding the best-performing baseline model (ChemBERTa-77M-MLM at 0.7642). This superior performance is even more pronounced in PR-AUC, where our model achieves 0.9008 compared to LR (0.8245), the best-performing baseline. Similarly, the F1-score of our model surpasses all competing methods, achieving 0.8017 compared to MD-GNN (0.7667). Among the baseline approaches, conventional machine learning methods show mixed performance, with LR achieving competitive PR-AUC scores. The large language model approaches demonstrate varying effectiveness, with ChemBERTa-77M-MLM significantly outperforming ChemBERT + MLP across all metrics. Graph deep learning methods also show diverse performance, with MolecularGNN and MD-GNN achieving strong results in specific metrics, while D-MPNN and AttentiveFP show more modest performance. These results underscore the effectiveness of our model architecture in capturing complex molecular patterns for DILI prediction, consistently outperforming approaches across all three methodological categories.
| Category | Method | ROC-AUC | PR-AUC | F1 |
|---|---|---|---|---|
| Machine learning | Random Forests (RF) | 0.7069 | 0.7607 | 0.7463 |
| Support Vector Machines (SVM) | 0.7017 | 0.7873 | 0.7612 | |
| Logistic Regression (LR) | 0.7418 | 0.8245 | 0.7572 | |
| Large language model | ChemBERT + MLP | 0.6982 | 0.7301 | 0.7080 |
| ChemBERTa-77M-MLM | 0.7642 | 0.7932 | 0.7554 | |
| Graph deep learning | MolecularGNN | 0.7340 | 0.8214 | 0.7635 |
| MD-GNN | 0.7162 | 0.7940 | 0.7667 | |
| AttentiveFP | 0.7589 | 0.7914 | 0.7456 | |
| D-MPNN | 0.6973 | 0.7239 | 0.7087 | |
| Ours | 0.8481 | 0.9008 | 0.8017 |
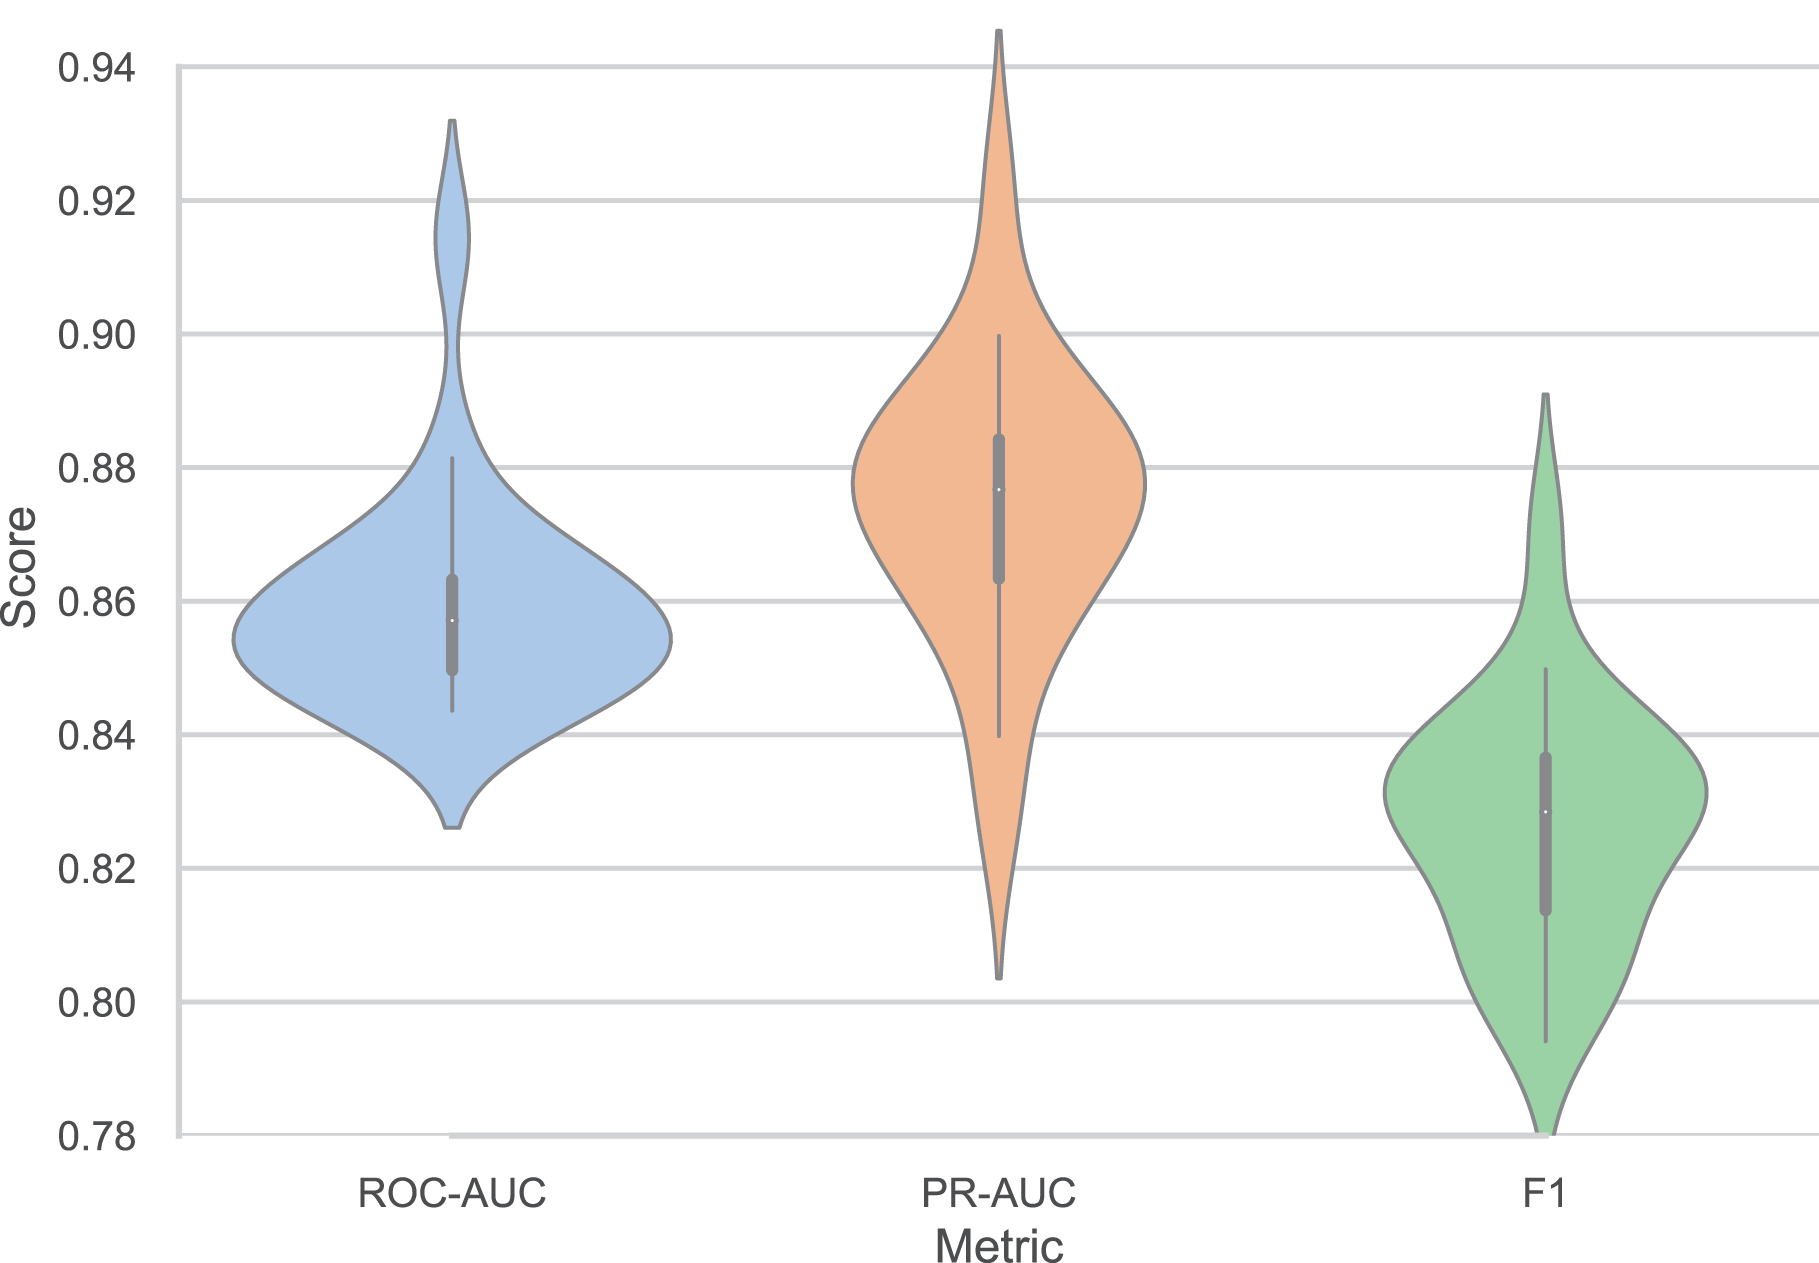
Figure 3 presents the performance consistency of our model across twenty independent trials, demonstrating robust stability and reproducibility. The model achieves a mean ROC-AUC of 0.8595 with a standard deviation (SD) of 0.0160, indicating minimal performance variation across different random initializations. Similarly, the PR-AUC maintains consistent performance with a mean of 0.8744 and SD of 0.0210, while the F1-score shows comparable stability with a mean of 0.8266 and SD of 0.0181. The relatively low SDs across all metrics (ranging from 1.6% to 2.4% of the mean values) confirm the model’s reliability and robustness to random initialization effects. The performance range across trials demonstrates consistent quality, with the highest-performing trial achieving a ROC-AUC of 0.9144, PR-AUC of 0.9223, and F1-score of 0.8711, while even the lowest-performing trial delivers strong results of 0.8436, 0.8266, and 0.7941 for ROC-AUC, PR-AUC, and F1-score, respectively. The PR-AUC metric shows slightly higher variability compared to ROC-AUC and F1-score, which is expected given its sensitivity to class distribution variations in different data splits. These results establish the reproducibility and statistical significance of our model’s superior performance, providing confidence in its practical applicability for DILI prediction tasks.

Figure 3: Performance variation of our models across twenty independent trials (ROC-AUC = 0.8595 ± 0.0160, PR-AUC = 0.8744 ± 0.0210, F1 = 0.8266 ± 0.0181).
Model interpretation
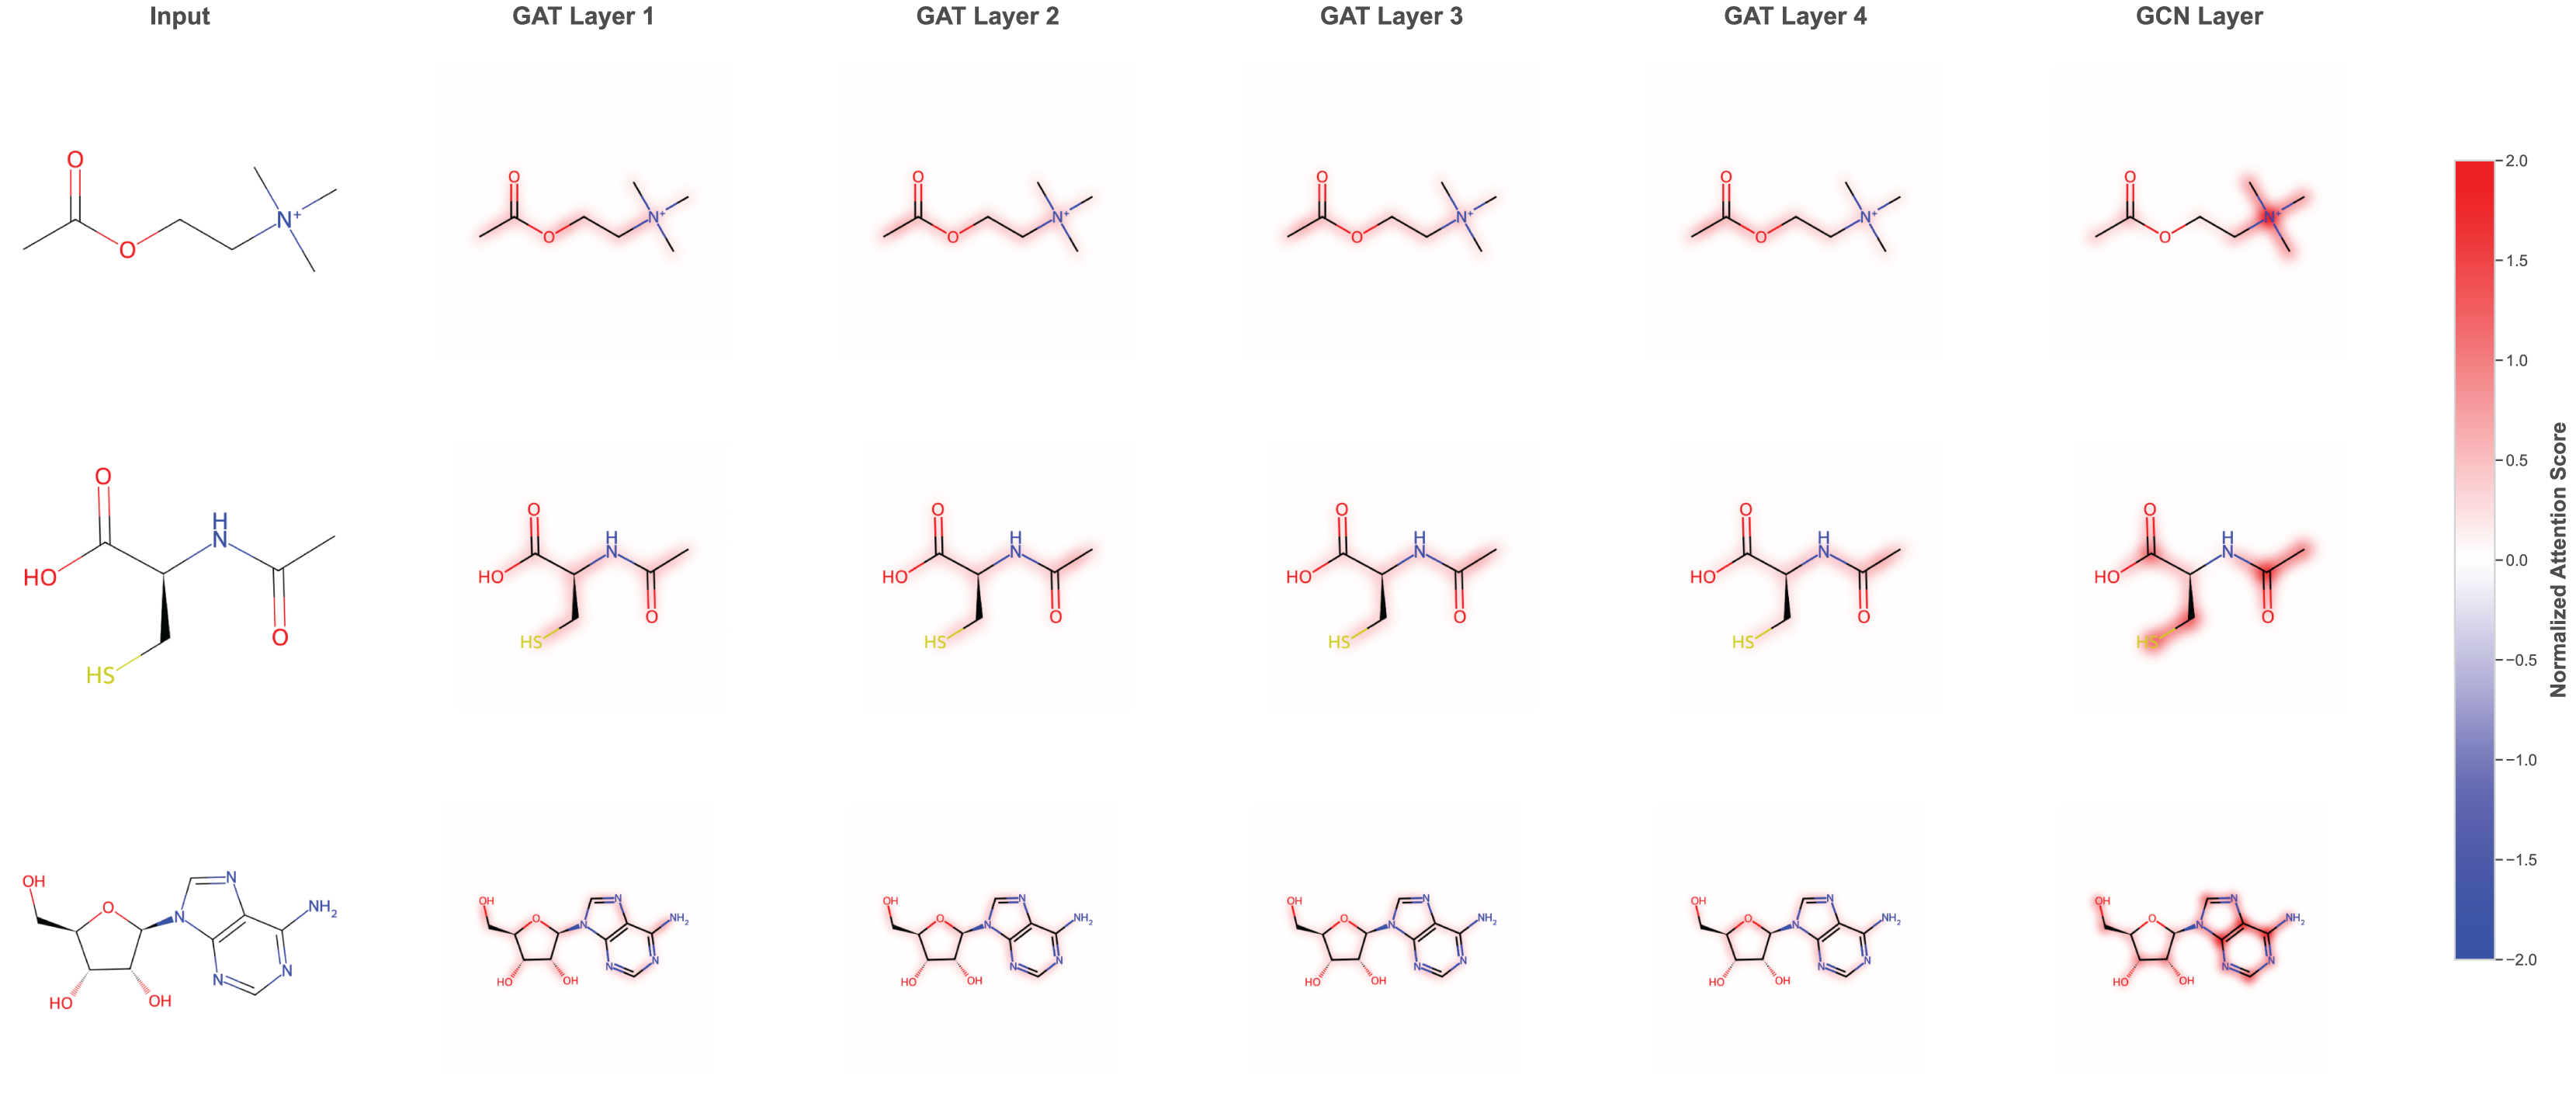
We visualized the attention-based learning heatmap to interpret learning patterns by focusing on specific molecular structures that are critical for DILI prediction. The attention analysis reveals that the model identifies and weights different molecular substructures across multiple GAT layers. As shown in the attention heatmaps (Fig. 4), the model progressively refines its focus through GAT Layer1 to GAT Layer4, followed by the final GCN layer, with normalized attention scores highlighting the most relevant molecular regions. The attention mechanism effectively captures important functional groups and structural motifs, such as hydroxyl (HO) groups and sulfur-containing moieties, which are known to be associated with hepatotoxicity. This layer-wise attention refinement allows the model to build hierarchical representations of molecular toxicity patterns, where early layers capture local structural features and deeper layers integrate these into more complex toxicologically relevant patterns. The interpretable attention weights provide valuable insights into the molecular basis of DILI, enabling researchers to understand which specific structural elements contribute most significantly to the model’s predictions and potentially guiding future drug design efforts.
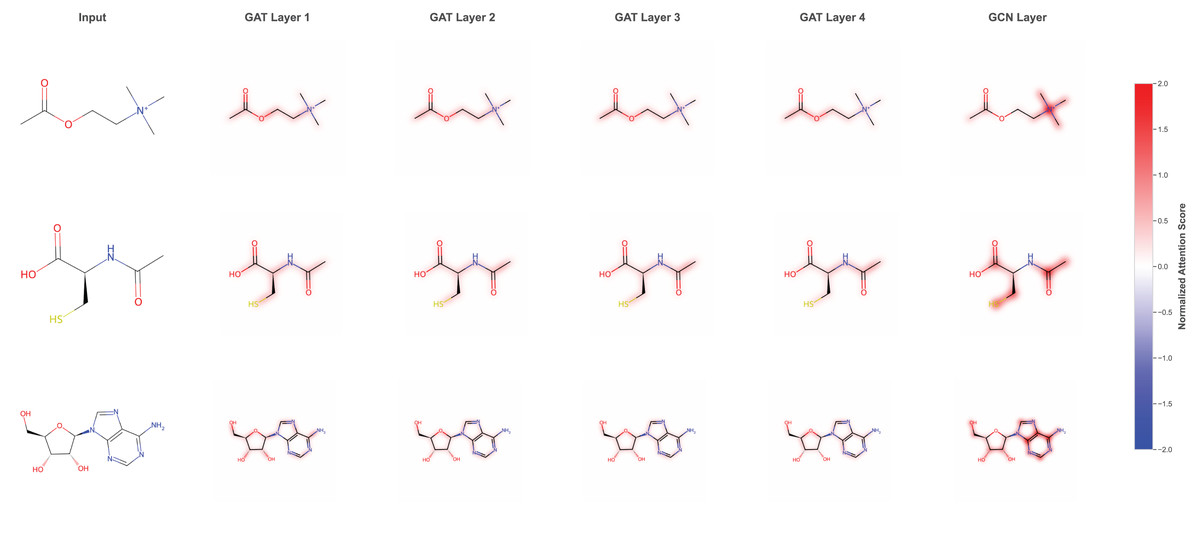
Figure 4: Attention-based learning on specific molecular structure throughout the model.
Limitations and future research
Our study has several limitations that point to concrete avenues for improvement. First, dataset heterogeneity and class imbalance constrain generalization; larger, prospectively curated cohorts with scaffold-aware splits and external validation will better characterize transportability across chemotypes and assay conditions. Second, while our attention mechanisms provide qualitative insight, quantitative interpretability and uncertainty calibration remain incomplete; integrating physics-informed priors could improve faithfulness and sample efficiency (Ren et al., 2025). Third, our featurization relies on 2D graphs; augmenting with lightweight 3D conformer priors and contrastive multimodal representation learning may enhance stereochemistry-dependent signals without prohibitive cost (Nguyen et al., 2024). Finally, expanding to multi-task toxicity panels, domain adaptation across assay platforms, and prospective, time-stamped benchmarks will be important to support real-world screening pipelines.
Conclusion
This study presents a robust graph-based computational model using graph attention networks for predicting DILI compounds, achieving superior performance compared to existing baselines. The consistency analysis across twenty independent trials confirms the model’s stability and reproducibility, establishing confidence in its practical applicability. The graph-based framework developed in this work can be readily adapted to predict other types of molecular toxicity and drug properties, demonstrating its versatility for broader pharmaceutical applications. Resolving computational complexity issues can further improve prediction accuracy and scalability.