
Hybrid GNN-Transformer model for multi-omic cancer classification with interpretable pathway-driven feature selection
- Published
- Accepted
- Received
- Academic Editor
- Siddhartha Bhattacharyya
- Subject Areas
- Artificial Intelligence, Data Mining and Machine Learning, Optimization Theory and Computation, Neural Networks
- Keywords
- Multi-omic, Pathway-driven, Hybrid GNN-Transformer, Breast cancer
- Copyright
- © 2026 EL kati et al.
- Licence
- This is an open access article distributed under the terms of the Creative Commons Attribution License, which permits unrestricted use, distribution, reproduction and adaptation in any medium and for any purpose provided that it is properly attributed. For attribution, the original author(s), title, publication source (PeerJ Computer Science) and either DOI or URL of the article must be cited.
- Cite this article
- 2026. Hybrid GNN-Transformer model for multi-omic cancer classification with interpretable pathway-driven feature selection. PeerJ Computer Science 12:e3415 https://doi.org/10.7717/peerj-cs.3415
Abstract
Accurate classification of cancer subtypes is critical for precision oncology, yet existing methods often fail to integrate multi-omic data while providing biologically interpretable insights. This study presents a novel hybrid deep learning framework for cancer classification that synergistically combines graph neural networks (GNNs) and transformers to model complex interactions across genomic, epigenetic, and functional biological layers. Our approach introduces three key innovations: (1) a heterogeneous graph integrating gene expression, DNA methylation, and pathway nodes with biologically meaningful edges (protein interactions, regulatory relationships); (2) discrete wavelet transforms for spatial-aware dimensionality reduction of methylation data, preserving critical regional patterns; and (3) pathway-guided attention mechanisms that prioritize oncogenic signaling pathways while ensuring interpretability. Experiments demonstrate superior performance over state-of-the-art methods in the classification of 23 cancer types and of breast-cancer subtypes. By bridging artificial intelligence (AI) with cancer biology, our framework enables interpretable multi-omic integration, offering clinicians pathway-level explanations for predictions while maintaining cross-platform robustness. This work advances precision oncology by providing both accurate classification and actionable biological insights, paving the way for improved therapeutic strategies.
Introduction
Cancer is one of the most leading causes of mortality worldwide, and successful therapy remains a real challenge despite enormous advancement in healthcare over the past century. A primary method of cancer categorization is based on the anatomical site (tissue or organ) of origin, for instance, breast cancer and prostate cancer. To aid physicians in early detecting cancer and classifying it as benign or malignant, artificial intelligence (AI) systems have been developed based on machine learning (ML) (Elkorany et al., 2022; Uddin et al., 2023) and deep learning (DL) (Gao et al., 2019; Kaur, 2023; Neffati & Machhout, 2023; Archana, 2024; EL Kati et al., 2024) techniques. Such systems are based on recognizing abnormalities by using different imaging modalities, such as histopathology and mammography images.
Recently, precision oncology has evolved as a cutting-edge method of cancer care in which diagnosis, prognosis, and personalized treatment are guided by the individual’s genetic and molecular profile. The new method leverages high-throughput sequencing technologies and bioinformatics pipelines to perform large-scale profiling of ‘omics’ (e.g., genomics, epigenomics, and transcriptomics) data to identify cancers subtypes based on molecular features of primary tumors. For example, breast cancer can be divided into five intrinsic subtypes, luminal A, luminal B, HER2+, basal-, and normal-like according to PAM50 subtyping system (Parker et al., 2009). The potential importance of a molecular subtype-based cancer taxonomy for precision oncology has been emphasized in some works (Mateo et al., 2022). As pointed out, the heterogeneous nature of cancer and the complex biological processes is better understood thanks to the new cancer taxonomy.
The application of AI to precision oncology is still in its infancy, and there is a critical need for innovative strategies to effectively integrate data generated from multiple types of omics in order to fully leverage the interactions and complementary information in multi-omics data. While individual omics data type only describe molecular characteristics at a specific level, combining multiple omics data can offer a more thorough perspective for defining cancer subtypes and enhance our comprehension of the intricate relationships between biomolecules at various levels (Cabassi & Kirk, 2020). This fact has motivated many recent attempts to establish AI-based multi-omics integrative frameworks that integrate data across different biological layers to build accurate predictive models (Nicora et al., 2020). Despite the appreciable efforts, translating these multi-omic layers into clinically actionable insights is still a real challenge (Sobhan, Islam & Mondal, 2025).
DL multi-omics integrative models were developed using artificial neural network (ANN) and convolutional neural network (CNN) (Gao et al., 2019; Nicora et al., 2020; Chen et al., 2023; Mohamed & Ezugwu, 2024). However, such models treat genes as independent features and miss cross-omic interactions. Cancer biology involves interactions between genes, epigenetic regulation, and pathway-level coordination. Genetic mutations or alterations can lead to uncontrolled cell growth, which can occur in oncogenes (genes that promote cell growth) or tumor suppressor genes (genes that normally prevent excessive cell growth). Abnormal epigenetic regulation, i.e., changes in gene expression that do not involve alterations to the underlying DNA sequence (e.g., DNA methylation), can also contribute to the development and progression of tumors. In addition, cancer involves complex networks of signaling pathways (i.e., collections of interacting genes) that regulate cell behavior, where these pathways often become dysregulated, leading to the hallmark features of cancer, such as uncontrolled proliferation and resistance to cell death. By ignoring gene-gene interactions and biological pathways, the proposed models operate as “black boxes” without biological rationale for predictions, which may limits their clinical adoption. To overcome this challenge, some works have integrated multi-omic data with knowledge of cancer pathways to develop explainable DL models (Cai et al., 2024; Sobhan, Islam & Mondal, 2025).
Recent attempts have focused on graph-based representations of molecular interactions and processing them using graph neural networks (GNNs) such as graph CNNs (GCNNs) (Ramirez et al., 2020; Wang et al., 2021; Li, Wang & Nabavi, 2021; Wang, Bai & Nabavi, 2021) and graph attention networks (GATs) (Kaczmarek et al., 2021; Lan et al., 2024; Tanvir et al., 2024; Alharbi et al., 2024; Li & Nabavi, 2024). However, these approaches often use homogeneous graphs, and fail to model gene-methylation-pathway heterogeneity. Also, they lack a unified framework to jointly model local graph-structured relationships (e.g., protein-protein interactions) and global feature dependencies (e.g., co-methylation across chromosomes). Furthermore, they mainly fail to ground predictions in established biological pathways, limiting their interpretability and clinical utility.
The main goal of this article is to develop a deep learning framework that integrates gene expression, methylation data, and pathway activity into a unified model for cancer subtype prediction, while enabling interpretable identification of critical biomarkers and biological pathways. To this end, three core computational challenges are addressed in this work. First, multi-modal integration is required to combine tabular (gene expression), spatial (methylation positions on chromosomes), and graph-structured (pathway relationships) data. Second, multi-omics data is high-dimensional and must be properly handled, where human cells contain k genes and k methylation sites, creating a feature space with samples features. Third, interpretable predictions are key factors, where clinicians require explanations grounded in biological mechanisms.
The significant contributions made in this article are manifolded.
-
Multi-modal integration using graph representation: We construct a heterogeneous graph, where nodes represent genes, methylation sites, and pathways, and edges encode cross-modal relationships (i.e., protein interactions, promoter regulation, and pathway membership). We use GNNs to propagate signals across the heterogeneous graph, capturing dependencies between omics layers.
-
Effective dimensionality reduction: We use Haar Wavelet Transform (HWT) with particle swarm optimization (PSO) to compress methylation data while preserving spatial genomic information (e.g., CpG island locations). HWT is a multi-scale feature extraction method that analyzes a signal by decomposing it into different frequency components at different resolutions (scales). It compresses methylation data by representing it as a compact set of coefficients capturing essential multi-scale trends and significant local variations, while discarding minor details and noise. PSO, which is a population-based metaheuristic optimizer inspired by the collective behavior of biological swarms (e.g., bird flocks), is then utilized to select wavelet coefficients most relevant to cancer subtypes.
-
Transformer-based attention for context-aware feature selection: We integrate a transformer encoder into GNN to model long-range dependencies in gene expression and methylation data. The self-attention mechanism prioritizes genes with co-expression or co-methylation patterns linked to oncogenic pathways. We apply pathway-guided attention to focus on genes within cancer-related pathways identified from the MSigDB database.
-
Performance evaluation: We compare the performance of the proposed method with that of state-of-the-art methods. We use SHapley Additive exPlanations (SHAP) values (Lundberg & Lee, 2017) to quantify feature importance. We validate prioritized genes/pathways via enrichment analysis.
The remainder of this article is organized as follows. ‘Methods and Materials’ presents the proposed methodology and the materials. The outcomes are detailed with an in-depth explanation provided in ‘Results’. ‘Discussion’ engages in a comprehensive discussion of the results. The conclusions are then highlighted and the potential avenues for future research are identified.
Methods and materials
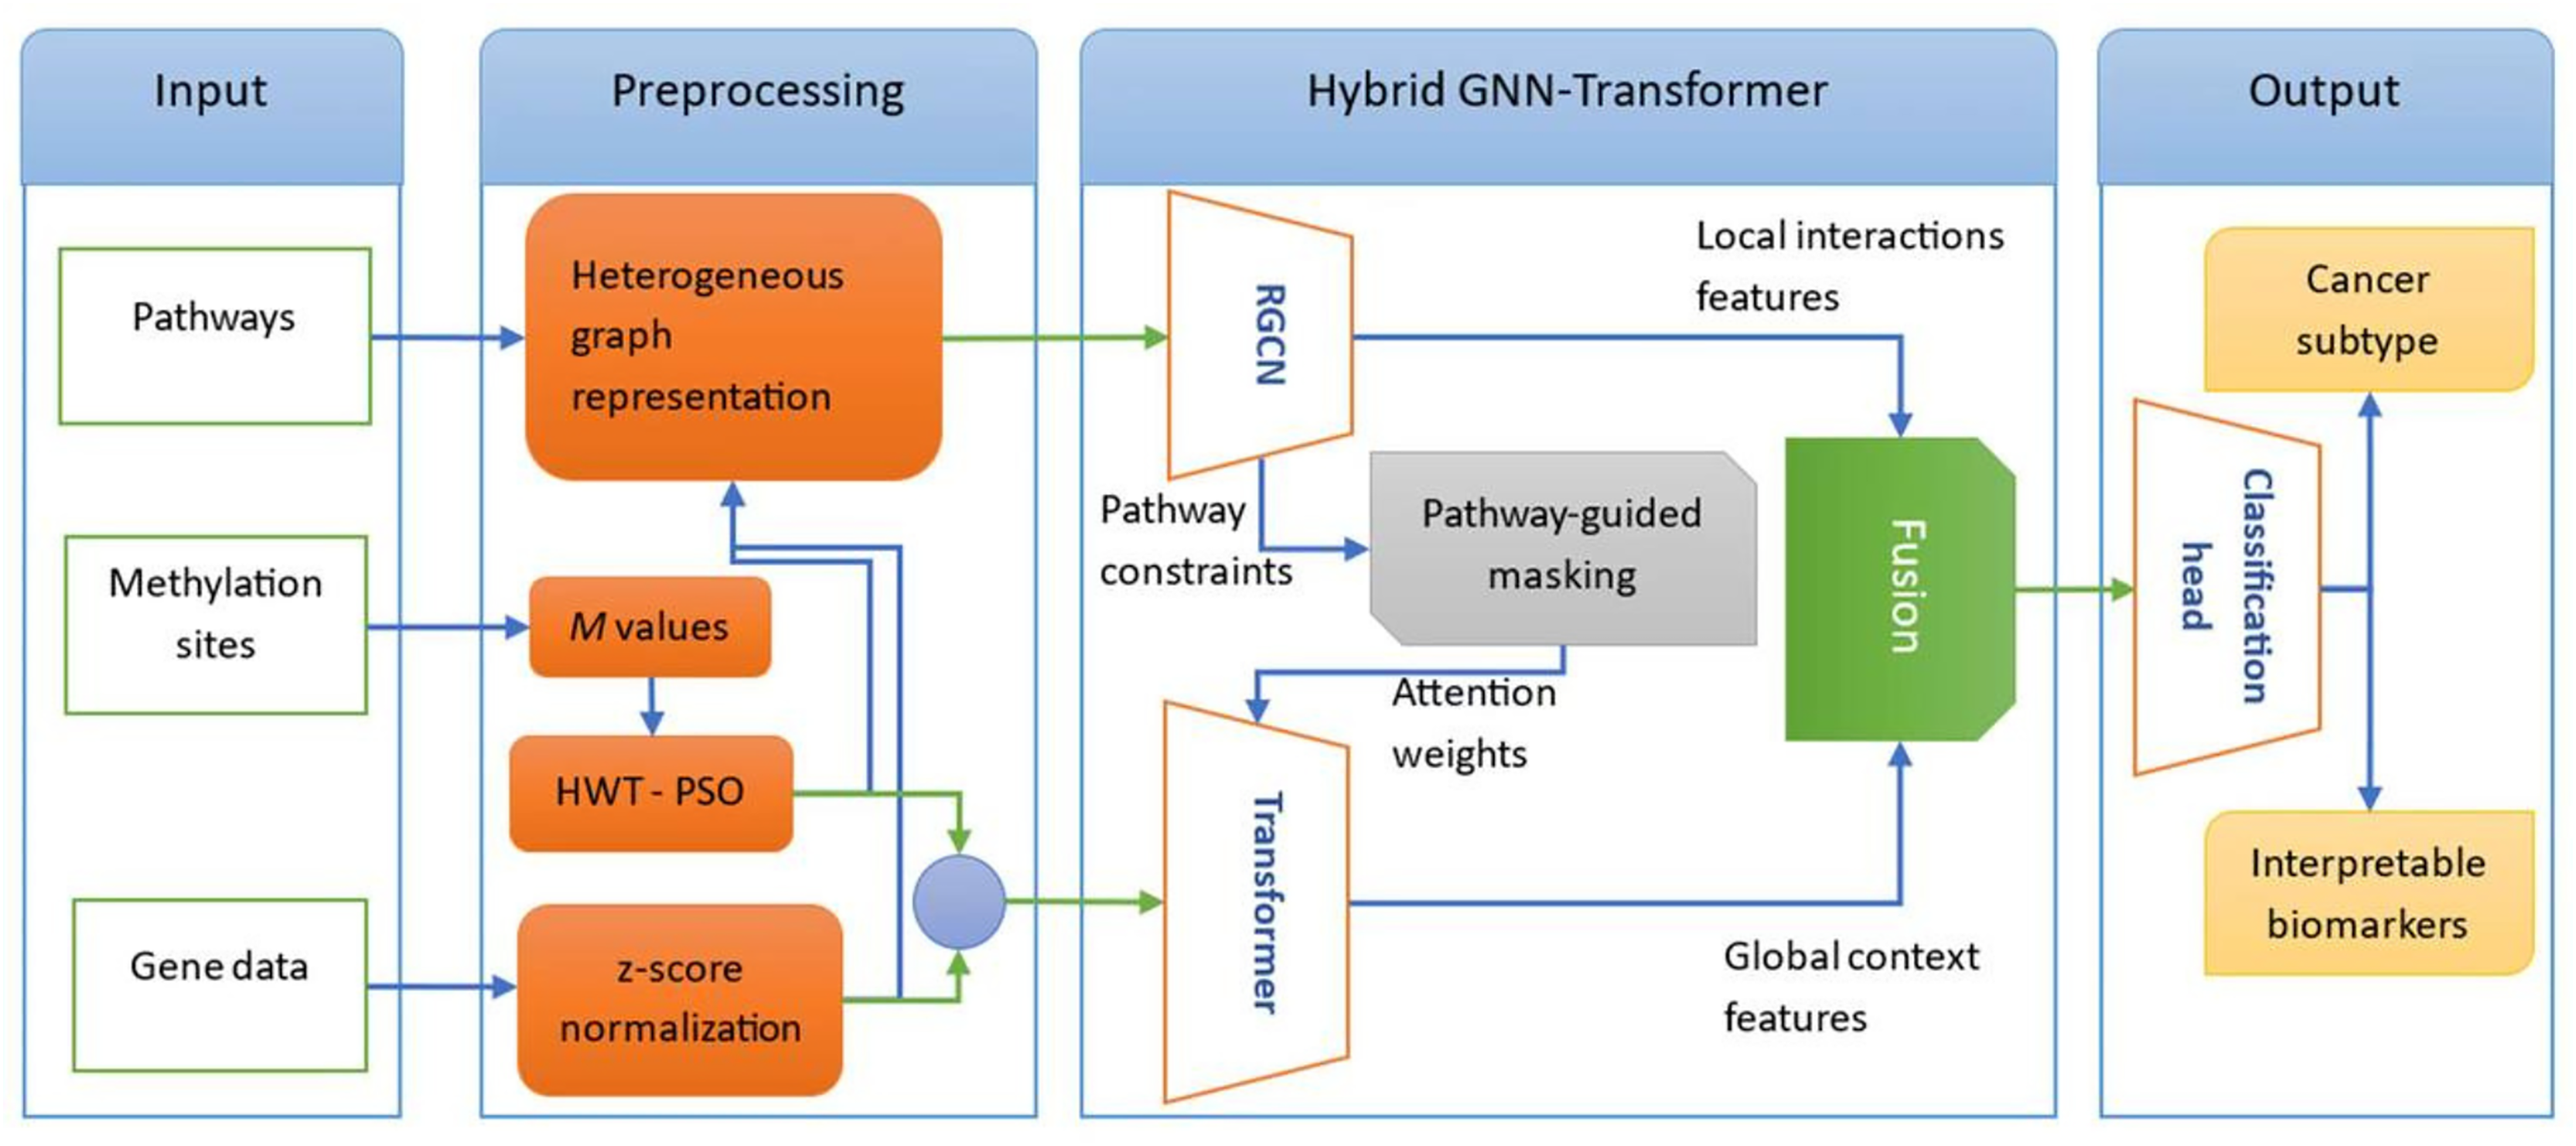
In this section, we outline the methodologies carried out to achieve the research objectives. The block diagram of the proposed model is given in Fig. 1. We model multi-omic interactions through a heterogeneous graph where genes, methylation sites, and pathways are interconnected via experimentally grounded relationships (protein interactions, promoter regulations, pathway memberships). Methylation data is compressed using Haar Wavelet Transform with Particle Swarm Optimization (HWT-PSO) to retain spatial genomic features (e.g., CpG islands) while eliminating noise. Crucially, we deploy a hybrid RCGN-Transformer architecture: Relational Graph Convolutional Networks (RCGN) propagate signals across local topological constraints, while a pathway-guided transformer encoder, biased toward cancer-related pathways, captures long-range dependencies via self-attention. This combination enables context-aware prioritization of co-expression/co-methylation patterns driving oncogenesis. In the following, we first explore data collection and preprocessing steps. Next, we describe each component of the proposed model architecture.
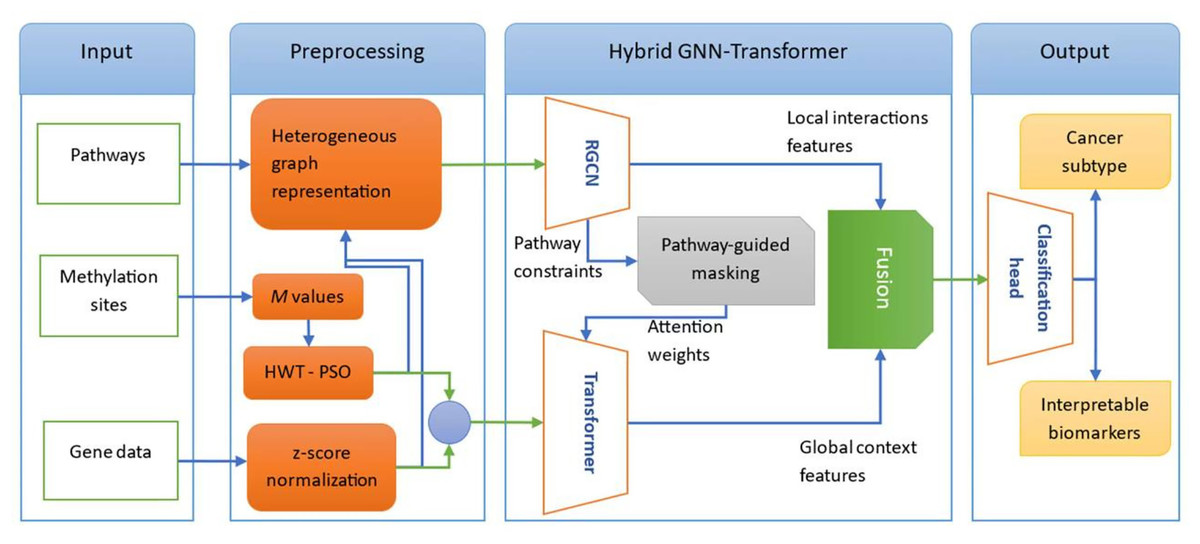
Figure 1: The block diagram of the proposed hybrid GNN-Transformer model for cancer subtypes classification.
Data collection
The proposed dataset consists of gene data, methylation sites, and pathway activities. The gene data are collected from The Cancer Genome Atlas (TCGA) (https://portal.gdc.cancer.gov/). This includes expression values (RNA-seq), mutation status (binary: 1 if mutated, 0 otherwise), and copy number variations (CNV) status (e.g., −1 = deletion, 0 = neutral, +1 = amplification). The methylation sites are collected through UCSC Xena Browser but originating from TCGA, including beta-value (methylation level: 0 = unmethylated, 1 = fully methylated), genomic coordinates (chromosome, start, and end), and association with CpG islands/shores, with all measurements mapped to individual TCGA patients. The pathways data is curate cancer-related pathways collected from MSigDB database, representing biological relationships rather than patient-specific measurements. For cancer classification, the dataset is composed of 6,356 samples of 23 cancer types, with 80% (5,085 samples) for training, 10% (635 samples) for validation, and 10% (636 samples) for testing. For breast cancer subtypes classification, the training dataset is composed of 974 samples of five breast cancer subtypes, and the test dataset is composed of 122 samples collected from the Clinical Proteomic Tumor Analysis Consortium (CPTAC).
Data preprocessing
The collected data is preprocessed in order to ensure effective learning of the proposed model. The gene expressions are normalized using log normalization.
(1) The resulted expressions are further normalized using z-score normalization,
(2) where and are the mean and the standard deviation over all samples, respectively. The beta values of the DNA methylation data are first converted to M-values.
(3)
High-dimensional DNA methylation profiles, with k CpG sites, presents significant computational challenges for cancer classification. Traditional dimensionality reduction techniques like Principal Component Analysis (PCA) often fail to preserve critical spatial patterns in methylation data (e.g., CpG island clusters), which are biologically significant.
In this article, we propose a hybrid approach combining HWT with PSO to achieve efficient feature reduction while retaining diagnostically relevant information. HWT is a multi-scale feature extraction method that decomposes signals into hierarchical approximations (low-frequency trends) and details (high-frequency variations). HWT can decompose data into multi-resolution coefficients, capturing both local and global patterns. In general, HWT is applied iteratively at multiple scales, that is, at each scale, the signal is downsampled, and the resulting coefficients become the input for the next scale. Thus, each scale captures different levels of detail in the signal. In this work, HWT is utilized to decompose methylation M-values (treated as a 1D signal) into approximation (low-frequency trends or broad methylation domains) and detail (high-frequency noise or fine-scale variations) coefficients, where represents the level of the wavelet decomposition. A three-level decomposition of the signal ( and ) is carried out with high-resolution details (individual CpG sites), mid-resolution details (gene clusters), and low-resolution approximation (chromosomal regions). For a methylation profile , HWT is computed by
(4)
(5) and
(6)
(7) where and . Thus, high-frequency detail coefficients, (for levels and 3) are discarded to eliminate noise, while approximation coefficients are progressively compressed, maintaining spatial genomic integrity. Through three-level compression, contains N/2 coefficients, contains coefficients, and retains only coefficients (i.e., 12.5% of N). As a result, the utilized HWT decomposition reduces the features by 87.5% (i.e., from 450 to 56 K coefficients).
While HWT reduces dimensionality, not all wavelet coefficients are discriminative for cancer subtypes. We combined HWT with PSO to adaptively identify and retain maximally discriminative coefficients. PSO is a metaheuristic optimization technique inspired by swarm intelligence, where candidate solutions (“particles”) navigate high-dimensional search spaces. Each particle iteratively refines its position based on personal experience ( ) and swarm knowledge ( ), dynamically balancing exploration of new solutions and exploitation of known successes. This enables efficient convergence toward coefficient subsets that maximize inter-class separation between cancer subtypes. We employ PSO to identify the most informative subset of HWT coefficients. Specifically, each particle encodes a binary vector , where is the number of wavelet coefficients, where a value of 1 indicates the coefficient is selected. Each particle’s feature subset is evaluated using a support vector machine (SVM) classifier with a radial basis function (RBF) kernel trained solely on the training subset. The classification accuracy, computed as the average accuracy from three-fold cross-validation on the training data, is then used as a fitness function, whose input is element-wise multiplication of the wavelet-transformed data and , to determine each particle’s personal best solution ( ) and the swarm’s global best solution ( ). Based on these individual and swarm best solutions, the particles adjust their positions during optimization:
(8)
(9) where is the Sigmoid function, is inertia, and are learning rates, , and are random numbers. Note that denotes the particle index, denotes the index of the binary vector , and denotes the iteration number. Thus, PSO is used to optimize the features subset that maximizes cancer subtype separability. To prevent data leakage, the dataset was divided into training (80%), validation (10%), and test (10%) subsets prior to any feature selection. The PSO feature selection process operated exclusively on the training subset, with three-fold cross-validation performed within this subset. The optimal features obtained from PSO were then applied to all subsets, i.e., training, validation, and test subsets.
Heterogeneous graph representation
To capture the complex interactions underlying cancer biology, we aim to build a graph that represents genes, methylation sites, and pathways as nodes, with edges encoding their biological relationships (e.g., regulation, membership, interaction). That is, each node has its own type and attributes as given below.
-
-
Genes: This node represent genes, which are functional units of DNA that encode proteins or regulatory RNAs. The node attributes are expression levels (RNA-seq), mutation status, and CNV status. For example, the gene “TP53” has the attributes, expression: 12.5 TPM (high in normal tissue, low in tumor), mutation: 1 (mutated in 50% of cancers), and CNV: 0.
-
-
Methylation sites: This node represents CpG sites, which are regions of DNA where a cytosine nucleotide is followed by a guanine nucleotide. Methylation at these sites regulates gene expression. The node attributes are beta-values, genomic coordinates (chromosome, start, end), and association with CpG islands/shores. For example: the CpG site “cg03607383” has the features, beta-value: 0.9 (hypermethylated), and location: promoter of BRCA1 (chr17:43,044,294).
-
-
Pathways: This node represents biological pathways, which are collections of genes that work together to perform specific functions (e.g., cell cycle regulation). The node attributes are pathway size (number of genes), functional category (e.g., “Metabolism,” “Immune Response”), and activity score (computed via AUCell). For example: the pathway “KEGG”, hsa04110 (Cell Cycle), genes: “CDK1”, “CCND1”, “TP53”, and activity score: 2.3 (upregulated in tumors).
The edges of the proposed heterogeneous represent biological relationships between nodes, with each edge type encoding a specific biological interaction. The description of these edges is given below.
-
-
Gene-gene: It represents physical or functional interactions between genes (e.g., protein-protein interactions, PPI, and co-expression). For PPI, only high-confidence interactions (STRING score > ) are used. For example, “TP53” “MDM2” (“MDM2” ubiquitinates “TP53” for degradation). For co-expression, only pearson correlation > (or for negative correlation) is used. For example, the genes“EGFR” and “KRAS” are co-expressed in lung adenocarcinoma.
-
-
Gene-pathway: It represents the membership of genes in biological pathways. For example, the gene “TP53” is a key gene in the pathway “hsa04115 (p53 signaling)”.
-
-
Methylation-gene: it represents the regulatory effect of methylation on gene expression. For example, hypermethylation of the CpG site “cg03607383” silences “BRCA1” expression.
-
-
Methylation-pathway: it represents the indirect effect of methylation on pathways via target genes. That is, if a CpG site regulates a gene in a pathway, connect the site to that pathway. For example, hypermethylation of the CpG site “cg03607383” silences the gene “BRCA1”, disrupting the “DNA repair” pathway.
Thus, the heterogeneous graph is defined by
(10) where
(11) and
(12)
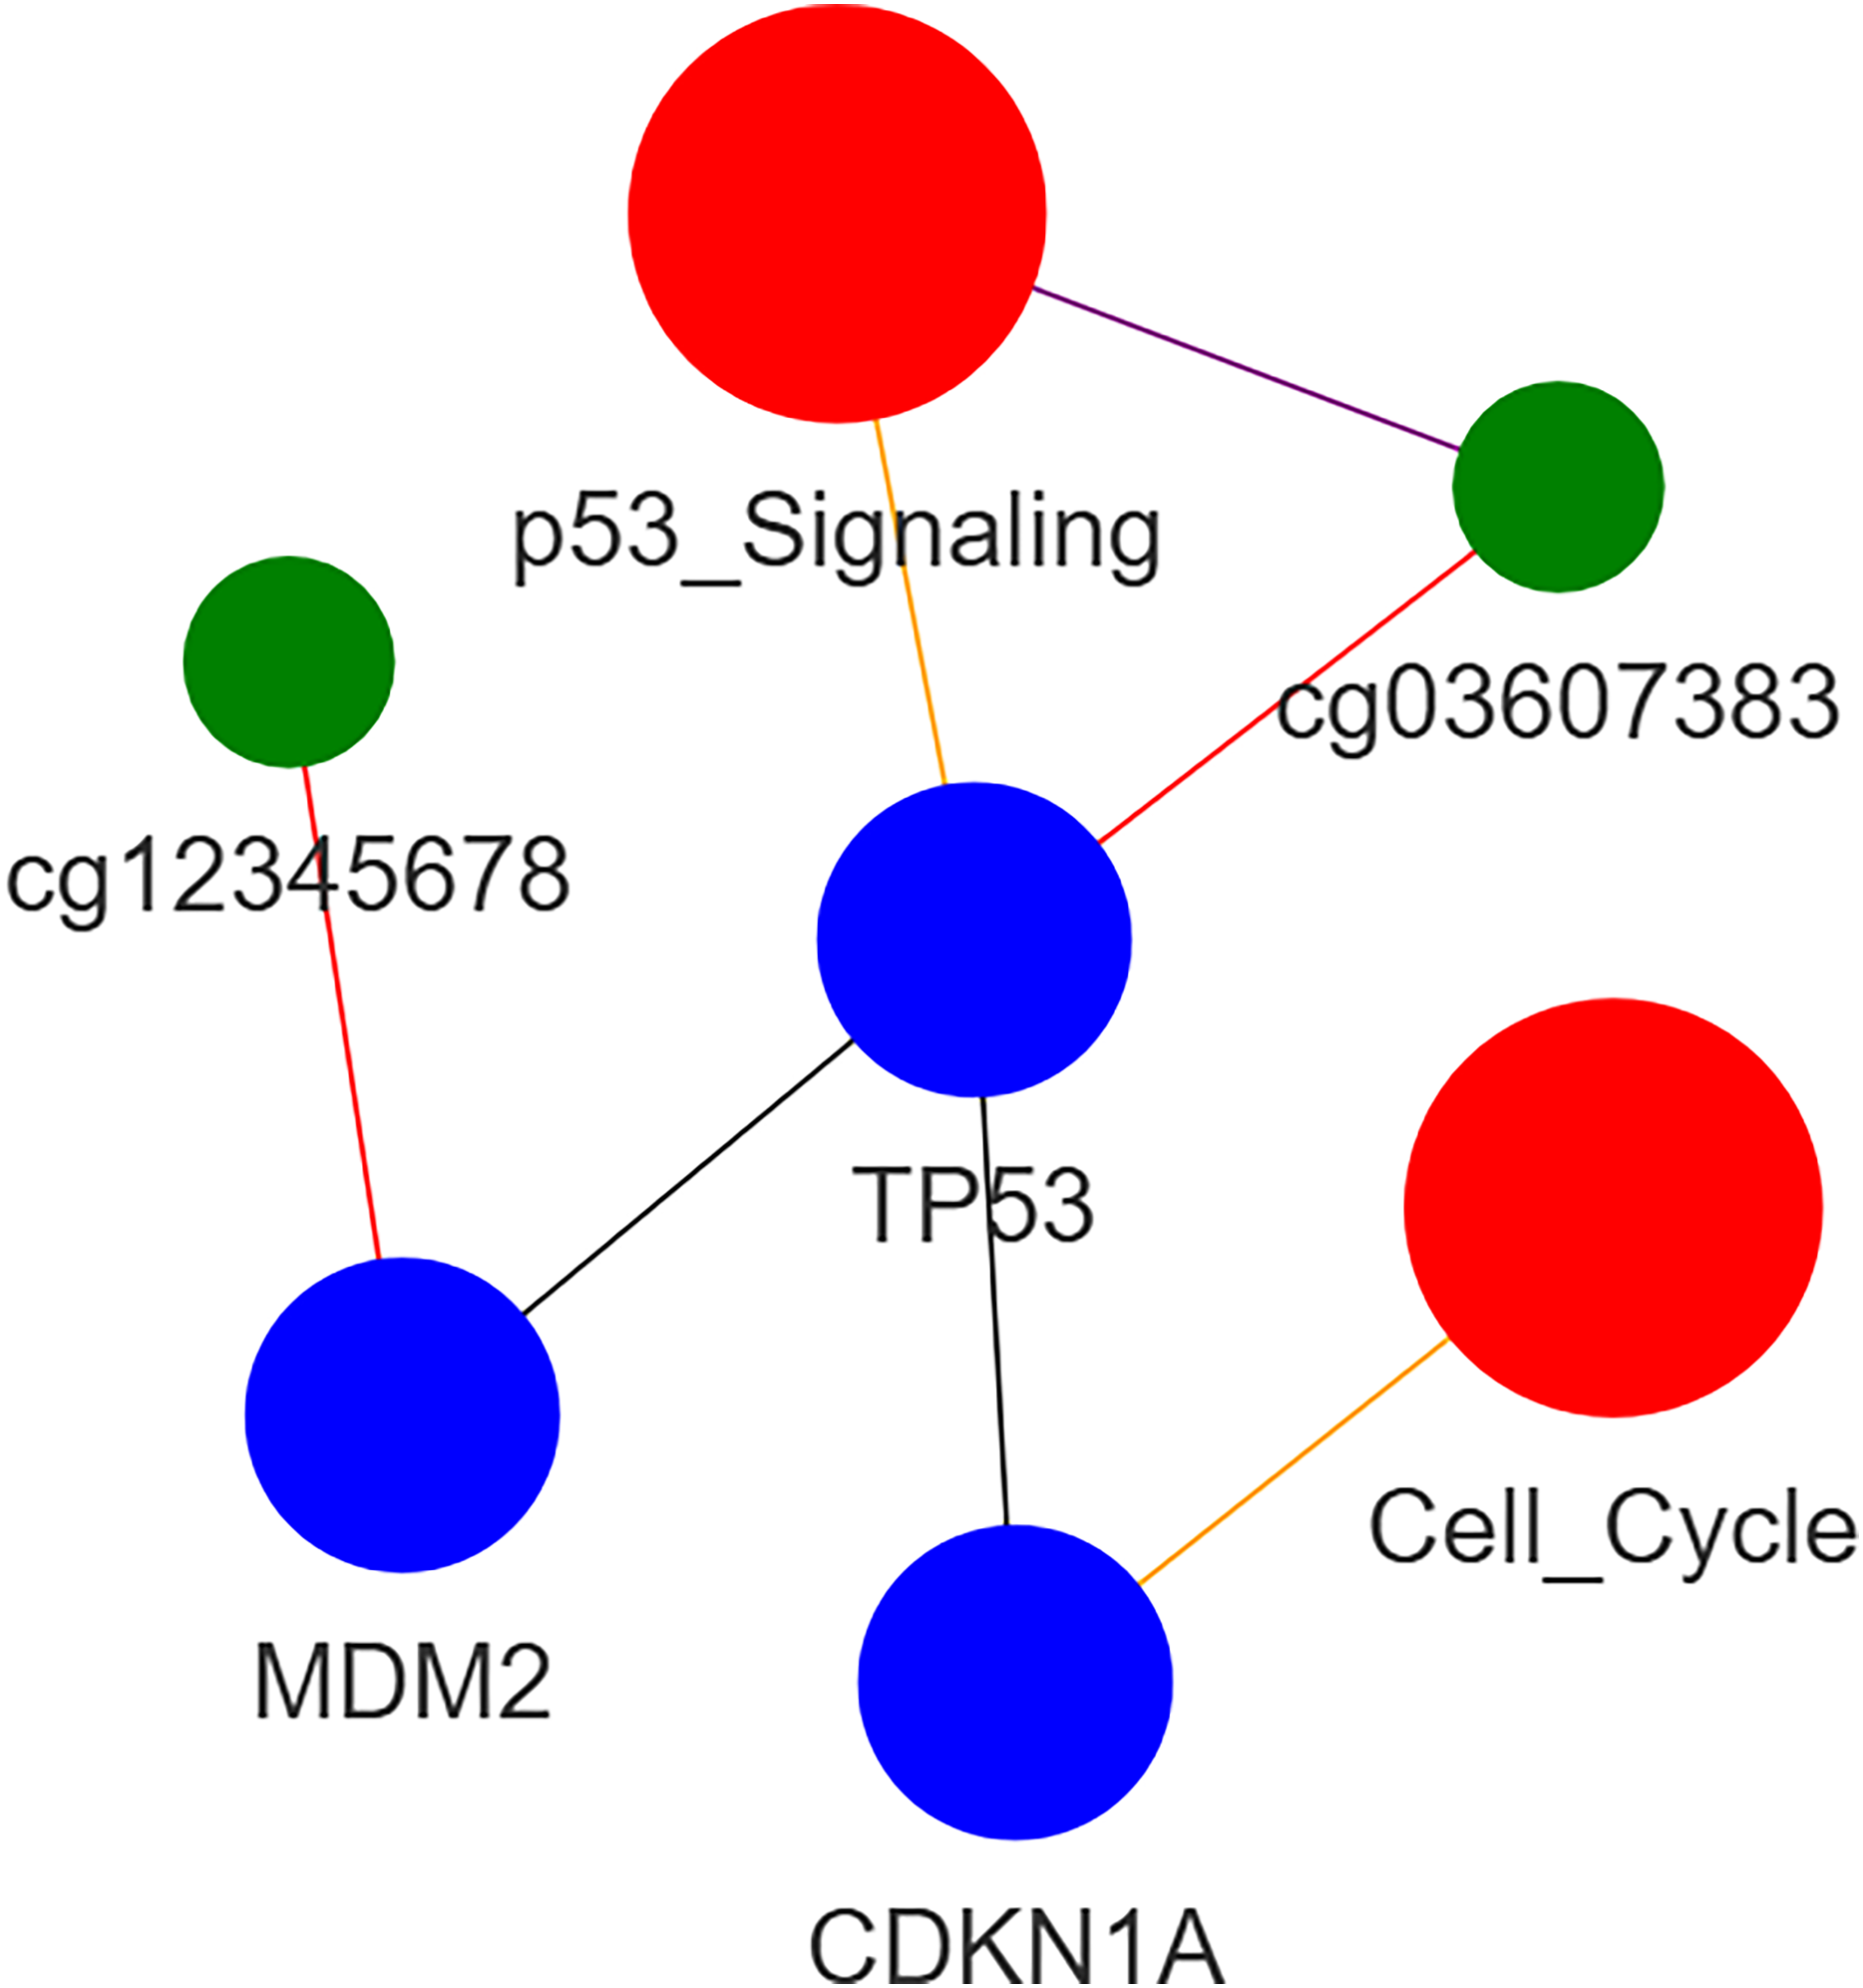
An example of heterogeneous subgraph is illustated in Fig. 2. Note that the blue, green, and red circles are corresponding to gene, methylation site, and pathway, respectively.
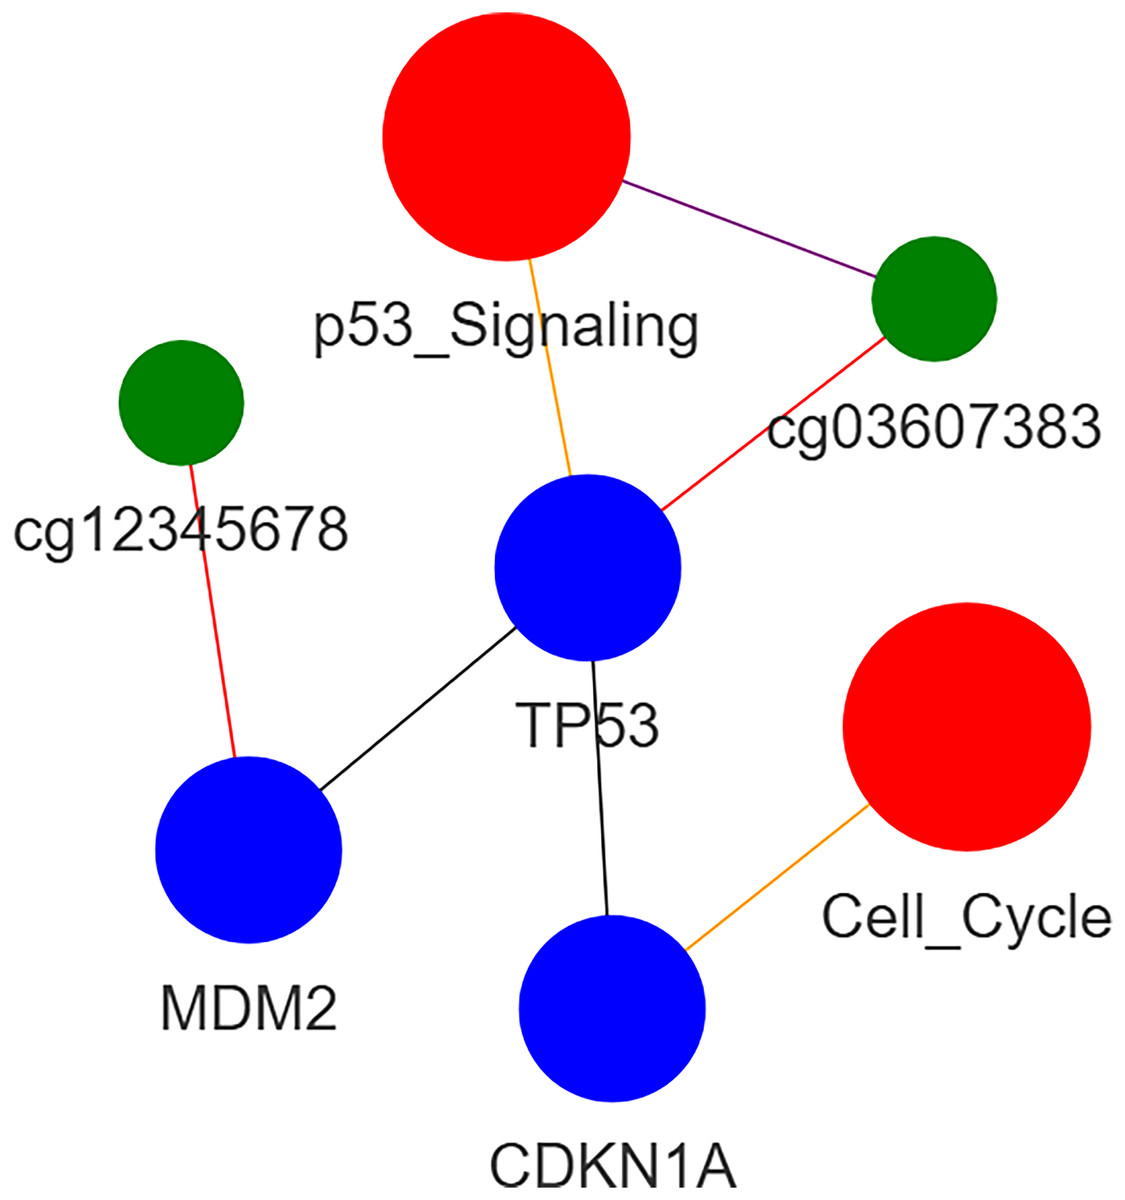
Figure 2: Heterogeneous graph.
Graph neural network (GNN)
The GNN operates on the heterogeneous graph to capture local interactions between nodes, such as gene-gene interactions, methylation-gene regulation, and gene-pathway memberships. Rational graph convolutional network (RGCN) is an extension of the standard graph convolutional network (GCN) that handles heterogeneous graphs by using separate weight matrices for each edge type. This makes it ideal for modeling multi-omic data, where nodes and edges represent different biological entities and relationships. The core idea of RGCN is to aggregate information from neighbors while considering the type of relationship between nodes. For node and edge type , the message-passing rule is:
where is embedding of node at layer , are neighbors of via edge type , are learnable weights for edge type , and is activation function.
RGCN in the proposed model consists of two layers to balance model complexity and computational efficiency. The raw node features are fed into the first layer to aggregate information from neighbors of each edge type and update node embeddings using the message-passing rule. The output of the first layer involves intermediate node embeddings capturing local interactions, which are fed into the second layer to perform another round of aggregation and updating. The output of the second layer is final node embeddings capturing higher-order interactions (e.g., pathways influenced by multiple genes).
In RGCN, each edge type has its own weight matrix, allowing the model to learn relationship-specific patterns. RGCN include self-loop connections to preserve node-specific information. The benefits of RGCN come from its seamless handling multiple node and edge types, its efficient processing of large graphs with sparse connections, and its ability to learn relationship-specific embeddings, making it easier to interpret results.
Transformer for context-aware feature selection
The transformer encoder processes the preprocessed data to capture global dependencies using pathway-guided attention. Gene expression and methylation sites are jointly input to the transformer to model their direct regulatory relationships (e.g., promoter methylation suppressing gene expression), enabling self-attention to capture cross-modal dependencies critical for cancer biology. The input is formed by concatenating the preprocessed genes and methylation sites metrices into a single matrix:
where N is number of samples, is number of selected gene features, and is number of selected methylation features. The preprocessed data X is projected into a shared feature space using learned embeddings:
(13) where is learnable embedding matrix, is learnable bias term, and D is dimension of the transformer embeddings. The architecture of the transformer encoder consists of the following components:
Positional encoding: Since transformers are permutation-invariant, positional encodings are added to the input embeddings to preserve the order of features: (14) where is a positional encoding matrix. Here, tokens are ordered by genomic coordinates, grouped by chromosome and sorted by ascending position, with genes and methylation sites interleaved to preserve spatial regulatory relationships. Physically proximate elements become consecutive tokens, receiving similar sinusoidal positional encodings that model cis-regulatory interactions.
Self-attention mechanism: This mechanism computes attention scores between all pairs of features, allowing the model to focus on the most relevant features for each prediction. The input embeddings are projected into query (Q), key (K), and value (V) matrices: where are learnable weight matrices. The attention scores are computed by where is dimension of the key vectors and used for scaling, and normalizes the scores to sum to 1.
Pathway-guided masking: To ensure biological relevance, a binary mask M is applied to the attention matrix as where if features and are biologically related (e.g., genes in the same pathway), and 0 otherwise. This mask is computed from RCGN pathway-informed embeddings: (15) where and are RCGN embeddings corresponding to positions in transformer input, and is a threshold dynamically computed per sample as the 75th percentile of all pairwise cosine similarities between RCGN embeddings in the transformer input, .
Multi-head attention The transformer uses multi-head attention to capture different types of relationships as where H is number of attention heads, , and is a learnable projection matrix. Following this, layer normalization and residual connections are used:
Feed-Forward Network (FFN) After multi-head attention, the output is passed through a position-wise feed-forward network as where and are learnable parameters. This is followed by layer normalization and residual connections to stabilize training as
In our model, the transformer encoder uses pathway-guided attention to ensure that attention is focused on biologically relevant relationships. This is achieved by restricting attention to genes and methylation sites within the same pathway and highlighting important features based on pathway membership. The RGCN and transformer modules are trained simultaneously in an end-to-end framework rather than as isolated components. This joint optimization enables dynamic interplay between local graph-based feature learning (RGCN) and global context modeling (transformer), where gradient signals from the classification loss co-adapt both modules. Specifically, the RGCN’s pathway-informed embeddings constrain the transformer’s attention mechanism via biological priors, while the transformer’s context features provide feedback to refine graph representations. This co-training strategy preserves biological consistency between local pathway structures and global feature interactions, which is critical for capturing cancer-specific dysregulation patterns. The local (RGCN) and global (transformer) features are fused for final predictions,
where are node embeddings from the RGCN and are context-aware embeddings from the transformer.
Classification head
The classification head is the final component of the proposed model, which is responsible for predicting cancer subtypes based on the fused representation of local (RGCN) and global (transformer) features. It consists of a multi-layer perceptron (MLP) that maps the fused features to the predicted cancer subtypes.
The cross-entropy loss is used for training, which is given by
where is the true label and is the predicted probability for the th sample.
Finally, it should be pointed out that the dual use of pathway data, in graph construction and pathway-guided attention, is not redundant, but a deliberate design to enforce biological plausibility at multiple levels. In graph construction, pathways define the topology of the heterogeneous graph. They establish hard constraints (e.g., gene-pathway memberships) that ensure the RGCN learns biologically grounded local interactions. Without this, the graph could capture spurious correlations. In pathway-guided attention, they act as a soft regularizer for global attention. While the graph uses pathways to define edges, the attention mechanism uses them to dynamically weight gene-gene interactions in the Transformer. Crucially, it masks non-pathway-related interactions (e.g., between genes in unrelated pathways) that might otherwise dominate due to statistical biases.
The pseudo-code for the proposed hybrid graph-transformer model for cancer classification is given in Algorithm 1.
| Input: Gene expression matrix , Methylation beta-values , |
| Pathway database P = pathway: gene_list, and sample labels |
| Output: Cancer subtype predictions and Interpretable feature importance scores |
| 1. Data Preprocessing: |
| a. Gene Expression: compute Gzscore. |
| b. Methylation: compute Mvalues. |
| c. Pathway Processing: compute and |
| 2. Heterogeneous Graph Construction: |
| for each sample i do: |
| a. Create nodes: |
| b. Create edges: using |
| c. Build graph where: |
| end for |
| 3. Model Architecture: |
| A. Transformer Module: |
| procedure PathwayAwareTransformer (X, M): |
| return htransformer |
| end procedure |
| B. GNN Module: |
| procedure RCGN (Graph G): |
| for each layer l in do: |
| for each node type do: |
| end for |
| end for |
| return hRCGN |
| end procedure |
| C. Classification Head: |
| procedure Classifier (hRGCN, htransformer): |
| return |
| end procedure |
Performance evaluation
The performance of the proposed method is evaluated on two classification tasks. The first task involves cancer classification using the data of 6,356 samples with 23 cancer types. The second task involves breast cancer subtypes classification, i.e., luminal A, luminal B, HER2-enriched, basal-, and normal-like (Parker et al., 2009). The training dataset consists of a total of 974 samples of breast cancer. A breast cancer cohort of 122 samples collected from CPTAC is used as a independent test dataset. For each class, the classification outcomes are categorized into true positive (TP) indicating samples that correctly diagnosed as belonging to this class, true negative (TN) indicating samples that correctly diagnosed as not belonging to this class, false positive (FP) indicating samples that wrongly diagnosed as belonging to this class, and false negative (FN) indicating samples that wrongly diagnosed as not belonging to this class. The evaluation is then carried out for each class independently using the performance metrics,
(16)
(17)
(18)
(19)
(20)
Afterwards, the averages of these metrics are calculated as indicators for the overall prediction performance.
Results
In this section, the results of the conducted experiments are presented. The parameters used in the experiments were learning rate of , batch size of 64, and number of epochs of 100. All the experiments are executed on Intel Core i7-1260P CPU processor with a 64-bit Windows 11 operating system and 8.00-GB RAM using Python.
Classification of cancer types
First, the performance of the proposed model is evaluated on cancer classification task with respect to several baselines in the literature. These baselines are given below.
-
-
MOGTN (Kaczmarek et al., 2021): This method integrates miRNA and mRNA expression data into a biological interaction graph, where nodes represent molecular entities (miRNAs/mRNAs) and edges encode regulatory relationships derived from TargetScan databases.
-
-
MOGONET (Wang et al., 2021): This method utilizes GCN for omics-specific learning and unifies it with multi-omics integrative classification at the label space.
-
-
DeePathNet (Cai et al., 2024): A transformer-based explainable deep learning model integrating cancer-specific pathway information into multi-omic data analysis.
-
-
MOGNN (Li & Nabavi, 2024): An end-to-end multi-omics GNN framework utilizing multi-omics data in the form of heterogeneous multi-layer graphs, which combine both inter-omics and intra-omic connections from established biological knowledge. This model incorporates learned graph features and global genome features for accurate classification.
For fair comparison, all models were trained and evaluated on the dataset of 6356 TCGA samples across 23 cancer types, with strictly matched data partitioning: 80% (5,085 samples) for training, 10% (635 samples) for validation, and 10% (636 samples) for testing. However, modality inputs were adapted to each model’s capabilities as shown in Table 1, with our framework uniquely leveraging the complete multimodal feature set (gene expressions, methylation sites, and pathway activities). Stratified sampling preserved class distributions across splits.
| Model | Modality inputs |
|---|---|
| MOGTN | • mRNA expression |
| • miRNA expression | |
| • Regulatory edges(collected from TargetScan) | |
| MOGONET | • mRNA expression |
| • Methylation (region-level beta-values) | |
| • miRNA expression | |
| DeePathNet | • mRNA expression (RNA-seq) |
| • mutations | |
| • CNV | |
| • Static pathway memberships | |
| MOGTN | • mRNA expression |
| • Methylation (region-level beta-values) | |
| • miRNA expression | |
| • CNV | |
| Our Model | Gene Expression: |
| -RNA-seq quantification | |
| -mutations | |
| -Copy number variations (CNV) | |
| Methylation Sites: | |
| -Beta-values | |
| -Genomic coordinates (chr, start, end) | |
| -CpG island/shores annotation | |
| Pathway Activities: | |
| -Gene count | |
| -Functional category | |
| -Sample-specific activity score |
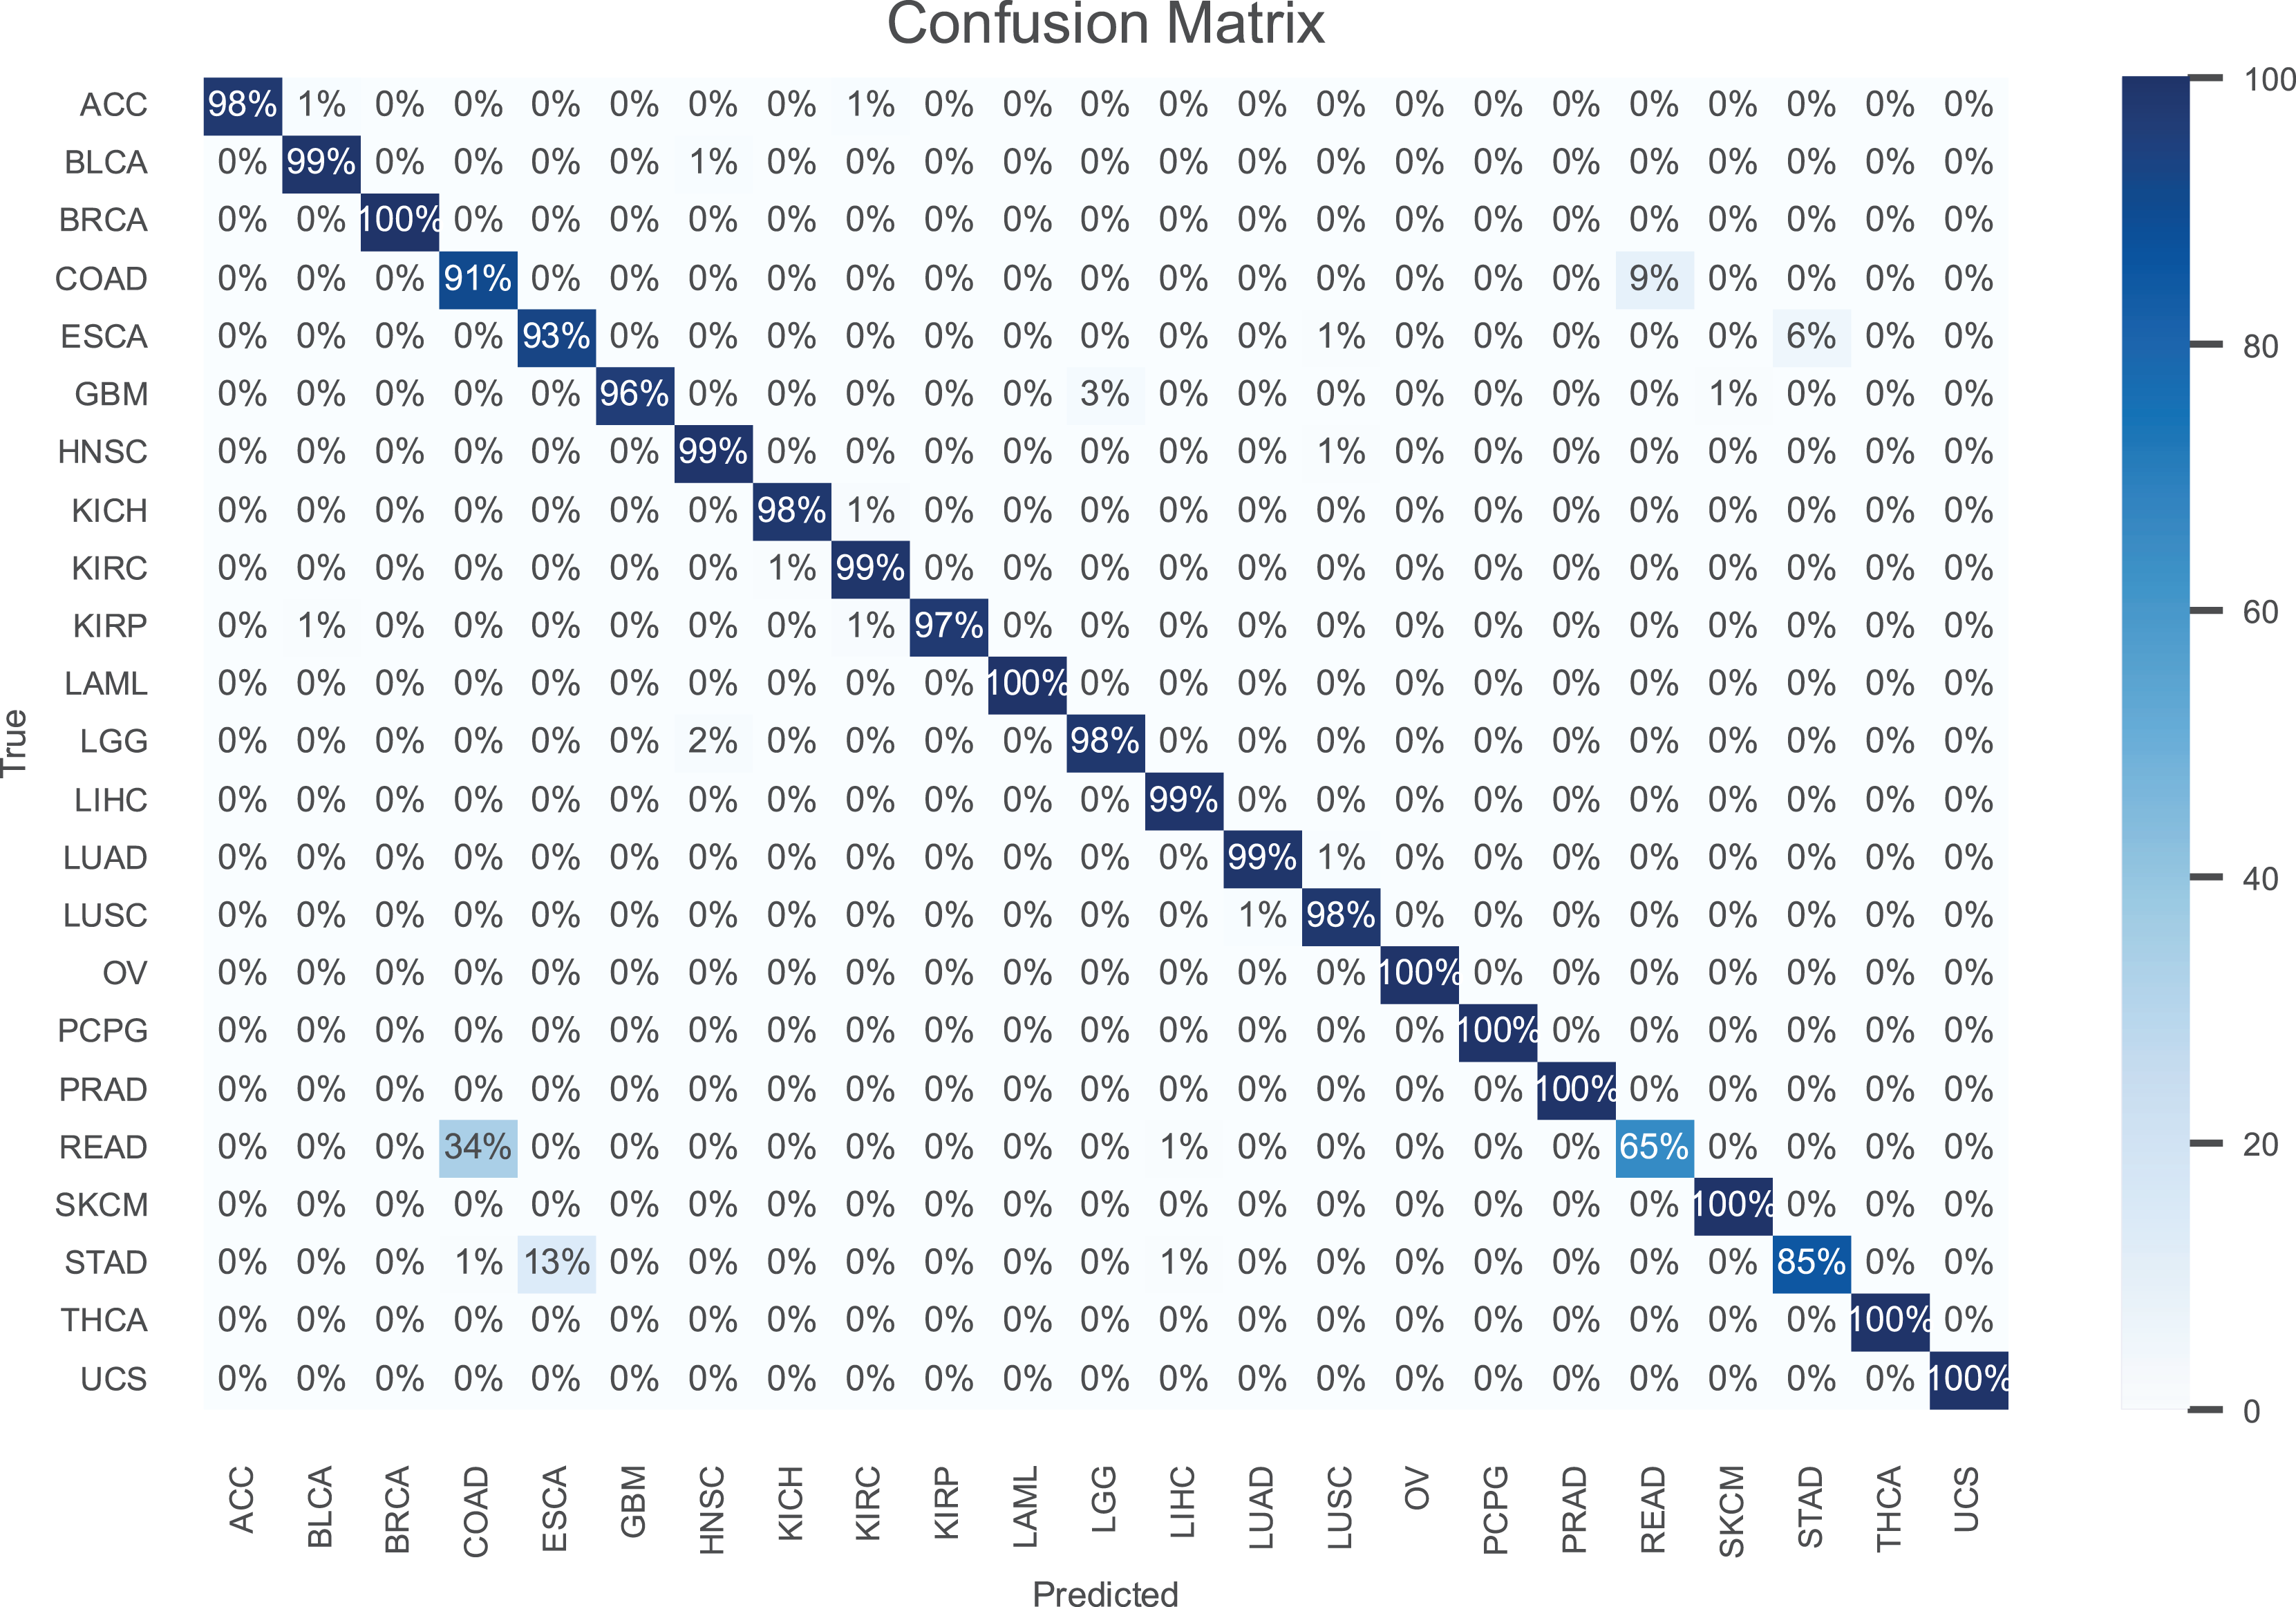
The results are presented in Table 2, demonstrating that our model consistently outperforms the others in terms of all performance metrics. Further, the confusion matrix for our model is shown in Fig. 3 to illustrate the performance for each cancer type. As can be seen, our model achieves an accuracy higher than 97% for most cancer types.
| Method | ACC | PPV | SPC | SEN | F1-score |
|---|---|---|---|---|---|
| MOGTN | 93.12 | 90.46 | 91.52 | 91.75 | 91.10 |
| MOGONET | 92.40 | 90.14 | 91.24 | 91.31 | 90.72 |
| DeePathNet | 96.03 | 93.47 | 94.11 | 94.73 | 94.10 |
| MOGNN | 95.48 | 92.91 | 93.85 | 94.0 | 93.45 |
| Proposed | 96.52 | 94.06 | 94.93 | 95.13 | 94.59 |
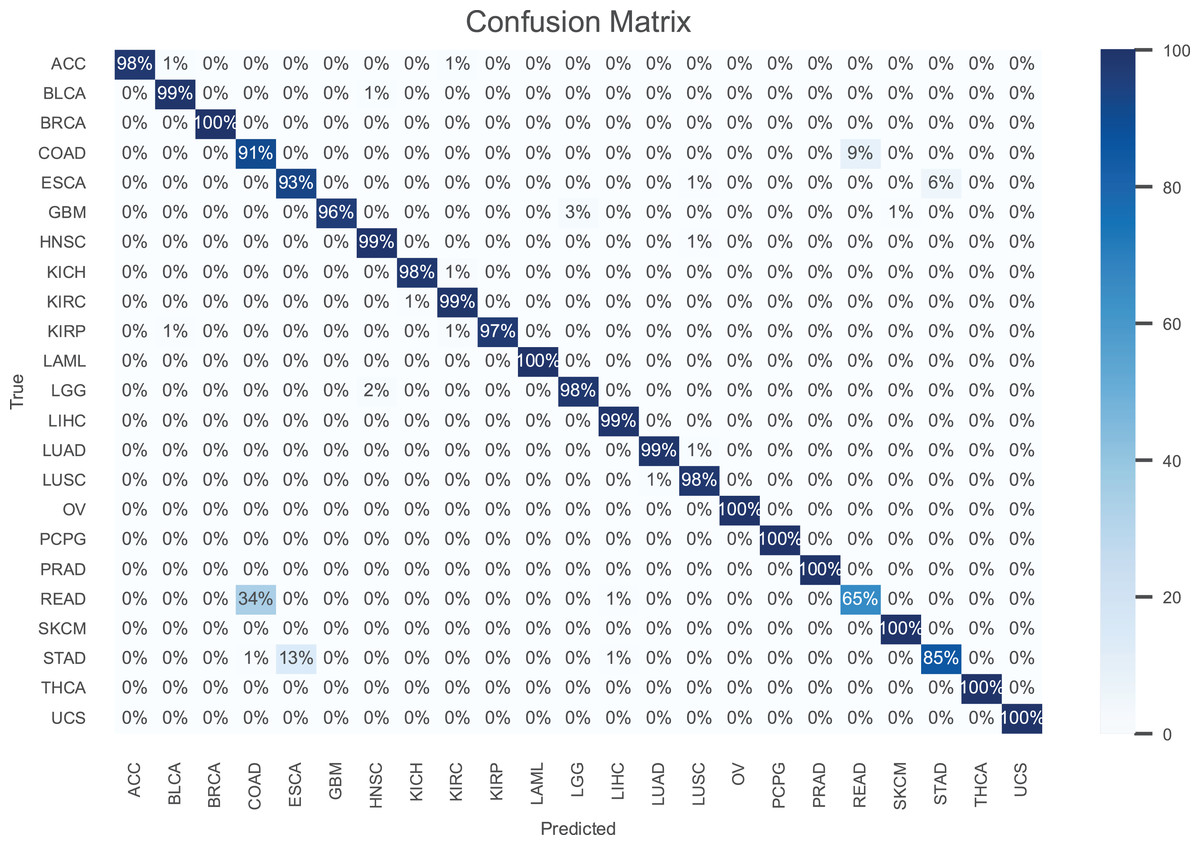
Figure 3: The confusion matrix for the proposed model.
Notably, breast invasive carcinoma (BRCA), acute myeloid leukemia (LAML), ovarian serous cystadenocarcinoma (OV), pheochromocytoma paraganglioma (PCPG), prostate adenocarcinoma (PRAD), skin cutaneous melanoma (SKCM), thyroid carcinoma (THCA), and uterine carcinsarcoma (UCS) are the most accurately classified cancer types. In contrast, rectum adenocarcinoma (READ) is the cancer type with the poorest accuracy, where 34% of the samples are misclassified as colon adenocarcinoma (COAD). This is owing to the fact that the colon and rectum are adjacent tissue types sharing highly similar attributes, where they often grouped together and are treated with similar chemotherapeutic regimens (The Cancer Genome Atlas Network, 2012). Also, the accuracy is stomach adenocarcinomas (STAD) is poor, where 13% of its samples misclassified as esophageal carcinoma (ESCA). This can be attributed to the similar histopathology and the anatomical proximity of STAD and ESCA (Akiyama et al., 1997).
We conducted a comprehensive ablation study to evaluate the contributions of each component in our hybrid graph-transformer framework, testing nine distinct model variants that systematically removed or altered key elements: pathway attention mechanisms, RGCN module for local interactions, transformer module for global context, gene expression data, methylation sites, pathway database, and HWT-PSO. Each variant was rigorously evaluated using standard classification metrics (Accuracy, F1-score, and AUC), a specialized BioConsistency metric (0–1 scale) quantifying alignment between model attention weights and established biological pathways, and training efficiency measured by epochs to convergence.
The results shown in Table 3 reveal critical dependencies and performance impacts across components. Removing the pathway attention mechanism caused a substantial 3.25% accuracy decline and severe 0.17 BioConsistency reduction, demonstrating its essential role in enforcing biologically plausible feature interactions. Eliminating the RGCN module resulted in the most dramatic performance degradation (8.12% accuracy drop), confirming its irreplaceable function in capturing local molecular interactions and pathway-constrained relationships. Disabling the transformer module reduced accuracy by 5.64%, highlighting its unique capacity to model global gene dependencies across tissue types. Data modality ablation showed that gene expression contributes marginally more predictive power than methylation (3.53% vs. 2.82% accuracy drop when removed), but both are necessary for comprehensive regulatory modeling. Strikingly, removing the external pathway database caused the second-largest accuracy reduction (7.04%) and most severe BioConsistency collapse (0.27 decrease), underscoring how biological knowledge grounds the entire architecture in reality. The 3.76% accuracy drop when using HWT without PSO confirms that wavelet decomposition alone preserves spatial patterns but fails to select biologically relevant features. PSO is essential for identifying discriminative wavelet coefficients that optimize cancer type separation.
| Model variant | Accuracy | F1-score | AUC | BioConsistency | Epochs to converge |
|---|---|---|---|---|---|
| Full model | 96.52% | 94.59 | 0.981 | 0.92 | 45 |
| w/o pathway attention | 93.27% (−3.25) | 91.21 (−3.38) | 0.952 (−0.029) | 0.75 (−0.17) | 52 |
| w/o RGCN module | 88.40% (−8.12) | 86.16 (−8.43) | 0.901 (−0.080) | 0.79 (−0.13) | 58 |
| w/o transformer module | 90.88% (−5.64) | 88.64 (−5.95) | 0.929 (−0.052) | 0.85 (−0.07) | 49 |
| w/o gene expression data | 92.99% (−3.53) | 90.81 (−3.78) | 0.948 (−0.033) | 0.86 (−0.06) | 48 |
| w/o methylation sites | 93.70% (−2.82) | 91.67 (−2.92) | 0.957 (−0.024) | 0.88 (−0.04) | 47 |
| w/o pathway database | 89.48% (−7.04) | 87.26 (−7.33) | 0.912 (−0.069) | 0.65 (−0.27) | 62 |
| w/o PSO (HWT only) | 92.76% (−3.76) | 90.56 (−4.03) | 0.944 (−0.037) | 0.82 (−0.10) | 68 |
Breast cancer subtypes classification
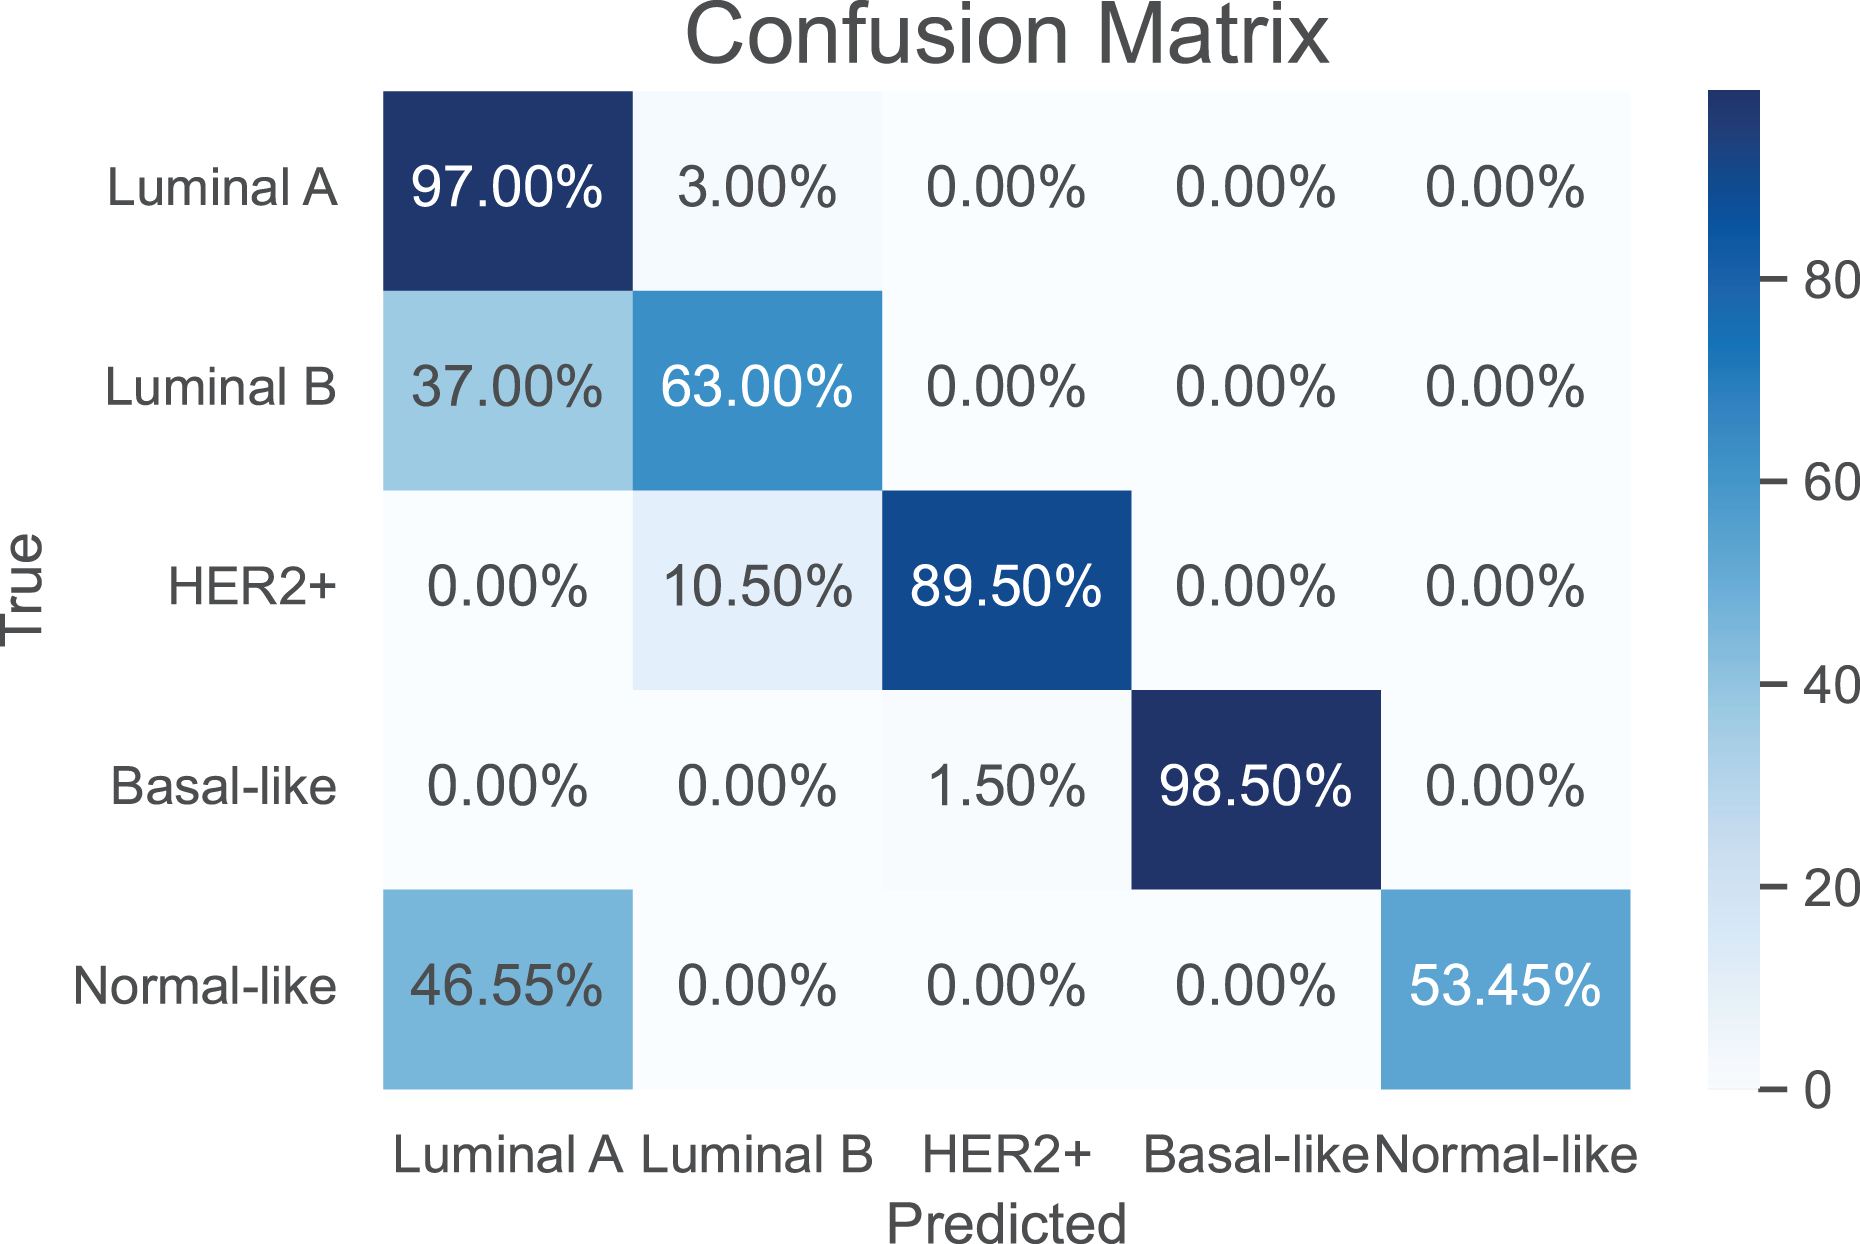
As a use case, we evaluate the performance of the proposed model against the baselines in classifying breast cancer subtypes, luminal A, luminal B, HER2-enriched, basal-, and normal-like (Parker et al., 2009). The training of the compared models was performed using a total of 974 samples of breast cancer. A breast cancer cohort of 122 samples collected from CPTAC is used as a independent test dataset. The results are shown in Table 4. It can be seen that our model achieves the best performance metrics in both training and test datasets. Further, the confusion matrix of the proposed model is shown in Fig. 4 to evaluate the performance for each subtype. Apparently, our model has its highest accuracy in the classification of the “Basal-like” subtype (98.5%). In contrast, the “Normal-like” subtype is poorly classified, where half of its samples are misclassfied as “Luminal A”. This is unsurprising due to the fact that both “Luminal A” and “Normal-like” share similar IHC markers (Cai et al., 2024); indeed, the “Normal-like” subtype is rarely used in medical sector (Raj-Kumar et al., 2019).
| Method | Training set | Test set | ||||||||
|---|---|---|---|---|---|---|---|---|---|---|
| ACC | PPV | SPC | SEN | F1-score | ACC | PPV | SPC | SEN | F1-score | |
| MOGTN | 88.69 | 81.65 | 87.70 | 88.33 | 84.86 | 87.70 | 80.75 | 86.69 | 87.38 | 83.93 |
| MOGONET | 88.41 | 79.12 | 85.20 | 87.46 | 84.07 | 87.35 | 78.18 | 84.11 | 86.40 | 82.08 |
| DeePathNet | 90.10 | 85.34 | 87.22 | 87.56 | 86.43 | 89.29 | 84.57 | 86.44 | 86.77 | 85.65 |
| MOGNN | 90.63 | 86.05 | 89.15 | 90.37 | 88.16 | 89.93 | 85.36 | 88.44 | 89.62 | 87.43 |
| Proposed | 92.77 | 88.47 | 91.42 | 92.31 | 90.34 | 92.40 | 88.14 | 91.03 | 92.01 | 90.03 |

Figure 4: The confusion matrix for the proposed model in classification of breast cancer subtypes.
Enrichment analysis
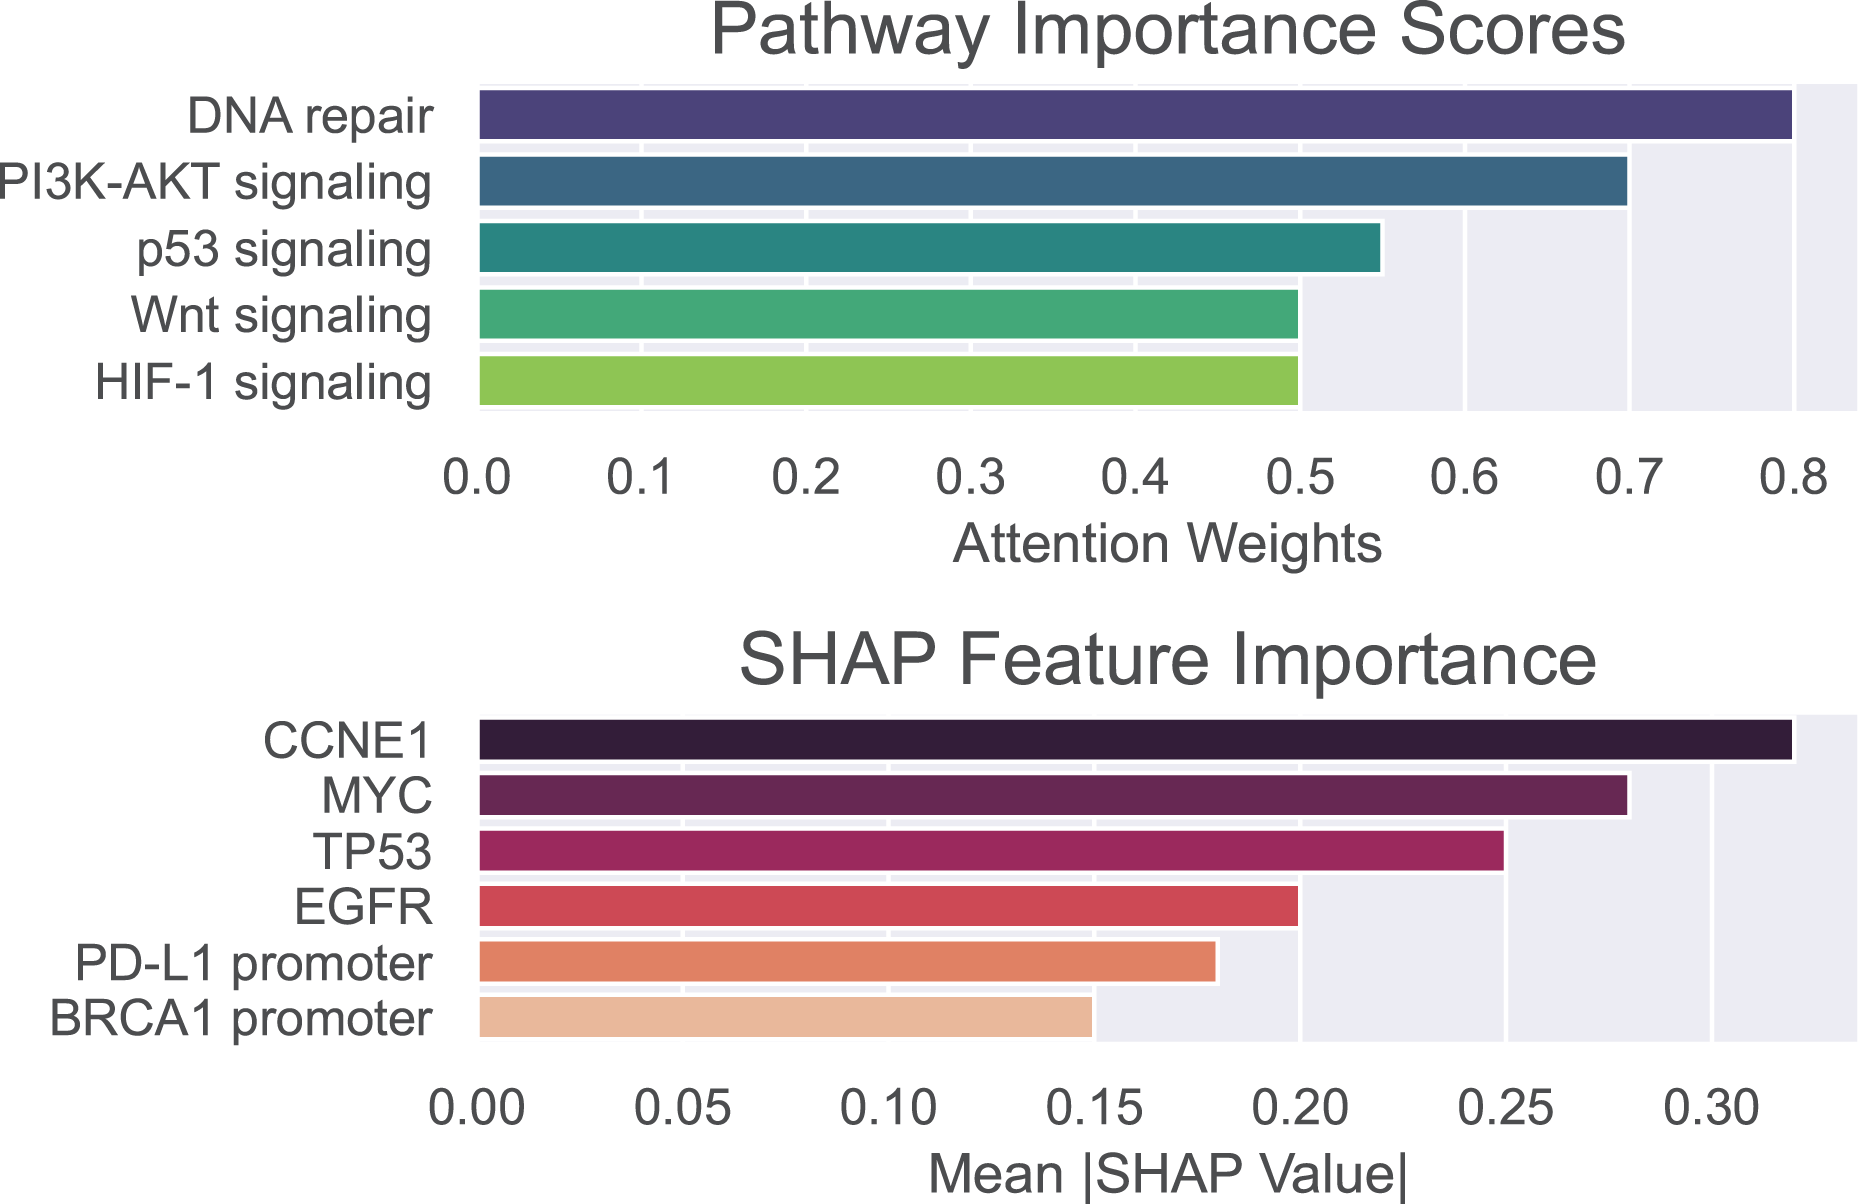
To validate the biological and clinical significance of biomarkers prioritized by our hybrid GNN-Transformer model, we perform enrichment analysis on genes, methylation sites, and pathways associated with the basal-like breast cancer subtype. Pathway importance scores and SHAP values are used to identify drivers of basal-like pathogenesis and therapeutic vulnerabilities. Pathway importance scores highlight systems-level drivers, where high-score pathway nominating therapeutic targets and low-score pathways exclude irrelevant mechanisms. SHAP attributes the prediction to all features, assigning each feature an importance value.
The outcomes of the proposed model are shown in Fig. 5, where pathway importance scores are depicted in the top panel and SHAP values are depicted in the bottom panel. For pathway importance scores, our model prioritizes pathways with known roles in basal-like cancer biology. That is, dysfunctional DNA repair, particularly defective homologous recombination due to BRCA1 mutations, plays a key role in basal-like breast cancer. PI3K-AKT, which regulates cell survival, metabolism, and growth, is often activated in basal-like breast cancer due to mutations or amplifications in the genes encoding components of this pathway. The p53 signaling pathway is critically disrupted in basal-like breast cancer, with profound implications for tumor aggressiveness, genomic instability, and therapeutic resistance. For SHAP values, our model recapitulates known basal-like drivers (e.g., TP53 and CCNE1) and nominates novel candidates (e.g., PD-L1 promoter methylation). In other words, SHAP values highlight oncogenic drivers (CCNE1 and MYC) and epigenetic regulators (e.g., BRCA1 promoter methylation) as critical basal-like features. These findings align with aggressive phenotype and therapeutic resistance of basal-like cancer. As can be seen, only positive values are shown on the x-axis, representing the overall influence of each feature rather than its directional effect. This allows for more reliable identification of consistently impactful features, which is essential in the context of biomarker discovery.
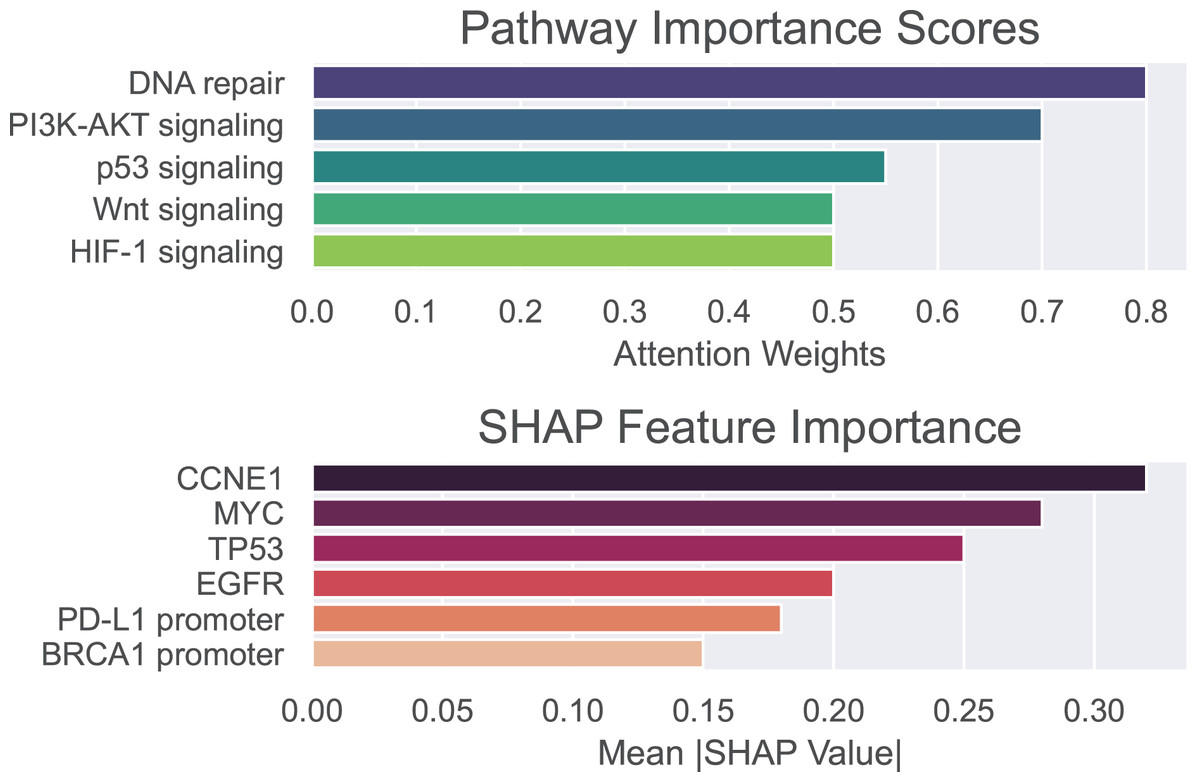
Figure 5: Pathway importance scores and SHAP features importance for basal-like breast cancer subtype.
Discussion
In this section, we shed light on the key insights derived from the results presented in ‘Results’ that obtained through a comprehensive analysis involving various performance metrics. These results demonstrate that the proposed GNN-transformer performs commendably in cancer classification and cancer subtypes classification, as it effectively processes the heterogeneous biological graphs. On the on hand, the transformer acts as a global feature selector, prioritizing genes and methylation sites in cancer-related pathways. On the other hand, the GNN acts as a relational reasoner, modeling how these features interact in the biological graph, where the clinical relevance is to prioritize biomarkers for targeted therapies (e.g., demethylating agents for hypermethylated genes). Together, they reduce dimensionality and noise via pathway-guided attention, capture both local (gene-gene) and global (cross-pathway) interactions, and provide interpretable insights into biomarkers and mechanisms.
Compared with other baselines, our model achieves better results in terms of all performance metrics, overcoming the limitations of most existing DL methods that use either GNN or transformer architectures. This improvement is also owing to the use of biologically meaningful heterogeneous graph that captures multi-omic interactions, enabling robust cancer classification and biomarker discovery. In addition, the proposed model exhibits a better generalization capability for unseen data. Finally, it successfully identifies both established biomarkers and novel candidates, validated through pathway enrichment analysis.
The proposed hybrid architecture bridges the gap between “black-box” deep learning and clinically actionable explanations, making it ideal for cancer classification. The implication of our findings is that, integrating the proposed hybrid GNN-Transformer model into real-world clinical workflows could augment the cancer diagnostic capabilities of medical practitioners. The new model could enable early and accurate detection of cancer, which can potentially improve patient outcomes and increase the survival rates. Further research can be conducted to extend the proposed approach to single-cell multi-omics to resolve intra-tumor heterogeneity. Another research direction worth to perform is integrating radiogenomic data (e.g., magnetic resonance imaging (MRI) features) for holistic cancer profiling.
Conclusion
The article has proposed a hybrid AI model that integrates multi-omic data (gene expression, methylation, pathways) to classify cancer subtypes with interpretable insights into biomarkers and mechanisms. This framework addresses limitations in existing methods by unifying multi-omic data, improving interpretability, and leveraging biological pathways. Extensive experiments have been conducted to evaluate the performance of the proposed model in classifying 23 type of cancers and in classifying breast cancer subtypes. Our model is compared to various baselines and has been shown to outperform them in terms of various performance metrics. It aligns with trends in precision oncology and could facilitate biomarker discovery for targeted therapies. The proposed hybrid architecture bridges the gap between “black-box” deep learning and clinically actionable explanations, making it ideal for cancer classification.
Despite the robust performance of our model, several limitations warrant consideration. First, the computational complexity of integrating multi-omics data with pathway-guided attention limited our ability to scale to extremely large cohorts or rare cancer subtypes with sparse data. Second, our analysis focused on bulk omics data, which obscures intra-tumor heterogeneity and cell-type-specific pathway activity. Finally, generalizability to diverse populations remains uncertain, as training data were derived from publicly available cohorts with underrepresentation of ethnic and geographic diversity. Future work can be devoted to address these gaps through efficient implementation of model, single-cell integration, and extending training to more representative cohorts.
Supplemental Information
Compressed synchronization file generated by the SyncTeX tool during the compilation of a LaTeX document main.tex.
Allows text editors and PDF viewers to link the source code to the corresponding location in the generated PDF, enabling features like clicking in the PDF to jump to the source code line and vice versa