
Real-time individual identification and recognition of Khorat snail-eating turtle Malayemys khoratensis using directional weight YOLOv8 for characteristic patterns finding
- Published
- Accepted
- Received
- Academic Editor
- Nicole Nogoy
- Subject Areas
- Algorithms and Analysis of Algorithms, Artificial Intelligence, Computer Vision, Data Mining and Machine Learning, Neural Networks
- Keywords
- Identification, Recognition, Characteristic patterns, Khorat snail-eating turtle, Malayemys khoratensis
- Copyright
- © 2025 Songpan et al.
- Licence
- This is an open access article distributed under the terms of the Creative Commons Attribution License, which permits unrestricted use, distribution, reproduction and adaptation in any medium and for any purpose provided that it is properly attributed. For attribution, the original author(s), title, publication source (PeerJ Computer Science) and either DOI or URL of the article must be cited.
- Cite this article
- 2025. Real-time individual identification and recognition of Khorat snail-eating turtle Malayemys khoratensis using directional weight YOLOv8 for characteristic patterns finding. PeerJ Computer Science 11:e3413 https://doi.org/10.7717/peerj-cs.3413
Abstract
Background
Khorat snail—eating turtle (Malayemys khoratensis) is widely recognized as a valuable bioindicator for environmental monitoring due to its long life span and high accumulative capacity. Until now, specialized techniques such as carapace marking and microchip implantation are required for thelong-term tracking of these freshwater turtles. However, these techniques are costly and frequently cause physical harm to the turtles, disrupting their natural behaviors and feeding patterns.
Methods
To overcome these circumstances, this study explores the precision of YOLOv8 for the individual identification of Khorat snail-eating turtles through the analysis and finding of characteristic patterns, including nasal stripes, position and shape of the infraorbital stripe, and plastron stripe patterns and enhancing by directional weight parameter to detect individual and recognition accurately. A directional weight parameter was introduced into the YOLOv8 based on convolutional neural network (CNN) framework to improve recognition performance. This parameter emphasizes the spatial orientation of key morphological features such as plastron stripes and facial markings, thereby guiding the model to focus on biologically stable and directionally significant traits during individual identification.
Results
Among the proposed models, the utilizing a novel approach based on plastron stripe pattern demonstrated the highest accuracy, achieving up with a precision of 0.96 ± 0.01, recall of 0.97 ± 0.01, accuracy of 0.97 ± 0.01, and a mAP@50–95 of 0.91 ± 0.01 precision in individual identification when trained on 5-fold cross-validation of data collect from 30 Khorat snail-eating turtles. The findings highlight that biometric identification based on morphological traits can be used for individual identification of Khorat snail-eating turtles, and it should be considered a choice for noninvasive long-term tracking of these turtles. Utilizing YOLOv8 techniques to identify distinctive patterns for individual recognition in the Khorat snail-eating turtle (Malayemys khoratensis) presents significant potential for enhancing the accuracy and efficiency of ecological monitoring efforts. This approach could substantially improve individual identification accuracy, thereby contributing to more effective monitoring and research in ecological studies.
Introduction
Artificial intelligence (AI) recognition algorithms, widely used in human surveillance for identity confirmation, are increasingly being applied in ecological monitoring, environmental studies, and wildlife conservation. These algorithms enable the identification of individual animals, facilitating more accurate and efficient monitoring of wildlife populations (Schneider, Taylor & Kremer, 2019; Takahiro et al., 2016). One of the most established methods in wildlife research is mark-recapture techniques, which traditionally involves physically marking animals and later recapturing them to estimate population parameters. Mark-recapture techniques are appropriate for long-term wildlife monitoring and provide advantages for wildlife population studies, conservation efforts, ecological monitoring, and assessing eco-heath, which is also essential for assessing human health (Takaya, Taguchi & Ise, 2023; Lee et al., 2014; Clutton-Brock & Sheldon, 2010).
However, AI-based recognition methods now offer non-invasive alternatives by identifying individuals through unique physical patterns, such as fur markings or facial features, captured in photographs or videos (Norouzzadeh et al., 2018; Matthew et al., 2019).
The integration of AI recognition into mark-recapture studies enhances the ability to monitor key ecological parameters, including population size, distribution, and trends. Additionally, these technologies support the assessment of animal behavior, ecological health, and exposure to hazardous chemicals or contaminants (Tabak et al., 2019). By automating the identification process, AI reduces human error, increases data processing speed, and minimizes disturbance to wildlife, thereby improving the quality and scope of ecological research and conservation management (Schneider, Taylor & Kremer, 2019).
Khorat snail-eating turtle (Malayemys khoratensis) is a freshwater turtle species highly endemic to northeastern Thailand and Lao PDR (Ihlow et al., 2016; Sumontha et al., 2016; Chaianunporn et al., 2024a, 2024b). This species primarily inhabits lentic waters in lowland areas, such as ponds or rice fields. It is threatened by consumption of turtles and its eggs, use in traditional medicine, and capture and trade for merit release in traditional and Buddhist ceremonies (Platt et al., 2022; Chaianunporn et al., 2024a). The Khorat snail-eating turtle is a carnivorous species in the food chain, primarily feeding on gastropods, earthworms, aquatic insects, crustaceans, and small fish. In addition, M. khoratensis can be used as a bioindicator species for monitoring heavy metal contamination in aquatic ecosystems as bioaccumulation of lead (Pb), cadmium (Cd), and mercury (Hg) has been detected in turtles inhabiting contaminated environments (Mokarat et al., 2022).
Individual identification of the Khorat snail-eating turtle is essential for various ecological and conservation studies, e.g., to monitor the population size, survival rates and demographic of this turtle species, to track specific turtles to assess bioaccumulation of pollutants like heavy metals or pesticides and to assess the effectiveness of conservation measures and identify threats on this turtle species. Until now, individual identification relied primarily on mark-recapture techniques. However, conventional mark-recapture techniques have specific criteria and depend on the characteristics of the target animals. The marking technique involves capturing turtles with animal traps and tagging or marking them to enable individual identification upon recapture. Furthermore, the marked animals should blend back into their population and mix randomly within the group to avoid bias in data collection and ensure accurate population estimates (Southwood & Henderson, 2000). Marking and tagging animals should be restricted to experts or veterinarians due to their implications for animal welfare (Cooke et al., 2013). Biologists have implemented less invasive methods for genetic sampling and molecular tracking in wildlife, such as collecting blood samples, to aid in monitoring and identification. These methods generally entail extracting DNA from blood to perform genetic analyses that facilitate species identification, monitor individual animals, and evaluate population patterns. For instance, DNA mini-barcodes and mitochondrial DNA (mtDNA) sequencing are commonly employed in wildlife studies to trace animals implicated in poaching and illegal trade (Chandramouli et al., 2022; Ogden & Linacre, 2015). Despite these advancements, both molecular techniques and various marking strategies like fish and amphibian tattooing, toe clipping in amphibians, reptiles, and small mammals, shell notching, microchip implantation, and ear tagging in larger mammals—still present potential hazards, including physical harm, infection, and occasional mortality (Mellado et al., 2022; Soulsbury et al., 2020; Lettink & Armstrong, 2003).
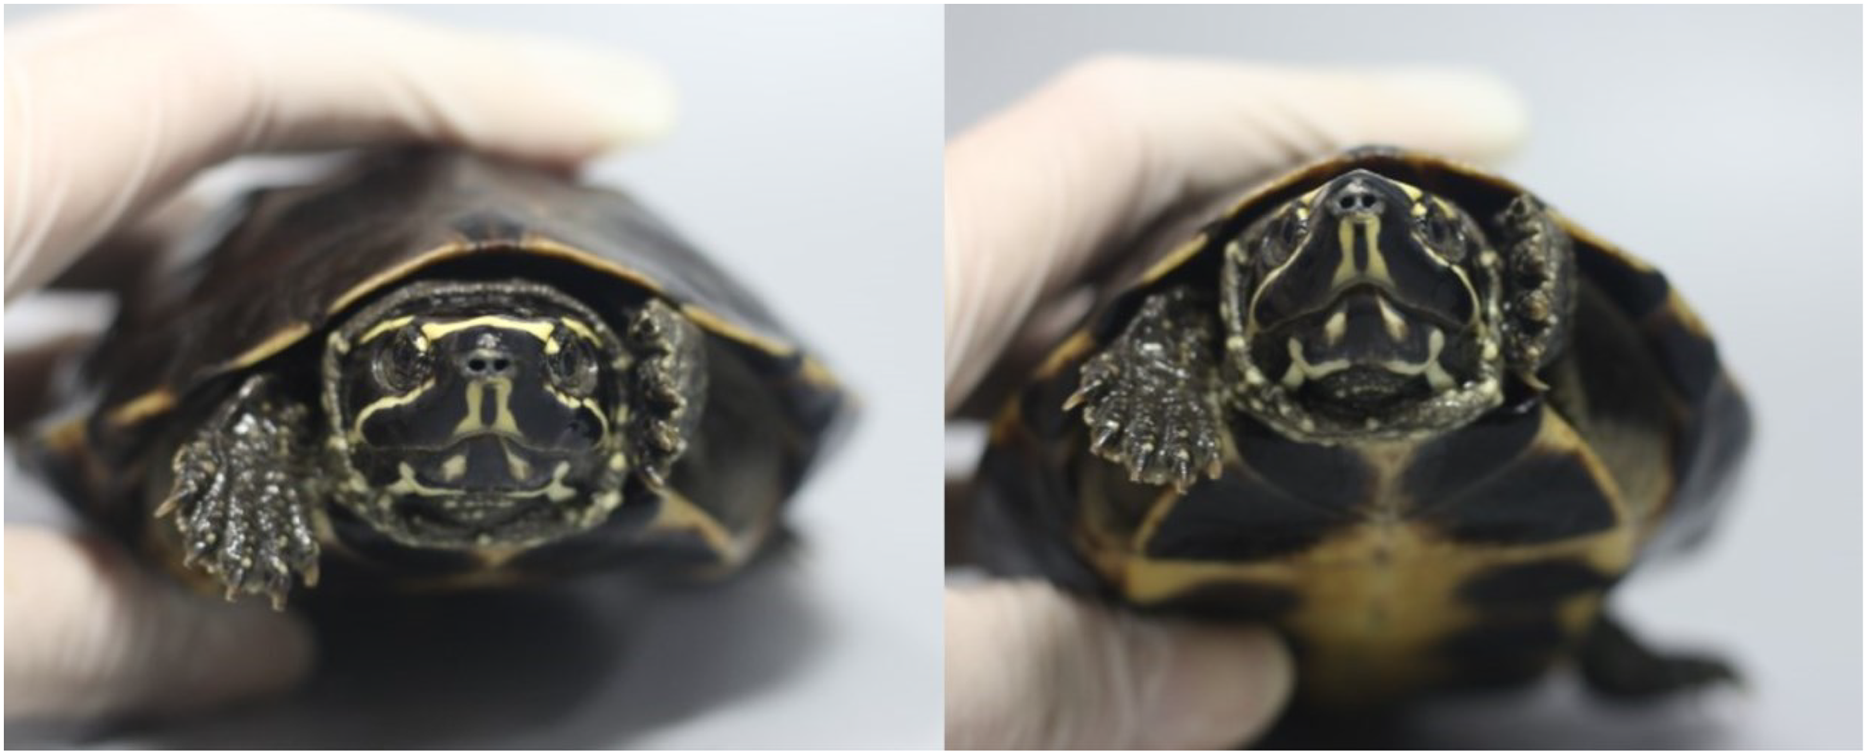
The distinctive features in species of Malayemys spp. include three parallel ridges running the carapace length, a brown shell with smooth yellow edges, and a yellowish plastron with black or brown markings on the scutes, as shown in Fig. 1; the skin under the shell is greyish-brown or black. The head is large, with yellow or white lines running along the face and under the nostrils.
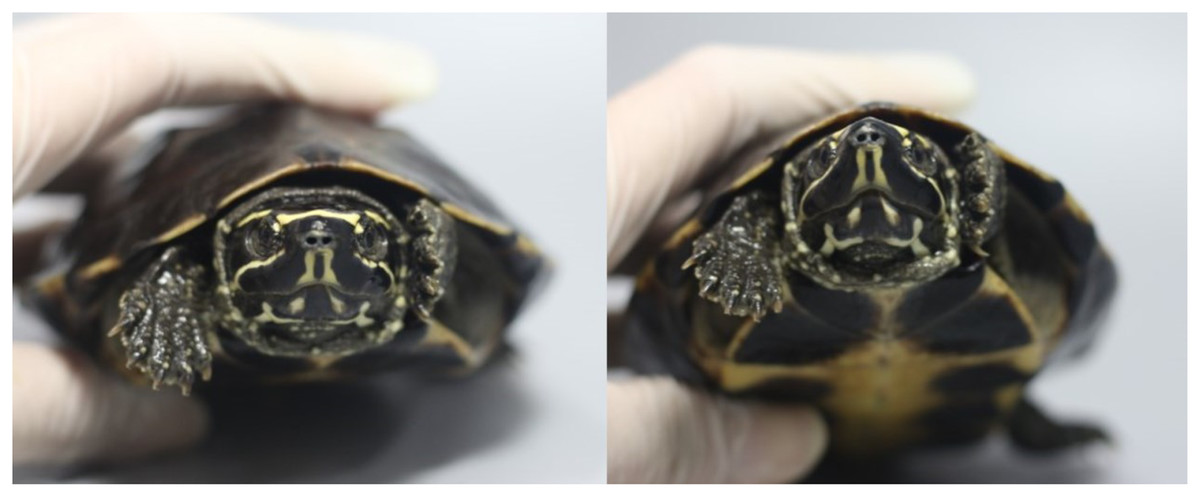
Figure 1: Characteristics of nasal stripes pattern of Khorat snail—eating turtle (M. khoratensis).
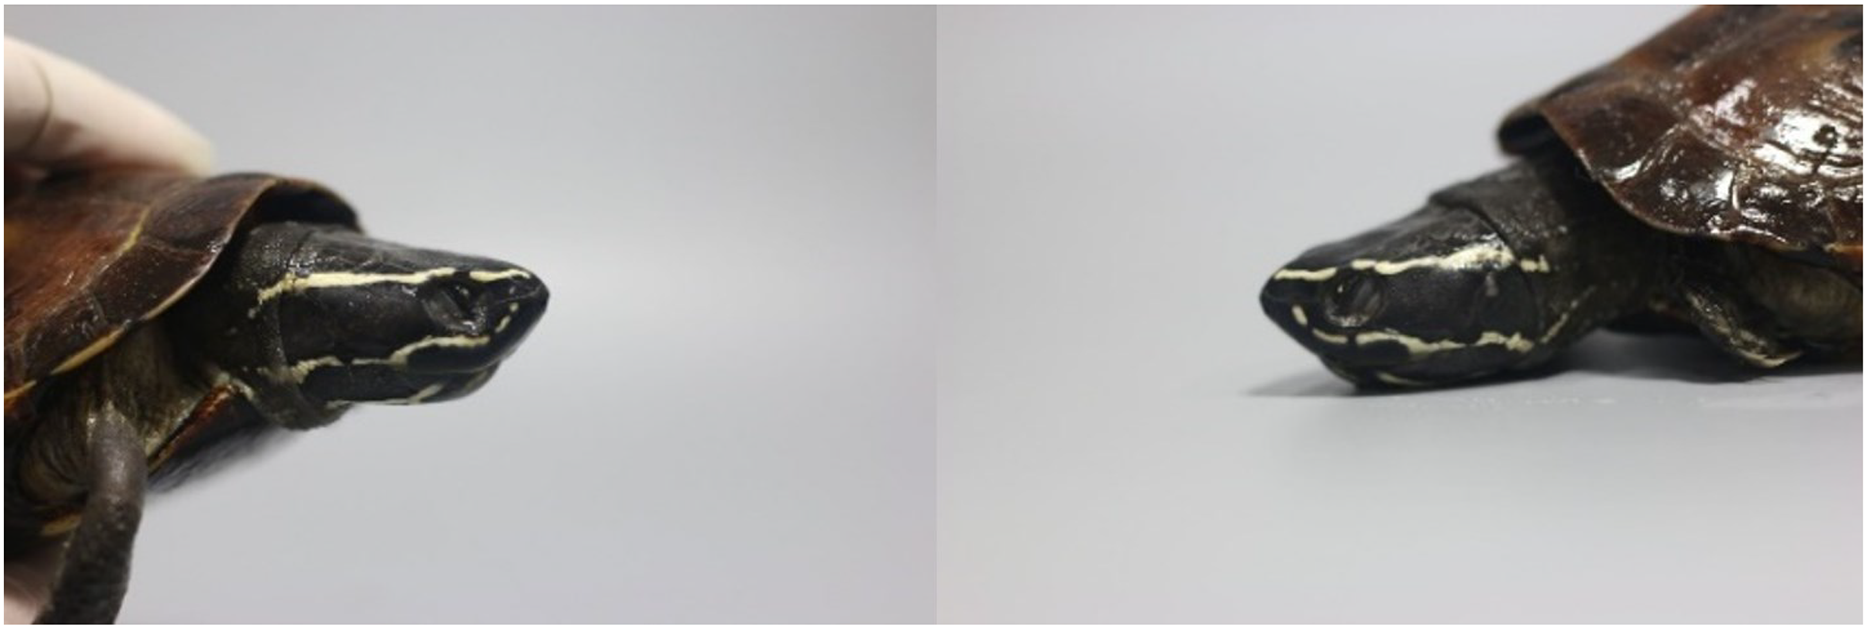
The position and shape of the infraorbital stripe (a stripe located beneath the eye, also known as a subocular stripe) are key morphological features used to identify and differentiate between individual turtles and species within the genus Malayemys. This stripe is often unique in its pattern, length, curvature, and position on each turtle, making it a reliable marker for identification as Fig. 2.
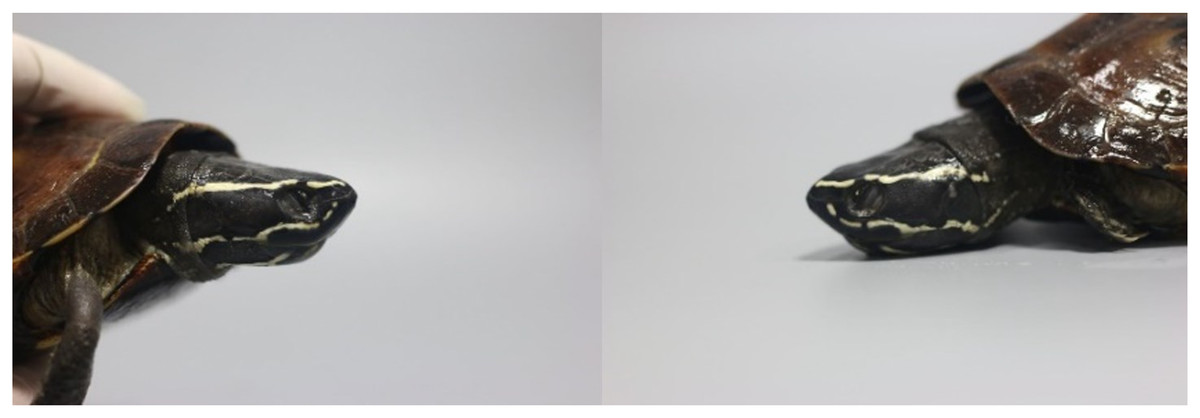
Figure 2: Characteristics of position and shape of the infraorbital stripe pattern of Khorat snail—eating turtle (M. khoratensis).
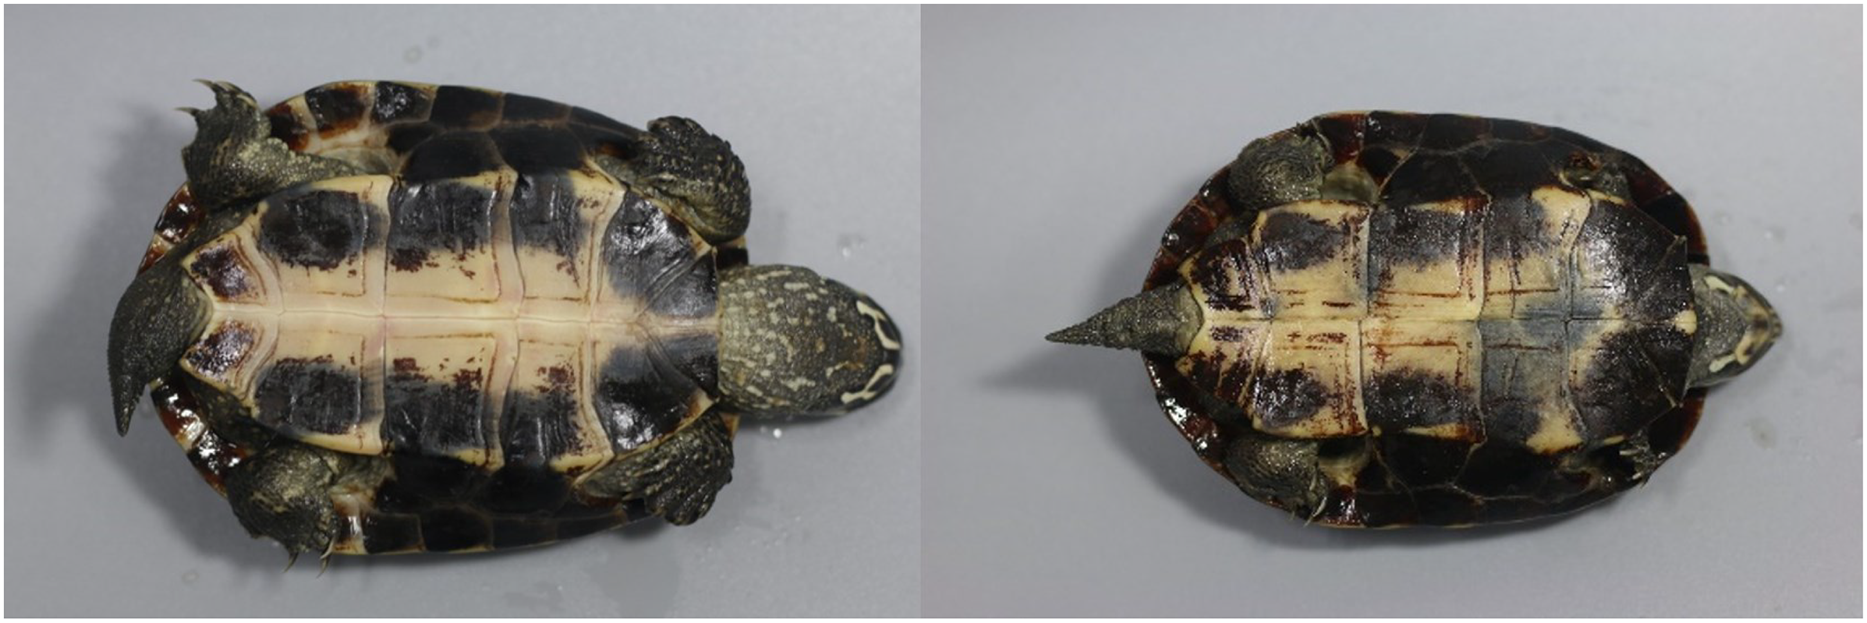
Identifying the characteristics of the plastron pattern is interesting for accurate species classification, individual turtle recognition, and effective, non-invasive monitoring in both research and conservation contexts, as shown in Fig. 3.
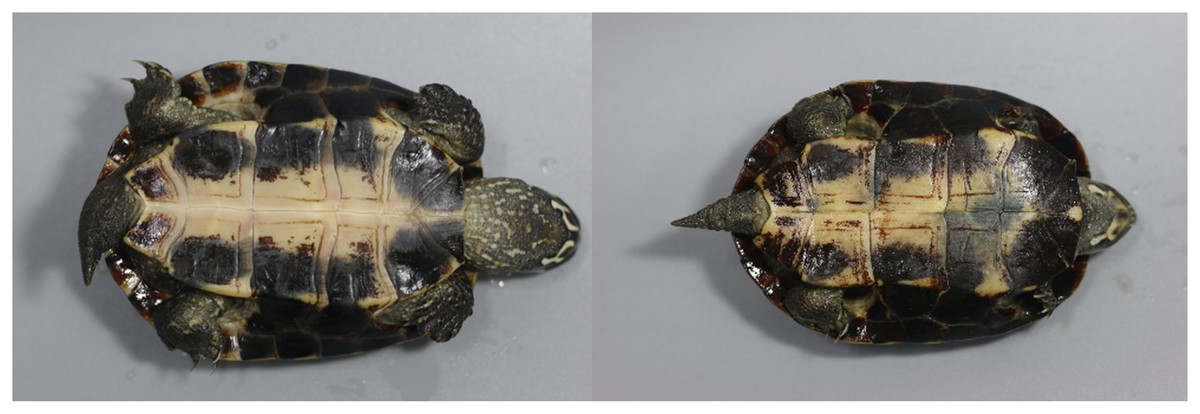
Figure 3: Characteristics of plastron pattern Khorat snail—eating turtle (M. khoratensis).
The identification of individual animals with image processing and deep learning techniques particularly to enhance the accuracy of species identification has gained significant attention in conservation and animal behavior studies over the past decade. Several biology studies have developed various techniques to address this challenge (Vijay et al., 2024; Jeff, Eibe & Varvara, 2017; André et al., 2020; Sazida et al., 2023). Meanwhile, turtle species and individual detection are challenging in developing biological classification. The contributions of the proposed methods are as follows,
-
(1)
New characteristics such as plastron patterns were found for turtle identification and recognition of the Khorat snail-eating turtle (Malayemys khoratensis). This essential animal species enhanced the understanding of identifying ecological dynamics for biodiversity preservation.
-
(2)
Improved turtle identification and recognition automation and real-time, Khorat snail-eating turtle (Malayemys khoratensis), through machine vision technology, and reduced cost for verification based on turtle blood evidence and animal injuries for DNA testing.
Motivations
The methods employed in this study were chosen to address the limitations of traditional identification techniques for the Khorat snail-eating turtle (Malayemys khoratensis) and to enhance ecological monitoring. The integration of YOLOv8 for analyzing distinct morphological patterns, such as nasal stripes, infraorbital stripes, and plastron patterns, was motivated by its superior real-time detection capabilities and high accuracy in feature extraction. By leveraging deep learning techniques, the approach ensures non-invasive, cost-effective, and precise individual recognition, avoiding the physical harm often associated with conventional tagging and DNA-based methods. This method supports improved conservation strategies and robust long-term wildlife monitoring systems. Therefore, this study focuses on developing the identity model for the Khorat snail-eating turtle (M. khoratensis) from images and explores the effectiveness of various perspectives in individual turtle identification when expert analysis is unavailable. The study employs a range of deep learning techniques for automated feature extraction, aiming at individual identification characteristics that are most informative for recognizing individual turtles.
Related works
The rapid advancements in computer vision and deep learning techniques have opened new avenues for wildlife monitoring and conservation efforts. Wildlife classification using convolutional neural network aims to develop a robust model for identifying and categorizing diverse wildlife species from images. The project utilizes a comprehensive dataset and tailored CNN architecture to achieve high accuracy and generalization capabilities. As Table 1, there are several research on the kind of turtle and techniques to solve according to the related works as follows.
| Researchers | Characteristic pattern | Techniques | Results |
|---|---|---|---|
| Steven et al. (2014) | Post-ocular scute patterns | Artificial Neural Networks (ANNs) | 95% accuracy |
| Adnan, Oyebade & Fahreddin (2016) | Shell (Carapace) Patterns, Beak Shapes, Texture and Color Variations, Size and Morphology | Back Propagation Neural Networks (BPNN) | 63.75% accuracy |
| Gray et al. (2018a) | Natural Marks and Skin Patterns, Geometric and Spatial Features | Ensemble Learning | 94.5% accuracy |
| Gray et al. (2018b) | Shape and Outline, Texture and Color, Size and Proportion, Spatial Features. | Convolutional Neural Networks (CNNs). | Detecting only sea turtles from drone imagery |
| Karun et al. (2021) | Graph representation of sea turtle scale structures. | Coherent point drift algorithm for node correspondence. | 94% accuracy. |
Animal ethics
The study was permitted (DF.1/2566) by the Department of Fisheries, Ministry of Agriculture and Cooperatives, Thailand, and the protocol was approved by the Committee on the Ethics of Animal Experiments of Khon Kaen University (permit numbers: IACUC-KKU-73/66). All animal handling was in accordance with accepted wildlife husbandry standards of American Society of Ichthyologists and Herpetologists (2004).
Ethical considerations are a critical component of ecological research, especially when involving wildlife monitoring and handling. While advances in AI and non-invasive identification techniques have reduced direct animal contact, it remains essential to implement standardized handling protocols whenever physical interaction is necessary to ensure animal welfare. These protocols should be designed to minimize stress, pain, and disturbance to the animals, preserving their natural behaviors and health. Furthermore, researchers must explicitly address strategies that reduce the impact of monitoring activities on wildlife, such as limiting the frequency and duration of human presence and using remote sensing technologies. Upholding these ethical standards not only protects the animals but also enhances the validity of ecological data by reducing bias caused by stress-induced behavioral changes. Therefore, comprehensive ethical frameworks should be integrated into all stages of wildlife research to balance scientific objectives with animal welfare.
Materials and Methods
Study area and data collection
We collected samples in Khon Kaen Province (18 individuals), Kalasin Province (nine individuals), and Si Sa Ket Province (three individuals) as described in Chaianunporn et al. (2024a). Figure 4 illustrates the location where samples were collected. For each turtle, 20 photographs were taken by two environmental scientists, focusing on specific characteristics to identify 30 turtles, including nasal stripes (face), position and shape of the infraorbital stripe (side face), and plastron patterns. Each M. khoratensis specimen was photographed and was subsequently released into suitable habitat near the collection site.
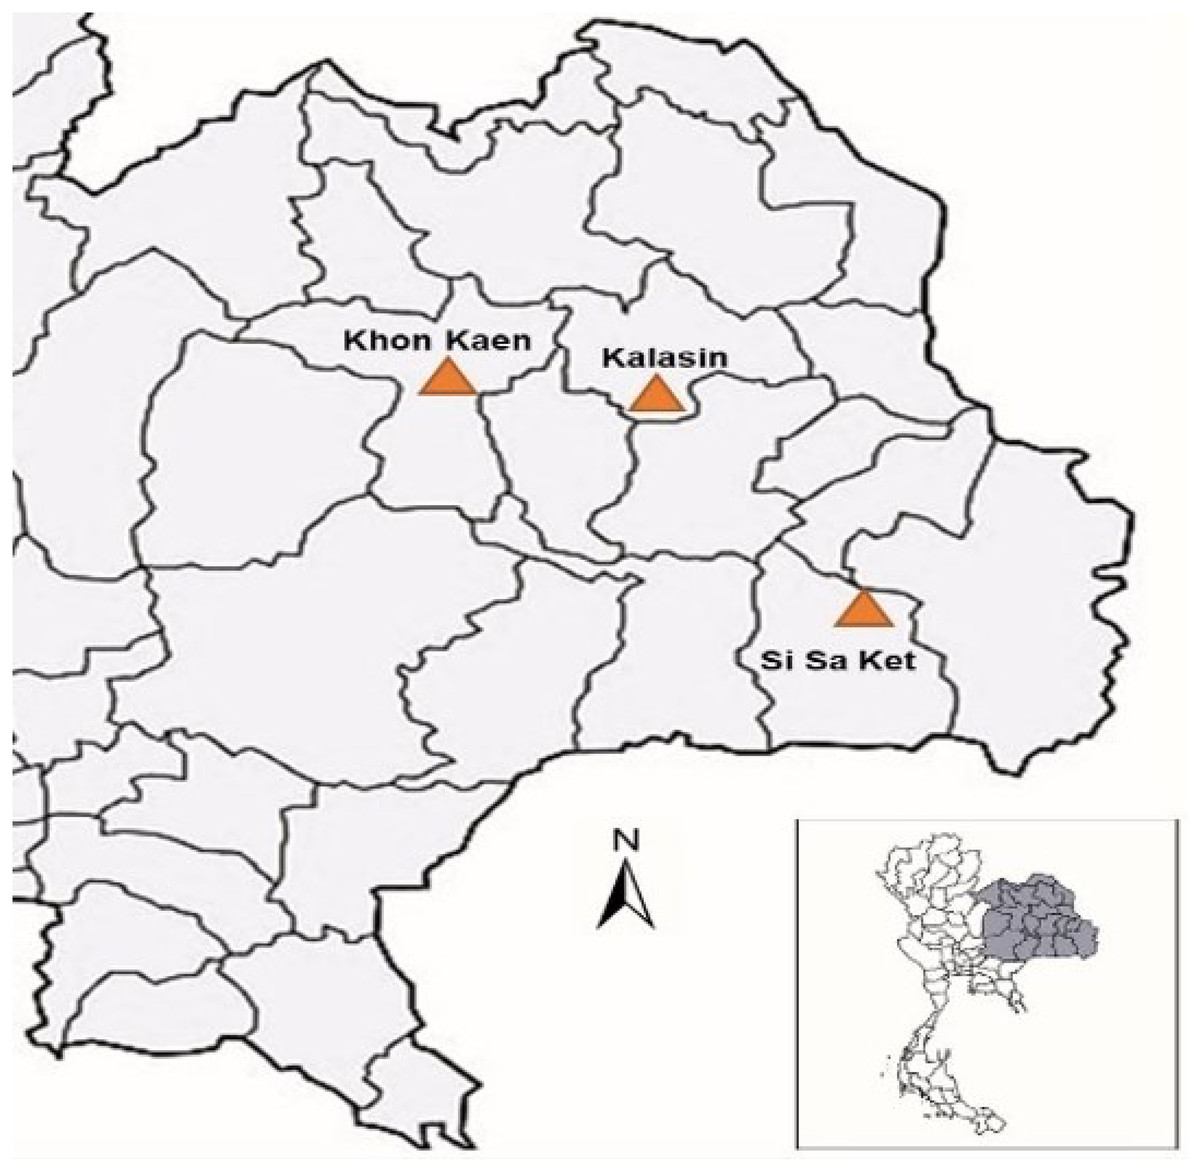
Figure 4: The study area map illustrates Thailand and the sampling locations for Khorat snail—eating turtle (M. khoratensis) turtles (orange triangles).
The black lines represent provincial borders.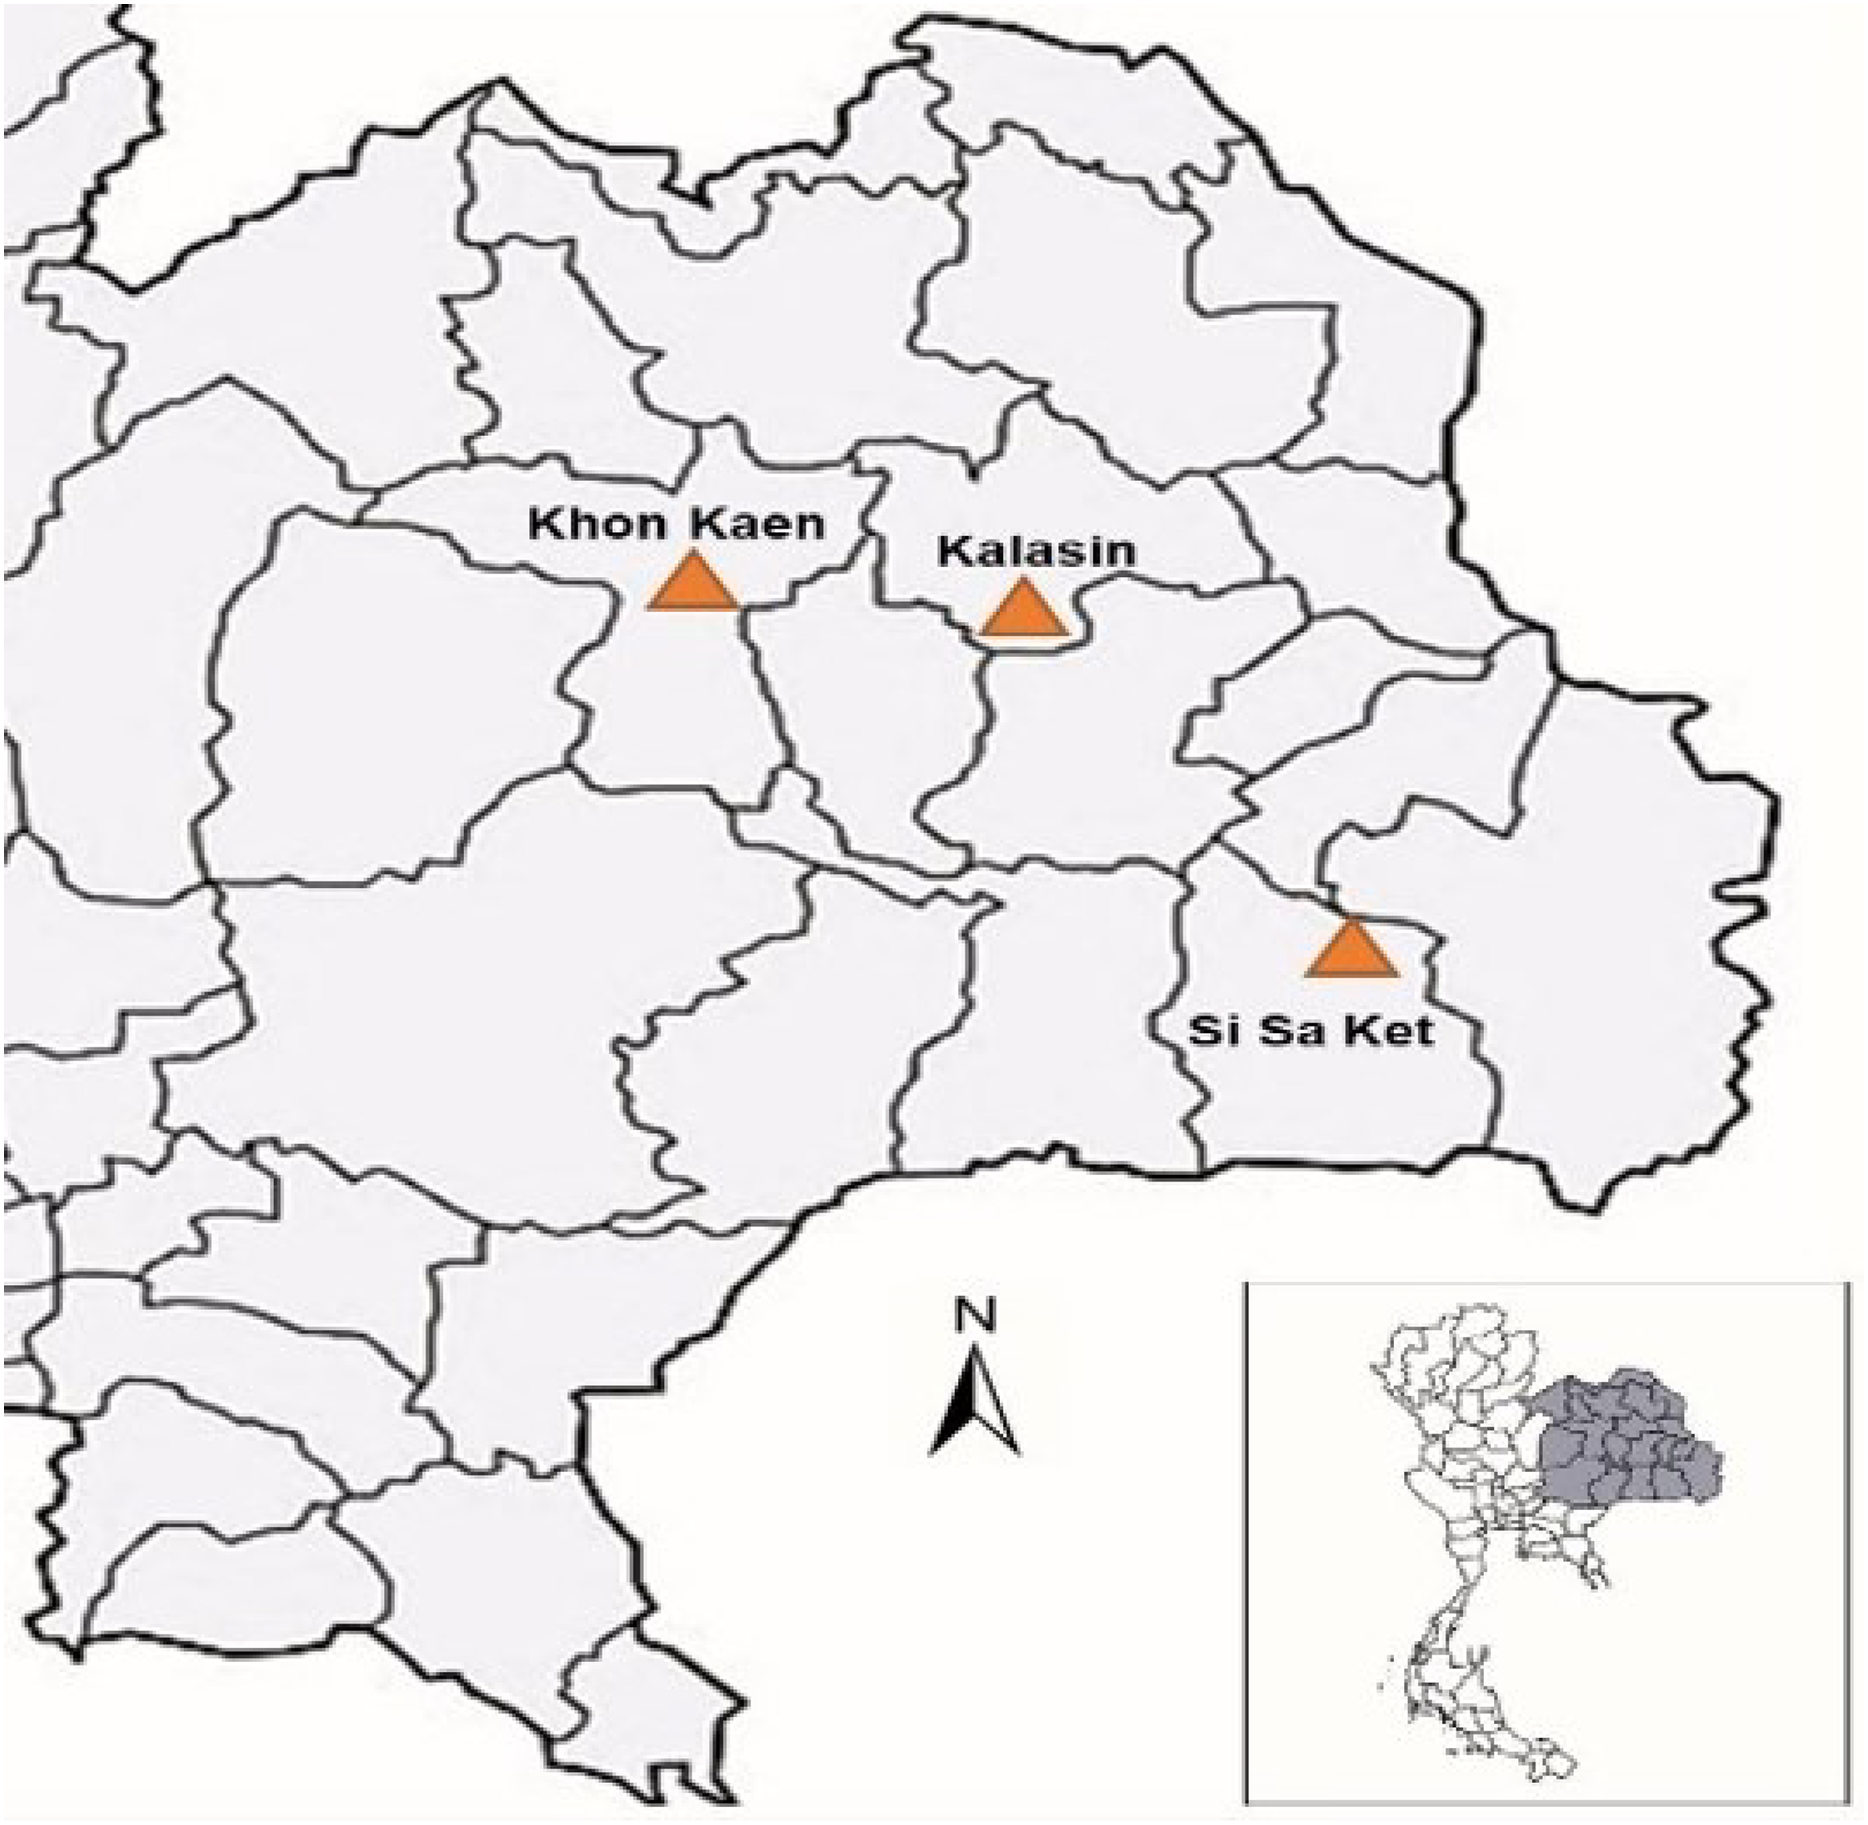
Data preparation
Each individual Malayemys khoratensis was photographed under controlled conditions using a digital camera with fixed exposure settings to ensure consistency and reproducibility. For each turtle of 20 photographs were captured from multiple perspectives, emphasizing distinct morphological regions including the nasal stripes, infraorbital strip and plastron. Each specimen was positioned on a white or non-reflective background and illuminated using controlled natural light source to minimize shadow. To maintain reproducibility and minimize inter-observer variability, all image were captured according to standardized photographic parameters, as summarized in Table 2. These parameters include camera angle, illumination direction, shooting distance, and resolution, which collectively ensure uniform brightness, contrast, and viewing perspective. Such standardization facilitates accurate feature extraction in subsequent deep-learning analysis.
| Parameter | Description | Standard setting/Range |
|---|---|---|
| View type | Orientation of the turtle during photography | Nasal stripe, infraorbital stripe (left & right), plastron |
| Camera angle (°) | Elevation between the lens axis and the turtle surface | 0° (frontal), 45° (lateral), 90° (top) |
| Distance from subject (cm) | Lens-to-turtle distance | 30–50 cm |
| Illumination direction | Light source orientation | Front-left, front-right, or overhead; 500–800 lux |
| Background | Surface type during capture | White, non-reflective mat |
| Camera height (cm) | Vertical lens height above the surface | 15–25 cm |
| Shots per view | Repeated captures to reduce variation | 2–3 per view |
| Observer | Human photographer identity | 2–3 trained observers |
| Image resolution | Native resolution before resizing | 4,000 × 3,000 pixels (≈12 MP) |
Data pre-processing and annotation
The proposed model incorporates a pre-processing stage designed to enhance data quality and align it with the requirements of baseline YOLOv8 models. This process includes automatically resizing images to 640 pixels width for YOLOv8 model training and validation, and sharpening to ensure uniform brightness and contrast, alongside removing equipment that captured animals, thereby improving the overall visual clarity of the images.
Furthermore, precise annotations of target objects such as faces, sides, and plastrons were conducted using Imglabel, a Python-based annotation tool recognized for its capacity to produce high-quality labels. The image dataset was further enriched by applying diverse augmentation techniques, including image horizontal flipping, zoom-in-out, and rotation, to provide a robust representation of the potential challenges faced by the model in detecting objects like faces, sides, and plastrons across varying environmental contexts.
Proposed model
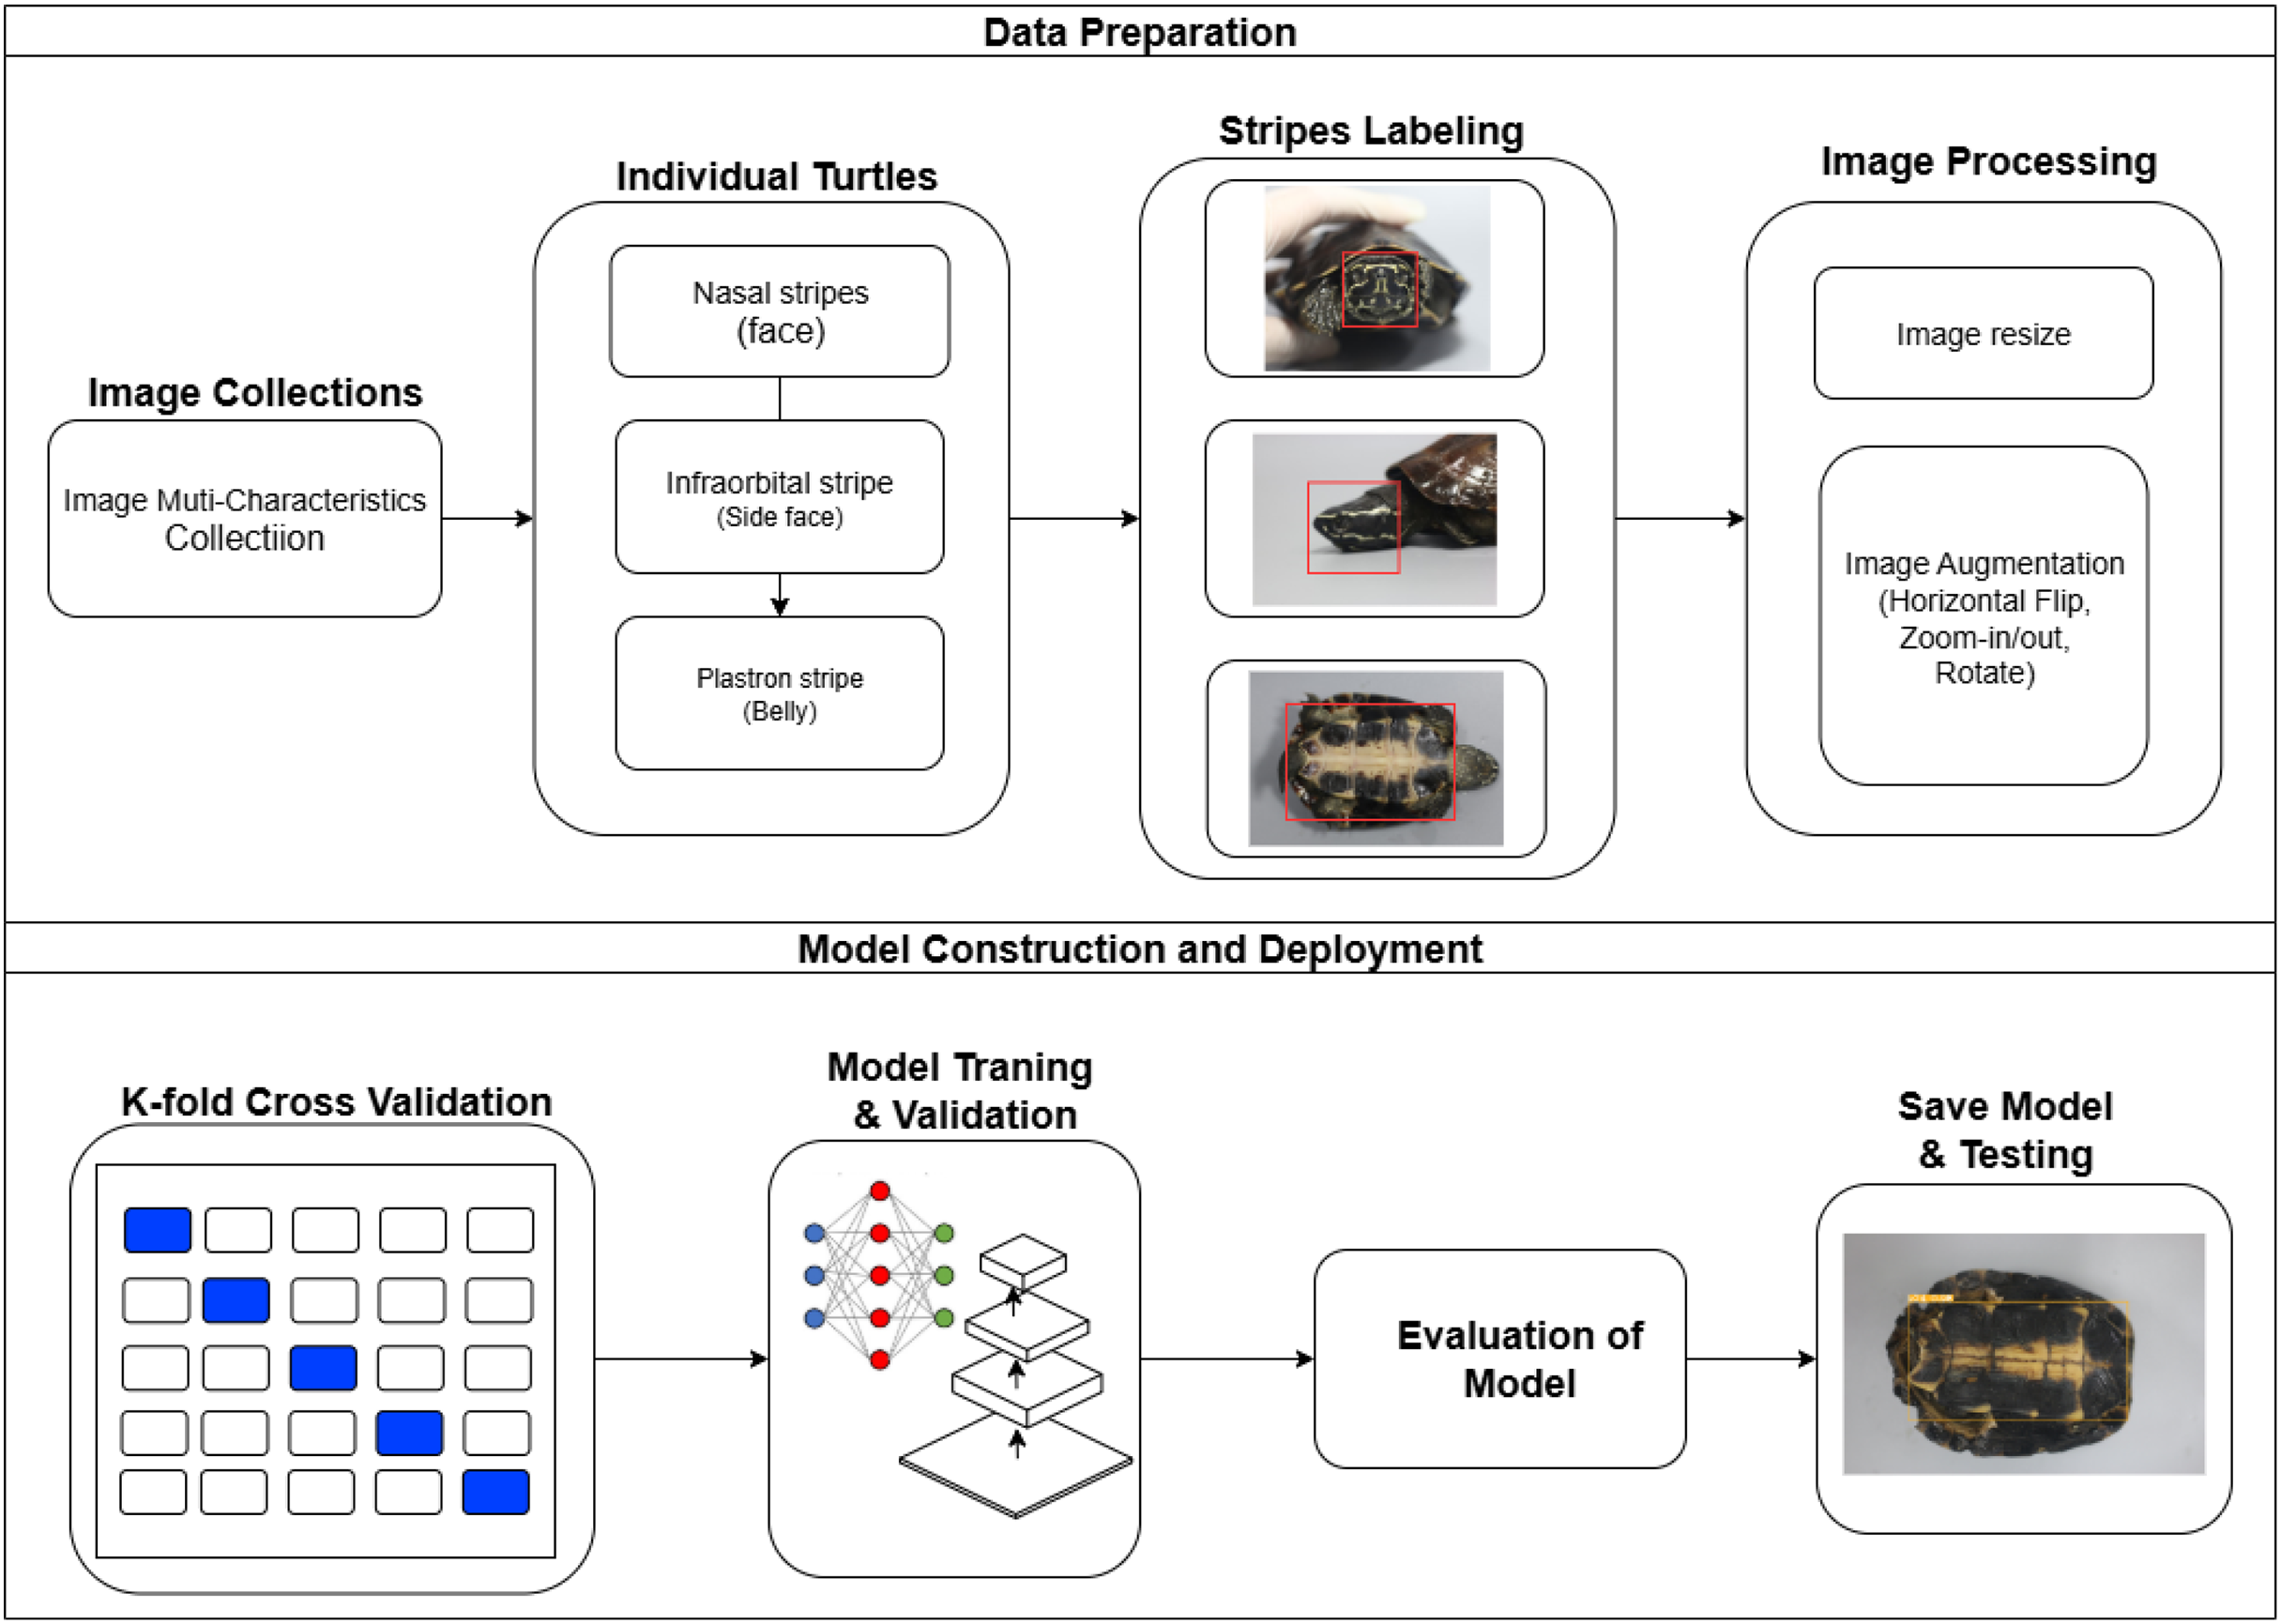
The proposed model illustrates a comprehensive turtle identification system workflow, emphasizing data preparation and model construction and deployment. The process starts with collecting images categorized as image multiple characteristics collection, capturing various perspectives and characteristics of individual turtles from the genius Malayemys. These images are then processed to identify specific turtle characteristics, focusing on stripe patterns such as nasal stripes (face), infraorbital stripes (side face), and plastron stripes. Precise labeling of these patterns follows, with red boxes highlighting the regions of interest. The labeled images undergo further processing, including resizing for uniformity and augmentation through horizontal flipping, zooming, and rotation to enhance the model’s robustness. The dataset is split into training, validation, and testing sets, facilitating model training, hyperparameter tuning, and performance evaluation. Deep learning techniques, including baseline YOLOv8, are employed for feature extraction and classification. The model’s performance is rigorously evaluated to ensure accurate identification of turtles based on their stripe patterns, with steps taken to avoid overfitting. After validation, the model is saved and further tested to ensure its effectiveness in real-world scenarios, culminating in its deployment as a web application for practical field use. This approach ensures the model’s reliability and accuracy in identifying individual Malayemys khoratensis turtles, contributing significantly to wildlife conservation and monitoring efforts as Fig. 5.
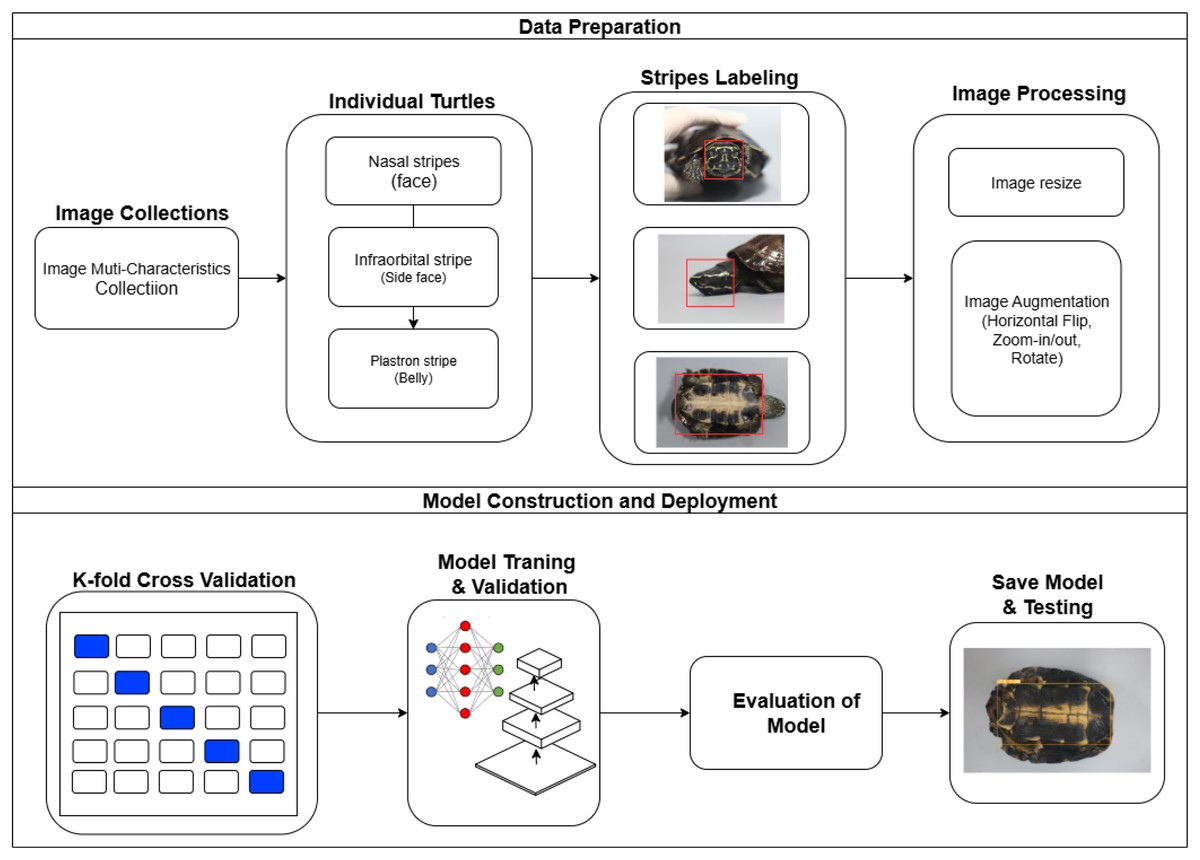
Figure 5: Framework of automatic individual identification and recognition of Khorat snail-eating Malayemys khoratensis.
YOLOv8 introduces significant enhancements in architectural design and training methodologies, making it exceptionally well-suited for detecting and classifying objects in real-time applications, such as video analysis and autonomous systems. The model’s modified backbone network and advanced feature extraction techniques enable it to capture intricate details within an image, contributing to its superior performance in various detection scenarios. These capabilities are further enhanced by anchor-free detection, improved loss functions, and efficient use of multi-scale features, all of which contribute to YOLOv8’s high accuracy and speed.
In the context of turtle identification, YOLOv8’s flexibility and advanced training strategies, such as data augmentation and transfer learning, are particularly valuable. By fine-tuning YOLOv8 for species identification tasks, researchers can leverage its deep convolutional neural networks (CNNs) to recognize and classify turtles based on unique morphological features, such as distinctive stripe patterns. The YOLOv8 is processed by input as a resized image of dimensions H × W × C, where H is height, W is width as 640 pixels, and C is the number of color channels. Augmentation pictures are taken manually by the photographer. A pre-trained convolutional neural network extracts features from the input image. This backbone processes the image and outputs a feature map. Output Feature Map is F of dimensions H′ × W′ × D, where H′ and W′ are the reduced dimensions due to strides and pooling in CNN layers, and D is the depth representing high-level features. The importance of the YOLOv8 detector via input of the feature map F output by the CNN backbone, which applies a series of convolutional layers on feature map F to predict bounding boxes, class probabilities, and object scores at different scales. This is done by applying 1 × 1 convolutions to predict bounding box attributes and class probabilities for each cell in the feature grid.
The output Predictions for each grid cell predict bounding box coordinates (bx, by, bw, bh) as follows,
(1)
(2)
(3)
(4) Object confidence score Pobj.
(5) Class probabilities Pclass[i].
(6) Here, is the sigmoid function of tx, ty, tw, th are the predicted offsets of cx, cy are the top-left coordinates of the grid cell, and pw, ph are the dimensions of the anchor box. The integration uses a composite loss function that includes terms for bounding box regression, object score, and class probability accuracy. The loss function can be shown as,
(7) Here, 1ij obj indicates if object j is present in cell i, terms are weights for different components of the loss, x, y, C are the ground truth box coordinates and confidence, and pi(c) are the class probabilities. Next, calculate the Average Precision (AP) for each model per class are compute the area under the precision-recall curve (AUC) for each model for each class. The Average Precision (AP) area can be approximated using the trapezoidal rule or more advanced interpolation methods in Eq. (8).
(8) where ws = spatial weight
wc = confidence weight
wp = pattern weight
mAPbox = mean Average Precision from bounding box regression
mAPobj = mean Average Precision from objectness detection
mAPcls = mean Average Precision from classification (turtle ID).
In object detection tasks, Average Precision (mAP) is a widely used metric to evaluate the performance of models like YOLOv8 when integrated with CNNs. mAP provides a comprehensive measure that captures the detector’s precision and recall across various threshold levels, offering an aggregate performance score that reflects the accuracy of detecting multiple classes of objects via calculating a mAP for an object detection model.
(9) where N is the number of classes i.
is the directional weight of mAP
This approach ensures precise and rapid identification, thereby enhancing the model’s robustness in varying environmental conditions. The model’s ability to consistently achieve high accuracy across different perspectives and conditions makes it an essential tool in developing automated systems for ecological monitoring and biodiversity assessment. Performance measurements, including accuracy, precision, recall, and mAP50–95, will be crucial in evaluating YOLOv8’s effectiveness in identifying turtles, ensuring that the model can be reliably deployed for real-world conservation efforts.
To evaluate the performance of the YOLOv8 model in identifying turtles, we use several standard metrics, including accuracy, precision, recall, and F1-score. The formula for each metric is as follows,
Precision measures of the ratio of the identified turtles are correct.
(10)
The model correctly identifies recall measures of the ratio of the actual turtles.
(11) mAP50–95 is more sensitive to localization errors. Overfitting models tend to perform well on training but poorly on higher IoU thresholds in validation. Firstly, the measure is calculated as average precision (AP) where p(r) is the precision as a function of recall using the area under the precision-recall curve as in Eq. (12) as follows,
(12)
Accuracy measures the proportion of correctly identified turtles out of all identification attempts.
(13) TP represents the number of correctly identified turtles, whereas TN denotes correctly identified non-turtle (background) instances. FP corresponds to non-turtle objects that were incorrectly classified as turtles, while FN refers to turtles that the model failed to detect. These indicators collectively evaluate the reliability and robustness of YOLOv8 in discriminating Malayemys khoratensis from non-target backgrounds based on distinctive morphological characteristics.
High TP and TN values, coupled with low FP and FN counts, demonstrate the model’s capability to perform consistently across real-world turtle identification scenarios.
The experiments were implemented using Python 3.8 and PyTorch 2.0.0, executed on a Windows 11 workstation equipped with an 11th-Gen Intel® Core™ i5-1135G7 CPU (2.40 GHz) and 16 GB RAM. A summary of the computational environment is presented in Table 3.
| Parameter | Value |
|---|---|
| Epoch | 100 |
| Batch size | 16 |
| Image size | 640 × 640 |
| Optimizer algorithm | SGD |
| lr0 | 0.01 |
| Degrees | 10 |
| Translate | 0.1 |
| Scale | 0.5 |
| Shear | 2 |
| Momentum | 0.937 |
| Weight decay | 0.01 |
| Directional weight of mAP | 0.75 |
Model training employed the Stochastic Gradient Descent (SGD) optimizer with an initial learning rate of 0.01, a momentum factor of 0.937, and approximately 3.7 M trainable parameters.
Each input image was resized to 640 × 640 pixels, with a batch size of 16, and trained over 100 epochs. To mitigate overfitting, a weight-decay coefficient of 0.01 was configured to regularize the learning process, while 5-fold cross-validation was performed to assess generalization stability across different dataset partitions.
Training loss metric is a metric to serve as a quantitative measure of how well the YOLOv8 Model learn to detect and classify turtle features during optimisation. There are composite metric comprising three components as Localization Loss (Loss_box), Confidence Loss (Loss_obj) and Classification Loss (Loss_class). Therefore, the total metric quantifies the cumulative prediction error across all training sample, where lower value indicate higher model accuracy and stability (Ariyametkul & Paing, 2025). The analysis representative would be presented the application of heat map visualization techniques as Grad-Cam and related variations (Jiang et al., 2025).
The experimental results are shown in the results section.
Results
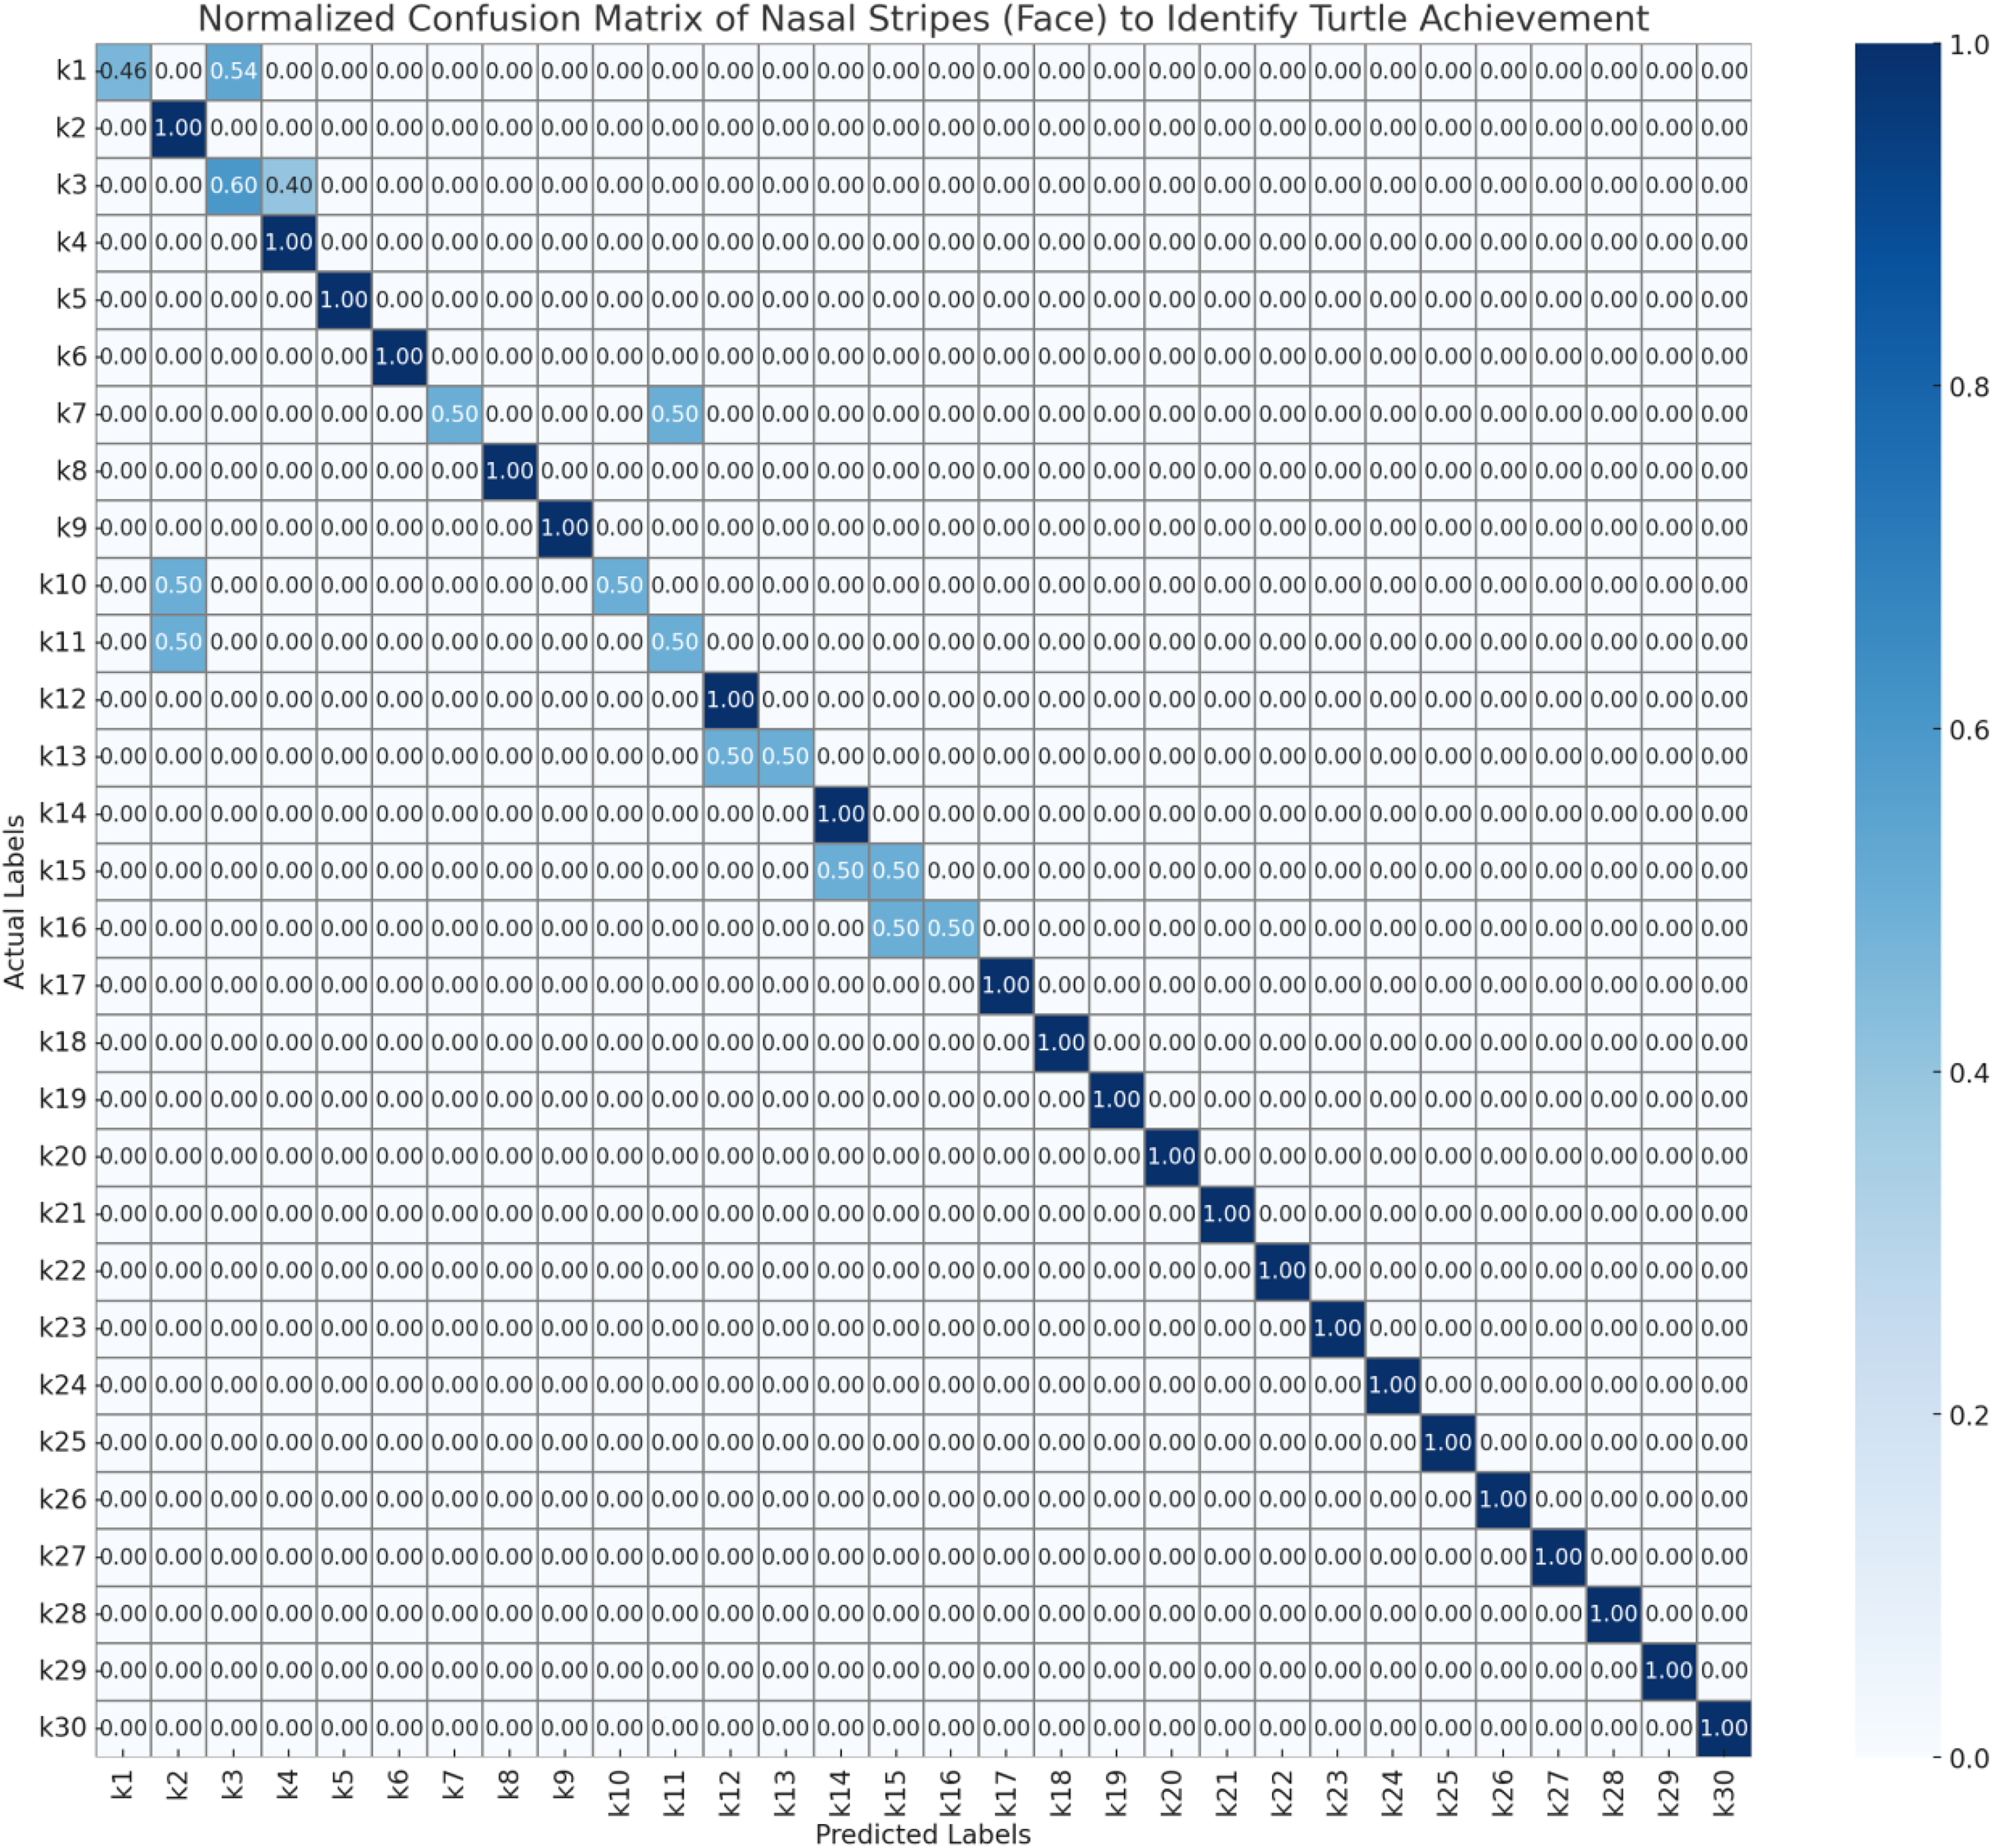
To evaluate the performance of the automated turtle identification framework, a systematic assessment protocol was employed utilizing three morphologically distinct biometric features as nasal stripe configurations obtained from frontal facial imagery, infraorbital stripe morphology and spatial positioning derived from lateral cranial profiles, and plastron pattern characteristics extracted from ventral carapace surfaces. Model validation was executed through stratified 5-fold cross-validation methodology to ensure statistical robustness and mitigate potential overfitting artifacts. The resulting confusion matrices (Figs. 6–8) present normalized probability distributions within the interval [0, 1], where diagonal elements indicate true positive classification rates and off-diagonal elements quantify inter-individual misclassification frequencies. Each matrix element represents the conditional probability P(predicted class j | actual class i), with optimal classification performance characterized by unity values along the principal diagonal and zero values in all off-diagonal positions.
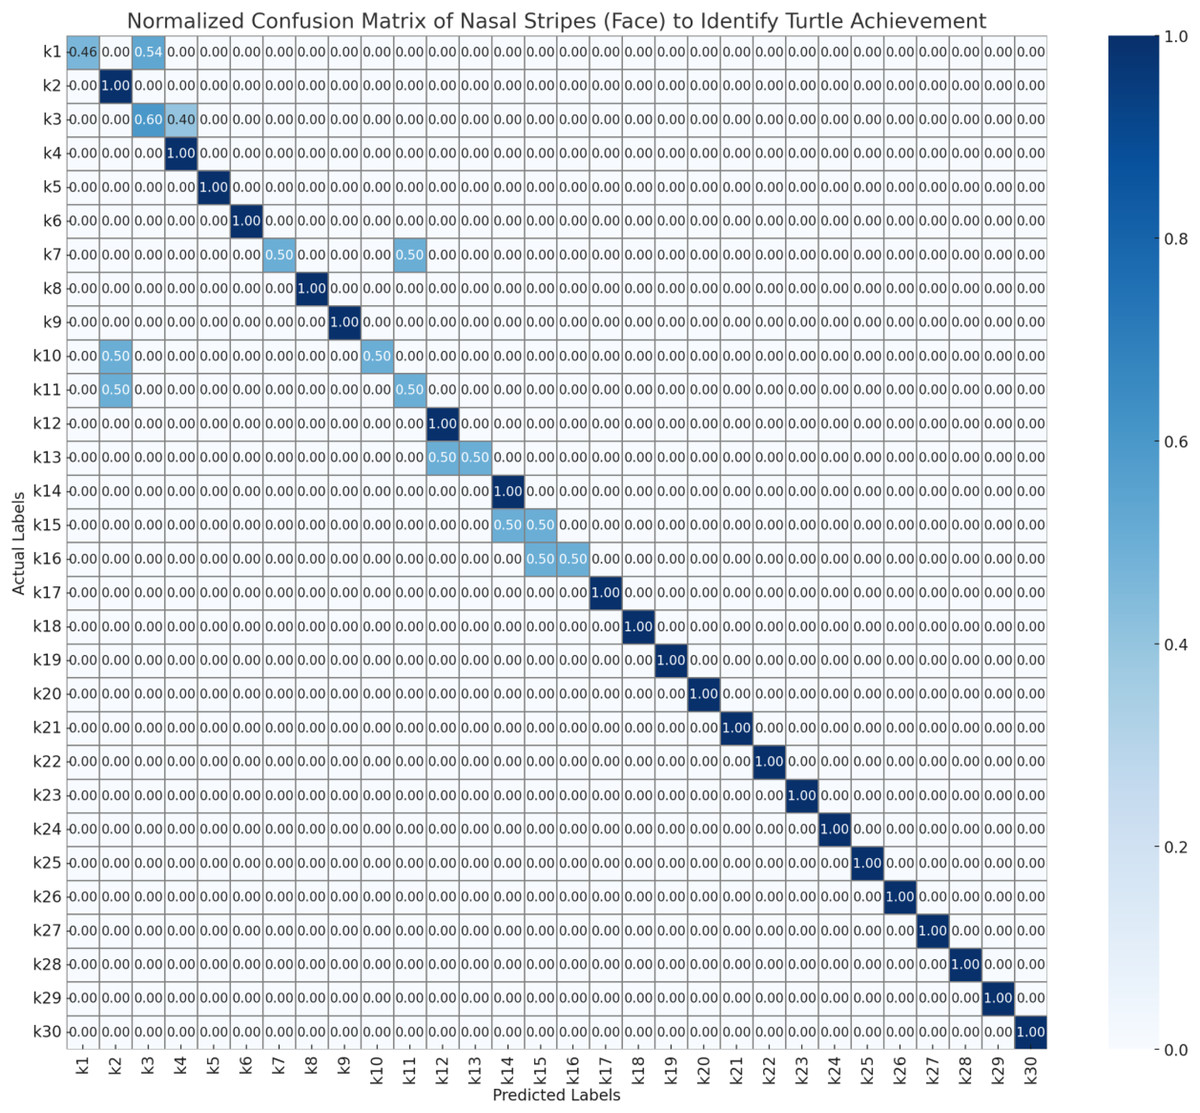
Figure 6: Normalized confusion matrix of nasal stripes (face) to identify turtle achievement.
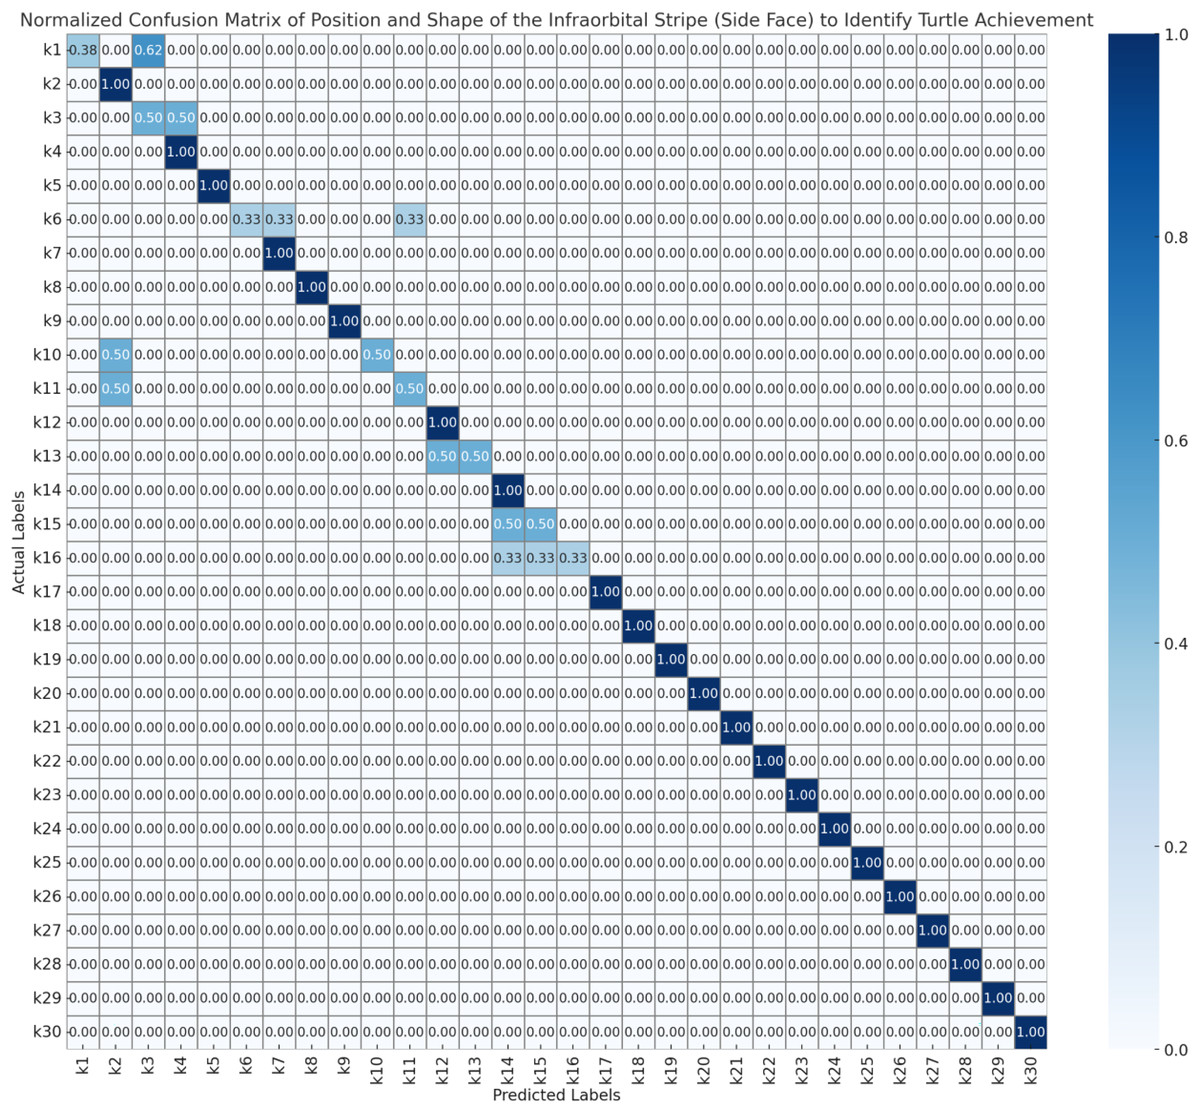
Figure 7: Normalized confusion matrix of position and shape of the infraorbital stripe (side face) to identify turtle achievement.
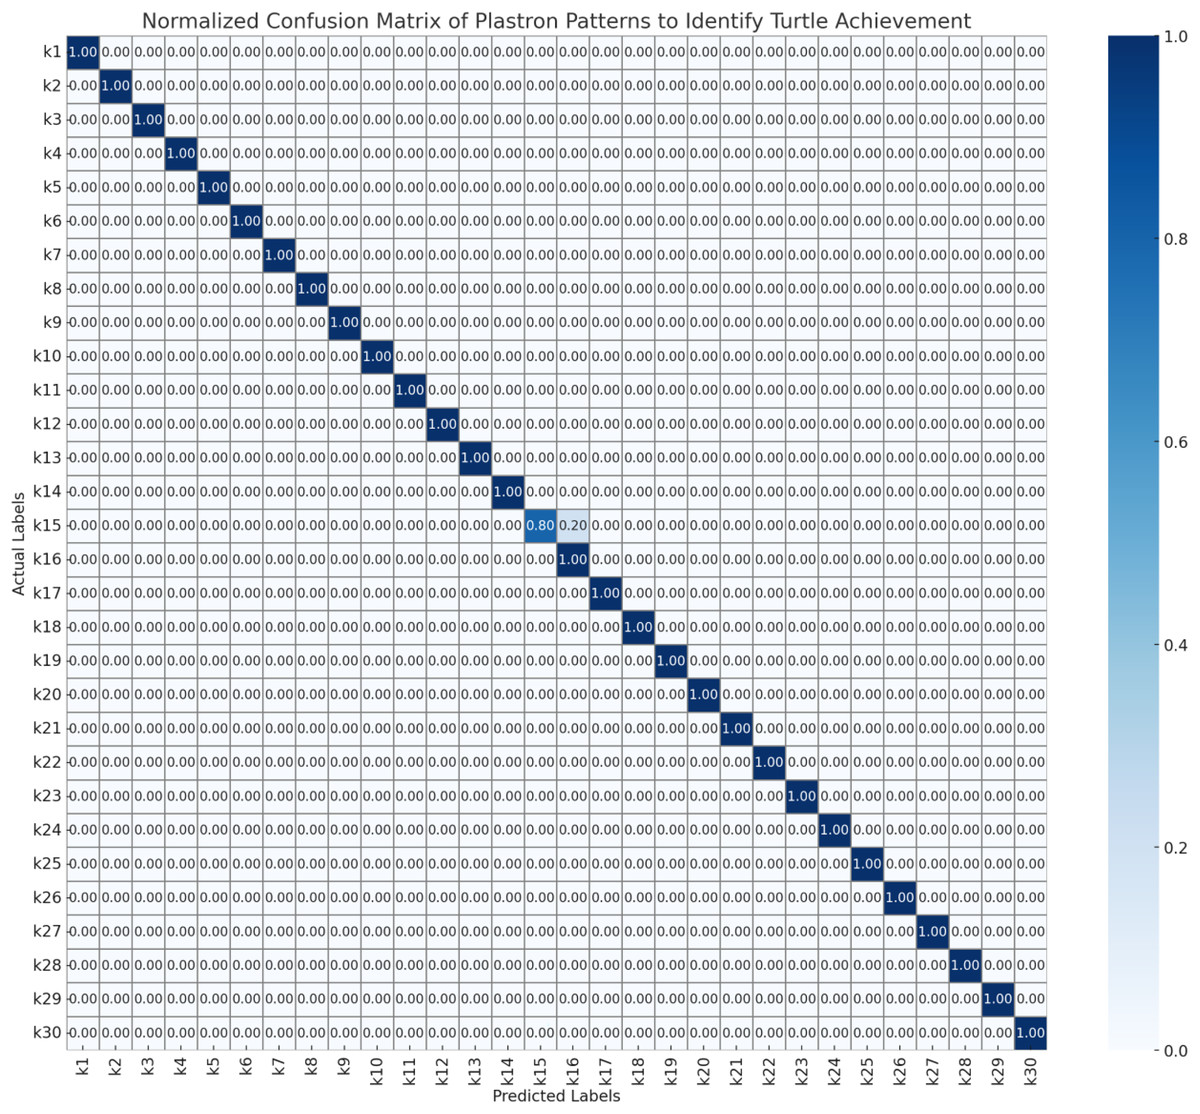
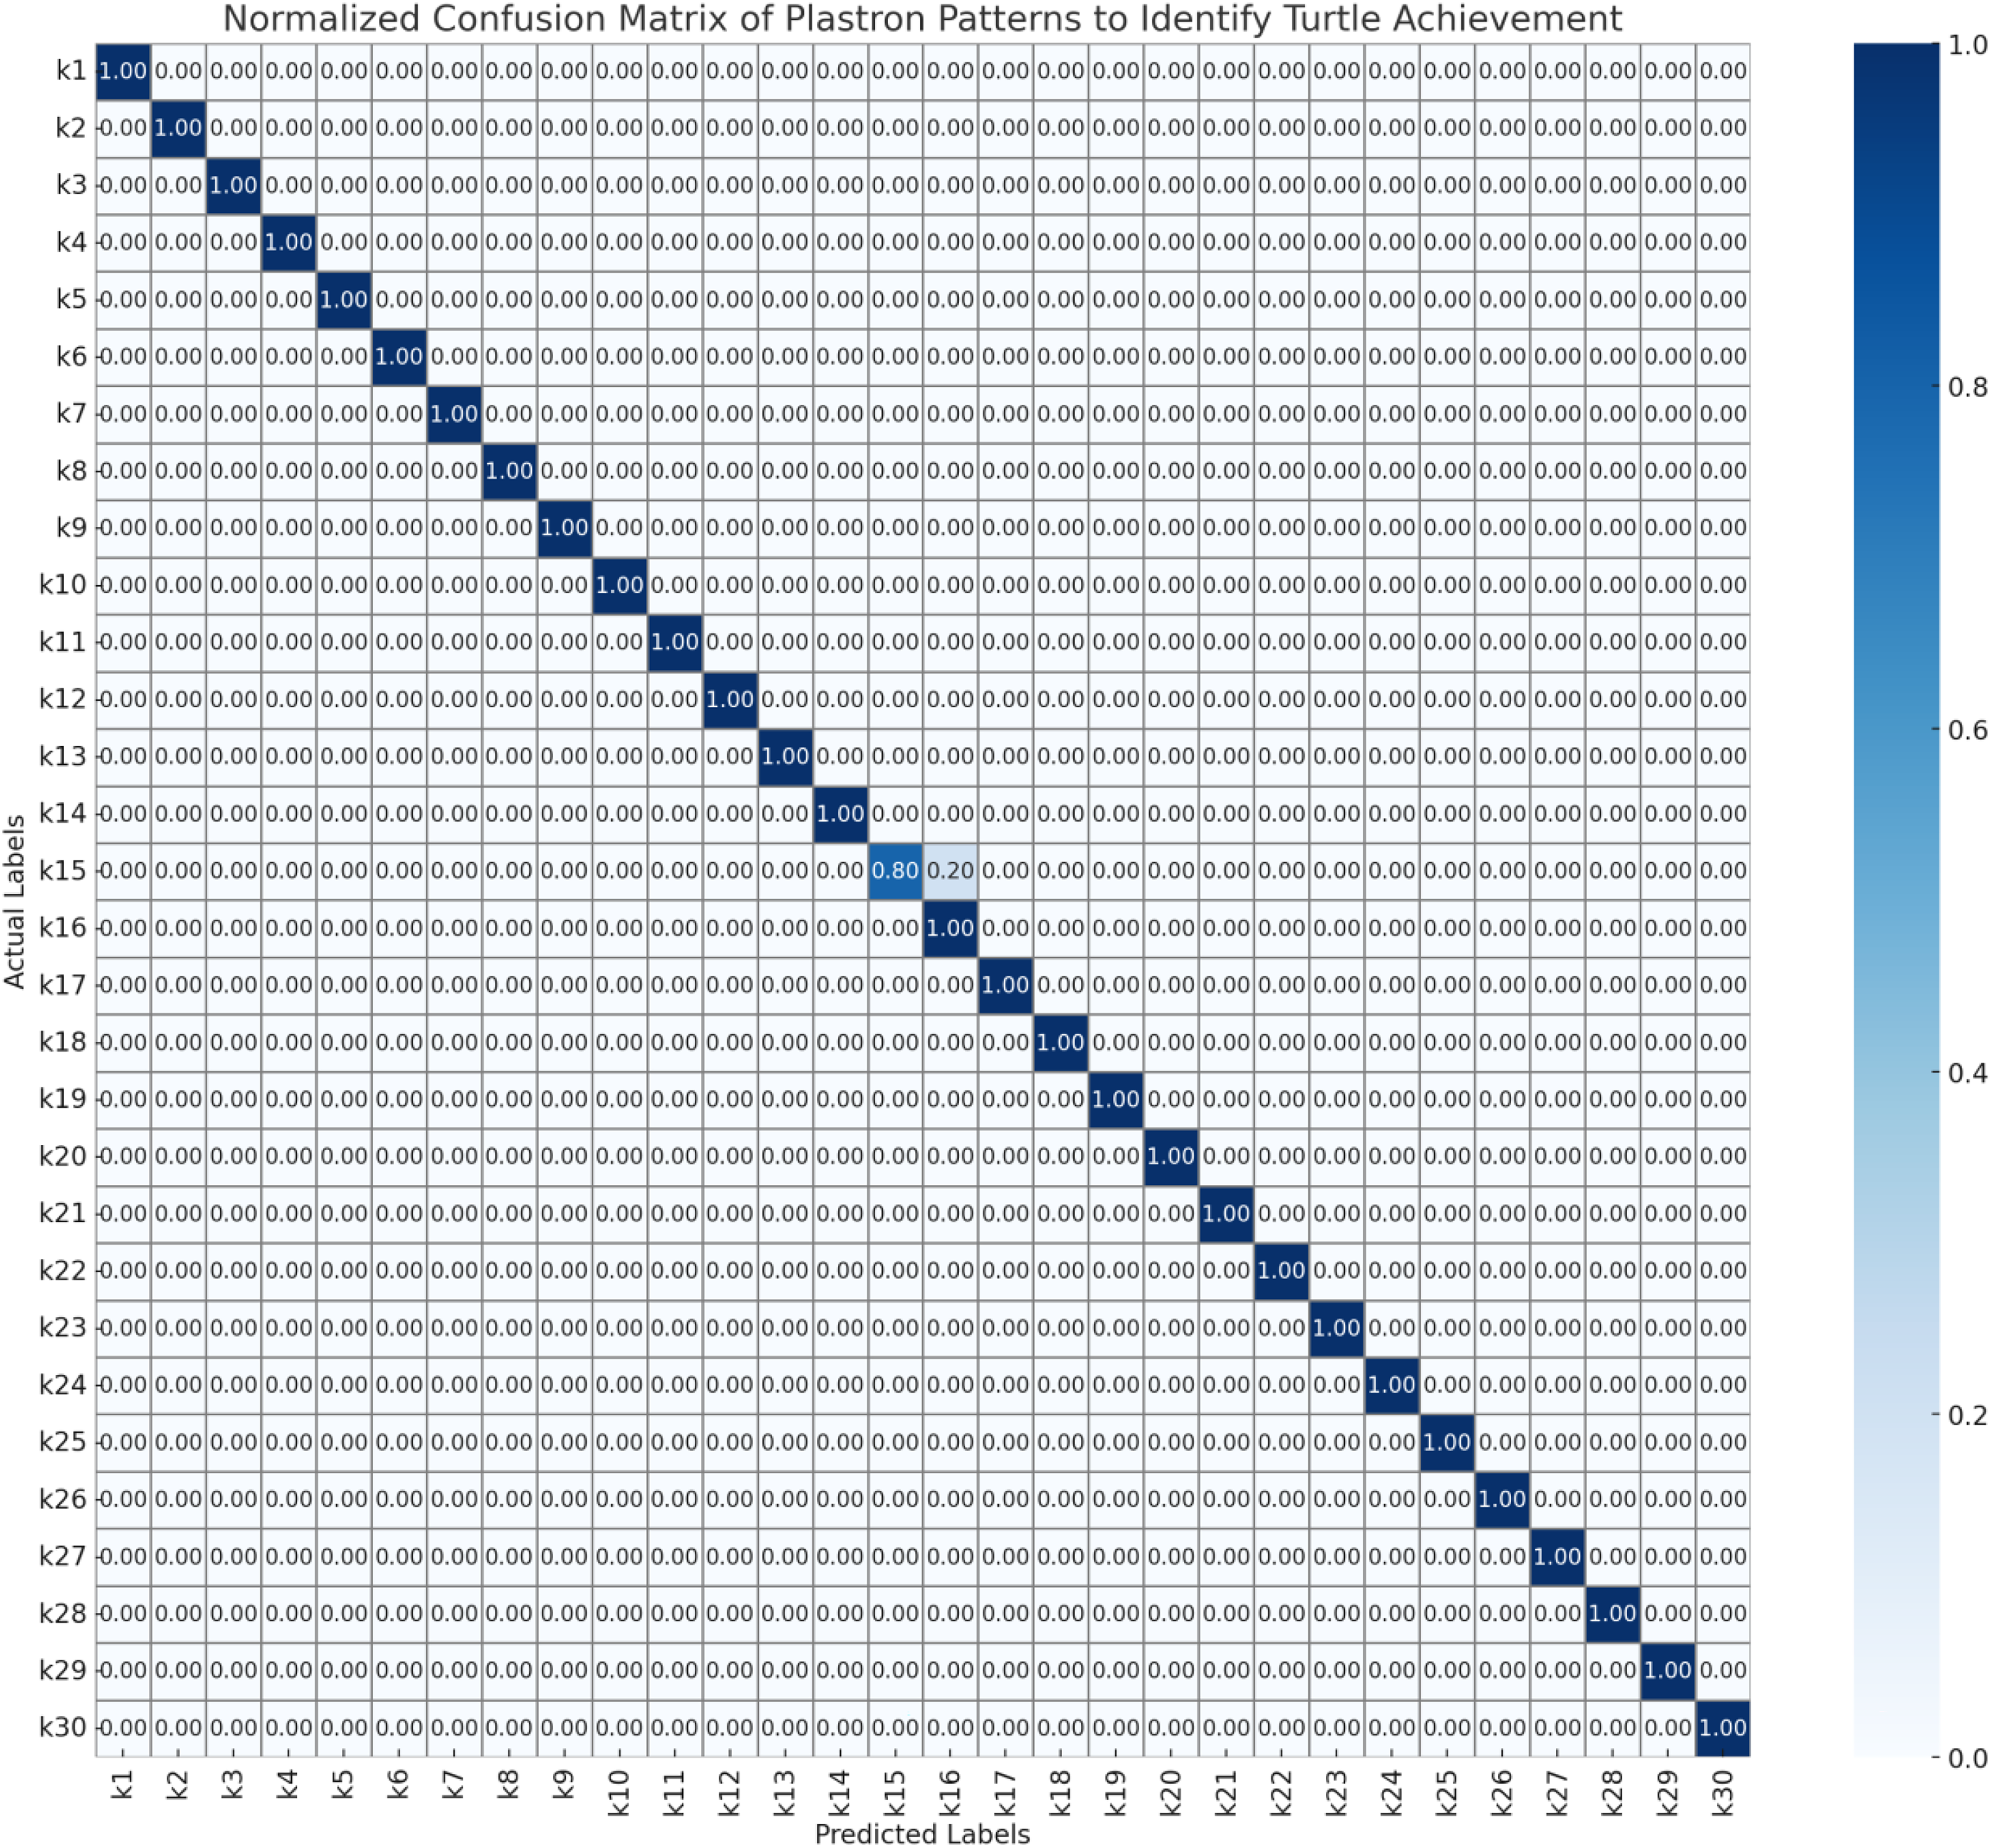
Figure 8: Normalized confusion matrix of plastron patterns to identify turtle achievement.
As Fig. 6, the confusion matrix demonstrates the classification performance of the nasal stripe recognition system using facial imagery. The matrix shows perfect diagonal classification (1.00) for the majority of turtle individuals (k2, k4–k6, k8–k9, k12, k14, k17–k30), indicating accurate identification based on nasal stripe patterns. However, several individuals show classification errors: k1 exhibits confusion between itself (0.46) and k3 (0.54), while k3 shows reciprocal confusion with k1 (0.60 vs. 0.40). Additionally, k7 demonstrates split predictions between k7 (0.50) and k10 (0.50), with k10 and k11 showing similar bidirectional confusion patterns (0.50 each). The k13 individual shows equal probability distribution between k13 and k14 (0.50 each), while k15 and k16 exhibit mutual misclassification (0.50 probability each). These results suggest that while nasal stripe patterns from facial views provide reliable identification for most individuals, certain turtle pairs may have similar nasal stripe characteristics that challenge automated classification systems.
As Fig. 7, the infraorbital stripe (side face) analysis from lateral facial views shows predominantly accurate classification performance. Most individuals (k2, k4–k5, k7–k9, k12, k14, k17–k30) achieved perfect classification scores (1.00 on the diagonal). Notable misclassifications include k1 with moderate confusion between itself (0.38) and k3 (0.62), and k3 showing reciprocal confusion with k1 (0.50 each). Individual k6 demonstrates three-way confusion among k6, k7, and k10 (0.33 probability each), while k10 and k11 maintain bidirectional confusion patterns (0.50 each). Similarly, k13 shows equal distribution between k13 and k14, k15 exhibits split prediction between k15 and k16 (0.50 each), and k16 demonstrates three-way confusion among k14, k15, and k16 (0.33 each). The infraorbital stripe positioning and morphology appear to provide reliable biometric markers for individual identification, though certain morphologically similar individuals continue to present classification challenges.
As Fig. 8, The plastron pattern recognition system demonstrates the highest classification accuracy among the three biometric approaches. Nearly all individuals (k1–k14, k16–k30) achieved perfect classification (1.00 diagonal values) with only minimal confusion observed. The single notable exception is k15, which shows uncertainty between k15 (0.20) and k16 (0.80), indicating potential similarity in plastron patterns between these two individuals. This high accuracy suggests that plastron patterns provide the most distinctive and reliable biometric characteristics for individual turtle identification. The ventral shell patterns appear to be highly individualistic and stable markers, making them particularly suitable for automated identification systems. The near-perfect classification performance indicates that plastron imagery could serve as the primary biometric method for turtle identification protocols, with facial stripe patterns serving as supplementary verification features.
Therefore, the confusion matrix confirms that the model is well-tuned for recognizing the unique plastron patterns of individual turtles, achieving strong overall accuracy and minimal errors. This performance underscores the potential of using plastron patterns with advanced machine learning models like YOLOv8 for accurate and efficient wildlife monitoring and conservation efforts.
As shown in Fig. 9, among the three features, plastron patterns achieved the highest overall performance, with a precision of 0.96, a recall of 0.97, an accuracy of 0.97, and an mAP@50–95 of 0.91, indicating that this feature provides the most reliable and consistent cues for individual identification. The high precision and recall suggest near-perfect classification with minimal false positives and false negatives, while the elevated mAP@50–95 confirms excellent detection quality across multiple IoU thresholds. Most notably, the accuracy of 0.97 reflects the model’s ability to correctly classify a large majority of test instances, highlighting the low misclassification rate and strong generalization ability across individual turtles.
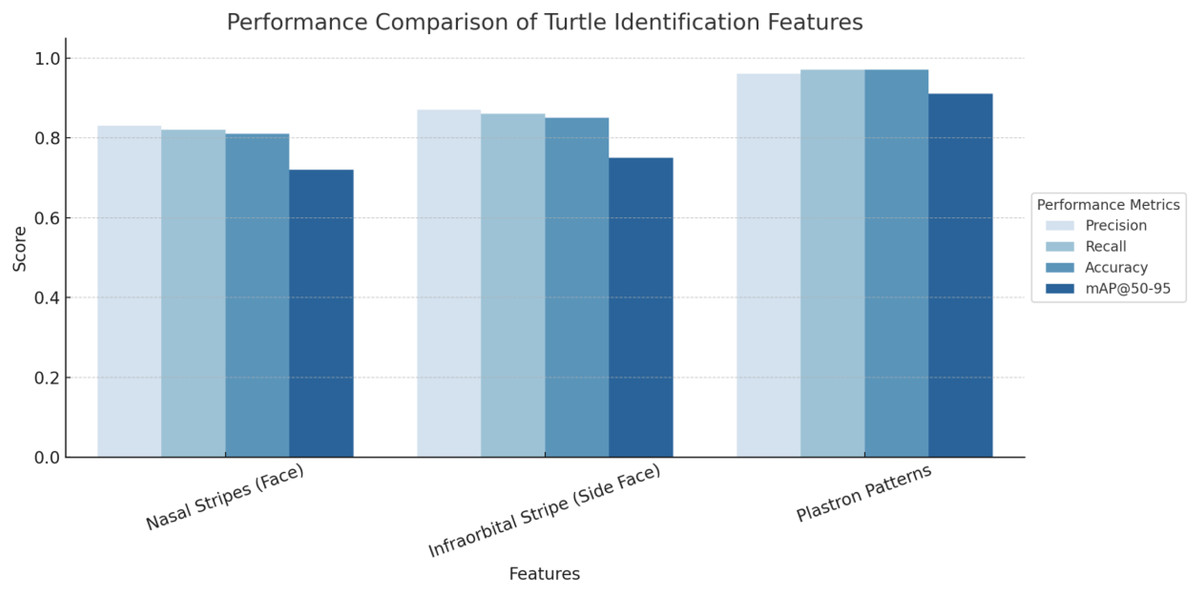
Figure 9: Comparative performance of three distinguishing features nasal stripes (face), infraorbital stripe (side face), and plastron patterns.
In contrast, nasal stripes (face) and infraorbital stripes (side face) showed slightly lower performance. The nasal stripe feature achieved a precision of 0.83, recall of 0.82, accuracy of 0.81, and mAP@50–95 of 0.72, whereas the infraorbital stripe yielded a precision of 0.87, recall of 0.86, accuracy of 0.85, and mAP@50–95 of 0.75. The relatively lower accuracy for these features may reflect greater variability in stripe visibility, shape distortion due to head pose, inconsistent lighting, or occlusion during image capture. These factors can reduce the model’s ability to confidently and consistently distinguish individuals based solely on facial markings.
To prevent overfitting during training, a weight decay parameter of 0.01 was applied to all convolutional and batch normalization layers within the YOLOv8 framework. This acted as an regularization term in the Adam optimizer, penalizing large parameter magnitudes to encourage smoother and more generalized feature representations. The training was performed with a learning rate of 0.001, momentum of 0.937, and the weight decay term integrated into the optimization process. This configuration was found to stabilize the learning curve. As illustrated in Fig. 10, both the training and validation loss curves consistently decreased, indicating effective convergence and strong generalization. In this phase, the analysis was systematically conducted across anatomical plastron patterns of the turtle to ensure that the model’s learning behaviors and convergence were consistent across distinct morphological perspectives. The results from all regions exhibited similar trends, with steady reductions in loss functions and high accuracy in detection metrics, confirming the robustness and adaptability of the directional weighted YOLOv8 architecture for individual identification tasks.
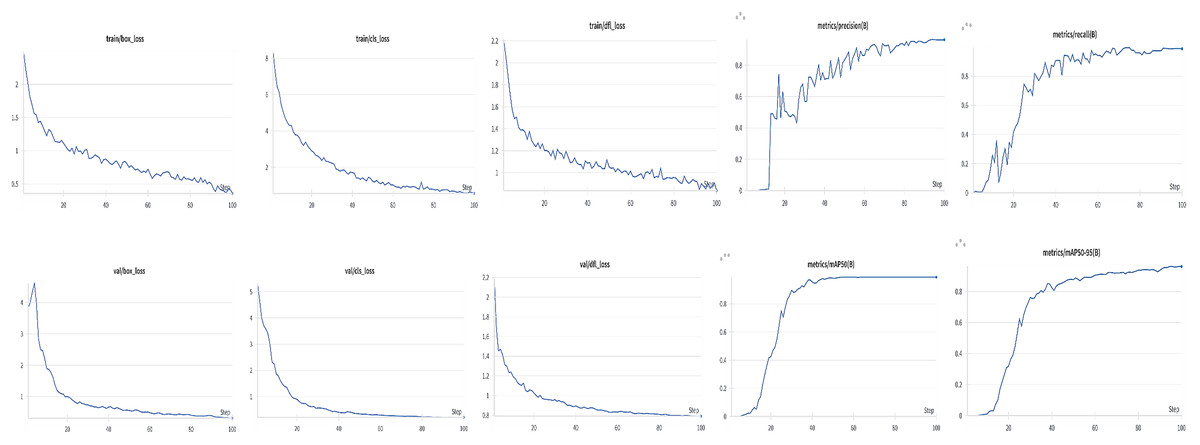
Figure 10: Training and validation performance of the proposed model for plastron stripe identification.
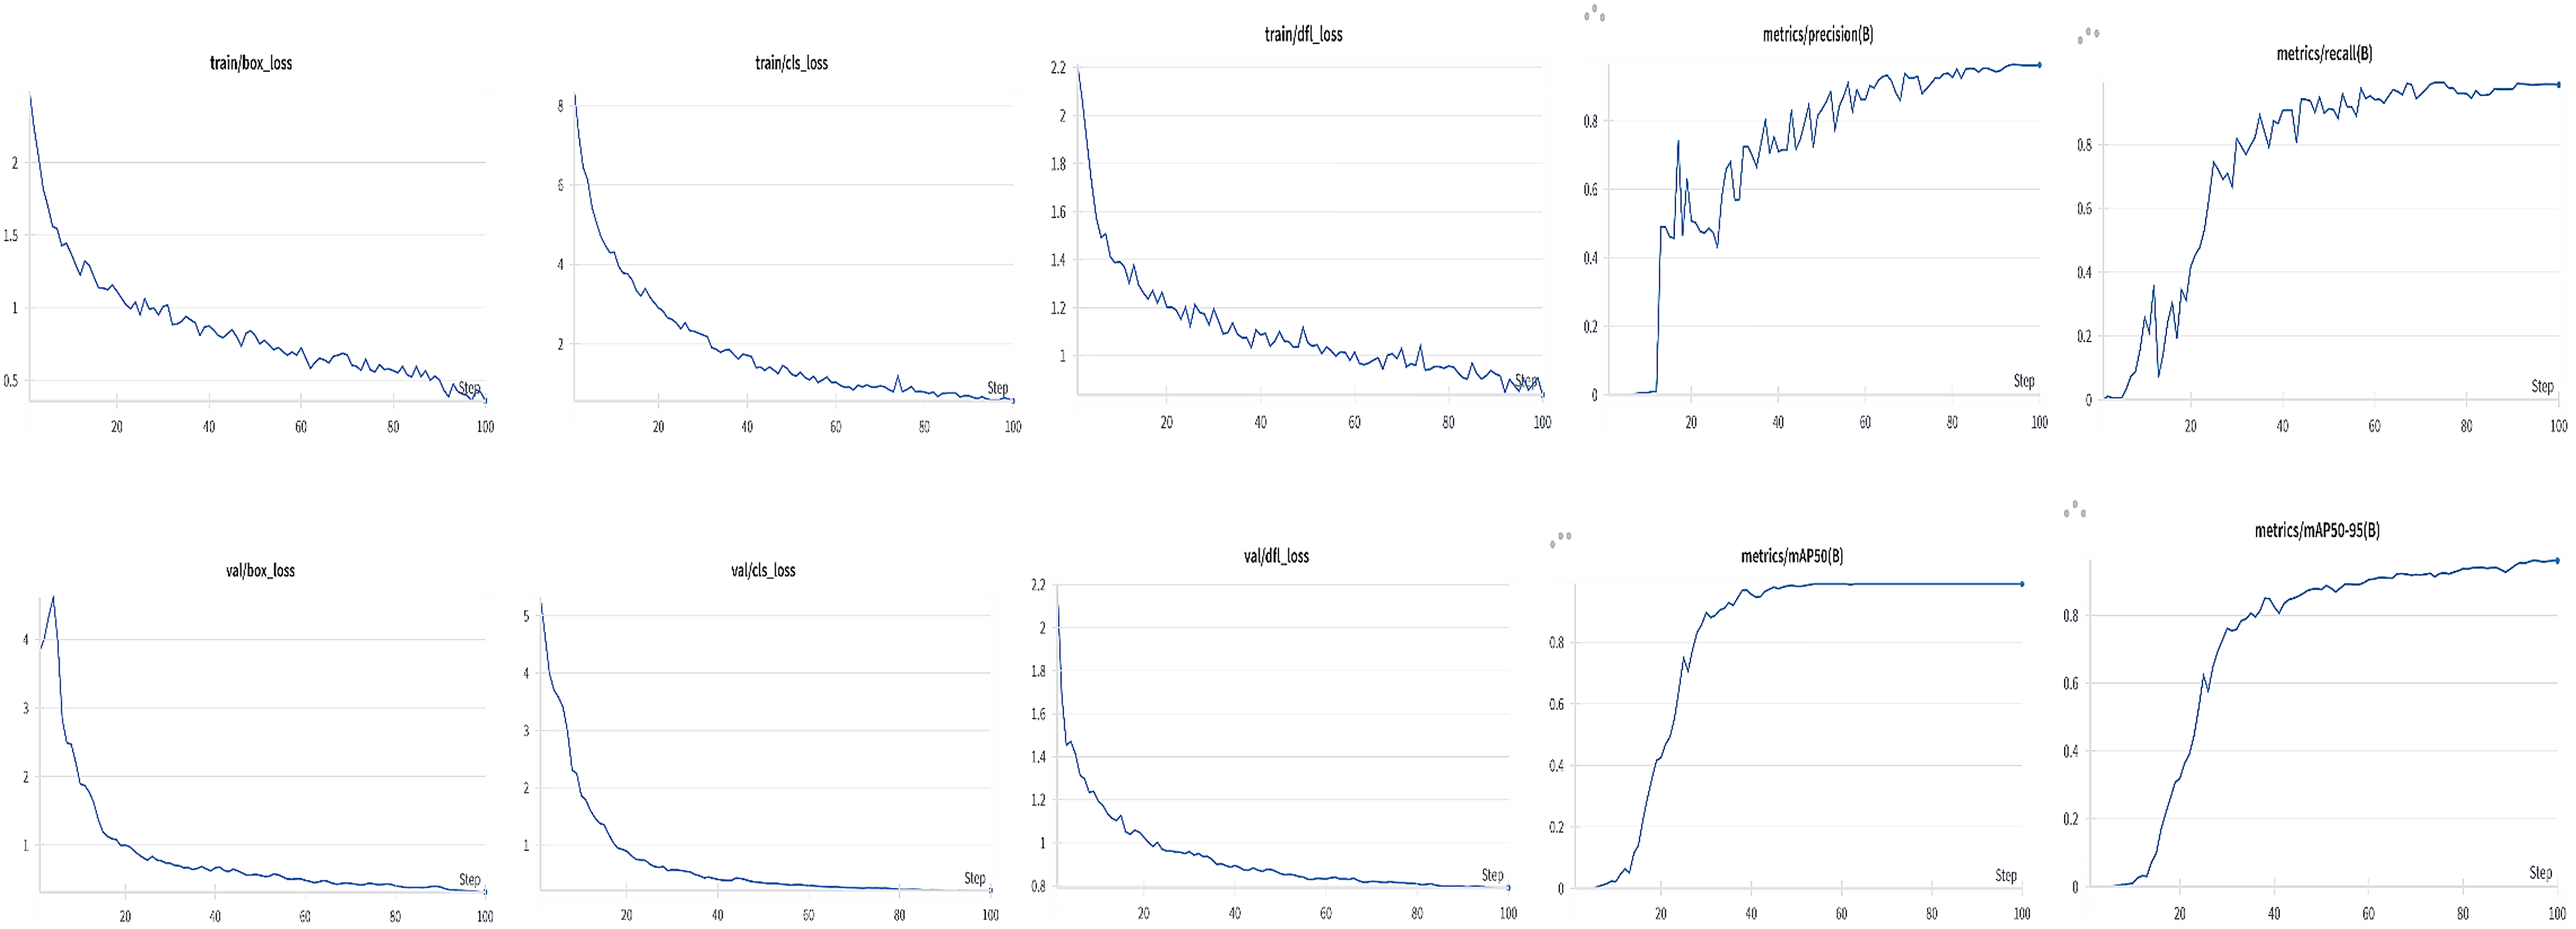
The training and validation losses of all datasets decreased steadily over 100 epochs, with no observable divergence. For the plastron pattern, the model achieved rapid convergence within the first 30 epochs, smooth loss reduction and low final loss, indicating strong discriminative capability for ventral morphological features (precision = 0.96, recall = 0.97, mAP@50–95 = 0.91). Overall, the parallel trends of training and validation curves across plastron regions highlight the reliability of the proposed model and validate the effectiveness of the directional weighting strategy in capturing morphological diversity without overfitting.
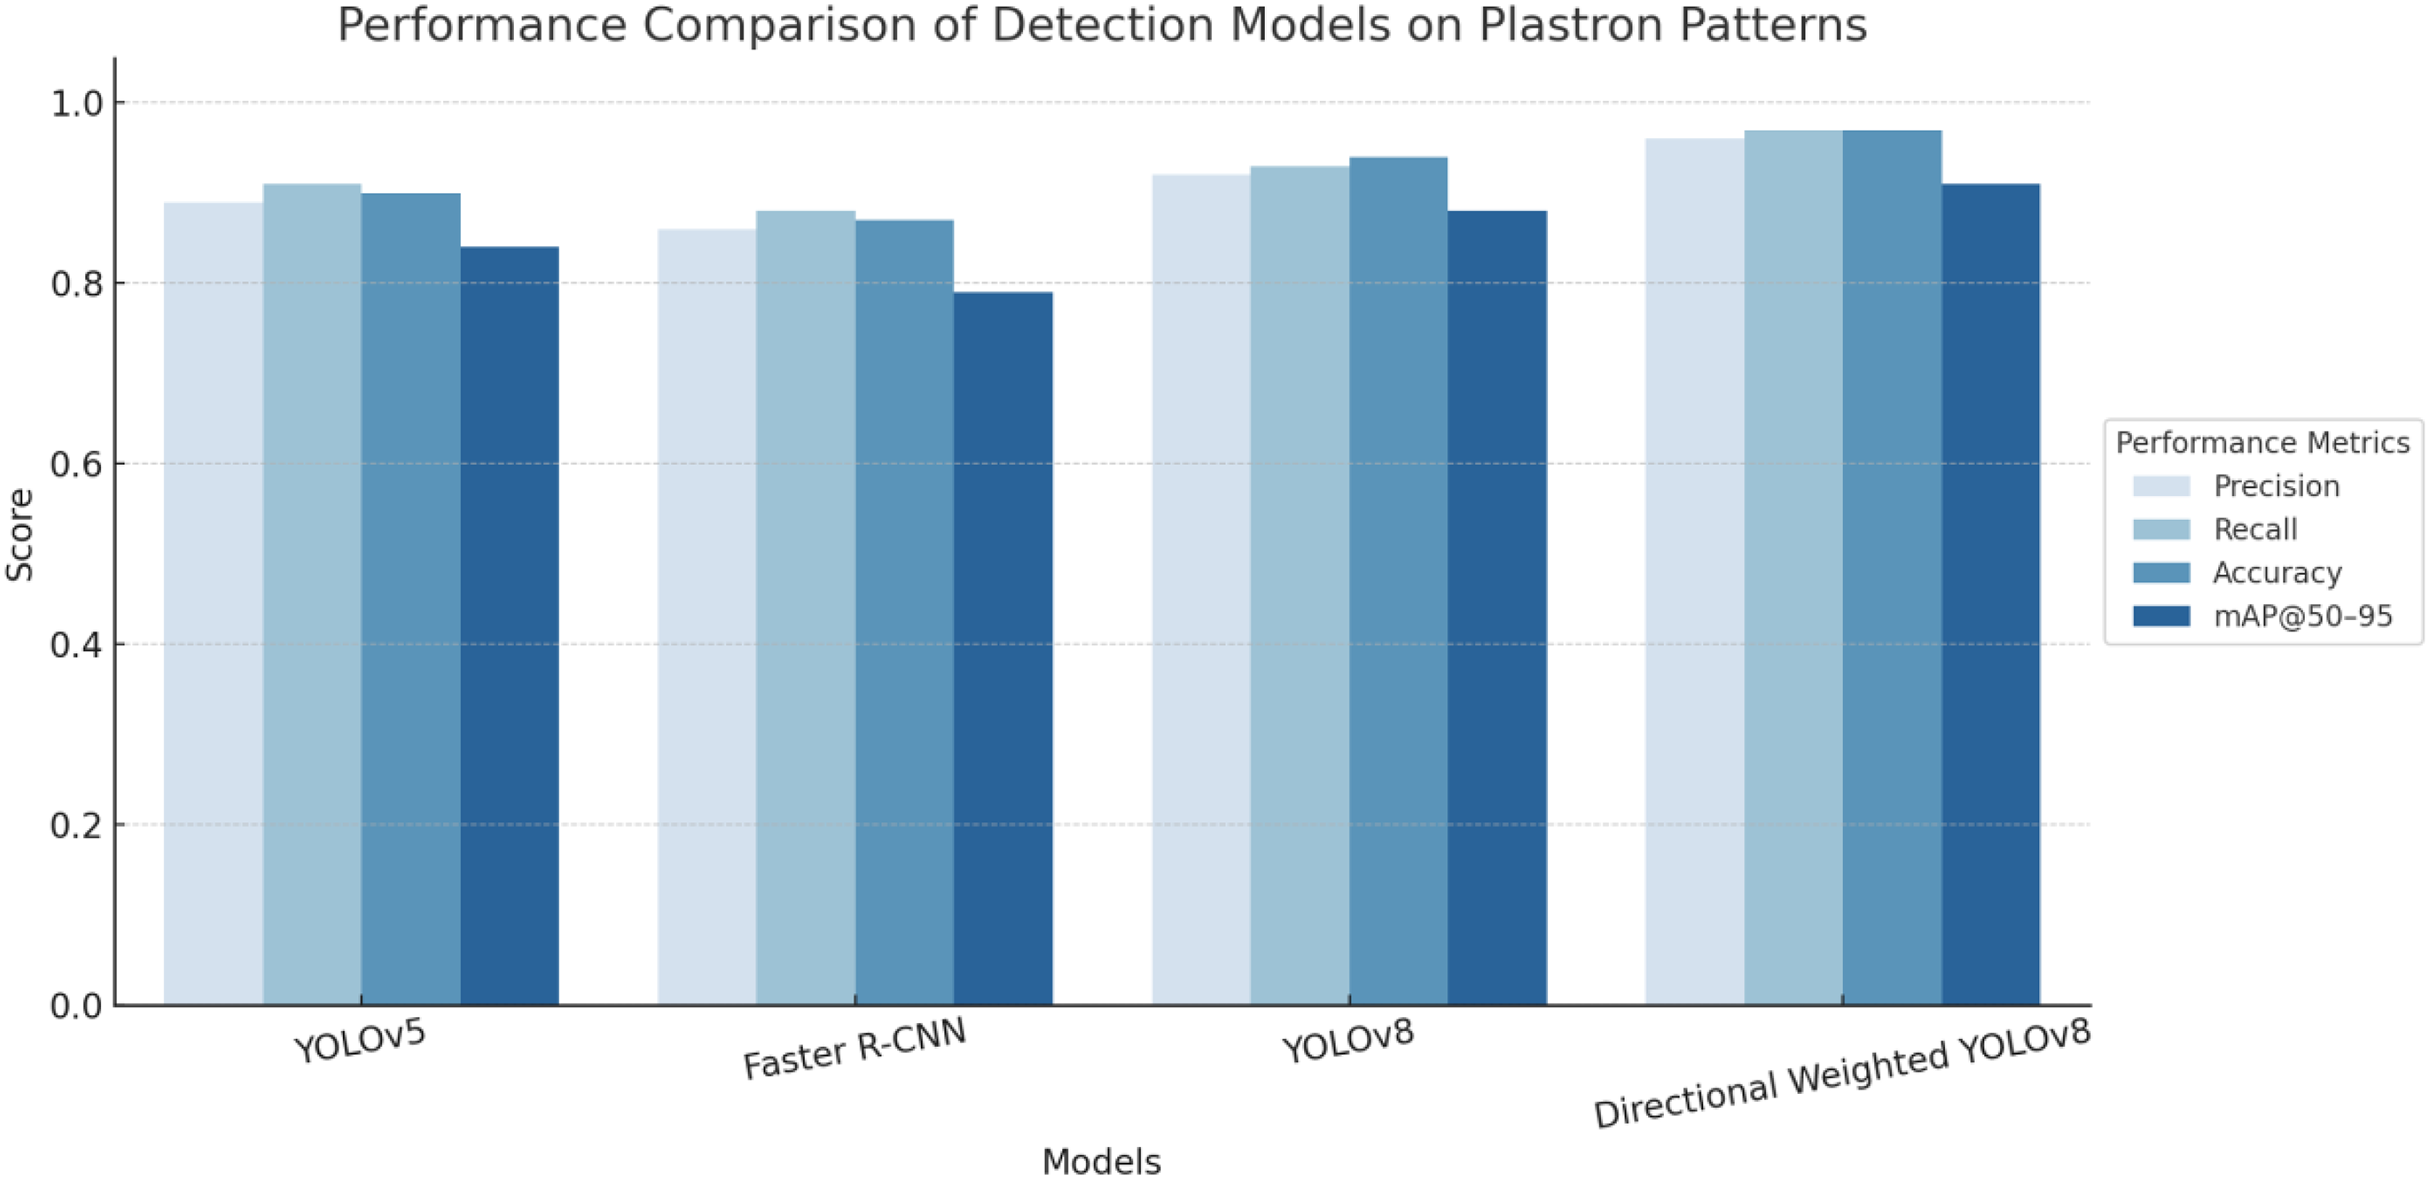
The comparative analysis of four state-of-the-art object detection models reveals significant performance variations in plastron pattern detection tasks. The evaluation encompassed four key performance metrics: precision, recall, accuracy, and mAP at 50–95% IoU thresholds (mAP@50–95). Directional Weighted YOLOv8 demonstrated superior performance across all evaluated metrics, achieving the highest scores in precision (0.96), recall (0.97), accuracy (0.97), and mAP@50–95 (0.91). The enhanced performance can be attributed to its directional weighting mechanism, which effectively captures the oriented nature of plastron patterns. Baseline YOLO Architectures, standard YOLOv8 exhibited robust performance with precision (0.92), recall (0.94), accuracy (0.95), and mAP@50–95 (0.88), outperforming its predecessor YOLOv5. YOLOv5 achieved moderate performance metrics with precision (0.90), recall (0.91), accuracy (0.90), and mAP@50–95 (0.84). These results align with the evolutionary improvements documented in the YOLO architecture series, where YOLOv8’s enhanced feature extraction capabilities and optimized anchor-free design contribute to superior detection performance. Whereas Faster R-CNN (Shaoqing et al., 2017), despite being a well-established two-stage detector, demonstrated the lowest performance among evaluated models, with precision (0.87), recall (0.90), accuracy (0.87), and mAP@50–95 (0.79). This relatively lower performance may be attributed to the model’s computational complexity and potential overfitting to the specific characteristics of plastron patterns in their analysis of two-stage vs. one-stage detectors for biological pattern recognition. The results of performance comparison are shown as Fig. 11.
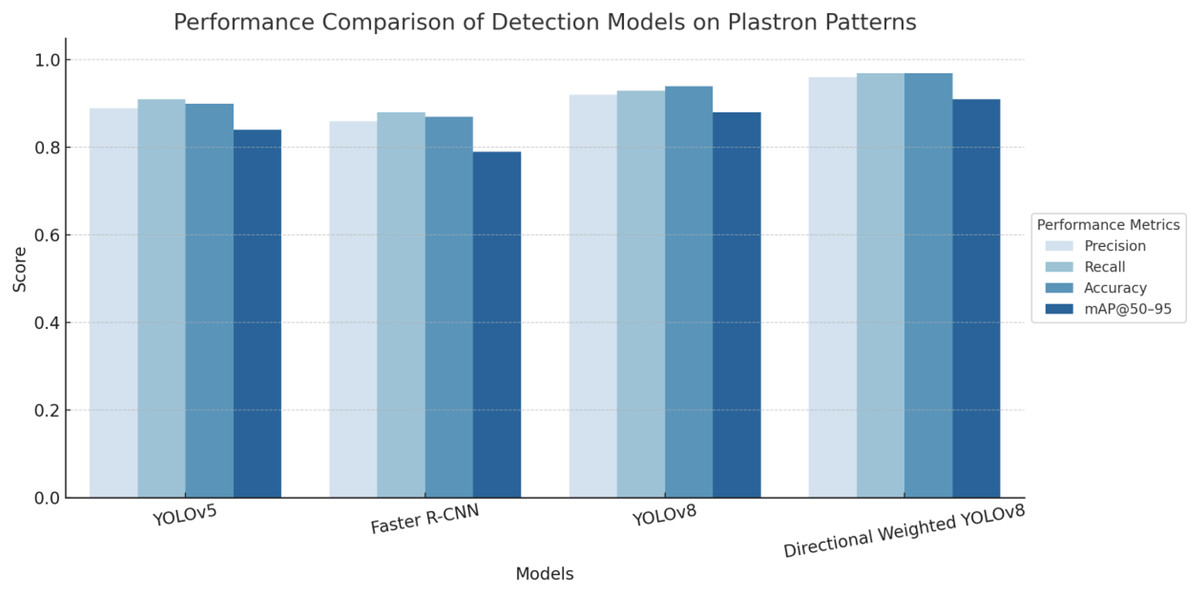
Figure 11: Performance comparison of YOLOv5, Faster R-CNN, YOLOv8, and directional weighted YOLOv8 on turtle identification using plastron patterns.
As Table 4, Overall, the proposed directional weighted YOLOv8 achieved the highest and most stable performance across all metrics and from 1 to 5 folds. The precision, recall and mAP@50–95 consistently surpassed those of YOLOv4, Faster R-CNN, and the base line YOLOv8, confirming the effectiveness of incorporating direction weight attention of plastron pattern recognition. The Directional Weighted YOLOv8 model consistently outperformed all other detection frameworks across all folds. The average precision and recall reached 0.97 ± 0.01 and 0.98 ± 0.01, respectively, with mAP@50–95 of 0.93 ± 0.01. In contrast, the baseline YOLOv8 and traditional frameworks such as YOLOv5 and Faster R-CNN showed larger performance variations, indicating relatively lower generalization ability. These results demonstrate not only the robustness of the model but also the stability of its learning behaviour across multiple validation sets.
| Model | Fold | Precision | Recall | Accuracy | mAP@50–95 |
|---|---|---|---|---|---|
| YOLOv5 | Fold 1 | 0.89 | 0.91 | 0.90 | 0.84 |
| Fold 2 | 0.90 | 0.91 | 0.90 | 0.85 | |
| Fold 3 | 0.91 | 0.92 | 0.91 | 0.84 | |
| Fold 4 | 0.90 | 0.90 | 0.90 | 0.83 | |
| Fold 5 | 0.89 | 0.91 | 0.89 | 0.84 | |
| Mean ± SD | 0.90 ± 0.01 | 0.91 ± 0.01 | 0.90 ± 0.01 | 0.84 ± 0.01 | |
| Faster R-CNN | Fold 1 | 0.86 | 0.89 | 0.87 | 0.79 |
| Fold 2 | 0.87 | 0.90 | 0.88 | 0.79 | |
| Fold 3 | 0.88 | 0.91 | 0.88 | 0.80 | |
| Fold 4 | 0.87 | 0.90 | 0.87 | 0.78 | |
| Fold 5 | 0.87 | 0.89 | 0.88 | 0.79 | |
| Mean ± SD | 0.87 ± 0.01 | 0.90 ± 0.01 | 0.87 ± 0.01 | 0.79 ± 0.01 | |
| YOLOv8 | Fold 1 | 0.91 | 0.93 | 0.94 | 0.87 |
| Fold 2 | 0.92 | 0.94 | 0.95 | 0.88 | |
| Fold 3 | 0.92 | 0.95 | 0.95 | 0.89 | |
| Fold 4 | 0.93 | 0.94 | 0.95 | 0.88 | |
| Fold 5 | 0.92 | 0.93 | 0.94 | 0.88 | |
| Mean ± SD | 0.92 ± 0.01 | 0.94 ± 0.01 | 0.95 ± 0.01 | 0.88 ± 0.01 | |
| Directional weighted YOLOv8 (proposed) | Fold 1 | 0.96 | 0.97 | 0.97 | 0.91 |
| Fold 2 | 0.96 | 0.97 | 0.97 | 0.91 | |
| Fold 3 | 0.97 | 0.97 | 0.97 | 0.91 | |
| Fold 4 | 0.96 | 0.97 | 0.98 | 0.92 | |
| Fold 5 | 0.97 | 0.97 | 0.97 | 0.91 | |
| Mean ± SD | 0.96 ± 0.01 | 0.97 ± 0.01 | 0.97 ± 0.01 | 0.91 ± 0.01 |
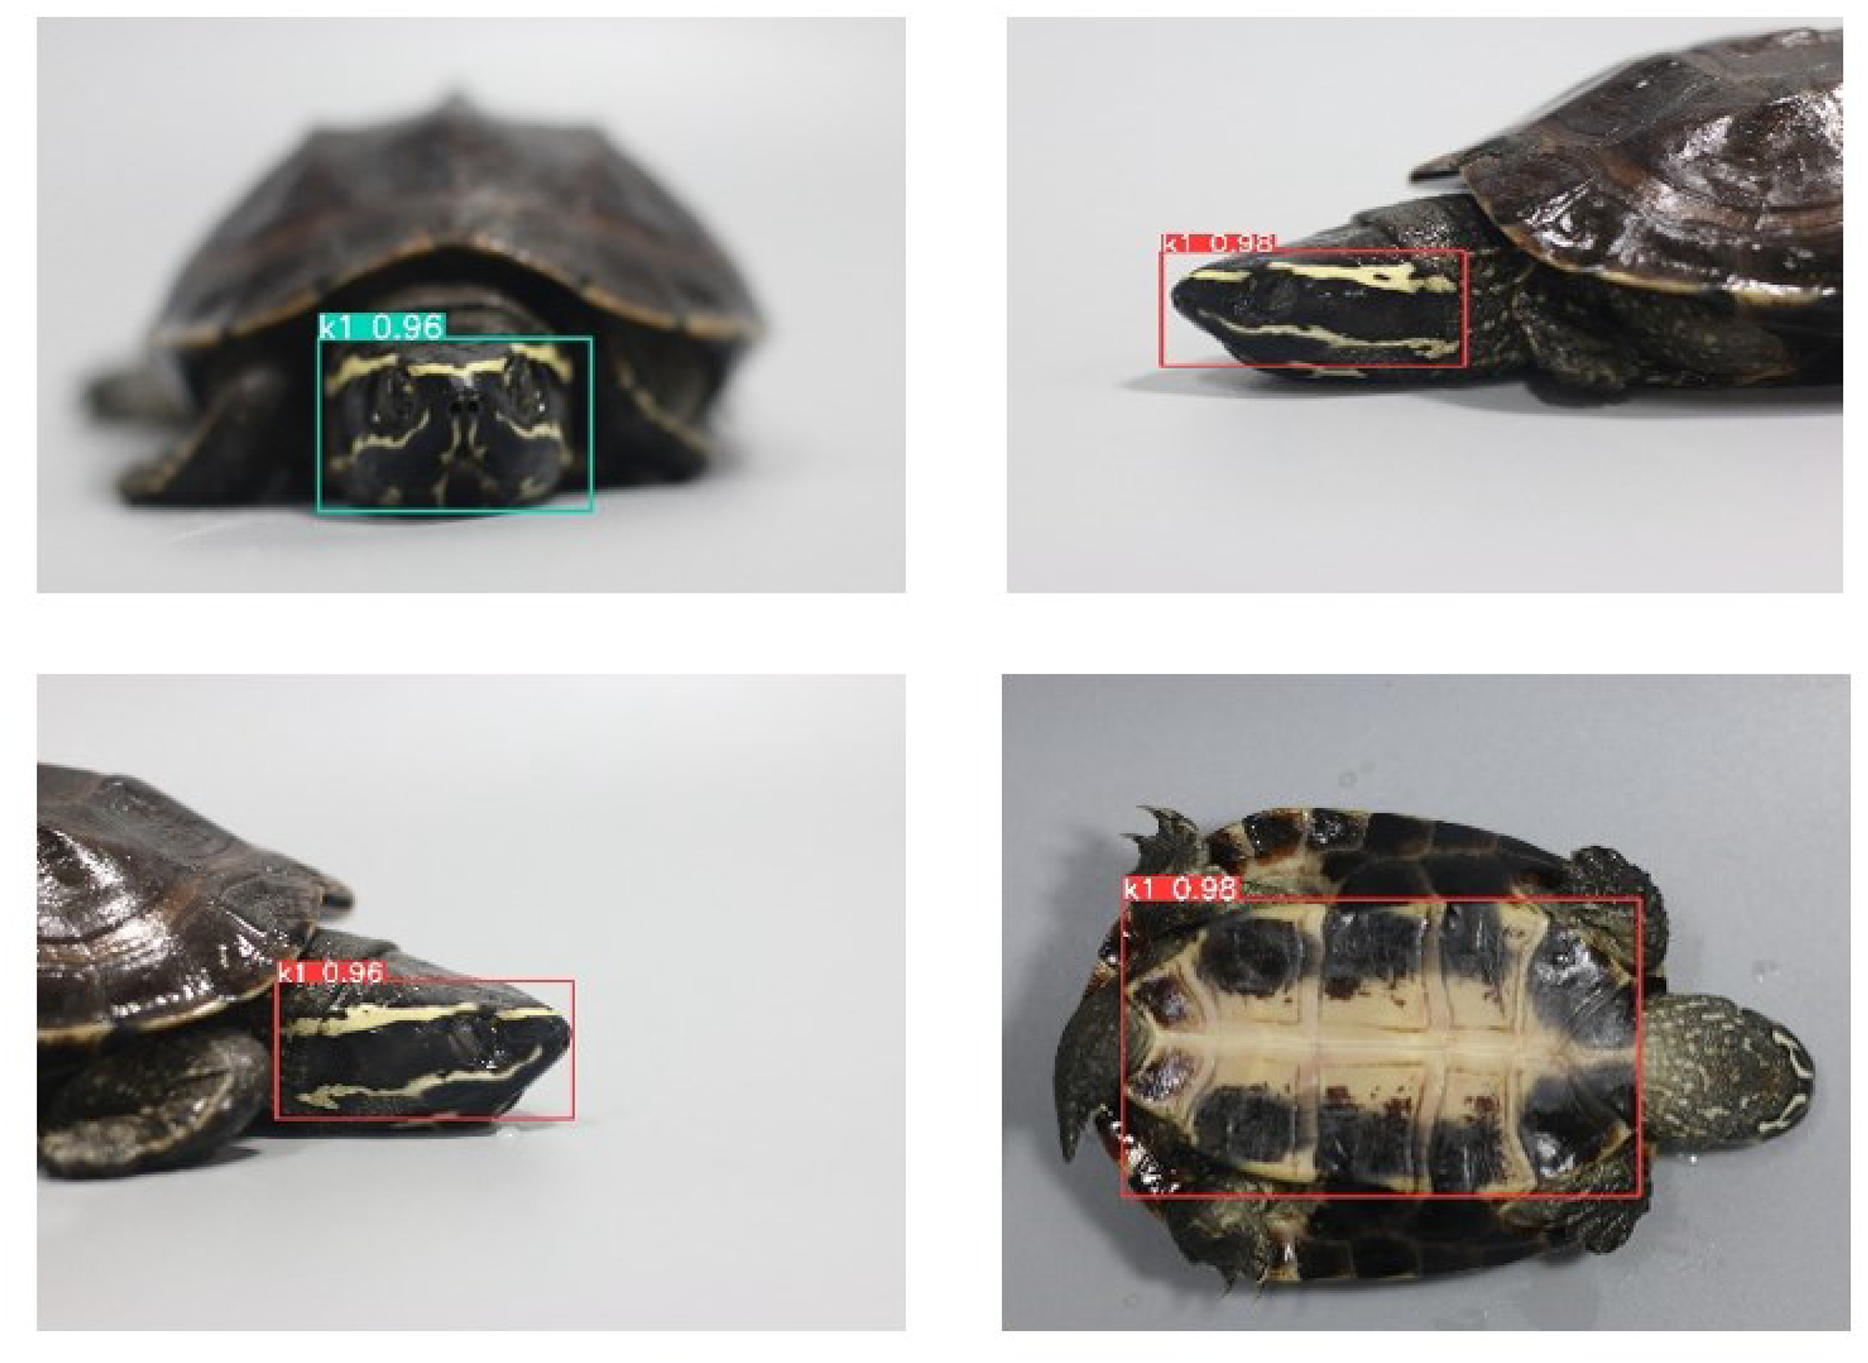
The deep results validate that our proposed method efficiently extracts features via the plastron pattern to identify and recognize each turtle. The sample turtle ID shows real-time overall recognition of features, as shown in Fig. 12.
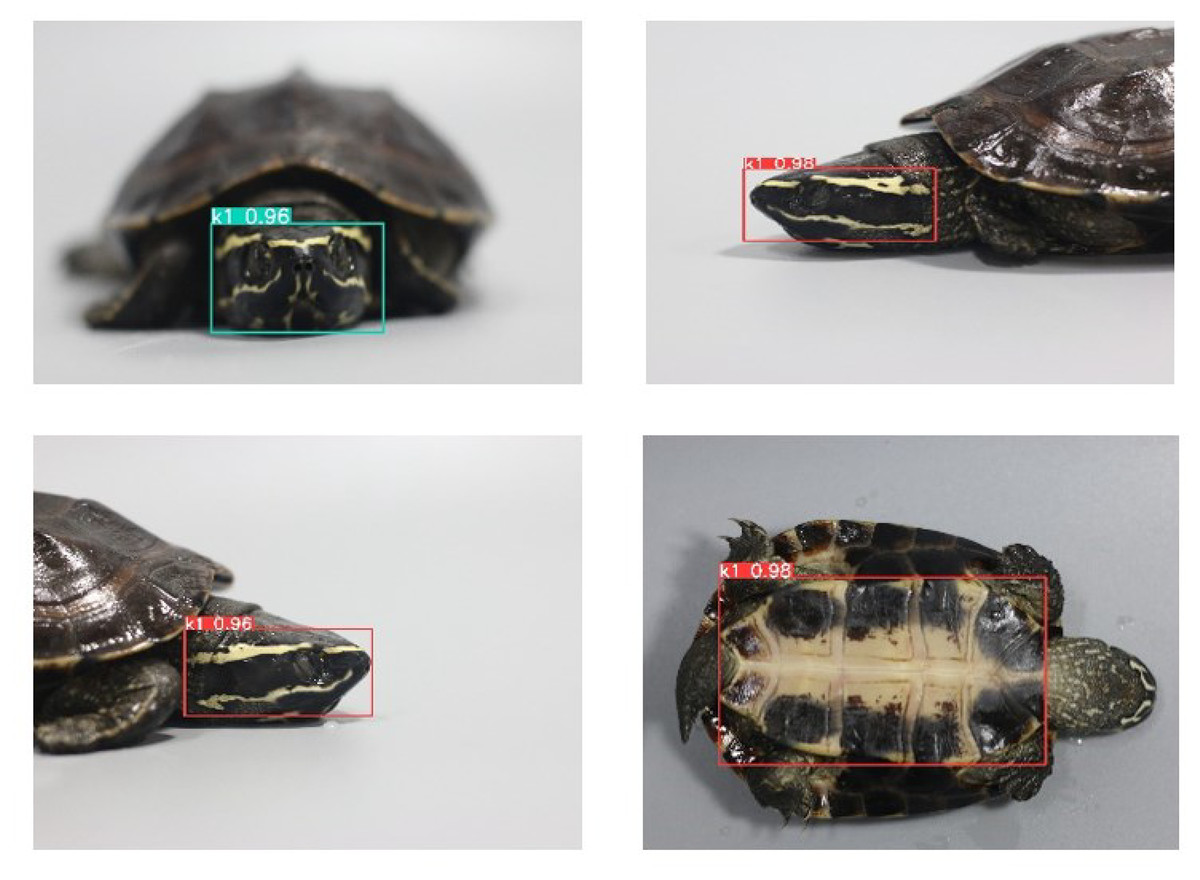
Figure 12: Real-time individual identification and recognition of Khorat snail-eating turtle (Malayemys khoratensis) using the proposed model.
Discussion
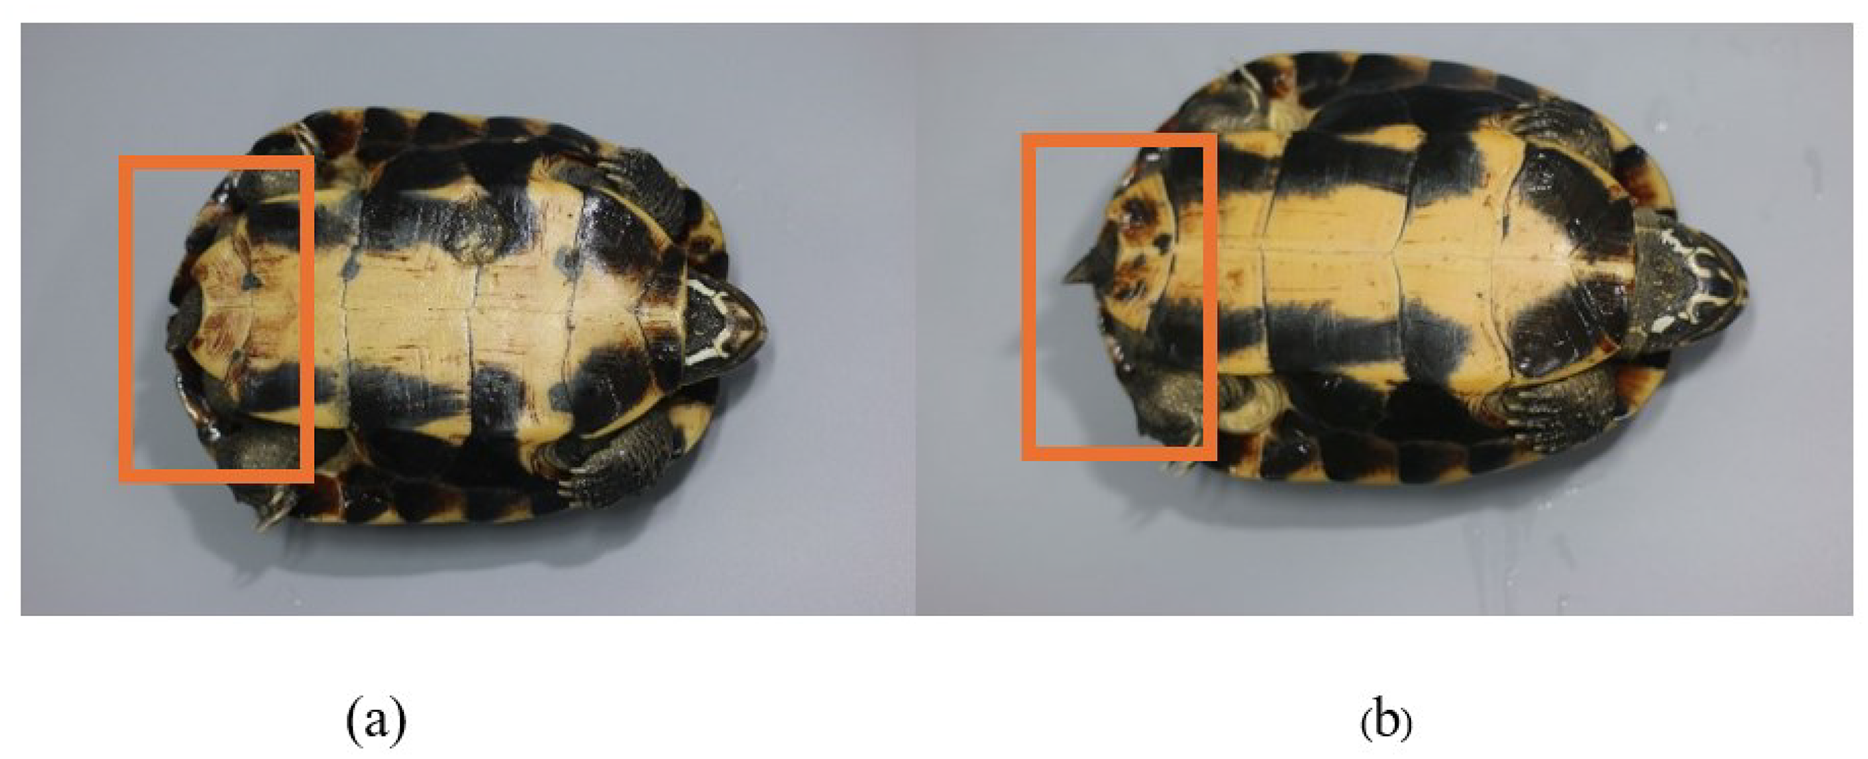
The study demonstrates the application of advanced deep learning techniques, particularly YOLOv8, in accurately identifying Khorat snail-eating (M. khoratensis). By focusing on various morphological features, including nasal stripes, infraorbital stripes, and plastron patterns, the model achieved high levels of accuracy in species and individual identification. The occurrence of false negatives, particularly in cases where turtles share similar plastron patterns near the tail region, highlights the challenges of distinguishing between individuals with closely resembling features. These results underscore the effectiveness of incorporating multiple perspectives and deep learning-based feature extraction to improve the robustness of identification systems in wildlife conservation and monitoring.
In the context of turtle identification, a false negative occurs when the system incorrectly identifies a turtle as another individual. Specifically, for Turtle ID K15, the system mistakenly identified it as Turtle ID K16. This misidentification can occur due to similarities in certain morphological features, particularly when two turtles have very similar or nearly identical patterns. For Turtle IDs K15 and K16, the false negative might have occurred because the plastron near the tail end in both turtles has certain distinct characteristics that are remarkably similar. In particular, the shape and pattern of the stripes on the plastron in the tail region of K15 resemble those of K16. Although the system typically uses various features for identification, the striking similarity in the plastron patterns between these two individuals could lead to confusion, causing the model to incorrectly identify K15 as K16 as Fig.13.
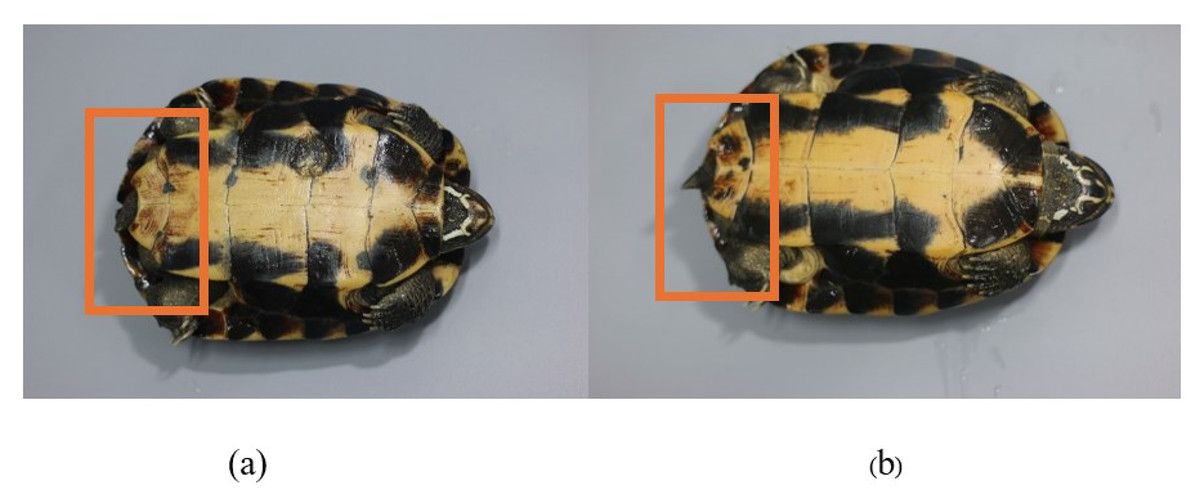
Figure 13: False negative of K15 (A) is identified as K16 (B).
Additionally, specific markings or patterns near the end of the plastron could be particularly challenging for the model if those patterns are not sufficiently distinct between different individuals. In cases where turtles share similar features in this critical area, it becomes more difficult for the model to differentiate between them, leading to a higher likelihood of false negatives. This situation underscores the importance of combining multiple perspectives and detailed feature analysis to improve the accuracy of turtle identification, especially when dealing with individuals that closely resemble morphological features.
The mark-recapture technique is critical for animal conservation and management. Researchers employ recaptures to investigate how released animals impact and influence the ecosystems around them. This involves investigating how successfully these creatures use available resources (such as water, food, and shelter) and how their presence impacts other species (predation or competition). Monitoring habitat usage through recapture can also help conservationists change ecosystems by enhancing food availability or decreasing human-wildlife conflict (Prosekov et al., 2020). However, non-invasive monitoring using deep learning techniques, such as YOLOv8, allows for recognizing individual animals based on distinct morphological characteristics. This approach leverages machine learning to identify individuals through visual markers, providing a minimally invasive way to monitor wildlife populations and track specific animals over time (Petso, JrRS & Mpoeleng, 2022; Sharma, Sato & Gautam, 2023).
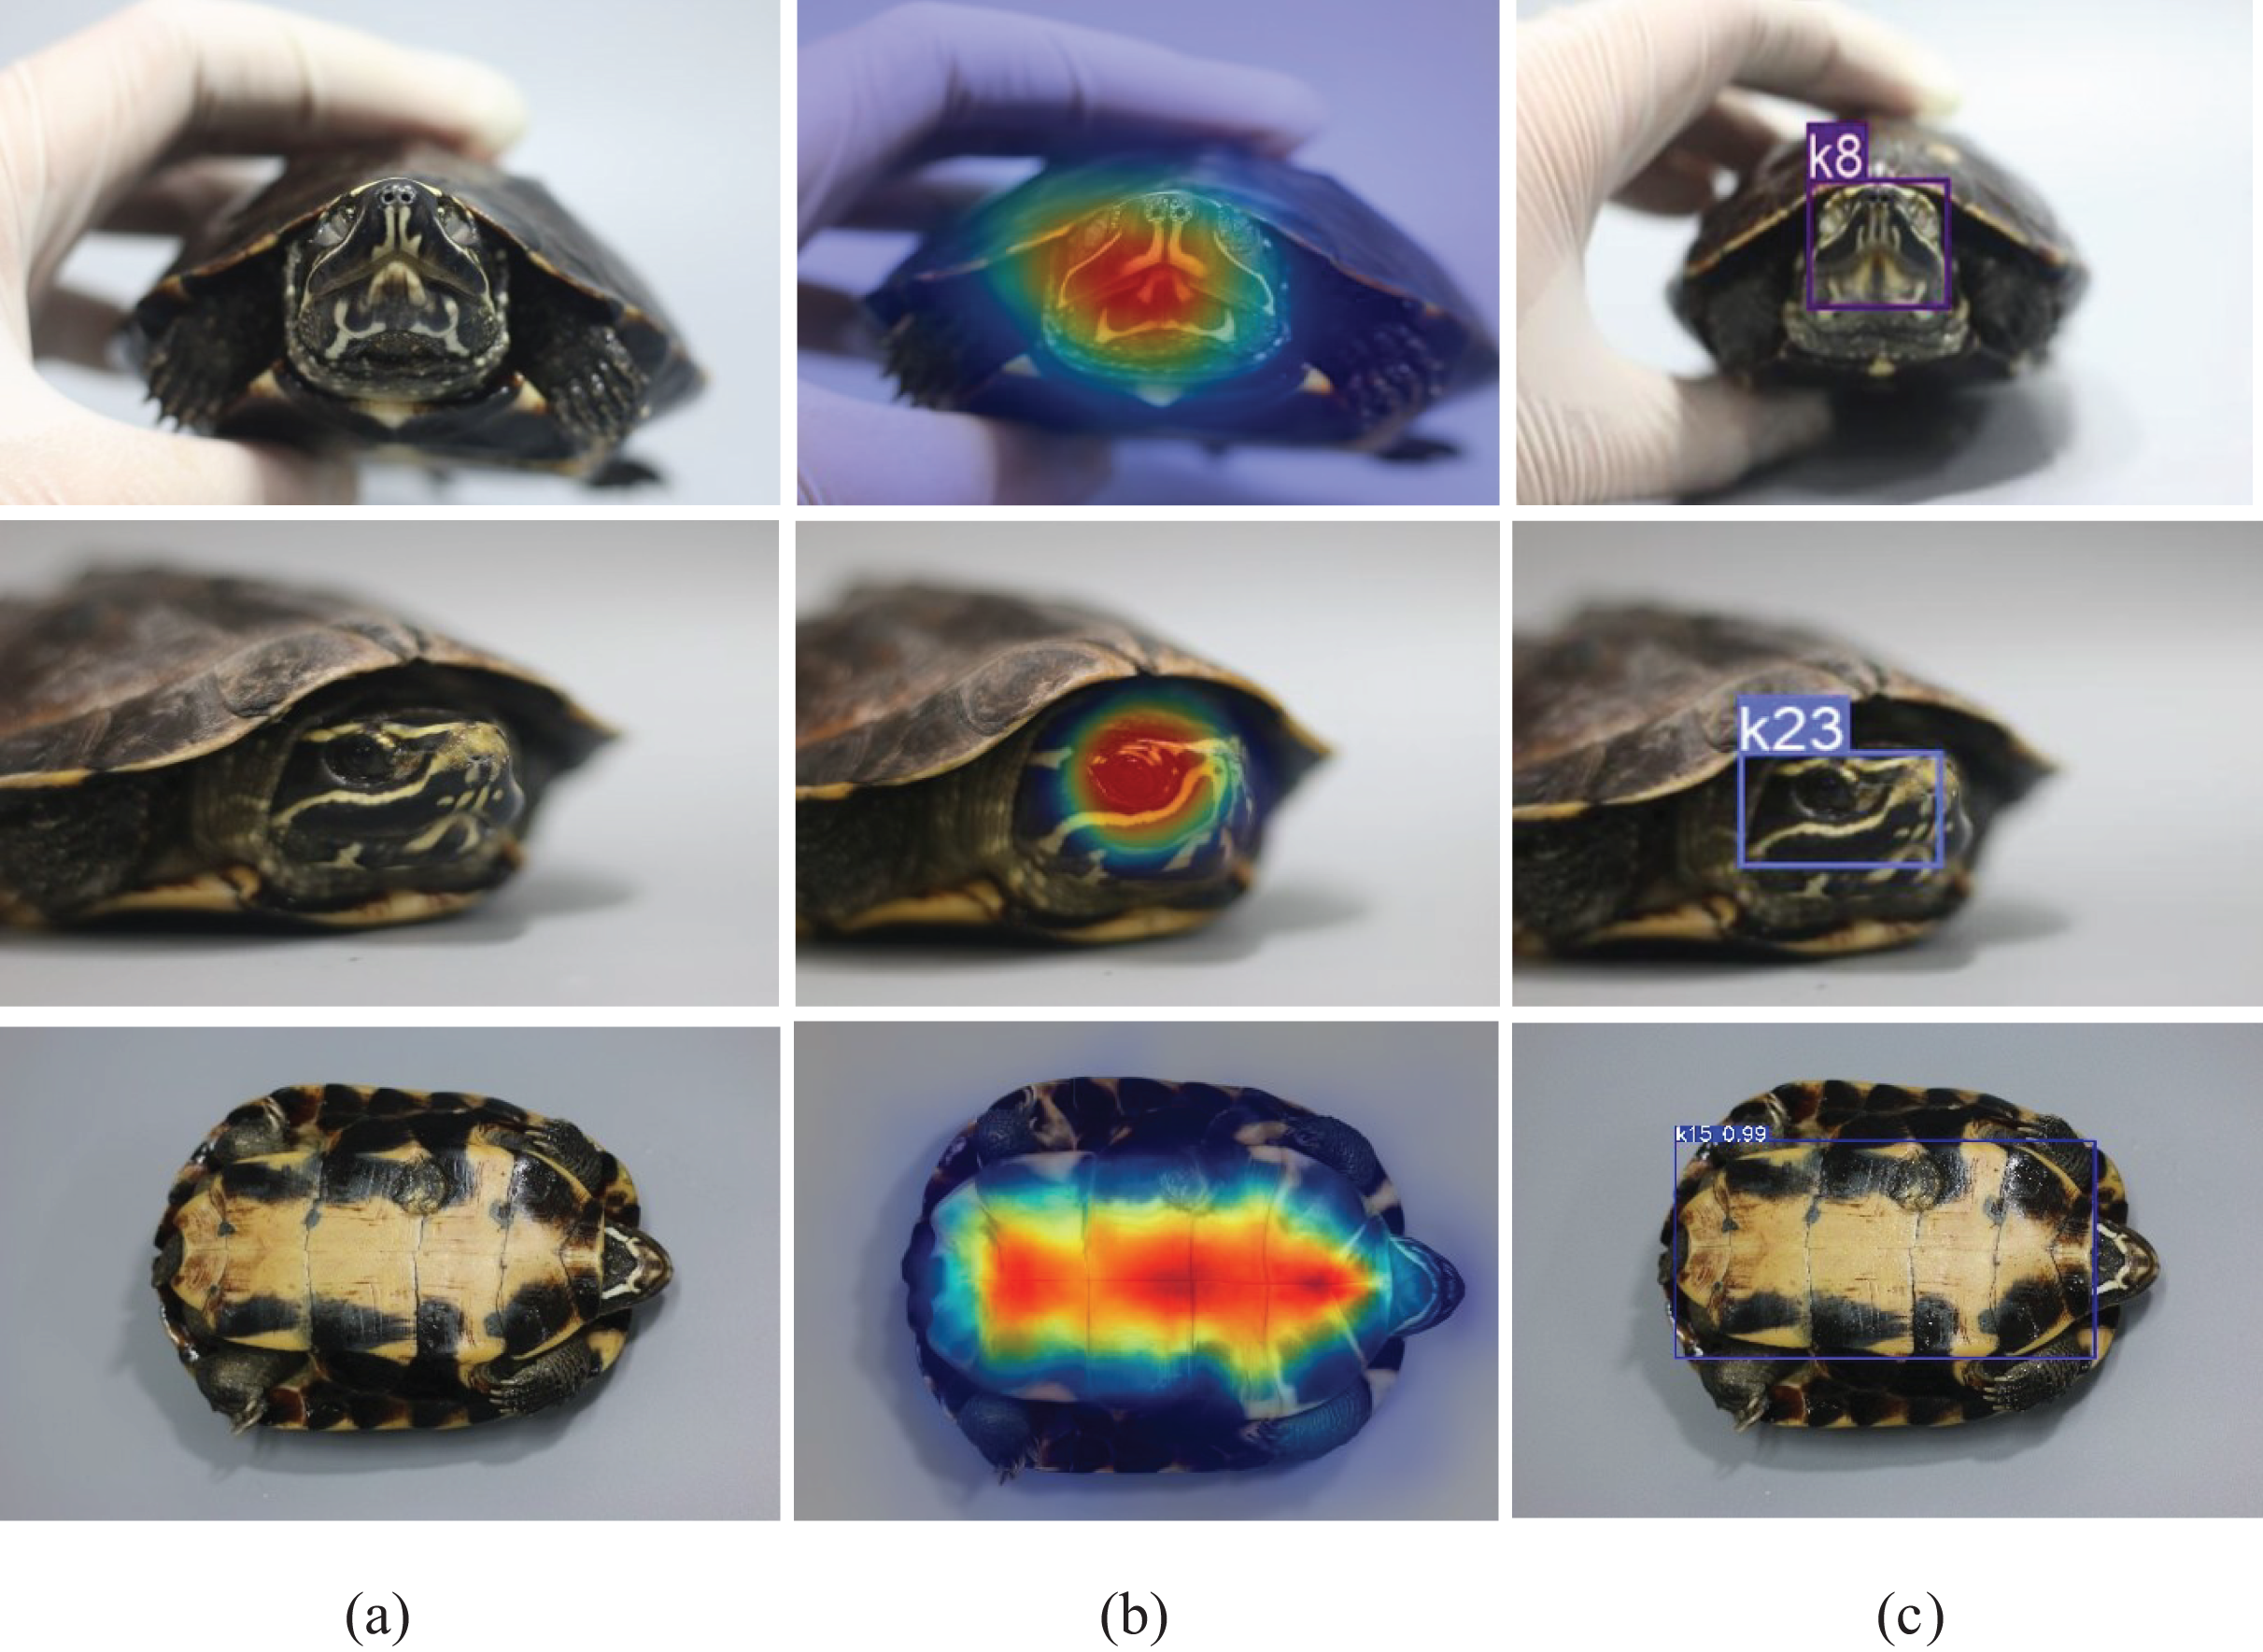
To further analyse that the model’s predictions were based on biologically meaningful visual cues, Gradient-weighted Class Activation Mapping (Grad-CAM) was applied to visualise the spatial attention of the directional weighted YOLOv8 model, as shown in Fig. 14.
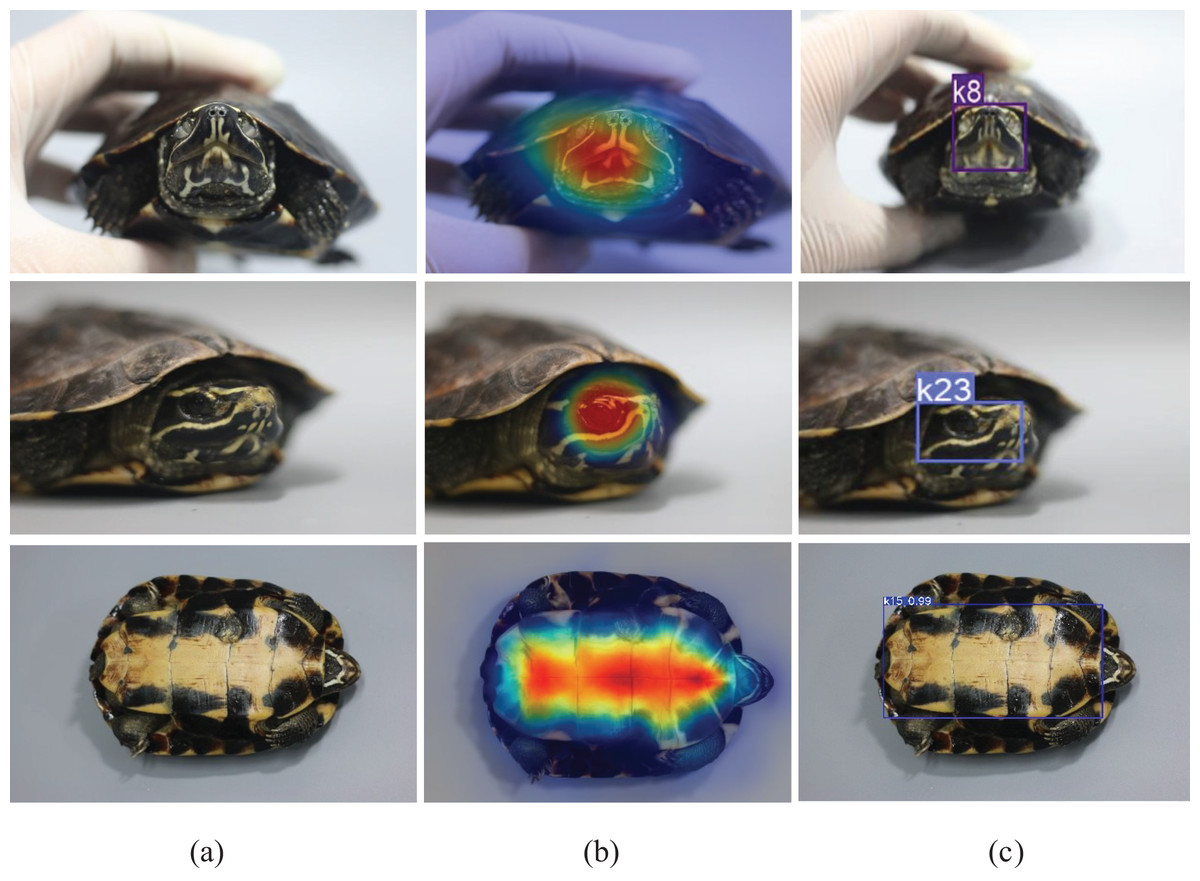
Figure 14: Grad-CAM visualization of the directional weighted YOLOv8 model across three anatomical regions of Malayemys khoratensis.
In Fig. 14, the heatmap overlays revealed that the model focused on distinctive morphological areas across all anatomical regions. In the nasal stripe (face), strong activations were observed around the symmetrical yellow nasal lines and suborbital markings, confirming reliance on consistent facial geometry. In the infraorbital stripe (side face), attention concentrated along the curved infraorbital stripe, indicating that the model captured edge continuity and side-profile contrast as key identification cues.
Notably, the plastron exhibited the most stable and well-localized activation patterns. The Grad-CAM heatmaps emphasized the central and lateral scute boundaries precisely corresponding to the geometric pigmentation patterns unique to each individual. This spatial consistency aligns with the model’s superior quantitative performance in this region (precision = 0.96, recall = 0.95, mAP@50–95 = 0.91), suggesting that the plastron provides the most precise and most reliable features for individual identification. Collectively, these findings confirm that the proposed model’s high accuracy stems from genuine morphological representations rather than background artifacts, thereby enhancing its interpretability and biological relevance.
Although the proposed model achieved superior and stable performance across all folds, several limitations remain to be addressed in future research. First, the dataset size was limited to 30 individuals and 20 photographs per turtle, which may not fully represent the variability of plastron patterns across broader populations or different age classes. Future work should include a larger dataset encompassing more individuals and environmental conditions to strengthen model generalization. Second, although cross-validation results demonstrated strong robustness (precision = 0.96 ± 0.01, recall = 0.97 ± 0.01), the model was primarily trained on images captured under controlled lighting (500–800 lux) and uniform backgrounds. Additional testing under natural field conditions where illumination, reflection, and occlusion vary would provide more realistic insights into operational reliability. Finally, although multiple observers were involved in the image acquisition process, human-induced variation was controlled within the same lab setup. Future extensions could involve community-based data collection using standardized mobile applications to evaluate inter-observer consistency under more diverse conditions.
Conclusion
In conclusion, the identification of individual turtles within the Khorat snail-eating turtle (M. khoratensis) using deep learning techniques, such as YOLOv8, shows baseline significant promise, particularly in enhancing the accuracy and efficiency of individual recognition in ecological studies. Collectively, the findings presented in the experiment demonstrate that the directional weighted YOLOv8 not only improves detection precision and recall but also exhibits superior stability across folds, underscoring its robustness and generalization capability for biological pattern recognition tasks.
However, challenges remain in accurately distinguishing between individuals with highly similar morphological features, such as closely resembling plastron patterns near the tail region. This limitation highlights the need for continued refinement of the model and the integration of additional distinguishing features to improve differentiation among similar-looking individuals, which focus on enhancing the robustness of the identification model by incorporating more advanced data augmentation techniques and exploring the use of other morphological characteristics that may provide a more significant distinction between individuals. Expanding the dataset to include a diverse range of turtles across different environments and regions could improve the model’s generalizability. The development of a real-time identification system, integrated with field-deployable technology such as mobile applications, represents a key avenue for future research. This approach would facilitate practical conservation efforts by enabling rapid, accurate identification in the field, ultimately supporting more effective ecological monitoring and protection of turtle populations.
These advancements enhance the effectiveness of turtle studies and conservation and open opportunities for application to other species in the future. However, developing these systems must also consider challenges such as operating in diverse environments, managing large datasets, and maintaining data privacy to ensure their effective and sustainable use in ongoing turtle conservation efforts. Therefore, deep learning is significant in the field of the identification of individual patterns.