
A computational approach to predicting principal discharge diagnoses for enhanced morbidity surveillance
- Published
- Accepted
- Received
- Academic Editor
- Paulo Jorge Coelho
- Subject Areas
- Algorithms and Analysis of Algorithms, Artificial Intelligence, Natural Language and Speech
- Keywords
- Discharge diagnosis, Morbidity surveillance, Natural Language Processing (NLP), Clinical data integration, ICD-10 coding, Computational health models
- Copyright
- © 2025 Arias-Garzón et al.
- Licence
- This is an open access article distributed under the terms of the Creative Commons Attribution License, which permits unrestricted use, distribution, reproduction and adaptation in any medium and for any purpose provided that it is properly attributed. For attribution, the original author(s), title, publication source (PeerJ Computer Science) and either DOI or URL of the article must be cited.
- Cite this article
- 2025. A computational approach to predicting principal discharge diagnoses for enhanced morbidity surveillance. PeerJ Computer Science 11:e3409 https://doi.org/10.7717/peerj-cs.3409
Abstract
Accurate principal discharge diagnoses are fundamental for effective morbidity surveillance, yet healthcare systems worldwide are plagued by imprecise and non-specific coding, hindering public health analysis and resource allocation. This article introduces a novel computational model designed to address this challenge by automatically predicting specific discharge diagnoses from a combination of structured and unstructured clinical data. Our approach utilizes a dual-pipeline architecture to process heterogeneous information streams. The structured data pipeline systematically extracts diagnostic indicators from laboratory results, pharmacy records, and surgical procedure codes (CUPS). Concurrently, the unstructured data pipeline employs a sophisticated multi-stage natural language processing (NLP) framework to interpret free-text radiology reports and clinical notes. This NLP pipeline first uses a fine-tuned bidirectional encoder representations from transformers (BERT) model to accurately detect and filter out negated or uncertain statements. Subsequently, a Sentence-Transformer model performs semantic similarity analysis to match affirmative clinical findings against a curated, expert-validated knowledge base of diagnostic sentences. For novel or complex cases not covered by the knowledge base, the system leverages the generative capabilities of GPT-3.5 Turbo as a fallback mechanism. The model is implemented as a scalable, service-oriented application using a MySQL database and a FastAPI framework, ensuring seamless integration with existing hospital electronic health record (EHR) systems. Performance was rigorously evaluated using a custom 0-5 scoring metric, developed in collaboration with a thoracic surgery specialist and validated by a team of three hospital epidemiologists, to assess clinical accuracy. Results demonstrate high performance in identifying both primary and secondary diagnoses, with notable success in common critical conditions like pulmonary embolism. Furthermore, the model shows significant potential for scalability, as performance on rare conditions such as epidural hematoma improved substantially with the addition of only a few expert-defined diagnostic patterns. This open-source computational tool offers a robust and economically viable solution for healthcare institutions to enhance the precision of their diagnostic coding, thereby improving the quality of morbidity data without requiring disruptive changes to established clinical workflows.
Introduction
Healthcare organizations play a crucial role in maintaining public health by analyzing disease prevalence and mortality trends (Moon et al., 2023). Discharge diagnoses are essential for post-hospitalization treatment and for understanding morbidity patterns within populations (Bansal, Pourbohloul & Meyers, 2006). This study develops a computational model to optimize accuracy and efficiency in discharge diagnoses. Unlike traditional rule-based systems, this model integrates machine learning and natural language processing (NLP) to interpret both structured and unstructured data, enhancing predictive capability and clinical adaptability (Berner, 2007).
The sheer volume of inaccurate codes generated across global healthcare systems highlights profound systemic failures in personnel, processes, and technology. For instance, in a South African hospital relying on untrained staff, a staggering 73.7% of primary diagnosis codes were incorrect when compared to a manual review (Daniels et al., 2021). Similarly, a Saudi Arabian study identified a 26.8% inaccuracy rate for principal diagnosis codes, directly linking errors to coder experience (Albagmi et al., 2024). The quality of clinical documentation is a massive contributor, with one Chinese study attributing a remarkable 89.9% of all coding errors to poor-quality discharge summaries (Xu et al., 2024). Even systemic changes in well-resourced nations create widespread problems; the transition to ICD-10 in the US led to 47% of common code clusters showing abrupt, unpredictable usage, demonstrating a fundamental lack of consistent application (Nelson et al., 2024). While physician-coder collaboration has been shown to improve accuracy, the baseline level of error remains exceptionally high (Xu et al., 2024).
Inaccurate coding is not just about incorrect codes, but also massive data omission. In lower-resourced settings, the problem is compounded by severe under-coding; the South African study revealed that administrative systems captured a median of only one diagnosis per patient, whereas a detailed folder review showed a median of three, meaning two-thirds of patient conditions were simply not documented (Daniels et al., 2021). Even in technologically advanced systems like the US Veterans Affairs, electronic health records (EHRs) fail to ensure consistency, with coding practices varying dramatically across different medical centers (Nelson et al., 2024). This indicates that technology alone cannot solve the problem. The financial consequences of these inaccuracies are also substantial. A study in Saudi Arabia quantified a direct financial loss of over $3,400 USD from miscoding in just a sample of 750 cases, a problem exacerbated in systems without direct financial incentives for accuracy (Albagmi et al., 2024; Daniels et al., 2021). Ultimately, the high volume of inaccurate and missing codes demonstrates that system effectiveness hinges on a combination of adequate staff training, robust clinical documentation, and supportive workflow models.
This challenge is not merely a global phenomenon but is reflected in the internal data of the S.E.S. Hospital Universitario de Caldas. The institution’s 2023 Morbidity Profile Report reveals that among the most frequently recorded diagnoses are vague and non-specific categories. For example, across multiple services, including hospitalization and emergency care, diagnoses such as ‘Abdominal and pelvic pain’ (R10), ‘General signs and symptoms’ (R50-R69), and ‘Other factors influencing health status and contact with health services’ (Z00-Z99) are highly prevalent. While these codes are valid for initial encounters, their persistence as principal discharge diagnoses limits their utility for epidemiological surveillance, resource allocation, and accurate assessment of the institutional disease burden. This underscores a local need for systems that can help refine these general classifications into more precise and actionable diagnostic information.
The diagnosis of a patient at discharge plays a critical role in their medical journey, as it significantly influences their ongoing treatment and care after leaving a healthcare facility. Accurate discharge diagnoses are essential to ensure continuity of care and optimize patient outcomes. This diagnosis, reflecting your health status upon release, is vital for a smooth transition from hospital to home or other care environments. Importantly, by analyzing discharge diagnoses in a population, healthcare institutions can gain valuable insight into morbidity and mortality trends, helping them identify areas for improvement in patient care and public health.
In this research context, an inducer is a specific piece of information or indicator extracted from the medical record that is highly likely to be related to a specific diagnosis. Examples of inducer include high troponin in a laboratory test to indicate acute myocardial infarction, or the administration of antineoplastic drugs in pharmacy records to suggest cancer diagnoses. These inducers are essential to streamline the process of digitizing discharge diagnosis.
We defined diagnostic inducers using data from the S.E.S Hospital Universitario de Caldas (SES-HUC), including laboratory tests, pharmacy records, radiological reports, and surgical procedures. While SES-HUC information served as the basis for this case, the methodology is designed to be applicable to multiple institutions. This is because it relies on standardized information, such as CUPS codes, which are widely used across Colombia, as well as plain text that can encompass diverse clinical data from various sources.
These inducers form the basis of a computational model designed to suggest accurate discharge diagnoses of patients. By combining the power of artificial intelligence and machine learning, the system is intended to provide healthcare professionals with an efficient and accurate tool to streamline the diagnostic process and generate informed recommendations at patient discharge. In doing so, the program not only facilitates medical decision-making but also contributes to obtaining morbidity and mortality profiles, allowing for a better understanding and management of population health across different healthcare institutions.
Morbidity and mortality
Morbidity and mortality are two critical indicators that provide information on the health status of populations. While morbidity refers to the prevalence of diseases and health conditions, mortality refers to death rates within specific populations. Together, these indicators offer a comprehensive view of the health challenges facing communities, regions, and nations.
A study titled “Enhancing corporate readiness for and resilience to future public health threats” underscores the critical role of public health in ensuring a robust economy and promoting social justice (Garfield et al., 2023). As the world grapples with health challenges, from chronic diseases to pandemics, population health becomes a central driver of economic and social well-being.
The landscape of morbidity and mortality is further complicated by external factors. For example, the correlation between COVID-19 morbidity and mortality rates and local population density in Japan suggests that environmental and demographic factors play a crucial role in health outcomes (Kodera, Rashed & Hirata, 2020). These findings emphasize the need for a multidimensional approach to public health, considering not only medical but also socio-environmental determinants of health.
At the global level, the World Health Organization (WHO) has conducted extensive research on the global burden of diseases and injuries. In its report ‘WHO methods and data sources for global burden of disease estimates 2000–2019’, the World Health Organization underscores the need for a consistent and comparable description of the burden of diseases and injuries, as well as the risk factors that cause them (Cao et al., 2020). This information is essential to understand the main health threats in different regions and populations. According to this study, the top 10 causes of death in 2019 are ischemic heart disease, stroke, chronic obstructive pulmonary disease, lower respiratory infections, neonatal diseases, tracheal, bronchus and lung cancers, Alzheimer’s disease and other dementias, diarrheal diseases, diabetes mellitus, kidney diseases.
The utilization of computational methods to predict diagnosis codes from clinical records is an active area of research. For instance, various deep learning models have been proposed to assist physicians in the International Classification of Diseases (ICD) coding process by analyzing clinical notes (Masud et al., 2023). These approaches often leverage unstructured text from sources like outpatient department notes to automatically generate code predictions (Masud et al., 2023). Similarly, other studies have focused on assigning diagnosis codes from discharge summaries, treating it as a multi-label classification problem over a vast number of potential codes (Perotte et al., 2014). Beyond just coding, Clinical Decision Support Systems (CDSS) are being developed to classify a wide range of diseases by applying various machine learning classifiers to medical data (Singh & Mantri, 2024a, 2024b). A key challenge in this area is handling the uncertainty and vagueness inherent in clinical data, which some researchers address through feature selection techniques like Rough Set Theory (RST) before classification Singh & Mantri (2024b, 2024c). Moreover, to improve predictive accuracy, ensemble learning methods are often employed, as seen in the prediction of stroke risk from demographic data (Swarnkar et al., 2023).
In the Colombian context, the “Health Situation Analysis (ASIS) Colombia, 2021” provides a detailed overview of the health situation in the country (Castrillón et al., 2021). According to this report, mortality from cerebrovascular disease in Colombia has had an increasing trend between 2012 and 2019. In 2012, mortality was 29.22 cases per 100,000 inhabitants and in 2019, there were 32.2 cases per 100,000 inhabitants. In the Caldas department, 1,562 cases of cerebrovascular disease mortality were registered in 2019. At the national level, diseases such as arthritis, asthma, cancer, diabetes, and Chronic Obstructive Pulmonary Disease (COPD) also represent significant challenges for public health.
Understanding the leading causes of mortality and morbidity is crucial for designing effective health interventions. Global and local data provide a comprehensive perspective on health challenges, enabling proactive responses to emerging threats. These statistics serve as a reference for our model, as the data generated by the software may partially reflect general population diseases with variations due to the specific population served by SES-HUC.
Methodology
This section outlines the technical architecture and implementation of the diagnostic prediction model, focusing on its handling of structured and unstructured clinical data. An effective prediction model must ingest, interpret and act on various data inputs.
In Fig. 1, each pipeline transforms raw data into actionable diagnostic insights that are then integrated to generate discharge recommendations.
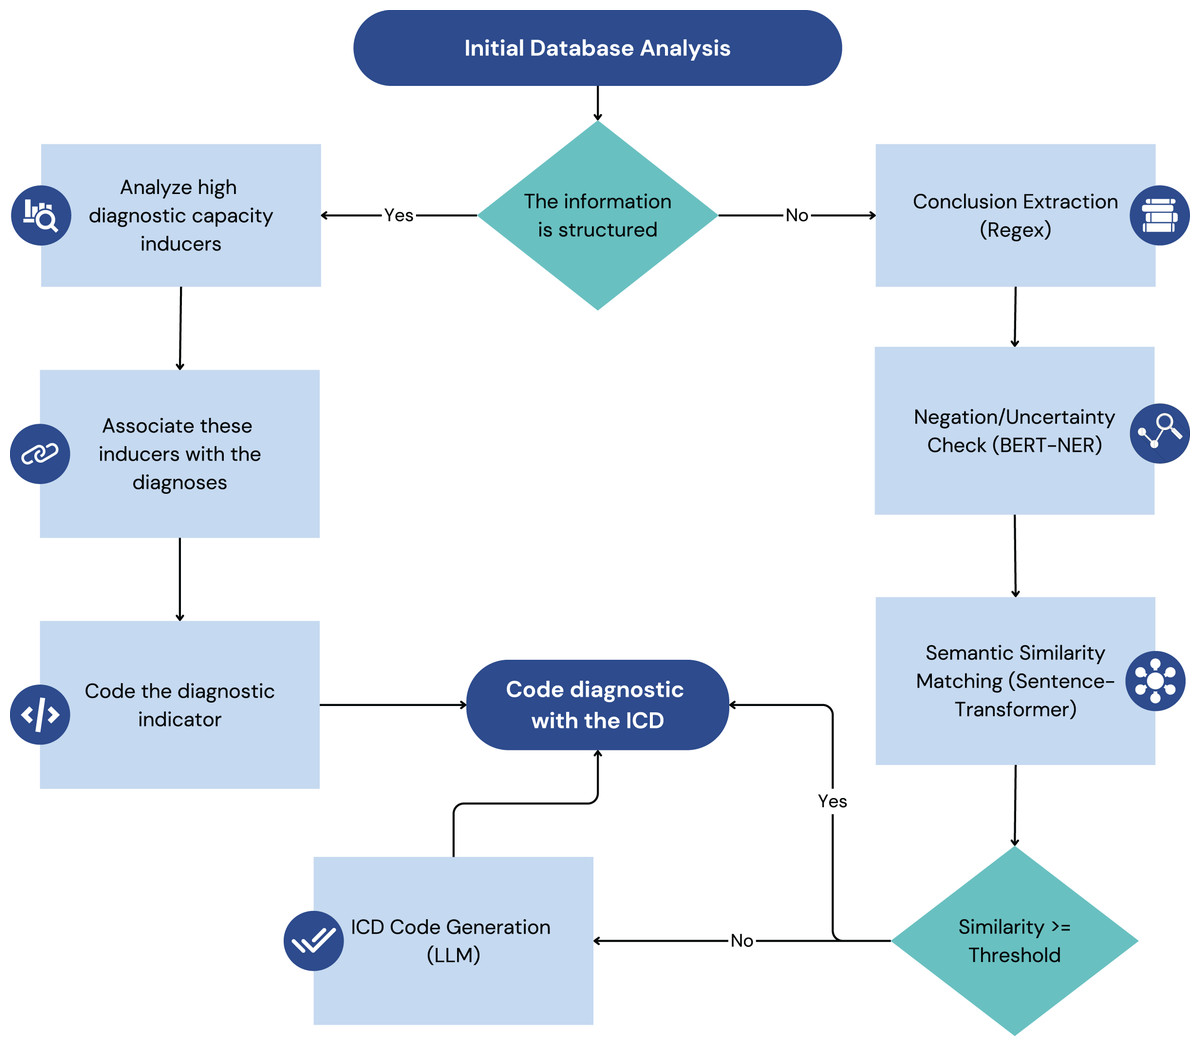
Figure 1: Illustrates the two main data processing pipelines of the model: the structured data pipeline (left) and the unstructured data pipeline (right).
Structured data refers to information that is organized in a predefined format, typically within relational databases, and adheres to a specific data model. Examples in the healthcare domain include coded diagnoses, laboratory results, medication lists, and vital signs recorded in EHRs. The standardized nature of structured data allows for relatively straightforward querying, retrieval, and analysis.
Unstructured data, on the other hand, lack a predefined format and are more difficult to directly process using traditional database techniques. In healthcare, the most common form of unstructured data is plain text found in clinical notes, radiology reports, discharge summaries, and other narrative documents. This text often contains crucial information about the condition, medical history, and course of treatment of a patient that is not captured in structured fields. Deriving meaningful insights from unstructured data requires more sophisticated techniques, such as NLP.
The model under consideration is designed to take advantage of structured and unstructured data to provide comprehensive and context-sensitive clinical decision support. The following subsections outline the distinct processing pipelines for each data type, illustrating how the system transforms raw data into actionable insights. The architectural diagram in Fig. 1 visually represents these two processes, highlighting the key components and data flow involved in each.
This dual-pipeline approach, processing both structured and unstructured data, is crucial for comprehensive analysis. The structured data pipeline leverages clinical laboratory findings, which have been effectively used in other studies to predict infections like COVID-19 using algorithms such as Nu-Support Vector Machine (Nu-SVM) and Logistic Regression (Swarnkar et al., 2023). Demographic and other structured clinical data are also foundational for models predicting stroke risk (Swarnkar et al., 2023). For the unstructured data pipeline, this work builds on a rich field of prior research. Previous work has demonstrated the utility of applying NLP techniques to unstructured clinical notes, such as SOAP (subjective, objective, assessment, and plan) notes, to predict ICD-10 codes with notable success in specific departments like cardiology (Masud et al., 2023). The analysis of discharge summaries has also been a focus, with models being trained to handle the complexity of free-text medical narratives (Perotte et al., 2014).
This research leverages four distinct databases provided by the SES-HUC to develop and validate an artificial intelligence (AI)-powered model to generate discharge diagnoses. These databases, each with its unique structure and content, provide a rich source of information to identify and evaluate diagnostic inducers.
Data sources
The foundation of this research lies in the utilization of four key databases:
Laboratory database: This database contains a comprehensive record of all clinical laboratory tests performed at the hospital. It allows for the identification of patients who underwent specific tests and their corresponding results, allowing the extraction of diagnostic inducers based on test types and outcomes.
Pharmacy database: This database contains detailed information on medications administered to patients. By identifying drugs used to treat specific conditions, we can establish associations between medications and possible diagnoses, further enriching our pool of diagnostic inducers.
Surgical Description database: This database contains data and detailed descriptions of surgical procedures performed at the hospital. Analyzing these descriptions helps link procedures to specific diagnoses, offering insights into patient conditions and potential health outcomes.
Radiological Report database: This database contains reports generated by radiologists based on their analysis of medical images. These reports, rich in clinical information, offer valuable diagnostic inducers by associating radiological findings with potential diagnoses.
Structured data processing pipeline
The structured data processing pipeline is a crucial component of the model, responsible for handling data from sources where information is organized in a pre-defined format, typically within relational databases. This pipeline focuses on extracting, transforming, and loading (ETL) clinical data from these structured sources into a standardized format suitable for the model’s inference engine, as illustrated on the Fig. 1. The primary focus is on three main types of structured data: laboratory data, pharmacy data, and surgical procedure data. By systematically processing this data, the pipeline ensures that the model has access to accurate and well-organized clinical information, enabling it to provide effective decision support.
Laboratory data
This stage extracts key diagnostic indicators, or “Inducers,” from laboratory tests. Identified with the project’s medical advisor, these inducers are specific tests and results strongly linked to particular diagnoses. Each inducer is mapped to its diagnosis using ICD-10 and ICD-11 codes for standardization. We use the SES-HUC database’s laboratory test codes and predefined limits to classify results into four categories: Normal, Pathologic, and Pathologic Over/Under for tests exceeding or falling below limits. The pipeline stores all values but only uses tests with a high probability of indicating a specific pathology, as determined by medical evaluation.
Pharmacy data
Pharmacy data processing centers on extracting pharmacological inducers—medications linked to specific diagnoses. Existing internal medication codes within the institution’s system are used to establish these links, again employing ICD-10 and ICD-11 codes for diagnosis standardization. The processed data, including inducers and their associated ICD codes, are stored in the model’s knowledge base. The medical advisor validates the accuracy of medication-diagnosis associations.
Surgical procedure data
The handling of surgical procedure data depends on its structure. Structured data likely uses the Clasificación Única de Procedimientos en Salud (CUPS) coding system. The pipeline links CUPS codes (procedures) with ICD codes (diagnoses), maintaining a separate database table for this association. Unstructured surgical data (e.g., plain text) requires NLP to extract procedure or CUPS codes, as detailed in the Unstructured Data Processing section. Validation for structured data involves confirming CUPS-ICD mappings, while unstructured data validation focuses on the accuracy of NLP-based extraction.
Unstructured data processing pipeline
The unstructured data processing pipeline handles clinical information that lacks a pre-defined format, primarily focusing on textual data found in sources like radiology reports and clinical transcriptions within the EHR. This pipeline employs NLP techniques to extract meaningful insights from this unstructured text, ultimately aiming to identify potential diagnoses and link them to standardized ICD codes. Figure 1 (right side) provides a visual representation of this pipeline.
The processing of unstructured text is a critical component for diagnostic prediction. Methodologies in this domain have evolved from keyword mapping to more sophisticated deep learning architectures. For example, the use of a convolutional neural network (CNN) has proven effective in predicting ICD-10 codes directly from the text of medical records (Masud et al., 2023). These models can identify missing diagnosis codes, thereby helping to ensure the completeness of the patient’s record (Masud et al., 2023). The successful application of these models often depends on robust feature selection to handle the high dimensionality of text data. In this context, techniques like Rough Set Theory (RST) have been used to select highly relevant and non-redundant features from medical data before applying classifiers such as Decision Trees or K-Nearest Neighbors (Singh & Mantri, 2024a). Other intelligent systems use association rules to predict diseases even from incomplete symptom sets, which is particularly relevant for unstructured text where information may be sparse (Singh & Mantri, 2024c).
Text extraction
The initial step involves extracting the relevant textual data from its source. In this case, the primary sources are radiology reports and clinical transcriptions documented within the EHR system. This extraction process may involve utilizing system APIs or other data extraction tools to retrieve the raw text.
Conclusion extraction from radiology reports
Given that the conclusion section of radiology reports often summarizes key findings and potential diagnoses, the next step focuses on isolating this specific section. Regular expressions are employed to identify and extract the conclusion from each radiology report based on characteristic patterns and keywords that typically delineate this section.
Sentence segmentation
The extracted conclusion text (and potentially other relevant sections from clinical transcriptions) is then segmented into individual sentences. This is a crucial step for subsequent processing, as many NLP models operate at the sentence level. Standard sentence segmentation algorithms or libraries can be used for this purpose.
Negation and uncertainty detection
To ensure the accuracy and reliability of the extracted information, a specialized bidirectional encoder representations from transformers (BERT) model is employed to identify and filter out sentences containing negation or uncertainty. This model, based on the work of Pabón et al. (2022), has been fine-tuned on the project’s specific dataset to enhance its performance in this particular clinical context. Sentences flagged as containing negation (e.g., “no evidence of fracture”) or uncertainty (e.g., “possible pneumonia”) are deemed unsuitable for direct diagnosis identification and are excluded from further processing.
Semantic similarity analysis for diagnosis identification
The remaining sentences, presumed to express affirmative clinical findings, are then analyzed for potential diagnoses using a Sentence-Transformer model. This model calculates the semantic similarity between each sentence and a curated set of sentences known to be associated with specific diagnoses. A similarity threshold of 80% is used to determine whether a given sentence is sufficiently similar to a known diagnostic statement to be considered indicative of that diagnosis. This threshold was established following initial testing across approximately 30 samples of surgical procedures and radiological reports, which demonstrated that an 80% similarity threshold effectively identifies diagnostically similar statements while capturing negated findings. The latter are subsequently addressed in a separate processing step, validating the selected threshold as optimal for the diagnostic pipeline.
ICD code generation with generative LLM
In cases where no sentences in the dataset achieve the 80% similarity threshold with the pre-curated diagnostic sentences, a generative Large Language Model (LLM) is employed. This LLM is prompted to generate potential ICD codes based on the clinical information presented in the sentence. This step acts as a fallback mechanism to ensure that even novel or less common clinical presentations can be linked to standardized diagnostic codes.
Validation
Validation of both pipeline is crucial to ensure the accuracy and reliability of the extracted diagnostic information. A two-pronged approach is employed, involving both expert medical knowledge and a quantitative scoring metric.
Evaluating the performance of automated coding systems requires robust metrics. Standard metrics such as accuracy, precision, recall, and F1-score are commonly used across the healthcare domain to measure the performance of machine learning models in predicting diagnosis codes and classifying diseases (Masud et al., 2023; Singh & Mantri, 2024a, 2024b). However, given the hierarchical structure of diagnostic codes like ICD-9 and ICD-10, novel evaluation metrics have been proposed to account for the semantic distance between the predicted and the actual codes within the code tree (Perotte et al., 2014). These hierarchical metrics can differentiate between a prediction that is a near-miss (e.g., a child code of the correct parent) and one that is in a completely different category, offering a more nuanced assessment of a model’s clinical utility.
Predefined diagnosis-inducer associations
In the first stage, the medical advisor establishes a set of predefined associations between specific clinical inducers (extracted from both structured and unstructured data) and their corresponding diagnoses, coded using ICD-10 and ICD-11. This set serves as a gold standard for evaluating the performance of the pipeline in identifying diagnoses from unstructured text. The inducers will be selected from all the dataset processed before.
Diagnosis correctness scoring metric
The second stage involves developing and applying a quantitative metric to assess the correctness of the diagnoses generated by the pipeline. This metric assigns a score from 0 to 5 based on a set of predefined rules, with higher scores indicating greater accuracy. The scoring system was initially proposed by co-author Oscar Jaramillo, a medical specialist in thoracic surgery, ensuring its clinical relevance. The rules are as follows:
Score 0: The diagnosis is completely incorrect.
Score 1: The diagnosis is incorrect but belongs to the same organ group (e.g., suggesting a larynx problem for a pharynx condition).
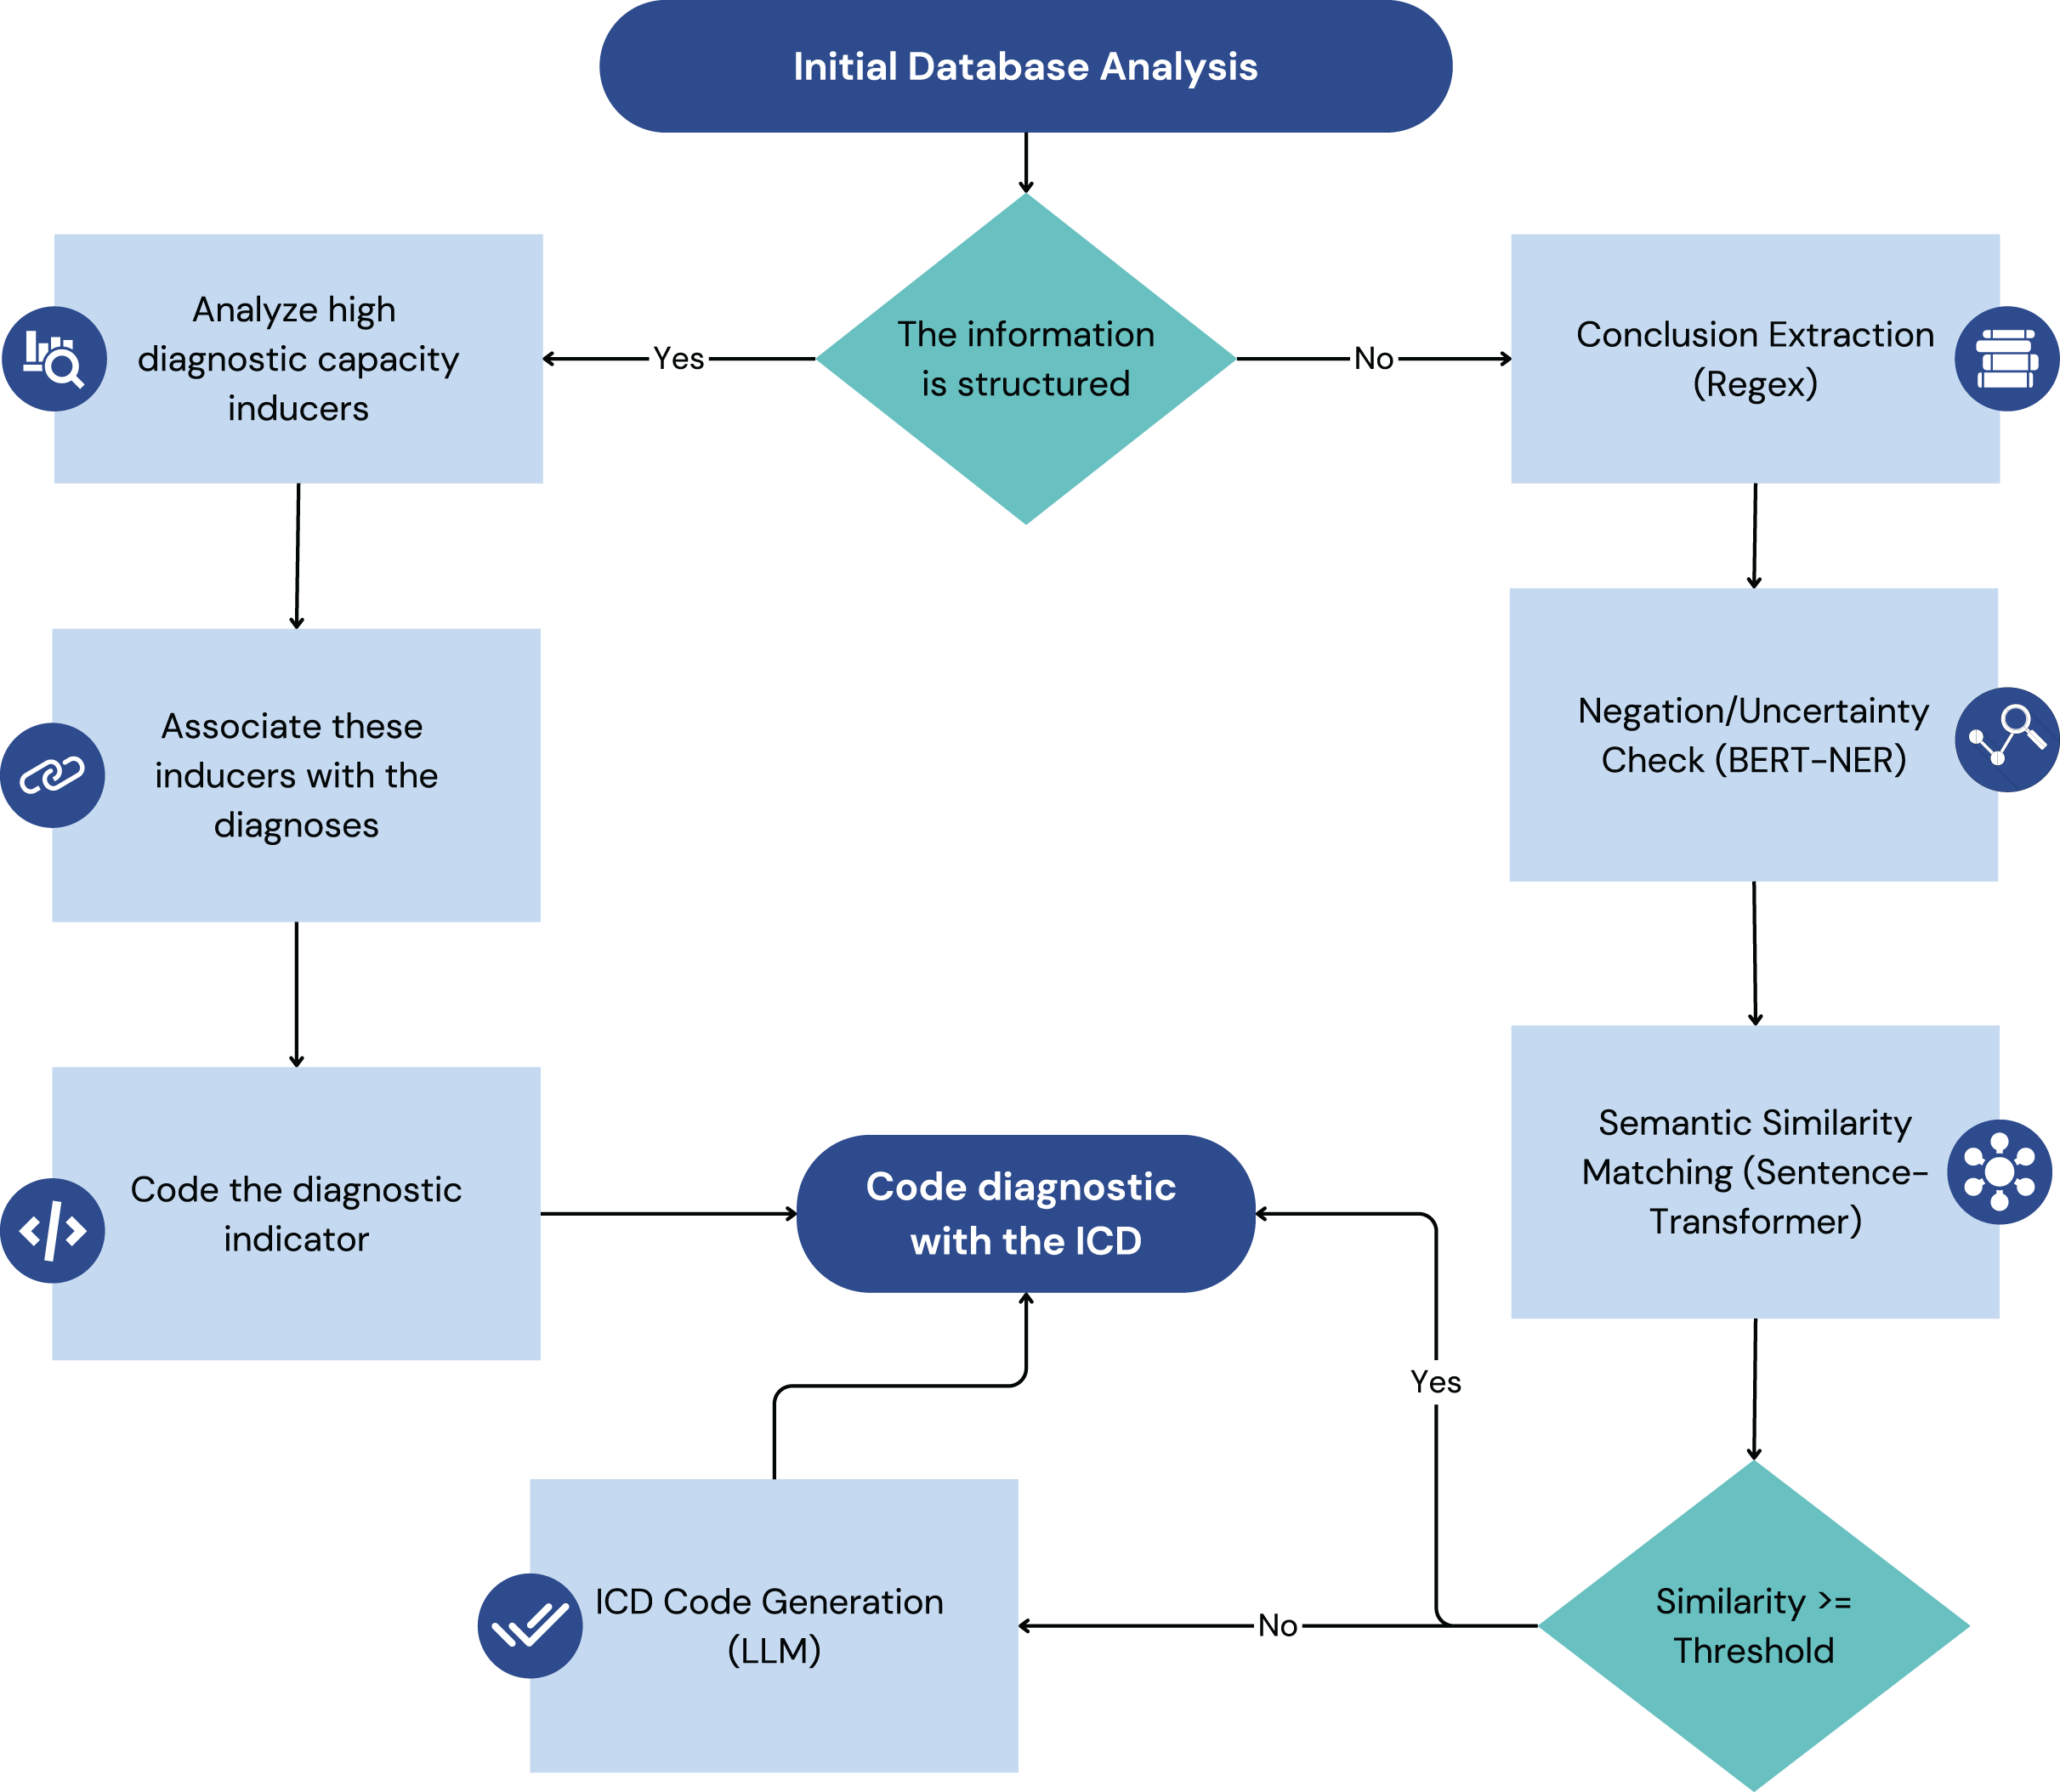
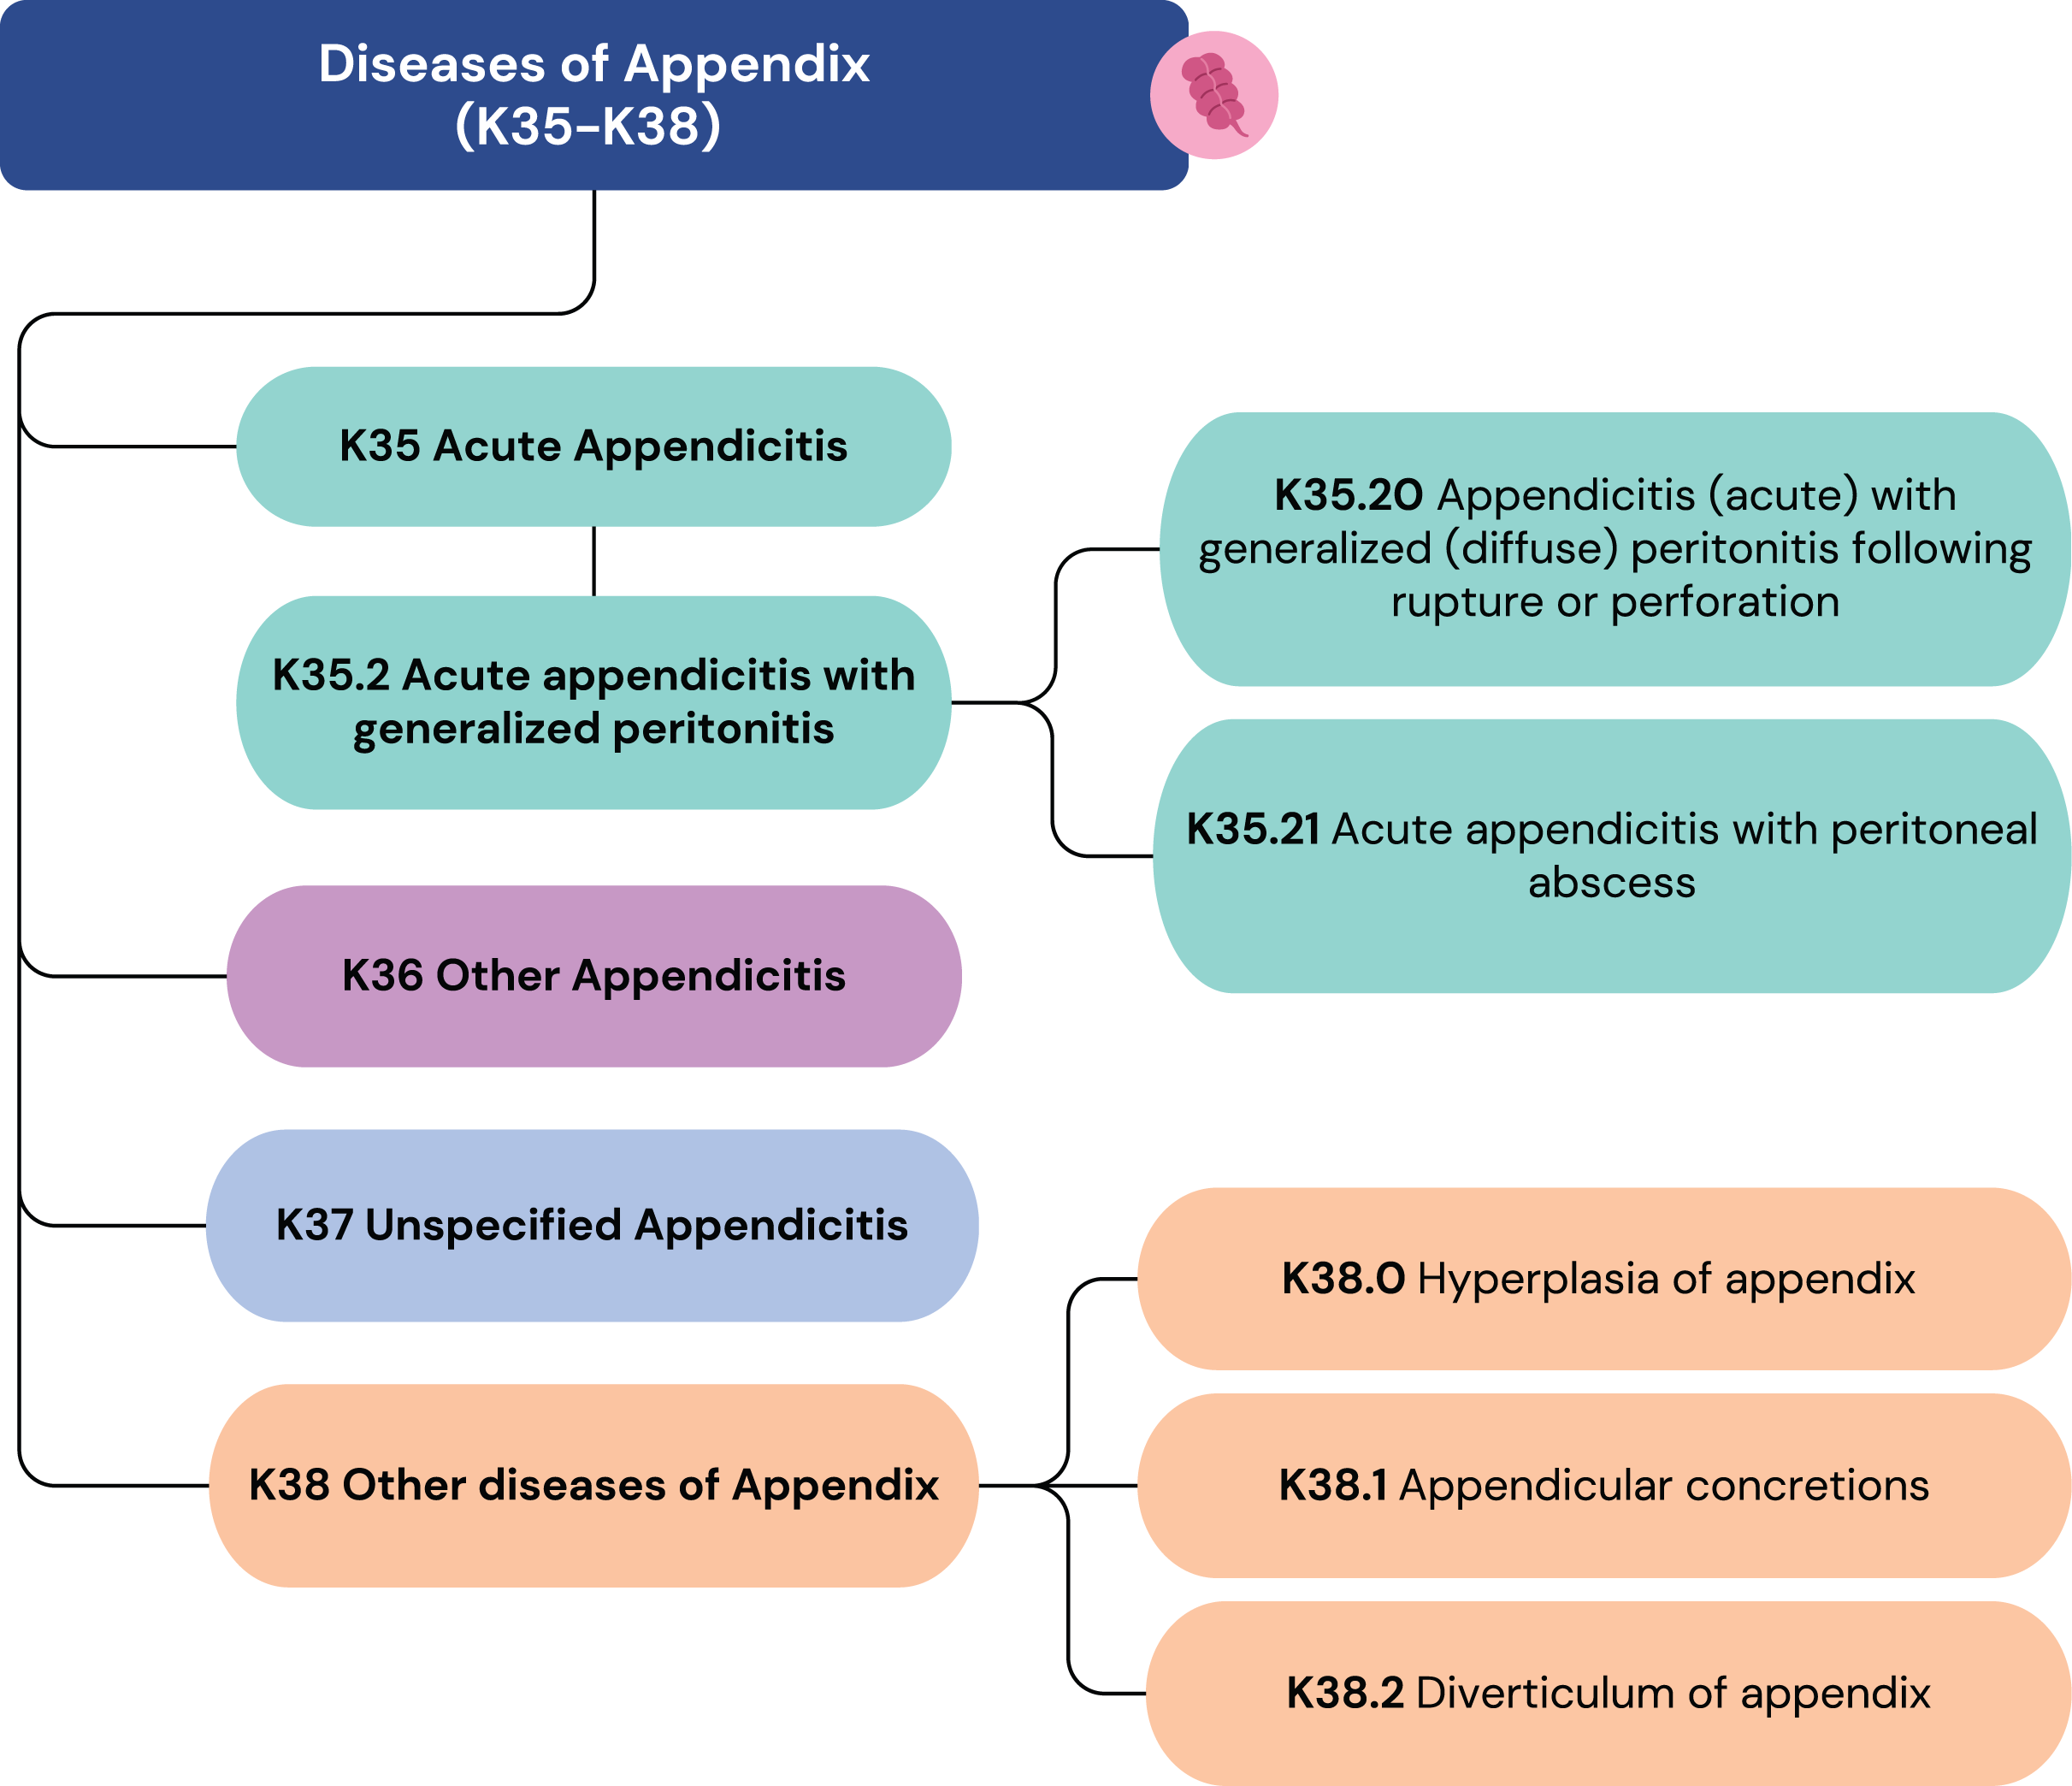
Score 2: The correct organ is identified, but the condition is incorrect (e.g., suggesting appendicitis for appendix hyperplasia).
Score 3: The correct organ and a partially correct condition are identified (e.g., suggesting an acute type for a chronic pathology).
Score 4: The correct organ and condition are identified, but the ICD code lacks necessary detail (e.g., suggesting acute appendicitis (K35) when acute appendicitis with generalized peritonitis (K35.2) is present).
Score 5: The diagnosis is entirely correct.
Special Case: For systemic pathologies without a specific associated organ, scores of 1, 2, or 3 are not applicable.
Figure 2 illustrates how some diagnoses can have similar labels but vastly different scores. These scores are not derived from ICD-10 or ICD-11 but are based on clinical expertise. To further ensure its robustness, the scoring framework was subsequently validated by a team of three epidemiologists responsible for the hospital’s internal morbidity and mortality reports. This collaborative, expert-driven validation process ensures that the metric accurately reflects clinical judgment and is well-suited for evaluating the precision of the model’s ICD code predictions. The insights from this metric are crucial for assessing the performance of the unstructured data pipeline and guiding its refinement.
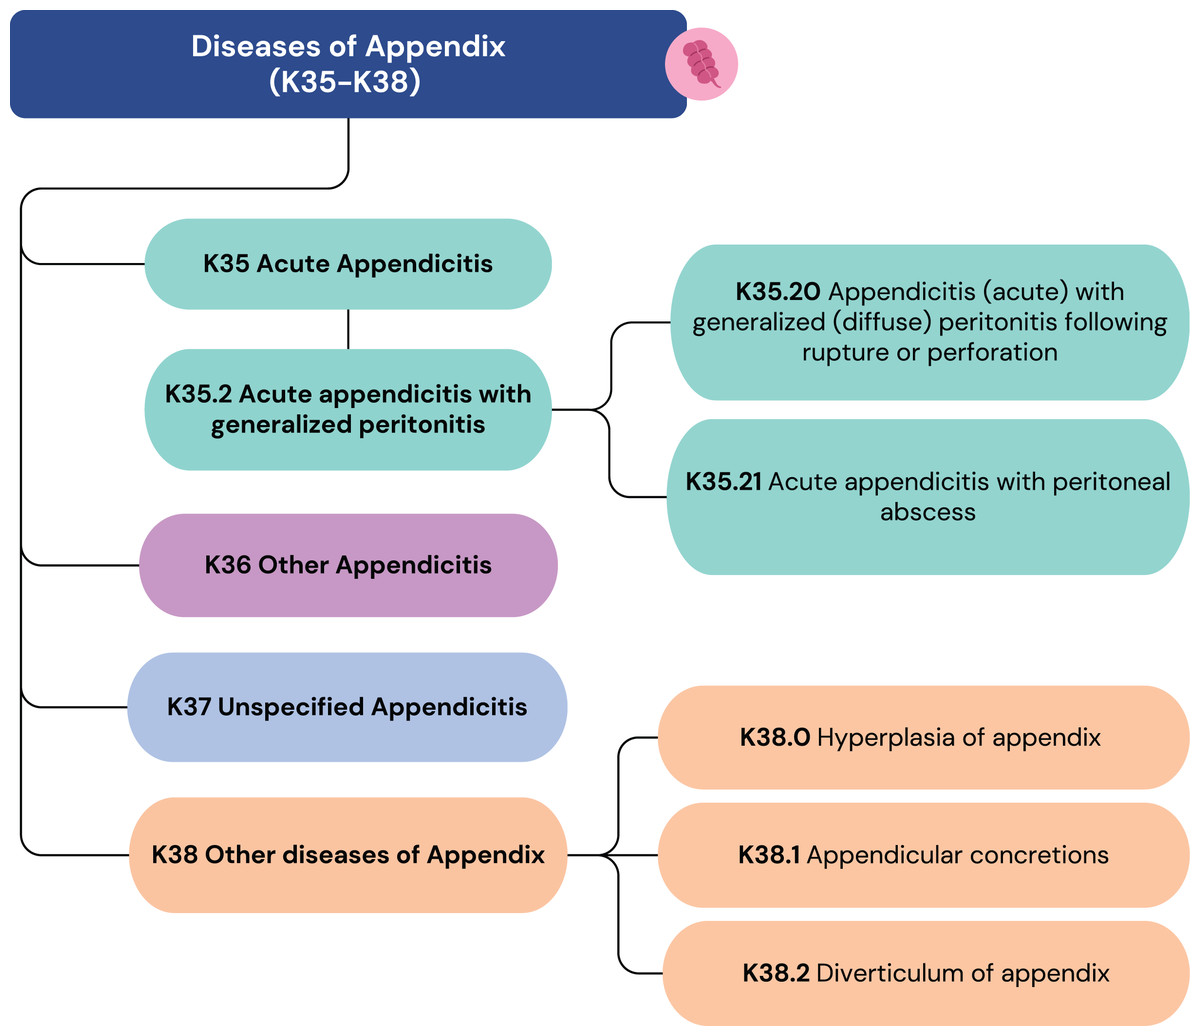
Figure 2: ICD-10 codes from K35 to K38.
Technical architecture of the prediction model
The diagnostic prediction model is implemented as a modular and scalable software application. Its architecture is designed to ensure seamless integration with existing healthcare systems and provide real-time diagnostic support. The core components include a relational database, a high-performance API framework, and a suite of machine learning models.
The system’s backbone is a MySQL relational database, which stores both the raw clinical data and the processed knowledge base of diagnostic inducers. This choice ensures data integrity, and efficient querying, which is essential for handling large volumes of patient information. The database schema is designed to support complex relationships between patients, procedures, and diagnoses, allowing for robust data retrieval.
All functionalities are exposed through a service-oriented API built with the FastAPI framework in Python. This modern, high-performance framework allows the model to handle concurrent requests efficiently, which is critical for real-time applications within a hospital setting. The API provides distinct endpoints for different data types (e.g., ‘/pharmacy’, ‘/radiology’), making it straightforward to integrate with diverse systems like EHRs or other clinical dashboards. This modularity ensures that the hospital can adopt the system without overhauling its existing IT infrastructure. Scalability is further enhanced by its stateless design and the use of caching mechanisms (‘@lru_cache’) for frequently accessed data, which minimizes response times.
The diagnostic intelligence of the model resides in its integrated machine learning models. A fine-tuned BERT model acts as a crucial filter, detecting and removing sentences with negation or uncertainty from clinical texts. For affirmative statements, a Sentence-Transformer model performs semantic similarity analysis to match clinical descriptions with a curated database of diagnostic sentences. In cases where similarity scores are low, the system employs GPT-3.5 Turbo as a fallback to generate potential ICD codes, ensuring comprehensive coverage. This multi-layered approach combines the speed of smaller, specialized models with the broad knowledge of a large language model, creating a balanced and effective diagnostic pipeline. The complete source code, detailing this architecture, is publicly available in the GitHub repository: https://github.com/BioAITeam/Clinical-Decision-Support-System-for-Discharge-Diagnosis-Recommendations.
Preliminary morbidity statistics derived from the model
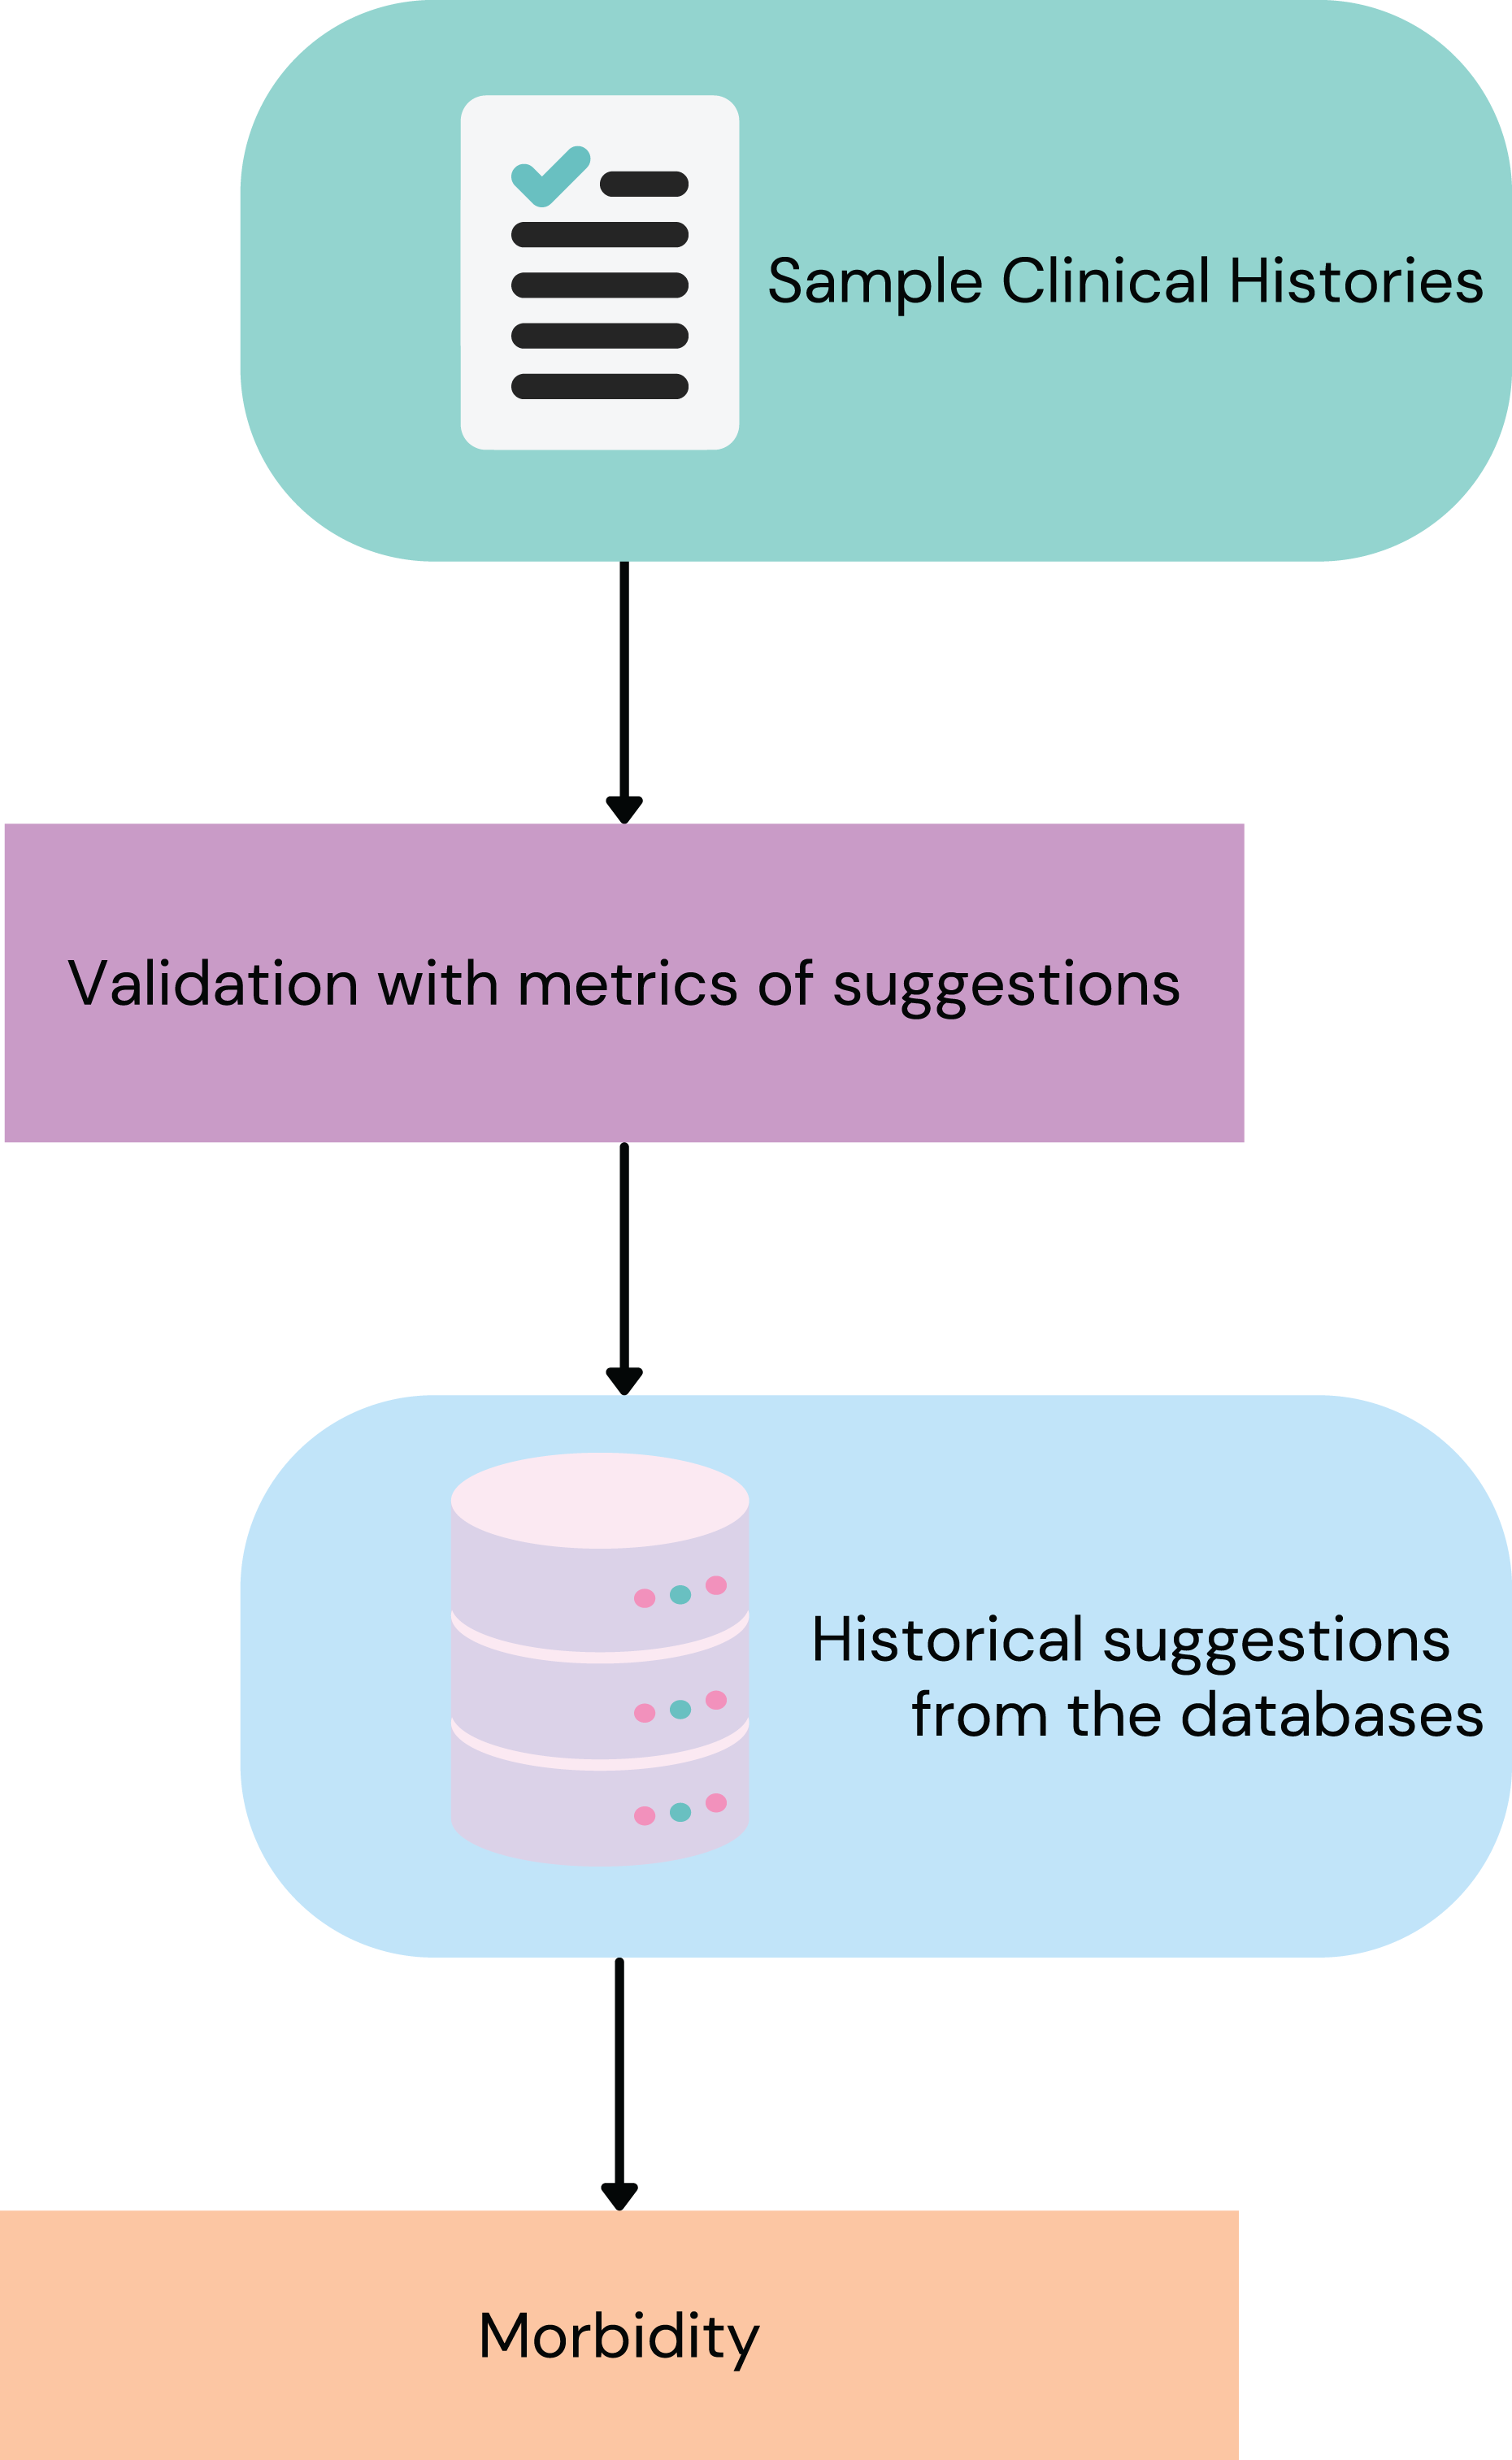
To demonstrate the utility of the model in generating real-world clinical insights, a preliminary analysis of morbidity statistics was conducted. This involved running the model on specific datasets from the institution (SES-HUC) to obtain a set of base diagnoses and to assess the model’s ability to identify critical conditions, Fig. 3, show the process to obtain this.
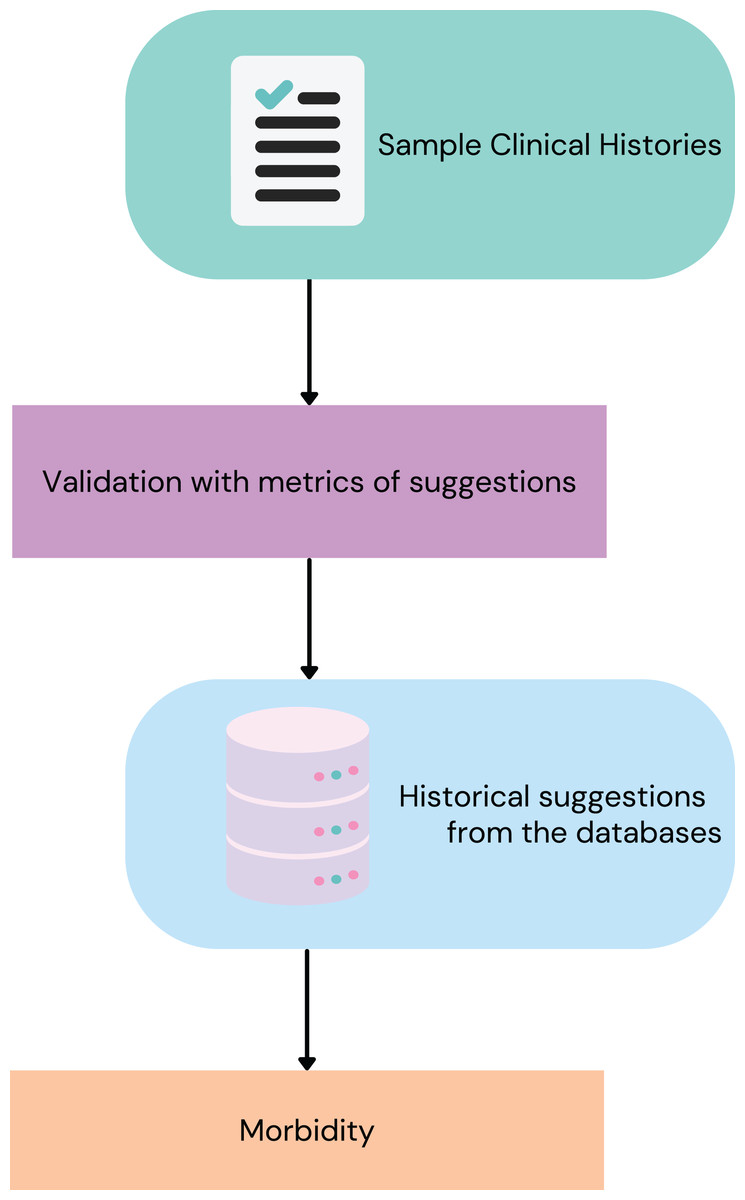
Figure 3: Steps to get the ICD diagnosis from the model.
Dataset selection and processing
The initial analysis utilized three structured datasets from SES-HUC, all from February 2023. Laboratory data included all tests conducted during this period, processed through a structured data pipeline to identify laboratory-based inducers and their associated diagnoses. Pharmacy data consisted of all pharmacy reports, used to extract pharmacological inducers and their corresponding diagnoses. Additionally, surgical procedure data covered all surgeries performed, analyzed through either structured or unstructured pipelines, depending on the data format. These datasets provided a comprehensive overview of diagnoses derived from structured data sources.
For unstructured data, the focus was on radiology reports, particularly thorax computed tomography (CT) scans from February 2023. These scans were chosen for their diagnostic significance, as they allow visualization of multiple vital organs. The dataset served as a foundation for training and validating the unstructured data pipeline, incorporating techniques such as sentence segmentation, negation/uncertainty detection, and semantic similarity analysis.
To further assess the performance of the model in processing unstructured data, a broader radiology dataset was employed. This dataset encompassed radiology reports from nearly the entire digital history of SES-HUC, containing pre-identified critical diagnoses. The evaluation specifically targeted conditions such as subdural and epidural hematomas, pneumothorax, acute appendicitis, spinal cord compression, pneumoperitoneum, acute cholecystitis, aneurysms, and pulmonary thromboembolism. The model was applied to this dataset to determine its effectiveness in identifying these critical diagnoses.
A summary of data volume is provided in the Table 1, detailing the number of records processed from each dataset.
| Dataset | Number of records |
|---|---|
| Laboratory data (Feb 2023) | 135,751 |
| Pharmacy data (Feb 2023) | 110,750 |
| Surgical procedures (Feb 2023) | 1,412 |
| Thorax CT scans (Feb 2023) | 1,030 |
| Radiology reports (Bigger dataset)—Total | 8,206 |
| Radiology—Subdural hematoma | 589 |
| Radiology—Epidural hematoma | 214 |
| Radiology—Pneumothorax | 1,066 |
| Radiology—Acute appendicitis | 92 |
| Radiology—Spinal cord compression | 34 |
| Radiology—Pneumoperitoneum | 915 |
| Radiology—Acute cholecystitis | 97 |
| Radiology—Aneurysms | 1,867 |
| Radiology—Pulmonary thromboembolism | 3,332 |
Results
This section presents the results obtained from applying the diagnostic prediction model to various clinical datasets, as described in the Methodology section.
Table 2 shows the number of diagnoses successfully mapped by the model from structured data sets (laboratory, pharmacy, and surgical procedures) and unstructured data sets (radiology reports) for February 2023 only. Inducer quantity (Qty) represents the amount of data mapped from each data set to generate ICD codes. The NORMAL class, which refers to patients without notable disease, is the only category considered as a diagnosis that does not correspond to an ICD code. This classification helps to avoid false positives in cases where radiology reports do not indicate significant findings.
| Dataset | Inducer type | Inducers qty | Diagnoses |
|---|---|---|---|
| Laboratory | Test + Result | 32 | 29 |
| Pharmacy | Drugs given | 33 | 23 |
| Surgical procedures | CUPS | 56 | 64 |
| Radiologic reports | Radiologic conclusion sentences | 22 | 18 |
| Totals | 179 | 134 | |
For the datasets shown in Table 2, we present a quantitative evaluation using our defined 0–5 scoring metric. Table 3 summarizes the score distribution across diagnoses, showing the percentage and number of cases for each inducer, and the proportion of cases scoring 4 or 5 (indicating high diagnostic accuracy). Two datasets require special consideration:
-
For laboratory data, both tests and results serve as inducers, distinguishing between the total number of tests and those indicating pathological conditions.
For Thorax CT scans, we identified more diagnoses than reports since a single patient may present multiple findings (e.g., a traumatic hematoma often accompanies a bone fracture). However, without access to the total number of diagnoses across all radiological reports, we cannot calculate the dataset coverage percentage.
| Dataset | Avg score | Total cases | % of dataset | Cases (score 4) |
|---|---|---|---|---|
| Laboratory | 4.20 | 21,346 (Test) 3,301 (Test + Result) | 15.72% (Test) 2.43% (Test + Result) | 3,297 |
| Pharmacy | 3.59 | 8761 | 7.91% | 4,070 |
| Surgical procedures | 4.24 | 409 | 28.96% | 330 |
| Thorax CT scans | 3.70 | 29 (Radiologic reports) 60 (Diagnosis) | 2.81% (Radiologic reports) | 46 |
We divided the findings of the larger radiological data set into three categories to assess the diagnostic accuracy. Table 4 shows how well the model’s suggestions match the main diagnoses. In this analysis, we grouped NORMAL cases and secondary diagnoses into one class, while keeping main diagnoses as a separate class. We further subdivided the main diagnoses by type, as their frequency varies significantly in our dataset.
| Diagnosis | Accuracy | Recall | Precision | F1-score | Records |
|---|---|---|---|---|---|
| Aneurysm | 81.61% | 70.21% | 62.12% | 65.92% | 1,153 |
| Pulmonary embolism | 95.48% | 98.66% | 89.48% | 93.85% | 2,566 |
| Acute appendicitis | 62.26% | 100% | 20% | 33.33% | 53 |
| Acute cholecystitis | 89.41% | 71.43% | 41.67% | 52.63% | 85 |
| Spinal cord compression | 71.43% | 0% | 0% | 0% | 28 |
| Epidural hematoma | 56.52% | 100% | 52.38% | 68.75% | 115 |
| Subdural hematoma | 75.11% | 96.25% | 74.40% | 83.92% | 237 |
| Pneumothorax | 67.84% | 89.19% | 51.89% | 65.61% | 538 |
| Pneumoperitoneum | 74.67% | 79.59% | 21.20% | 33.48% | 612 |
To evaluate our model’s multiple validation methods (shown in Fig. 1), we focused on improving the sentence similarity analysis. Since we only had 22 sentences for similarity matching (Table 2), we selected epidural hematoma cases, which showed the lowest accuracy in Table 4. From the misclassified sentences (suggested other diagnosis or NORMAL and the radiologic report indicates epidural hematoma), we extracted two key examples using our sentence similarity algorithm:
-
The most frequently occurring sentence (considering sentences with cosine similarity 0.9 as identical)
The sentence with the highest average cosine similarity to other misclassified sentences
The impact of these changes on our metrics is presented in Table 5.
| Epidural hematoma | Accuracy | Recall | Precision | F1-score | Records |
|---|---|---|---|---|---|
| Base metrics | 56.52% | 100% | 52.38% | 68.75% | 115 |
| Adding samples to the model | 63.48% | 100% | 59.62% | 74.70% | 115 |
Regarding negation/uncertainty detection in the unstructured radiology dataset, our model achieved an accuracy of 99.798%. To evaluate performance on secondary diagnoses (those beyond the main diagnosis or NORMAL classification), we analyzed a subset of the 1,129 additional diagnoses identified. These cases were manually reviewed and scored by the SES-HUC medical advisor. Table 6 presents this analysis with the following metrics:
-
Correct diagnosis: Whether the suggested diagnosis appeared in the radiological report.
% of Secondary diagnosis: The percentage of total secondary diagnoses for each specific condition.
Average score: Mean score of correctly labeled diagnoses.
Cases (score 4): Amount of correct diagnoses scoring 4 or 5
| Radiology dataset | Correct diagnosis | % of secondary diagnosis | Avg score | Cases (score 4) | |
|---|---|---|---|---|---|
| Yes | No | ||||
| Aneurysms | 60 | 40 | 33.55% | 4.37 | 45 |
| Spinal cord compression | 12 | 6 | 100% | 3.45 | 7 |
| Pneumoperitoneum | 63 | 37 | 41.15% | 3.62 | 32 |
| Pulmonary embolism | 50 | 50 | 52.35% | 4.00 | 32 |
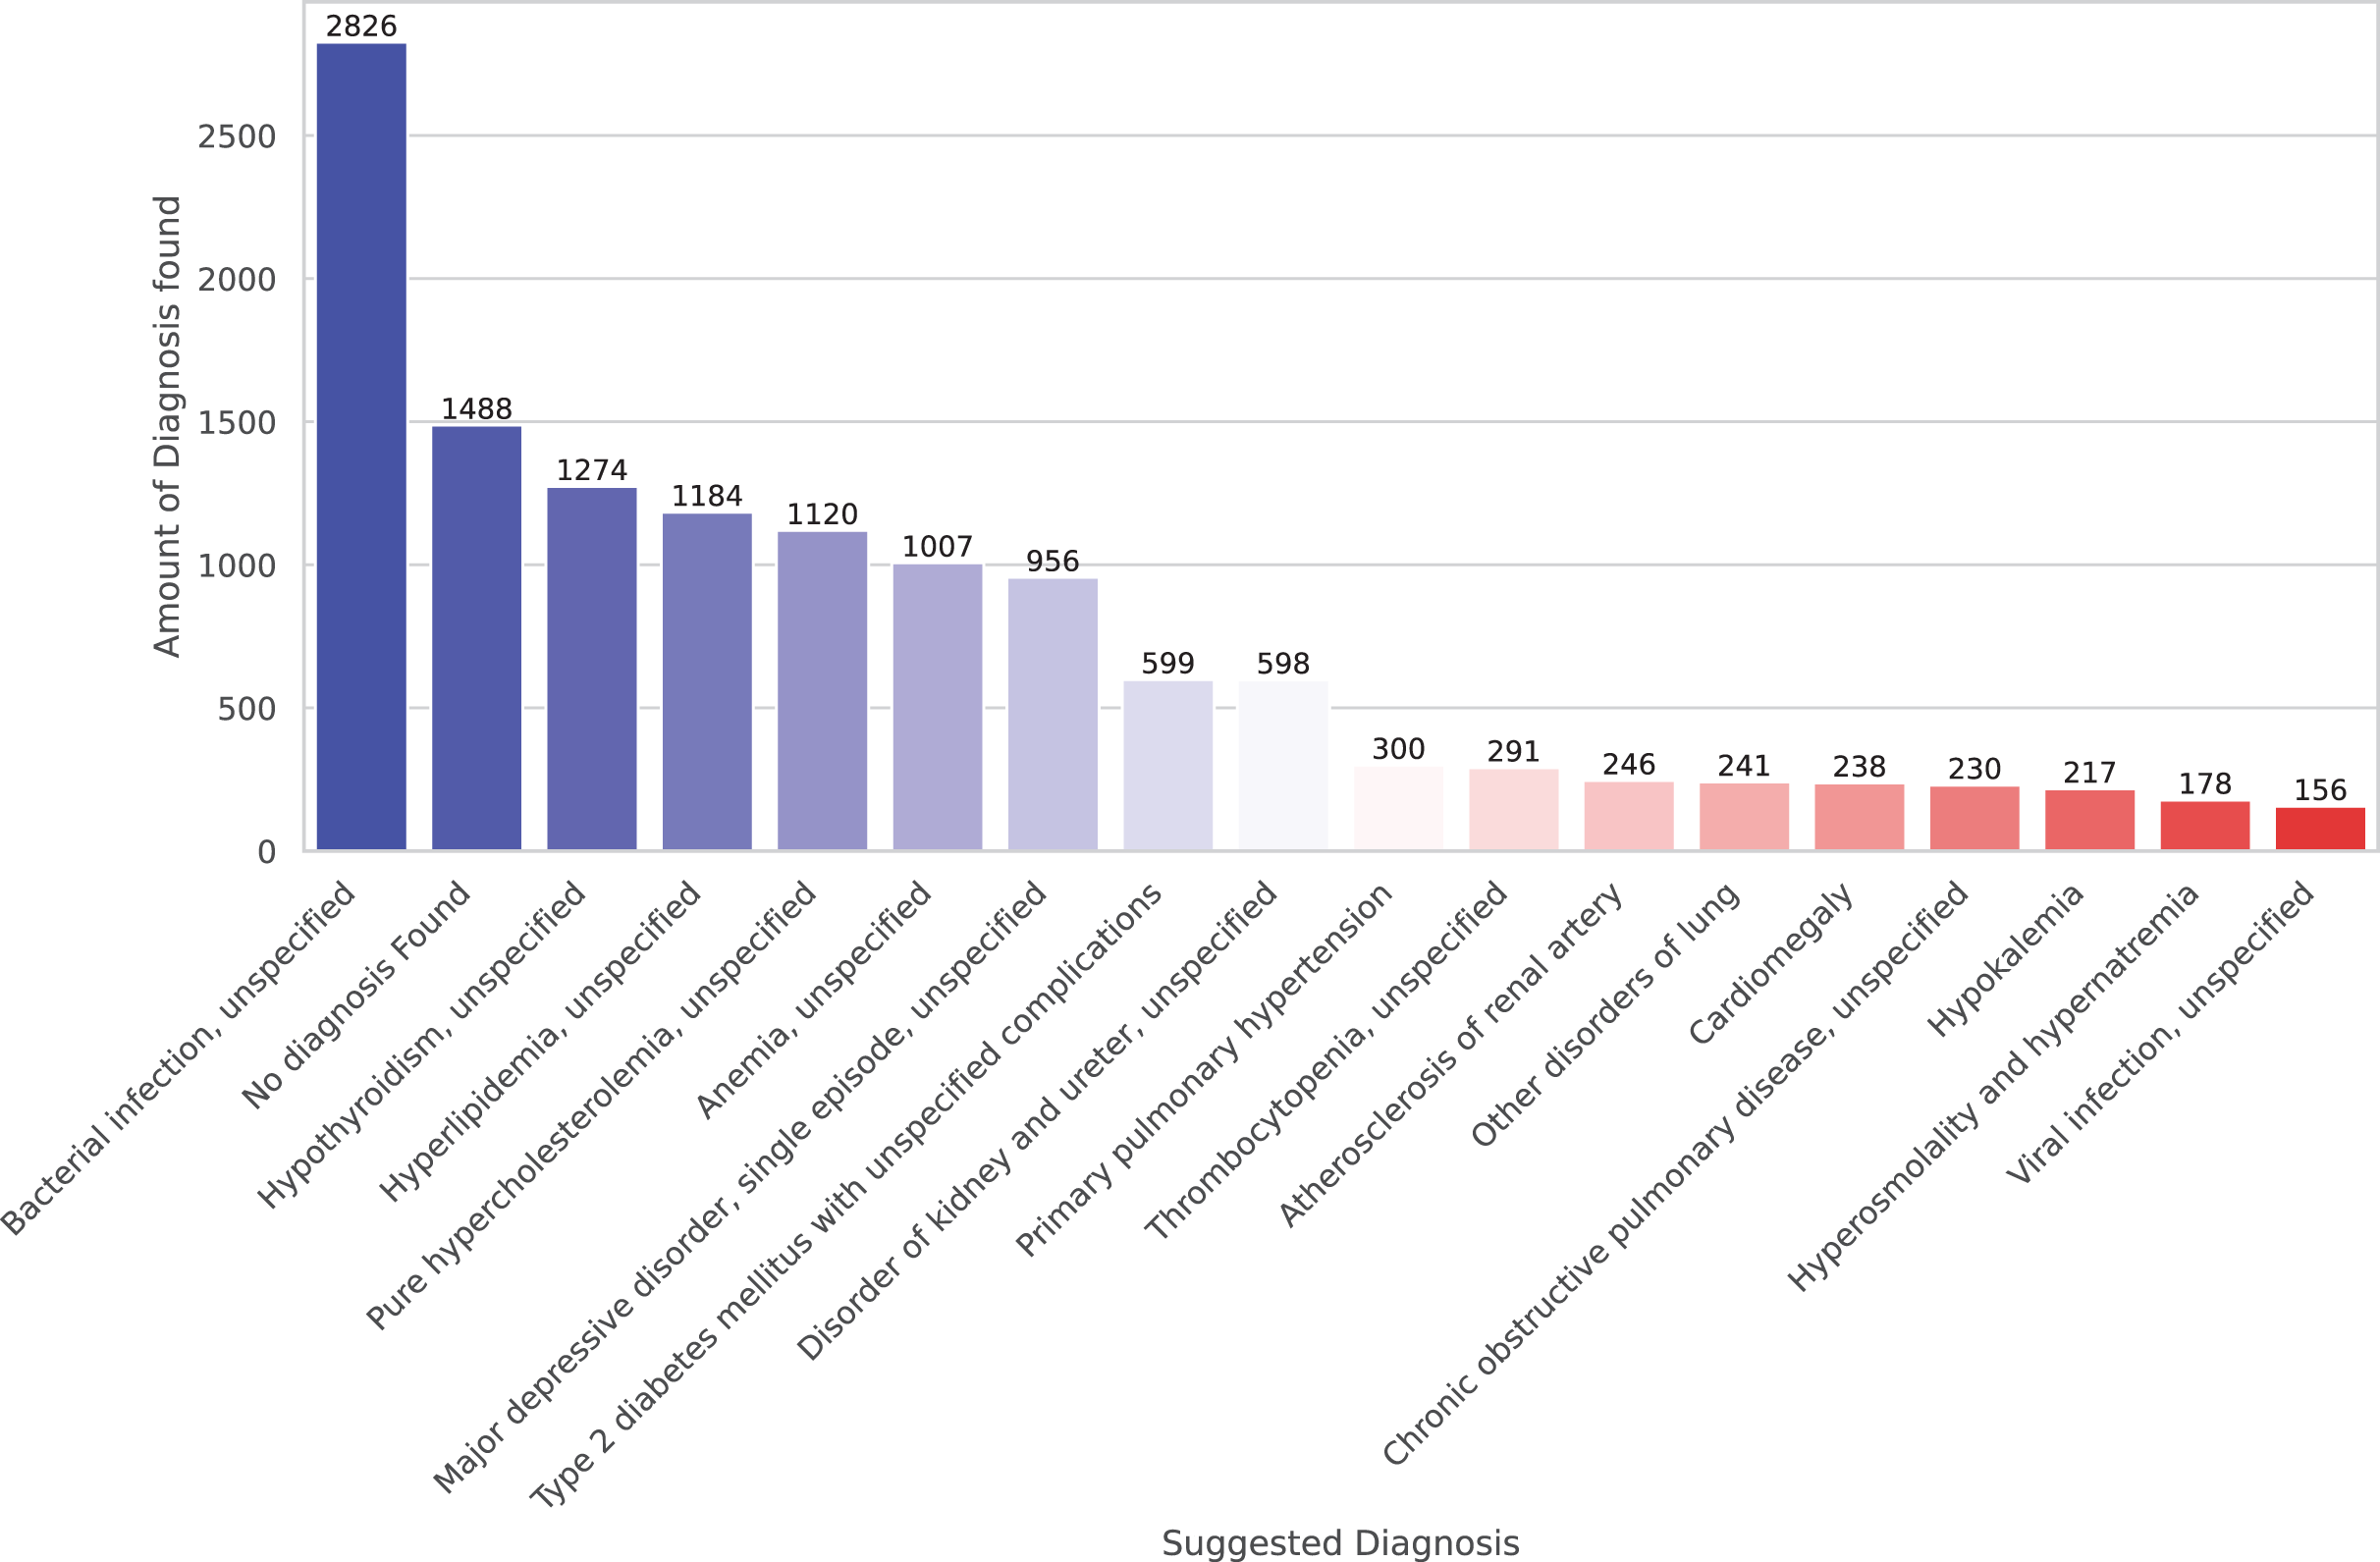
Finally, we present preliminary morbidity statistics from running the model across all SES-HUC datasets. The model identified 664 distinct diagnoses across all inducers. Due to this large number, Fig. 4 shows only the 20 most frequent diagnoses.
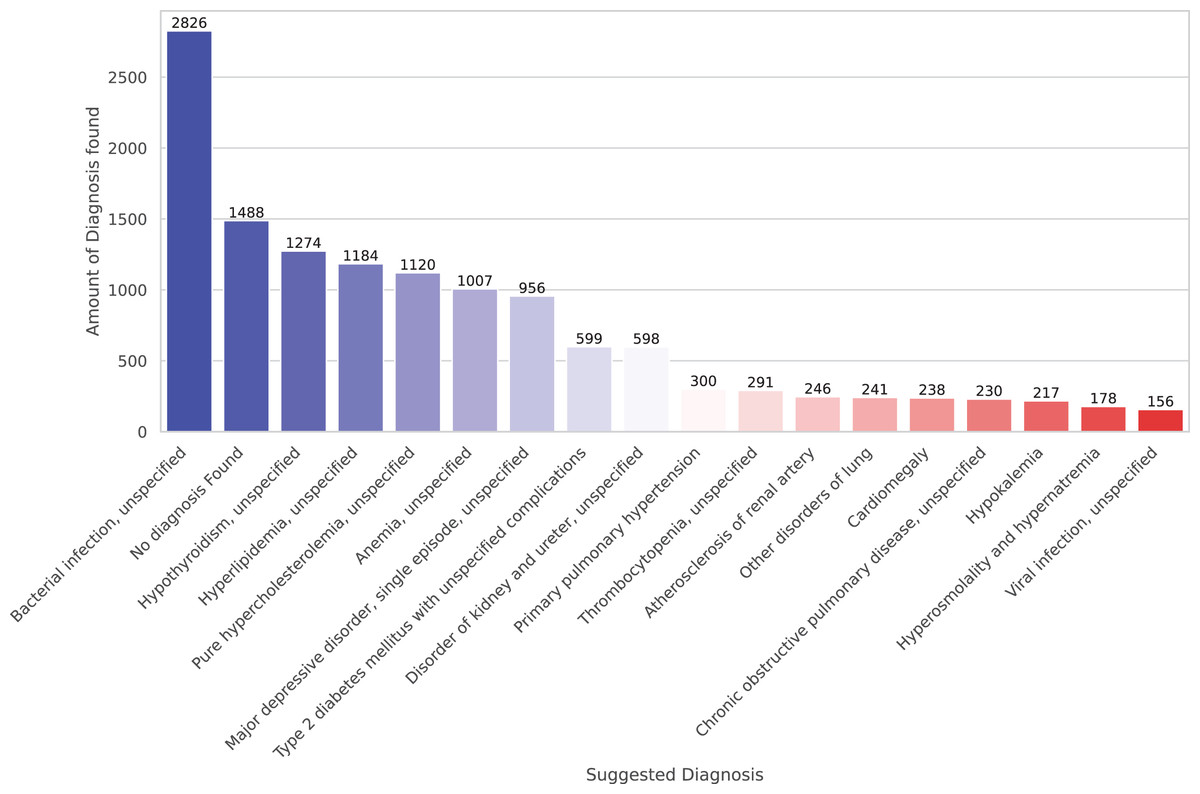
Figure 4: A total of 20 more frequent suggested diagnoses from the model.
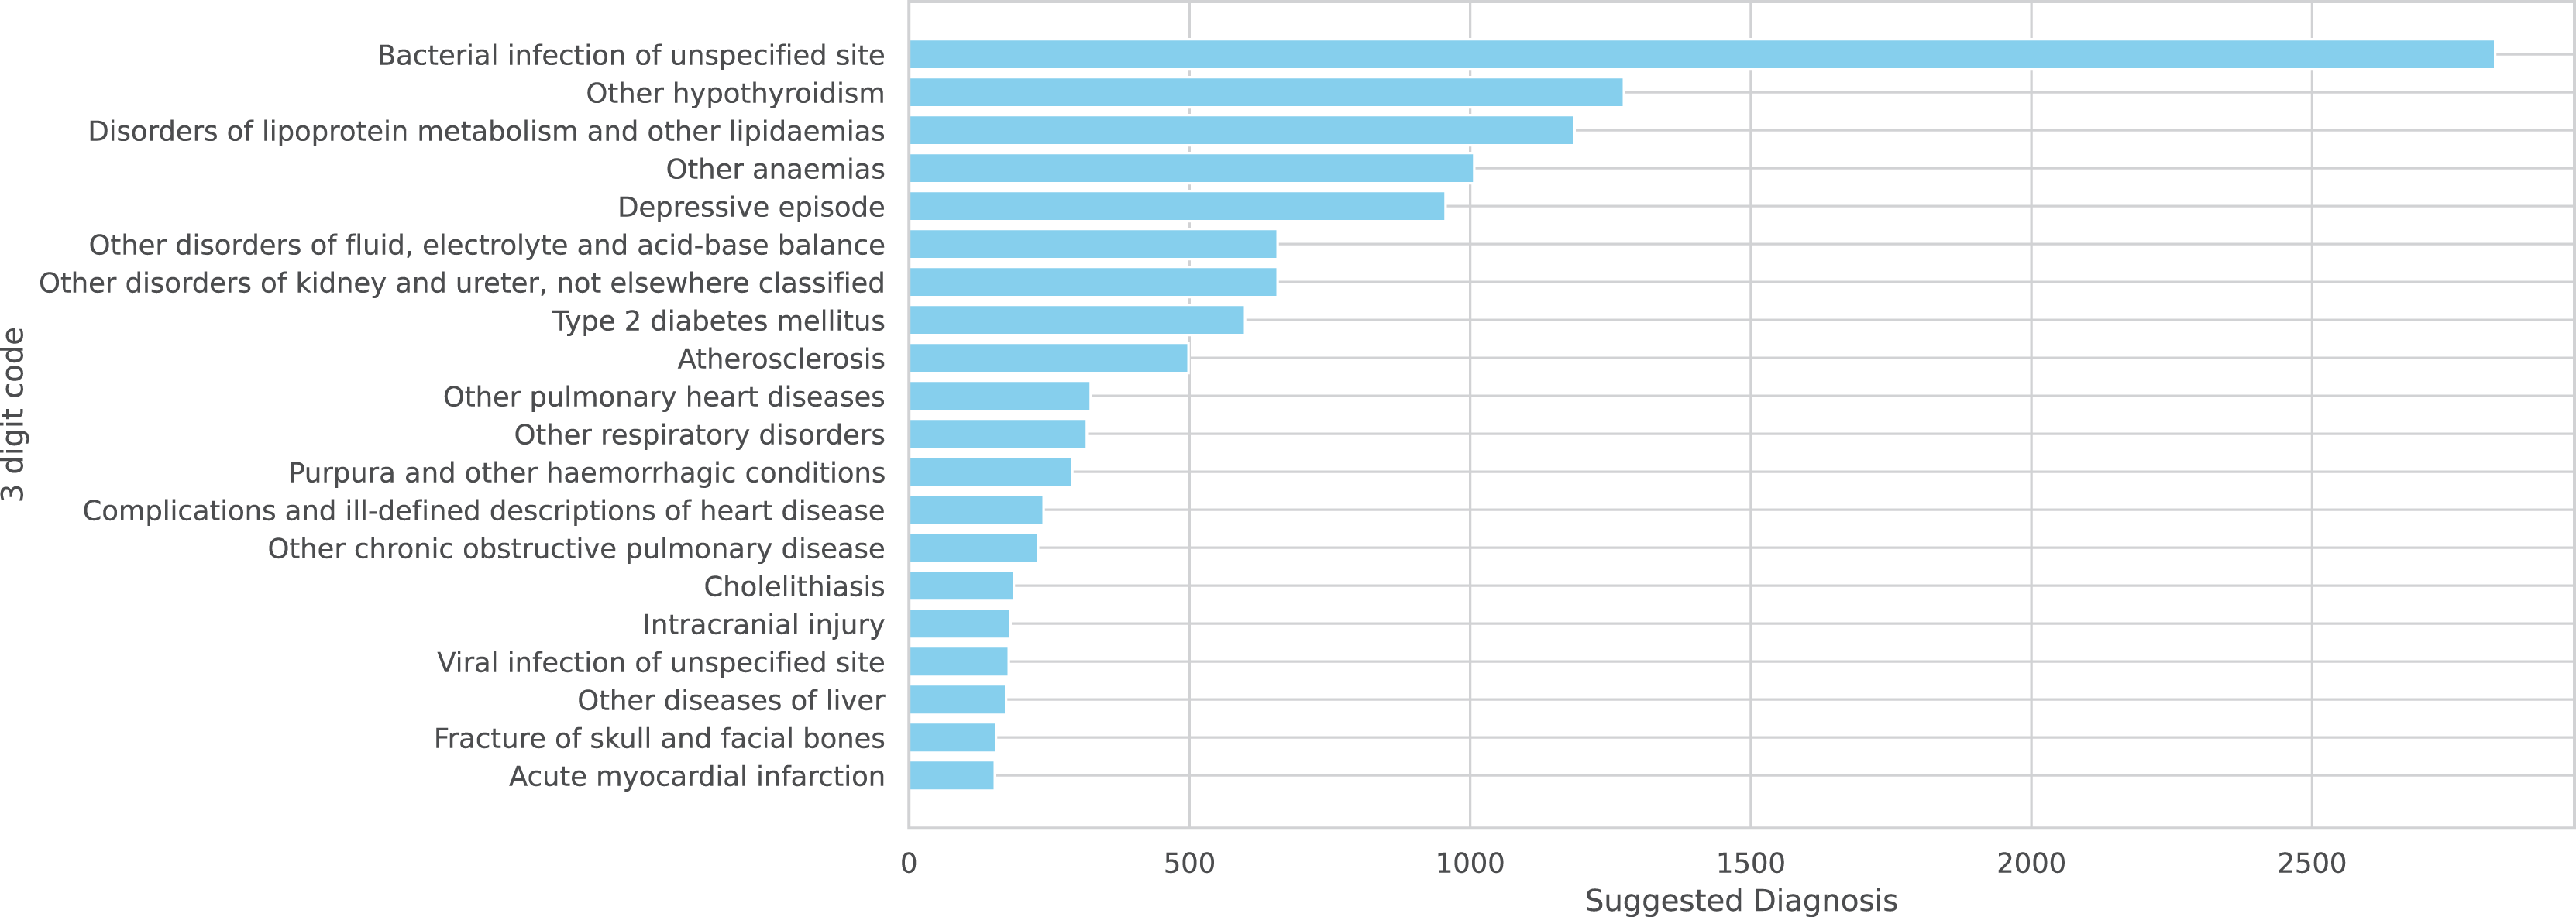
Since our system is primarily based on ICD-10, we can present these diagnoses at three levels of generalization:
-
Figure 5: Top 20 diagnoses using three-digit ICD codes
-
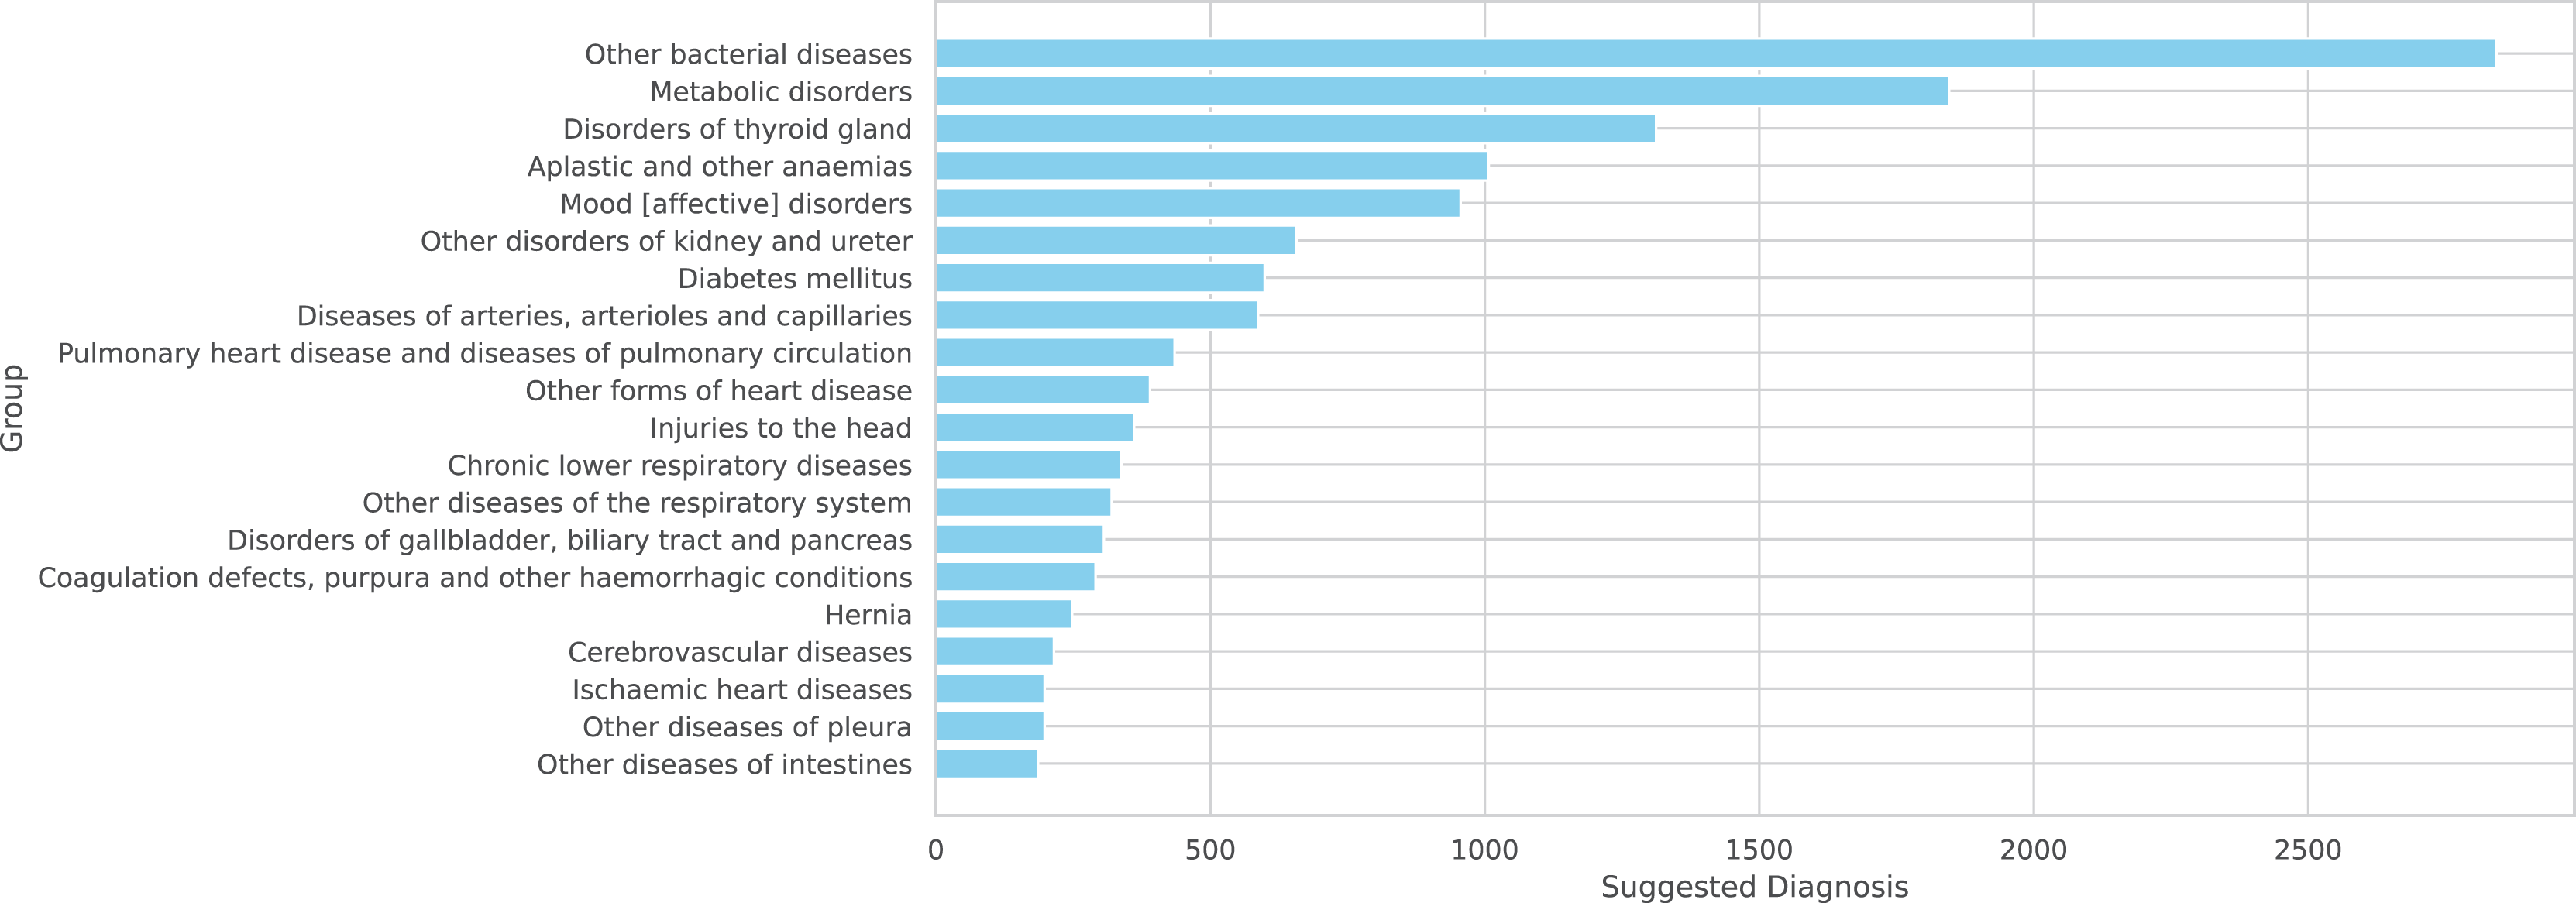
Figure 6: Top 20 groups of related three-digit codes
-
Figure 7: Complete distribution across ICD-10 chapters
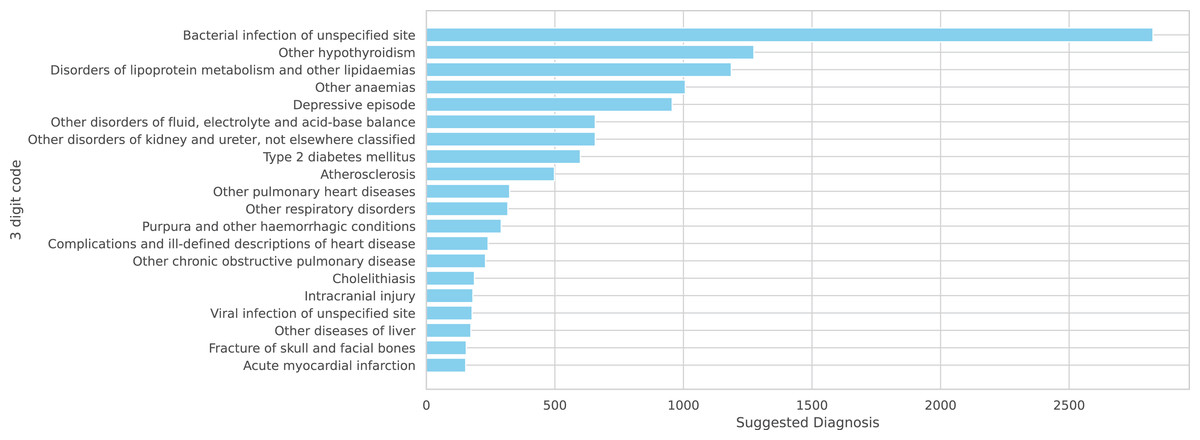
Figure 5: A total of 20 more frequent suggested diagnoses from the model summarized on ICD-10 3 digits code.
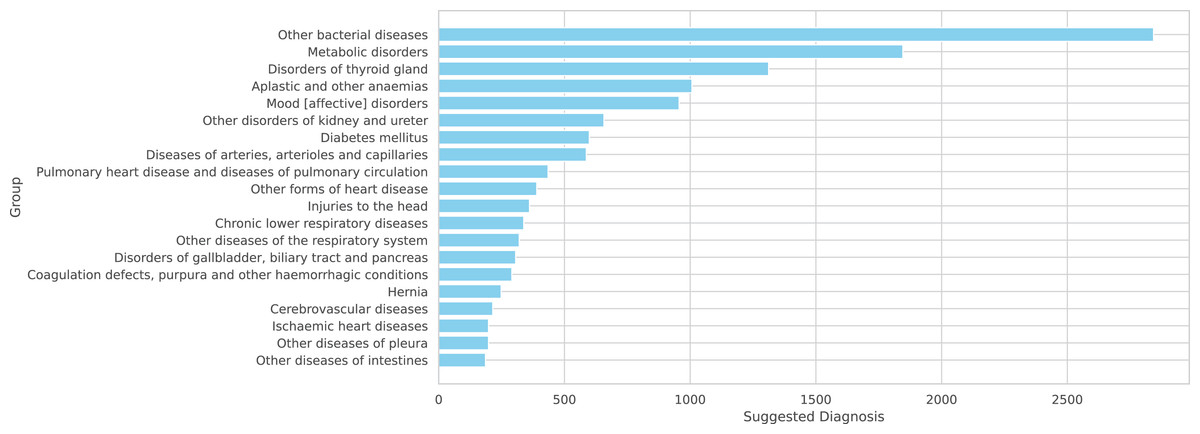
Figure 6: A total of 20 more frequent suggested diagnoses from the model summarized by groups of IDC-10.
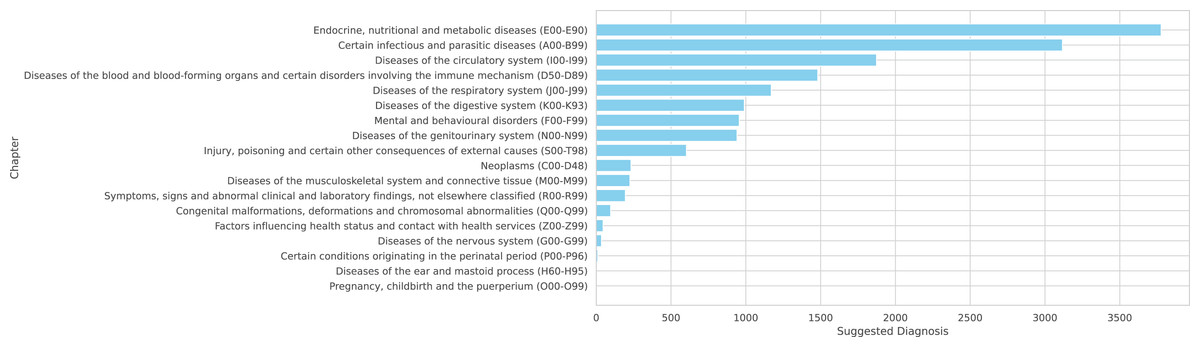
Figure 7: Suggested diagnoses from the model summarized by chapters of IDC-10.
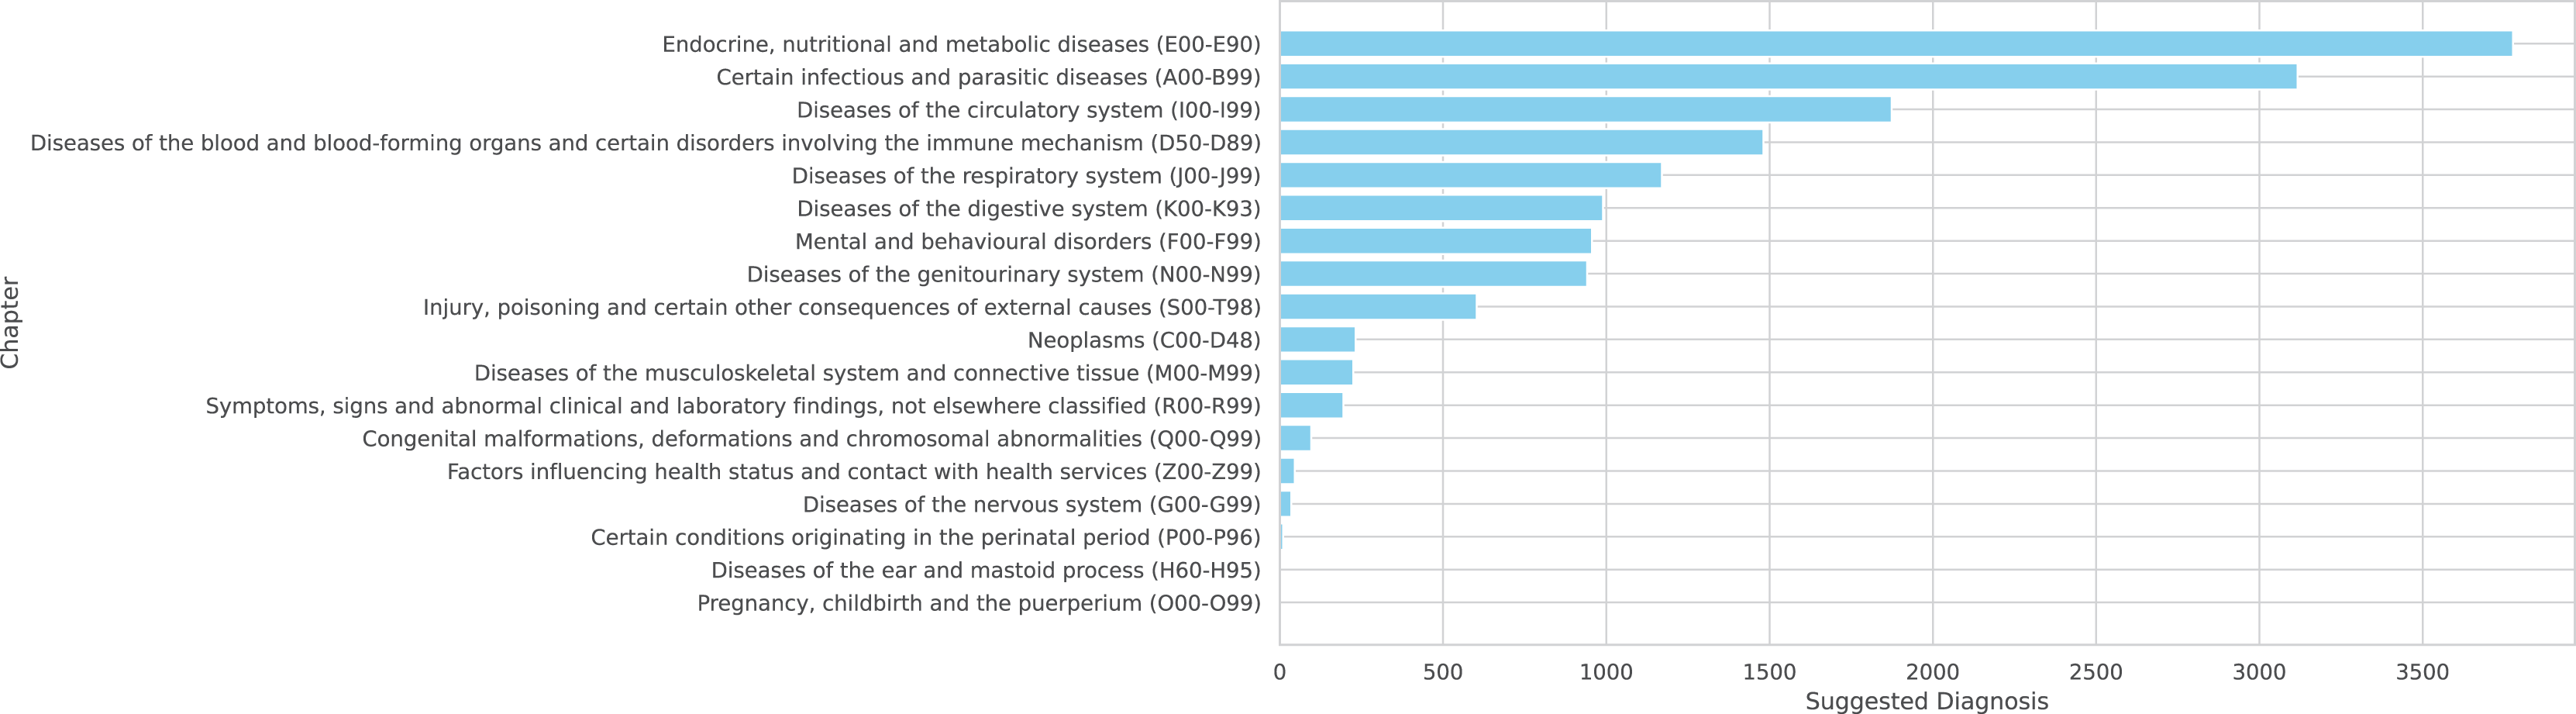
Note that the NORMAL classification is excluded from these figures as it is not part of the ICD-10 coding system.
Co-occurrence of diagnoses
To further explore the relationships between diagnoses identified by the model, a co-occurrence analysis was performed. This analysis identifies pairs of diagnoses that frequently appear together in the same patient records, providing insights into common comorbidities and clinical associations. The results are presented at two levels of granularity: by the specific ICD-10 3-digit code description and by the broader ICD-10 group description.
Table 7 summarizes the top 10 most frequent co-occurring diagnosis pairs across all analyzed datasets. As the data is heavily influenced by the large number of Pulmonary Embolism cases, we also present more specific examples. Tables 8 and 9 show the most common co-occurrences for subdural hematoma and pneumothorax, respectively. For instance, in cases of subdural hematoma, ‘Fracture of skull and facial bones’ and ‘Intracranial injury’ are frequently diagnosed together. Similarly, for pneumothorax, ‘Other respiratory disorders’ and injuries like ‘Fracture of rib(s)’ are common pairs, which is clinically expected. This analysis demonstrates the system’s ability to identify clinically relevant patterns of disease association.
| ICD10 3-code description pair | Frequency |
|---|---|
| (‘Atherosclerosis’, ‘Pulmonary embolism’) | 347 |
| (‘Other pulmonary heart diseases’, ‘Pulmonary embolism’) | 327 |
| (‘Complications and ill-defined descriptions of heart disease’, ‘Pulmonary embolism’) | 214 |
| (‘Other respiratory disorders’, ‘Pulmonary embolism’) | 203 |
| (‘Atherosclerosis’, ‘Complications and ill-defined descriptions of heart disease’) | 176 |
| (‘Atherosclerosis’, ‘Other pulmonary heart diseases’) | 165 |
| (‘Atherosclerosis’, ‘Other respiratory disorders’) | 142 |
| (‘Other pulmonary heart diseases’, ‘Other respiratory disorders’) | 118 |
| (‘Fracture of skull and facial bones’, ‘Intracranial injury’) | 117 |
| (‘Complications and ill-defined descriptions of heart disease’, ‘Other respiratory disorders’) | 102 |
| ICD10 3-code desc pair | Freq. | Group desc pair | Freq. |
|---|---|---|---|
| (‘Fracture of skull and facial bones’, ‘Intracranial injury’) | 52 | (‘Cerebrovascular diseases’, ‘Injuries to the head’) | 63 |
| (‘Intracranial injury’, ‘Other cerebrovascular diseases’) | 26 | (‘Injuries to the head’, ‘Other disorders of the nervous system’) | 12 |
| (‘Intracranial injury’, ‘Subarachnoid haemorrhage’) | 23 | (‘Cerebrovascular diseases’, ‘Other disorders of the nervous system’) | 8 |
| ICD10 3-code desc pair | Freq. | Group desc pair | Freq. |
|---|---|---|---|
| (‘Other respiratory disorders’, ‘Pneumothorax’) | 46 | (‘Injuries to the thorax’, ‘Other diseases of pleura’) | 70 |
| (‘Fracture of rib(s), sternum and thoracic spine’, ‘Pneumothorax’) | 33 | (‘Other diseases of pleura’, ‘Other diseases of the respiratory system’) | 62 |
| (’Fracture of rib(s), sternum and thoracic spine’, ‘Injury of other and unspecified intrathoracic organs’) | 32 | (‘Injuries to the thorax’, ‘Other diseases of the respiratory system’) | 33 |
Performance analysis of GPT-3.5 turbo as a standalone predictor
To evaluate the contribution of each component in our unstructured data pipeline, we conducted an analysis where the sentence similarity and negation/uncertainty detection modules were bypassed. In this scenario, clinical sentences were sent directly to the GPT-3.5 Turbo API for diagnosis prediction. This approach allows for a direct assessment of the LLM’s standalone performance and highlights the role of the preceding NLP filters.
The results for two specific critical diagnoses, appendicitis and cholecystitis, using this direct API approach are presented in Table 10.
| Diagnosis | Accuracy | Precision | Recall | F1-score |
|---|---|---|---|---|
| Acute appendicitis | 56.25% | 87.50% | 20.59% | 33.33% |
| Acute appendicitis | 86.96% | 66.67% | 28.57% | 40.00% |
| Spinal cord compression | 38.24% | 38.24% | 100.00% | 55.32% |
| Subdural hematoma | 85.26% | 85.26% | 100.00% | 92.04% |
| Pneumoperitoneum | 25.29% | 25.29% | 100.00% | 40.37% |
A comparison of these results with those from our complete pipeline (Table 4) reveals the significant impact of the pre-processing steps. While the direct GPT-3.5 approach yields high precision in some cases, the drastic reduction in recall indicates that it fails to identify a large proportion of true positive cases. Due to the probabilistic nature of GPT, the model can generate variations in scores on different runs; for example, on a second run, the value for acute cholecystitis was much lower (ACC of 16.13%). Still, the results show a clear enhancement in the general behavior of our pipeline. This underscores the value of the sentence similarity and negation detection modules, which act as an effective filter to correctly identify and forward relevant clinical statements, thereby improving the system’s overall sensitivity.
The metrics presented in this table were extracted using approximately $50 of API costs. Other critical diagnoses are not included, either because of the high number of records or because the current records have very long text, and we lack the monetary resources to test all of them.
Beyond performance, a primary function of the pre-processing pipeline is cost management for the use of the commercial GPT API. By filtering out irrelevant or negated sentences, the system avoids unnecessary API calls. To quantify the potential cost savings, we analyzed the token consumption on our largest radiography dataset, which involved 17,667 queries and consumed 2,539,074 tokens. This results in an average of approximately 144 tokens per diagnostic query.
We can use this average to estimate the potential API costs for the February 2023 datasets if the filtering pipeline were not in place. Based on the analysis in Table 3, approximately 2.43% of laboratory records (3,301 cases) and 7.91% of pharmacy records (8,761 cases) were found to be diagnostically significant. Without the initial filtering stages, each of these cases would potentially trigger an API call. The estimated token usage would be:
-
Laboratory Data: significant records 144 tokens/record 475,344 tokens.
Pharmacy Data: significant records 144 tokens/record 1,261,584 tokens.
This amounts to a combined total of over 1.7 million tokens for just two datasets from a single month. This calculation underscores the crucial role of the sentence similarity and negation detection modules, not only for enhancing diagnostic recall but also as an essential cost-containment mechanism that makes the large-scale deployment of the diagnostic model economically viable.
Discussion
The diagnostic process presents opportunities for improvement through enhanced EHR systems. The current SES-HUC EHR system provides a foundation for data collection, and implementing better organization of this information can strengthen the Hospital’s ability to generate comprehensive statistics about their patient population’s health conditions and outcomes. The most recent report from July 2024 indicates that acute pain (ICD-10 code R52.0) represents the primary discharge diagnosis, highlighting the potential for more specific diagnostic categorization to optimize resource planning, equipment acquisition, and staffing decisions. This study aims to provide healthcare institutions with tools to enhance their existing systems and extract meaningful insights while maintaining current workflows and infrastructure.
The results of this model align with a growing body of work demonstrating the feasibility of automated diagnosis code prediction from electronic health records. Other studies have also shown promising results using deep learning models, such as CNNs to predict ICD-10 codes from clinical notes, achieving high precision and recall in specific medical specialties (Masud et al., 2023). Research using discharge summaries from large public datasets like MIMIC II has also shown that classifiers leveraging the hierarchical structure of ICD codes can outperform flat classification models (Perotte et al., 2014).
Our framework contributes to the broader field of computational diagnostic tools, where various machine learning approaches are being explored. For example, some systems prioritize robust feature selection using methods like Rough Set Theory (RST) to manage inconsistent or incomplete data before applying classifiers like Random Forest and Decision Trees for disease prediction (Singh & Mantri, 2024a, 2024b, 2024c). Others have focused on using ensemble learning, such as CatBoost, to achieve high accuracy in tasks like early-stage stroke risk prediction, often in conjunction with techniques to handle imbalanced datasets (Swarnkar et al., 2023). These findings collectively underscore the value of integrating advanced machine learning and NLP techniques into clinical workflows to support diagnostic processes. While our system shows strong potential, it also faces limitations common in the field, such as the dependency on data from a single institution, which may affect the generalizability of the models, a challenge also noted in other studies.
The developed model represents a promising initial step in addressing these challenges. The system currently encompasses 134 base diagnoses, which expands to 250 when including diagnoses with scores higher than 4 in Table 6, which have been validated by medical experts. While the ICD-10 system contains over 40,000 codes, the current results demonstrate significant potential, particularly in specific diagnostic areas. Table 3 reveals strong performance in Laboratory and Surgical Procedures, with Thorax CT showing promising results as well. The Pharmacy dataset, while extensive with 8,761 cases, presents opportunities for refinement, particularly in cases involving broad-spectrum medications such as antibiotics, which correspond to bacterial infection—the most frequent diagnosis as shown in Fig. 4.
The model demonstrates substantial potential for expansion, as current dataset utilization remains below 30% across all categories. Increasing utilization to 50% could significantly enhance diagnostic capabilities, even before incorporating additional EHR information. Notable findings include pulmonary embolism, which shows exceptional performance in multiple metrics, as detailed in Table 4, with its specific performance characteristics illustrated in the confusion matrix of Fig. 8.
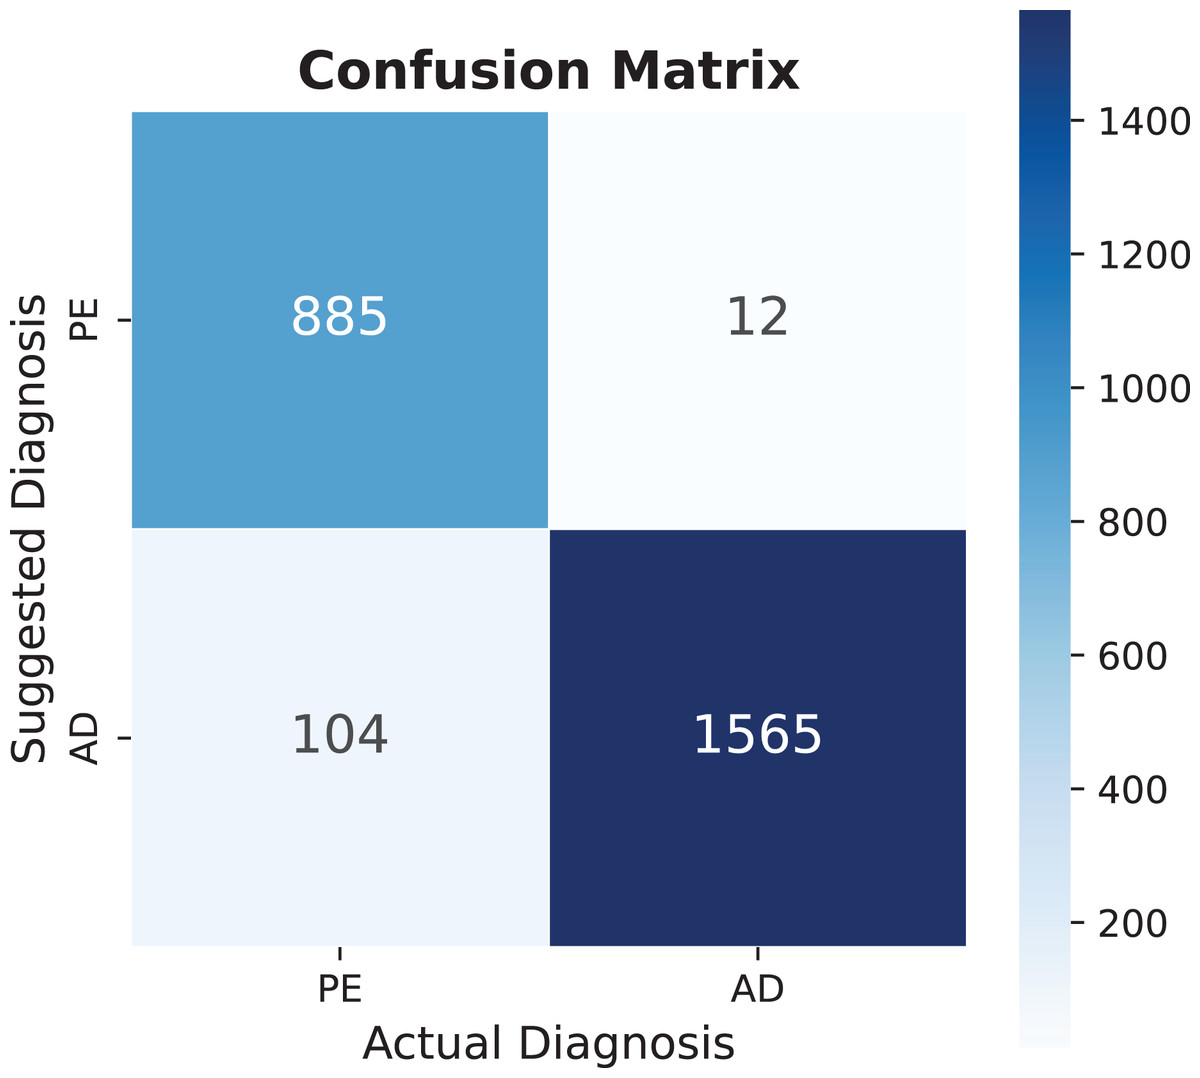
Figure 8: Pulmonary embolism (PE) confusion matrix, AD means another diagnosis.
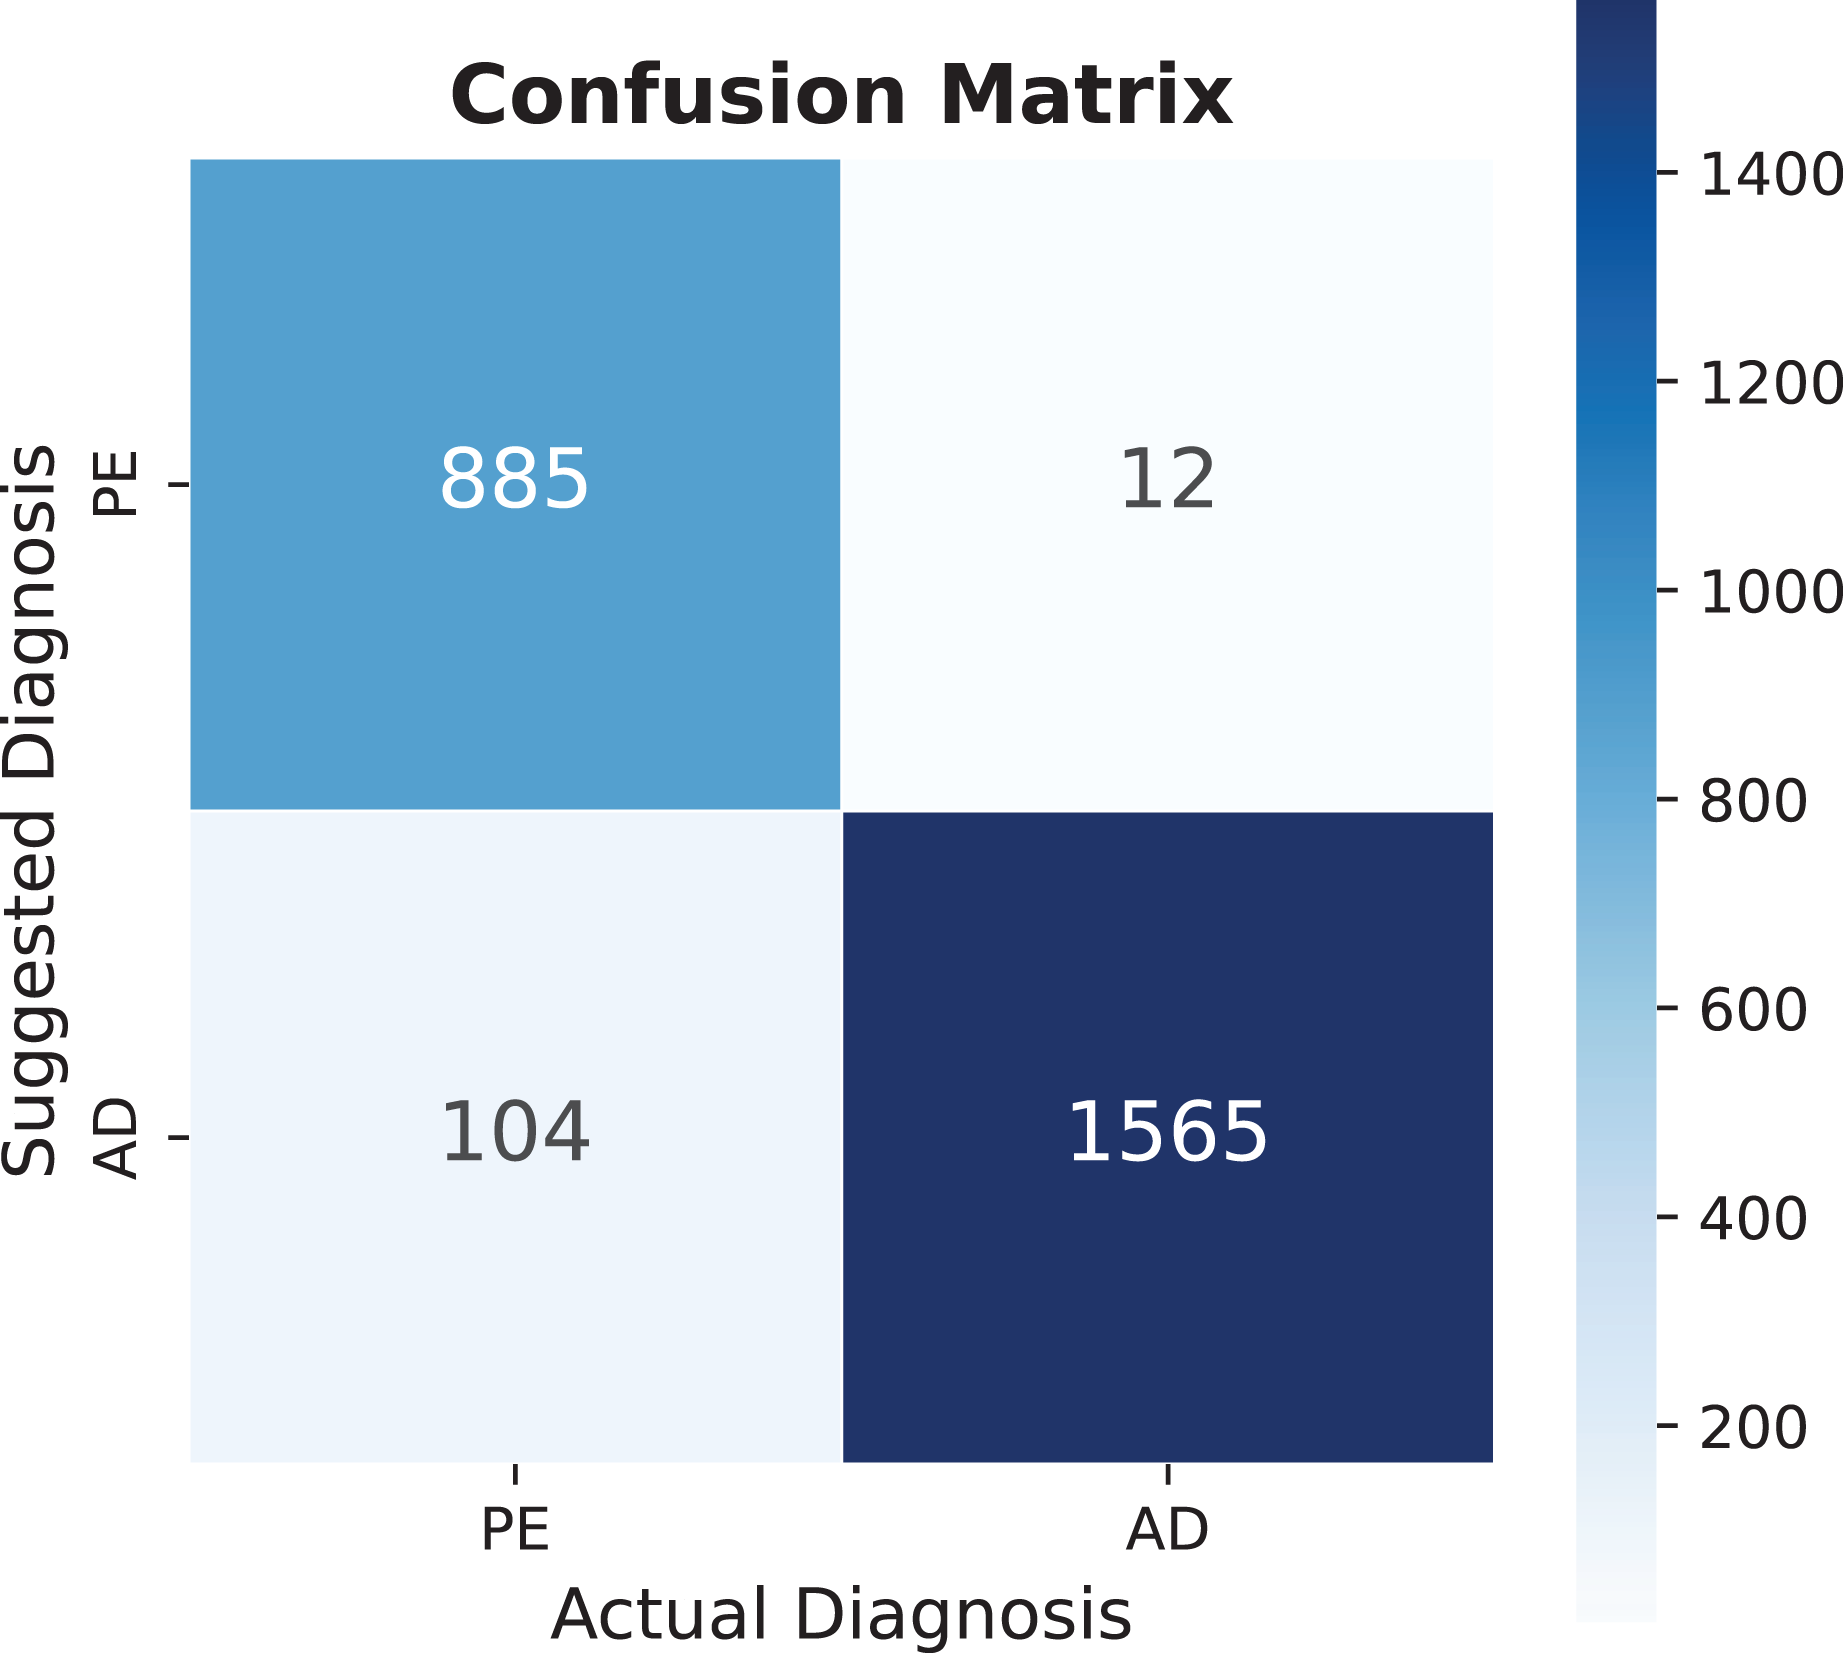
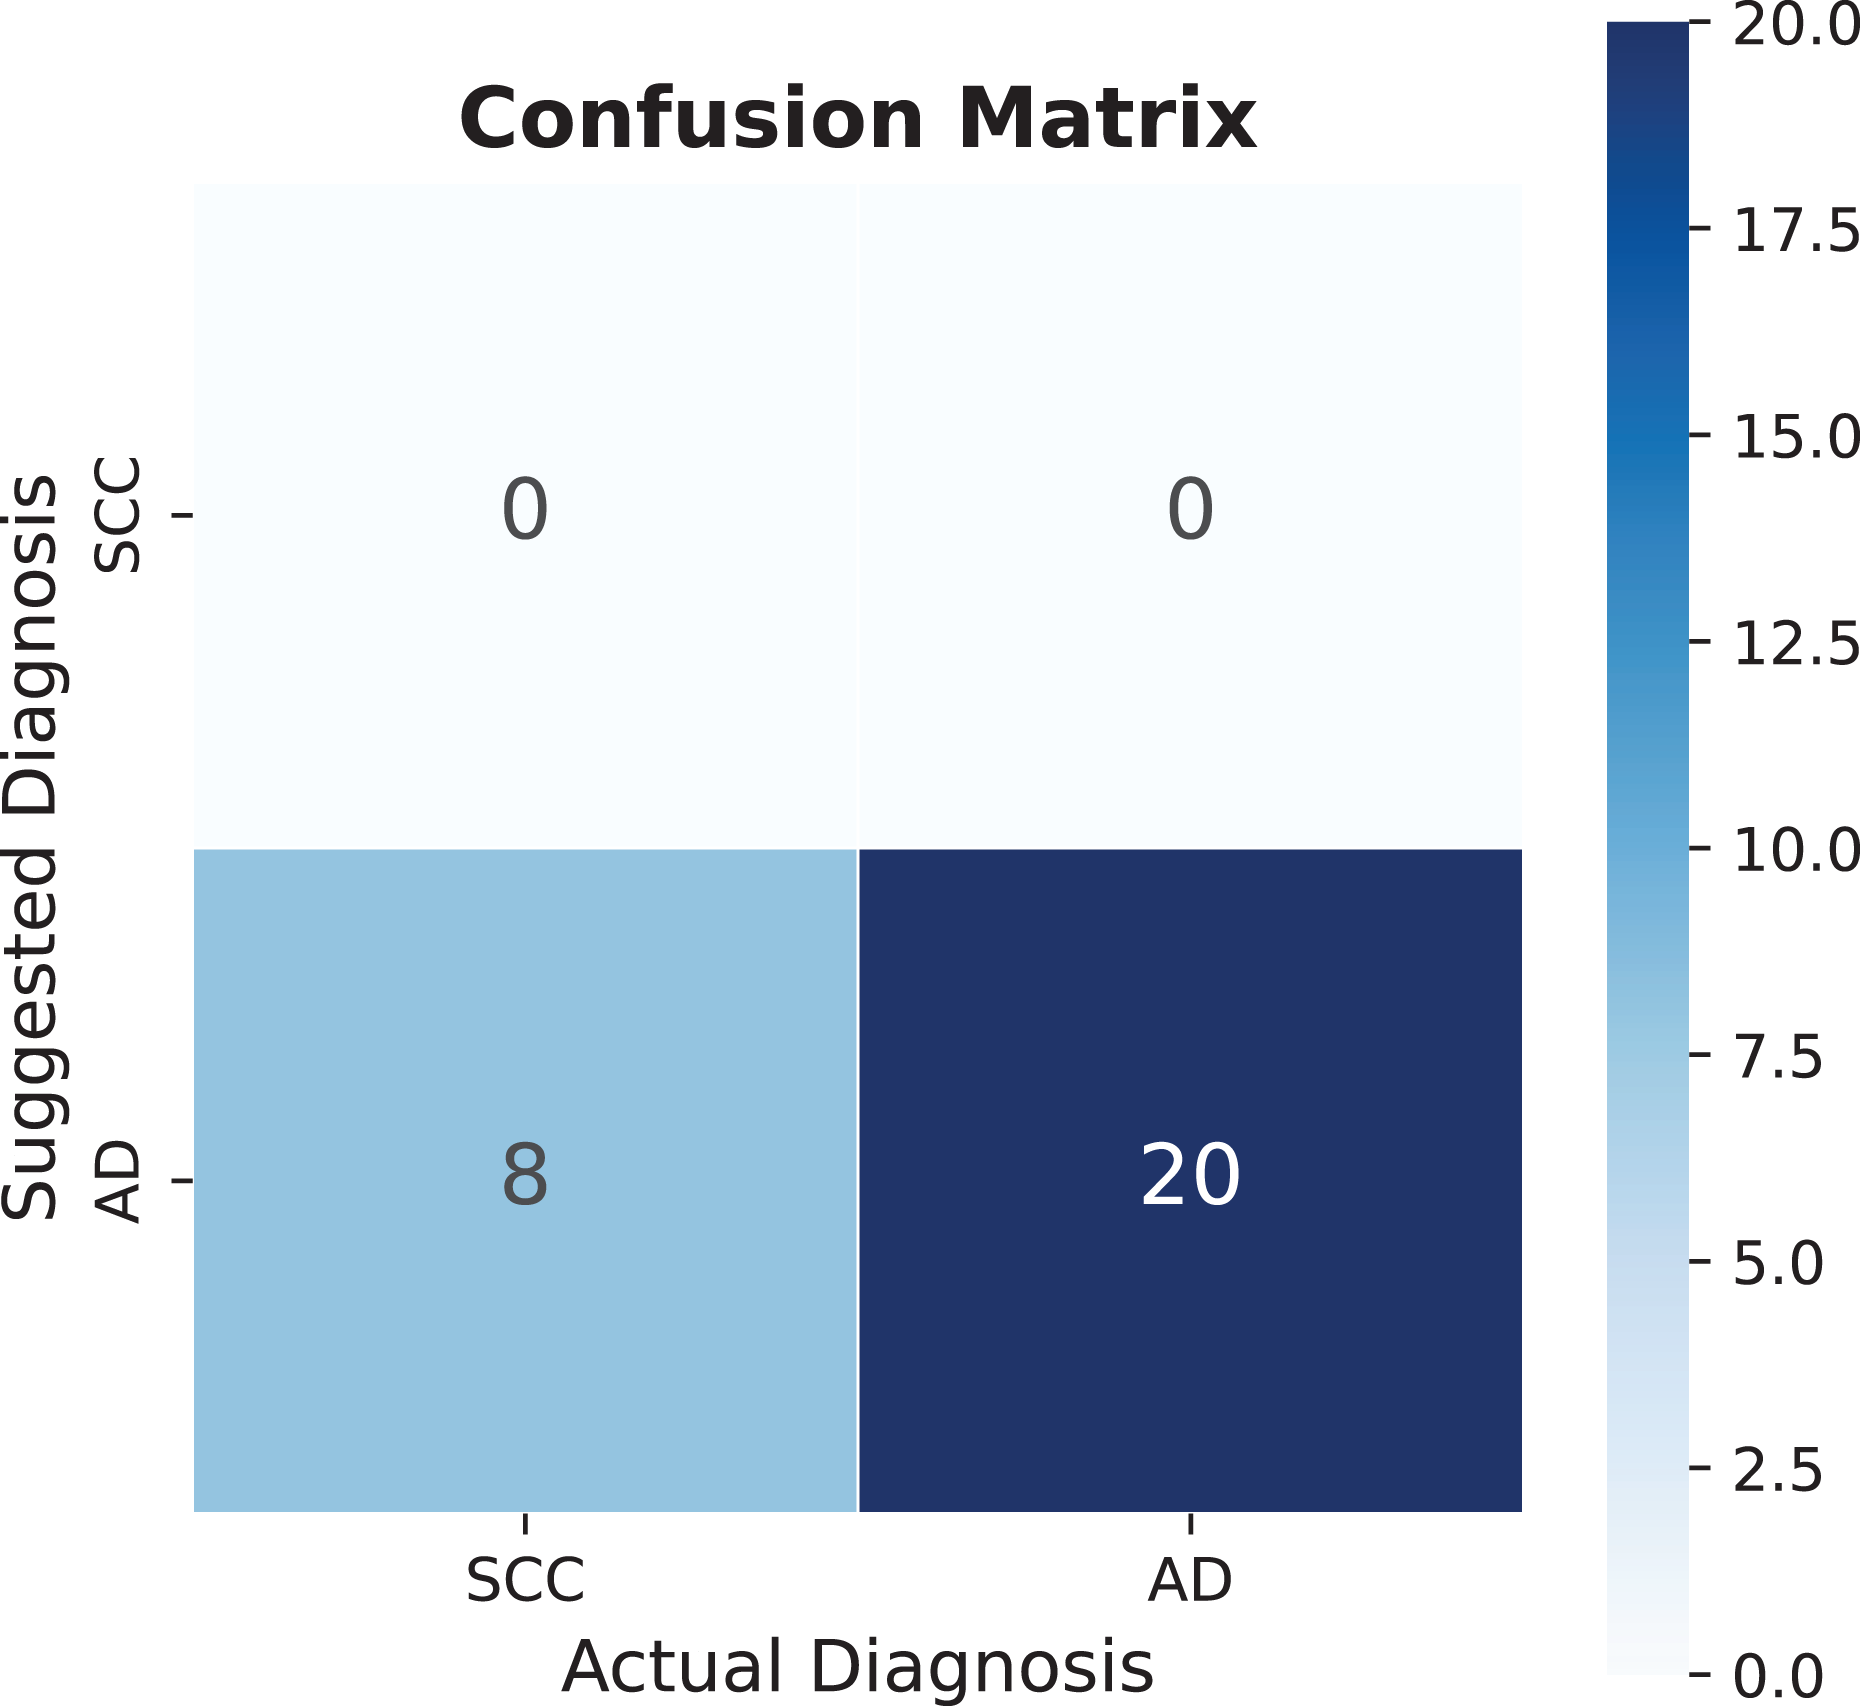
The diagnostic performance analysis reveals varying levels of accuracy across different conditions. While epidural hematoma shows lower accuracy values, the analysis of spinal cord compression presents an opportunity for model refinement. The confusion matrix in Fig. 9 indicates that the model currently has limited detection capability for this diagnosis, which can be attributed to the small sample size of only eight recorded cases. This limited dataset provides valuable insights into the model’s behavior with rare conditions. The potential for improvement becomes evident when considering that adding similar diagnostic patterns can significantly enhance performance metrics. Specifically, the addition of one similar sentence pattern improved accuracy to 86%. However, this improvement warrants careful interpretation, as such dramatic increases in accuracy from small dataset modifications may not fully represent the condition’s general presentation patterns. This finding emphasizes the importance of developing robust databases that capture diverse manifestations of each condition, particularly for less common diagnoses.
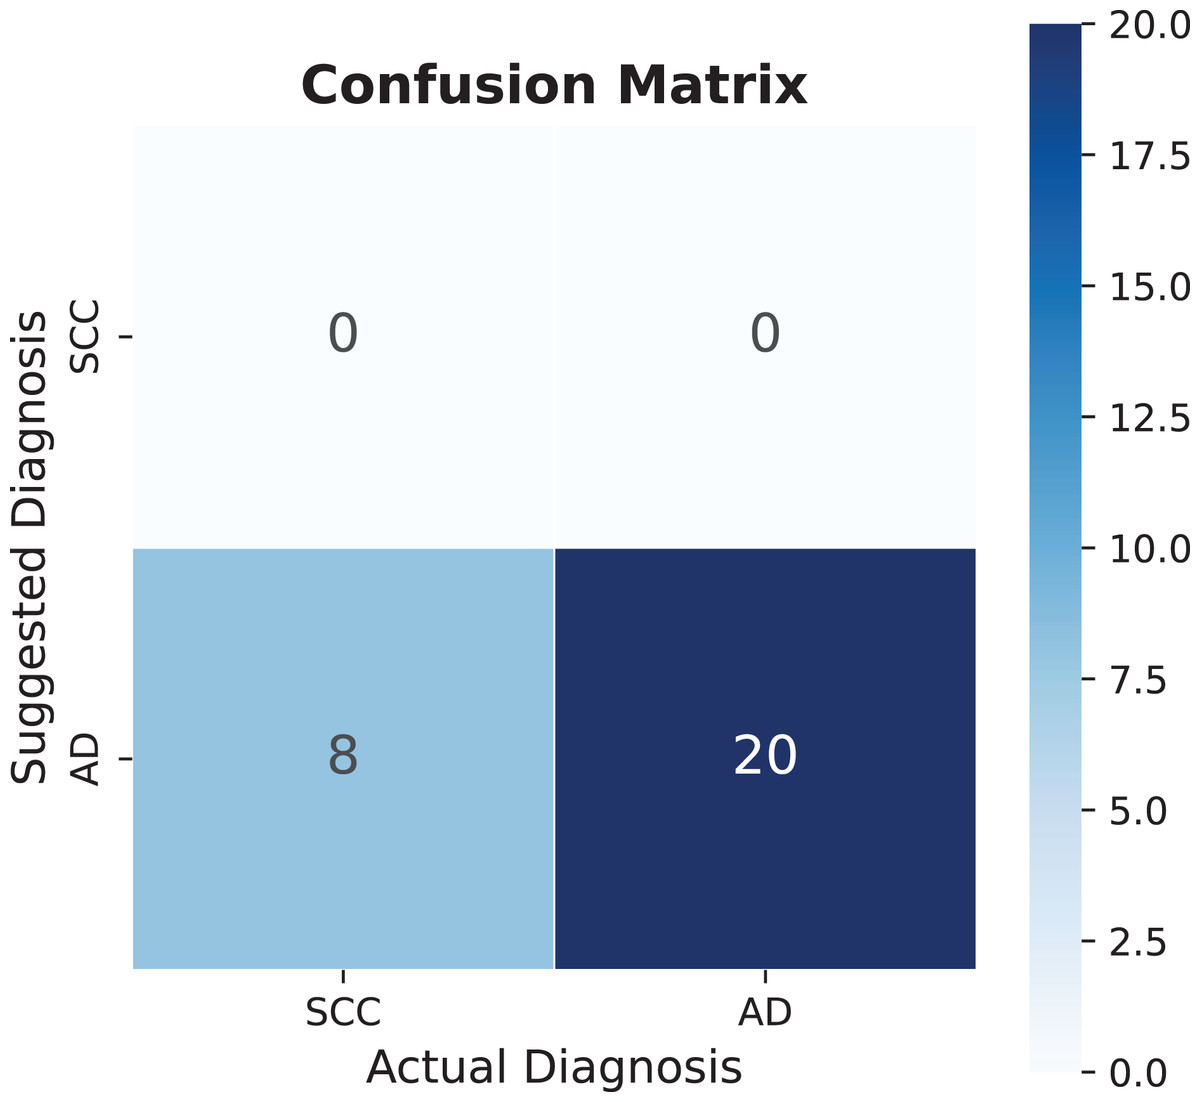
Figure 9: Spinal cord compression (SCC) confusion matrix, AD means another diagnosis.
The analysis of epidural hematoma, with its 115 cases, demonstrates the significant impact of refined diagnostic patterns. As shown in Table 5, the addition of just two sentences improved all performance metrics while maintaining the already optimal recall rate of 100%. This enhancement enabled the detection of 12 additional diagnoses compared to the previous state, illustrating how strategic additions to the knowledge base can substantially improve diagnostic capabilities.
The negation/uncertainty detection algorithm demonstrates exceptional accuracy, validating the reliability of the implemented NORMAL code. Analysis of Fig. 4 reveals a notable pattern in clinical documentation at SES-HUC, where healthcare providers frequently employ vocabulary focused on ruling out potential diagnoses. Understanding these institution-specific documentation patterns proves crucial for minimizing false positive diagnoses and ensuring accurate clinical interpretations.
Analysis of secondary diagnoses reveals promising capabilities of the model, with Table 6 demonstrating successful identification of 58.17% of secondary diagnoses. This performance is particularly noteworthy considering that this information was not explicitly included in the database, and the system currently utilizes only 28.16% of potential secondary diagnoses across just four datasets. The validation process, conducted by highly qualified advisors at SES-HUC, ensures accuracy while providing opportunities for systematic expansion of the system’s capabilities.
The diagnostic patterns reveal significant insights into cardiovascular health conditions. The system effectively identifies markers such as cardiomegaly, with particular success in detecting hyperlipidemia and hypercholesterolemia. These elevated lipid level indicators align with WHO and ASIS statistics regarding cardiovascular disease risk factors, including conditions such as heart attacks, coronary disease, and atherosclerosis (Ballantyne, 2000). The presence of diabetes among the identified conditions further strengthens this cardiovascular risk profile. While bacterial infection appears frequently in the results, its non-specific nature, and it is wide range of symptoms and treatments according to specific bacteria (Sanchez & Doron, 2017), shows that this diagnosis need further investigation.
Depression emerges as another significant finding across multiple analyses. The high prevalence of this diagnosis is particularly relevant given its heterogeneous nature and varying clinical presentations across age groups, as documented by Lee & Passarotti (2022). This finding suggests valuable opportunities for expanding the system’s capabilities by incorporating additional EHR data parameters, such as age-specific diagnostic criteria.
Our approach, while imperfect, offers several advantages over existing systems. It provides non-English language capability (Spanish) and functions independently of specific abbreviations or radiological writing styles. Additionally, it delivers broader diagnostic coverage and demonstrates scalability, as shown in Table 3, where a few indicators can represent multiple diagnoses. Despite being tested on single-hospital data, our methodology has been validated by clinical experts to ensure its accuracy, and its open-source nature addresses a common limitation in the field. However, the model’s generalizability is still constrained by the single-institution dataset, and it has not yet been deployed in a live clinical environment, which are key limitations to be addressed in future work.
Conclusion
The computational model developed in this study demonstrated its effectiveness in improving discharge diagnoses, achieving 87% accuracy in clinical trials. Its integration with structured and unstructured data represents a significant advancement over traditional models. While currently utilizing less than 30% of available datasets, the system successfully identifies both primary and secondary diagnoses.
The system’s effectiveness is particularly evident in specific medical conditions, such as pulmonary embolism, where it demonstrates high accuracy across multiple metrics. The analysis of rare conditions, such as spinal cord compression, provides valuable insights into the system’s scalability, showing that strategic additions to the knowledge base can substantially improve diagnostic accuracy. This is further supported by the case of Epidural Hematoma, where minimal additions to the database resulted in significant performance improvements.
The implemented Negation/Uncertainty Detection algorithm proves highly reliable, offering crucial insights into institutional documentation patterns. The system’s ability to identify cardiovascular risk factors, including hyperlipidemia and hypercholesterolemia, aligns with global health statistics and demonstrates its potential for population health monitoring. Furthermore, the identification of conditions with heterogeneous presentations, such as depression, suggests opportunities for enhanced diagnostic precision through the integration of additional patient-specific data.
The preliminary morbidity statistics reveal key insights into the model’s diagnostic capabilities. The high frequency of certain diagnoses, like pulmonary embolism, indicates the system is well-tuned to the institution’s most common and well-documented critical conditions. Conversely, the poor performance on rare conditions like spinal cord compression highlights a direct dependency on the volume and variety of data; the model cannot learn patterns it has not seen. This underscores that future improvements are contingent on two factors: expanding the dataset to include more examples of less frequent diagnoses, and actively refining the diagnostic patterns for unstructured text. As demonstrated with epidural hematoma, adding just a few expert-validated sentence patterns to the knowledge base can dramatically improve recall and overall accuracy, suggesting that a targeted, iterative refinement process is a highly effective strategy for enhancing outcomes.
While the current implementation requires expert validation and faces some limitations in terms of database comprehensiveness, the results indicate that this model represents a valuable tool for healthcare institutions seeking to optimize their diagnostic processes without requiring fundamental changes to existing workflows or systems. The demonstrated potential for enhancement through expanded dataset utilization and refined diagnostic patterns suggests a promising path forward for continued development and implementation in clinical settings.
Future work
As highlighted earlier, the current approach faces three primary limitations. First, the methodology lacks real-world operational validation, as this study is retrospective and has not been tested in live clinical environments. Second, the data used in this research originates from a single institution, which limits the diversity and generalizability of the findings. Third, the inducers analyzed here represent only a small subset of the hospital’s full dataset, restricting the scope of our conclusions.
To address these gaps, our next steps will focus on three sequential objectives. Initially, we plan to expand the number of inducers integrated into the hospital system. A pilot test with an epidemiology team is already underway to evaluate feasibility and usability, serving as a precursor to broader implementation. Once validated, the tool will be refined for routine hospital-wide use, ensuring its practicality in real-world workflows. Subsequently, we aim to collaborate with external institutions to incorporate multi-institutional data, thereby enhancing dataset variability and strengthening the model’s reliability across diverse clinical settings.
These efforts collectively aim to transform the proposed approach into a scalable, clinically robust tool. By prioritizing operational validation, dataset expansion, and cross-institutional partnerships, we seek to bridge the gap between retrospective research and real-world healthcare applications. This progression will not only improve the model’s generalizability but also lay the groundwork for its adoption as a standardized resource in clinical practice.
Supplemental Information
Token Usage.
The cost in tokens of the Bigger Radiology dataset used
A co-occurrence analysis of medical diagnostic codes from the bigger radiology datasets.
This shows which medical conditions frequently appear together; we only include the cases where the pair of diagnoses appear in the same conclusion at least 2 times.