
Sow posture detection for determining piglet crushing through a camera system
- Published
- Accepted
- Received
- Academic Editor
- Andrea Brunello
- Subject Areas
- Artificial Intelligence, Autonomous Systems, Computer Vision, Data Mining and Machine Learning, Neural Networks
- Keywords
- Sow posture detection, Postural change, Piglet crushing, Warning system
- Copyright
- © 2025 Thongsrimoung et al.
- Licence
- This is an open access article distributed under the terms of the Creative Commons Attribution License, which permits unrestricted use, distribution, reproduction and adaptation in any medium and for any purpose provided that it is properly attributed. For attribution, the original author(s), title, publication source (PeerJ Computer Science) and either DOI or URL of the article must be cited.
- Cite this article
- 2025. Sow posture detection for determining piglet crushing through a camera system. PeerJ Computer Science 11:e3400 https://doi.org/10.7717/peerj-cs.3400
Abstract
Piglet crushing by sows is a leading cause of pre-weaning mortality on commercial pig farms. While improved management can mitigate this, resource limitations often hinder timely intervention. This article proposes an automated warning system that analyzes sow posture from surveillance footage in real-time to predict and prevent crushing events. We developed a posture detection model using You Only Look Once (YOLO)v8, trained on 422 real-world instances, which achieved a mean Average Precision (mAP@50) of 0.976. Our analysis revealed a significant increase in the frequency of sow postural changes on the day of a crushing event (8.23) and the day prior (7.49), compared to non-crushing days (5.52). Leveraging this insight, we designed a warning system using a threshold-based voting algorithm that analyzes posture changes over a 60-min window. The system’s performance was evaluated at two levels. For instance-based warnings (on a 60-min basis), it achieved a sensitivity of 62.50% and a specificity of 60.25%. When aggregated to a daily basis, the performance improved to a sensitivity of 71.42% and a specificity of 84.61%, respectively. Our results indicate that sow postural change frequency is a promising indicator for developing early warning systems, empowering farmers to take preventative action and reduce piglet losses.
Introduction
Swine production is a critical component of food security, but its profitability is often impacted by production losses. Health management strategies, including biosecurity, health surveillance and preventive procedures such as the use of food additives and vaccinations, can limit the risks and impact of disease infection (Riekert et al., 2020). Although biosecurity and prevention programs protect pig farms from the risk of infection, health monitoring is necessary for early notification of disease and abnormality warnings to mitigate production loss. A significant challenge in commercial farming is pre-weaning piglet mortality, with crushing by the sow being a primary cause of economic loss, particularly in regions like Thailand (Nuntapaitoon & Tummaruk, 2015, 2018). These accidental events are multifactorial and influenced by genetics, the environment, housing systems, and the characteristics of both the sow and her piglets. The survival rate of the piglets depends on the rescue time and frequent monitoring. Therefore, identifying reliable predictors and enabling rapid intervention are crucial to mitigate these losses (Liu et al., 2022; Valros et al., 2003; Wischner et al., 2009).
Sow behavior is a key indicator of crushing risk. Research has identified specific postures and activities associated with these events, particularly when a sow transitions from standing to lying down or rolls over. For instance, extended standing periods, frequent postural changes, and a higher incidence of ventral lying are linked to an increased risk, whereas behaviors like nesting and careful pre-lying movements (e.g., sniffing piglets) are more common in non-crushing sows. Although piglet distress sounds can signal an ongoing event, they are not always reliable predictors, and a successful rescue ultimately depends on an immediate response (Valros et al., 2003; Wischner et al., 2009; Illmann et al., 2013; Manteuffel et al., 2017). However, continuous manual monitoring is labor intensive and impractical, especially for smallholder farmers who often face labor and experience constraints. Furthermore, frequent human entry into farrowing pens poses a significant biosecurity risk, potentially introducing pathogens that compromise herd health (Anderson et al., 2021; Nöremark et al., 2009).
Automated monitoring systems that use computer vision offer a promising, non-invasive solution to these challenges. Among various data sources, 2D video from standard surveillance cameras is especially useful due to its low cost and ability to capture rich behavioral data, despite issues like variable lighting and viewing angles (Guo et al., 2023). Deep learning, particularly object detection models, has proven highly effective for analyzing such video data (Riekert et al., 2020; Zheng et al., 2020). Two-stage detectors like Faster region-based convolutional neural networks (R-CNN) have shown high accuracy (up to 95.5%) in detecting sow posture but can be less reliable when subjects are near the edge of the frame or in motion (Alameer, Kyriazakis & Bacardit, 2020; Riekert et al., 2020; Zheng et al., 2018, 2020). In contrast, single-stage detectors like You Only Look Once (YOLO) provide a better balance of speed and precision, making them ideal for real-time applications. The recent popular version, YOLOv8, improves upon its predecessors in both performance and efficiency.
Therefore, this study aims to address the challenge of piglet crushing on small-scale farms by developing and evaluating an automated warning system. We use the YOLOv8 object detector to analyze 2D video footage of sows, creating a system that can alert farmers to high-risk situations in real-time. The primary objective is to provide a cost-effective and practical tool that enables timely intervention, ultimately reducing piglet mortality and improving animal welfare on smallholder farms in Thailand.
Materials and method
Overview
The contents are those of the author(s) and do not necessarily represent the official views of, nor an endorsement, by CDC/HHS, or the U.S. Government. To create a warning system based on sow postural changes, a posture detection model was trained using the YOLOv8 architecture, selected for its optimal balance of accuracy and size. The model was trained and validated on a sow posture dataset collected from a commercial pig farm. Then, the postural changes in sows were analyzed, involved in crushing events compared to those in non-crushing situations to identify the unique characteristics of each group. Based on this analysis, we established warning criteria that were subsequently validated and tested using video footage from the farm, as illustrated in Fig. 1.
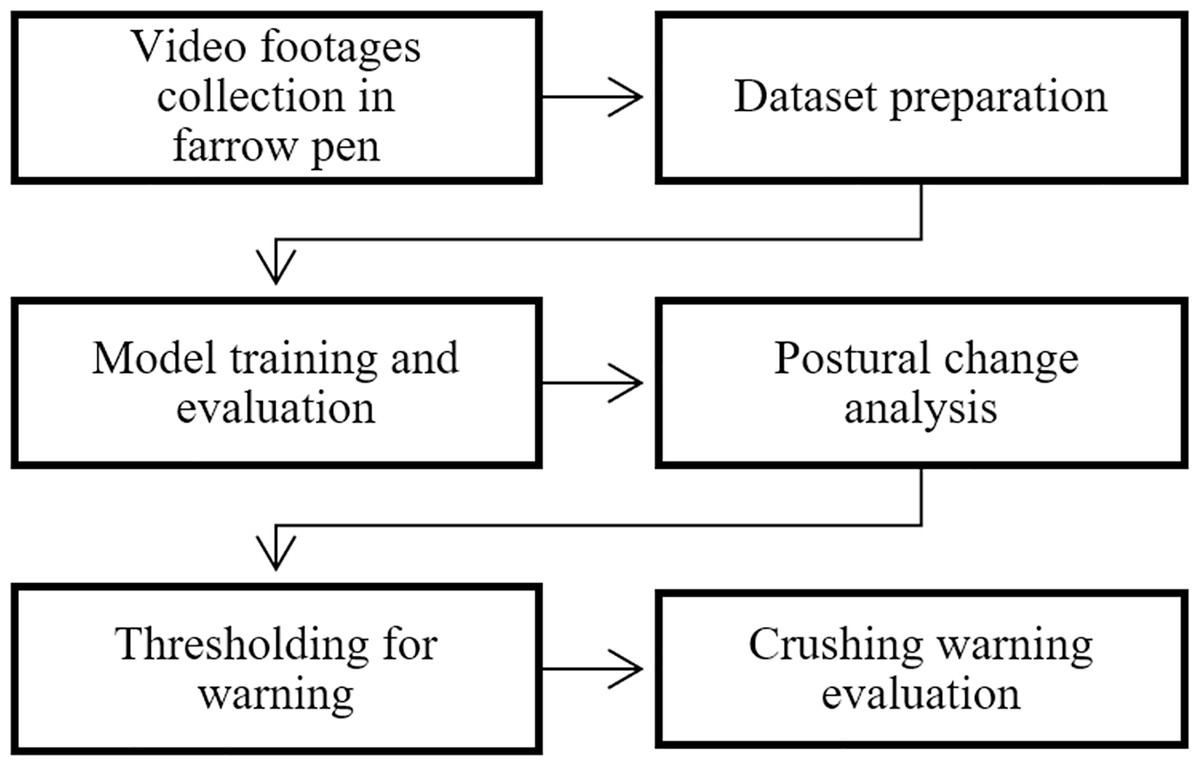
Figure 1: An overview framework of developing piglet crushing warning solution.
Sow posture detection model
Sow posture dataset preparation
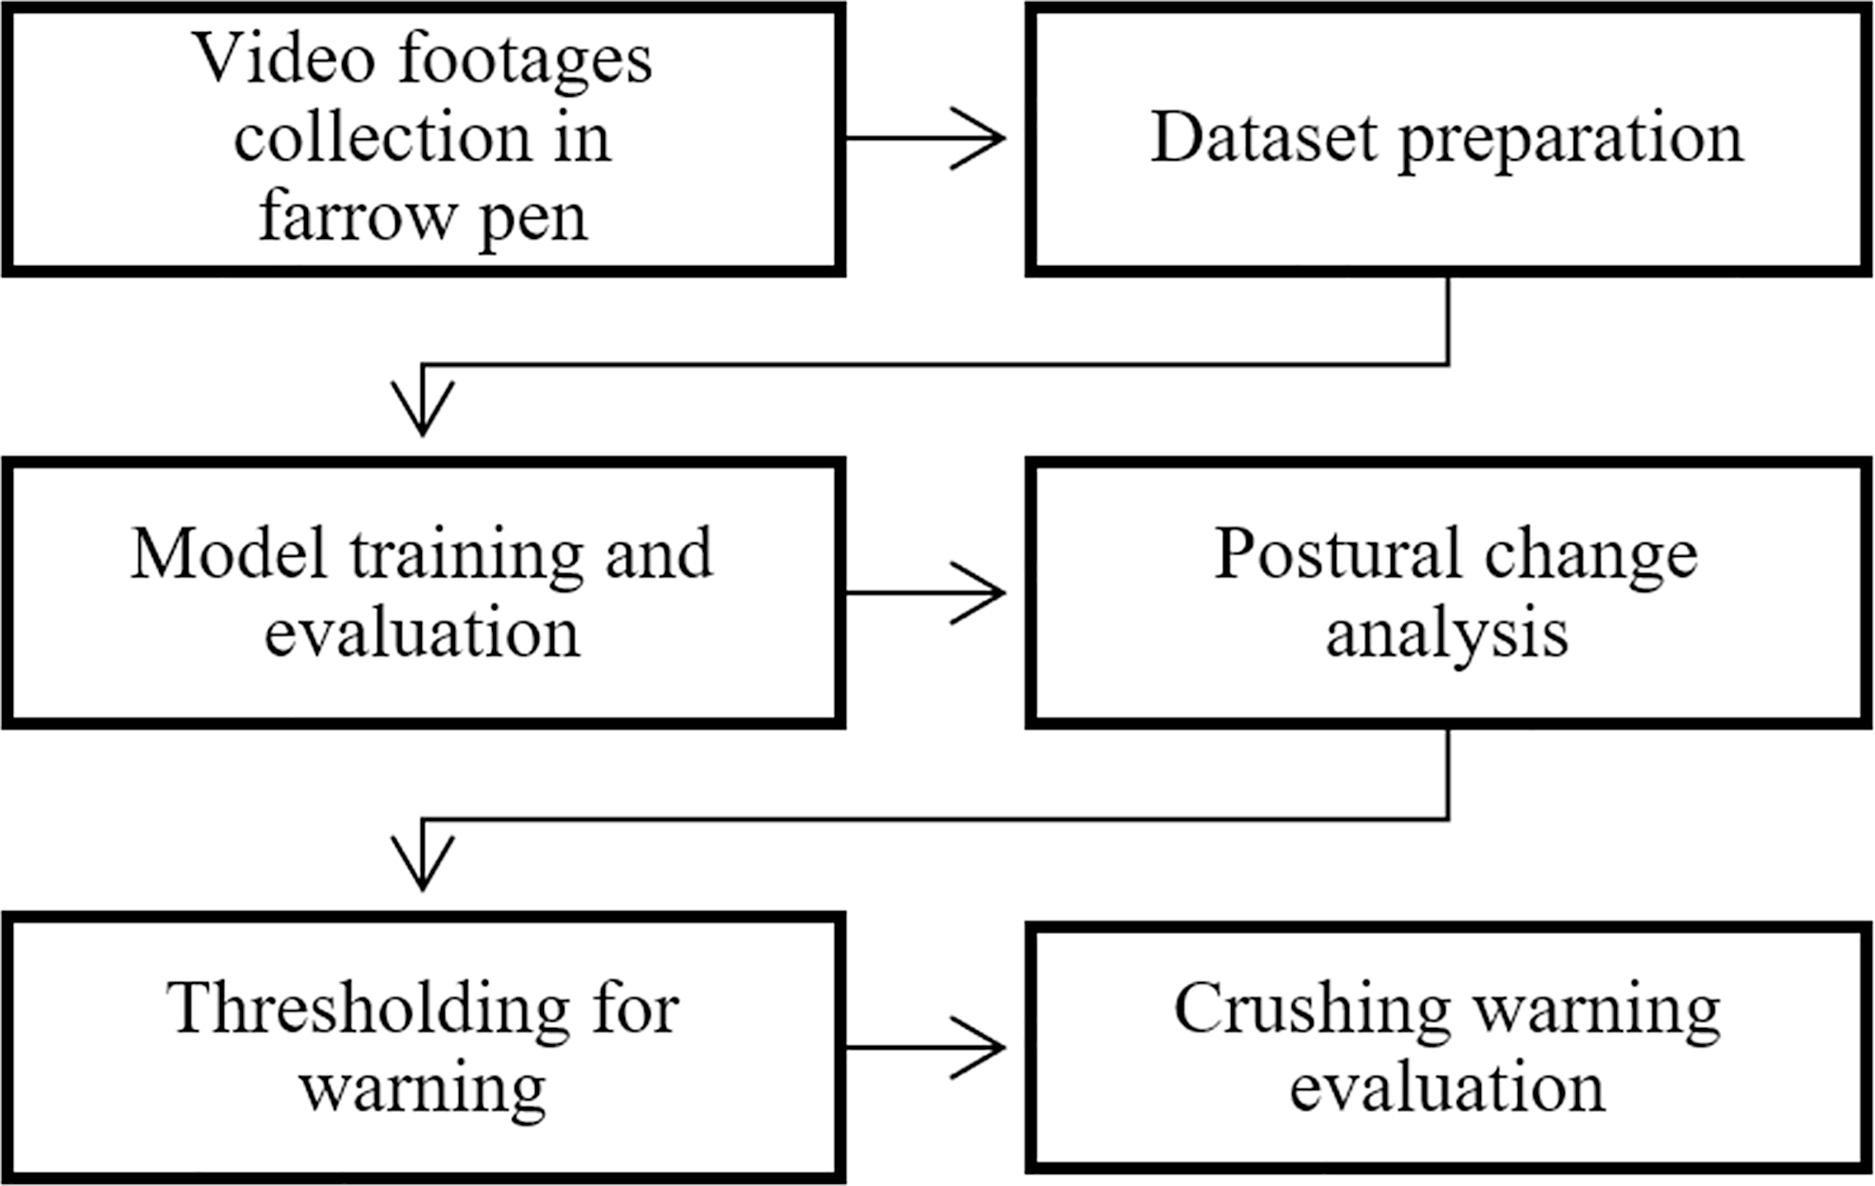
Video data was collected from a small-scale commercial pig farm in Thailand. Two surveillance cameras were positioned to monitor four sow farrowing pens, as depicted in Fig. 2. Footage was recorded by these cameras at a resolution of 1,920 × 1,080 pixels, with a frame rate of 15.15 frames per second (fps) and a total bit-rate of 2,126 kbps. For this study, footage was selected exclusively from the hours of 8:00 a.m. to 4:00 p.m. This period was chosen to ensure consistent natural lighting. It also corresponds to the sows’ most active hours, when more frequent postural changes are typically exhibited.
Figure 2: Image captured form 2 surveillance cameras in farrowing house, camera 1 (A) and camera 2 (B).
To create the posture dataset, an annotation pool was first established by sampling images from the video footage at 10-s intervals. Since the data originated from a commercial production farm, the dataset includes images from multiple sows, reflecting standard farm conditions. The DarkLabel annotation tool (darkpgmr, 2021) was used to label each sow’s posture into one of five distinct classes: standing (ST), sitting (SI), ventral recumbency (VR), right lateral recumbency (RR), and left lateral recumbency (LR). Detailed definitions for each class are provided in Table 1, with visual examples shown in Fig. 3. For each annotated instance, a bounding box was generated in the format required by YOLOv8, specifying the class label and the normalized coordinates of the box’s center, width, and height. Following the annotation process, all images were resized to 640 × 640 pixels using bilinear interpolation. Finally, the completed dataset was randomly partitioned into training and validation sets using an 80:20 ratio.
| Posture | Definition |
|---|---|
| Standing | Sow stands on four feet |
| Sitting | Sow uses forelimb or hindlimb to support, |
| while another lay down | |
| Ventral recumbency | Sow lays down on the floor using |
| chest | |
| Right lateral recumbency | Sow uses right side of body lay down |
| on the floor | |
| Left lateral recumbency | Sow uses left side of body lay down |
| on the floor |
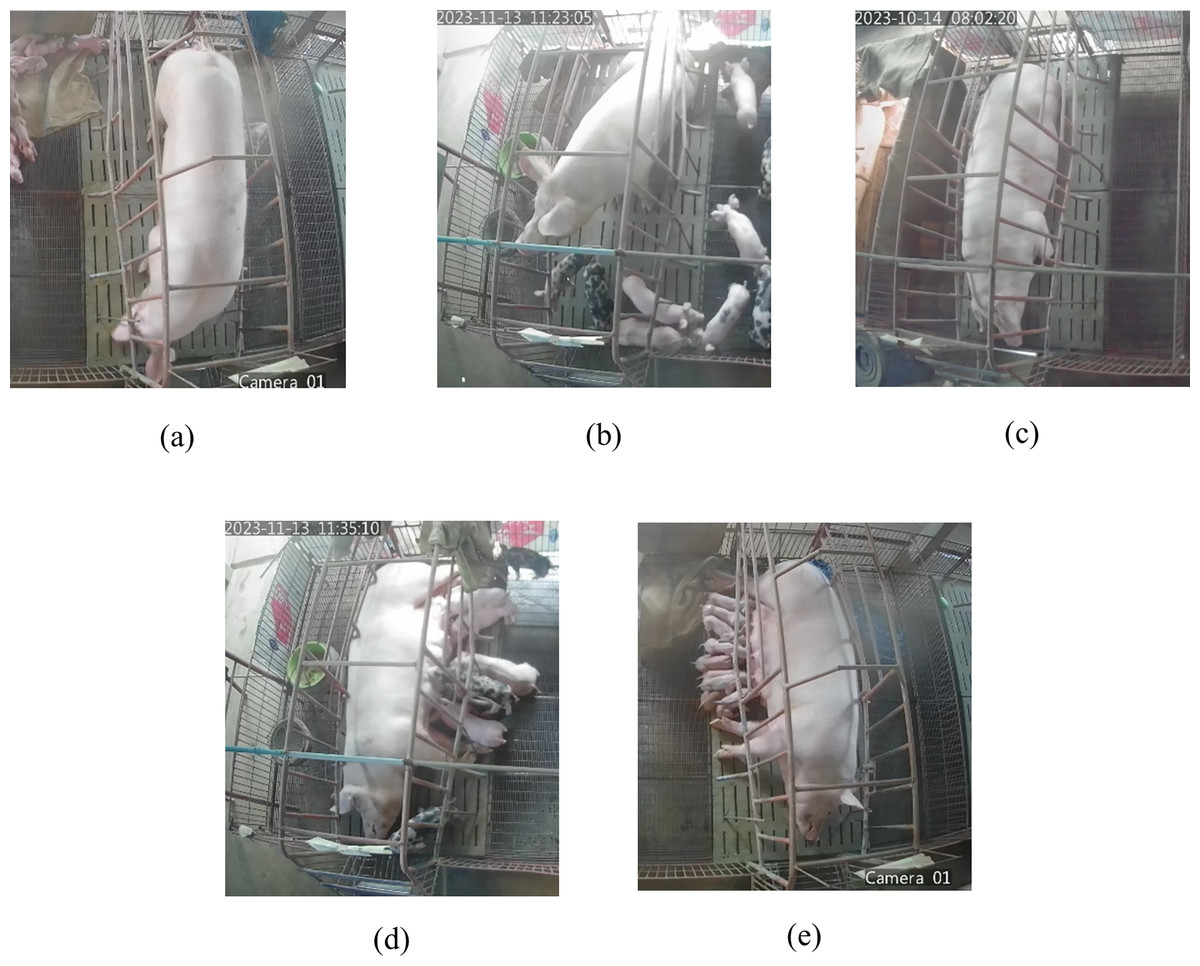
Figure 3: This figure shows sample images of five sow postures including (A) standing, (B) sitting, (C) ventral recumbency, (D) right lateral recumbency, and (E) left lateral recumbency.
Model training and validation
The experiments were conducted on a machine equipped with a 12th Gen Intel(R) Core(TM) i9-12900K (3.20 GHz) processor, 32 GB of RAM, and an NVIDIA GeForce RTX 3080 GPU. For this study, the pre-trained YOLOv8 model, released by Ultralytics in 2023, was utilized for transfer learning, and different model sizes (n, s, m, l, and x) were trained and evaluated. The models were trained for 200 epochs with a batch size of 16, using default settings for all hyperparameters and data augmentations (Jocher, Qiu & Chaurasia, 2023). Model performance was assessed using 5-fold cross-validation, for which the dataset was shuffled and partitioned into five folds. In each iteration, one fold (20%) was used for validation while the remaining four (80%) were used for training. The evaluation metrics included detection time, mean Average Precision at a 50% IoU threshold (mAP@50), and mean Average Precision across IoU thresholds from 50% to 95% (mAP@50–95). The mAP metric measures detector accuracy by calculating the mean of the Average Precision values across all sow posture classes, where a detection for mAP@50 is considered correct only if its bounding box has an IoU of at least 50% with the ground-truth box.
Crushing data
To establish ground truth, daily monitoring of all farrowing pens was conducted by the farm owner via camera footage. A standardized logging form was used to systematically record the pen number, any observed abnormalities, and the confirmation of a crushing event. Although these logs were submitted weekly, a specific data collection protocol was triggered by the confirmation of a crushing event. Following such a confirmation, the corresponding video footage from 8:00 a.m. to 4:00 p.m. was retrieved for a three-day period, covering the day the event occurred and the two preceding days.
Warning solutions
To develop the crushing warning system, three distinct classification approaches were evaluated. The first was a Decision Tree, a supervised learning model that creates a flowchart-like structure. In this model, data is sequentially split based on the most informative features to form a path of decision branches terminating in a final classification. The second approach was a support vector machine (SVM), an algorithm in which an optimal hyperplane is identified to separate data points into different classes by maximizing the margin between them. The third was a custom threshold-based voting method, which is detailed in the following sections.
Postural change dataset
To create the dataset for the warning system, a postural change dataset was derived by applying the trained posture detection model to the collected video footage. This footage included video from confirmed crushing days, the two days prior to a crushing event, and non-crushing days. A postural change event was defined as a difference in the sow’s classified posture between two consecutive 10-s intervals (Fig. 4). The total number of these events was then calculated and aggregated over four time windows including 5, 10, 30, and 60 min.
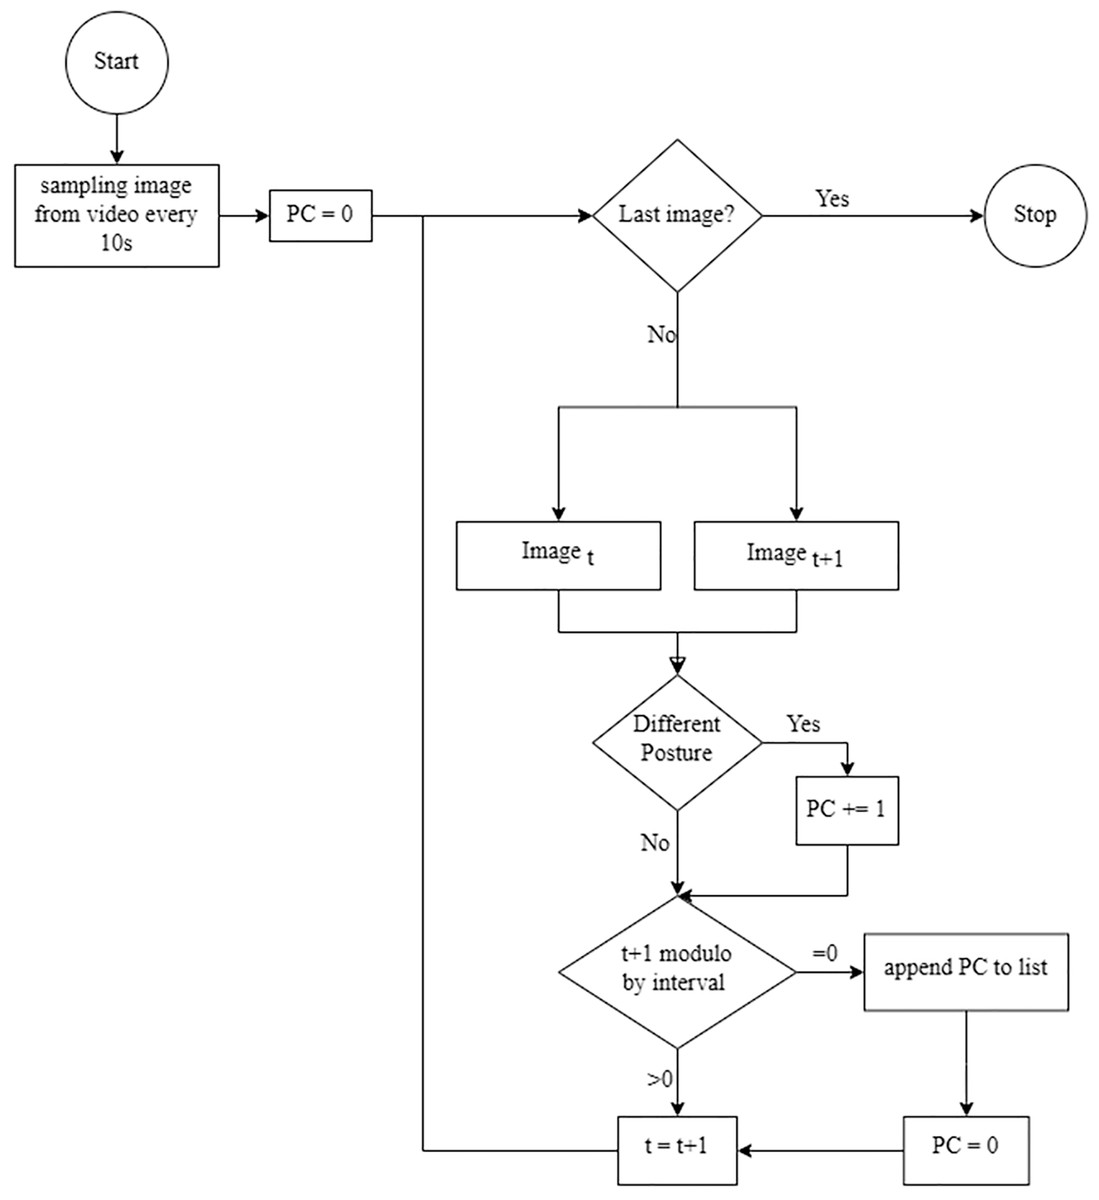
Figure 4: This flow diagram illustrates the method used to calculate postural change (PC) frequency.
To detect a PC, the current image (Image t) is sequentially compared with the subsequent image (Image t + 1). The total number of detected PCs is then accumulated over a defined target interval, such as a 10-min period corresponding to 60 images.
To identify an effective window for issuing warnings, a descriptive analysis was performed on this aggregated data. The data were structured for two separate comparisons. In the first analysis, data from crushing days and pre-crushing days were combined to form a “high-risk” group and compared against non-crushing days. In the second analysis, a more direct comparison was made between only crushing days and non-crushing days.
Decision tree
The first model evaluated was a decision tree built using the Classification and Regression Tree (CART) algorithm, which is known for its high interpretability and robustness.
Feature engineering. The goal was to issue a warning on an hourly basis. Therefore, features were engineered from the postural change (PC) frequency data using a 60-min sliding window. For each hour, a set of seven descriptive statistics was calculated from the six consecutive 10-min PC frequency counts, including the mean, standard deviation, minimum, maximum, and the first (25th), second (50th), and third (75th) quartiles. These statistics were then used as the input features for the model.
Hyperparameter tuning. The dataset, composed of these above extracted features, was partitioned into training and validation sets. A grid search with 5-fold cross-validation was employed to find the optimal hyperparameters for the tree. Three key hyperparameters included in the search space were criterion (gini, entropy, log_loss), max_depth (3, 5, 7, 9, 11), and min_samples_split (0.05, 0.1, 0.2). The best hyperparameter combination was selected based on the model that yielded the highest mean sensitivity across the validation folds. All other hyperparameters were kept at their default values (e.g., splitter=best, random_state=42, etc.).
Support vector machine
The second model evaluated was SVM, implemented via a support vector classifier (SVC). It was hypothesized that an SVM would be effective given the relatively small number of crushing events in the dataset. The same feature set extracted for the decision tree, comprising seven descriptive statistics over a 60-min window, was used as input for the SVC.
Hyperparameter tuning. Similar to the CART model, a grid search with 5-fold cross-validation was employed to optimize the SVC’s hyperparameters. The search space was designed to evaluate the model’s performance with different kernel functions and regularization strengths. Specifically, four kernel functions (linear, polynomial, rbf, sigmoid) and three values for the regularization parameter C (1.0, 0.1, 0.01) were tested. The hyperparameter combination that resulted in the highest mean sensitivity across the validation folds was selected for the final model.
Threshold and voting
This method is a custom algorithm in which a statistical threshold is combined with a voting system to issue warnings. In this approach, the median of the postural change (PC) frequency is used as the key threshold. Sow activity is analyzed in 10-min intervals, and if the PC frequency exceeds the pre-determined median, the interval is flagged as a potential high-risk period.
To prevent false alarms from isolated spikes in activity, a final warning is only issued on an hourly basis through a voting process. Over a 60-min period, flags from the six 10-min intervals are collected. A final crushing warning is produced only if a majority of these intervals are flagged as high-risk. Through this voting mechanism, it is ensured that a warning is based on a sustained period of unusual activity rather than a single, brief event (as illustrated in Fig. 5).
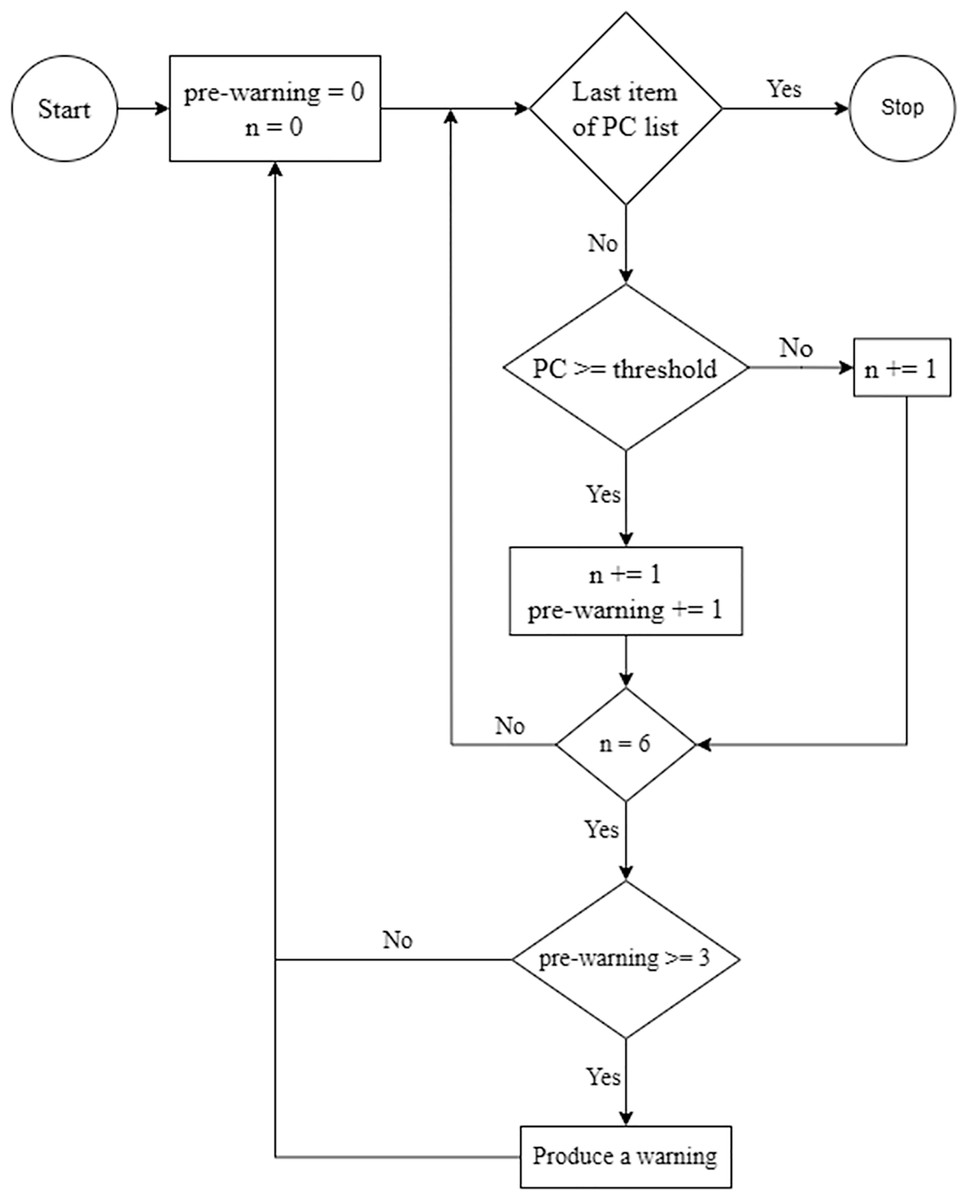
Figure 5: A flow diagram illustrates the hourly warning mechanism.
First, the postural change (PC) count is calculated for a 10-min interval. If this count exceeds a preset threshold, a “pre-warning” is triggered for that interval. A counter (n) tracks the number of intervals that have been evaluated. After six consecutive 10-min intervals (totaling 1 h), a final warning is issued based on a voting system that aggregates the number of pre-warnings recorded during that hour.
Warning evaluation
The performance of each warning system was evaluated on a test set of video footage from known crushing and non-crushing days. The models’ ability to correctly classify different periods was evaluated, with a specific focus on performance when data from crushing and pre-crushing days were combined (high-risk days), as well as on the actual day of a crushing event. To assess performance, the sensitivity and specificity of each model were calculated on both an instance-based (hourly) and an aggregated (daily) basis.
Instance-based evaluation. An instance was defined as a 60-min time block. For a known crushing event, if a warning was issued during any given hour, that hour was counted as a true positive (TP). If a warning was not issued, the hour was counted as a false negative (FN). Conversely, for a non-crushing day, any hour in which a warning was issued was considered a false positive (FP), and any hour without a warning was considered a true negative (TN).
Daily-based evaluation. To evaluate performance on a full-day basis, the hourly predictions were aggregated. A day was classified as positive (a crushing day) if warnings were issued for more than half of the monitored hours (i.e., more than four of the eight hours from 8:00 a.m. to 4:00 p.m.). If this criterion was met for a known crushing day, the day was counted as a daily true positive. The same logic was applied conversely for non-crushing days to determine daily true negatives and false positives.
Results
For this study, images from nine distinct sows, recorded across ten video clips, were sampled to create the annotation pool. A total of 280 images, comprising 422 individual sow posture instances, were labeled and used for training the posture detection model. The class distribution of these instances was as follows, including 85 standing, 39 sitting, 113 ventral recumbency, 77 left lateral recumbency, and 108 right lateral recumbency.
Posture detection model performance. Several models from the YOLOv8 family were evaluated, and performance differences between model sizes were found to be minimal (Table 2). Consequently, the smallest and most computationally efficient model, YOLOv8n, was selected for all subsequent analyses. High overall performance in detecting the five distinct sow postures was demonstrated by the YOLOv8n model, as detailed in Table 3.
| Size | Number of parameters (Millions) | Inferencing time (ms) | Precision | Recall | mAP@50 | mAP@50-95 |
|---|---|---|---|---|---|---|
| YOLOv8n | 3.006 | 5.960 | 0.970 | 0.958 | 0.976 | 0.896 |
| YOLOv8s | 11.137 | 6.700 | 0.967 | 0.968 | 0.982 | 0.908 |
| YOLOv8m | 25.842 | 11.500 | 0.967 | 0.972 | 0.985 | 0.916 |
| YOLOv8l | 43.610 | 15.520 | 0.969 | 0.966 | 0.977 | 0.908 |
| YOLOv8x | 68.128 | 21.680 | 0.961 | 0.974 | 0.983 | 0.907 |
| Posture | Precision | Recall | mAP@50 | mAP@50–95 |
|---|---|---|---|---|
| Standing | 0.969 | 0.975 | 0.979 | 0.867 |
| Sitting | 0.938 | 0.872 | 0.923 | 0.864 |
| Ventral recumbency | 0.966 | 0.961 | 0.988 | 0.889 |
| Left lateral recumbency | 0.985 | 0.982 | 0.994 | 0.937 |
| Right lateral recumbency | 0.989 | 1.000 | 0.995 | 0.921 |
Postural change frequency analysis. The postural analysis was conducted on video data collected over a total of 28 days, comprising 7 crushing days, 8 pre-crushing days, and 13 non-crushing days. In an initial analysis, the mean frequency of postural changes was found to be consistently higher on crushing days and on days preceding a crushing event compared to non-crushing days, across all measured time intervals (Figs. 6 and 7). The mean frequencies of postural change for each condition are summarized in Table 4.
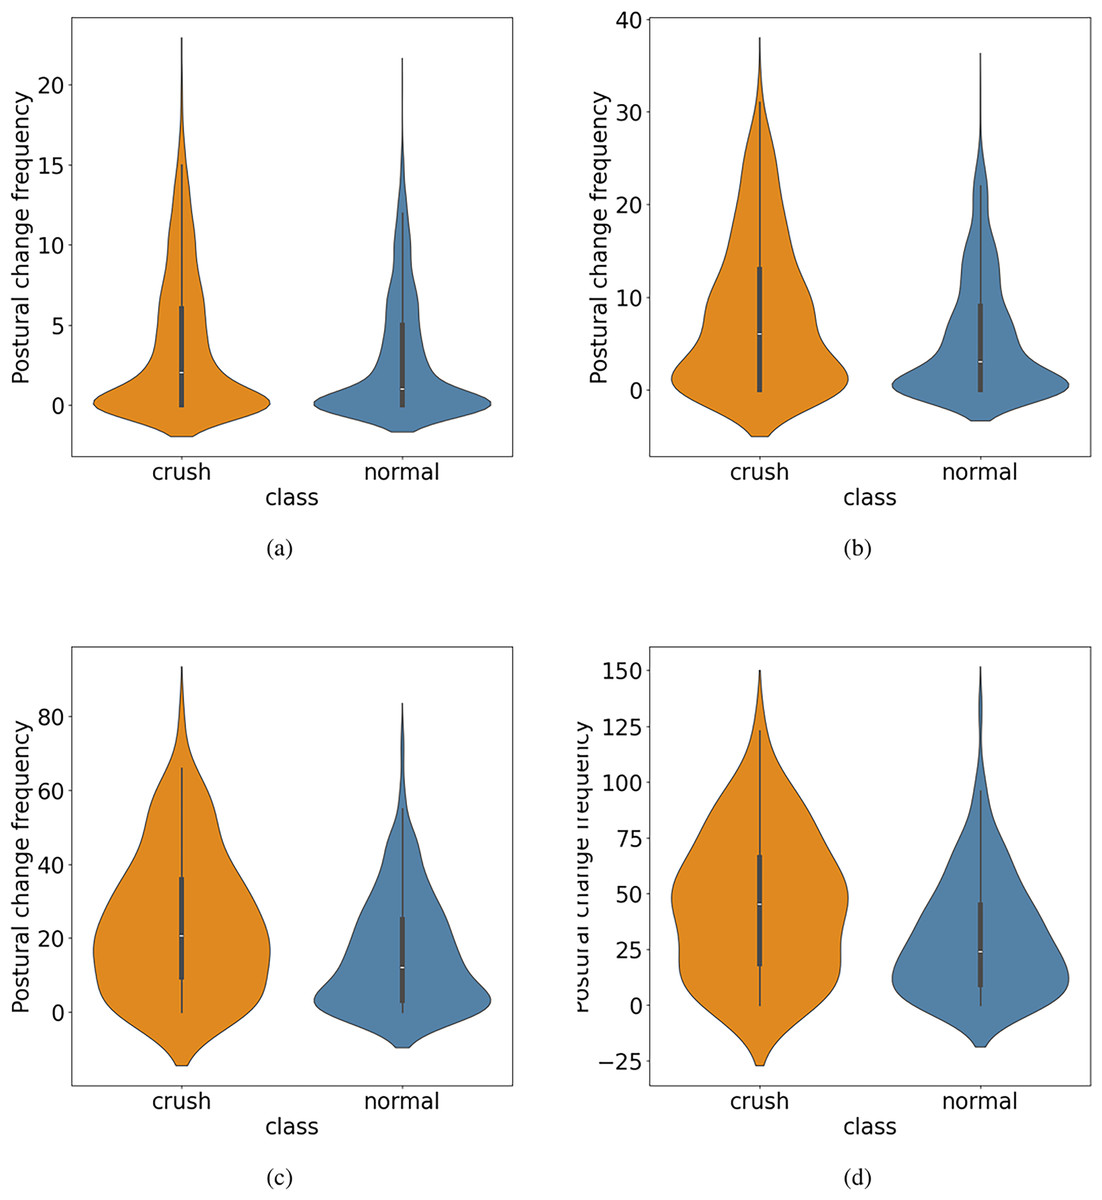
Figure 6: The postural change frequency on crushing vs. non-crushing days is illustrated using violin plots for four different time windows, including (A) a 5-min window, (B) a 10-min window, (C) a 30-min window, and (D) a 60-min window.
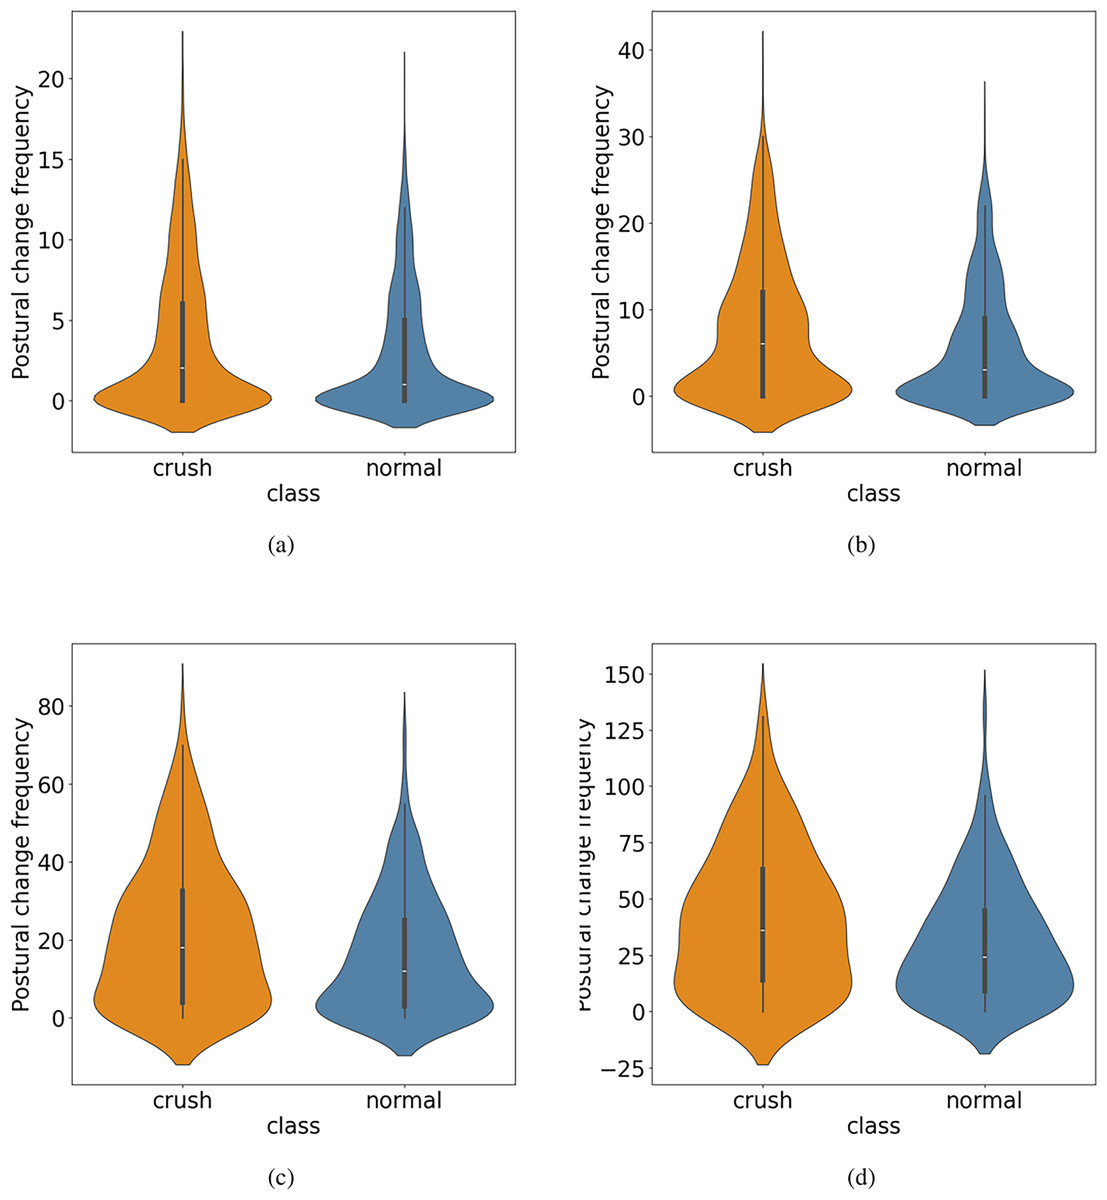
Figure 7: The postural change frequency on high-risk days (crushing and pre-crushing days combined) vs. non-crushing days is illustrated using violin plots for four different time windows, including (A) a 5-min window, (B) a 10-min window, (C) a 30-min window, and (D) a 60-min window.
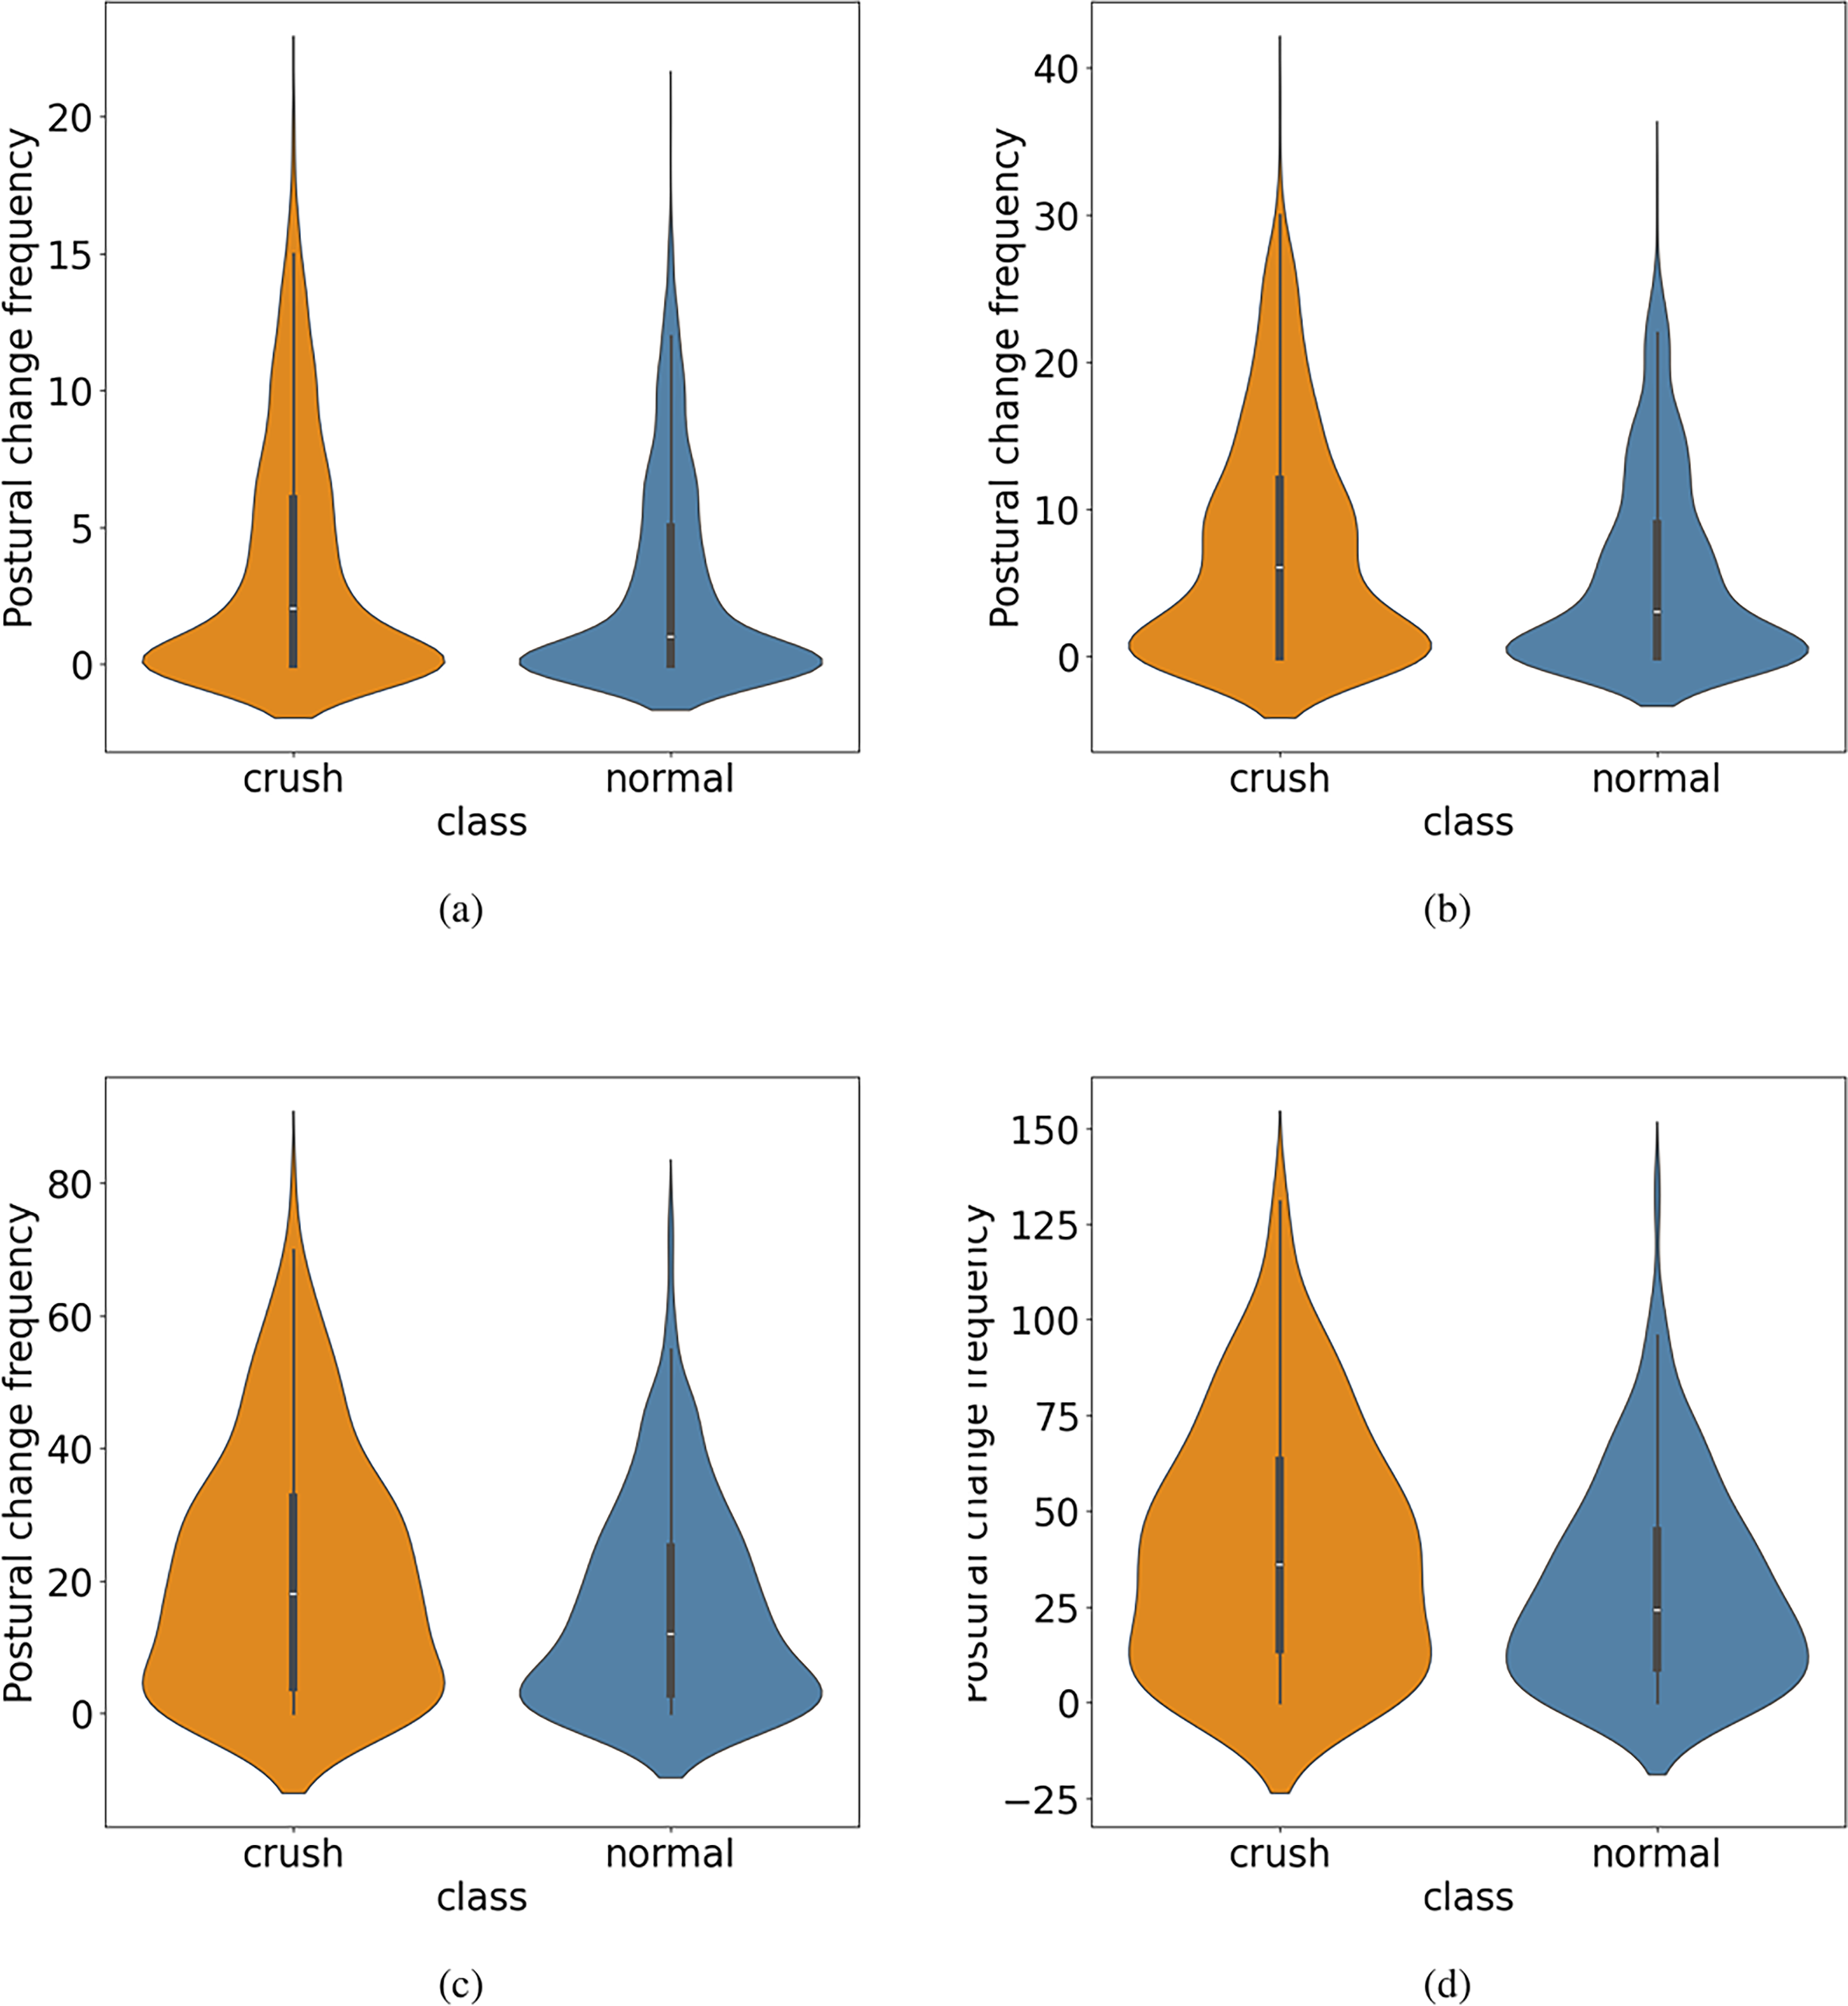
| Type | 5-min | 10-min | 30-min | 60-min |
|---|---|---|---|---|
| Crushing and pre-crushing days | 3.68 | 7.49 | 21.44 | 40.51 |
| Crushing days only | 3.68 | 8.23 | 23.93 | 44.82 |
| Non-crushing days | 2.77 | 5.52 | 15.86 | 30.22 |
Decision tree
The dataset used to train the decision tree models was derived from the 10-min postural change (PC) frequency data. This dataset was composed of 51 records from crushing days, 61 from pre-crushing days, and 132 from normal (non-crushing) days. The data were partitioned into training and validation sets using a 70:30 split. Then, two separate classification models were trained and evaluated.
Model 1: Crushing vs. normal. This model was trained to distinguish between crushing days and normal days. In the resulting tree, shown in Fig. 8, all extracted features were utilized except for the mean PC frequency. The optimal hyperparameters, selected via grid search, were a criterion of entropy or log_loss, a max_depth of 11, and a min_samples_split of 0.05. On the training data, a sensitivity of 43% and a specificity of 71% were achieved.
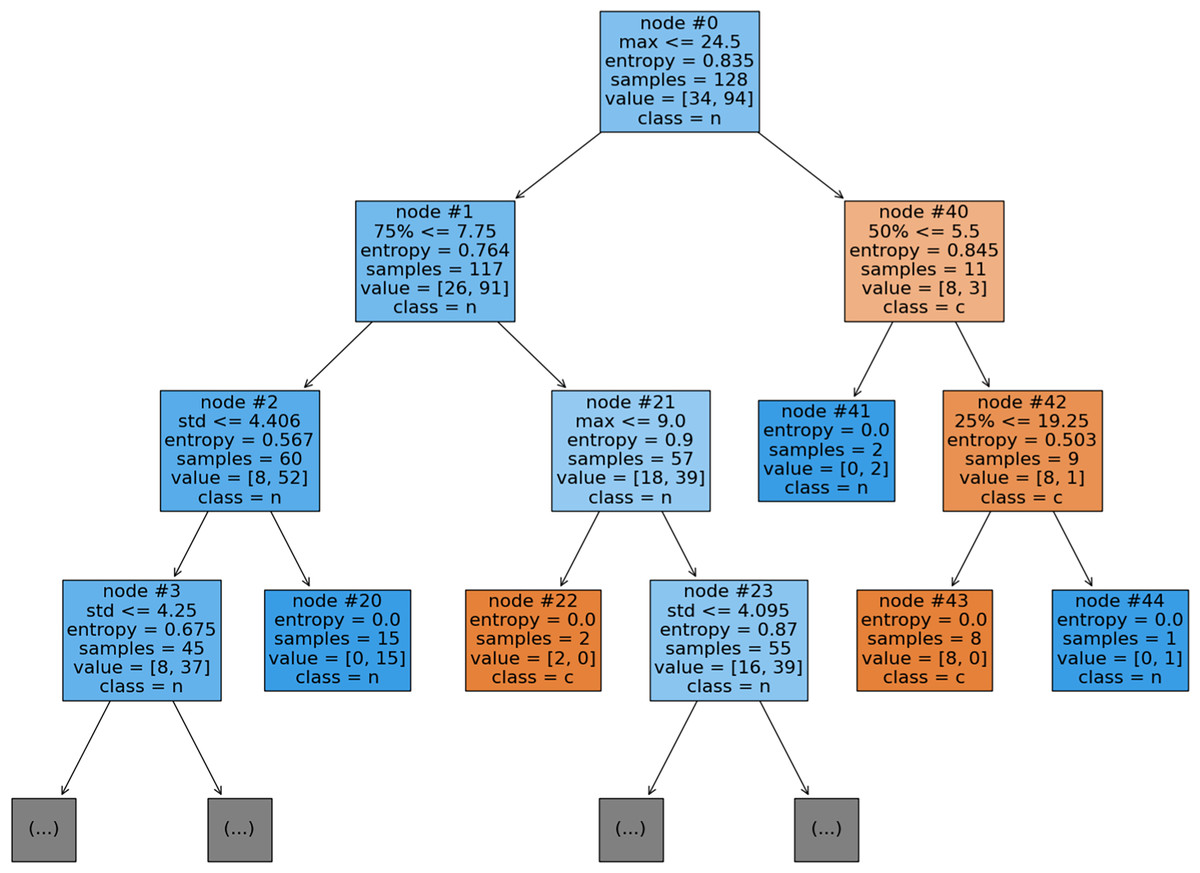
Figure 8: A decision tree shows three levels of depth for classifying crushing (c) vs. normal (n) days. The features utilized in this tree are the minimum (min), maximum (max), 1st quartile (25%), 2nd quartile (50%), 3rd quartile (75%), and standard deviation (std).
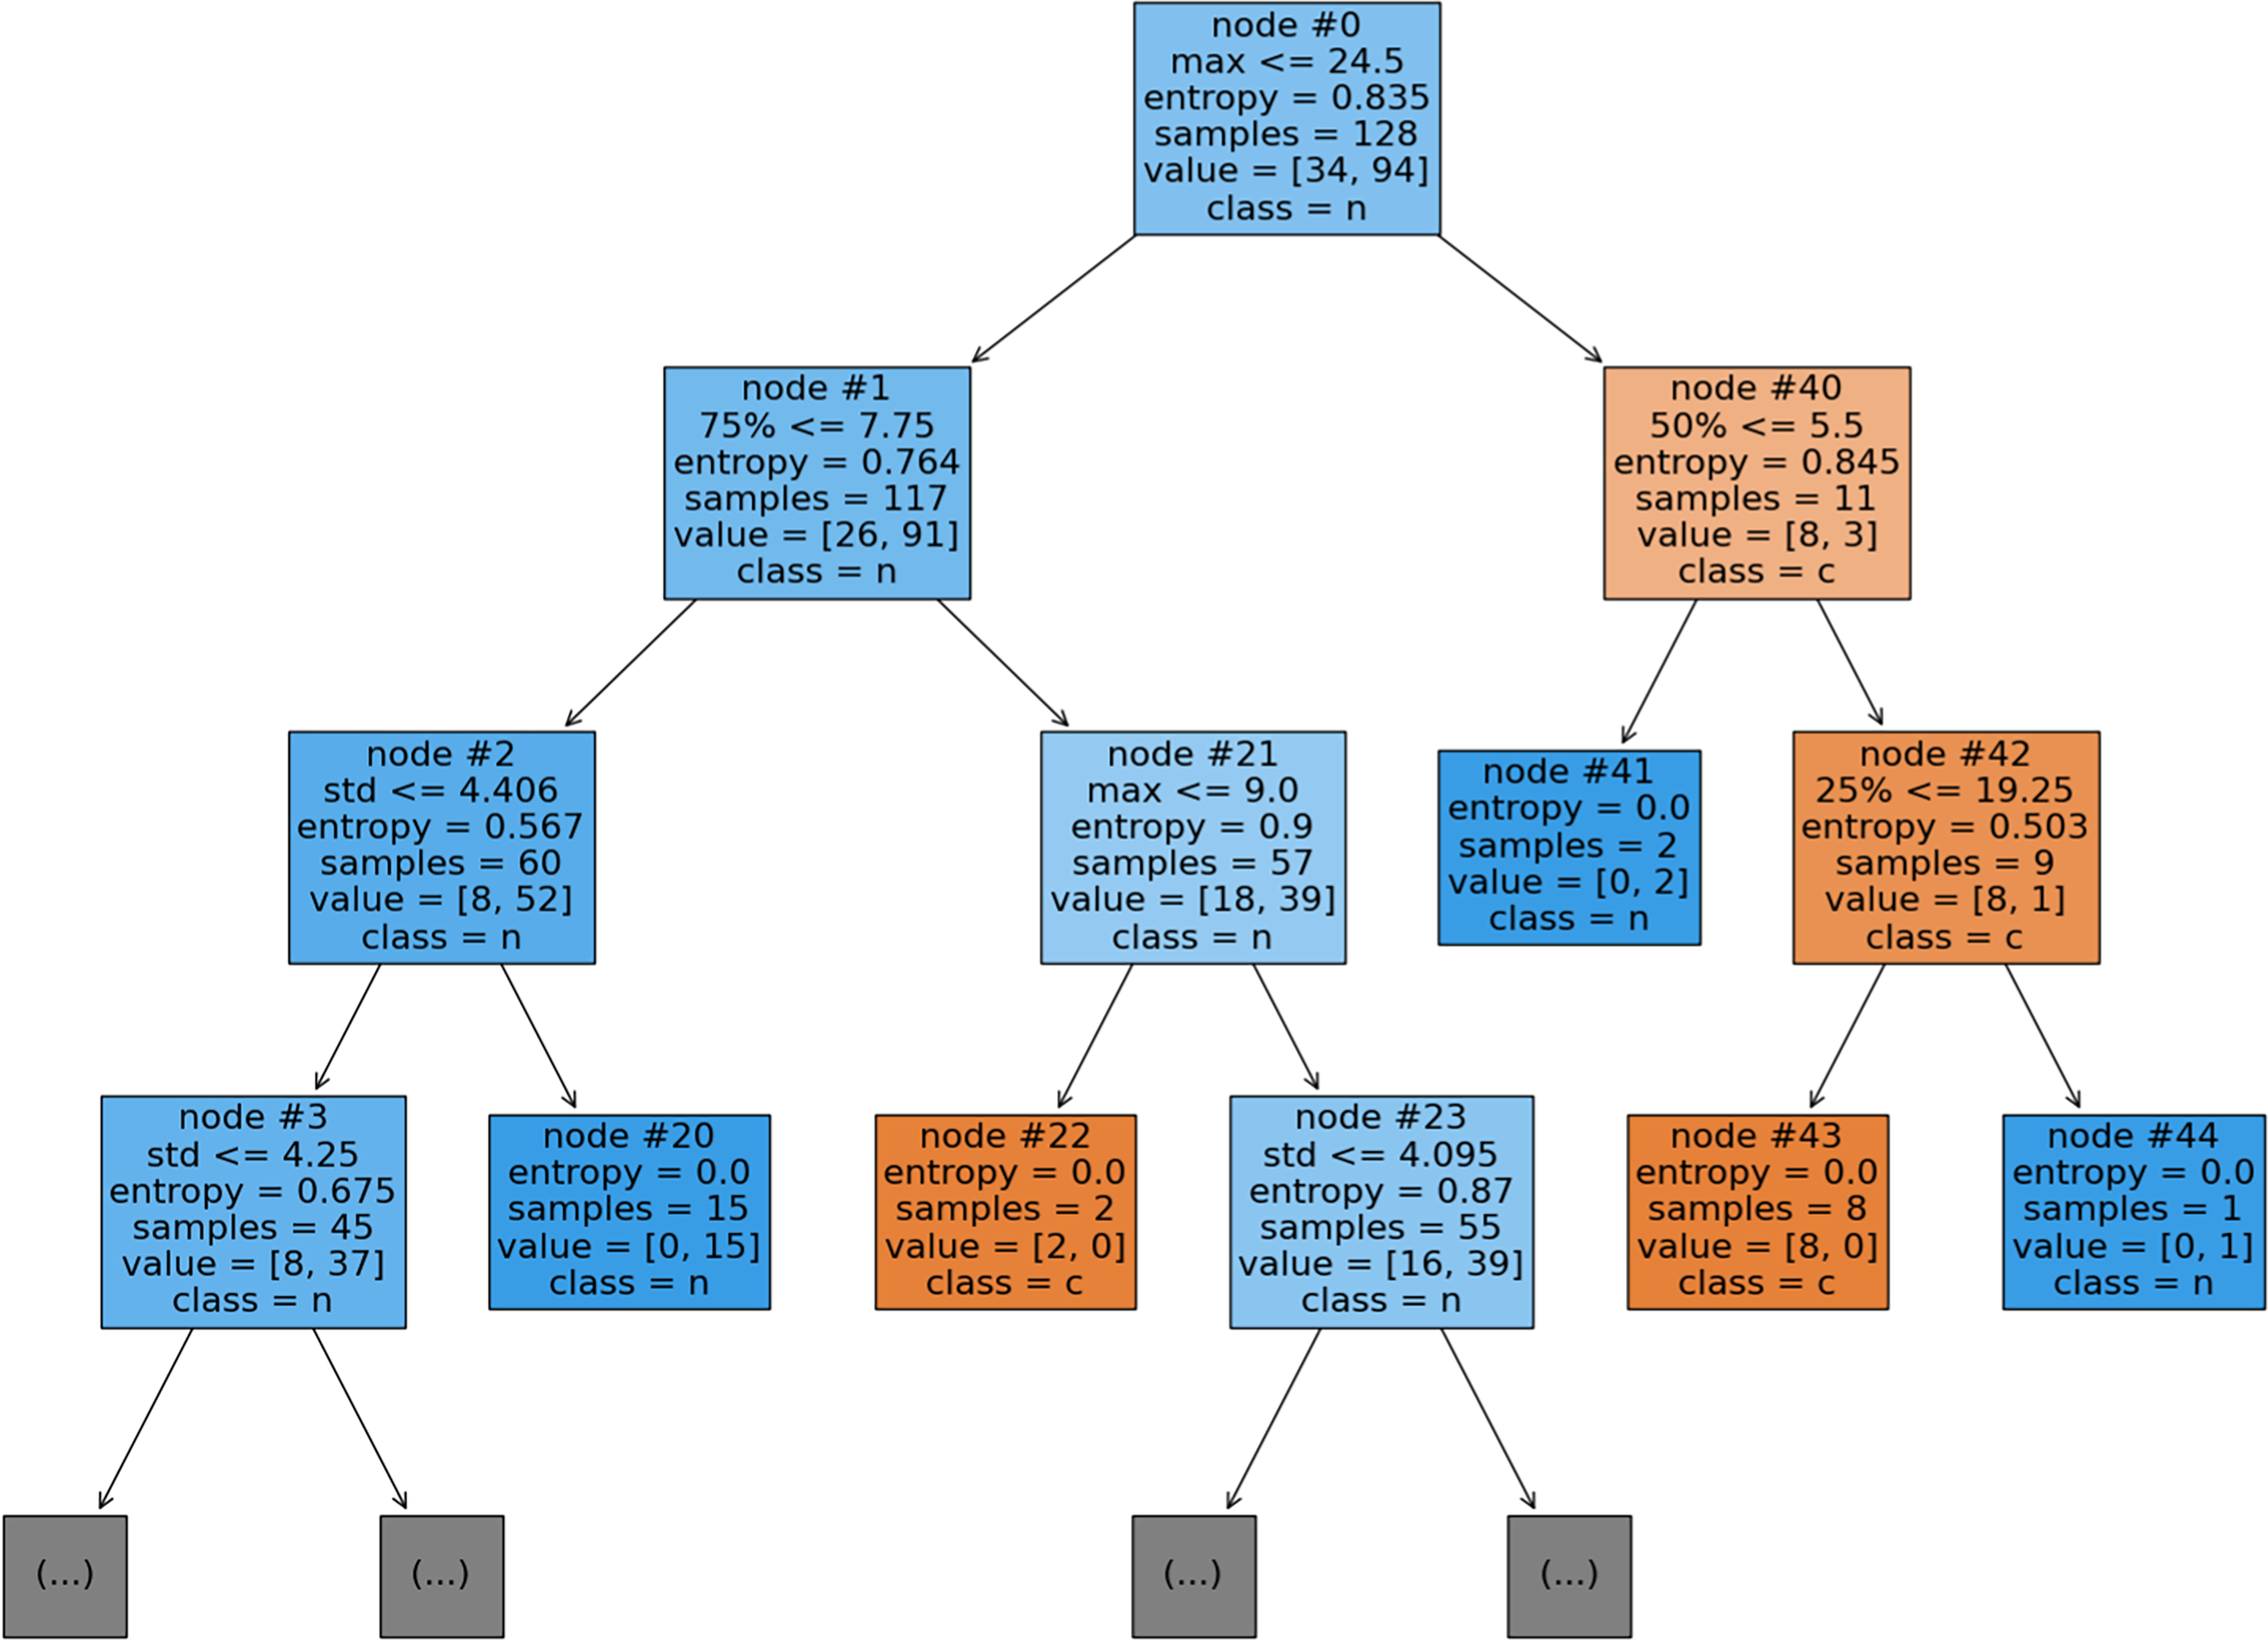
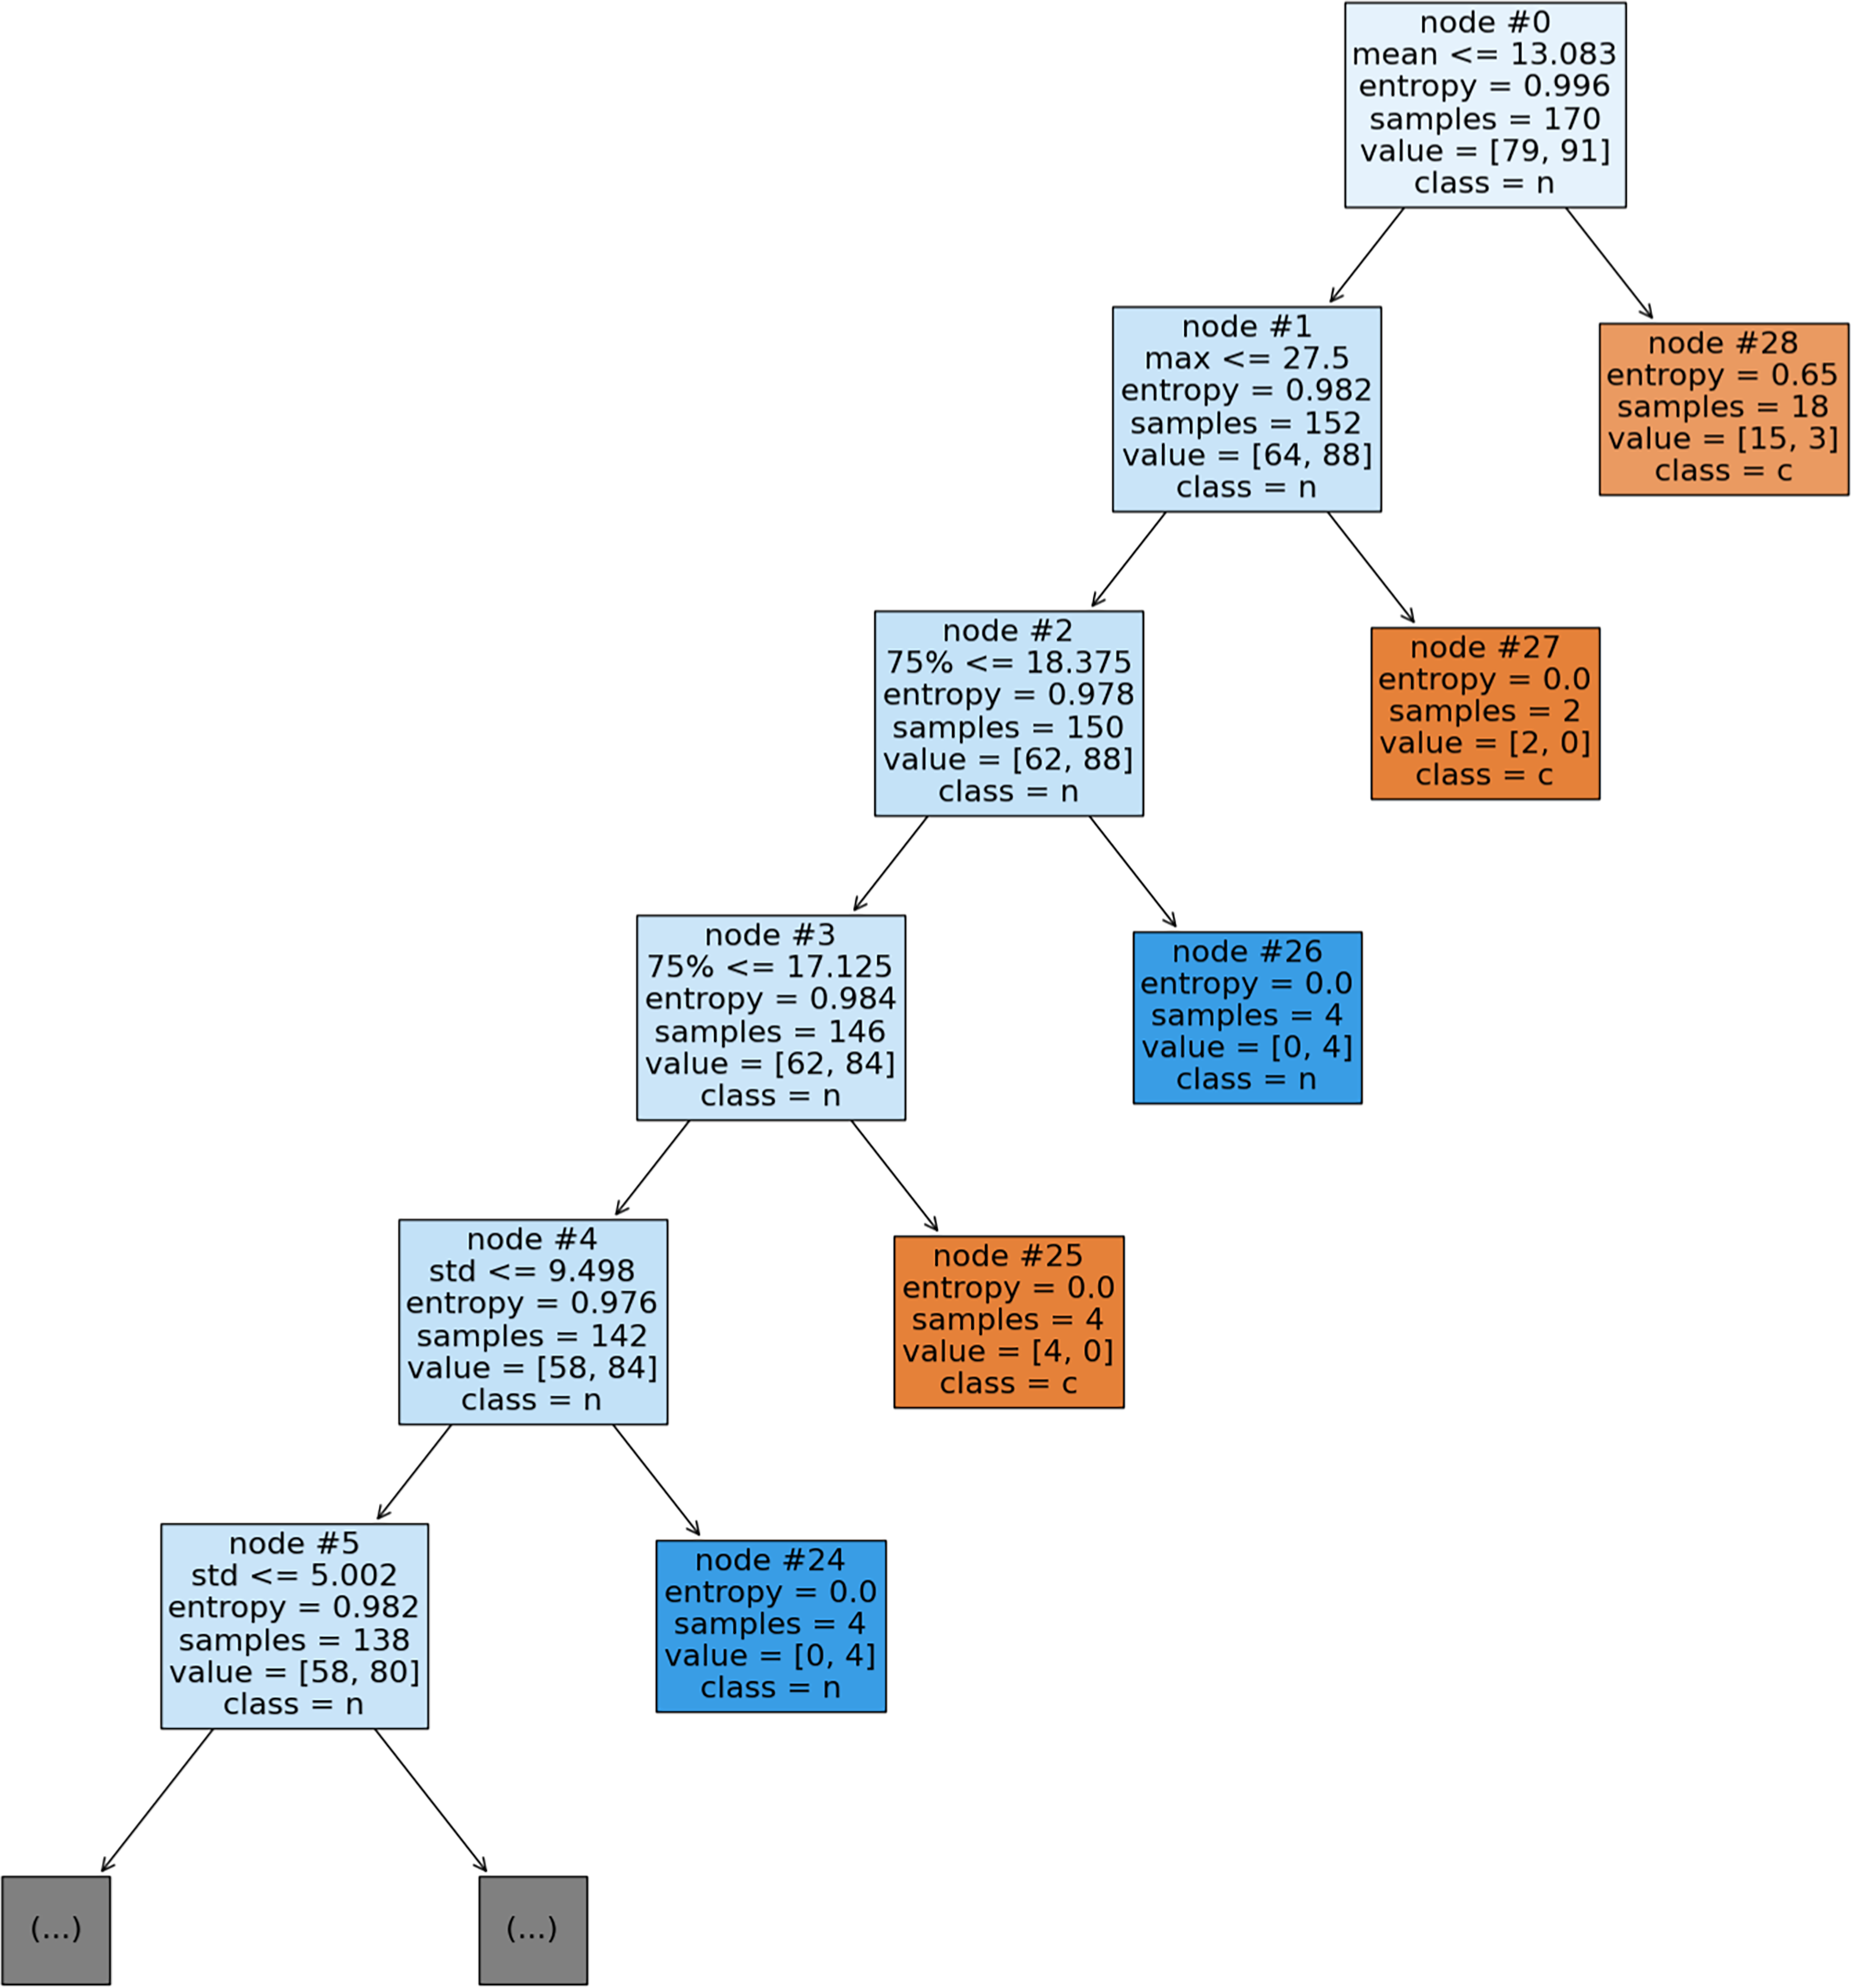
Model 2: High-risk vs. normal. The second model was trained to distinguish high-risk days (combining crushing and pre-crushing data) from normal days. In this tree, depicted in Fig. 9, all seven of the descriptive statistical features were incorporated. The best-performing hyperparameters for this model were a criterion of entropy or log_loss, no maximum depth (max_depth=None), and a min_samples_split of 0.2. With this configuration, a sensitivity of 63% and a specificity of 41% were achieved on the training set.
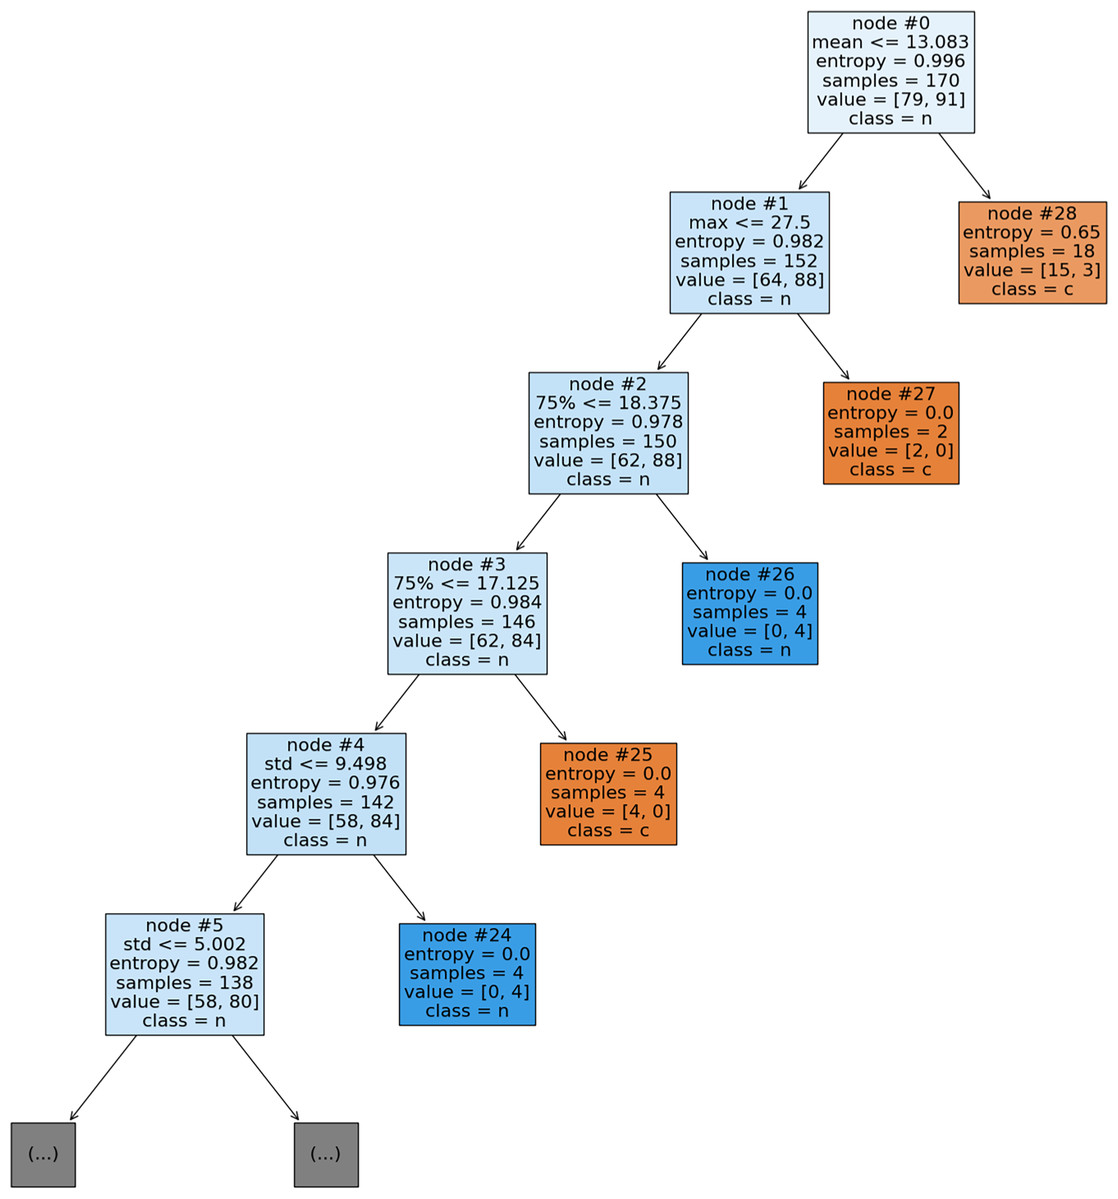
Figure 9: A decision tree shows five levels of depth for classifying high-risk (crushing and pre-crushing combined) (c) vs. normal (n) days. All features, including the mean, were utilized by this model.
Support vector machine
The SVM models were trained and validated using the same dataset and 70:30 split as the Decision Trees. During the grid search process, it was noted that some hyperparameter combinations resulted in models that were unable to identify any true positives, leading to a sensitivity of zero. The optimal results for the two classification scenarios are detailed below.
Model 1: Crushing vs. normal. For the task of distinguishing crushing days from normal days, a polynomial kernel with a regularization parameter of C = 1.0 was used by the best-performing SVM model. On the training data, a sensitivity of 24% and a specificity of 96% were achieved.
Model 2: High-risk vs. normal. For the classification of high-risk days against normal days, a sigmoid kernel with C = 1.0 was utilized by the optimal model. With this configuration, a sensitivity of 51% and a specificity of 55% were achieved on the training set.
Threshold and voting
The threshold-based voting method was evaluated using the median of the 10-min postural change (PC) frequency as the activation threshold. As with the other models, its performance was assessed on the 28-day test set using two different classification scenarios.
Model 1: Crushing vs. normal. When tasked with distinguishing crushing days from normal days, the system’s performance was evaluated on both an hourly and daily basis.
Hourly performance: The sensitivity was 62.50% and the specificity was 60.25%.
Daily performance: The performance improved with daily aggregation, yielding a sensitivity of 71.42% and a specificity of 84.61%.
Model 2: High-risk vs. normal. In the second scenario, pre-crushing days were included in the positive class (high-risk). This change resulted in a general decrease in performance.
Hourly performance: The sensitivity and specificity fell to 53.38% and 59.74%, respectively.
Daily performance: On a daily basis, the specificity remained consistent while the sensitivity dropped to 66.67%.
Unlike the decision tree and SVM models, which were evaluated on a test set (30% of the data), the threshold and voting technique was evaluated using the entire dataset. A comprehensive comparison of the performance of all three methods (Decision Tree, SVM, and Threshold-Voting) is provided in Table 5.
| Sensitivity (%) | Specificity (%) | |||
|---|---|---|---|---|
| Crushing days | High-risk days | Crushing days | High-risk days | |
| Hourly basis | ||||
| Decision tree | 25.00 | 42.85 | 67.44 | 59.37 |
| SVM | 0.00 | 53.12 | 66.66 | 66.66 |
| Threshold and voting | 62.5 | 53.38 | 60.25 | 59.74 |
| Daily basis | ||||
| Decision tree | 57.14 | 93.00 | 100.00 | 100.00 |
| SVM | 57.14 | 60.00 | 100.00 | 100.00 |
| Threshold and voting | 71.42 | 66.67 | 84.61 | 84.61 |
Discussion
Posture detection model performance and limitations
In this study, a high-performing sow posture detection model was successfully developed, and an overall mAP@50 of 0.976 was achieved with the computationally efficient YOLOv8n. This result is highly promising, demonstrating the viability of using deep learning for posture analysis even with a modestly sized dataset collected under the constraints of a commercial small-scale farm. The success was likely attributable to the use of a pre-trained YOLOv8 model with transfer learning.
Despite the high overall accuracy, several limitations were identified. Slightly lower performance was obtained for the sitting posture, which was attributed primarily to class imbalance in the training data, as there were fewer sitting instances compared to other postures. This issue was composed by annotation challenges that occur when the sow’s body occasionally obscured its legs, particularly from certain camera angles. As a result, the sitting posture was most frequently misclassified as ventral recumbency, as these two postures can appear visually similar depending on the viewing angle (Fig. 10). These challenges, including class imbalance and the impact of camera perspective, are consistent with findings from other studies (Chen, Lu & Wang, 2023). Furthermore, the model’s generalization is currently limited to the environment of a single farm. Therefore, future work should focus on expanding the dataset with images from diverse farm settings (e.g., both open and closed farrowing house systems) to enhance robustness and precision.
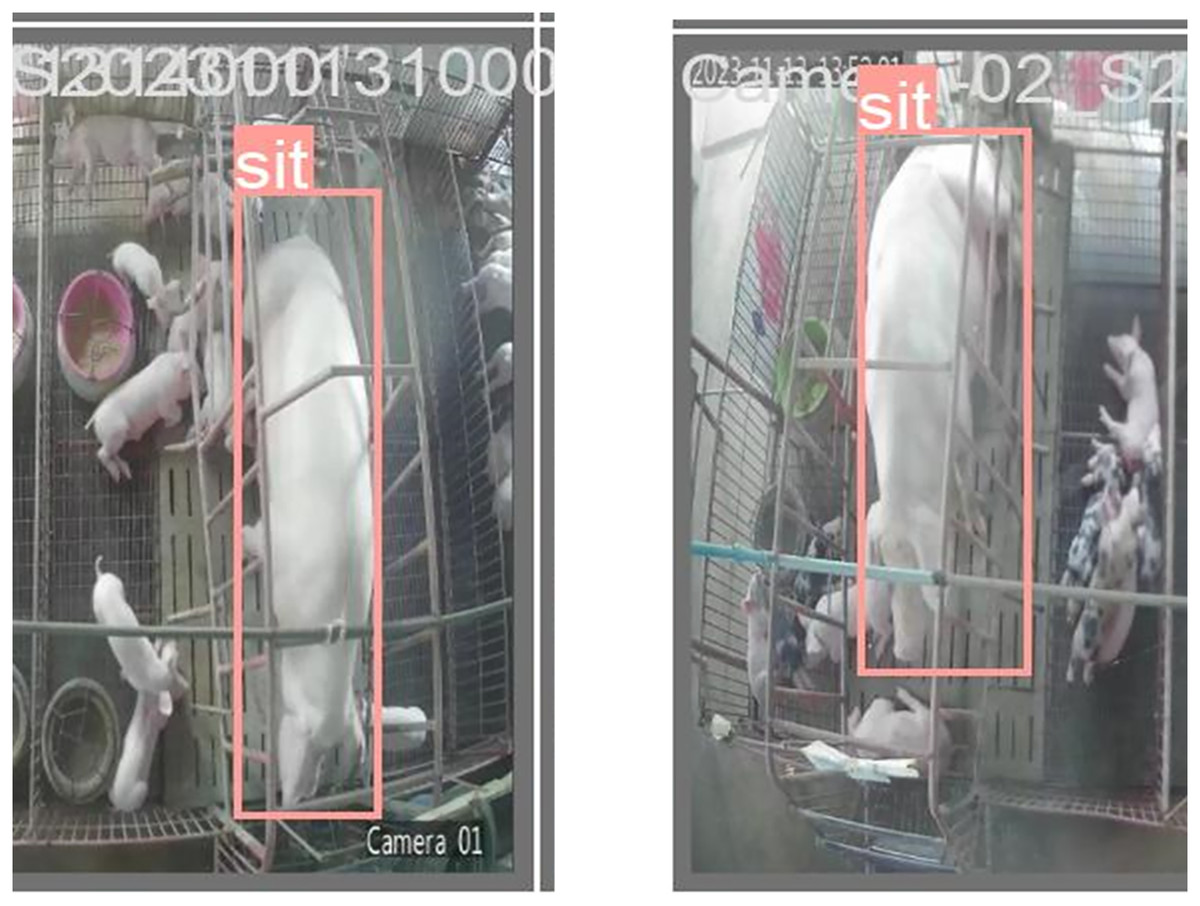
Figure 10: Sample detection results for the sitting (SI) posture from different viewing angles are shown.
The instance on the left was incorrectly classified as ventral recumbency (VR), while the instance on the right was correctly classified as sitting (SI).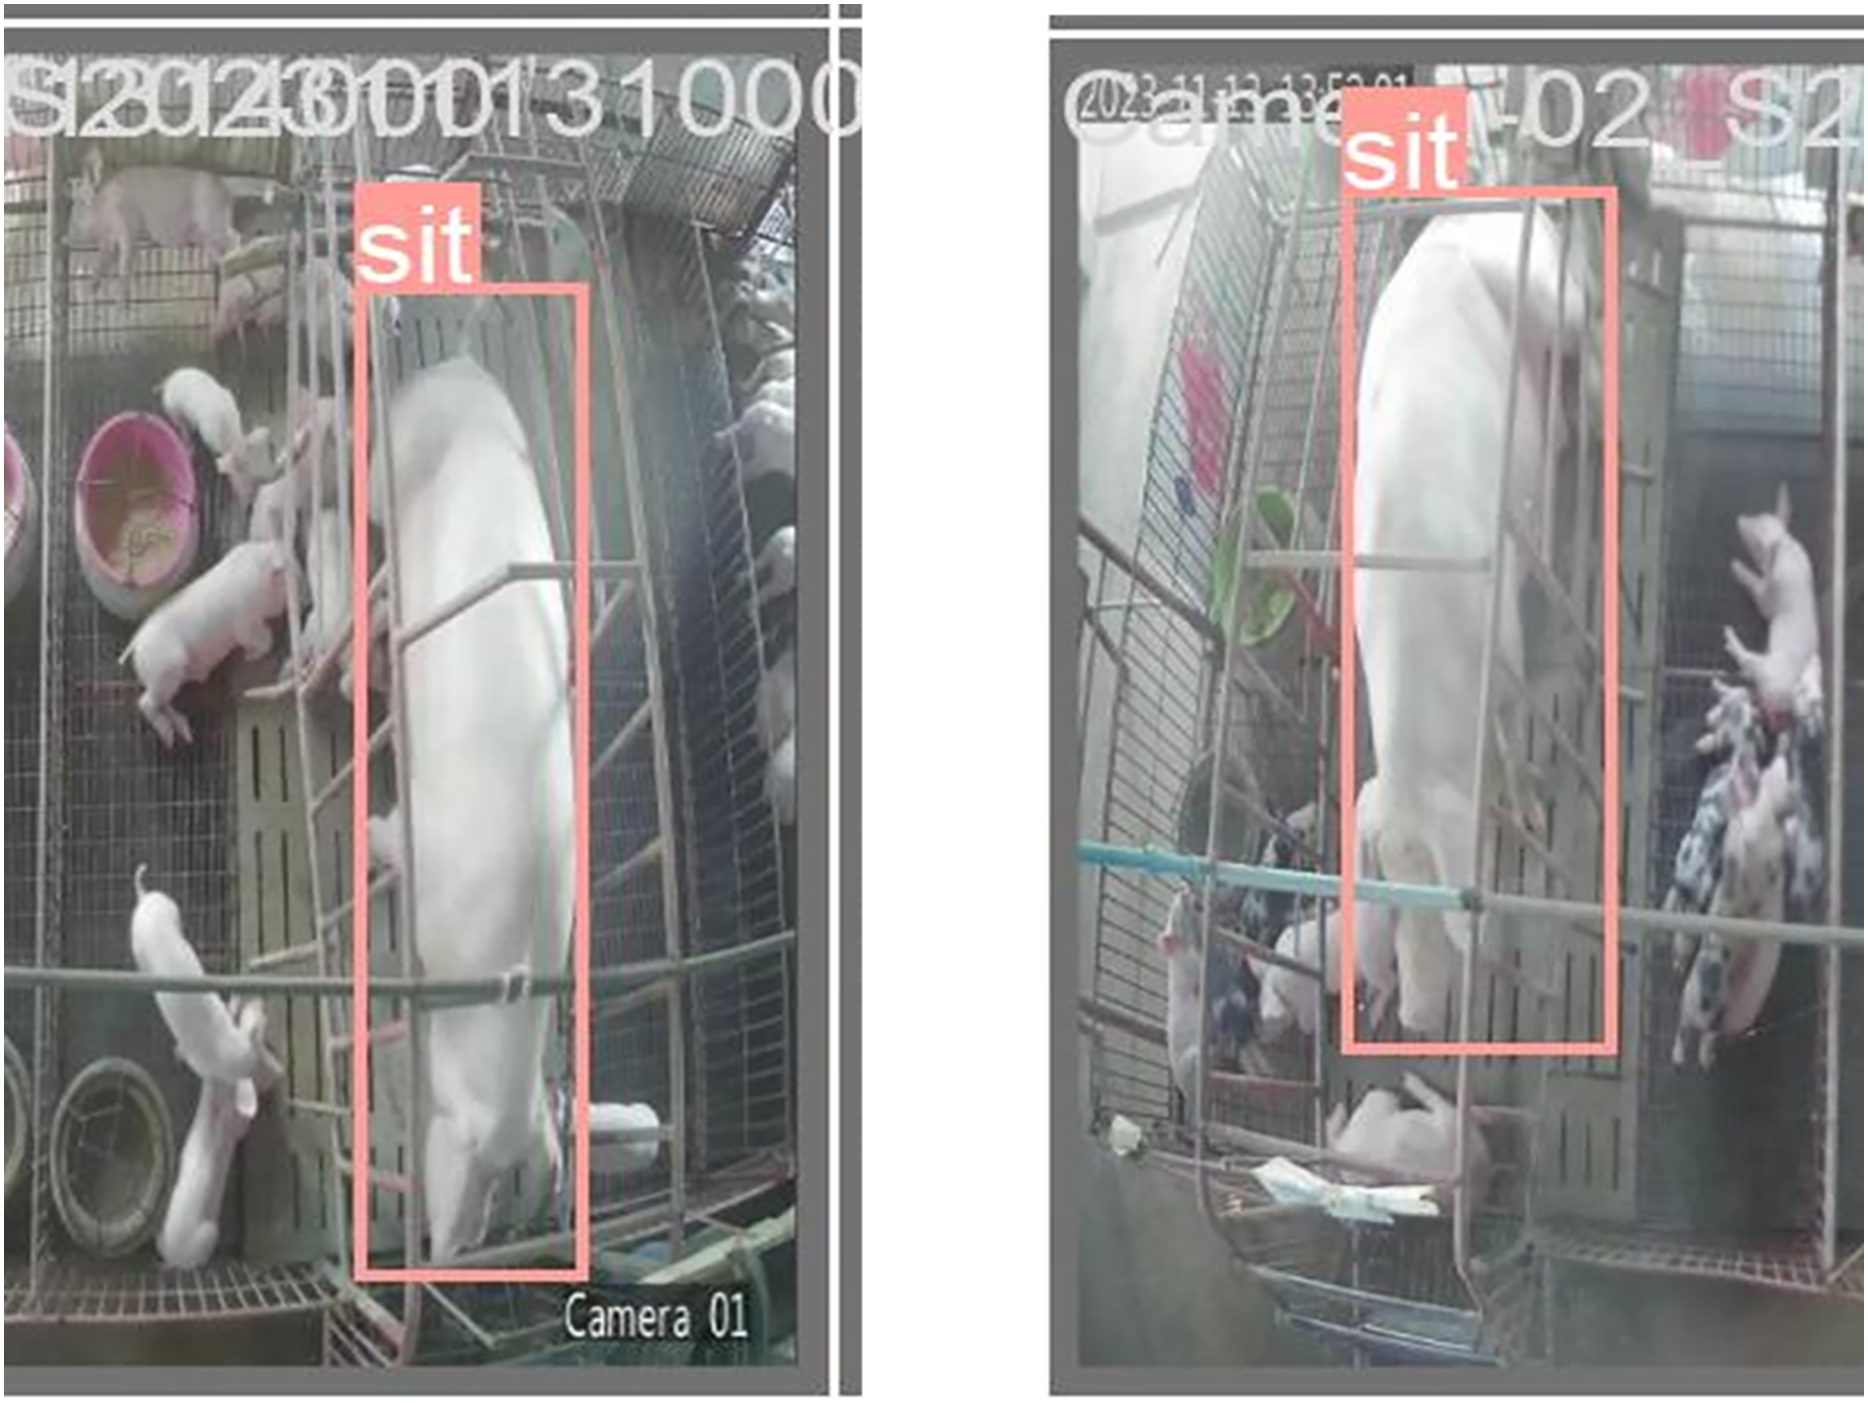
Comparison with alternative methods
When compared to other technological approaches for monitoring sow behavior, the image-based posture detection method presented in this study is competitive. For instance, its performance is comparable to systems that use vibration energy to classify postures, particularly for detecting standing (Dong et al., 2023). An alternative approach involves the use of audio data to detect piglet distress sounds, such as screaming, as an indicator of a crushing event. For example, an AI-based IoT system was developed by Chen, Lin & Chen (2021) in which a convolutional neural network (CNN) was used to detect piglet screams and trigger an actuator to encourage sow movement. In that study, it was found that using min-max scaling for audio pre-processing yielded a higher and more stable classification accuracy (99.4%) than the more common Mel Frequency Cepstral Coefficient (MFCC) method.
While such audio-based systems are highly accurate at detecting an ongoing event, the posture-based approach presented here is aimed at identifying high-risk behaviors before a crushing event occurs, offering a preventative rather than a reactive solution. This preventative focus makes the method particularly well-suited for providing actionable pre-warnings on small-scale farms. The high accuracy of image-based models for this task has also been demonstrated in other studies (Alameer, Kyriazakis & Bacardit, 2020; Riekert et al., 2020; Zheng et al., 2018, 2020).
Interpretation of postural change analysis
The frequency of postural changes was confirmed to be a key indicator of crushing risk, as a higher frequency of these changes was observed on crushing and pre-crushing days compared to non-crushing days. This finding is in alignment with the broader literature, in which sow restlessness and movement patterns have been identified as critical risk factors. For instance, it has been noted in previous studies that while non-crushing sows may exhibit more standing and walking, more high-risk behaviors like rolling tend to be displayed by crushing-prone sows. Similarly, the transition from standing to lying is a well-documented critical moment for crushing events, particularly in primiparous sows (Valros et al., 2003; Wischner et al., 2009; Illmann et al., 2013; Manteuffel et al., 2017).
It is important to note that this study was conducted in a system with farrowing crates, which restrict sow movement to reduce crushing risk but also limit natural behaviors. The distinct postural patterns that were detected, even within this constrained environment, underscore the robustness of this metric as a warning indicator.
Justification of the 10-min warning interval
For the development of the warning system, a 10-min interval was selected for compiling postural changes. This choice was based on a balance between responsiveness and reliability. As shown in the descriptive analysis (Table 4), the median postural change frequency in this interval during high-risk periods was approximately double that of non-crushing periods. A clear separation and a sufficient margin were thereby provided for the threshold to be effective while generating minor detection errors, an advantage not as stated in the 5-min interval.
Furthermore, the 10-min interval allows six data points to be included in the hourly voting mechanism. A more robust basis for a warning decision is thus provided compared to the two and one data points available from the 30- and 60-min intervals, respectively. This reduces the likelihood of false alarms being triggered by short, isolated bursts of activity.
Evaluation of warning system performance
In this study, three different models for the piglet crushing warning system were evaluated, with performance being assessed on both an hourly and daily basis to accommodate different user needs. A notable discrepancy between the models’ performance on the training and testing sets was observed. While promising performance was shown by the decision tree and SVM models on the training data, their performance dropped significantly on the unseen testing data for hourly predictions. In contrast, their daily-based performance was considerably higher (Table 5).
This was due to the limited number of crushing events in the dataset. With few positive instances, complex models like decision trees and SVMs are prone to overfitting the training data, leading to poor generalization on an instance-by-instance (hourly) basis. Through daily basis, which considers the entire data, these instance-level prediction errors are smoothed out, resulting in higher performance. In contrast, more balanced and robust performance on the testing set for both hourly and daily warnings was demonstrated by the simpler threshold-and-voting method. The simpler method worked better because it used a basic statistical rule instead of trying to find complex patterns in the small dataset. Also, looking at the data visually (Fig. 11) showed that the different groups were mixed together, which made it hard for complex models like SVMs to draw a clear line to separate them.
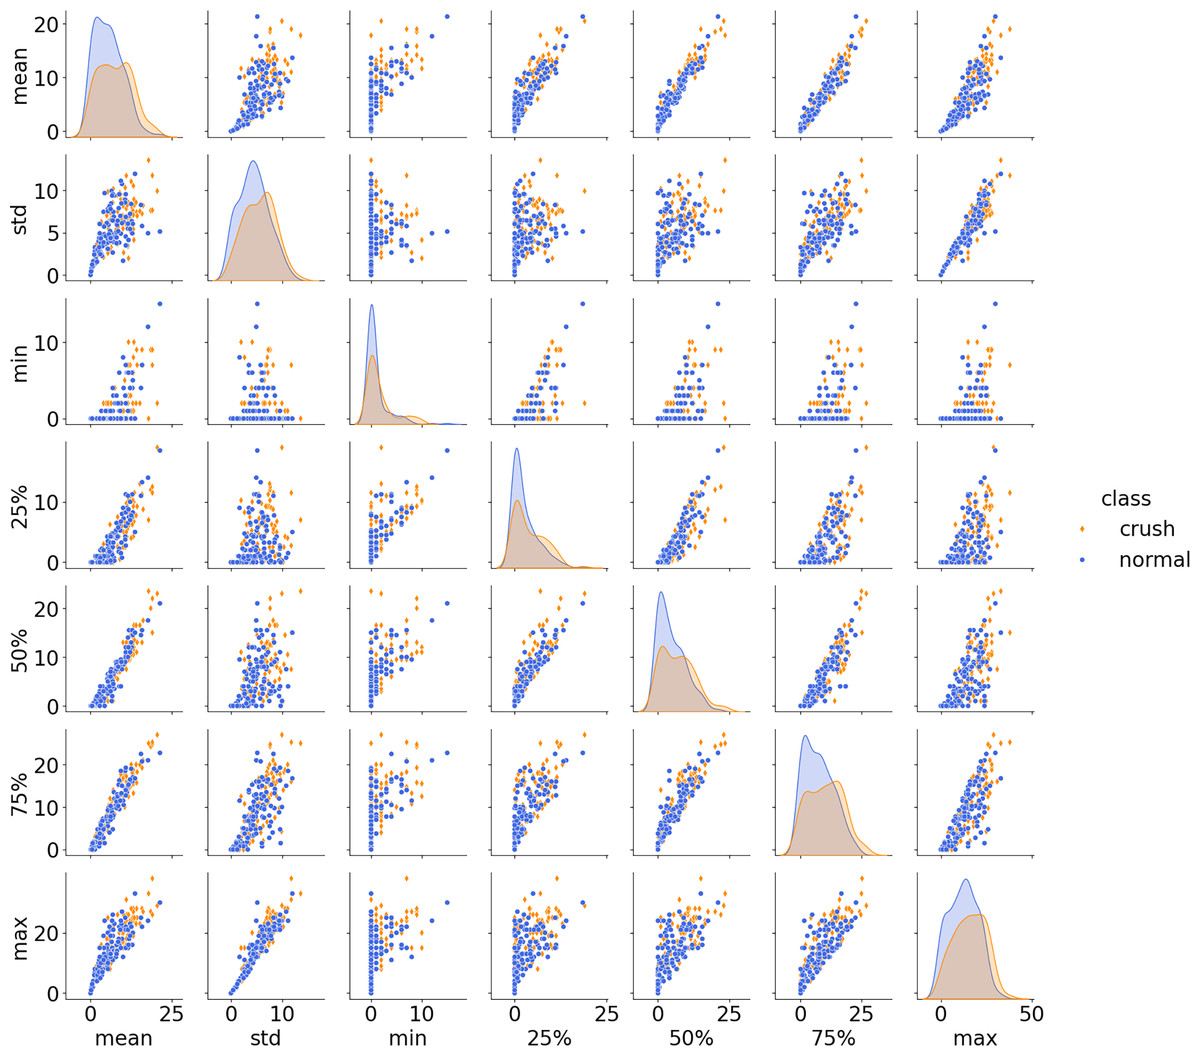
Figure 11: Scatter plots and histograms of the features used for the decision tree and SVM models, comparing the high-risk (crushing and pre-crushing) dataset to the normal dataset.
The features include the mean, standard deviation (std), minimum, 1st quartile (25%), median (50%), 3rd quartile (75%), and maximum.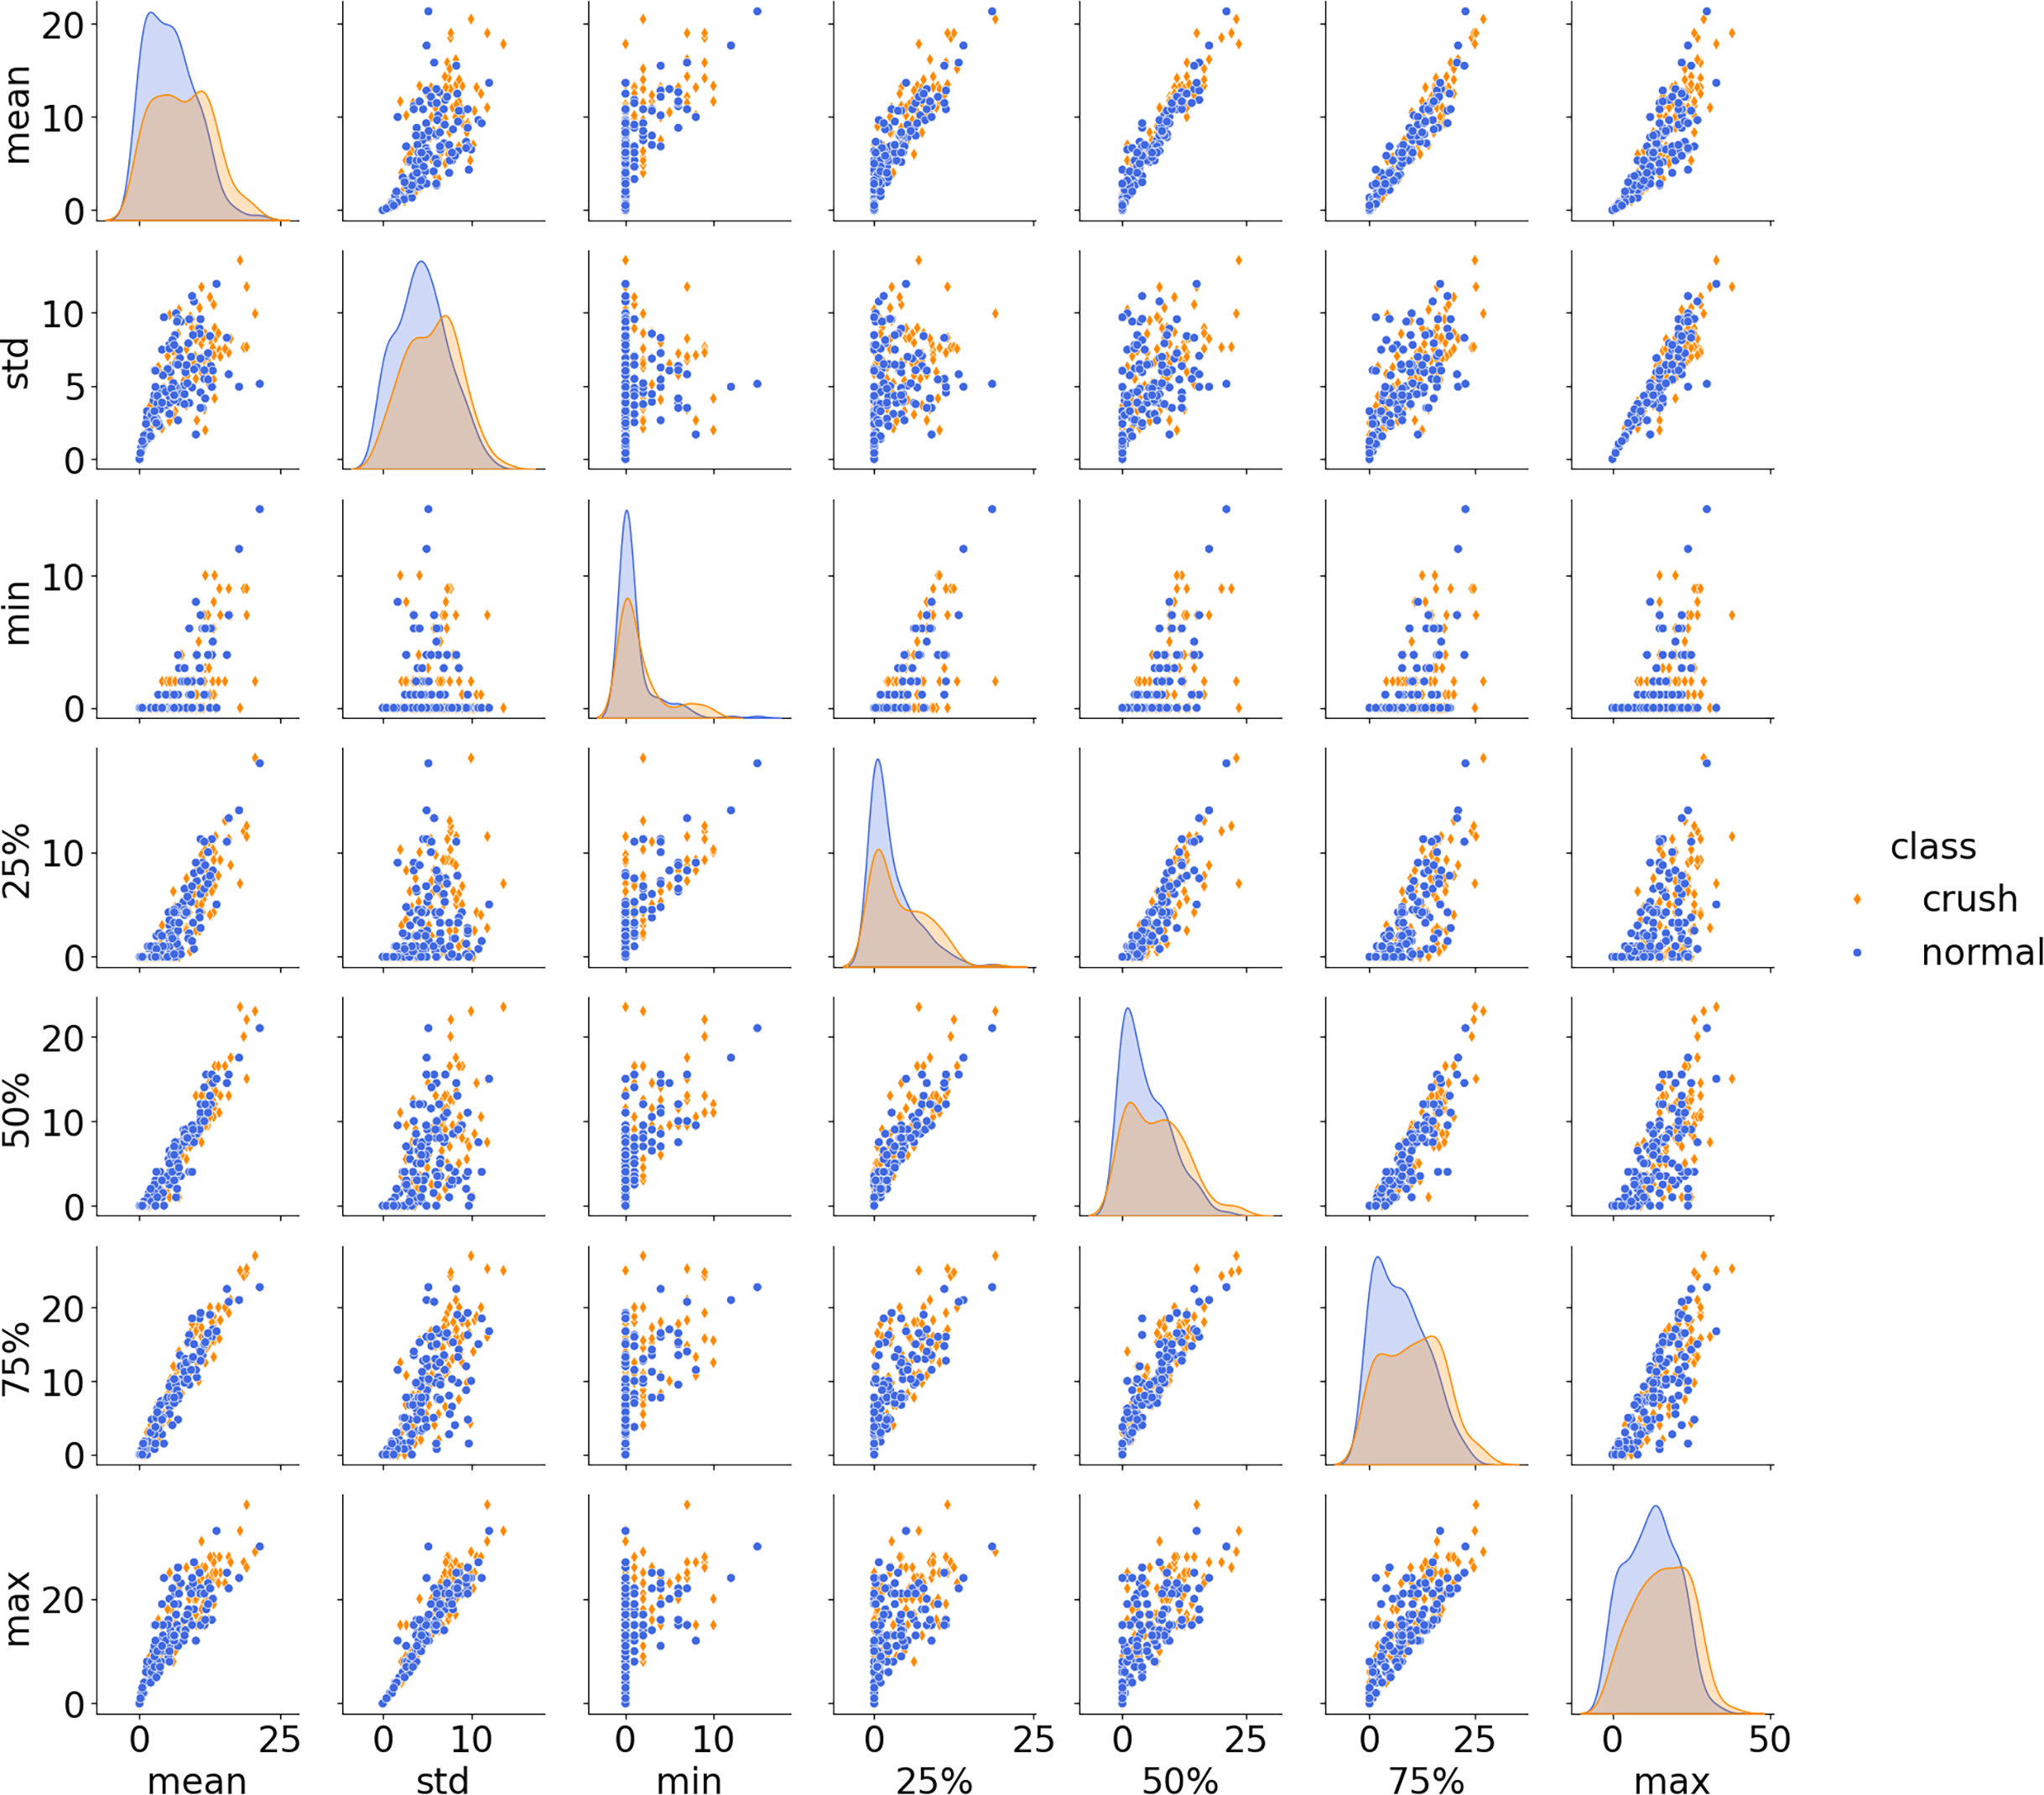
Practical implications and justification of the chosen method
Given these results, the threshold-and-voting method is identified as the most practical and reliable solution for the target application, with its primary advantage being straightforward interpretability. For smallholder farmers, who may check on animals infrequently, a reliable warning is critical, as a system with a high rate of false positives or low sensitivity would quickly be ignored.
The goal of this research was to develop a proactive tool for farmers with limited labor and experience. Through an automated warning system based on postural change frequency, awareness can be effectively raised, and interventions can be prompted, such as adjusting the crate, increasing sow comfort, or fostering piglets to another sow. Although the hourly sensitivity is moderate, a valuable layer of monitoring, which would otherwise be absent, is provided.
Future work and system enhancement
While postural change frequency is a promising indicator, the warning system could be significantly enhanced by incorporating additional data streams, through which both sensitivity and specificity could be improved. For example, an audio-based piglet scream detection system could be integrated to act as a secondary confirmation of a crushing event. High accuracy for vocalization-based detection, with specificity up to 95%, has been shown in previous research (Manteuffel et al., 2017), and a high probability of success has been demonstrated by IoT-based rescue systems triggered by screams (Chen, Lin & Chen, 2021).
Furthermore, the model’s precision could be improved by including environmental and health-related features. Factors such as temperature and humidity are known to influence sow behavior. For instance, a lower frequency of postural changes is often exhibited by heat-stressed sows (Liu et al., 2021). By accounting for such external variables, as well as the sow’s health status and parity, a more dynamic and adaptive warning threshold could be developed, moving beyond the fixed threshold used in this study (Yi et al., 2019; Kaiser et al., 2022). Through the integration of these relevant features, it is believed that a more precise and timely crushing warning system can be developed.
Conclusion
In this study, the feasibility of a computer vision-based system to provide early warnings for piglet crushing events, a multifactorial challenge in swine production, was successfully demonstrated. It was also established that the frequency of sow postural changes is a viable indicator for differentiating between high-risk and normal periods.
With the proposed warning system, which utilizes a straightforward threshold-and-voting method, a promising daily-based performance with a sensitivity of 71.42% and a specificity of 84.61% was achieved. Through this non-invasive approach, a practical tool is offered to enhance farmer awareness and enable timely, preventative interventions, particularly on smallholder farms with limited labor.
While the simpler method proved most effective for the dataset used in this study, the potential of more complex models like decision trees and SVMs was evident. Future work should be focused on expanding the dataset with more crushing events and data from diverse farm environments, as this would likely improve the generalization and performance of these models. Furthermore, the system’s precision and reliability could be significantly enhanced by incorporating more behavioral features, such as the specific frequency and duration of high-risk postures like descending and rolling.