
Emotional drivers of misinformation consumption and toxicity on YouTube
- Published
- Accepted
- Received
- Academic Editor
- Alexander Nwala
- Subject Areas
- Artificial Intelligence, Data Science, Natural Language and Speech, Network Science and Online Social Networks
- Keywords
- Social media, YouTube, Misinformation, Toxicity, Hate speech
- Copyright
- © 2026 Santoro et al.
- Licence
- This is an open access article distributed under the terms of the Creative Commons Attribution License, which permits unrestricted use, distribution, reproduction and adaptation in any medium and for any purpose provided that it is properly attributed. For attribution, the original author(s), title, publication source (PeerJ Computer Science) and either DOI or URL of the article must be cited.
- Cite this article
- 2026. Emotional drivers of misinformation consumption and toxicity on YouTube. PeerJ Computer Science 12:e3398 https://doi.org/10.7717/peerj-cs.3398
Abstract
Emotions shape online discourse and user behavior, yet the emotional interplay between misinformation and toxicity remains understudied. This article analyzes one million comments on Italian YouTube videos to examine how users react to reliable and questionable information, focusing on emotional expression and comment toxicity. Drawing on Plutchik’s psychoevolutionary framework and combining network science with human-centered artificial intelligence (AI), we identify distinct dynamics among users who predominantly engage with misinformation or mainstream sources. Comments on questionable sources convey more fear and less joy, with misinformation-prone users especially prone to expressing fear-tinged anger. We introduce the concept of emotional arborescence—capturing how secondary emotions emerge from basic ones—and find that mainstream-prone users exhibit 25% greater emotional diversity. These findings offer new insights into the emotional dimensions of online misinformation and toxicity, and inform strategies to mitigate their impact on public discourse.
Introduction
Social media platforms are central venues for sharing information and emotions in digital form (Schmidt et al., 2017; Del Vicario et al., 2016; Stella, Ferrara & De Domenico, 2018). Every interaction–whether a post, like, share, or reply–leaves behind a digital trace that encapsulates users’ communicative intentions and cognitive-emotional states (Stella, 2022). The scale of these traces provides researchers with unprecedented datasets to examine online discourse and social dynamics through computational approaches (Cinelli et al., 2020; Santoro et al., 2023). In these highly emotional environments, information processing can vary widely. Users may engage with content analytically or react emotionally (Pennycook & Rand, 2021; Pennycook et al., 2020; Pytlik, Soll & Mehl, 2020). Constant exposure to large volumes of often low-quality content can lead to “social media fatigue” (Ahmed & Rasul, 2023), a well-documented phenomenon of distress caused by the need to internalize and decide upon (e.g., reshare/like) vast amounts of information.
Users cope with this distress in various ways (Ahmed & Rasul, 2023), including the emergence of toxic communication–hostile or aggressive language that violates norms of civility (Cinelli et al., 2021; Zollo et al., 2015; Avalle et al., 2024). Such toxicity can result from users’ inability to regulate their emotions while communicating with others (e.g., emotional venting (Vermeulen, Vandebosch & Heirman, 2018)) or from a lack of cognitive resources to engage in analytical thinking when confronted with incorrect or misleading content, i.e., misinformation (Pennycook & Rand, 2021, 2019).
While misinformation is often framed as a consequence of cognitive failure (McIlhiney et al., 2023; Pantazi, Hale & Klein, 2021), recent research challenges the simplistic notion that misinformation-prone (MIp) users are merely less intelligent or “lazier” than those aligned with mainstream-affiliated sources (Ahmed & Rasul, 2023; Ecker et al., 2022; Borukhson, Lorenz-Spreen & Ragni, 2022; Taurino et al., 2023).
In this study, we adopt a data-driven approach to examine the emotional and toxic content of user comments on Italian YouTube videos related to COVID-19, a topic that has provoked intense polarization and emotional engagement (Cinelli et al., 2020; Santoro et al., 2023; Chen, Lerman & Ferrara, 2020; Polizzi, Lynn & Perry, 2020). Existing studies often overlook the interaction between misinformation, toxicity, and emotional language use. Our analysis focuses on two distinct user communities: misinformation-prone users (MIp), who predominantly engage with sources known for spreading false or misleading content, and mainstream-affiliated users (MAp), who primarily interact with reliable sources. This distinction enables a comparative analysis of how these groups express emotion and toxicity, and whether different informational environments are associated with distinct emotional patterns.
To investigate emotions we employ the recent computational framework of EmoAtlas (Semeraro et al., 2025), powered by Plutchik’s psychoevolutional theory of emotions (Plutchik, 1982, 2001). This approach identifies eight basic emotions—fear, anger, sadness, disgust, anticipation, surprise, trust, and joy—and was selected over other frameworks such as the circumplex model of affect (Posner, Russell & Peterson, 2005) due to: (i) its availability through large-scale, psychologically validated datasets (Mohammad & Turney, 2013), and (ii) its recent validation against human-annotated data via interpretable statistical analyses (Semeraro et al., 2025).
Importantly, in Plutchik’s theory, basic emotions can co-occur to form more nuanced “secondary” emotions or dyads (Plutchik, 1982; Mohammad & Turney, 2013). For instance, joy conveys positive reinforcement and pleasure, while trust signals safety, security and openness. When joy and trust co-occur, the resulting combined experience can feature, at the same time, deep connection and openness, which are traits characterizing love. In this sense, according to Plutchik’s psychoevolutionary theory, love can be considered as a dyad between trust and joy. We refer to the Table S2 for the full list of secondary emotions, as organized in Plutchik’s theory.
Our objectives are twofold: (i) to develop a taxonomy of emotions expressed by users oriented toward misinformation and mainstream news, across varying levels of language toxicity (as defined in Cinelli et al. (2021)); and (ii) to identify the emotional dyads or features most prevalent within mainstream-prone and misinformation-prone user categories. To this end, we introduce a novel analytic framework that integrates insights from cognitive psychology, network science, and explainable artificial intelligence (AI). At the core of this framework is the concept of arborescence, a measure of how secondary emotions or dyads derive from shared root emotions in user comments. Lower arborescence suggests emotional convergence around a dominant basic emotion, while higher arborescence indicates greater emotional diversification.
To guide our investigation, we articulate four research questions that address key dimensions of emotional and toxic language use in user discourse. First, we examine the emotional characteristics of toxic comments in response to content from Italian YouTube sources differing in credibility (reliable vs. questionable)[RQ1]. Second, we investigate how misinformation-prone and mainstream-prone users differ in their expression of Plutchik’s basic emotions [RQ2]. Third, we explore differences in the use of Plutchik’s emotional dyads across these two user communities [RQ3]. Finally, we assess whether the emotional framing of discourse varies systematically between misinformation-prone and mainstream-prone users, potentially reflecting distinct affective and cognitive environments [RQ4].
Our findings reveal that mainstream-prone users tend to express a broader range of emotional dyads, indicating higher emotional arborescence and greater affective nuance. By contrast, misinformation-prone users’ discourse is often centered around a narrower emotional set, particularly the combination of trust and fear–suggesting a more constrained and focused emotional landscape.
Related work
Following the framework proposed by George, Gerhart & Torres (2023), research on emotions and misinformation can be categorized into three overarching areas: (1) Stimuli, which focus on the triggers and motivations for engagement; (2) Actions, which encompass the processes of fabrication, propagation, and response; and (3) Outcomes, which investigate the effects and consequences of misinformation. We use this categorization to better contextualize the works discussed below.
Prior studies situated mainly within the “Actions” category have shown that misinformation tends to be characterized by narrower language use and reduced emotional richness compared to factual content (Carrasco-Farré, 2022; Ghanem, Rosso & Rangel, 2020). Other works spanning both “Actions” and “Outcomes” have highlighted the central role of emotional language in the spread and detection of misinformation. Exposure to false content has been found to elicit elevated levels of anger, fear, and resentment (Farhoudinia, Ozturkcan & Kasap, 2024; Cosgrove & Bahr, 2024), while anger in particular increases the likelihood of sharing misinformation (Han, Cha & Lee, 2020). In contrast, factual news is generally associated with more diverse and positive emotional responses (Farhoudinia, Ozturkcan & Kasap, 2024; Carrasco-Farré, 2022). A growing body of work has also explored how conspiratorial narratives rely on narrow emotional framing and emphasize perceived threats (Cosgrove & Bahr, 2024), while reduced emotional and lexical diversity has been linked to low-complexity communication in misinformation (Ghanem, Rosso & Rangel, 2020; Carrasco-Farré, 2022). Although these studies have advanced our understanding of misinformation’s affective traits, they predominantly focus on the content itself rather than user responses, and are thus primarily aligned with the “Actions” domain.
Our study shifts this perspective by focusing on user reactions to misinformation and mainstream content on YouTube, positioning our work closer to the “Stimuli” and “Outcomes” categories. Specifically, we examine emotional expression in user comments, not just in terms of individual emotions but also through a novel metric—emotional arborescence—that captures the richness and structure of emotional co-occurrence. This moves beyond the label-level analysis typical in previous studies and introduces a new way of quantifying emotional complexity in user discourse.
In addition to emotional content, our analysis incorporates toxicity, drawing on prior work that links it to online polarization and intergroup hostility (Cinelli et al., 2021; Mosleh, Cole & Rand, 2024). However, the relationship between toxicity and emotional expression remains underexplored. By jointly analyzing emotion and toxicity, we provide a more nuanced view of how users communicate in response to reliable vs. questionable sources.
A further contribution of our study is its user-centered design. Most existing work relies on aggregated analyses at the level of individual posts or videos. Our dataset includes multiple comments per user, allowing us to examine affective patterns not only in aggregate but also at the individual level. This enables us to observe emotional dynamics both within users and across the broader information ecosystem. By combining emotional arborescence, toxicity analysis, and user-level observations, our approach enables the investigation of how users engaged with different types of content (i.e., misinformation vs. mainstream) express emotions in measurably distinct ways—not just in which emotions dominate, but also in how they interact and diversify. In this way, we extend prior findings and introduce new tools for understanding emotional expression across polarized online environments.
Methods
In this section, we present the data and methodologies used to analyze the emotional content of texts in our data sources. We begin by detailing the variables and data processing steps. Next, we illustrate key concepts and definitions related to misinformation, toxicity, and the Plutchik emotional framework. Finally, we describe the techniques employed to assess the emotional content of the documents.
Data collection
We used data employed in Cinelli et al. (2021), which consists of about 1.3 million Italian comments to videos about SARS-CoV-2 posted on YouTube. Table 1 provides a breakdown of the dataset. The set of videos covers the time window that goes from 01/12/2019 to 21/04/2020, while the set of comments ranges in the time window that goes from 15/01/2020 to 15/06/2020. In particular, the comments span from the first case of disease detection in Italian territory on 30/01/2020 to the end of the lockdown’s “phase two” on 12/06/2020. According to Statista, around 24 million Italians—roughly one third of the population—used YouTube in 2019 (Cinelli et al., 2021). Based on the 1% rule of online participation, which suggests that only 1% of users actively contribute by commenting or interacting, this corresponds to an estimated 240k active users. The dataset includes approximately 300k unique users, suggesting that it captures a substantial share of Italy’s active YouTube commenters during that period. Data was collected using the official YouTube Data application programming interface (API), by performing a keyword search for videos that matched a list of keywords, i.e., coronavirus, nCov, corona virus, corona-virus, covid, SARS-CoV.
| Trustworthiness | Channels | Videos | Comments | Users |
|---|---|---|---|---|
| Reliable | 7,140 | 29,975 | 1,170,461 | 304,586 |
| Questionable | 17 | 464 | 103,475 | 9,094 |
| Undefined | – | – | – | 10,326 |
| Total | 7,157 | 30,436 | 1,273,930 | 324,006 |
The dataset used in this study builds on the foundation established in Cinelli et al. (2021), which originally included toxicity and misinformation labels for each YouTube comment. We retained these annotations to maintain consistency and enable comparative analysis with previous findings. In this work, we extend the dataset with novel emotional features and introduce a new metric—the emotional arborescence—to capture the affective structure of comment threads. The following subsections describe the inherited annotations, followed by a detailed explanation of our emotional feature extraction.
Toxicity labeling
The dataset incorporates toxicity labels from Cinelli et al. (2021), where each YouTube comment was annotated using a hate speech detection model. The labels include:
Acceptable: comments that do not contain toxic content;
Inappropriate: comments with vulgar or obscene expressions that are not targeted at specific individuals or groups;
Offensive: comments expressing generalizations, contempt, dehumanization, or indirect insults;
Violent: comments characterized by threats, incitement, or advocacy of physical harm directed at a target, including statements that condone, dispute, or glorify war crimes and crimes against humanity.
The majority of comments are deemed acceptable, while offensive, inappropriate, and violent content appear less frequently (Cinelli et al., 2021).
Misinformation labeling
Building on the approach proposed in Cinelli et al. (2021), each comment was assigned a label—reliable or questionable—based on the classification of the YouTube channel it appeared on. These labels, denoted , reflect the reliability assessment conducted in that work. A channel was labeled as questionable if it regularly produced unverified or false content, or was affiliated with news outlets that had repeatedly failed fact-checks conducted by independent organizations. The labeling was based on curated lists compiled using assessments from fact-checking and media-rating platforms active in Italy, including bufale.net, butac.it, facta.news, newsguardtech.com, and pagellapolitica.it. All remaining channels were labeled as reliable. There is no substantial difference in the distribution of toxicity labels between comments posted on questionable and reliable channels (Cinelli et al., 2021).
User classification followed the methodology proposed in Cinelli et al. (2021), grouping individuals into two categories–mainstream-prone and misinformation-prone–based on their commenting behavior. This classification captures commenting preferences only, without making assumptions about users’ agreement with the content.
To assign the label indicating the category of a user , the leaning statistic was computed as the proportion of comments posted on questionable channels:
where denotes the set of comments posted by user , and is the number of comments on videos from Questionable channels authored by that user. For instance, a user with four comments on reliable sources and one on a questionable source would have a leaning score of . Thus, a user is assigned the misinformation-prone label if , and the mainstream-prone label if . Users with in the intermediate range remain Undefined, representing 3.2% of the total. Consequently, 96.8% of users have a defined leaning, of which 2.9% is classified as misinformation-prone.
Emotional feature extraction
Extending the previously labeled dataset, this section introduces our original emotional annotations. We used the Plutchik emotional framework, a flexible framework widely used in psychotherapy and emotion detection (Plutchik & Kellerman, 2013). In this framework, the emotional landscape is composed of eight distinct basic emotional features, each trigger of particular behavior: joy (feeling of happiness, contentment, and pleasure); trust (sense of safety, confidence, and reliability in someone or something); fear (response to perceived threats, leading to caution or avoidance); surprise (reaction to unexpected events, which can be either positive or negative); sadness (feeling of loss, disappointment, or sorrow); disgust (aversion to something unpleasant or offensive); anger (response to threats, injustice, or frustration); anticipation (feeling of excitement or apprehension about future events).
These emotions are organized in opposing pairs in a circular representation: joy and sadness, fear and anger, trust and disgust, and surprise and anticipation. Moreover, the flexibility of the framework derives from the possibility of combining pairs of basic emotions to form 28 more complex emotions, called dyads. Examples of such dyads include love (joy + trust), submission (trust + fear), and optimism (anticipation + joy). We refer to the Table S2 for the complete list of secondary emotions.
Preprocessing
Our first goal is to extract emotional features from YouTube comments. Typically, such tasks involve analyzing texts using a lexicon of word-emotion associations, such as the NRC Lexicon. However, we refine this methodology to increase the sensitivity and interpretability of our results. As part of preprocessing, we took steps to minimize potential confounds introduced by emotionally valenced personal names that might be misinterpreted by automated tools. For example, the surname of the Italian Minister of Health at the time—Speranza, meaning hope in Italian—could spuriously trigger the detection of positive affect, specifically the Plutchik emotion trust. To avoid such misclassifications, instances of “Speranza” were replaced with semantically neutral placeholders. Similar adjustments were made for other names with potential linguistic or emotional ambiguity, such as “Conte” and “Draghi”.
Extraction of forma mentis networks
After preprocessing all texts, we extracted their textual forma mentis networks (TFMNs) (Stella, 2020), built through EmoAtlas (Semeraro et al., 2025). TFMNs rely on automatic syntactic parsing implemented via the spaCy parser 1 (Honnibal et al., 2020). The parser identifies associations between words and represents a sentence as a tree, where a root word is subsequently specified by syntactic dependencies (Stella, 2020). In TFMNs, nodes represent words and are linked either syntactically (if at distance on the syntactic dependency tree extracted by the parser) or semantically (if synonyms according to WordNet (Fellbaum, 1998)). Following previous works (Stella, Restocchi & De Deyne, 2020), we used to select local syntactic relationships. Differently from co-occurrence networks, TFMNs are also enriched with emotional labels (Mohammad & Turney, 2013) attributed to individual words, e.g. words that elicit “joy” in participants of a psychological mega-study.
Emotional features significance
To investigate the semantic structure of words, we compared the emotions identified in YouTube comments with those from a null model consisting of randomly selected words and their corresponding emotions. Specifically, we calculated z-scores by contrasting the emotion distributions observed in TFMNs with those obtained from 300 random samples of the lexicon. This approach produces a z-score for each emotion in a given comment , quantifying the degree to which that emotion is represented.
A z-score above the percentile of a normal distribution indicates that there is a statistically significant presence of a given emotion. Then, we define the event as the event that emotion is statistically represented in comment , i.e.,
and the related indicator variable
For brevity, we omit if it is clear from the context, writing and .
Users’ defining features
We aim to investigate the emotions defining the language of mainstream-prone and misinformation-prone users using explainable AI techniques. First, we characterize each user with nine features: for the Plutchik emotions, and one categorical label showing their commenting preference. For each emotion we compute , the fraction of the user’s comments containing a statistically significant number of words associated with emotion , i.e.:
For example, if user posted eight comments, of which one contained a significant level of the emotion “trust”, then .
Model selection and evaluation
Then, we train a random forest model, and explain it using Shapley Additive Explanations (SHAP) (Lundberg & Lee, 2017), employing it as an exploratory tool to investigate the emotional feature importance and correlations with respect to the users’ commenting preferences. We employed a random forest model for user preference classification, due to its wide acceptance as a robust and inspectable algorithm well-suited for explanatory analysis (Hastie et al., 2009). The model was trained on users characterized by their emotional features, using standard parameters ( estimators, Gini split, features, maximum depth). To improve the validity of our analyses, we modeled the emotional attributes of sufficiently active users possessing a defined commenting preference. That is, we chose to include user if the quantity of posted comments meets or exceeds a specified threshold T, thus preventing the model from analyzing irrelevant or low-quality data.
Empirically, we set as a reasonable choice, as it ensures that each user has the opportunity to express each emotion at least once. We also considered two different thresholds, of and comments respectively.
As mainstream-prone users are more than an order of magnitude greater than misinformation-prone users, fitting a model on this data would lead the model to favor the majority class. Therefore, we applied Synthetic Minority Oversampling Technique (SMOTE) (Chawla et al., 2002) to balance the classification (Bhagat & Patil, 2015). This technique creates synthetic users from the minority class by sampling existing data points and assigning the synthetic data points the average feature values of sampled ones. We fitted the model to all the points retained in this way.
Next, we examined the number of users retained for the analysis, and the models’ precision on training data’s minority class labeling, misinformation-prone user, shown in Tables 2 and 3 respectively. Inspecting the models’ precision on the minority class allows to evaluate the model’s effectiveness for the purpose of explanation of possible feature differences between classes. We selected the model trained on users which posted at least comments, as the precision of the model on the minority class was lower than in the chosen model for both and , albeit for different reasons. A lower threshold of introduced many noisy data points with contradictory examples due to low user activity, meaning users with differing labels but identical emotional configurations were included, therefore leading to a decay of the model’s performance on the training data itself. While methods to tackle this issue are well known, they are aimed at improving and generalizing the model for predictive purposes, which falls outside the objective of this analysis. Conversely, applying a stricter threshold of led to decreased data retention, and to the exclusion of many otherwise viable data points from the model, which also resulted in precision loss on the training data.
| Min. comments | 0 | 5 | 8 | 10 |
|---|---|---|---|---|
| Min. emotions | 0 | 1 | ||
| N. users | 304,586 | 42,174 | 25,153 | 19,614 |
| N. MAp users | 295,492 | 41,374 | 24,744 | 19,335 |
| N. MIp users | 9,094 | 800 | 409 | 279 |
| Min. Comments | 5 | 8 | 10 |
|---|---|---|---|
| Overall accuracy | 97.55% | 99.83% | 99.94% |
| Overall precision | 41.73% | 98.67% | 98.20% |
| Overall F1-score | 53.40% | 94.39% | 98.03% |
| Accuracy on MAp users | 98.00% | 99.98% | 99.97% |
| Precision on MAp users | 99.49% | 99.84% | 99.97% |
| F1 on MAp users | 98.74% | 99.91% | 99.97% |
| Accuracy on MIp users | 74.12% | 90.46% | 97.85% |
| Precision on MIp users | 41.73% | 98.67% | 98.20% |
| F1 on MIp users | 53.40% | 94.39% | 98.03% |
Model explanation
To interpret the output of our Random Tree Forest model, we adopted SHAP (Lundberg & Lee, 2017; Lundberg et al., 2020) with tree path-dependent feature perturbation and no approximation, to preserve the values’ consistency guarantees.
SHAP is a game theoretic approach to model interpretation that computes each feature’s contribution to the model’s classification, which uses Shapley Values to determine the importance of the features for the classifier. Shapley Values are computed as the feature’s average marginal contribution across all possible feature permutations.
Emotional arborescence
This section defines the measure of emotional arborescence and its intended purpose. Drawing on Plutchik’s theory and the concept of emotional dyads, it leverages conditional probabilities to provide a direct and interpretable metric of the specific relationships between emotions. This approach is distinct from an entropy-based measure, which would assess the overall emotional diversity of a group. Instead, emotional arborescence is designed to capture the detailed emotional patterns and dependencies within a set of documents, offering insights into the structure of how emotions are expressed.
The first step in the computation of the emotional arborescence involves computing the probabilities of emotion co-occurrences. Given a set of emotional features E (e.g., Plutchik’s basic emotions) and a collection of documents , each document may contain any number of emotions in statistically significant quantities, such that .
To compute the arborescence of an emotion in the set of documents D, the analysis begins by identifying all documents that contain the given emotion . Next, we define the subset of emotional features.
As the rooted emotion set, i.e., all emotions beside emotion that can be found in a document . Similarly, we define the set of all unordered pairs of distinct emotions in as
Then, we compute two sets of probabilities for each emotion : the “stem” probabilities , and the “branch” probabilities , where represents the event of finding a statistically significant signal for emotion . The “stem” probabilities measure the probability of finding a statistically significant signal of emotion in documents containing emotion ; likewise, the branch probabilities measure the probability of finding statistically significant signals of both emotions and in the documents containing emotion . These probabilities are visualized as the thickness of stems and branches in the arborescence plots. Subsequently, we measure the variety of emotions using the co-occurrence probabilities, and their significance. That is, given an emotion , we let the set of stems
and the set of branches
As the set of statistically significant “stem” and “branch” probabilities, where and are the mean and standard deviation of a reference distribution of probabilities. A distribution of emotion co-occurrences was obtained through reshufflings of emotions within each relevant subset of comments. For example, to generate a reference distribution for the anger arborescence in comments by misinformation-prone users, each comment from mainstream-prone users containing anger was selected, and the remaining emotions were randomly shuffled times.
Finally, we define the emotional arborescence measure as the weighted sum of elements in and :
Results
We begin this section by presenting the distribution of emotions in comments, examining their relationship to both the trustworthiness of the sources and the toxicity of the language used. We then explore the emotional profiles of content from mainstream-prone and misinformation-prone users within the Plutchik framework, considering both basic emotions and emotion dyads. Finally, we investigate the overall emotional variety in the discourse of the two user groups.
Comments’ emotions in relation to toxicity and misinformation
We start our analysis by measuring the frequency of occurrence of Plutchik eight basic emotions (see Methods for details).
Thus, we label each comment to reliable and questionable sources with eight binary indicators to signal the presence or absence of each basic emotion.
We observe that comments ( ) contain at least one basic emotion. To simplify our analysis, we exclude comments that do not exhibit any basic emotion. To ensure that this exclusion does not affect the proportion of comments from reliable and questionable sources, we conduct a test. The results indicate no significant relationship between the source’s trustworthiness and the presence of emotional features (Pearson ). This confirms that removing comments without emotional features does not impact the distribution of trustworthiness labels.
However, the test does not account for the nature of emotional features. To explore this further, we compare the frequency of each distinct basic emotion in comments from reliable and questionable sources, as illustrated in Fig. 1. We then apply the test to each basic emotion individually. As shown in Table 4, significant differences emerge in the distribution of labels for all basic emotions except sadness, although the effect sizes, measured by Cramér’s V, remain low. A possible interpretation for the low effect size is that it reflects both the imbalance between the two groups and the pairwise nature of Cramér’s V: single emotions have limited impact, while combinations of emotions—which could carry stronger signals—are not captured. This indicates that following analyses should consider the interaction between emotions.
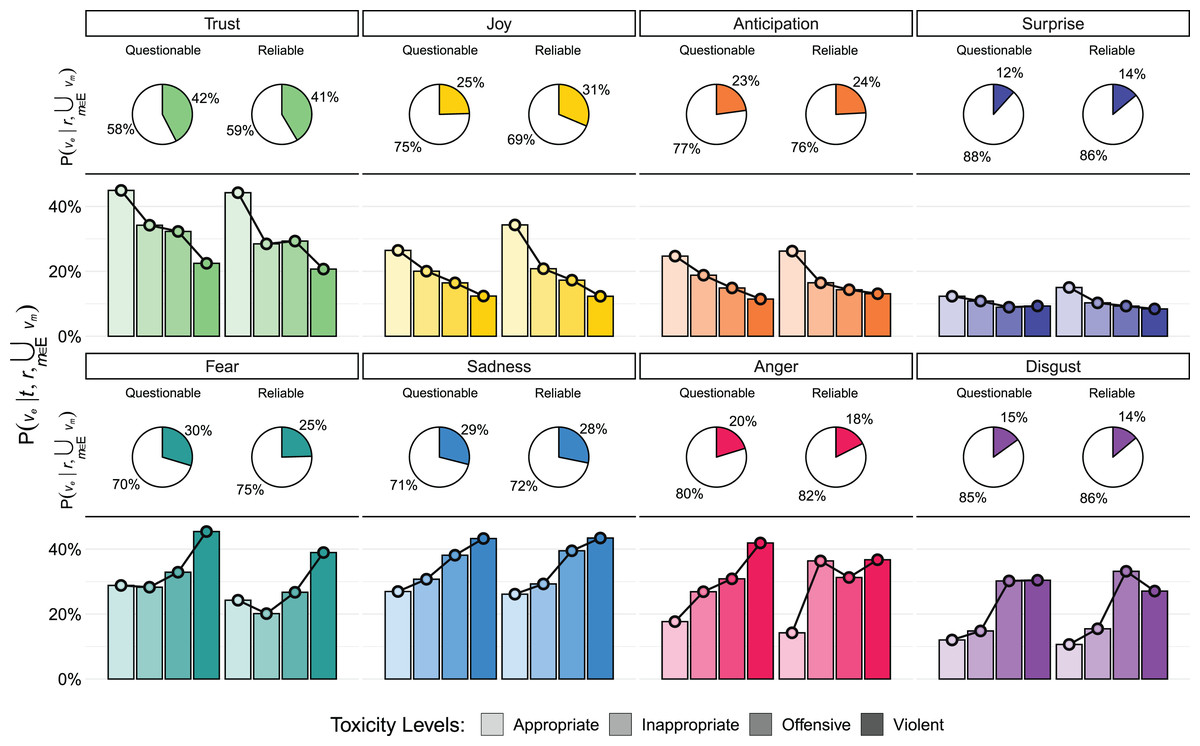
Figure 1: Emotional content of comments.
The pie charts show , the probability of encountering a significant signal of a specific emotion given the trustworthiness of the source , in comments with at least one significant emotional signal ( ). The bar charts depict , the probability of encountering a specific emotion in a comment, given both the toxicity level and the trustworthiness of the source . Joy is more prevalent in comments from reliable sources, while Anger and Disgust exhibit markedly different patterns.
| Emotion | N | Cramér’s V | |
|---|---|---|---|
| Trust | 293,961 | 31.96 | 0.007 0.002 |
| Joy | 218,203 | 1,125.15 | 0.04 0.002 |
| Anticipation | 168,156 | 55.45 | 0.009 0.002 |
| Surprise | 96,246 | 242.23 | 0.019 0.003 |
| Fear | 173,180 | 642.4 | 0.03 0.003 |
| Sadness | 195,885 | 8.86 | 0.004 0.002 |
| Anger | 122,948 | 236.87 | 0.018 0.002 |
| Disgust | 97,189 | 46.92 | 0.008 0.002 |
Next, we examine the relationship between emotions, toxicity, and source trustworthiness. Each comment in our dataset falls into one of four toxicity categories, as defined in subsection Toxicity Labeling of the Methods section: Acceptable, Inappropriate, Offensive, and Violent.
To answer RQ1, and investigate how toxicity levels relate to emotional features, we compute the probability of a significant presence of each basic emotion in a comment with toxicity level from a source with trustworthiness , expressed as . Here, represents the presence of a significant signal for emotion , while indicates that we consider only comments exhibiting a significant signal for at least one emotions .
As illustrated in Fig. 1, a clear relationship emerges between emotions and toxicity levels. Emotions can be broadly grouped into two categories: “positive” emotions (trust, joy, anticipation, and surprise), which negatively correlate with an increase in toxicity, and “negative” emotions (fear, anger, sadness, and disgust), which positively correlate with an increase in toxicity.
Furthermore, we find that “positive” emotions are more prevalent in low-toxicity comments from reliable sources compared to questionable sources. In contrast, “negative” emotions occur more frequently in high-toxicity comments from questionable sources. This finding is not unexpected, since toxicity and negative emotions are tied. However, here we find that anger is more likely to appear using appropriate language in comments to unreliable sources rather than in comments to reliable ones. This trend aligns with the expected pattern of other negative emotions. These findings address RQ1 and underscore how emotional signals vary in relation to both the toxicity of comments and the trustworthiness of their sources.
User emotional features and misinformation
In the previous section, we observed differences in the emotional expression of comments to reliable and questionable sources. Here, we focus instead on users and their preference for commenting on questionable or reliable sources (regardless of their personal beliefs. We employ the same categorization of users employed in Cinelli et al. (2021) based on their commenting preferences: those predominantly engaging with reliable YouTube channels (mainstream-prone), and those primarily engaging with questionable YouTube channels (misinformation-prone) and excluding users with undefined commenting preference (see Methods section Users’ Defining Features for details). Additionally, we have to exclude users without any significant emotional signal in their comments, as emotional features are missing. However, misinformation-prone users using emotions in their comments are 2.3% more numerous than mainstream-prone users, which is significant according to Pearson’s test with Yates continuity correction ( , Cramér’s V: 0.018). Lastly, we focus on users posting a minimum threshold of comments, under the premise that these users had ample opportunities to express their emotions. Nonetheless, we performed robustness tests using thresholds of and , finding similar results.
After training a random forest model which uses users’ emotional features to label their commenting preferences, we compute the model’s Shapley values, summarized in Fig. 2 (further details are provided in Methods section, Users’ Defining Features, the mean absolute SHAP values are reported in Table 5). Answering RQ2, we find that trust and fear are positively correlated with a user’s preference for questionable content: trust is a positive emotion associated with affiliation and sense of belonging; fear on the other hand is a negative emotion associated with the reaction to flee in response to a threat, in opposition to the drive to attack implied by anger. This finding is counterintuitive, as trust is a more prevalent in reliable comments, and suggests that trust, alongside fear, plays a key role in characterizing the language of misinformation-prone users. This suggests the possibility of an interplay between trust and fear, which gives rise to the dyad of “submission” in Plutchik’s theory (Plutchik, 1982). An alternative interpretation is that trust is indeed characterizing misinformation-prone users, as indicated in past works (Ognyanova et al., 2020), while other emotions are more prevalent mainstream-prone users.
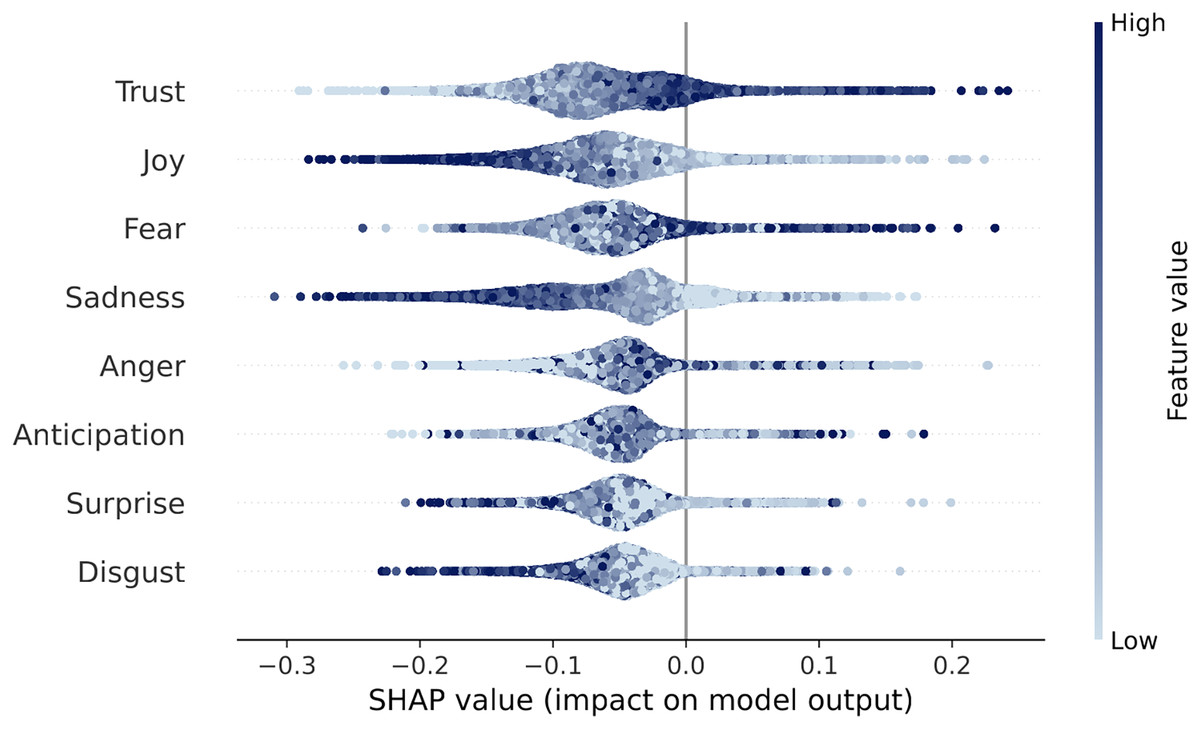
Figure 2: Shapley values from our random forest model.
Each dot represents a user, with the color indicating the row feature’s intensity. The horizontal axis shows the impact of the feature on the labeling, according to the model: a positive SHAP value indicates that the emotion moved the user towards misinformation-prone label. A clear shading effect of the dots (e.g., left is light, right is dark) implies a positive linear correlation between that variable and the outcome.
| Emotional feature | Mean absolute feature value |
|---|---|
| Trust | 0.13641 |
| Joy | 0.13051 |
| Fear | 0.12127 |
| Sadness | 0.11967 |
| Anger | 0.11790 |
| Anticipation | 0.11442 |
| Surprise | 0.10433 |
| Disgust | 0.10093 |
Emotion co-occurrences
The difference highlighted by the SHAP value analysis in the use of emotional language between the misinformation-prone and mainstream-prone users classified by our model considers the impact of the eight distinct basic emotions. However, this SHAP-based approach neglects the simultaneous presence of pairs of emotions, i.e., dyads. To address this issue, we compute the probability of finding the dyad in comments from user for each of the dyads. Figure 3 shows the differences in average values for the two user groups.

Figure 3: Mean dyad value difference plot.
The figure shows differences between average co-occurrences of two emotions (i.e., dyads) in misinformation-prone (larger gray dots) and mainstream-prone (smaller black dots) users’ comments. Rows are ordered by ascending difference. Anger + fear (frozenness), trust + fear (submission), trust + anger (dominance) and fear + disgust (shame) are more prevalent in misinformation-prone users’ comments, while joy + sadness (bittersweetness), sadness + disgust (remorse), trust + joy (love), anticipation + sadness (pessimism), trust + surprise (curiosity), anticipation + joy (optimism) and joy + surprise (delight) are more abundant in mainstream-prone users’ comments.
A two-part testing strategy is required to assess the significance of the values reported in Fig. 3, given the abundance of zeroes in the distribution of dyad values. We first test if the presence of dyads is independent of the user commenting preference for reliable or questionable sources; then, we test for the difference in intensity of the expressed dyads, i.e., how many comments from each user contained each dyad.
The results, fully reported in Tables 6 and 7, show a complex picture: in general, mainstream-prone users tend to employ dyads more frequently than misinformation-prone users, as all dyads with significant p-values are more frequent in mainstream-prone users. However, misinformation-prone users who employ dyads do express them more frequently.
| Dyad | MAp median | MIp median | W statistic | p-value |
|---|---|---|---|---|
| frozenness | 0.077 | 0.100 | 1,200,735.5 | <0.001 |
| submission | 0.059 | 0.077 | 618,883.5 | <0.001 |
| dominance | 0.045 | 0.067 | 244,400.5 | 0.001 |
| shame | 0.067 | 0.077 | 903,541.0 | 0.028 |
| ambivalence | 0.042 | 0.067 | 140,593.0 | 0.001 |
| aggressiveness | 0.044 | 0.053 | 245,429.5 | 0.111 |
| contempt | 0.071 | 0.083 | 1,039,114.5 | 0.111 |
| alarm | 0.045 | 0.056 | 259,267.0 | 0.028 |
| unbelief | 0.038 | 0.047 | 90,961.5 | 0.111 |
| sentimentality | 0.062 | 0.077 | 643,625.0 | 0.019 |
| outrage | 0.043 | 0.053 | 181,567.5 | 0.028 |
| pride | 0.038 | 0.056 | 81,176.5 | 0.086 |
| hope | 0.091 | 0.100 | 1,813,266.5 | 0.071 |
| envy | 0.078 | 0.091 | 1,189,395.5 | 0.028 |
| guilt | 0.043 | 0.061 | 175,291.0 | 0.028 |
| confusion | 0.069 | 0.077 | 901,055.5 | 0.026 |
| anxiety | 0.059 | 0.067 | 538,413.0 | 0.049 |
| morbidness | 0.040 | 0.044 | 104,142.0 | 0.617 |
| cynism | 0.038 | 0.044 | 96,059.0 | 0.276 |
| despair | 0.100 | 0.111 | 1,832,459.0 | 0.060 |
| disappointment | 0.050 | 0.059 | 331,368.0 | 0.086 |
| bittersweetness | 0.054 | 0.059 | 355,884.0 | 0.213 |
| remorse | 0.077 | 0.083 | 1,140,266.0 | 0.111 |
| love | 0.100 | 0.111 | 2,228,767.5 | 0.291 |
| pessimism | 0.059 | 0.071 | 536,727.0 | 0.221 |
| curiosity | 0.067 | 0.075 | 627,373.0 | 0.099 |
| optimism | 0.083 | 0.086 | 1,577,441.0 | 0.344 |
| delight | 0.071 | 0.071 | 928,614.5 | 0.577 |
| Dyad | MAp % | MIp % | MAp # | MIp # | p-value | |
|---|---|---|---|---|---|---|
| frozenness | 53.4% | 56.2% | 13,223 | 230 | 1.154 | 0.377 |
| submission | 39.4% | 39.1% | 9,743 | 160 | 0.003 | 0.993 |
| dominance | 23.6% | 26.2% | 5,834 | 107 | 1.349 | 0.362 |
| shame | 45.4% | 44.2% | 11,235 | 181 | 0.171 | 0.761 |
| ambivalence | 20.0% | 18.6% | 4,962 | 76 | 0.456 | 0.608 |
| aggressiveness | 23.3% | 23.2% | 5,771 | 95 | 0.000 | 1.000 |
| contempt | 48.8% | 45.5% | 12,076 | 186 | 1.652 | 0.309 |
| alarm | 25.3% | 23.9% | 6,272 | 98 | 0.339 | 0.654 |
| unbelief | 14.7% | 14.1% | 3,632 | 58 | 0.045 | 0.897 |
| sentimentality | 41.1% | 36.0% | 10,189 | 147 | 4.344 | 0.069 |
| outrage | 22.0% | 19.6% | 5,440 | 80 | 1.244 | 0.371 |
| pride | 14.7% | 13.0% | 3,636 | 53 | 0.835 | 0.459 |
| hope | 65.2% | 59.7% | 16,123 | 244 | 5.119 | 0.051 |
| envy | 54.1% | 48.7% | 13,377 | 199 | 4.519 | 0.067 |
| guilt | 22.6% | 18.6% | 5,571 | 76 | 3.352 | 0.117 |
| confusion | 48.3% | 42.1% | 11,946 | 172 | 5.997 | 0.040 |
| anxiety | 37.6% | 32.0% | 9,312 | 131 | 5.153 | 0.051 |
| morbidness | 16.2% | 13.2% | 4,016 | 54 | 2.500 | 0.188 |
| cynism | 17.2% | 12.2% | 4,256 | 50 | 6.673 | 0.034 |
| despair | 65.8% | 59.9% | 16,290 | 245 | 6.025 | 0.040 |
| disappointment | 30.6% | 24.2% | 7,564 | 99 | 7.394 | 0.026 |
| bittersweetness | 31.6% | 24.2% | 7,820 | 99 | 9.869 | 0.008 |
| remorse | 53.5% | 45.5% | 13,238 | 186 | 10.087 | 0.008 |
| love | 70.6% | 65.0% | 17,459 | 266 | 5.633 | 0.045 |
| pessimism | 38.9% | 29.3% | 9,627 | 120 | 15.114 | 0.001 |
| curiosity | 42.4% | 32.2% | 10,504 | 132 | 16.660 | 0.001 |
| optimism | 61.4% | 52.8% | 15,205 | 216 | 12.293 | 0.003 |
| delight | 48.2% | 39.1% | 11,930 | 160 | 12.968 | 0.003 |
Addressing RQ3, the fear + anger dyad (frozenness) and the trust + fear (submission) dyads are those with the largest difference of mean values in favor of misinformation-prone users, while optimism and delight are those with the largest difference in favor of mainstream-prone users. These results confirm the hypothesis of an interplay between negative and positive emotions in misinformation-prone users, as explored in RQ2.
Emotional arborescence
Finally, we use the emotional arborescences introduced in subsection Emotional Arborescence of the Methods section, to analyze the structure of emotional co-occurrences in comments by misinformation-prone and mainstream-prone users. Figure 4 visually represents how a key/root emotion co-occurs with other emotions, with these latter emotions branching out from the root. The thickness of the stems and branches indicates the probability of co-occurrence, thereby highlighting stronger or weaker associations. Overall, the visualization resembles a tree structure with a root and multiple branches, though cycles between branches may also emerge. We examine the set of comments from misinformation-prone users and mainstream-prone users, focusing on the emotions expressed in these comments. We compute the probability of finding emotions and in a comment containing emotion from a user with commenting preference . Additionally, we perform an undersampling test on emotional stems (ES) and emotional branches (EB) of mainstream-prone user comments to ensure that any observed differences in emotional distribution are not simply due to the smaller number of comments from misinformation-prone users. Details on significance computation and robustness check are reported in the Methods section. Comparing the emotional arborescence between the two groups, we find that comments from misinformation-prone users exhibit a sparser emotional landscape, as depicted in Fig. 4. We then quantify the variety of emotional features in the two user groups by comparing the emotional arborescence of the comments from mainstream-prone users, , and from misinformation-prone users . By examining the ratio , we find that mainstream-prone users show more emotional arborescence than misinformation-prone users, which addresses RQ4. These results further stress the patters highlighted by RQ2: the emotional contents of user-generated content written by misinformation-prone users offers less variety than the content from mainstream-prone users.
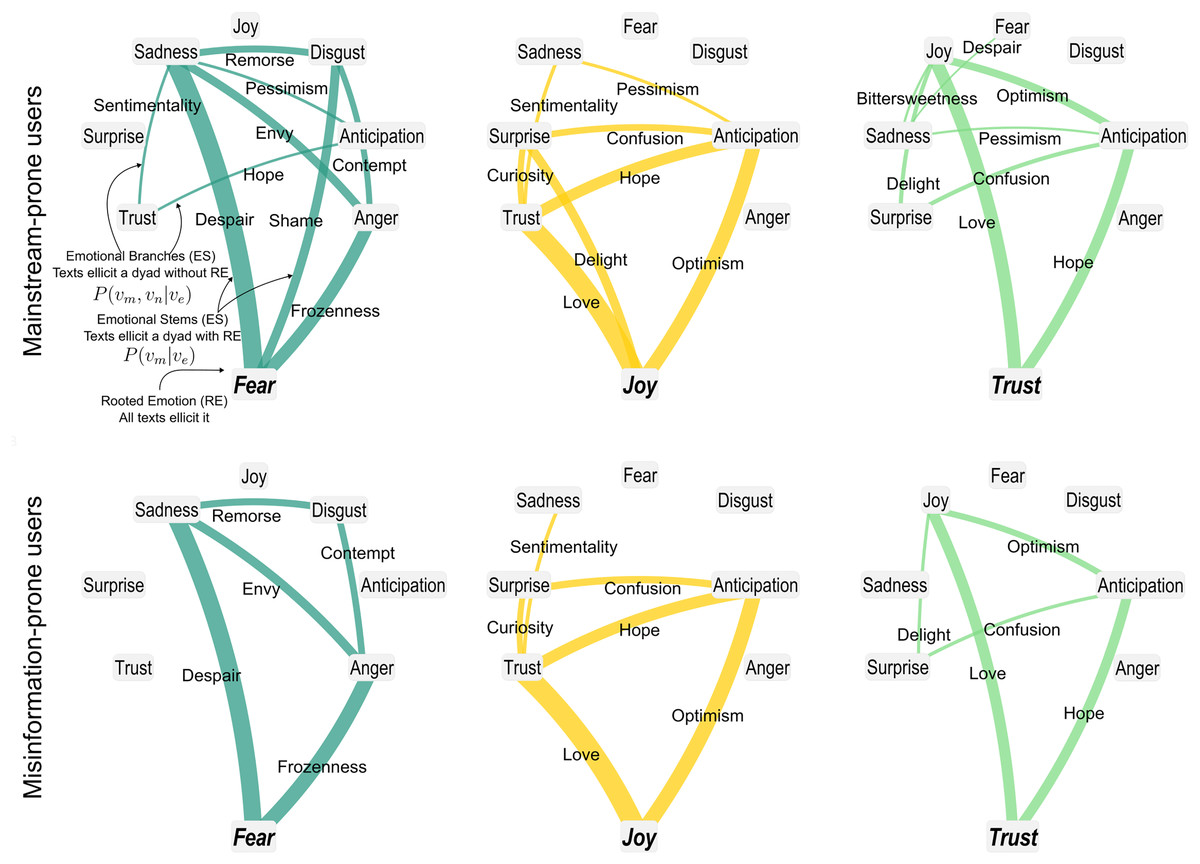
Figure 4: Arborescence plots of emotion co-occurrences in comments of mainstream-prone and misinformation-prone users.
The figure shows arborescence plots of Fear, Joy and Trust for mainstream-prone (Top) and misinformation-prone (Bottom). The arborescences of the other emotions are reported in Fig. S1. The plots show trees starting from their rooted emotions (RE), which are connected to the other emotions through emotional stems (ES), scaled by the value of ; similarly, each couple is connected by emotional branches (EB) scaled by . Values that are not significant according to permutation tests are “cut” from the tree. Arborescence is defined as the fraction of ES and EB appearing over the number of all possible EB and ES. The figure shows that the arborescences of comments by mainstream-prone users have more ES and EB than those by misinformation-prone ones.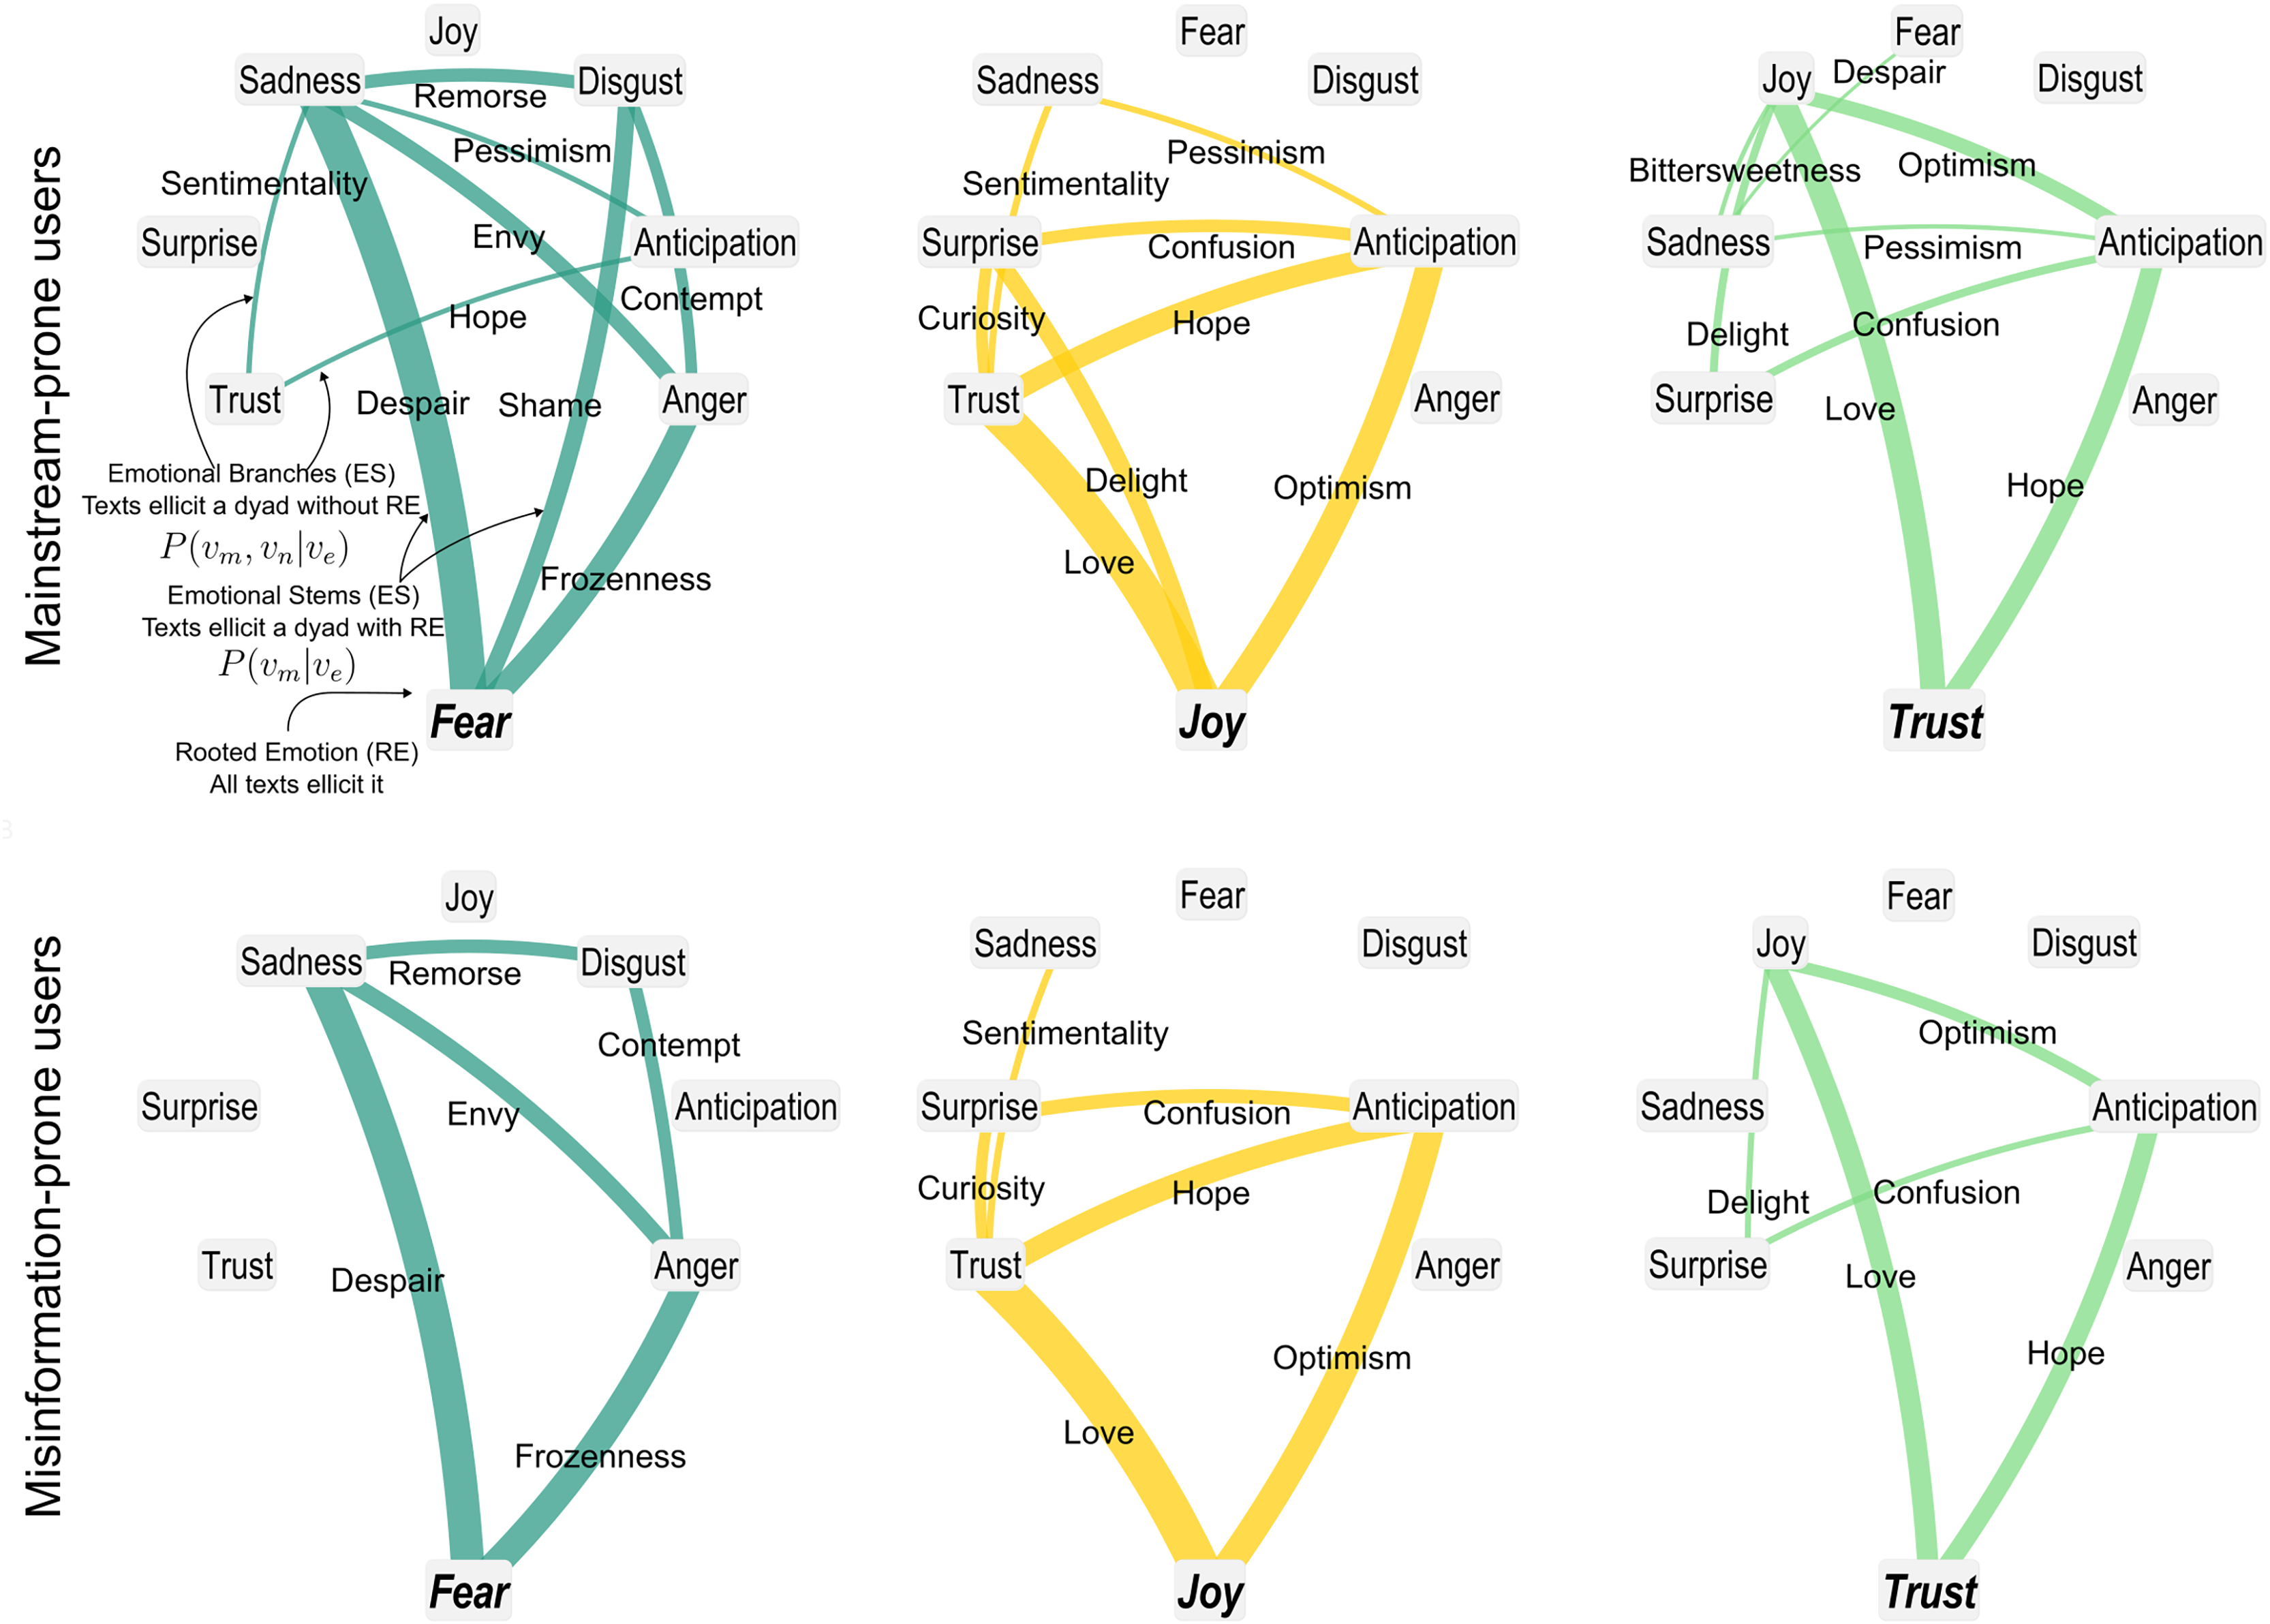
Discussion
In this study, we investigate the emotional content of toxic language produced by two opposing online communities: misinformation-prone and mainstream-prone users. The online debate is driven by an emotionally and politically polarizing topic–COVID-19. Adopting the EmoAtlas’ computational framework of Plutchik’s emotions (Semeraro et al., 2025), we evaluate the presence and co-occurrence of basic and nuanced emotions among users predominantly engaging with misinformation or mainstream content at increasing levels of toxicity.
While prior studies found both higher levels of anger in misinformation contents (Han, Cha & Lee, 2020) and similar levels of toxic language in comments on both reliable and questionable YouTube sources (Cinelli et al., 2021), our analysis shows that, although anger is overall less frequent in comments to reliable information (−2.54%), its prevalence specifically increases within toxic comments (+1.93%), in particular in Inappropriate and Offensive comments. In the other group (comments to unreliable sources) we observe alongside the increased negative emotion load a “normalization” of anger with respect to the toxicity found in comments. In other terms, we find that anger is more likely to appear using appropriate language in comments to unreliable sources rather than in comments to reliable ones. This quantitative finding importantly aligns with past findings about fake news diffusion among users of different political alignments (Ognyanova et al., 2020). Anger is also more likely to appear in comments employing violent language, which, however, are numerically much smaller in sample size. This re-contextualizes the usage of anger in reliable and unreliable information sources, where comments to reliable sources more likely use Inappropriate and Offensive language with anger. Conversely, comments to unreliable sources use anger in Appropriate and Violent comments. As reported also in Plutchik’s theory, anger is an emotional reaction to fight against external threats (Plutchik & Kellerman, 2013; Plutchik, 2001), hence it is expected that users express anger more frequently when using very high levels of toxicity and aggressiveness.
Also, misinformation-prone users tend to express language associated with trust and fear, often in combination with anger. To quantify this emotional complexity, we introduce the concept of emotional arborescence, measuring the emotional variety present in comments from each user group. We observe that misinformation-prone users generally exhibit lower emotional variety compared to mainstream-prone users.
Anger and fear represent two antagonistic responses to external threats: anger motivates aggressive confrontation, whereas fear triggers avoidance or flight behaviors (Plutchik, 1982; Bushman, 2002). Our findings suggest that mainstream-prone users display more aggressive and confrontational language than misinformation-prone users. However, interpretations of these emotional differences must consider the inherent limitations of online comments, as these alone cannot sufficiently determine users’ intentions.
Employing explainable AI techniques based on SHAP scores (Lundberg et al., 2020), we identify trust and fear as particularly distinguishing emotions among misinformation-prone users. Specifically, higher levels of trust and fear significantly contribute to classifying user-generated content as misinformation-prone. Our results thus underscore trust and fear as defining emotional characteristics within the comments of misinformation-prone users in our dataset.
Interpreting the higher prevalence of trust among misinformation-prone users requires considering the dual nature of trust (Castelfranchi & Falcone, 2010). Trust can arise either from cognitive reasoning—such as relying on a source perceived as credible—or from affective processes, such as emotional bonds. Using online comments alone, we cannot clearly distinguish these cognitive and affective components, thus limiting our ability to pinpoint the exact origins of trust. However, the elevated presence of trust among misinformation-prone users likely reflects a combination of affective and cognitive factors. Trust may signify increased positively valenced social cohesion within an in-group (Devos, Spini & Schwartz, 2002; Rathje, Van Bavel & Van Der Linden, 2021), or could result from specific reasoning tied directly to the debated topic, COVID-19. Future research employing existing dictionaries that measure in-group cohesiveness in online environments (Rathje, Van Bavel & Van Der Linden, 2021) could better quantify and clarify the socio-affective dimensions underlying increased trust observed among misinformation-prone users.
The second major pattern identified by our analysis is the stronger presence of fear among misinformation-prone users. Fear is a negatively valenced emotion elicited by perceived external threats (Plutchik, 1982). Within this dataset, fear could relate to diverse concerns such as COVID-19 itself, lockdown measures (Stella, Restocchi & De Deyne, 2020), or disrupted social interactions due to the pandemic. Future research employing topic modeling (Alipour et al., 2024) or cognitive network science (Stella, 2020) could quantitatively investigate the specific sources of fear in online discussions. Beyond this open research avenue, our findings clearly show the prominent role of fear among misinformation-prone users. Extensive psychological literature primarily associates fear with avoidance-oriented responses like fleeing, loss of control, negativity, and heightened alertness (Plutchik, 2001; Coelho et al., 2020). This characterization differentiates misinformation-prone users from mainstream-prone users, who, as previously noted, express aggression more prominently.
Our study also introduces emotional arborescence as a novel complex-network measure designed to capture the richness and complexity of emotional co-occurrences in textual corpora. Arborescence quantifies how various emotions co-occur relative to a reference “root” emotion (see Methods), resulting in an interpretable and robust measure of emotional richness, available through simple counting operations, cf. the EmoAtlas computational framework (Semeraro et al., 2025), rather than via black-box estimates available from large language models. Arborescence makes it easier to investigate also patterns among more emotions co-occurring together. For example, higher arborescence relative to trust implies that emotions other than trust co-occur more frequently with each other. Thus, arborescence can enhance understanding of how emotions such as fear and trust are integrated within online content produced by different user groups. Our analysis reveals lower emotional arborescence in misinformation-prone users, whose comments frequently emphasize trust and fear while exhibiting limited emotional diversity. Conversely, mainstream-prone users display richer interconnections among emotions. This difference might be due to psychological phenomena limiting the emotional expressiveness of misinformation-prone users, like rumination (Bushman, 2002), i.e., a tendency to circle around, think and express the same ideas. This interpretation calls for future research directions testing psychological phenomena in relation with misinformation consumption.
Recognizing the limitations inherent in our analysis can guide future research. Online platforms introduce contextual variability, as online interactions substantially differ across platforms and from offline communication. Future research guided by cognitive psychology (Stella, 2022) should investigate, in controlled laboratory settings, the extent to which System 2 (analytical and deliberate) cognitive processes might be impaired among misinformation-prone users. Moreover, it is important to clarify that our classification of users as misinformation- or mainstream-prone is based exclusively on their activity within specific content channels, without necessarily implying endorsement or adversarial behavior (Pennycook & Rand, 2020, 2021).
Despite these limitations, our findings provide quantitative evidence of emotional distinctions in responses to content from reliable vs. questionable sources, both at aggregate and individual user levels. These emotional differences offer valuable psychological insights and enhance understanding of online misinformation engagement. From this perspective, our results represent an exploratory yet innovative approach to investigating cognitive and emotional differences between misinformation- and mainstream-prone users on a large scale.