
Prediction of miRNA-disease associations using a dual-channel contrastive model based on multi-source information fusion
- Published
- Accepted
- Received
- Academic Editor
- Consolato Sergi
- Subject Areas
- Computational Biology, Algorithms and Analysis of Algorithms, Data Mining and Machine Learning, Neural Networks
- Keywords
- miRNA-disease associations, Heterogeneous graph, Dual-channel, Multi-source information
- Copyright
- © 2025 Lian et al.
- Licence
- This is an open access article distributed under the terms of the Creative Commons Attribution License, which permits unrestricted use, distribution, reproduction and adaptation in any medium and for any purpose provided that it is properly attributed. For attribution, the original author(s), title, publication source (PeerJ Computer Science) and either DOI or URL of the article must be cited.
- Cite this article
- 2025. Prediction of miRNA-disease associations using a dual-channel contrastive model based on multi-source information fusion. PeerJ Computer Science 11:e3378 https://doi.org/10.7717/peerj-cs.3378
Abstract
In the early prevention and treatment of diseases, it is crucial to identify potential associations between microRNAs (miRNAs) and diseases accurately. In recent years, deep learning methods have provided a new computational strategy for exploring these associations. However, integration of multi-source datasets introduces computational complexity, resulting in time-consuming and unstable performance when applying deep learning to accurately predict miRNA-disease associations (MDAs). Here, we propose a computational approach for predicting MDAs based on a dual-channel contrastive model with multi-source information fusion (DCCM-MSIF). Firstly, the heterogeneous graph transformation (HGT) method is utilized to capture potential relationships in multi-source biological data; subsequently, the multi-view features are integrated to learn sequence and graph structure information separately in a dual-channel manner, and residual linkage and multi-module comparative learning are utilized to enhance the model performance. Finally, potential MDAs are predicted by a multilayer perceptron (MLP). The experimental results show that the AUC of DCCM-MSIF reaches 96.89% on HMDD v3.2 and 95.01% on HMDD v2.0, which is better than most of the methods. The importance of the modules and the generalization performance of DCCM-MSIF are further validated by ablation experiments and three cancer case studies. This work aims to provide new ideas and references for further exploring potential MDA mechanisms and promoting clinical diagnosis.
Introduction
MicroRNAs (miRNAs) are a class of endogenous non-coding small RNA molecules about 21–25 nucleotides in length. Through complementary binding to target messenger RNAs (mRNAs), they control gene expression post-transcriptionally, thereby significantly influencing biological functions including cell proliferation, differentiation, apoptosis, and metabolic homeostasis (Calin & Croce, 2006; Bartel, 2009; Jonas & Izaurralde, 2015). Recently, a growing body of research has demonstrated that miRNAs play key roles in the onset and progression of various diseases (e.g., cancer (He et al., 2016; Hill & Tran, 2021)), neurodegenerative diseases (Hur et al., 2022; Petry et al., 2022), cardiovascular diseases (Kukreja, Yin & Salloum, 2011), and autoimmune diseases (Saeki et al., 2013; van den Hoogen et al., 2018; Ciechomska et al., 2023). Systematically exploring the possible relationship between miRNAs and diseases helps elucidate the molecular basis of disease occurrence and provides new ideas for clinical diagnosis and personalized treatment.
In terms of experimental detection, high-throughput sequencing, real-time quantitative polymerase chain reaction, molecular hybridization, and immunoprecipitation can precisely capture how miRNAs are expressed and interact with target genes (Tian, Wang & Zhou, 2015; Jet et al., 2021). Meanwhile, advances in synthetic mRNA therapeutics together with their lipid-nanoparticle carriers broaden the clinical landscape of RNA treatment and inspire fresh strategies for miRNA delivery (Zwolsman et al., 2025). The stability and programmability of such delivery systems offer new experimental routes for miRNA-targeted therapies and disease interventions, providing direct insights for miRNA–disease association (MDA) modelling. Within epitranscriptomics, the CRISPR/dead Cas13 system now enables site-precise editing of -methyladenosine, 1-methyladenosine and allied marks, sharpening our view of RNA regulation (Yu et al., 2024); programmable RNA editors such as the Cas13 family already support scar-free RNA modification and knockdown, opening routes for antiviral and tumor immunotherapies (Zhu et al., 2024). These studies reveal the mechanistic complexity of RNA functional regulation and highlight the potential roles of miRNAs in disease network modulation. On the computational front, deep-learning frameworks for RNA structure prediction and design markedly improve modelling accuracy and scalability, providing a foundation for large-scale MDA analysis (Pan et al., 2025).
With the continuous advancement of bioinformatics and big data analytics, computational models based on machine learning and deep learning are emerging, providing a feasible solution for screening MDAs quickly and cost-effectively (Huang, Zhang & Chen, 2022a, 2022b, 2022c). By integrating multiple sets of data or constructing complex networks, researchers can more comprehensively predict and validate potential MDAs, greatly reducing reliance on high-involvement experiments.
Early studies rely on relatively limited datasets, and MDA prediction methods based on traditional machine learning work relatively well under those conditions. For example, Chen, Zhu & Yin (2019) proposed the EDTMDA model, which used principal component analysis (PCA) to reduce feature dimensionality and integrate multiple decision trees to predict MDAs. Wang et al. (2019) employed natural language processing techniques to transform sequences of miRNAs into numeric vectors to enhance feature representation and then used a random forest classifier and logistic tree regression to forecast MDAs, respectively. Li et al. (2020b) designed the Seq-SymRF computational method, which employed a random forest algorithm for analysis and integrates features from sequences and clinical symptoms, followed by Euclidean distance-based cluster analysis to generate credible negative samples to predict MDAs. NCMCMDA, which integrated matrix complementation techniques and neighborhood constraints, employed an iterative shrinkage threshold algorithm to forecast the relationships between miRNAs and diseases (Chen, Sun & Zhao, 2021). Zhao, Chen & Yin (2019) introduced an innovative computational framework named ABMDA, which employed the Adaptive Boosting algorithm to enhance predictive accuracy and performance by consolidating several weaker classifiers (decision trees) into a robust ensemble. It also optimized the balance of positive and negative samples using k-means clustering. However, with the popularization of high-throughput sequencing technology and the continuous improvement of bioinformatic databases, the available data are growing exponentially. Traditional machine learning algorithms are often limited in feature extraction and processing for large and complex datasets and require longer computation times to identify potential associations efficiently.
In contrast, deep learning methods can better utilize large-scale data for model training through end-to-end automatic feature learning capabilities, which effectively improve prediction accuracy and offer greater scalability and adaptability (Torkey et al., 2021; Batool et al., 2024; Tang et al., 2024). As a result, more and more studies are turning to deep learning-based strategies to address the challenges of MDA prediction under big data conditions (Qu et al., 2024; Sun et al., 2024). Among these methods, graph attention network (GAT) has attracted much attention in recent years due to their excellent graph representation learning capabilities, especially when dealing with complex bioinformatic networks, which show unique advantages. For example, Li et al. (2022) proposed a computational method that integrates GATs with random forests, initially harnessing the linear features of diseases alongside miRNAs to establish a network for miRNA-disease analysis by incorporating long non-coding RNA (lncRNA) association data, and subsequently learning the nonlinear features of various nodes using GAT. Finally, the linear and nonlinear features were integrated, and a random forest model was used for training and classification to effectively predict the potential MDAs. However, most of the existing studies focus only on the direct associations between miRNAs and disease nodes, ignoring information about other nodes in the network that may play key roles. To improve the model’s capacity for representing complex biological networks further, the researchers propose that nodes such as drugs, genes, or proteins can be introduced into the heterogeneous graph to build a richer network structure to more comprehensively capture the underlying biological mechanisms behind the associations of miRNAs with diseases. For example, Yang et al. (2022) developed TLNPMD, a system relying on a three-layer heterogeneous network, constructed by integrating miRNA, drug and disease data, and combined with pathway computational methods to predict MDAs. MHCLMDA constructed hypergraphs of multiple miRNAs, diseases, and associated genes by adding information about genes as nodes, and extracted key features of miRNAs and diseases by combining multiple similarity views and using variational autoencoders (Peng et al., 2024). However, the methods described above enhance model performance by introducing limited node information related to MDAs, such supplemental information is usually insufficient. In addition, incorporating more node information into the model may significantly increase computational complexity. To solve these problems, Hu et al. (2020) proposed an approach called heterogeneous graph transformation (HGT), which replaced meta-paths with meta-relationships and automatically learned relationships between different types of nodes and edges from heterogeneous graphs without explicitly designing meta-paths. In existing studies, there have been attempts to construct heterogeneous maps using the HGT approach to forecast MDAs. However, although the approach is able to build a heterogeneous network structure and extract heterogeneous features, it fails to fully mine and integrate the rich information in the MDA matrix in the subsequent feature extraction stage. Such processing deficiencies directly lead to longer model runs in the prediction process, unstable results, and even zero evaluation indicators in some cases. This reduces prediction efficiency and substantially increases operational cost relative to traditional graph neural network models. To address these issues, we begin investigating more efficient feature fusion methods.
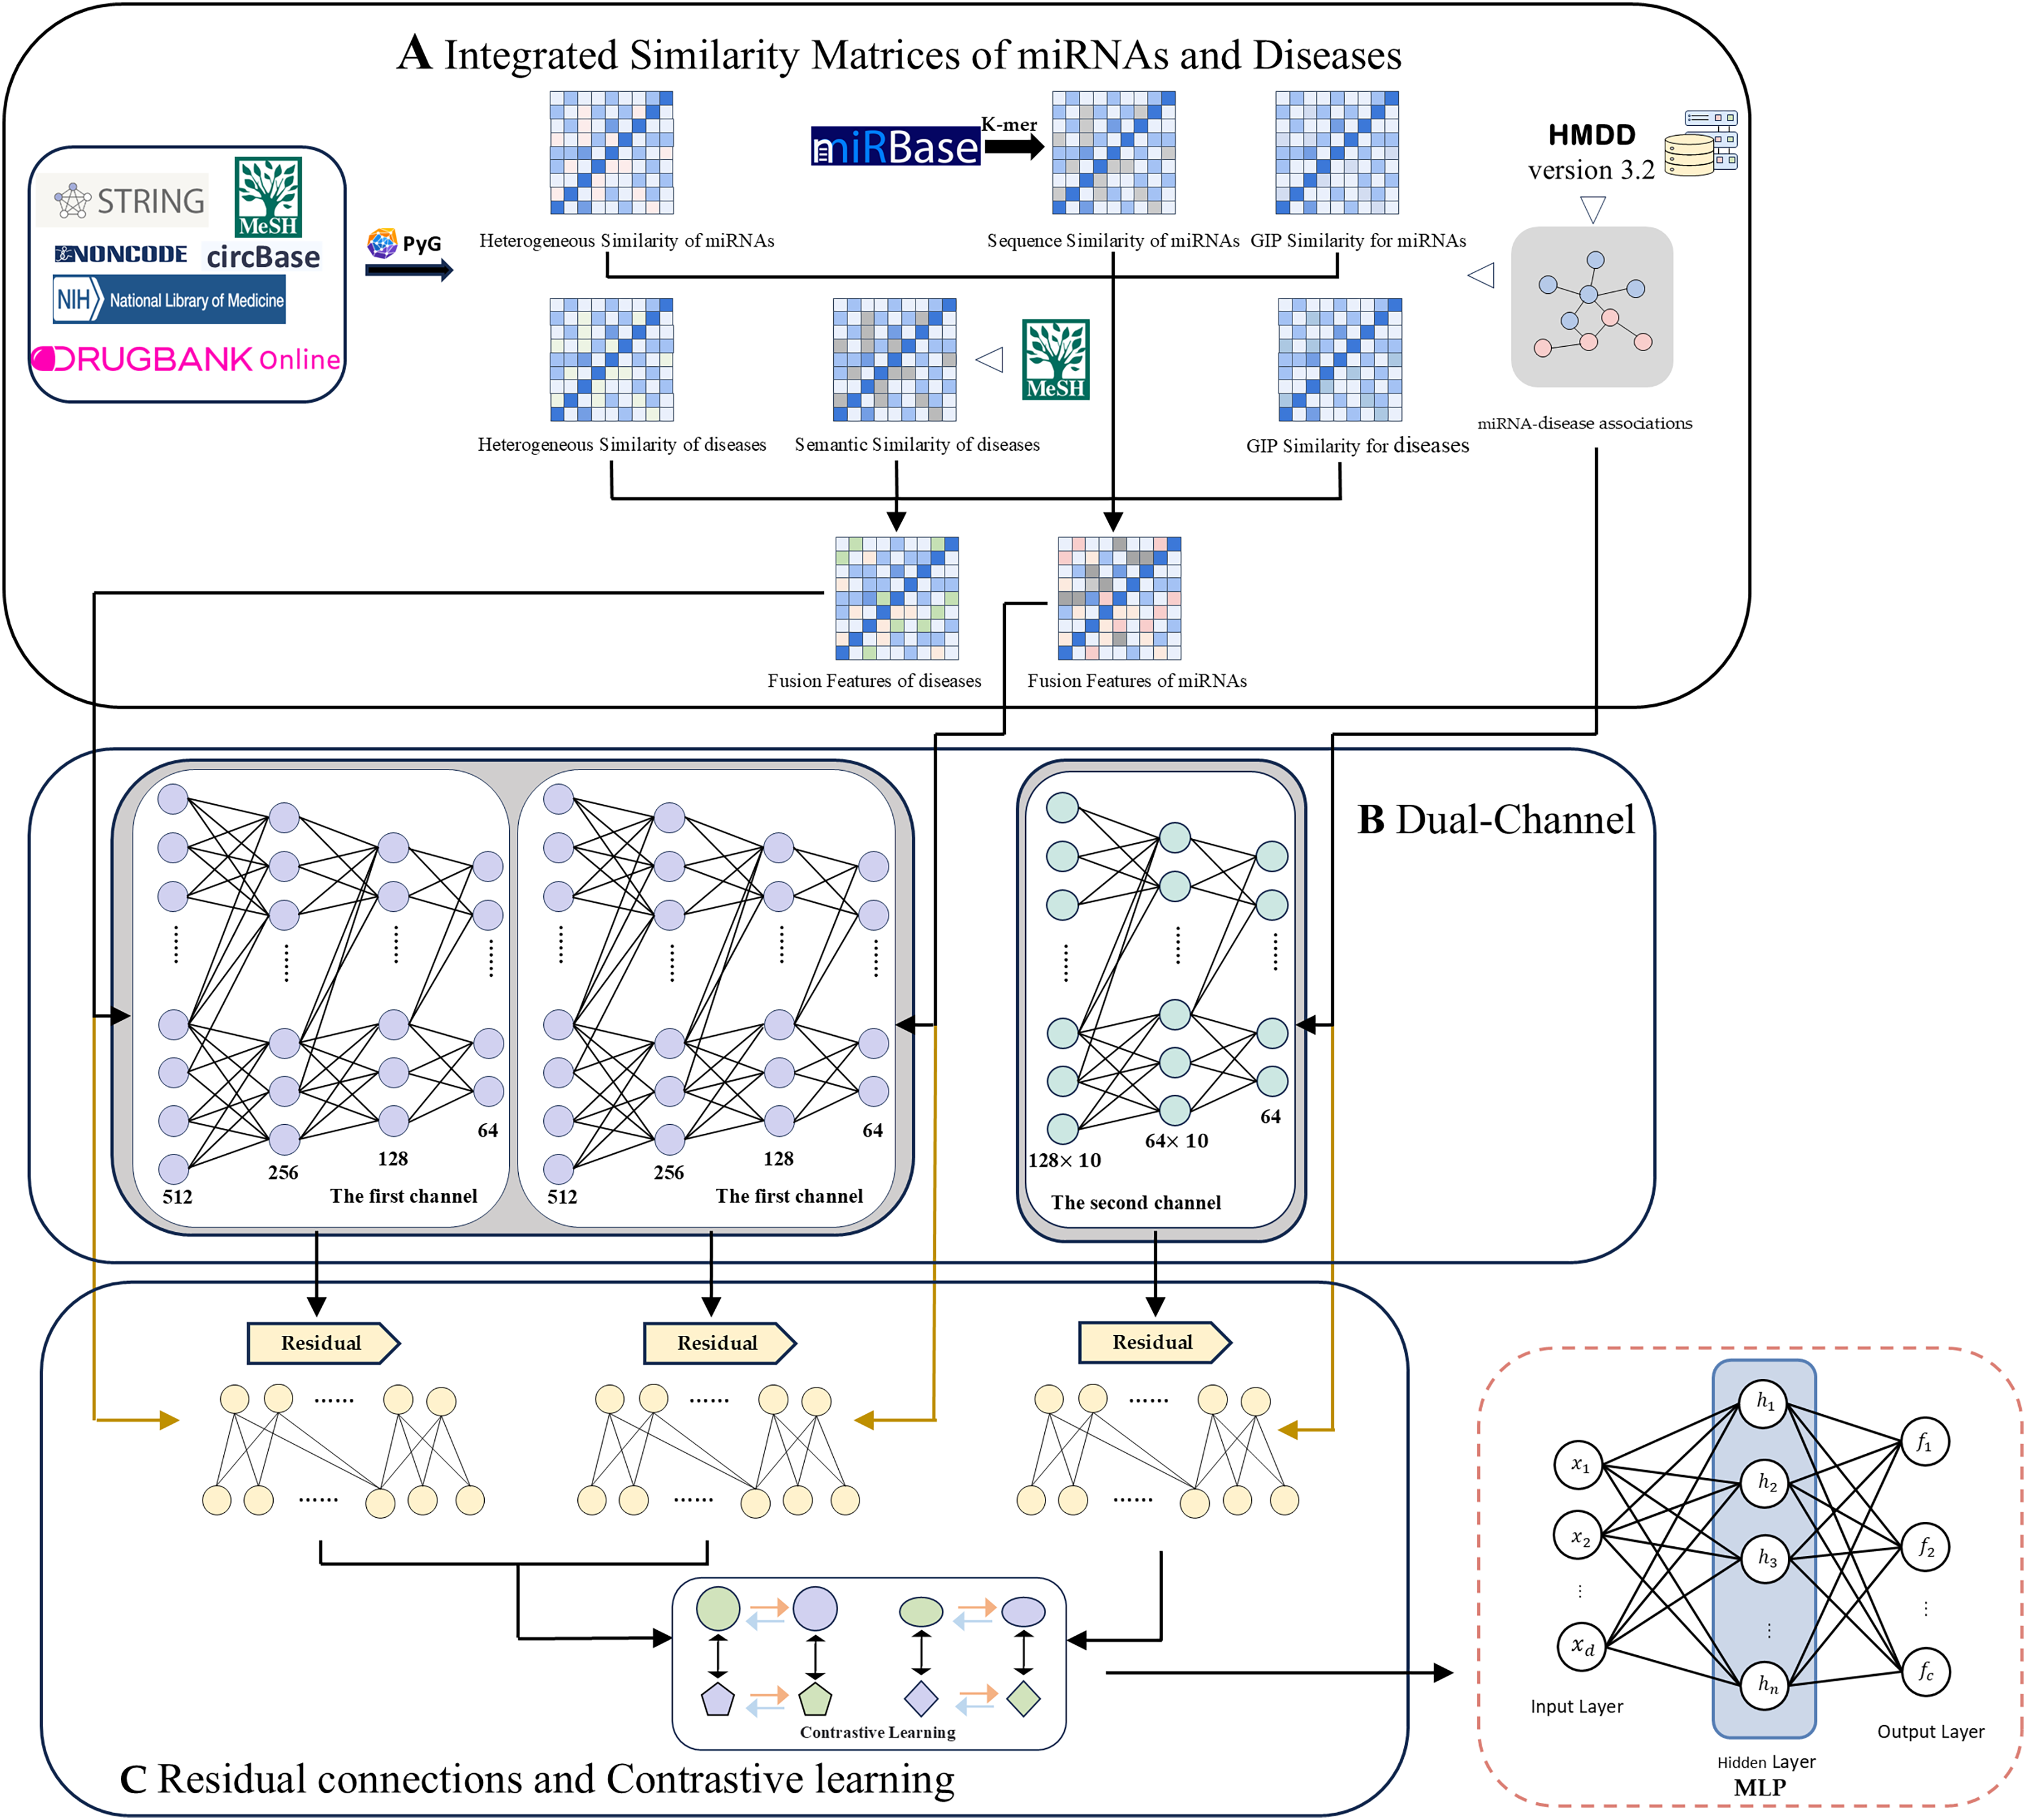
Here we propose a computational method for MDA prediction based on a dual-channel contrast model with multi-source information fusion (DCCM-MSIF). Three main components constitute the framework of the DCCM-MSIF model, as shown in Fig. 1: (1) Firstly, the HGT method in PyG is used to extract the heterogeneous graph features of miRNAs and diseases from existing multi-source data, which are then optimized and combined with similarity features from other miRNAs and diseases. (2) In the feature extraction stage, DCCM-MSIF adopts a dual-channel parallel approach for feature extraction separately. Prior to entering the first channel, we integrate three types of similarity matrices: miRNA sequence similarity, disease semantic similarity, and heterogeneous graph similarity. Specifically, we use Gaussian interaction profile (GIP) kernel similarity as an interpolation supplement for sequence/semantic features-whenever a miRNA sequence or disease semantic similarity value is zero, we replace it with the corresponding GIP kernel value; otherwise, we retain the original sequence or semantic similarity. The resulting interpolated miRNA and disease similarity feature vectors are then concatenated with heterogeneous graph similarity features to form the final fused input features. The first channel employs the long short-term memory (LSTM) network for feature learning, which is because LSTM is good at dealing with the fusion of different types of data, especially when multiple biological information (e.g., multi-view expression forms and similarity indexes of miRNAs) are spliced into continuous input vectors, LSTM can capture the potential long-distance dependencies in the sequences, and thus efficiently extracts the different biomarker. The second channel utilizes the GAT for graph structure feature learning, which can adaptively assign different weights to the nodes in the MDA matrix through the mechanism of multi-head attention to significantly enhance the model’s ability to capture the potential MDAs. (3) To alleviate the problem of information degradation that may be caused by deep network stacking, DCCM-MSIF introduces residual connectivity in both of the above channels to more effectively preserve the information flow between the input layer and the deep layer, and to improve the overall expressive ability and prediction accuracy of the model. In addition, to effectively utilize the results from the dual-channel, DCCM-MSIF introduces multi-module comparison learning. This strategy treats the representation of the same sample in different modules as positive samples and different samples as negative samples, which enhances the differentiation and robustness of the features by pulling the cross-module representation of the same entity closer and pulling the representation of different entities farther. Subsequently, the model fuses the output features of the dual channel and inputs them into a multilayer perceptron (MLP) to generate predicted MDA scores. Compared to previous work, the main innovations of this work are summarized as follows.
-
(1)
We design a dual-channel architecture that integrates LSTM and GAT to simultaneously capture the sequential dependencies and latent topological relationships of multi-source features, which maintains high predictive accuracy while significantly improving computational efficiency.
-
(2)
A cross-module contrast loss function is designed to enhance the expressiveness of the model and reduce the information degradation that may occur in the deep network through residual linkage with multi-module constraints.
-
(3)
We employ an MLP to adaptively fuse the outputs of the two channels, and validate the superior performance and biological reliability of the model across multiple datasets and cancer case studies.
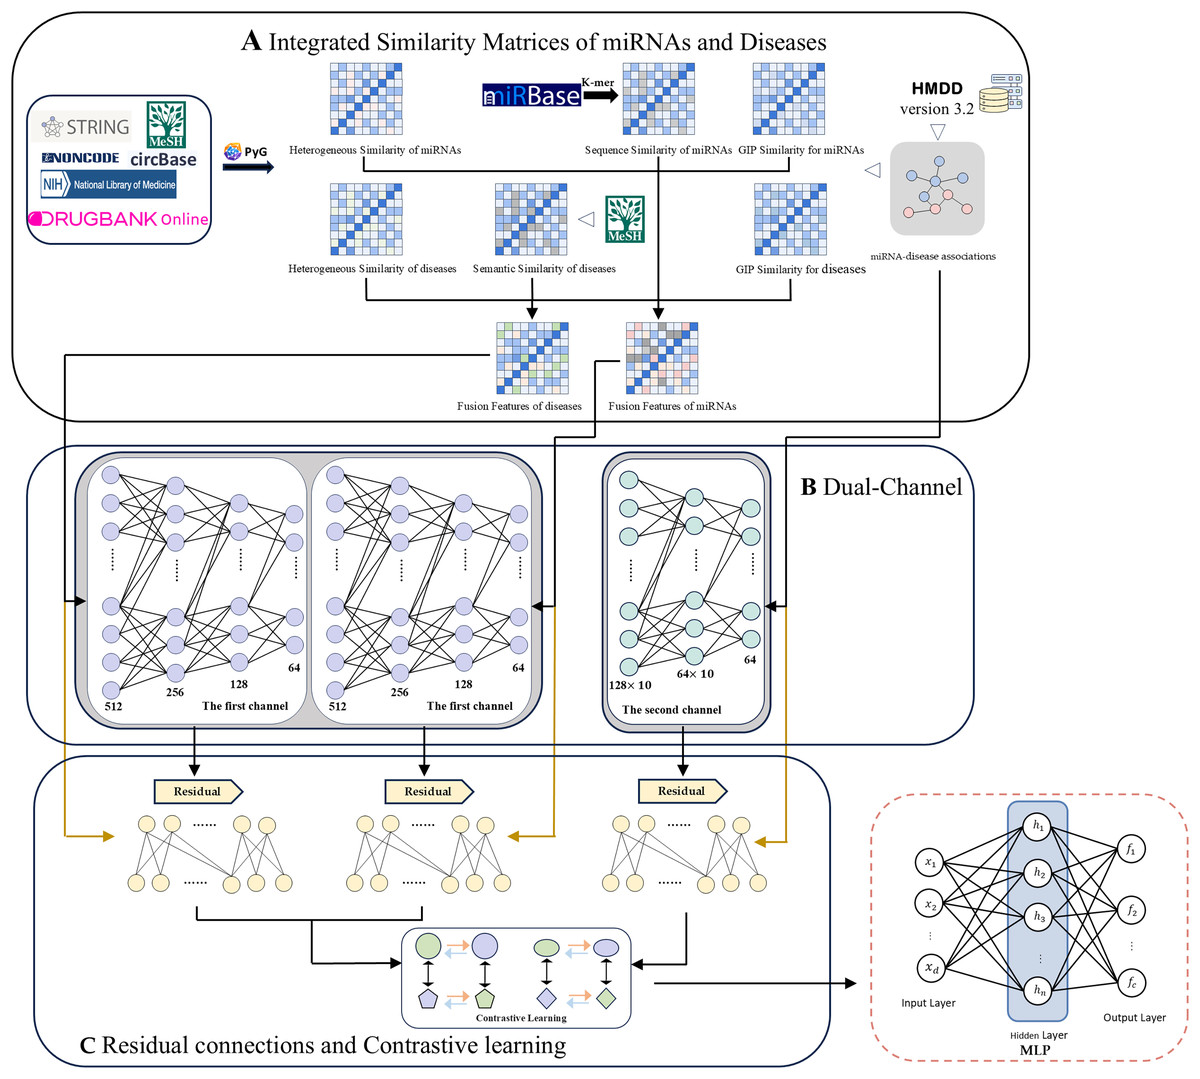
Figure 1: The overall framework of DCCM-MSIF.
Materials and Methods
Datasets and procedure
In this work, we use two releases of the Human MicroRNA Disease Database (HMDD). HMDD v3.2 contains 35,547 experimentally validated MDAs (Huang et al., 2018). Through screening, the dataset covers 901 miRNAs and 877 diseases, yielding an association matrix A R901 × 877. In addition, we incorporate HMDD v2.0, which offers 10,368 validated associations and, after filtering, encompasses 495 miRNAs and 383 diseases (Li et al., 2014). Furthermore, this work utilizes richer multi-source information data containing, 3,024 mRNA nodes are obtained from the NCBI database (Sherry et al., 2001), 1,319 drug nodes from the DrugBank database (Wishart et al., 2017), 2,633 lncRNA nodes through the NONCODEV5 database (Fang et al., 2017), 421 circular RNA (circRNA) nodes from the CircBase database (Glazar, Papavasileiou & Rajewsky, 2014), 100 microbial nodes from the NIH Medical Subject Headings (MeSH) database (Lipscomb, 2000), and a total of 3,348 protein nodes are gathered using the STRING database (Szklarczyk et al., 2018). The detailed association types in the heterogeneous graph are provided in Article S1. The data and code that support the findings of this work are available on GitHub at https://github.com/Lian259/DCCM_MSIF (DOI: 10.5281/zenodo.15171646).
Semantic similarity of disease
We extract disease descriptors from the MeSH database and construct disease semantic similarity matrix with the aid of directed acyclic graphs (DAGs). The degree of semantic similarity between the two diseases is calculated based on the nodes shared in the structure of their DAGs. The more shared parts in the structure of DAGs indicate the higher semantic similarity between the two diseases, from which the semantic contribution of the disease s to node v can be computed as follows:
(1) The semantic value of the disease is obtained by summing the semantic contribution values of the set of all ancestor nodes of disease (including itself). The semantic similarity between the disease and the disease can then be computed using the following equation:
(2)
Sequence similarity of miRNA
From the miRBase database (https://mirbase.org/), we download the matched miRNAs sequence data, sequence information of miRNAs is converted into multidimensional feature vectors using sequence comparison (Das et al., 2018; Su, You & Yi, 2020), and compute the initial miRNAs sequence similarity score matrix using cosine similarity. To eliminate global inconsistency, we normalize the similarity scores using the following formula to obtain the final miRNA sequence similarity matrix:
(3) where and denote the maximum and minimum values in the initial score matrix.
Heterogeneous graph similarity of miRNA/disease
Based on multi-source data, the miRNA/disease heterogeneity graph feature matrix (HM/HD) is generated, in which each row vector represents multi-source information corresponding to each miRNA or disease (Zou et al., 2024). The heterogeneous graph similarity matrices for miRNAs/diseases (MSH/DSH) are constructed by computing the cosine similarity between each pair of row vectors within the matrix, calculated as follows:
(4) where / denotes the ith row vector of the matrix HM/HD, and / denotes the modulus of the row vector.
GIP kernel similarity for miRNA/disease
GIP is an evaluation method for measuring MDAs. Taking miRNAs as an example, based on the approach of van Laarhoven, Nabuurs & Marchiori (2011), the interaction state between miRNAs indexed as and is described by defining two binary vectors and . The formula for calculating the GIP kernel similarity of miRNAs is as follows:
(5) where represents the count of miRNAs within the MDA network.
The GIP kernel similarity between the disease and is denoted as and can be obtained in the same way:
(6)
Dual-channel contrastive model
In this subsection, we provide a comprehensive overview of the detailed computational procedure for each channel.
The first channel
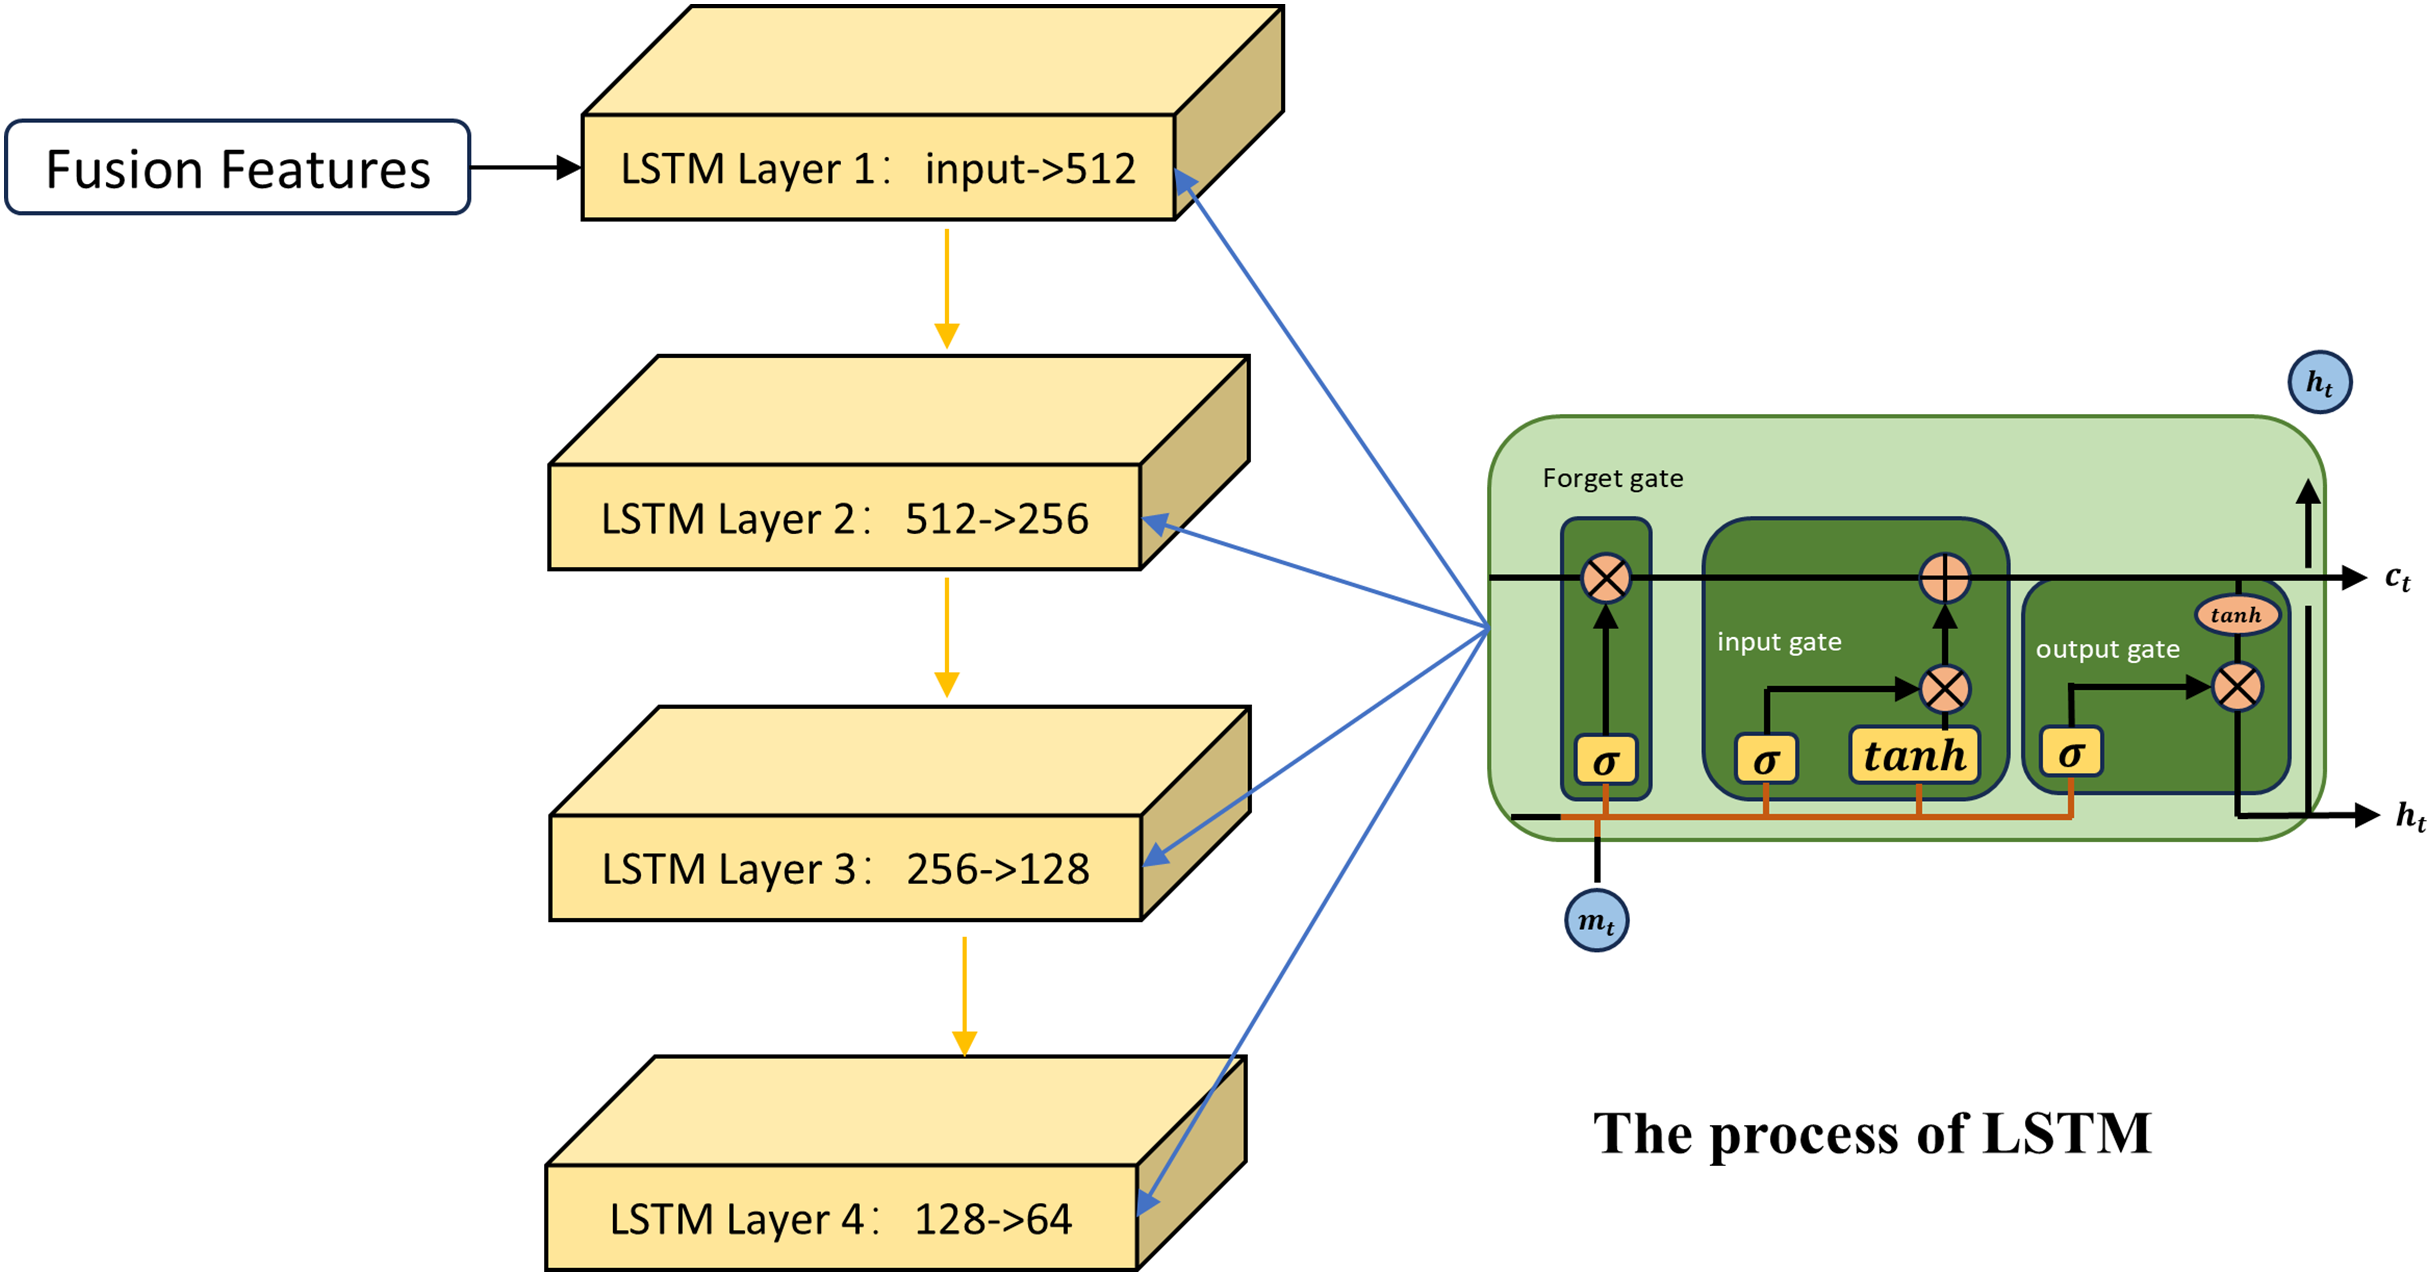
The first channel employs the LSTM network for feature learning. LSTM (Sak, Senior & Beaufays, 2014) is an improved neural network model that is particularly suitable for dealing with the fusion of different types of data, especially when these data are spliced into a continuous input vector. As shown in Fig. 2, first the LSTM uses the input gate and the candidate cell state to determine how new information at the current time step is integrated into the memory cell. Taking the fused miRNA feature vector as an example, to decide which part of the miRNA information stored in the memory cell at the previous time step should be retained, the LSTM applies a forget gate based on the previous hidden state:
(7) is the output vector of the forget gate, is the input vector at the current time step, and is the hidden state from the previous time step. The output of the forget gate indicates the retention level of the information associated with each miRNA in the previous memory cell state .
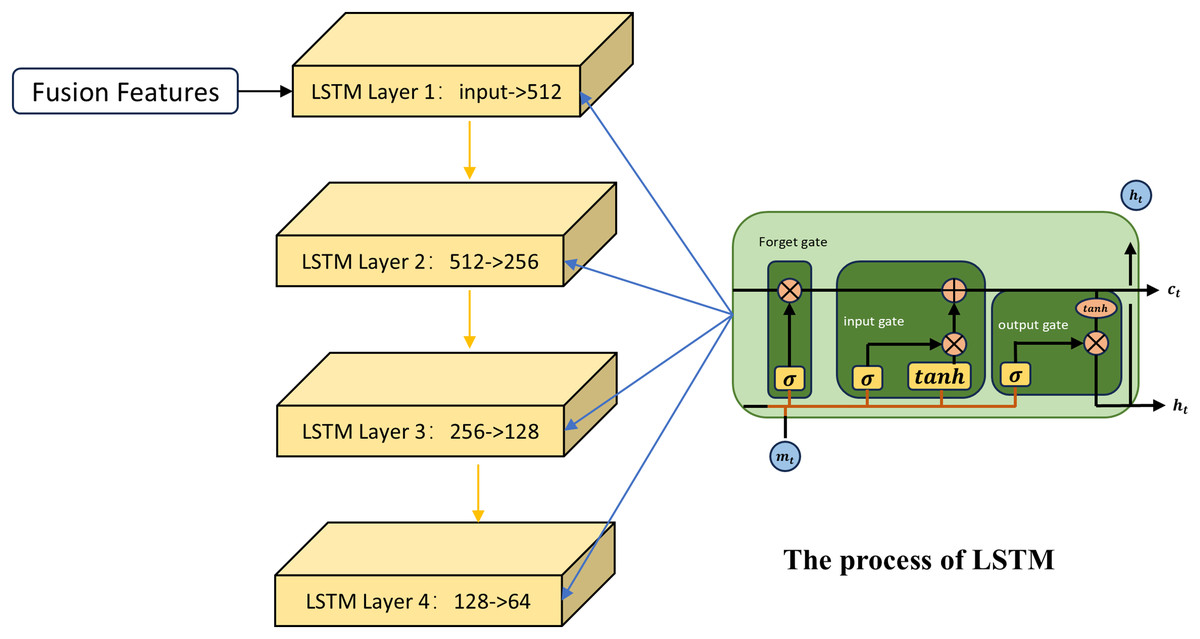
Figure 2: The process of the first channel.
The role of the input gate is to assign weights to the miRNAs at the current time step, indicating their importance for updating the memory unit. The formula is as follows:
(8) denotes the output vector of the input gate; denotes the sigmoid activation function. The candidate cell state generates new potential information that is used to update the current memory cell state:
(9) indicates the candidate cell state. By combining the input gate, the candidate state, and the forget gate, the memory cell state at the current time step is updated as follows:
(10) The first term denotes the retained portion of the previous memory cell state selected by the forget gate; the second term represents the new information added from the candidate cell state, regulated by the input gate. Here, denotes the Hadamard product. In this process, global information from miRNA sequences is stored over time through the memory unit, while current input features are dynamically incorporated. Meanwhile, the LSTM regulates the flow of information from the memory cell to the hidden state through the output gate, which is used to generate the input or final output for the next time step or subsequent layer:
(11) The output gate determines which parts of the memory cell state are passed to the hidden state :
(12) Through this process, the LSTM captures long-term patterns from fused similarity features, thereby extracting sequence-level representations tailored for MDA prediction.
The second channel
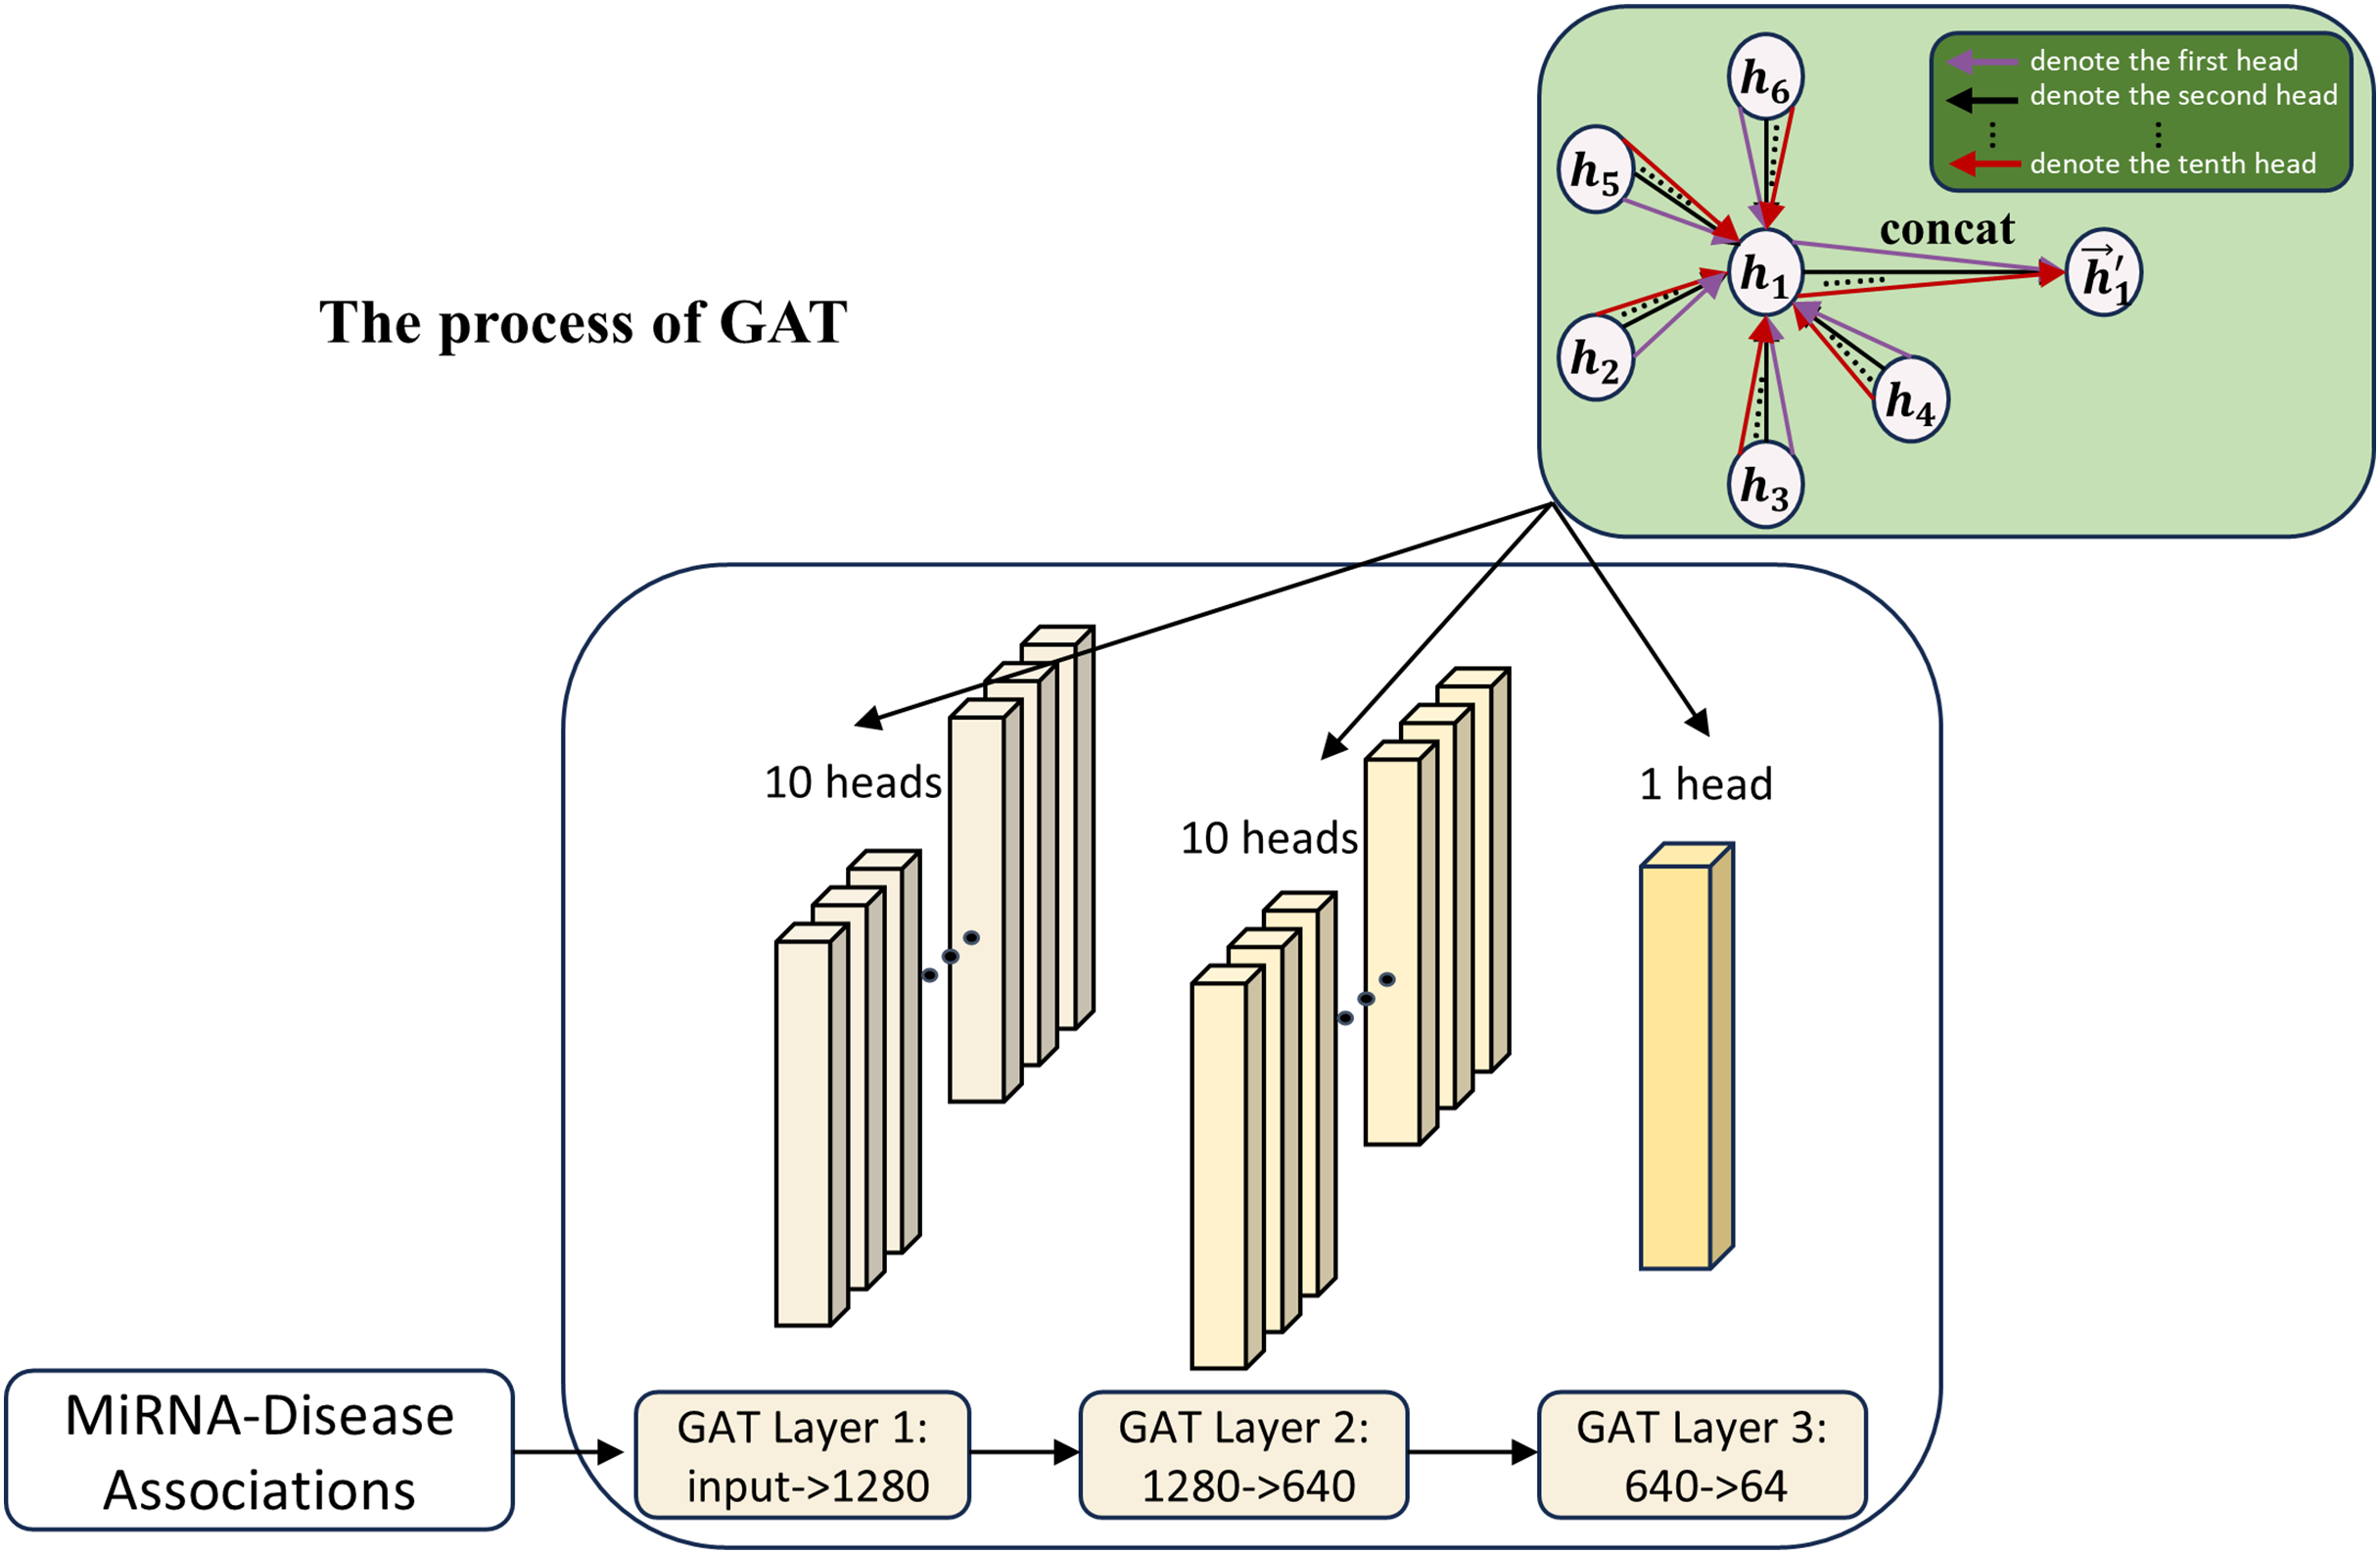
In this work, to further explore the MDA feature expression capability, GAT (Veličković et al., 2018) is used as the association array feature extraction module in the second channel, as shown in Fig. 3. The introduction of the second channel is aimed at learning the features of the association matrix and comparing the learning with the first channel. Meanwhile, the features of the second channel can also be used as a supplement to the first channel part, helping to improve the model’s accuracy by adaptively mining feature interactions between different nodes in the association matrix via the attention mechanism.
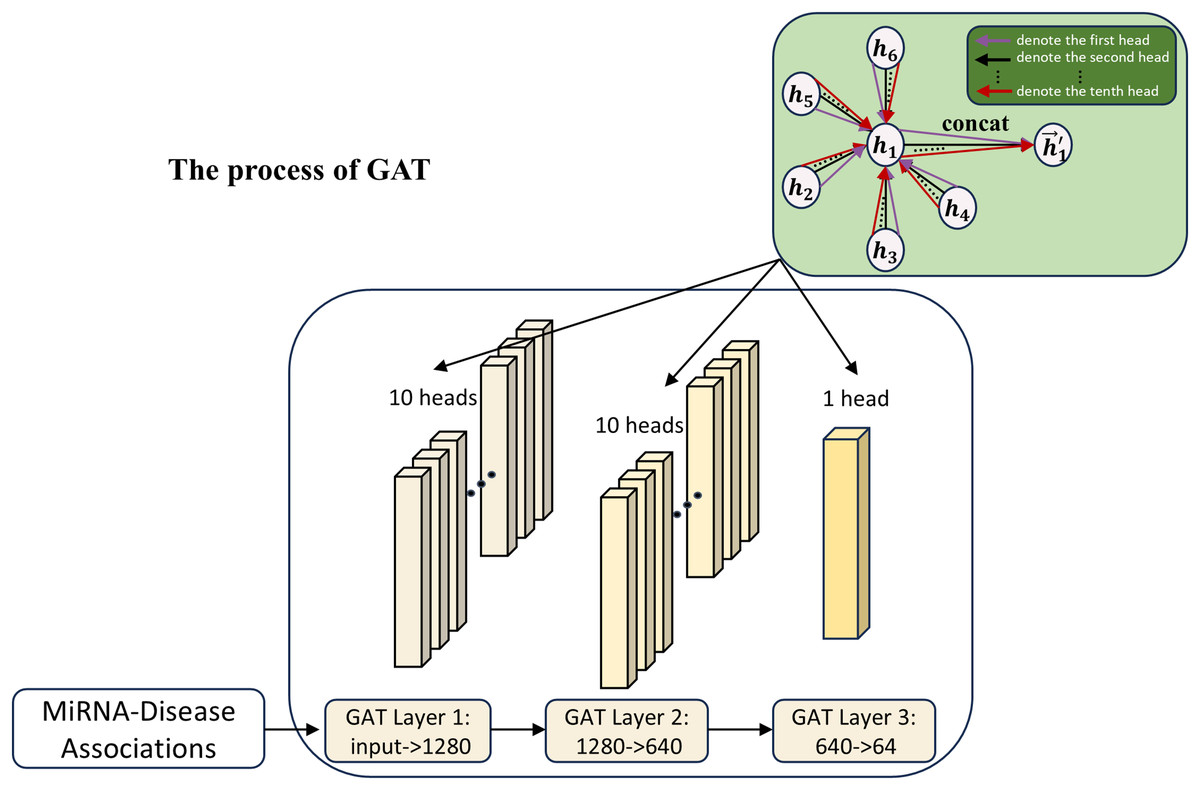
Figure 3: The process of the second channel.
The attention mechanism of GAT can be expressed as the following equation:
(13) where and are the feature representations of the ith and jth nodes in the MDA matrix; W is a learnable weight matrix; is a learnable parameter for the attentional weight and is the attentional score of node j to node i.
Attention scores are normalized by the softmax function:
(14) where denotes the importance of the neighbor node j to the target node i in the feature aggregation process.
Ultimately, the feature aggregation of node i is represented as:
(15) Through the attention mechanism, GAT can adaptively assign weights to different neighbors, thus making full use of the association relationships between miRNAs and disease nodes. Due to the complexity of node relationships in the graph structure, traditional single-head attention is difficult to capture comprehensively. GAT learns multi-head attention weights by introducing multi-head attention to capture the diversity of relationships among nodes more efficiently, alleviate the information bottleneck, and enhance the model generalization ability.
(16) where K is the number of attention heads and denotes the concatenation of output features from each head. In this work, we use 10 attention heads to extract association features of miRNAs and diseases.
Residual connections and contrastive learning
In this subsection, we provide details of the residual connections and contrastive learning process in the DCCM-MSIF model.
A common problem in deep networks is that, as the depth increases, the information across different layers may gradually become similar, thereby affecting model performance. To address the issue of information degradation caused by deep network stacking, the design introduces a residual connection mechanism, which enables the model to retain more input feature representations during updates, thereby enhancing the expressive capacity of the deep network and simultaneously mitigating degradation across layers, as shown below:
(17) Here, uses the ELU activation function, represents the initial feature representation of miRNAs, while , correspond to the initial representations of diseases and MDAs, respectively. and denote a learnable weight matrix and bias vector, respectively, where . Residual connections from the different modules are then fused with the final-layer features as follows:
(18) Here, and represent the output feature vectors of the miRNA and disease similarity modules from the final LSTM layer, respectively, while denotes the output of the association module from the final GAT layer. In addition, represents the fusion weight. In MDA prediction, the initial similarity features carry prior association information. Through residual connections, these original similarity representations are directly retained and jointly participate in the subsequent prediction with modular learning features. To efficiently integrate miRNA and disease features from different modules, we use the following equation:
(19) Here, denotes the fused representation of miRNAs obtained from multi-module integration, and represents the corresponding fused representation of diseases. The fusion weights are indicated by . We concatenate the fused miRNA and disease embeddings and pass them through an MLP to predict the final MDA scores, denoted as .
The cross-entropy loss function is used to minimize the discrepancy between model predictions and ground truth labels:
(20) Here, and denote the sets of positive and negative samples, respectively. represents the ground truth label indicating whether miRNA is associated with disease .
During training, the DCCM-MSIF model’s parameters are updated through gradient computations. However, the absence of a constraint mechanism across modules can lead to inconsistent feature representations. To address this issue, our approach includes a multi-module comparative learning method functioning as a regulatory mechanism to restrict disparities among module representations in identical data samples, thus solving the above problem and improving the model prediction performance. In this method, positive samples are defined as the representations of the same sample in different modules, while cross-module representations of different samples are regarded as negative samples. By enlarging the representation differences of different miRNAs (diseases) among different modules, and reducing the representation differences of the same miRNAs (diseases), it is possible to fully utilize the complementary information between the modules and effectively enhance the feature representation ability.
The contrast loss function for each miRNA sample is outlined as follows:
(21) Here, represents the total count of miRNA samples; refers to the embedding of miRNA in the t-th module; and measures the distance using cosine similarity.
Similarly, the contrastive loss for disease sample is defined as:
(22) The total loss function is defined as:
(23) This contrastive loss can reduce the representation differences across modules for the same miRNAs (diseases), while increasing the representation distance between different miRNAs (diseases), thereby enhancing the robustness of MDA prediction.
Data preprocessing
We first collect 35,547 experimentally validated MDAs from HMDD v3.2, and an additional 10,368 known MDAs from HMDD v2.0. Taking HMDD v3.2 as an example, we normalize the names of miRNAs and diseases separately and assign unique numerical labels to each, with miRNA labels ranging from 1 to 901 and disease labels from 1 to 877. This labeling step transforms the original association information into standardized numeric MDAs, facilitating subsequent computational analyses. Furthermore, based on the processed miRNA and disease information, we identify eight types of biologically relevant nodes associated with these entities. Each biological node is assigned a unique intra-category identifier to facilitate differentiation among nodes of the same biological type, and a numerical inter-category label to systematically distinguish among different categories of biological nodes.
When constructing the training dataset, positive samples are defined as all known MDAs, whereas unknown MDAs are treated as negative samples. To ensure comprehensive training, we randomly select negative samples to balance their number with positive samples.
Experiments and evaluation metrics
For the experiment, equal numbers of positive and randomly chosen negative samples are matched, and the data are segmented into five uniform subsets. For each experimental run, four of the subsets are selected at random for training, with the remaining subset allocated as the validation set. The performance of the model is evaluated using cross-validation, and the average of the results from each fold is taken as the final experimental outcome to ensure robustness of the findings. To further explore the impact of hyperparameter settings on model performance, we adjust the hyperparameter settings and perform fivefold cross-validation on the HMDDv3.2 dataset. This allows us to evaluate predictive performance systematically and quantify the influence of hyperparameter variations through performance metrics, thus providing a deeper understanding of the model’s behavior under different parameter configurations. Moreover, to validate the efficacy of each module within our proposed model and demonstrate its overall superiority, we conduct six ablation experiments and compare our model against six established baseline methods. Finally, three case studies illustrate the practical efficacy of our model in predicting MDAs.
To evaluate the model performance, we use six metrics (Singamsetty et al., 2024): area under the receiver operating characteristic curve (AUC), area under the precision-recall curve (AUPRC), accuracy, precision, recall, and F1-score. AUC reflects the ability of the model in terms of ranking the predictions, and AUPRC is used to measure the trade-off between precision and recall for different classification thresholds. We use accuracy to determine the model’s overall classification effectiveness. We employ precision to gauge how accurately the model predicts positive samples. We evaluate the model’s ability to detect positive samples using recall. By merging precision and recall, the F1-score delivers a thorough appraisal of the model’s ability to classify.
The complete set of training hyperparameters is summarized in Table 1. This work uses Python version 3.8 for implementing the prediction task on GPU. The computational environment includes GPU: NVIDIA GeForce RTX 4060 (8 GB memory), CPU: 13th Gen Intel (R) Core (TM) i7-13700H at 2.40 GHz, 16 GB RAM, and a 64-bit Windows 11 operating system.
| Parameters | Range | Values |
|---|---|---|
| LSTM layers | 2–5 | 4 |
| GAT layers | 1–4 | 3 |
| MLP layers | 2 | |
| Activation function for GAT | ELU | |
| Activation function for MLP | GELU | |
| Feature embedding sizes for LSTM | 128, 256, 512, 1,024 | 512 |
| Feature embedding sizes for GAT | 32, 64, 128, 512 | 128 |
| Optimizer | Adam | |
| Learning rate | 0.0001 | |
| Weight_decay | 0.0001 | |
| Dropout | 0.2 |
Results and discussion
Performance analysis under 5-fold cross-validation
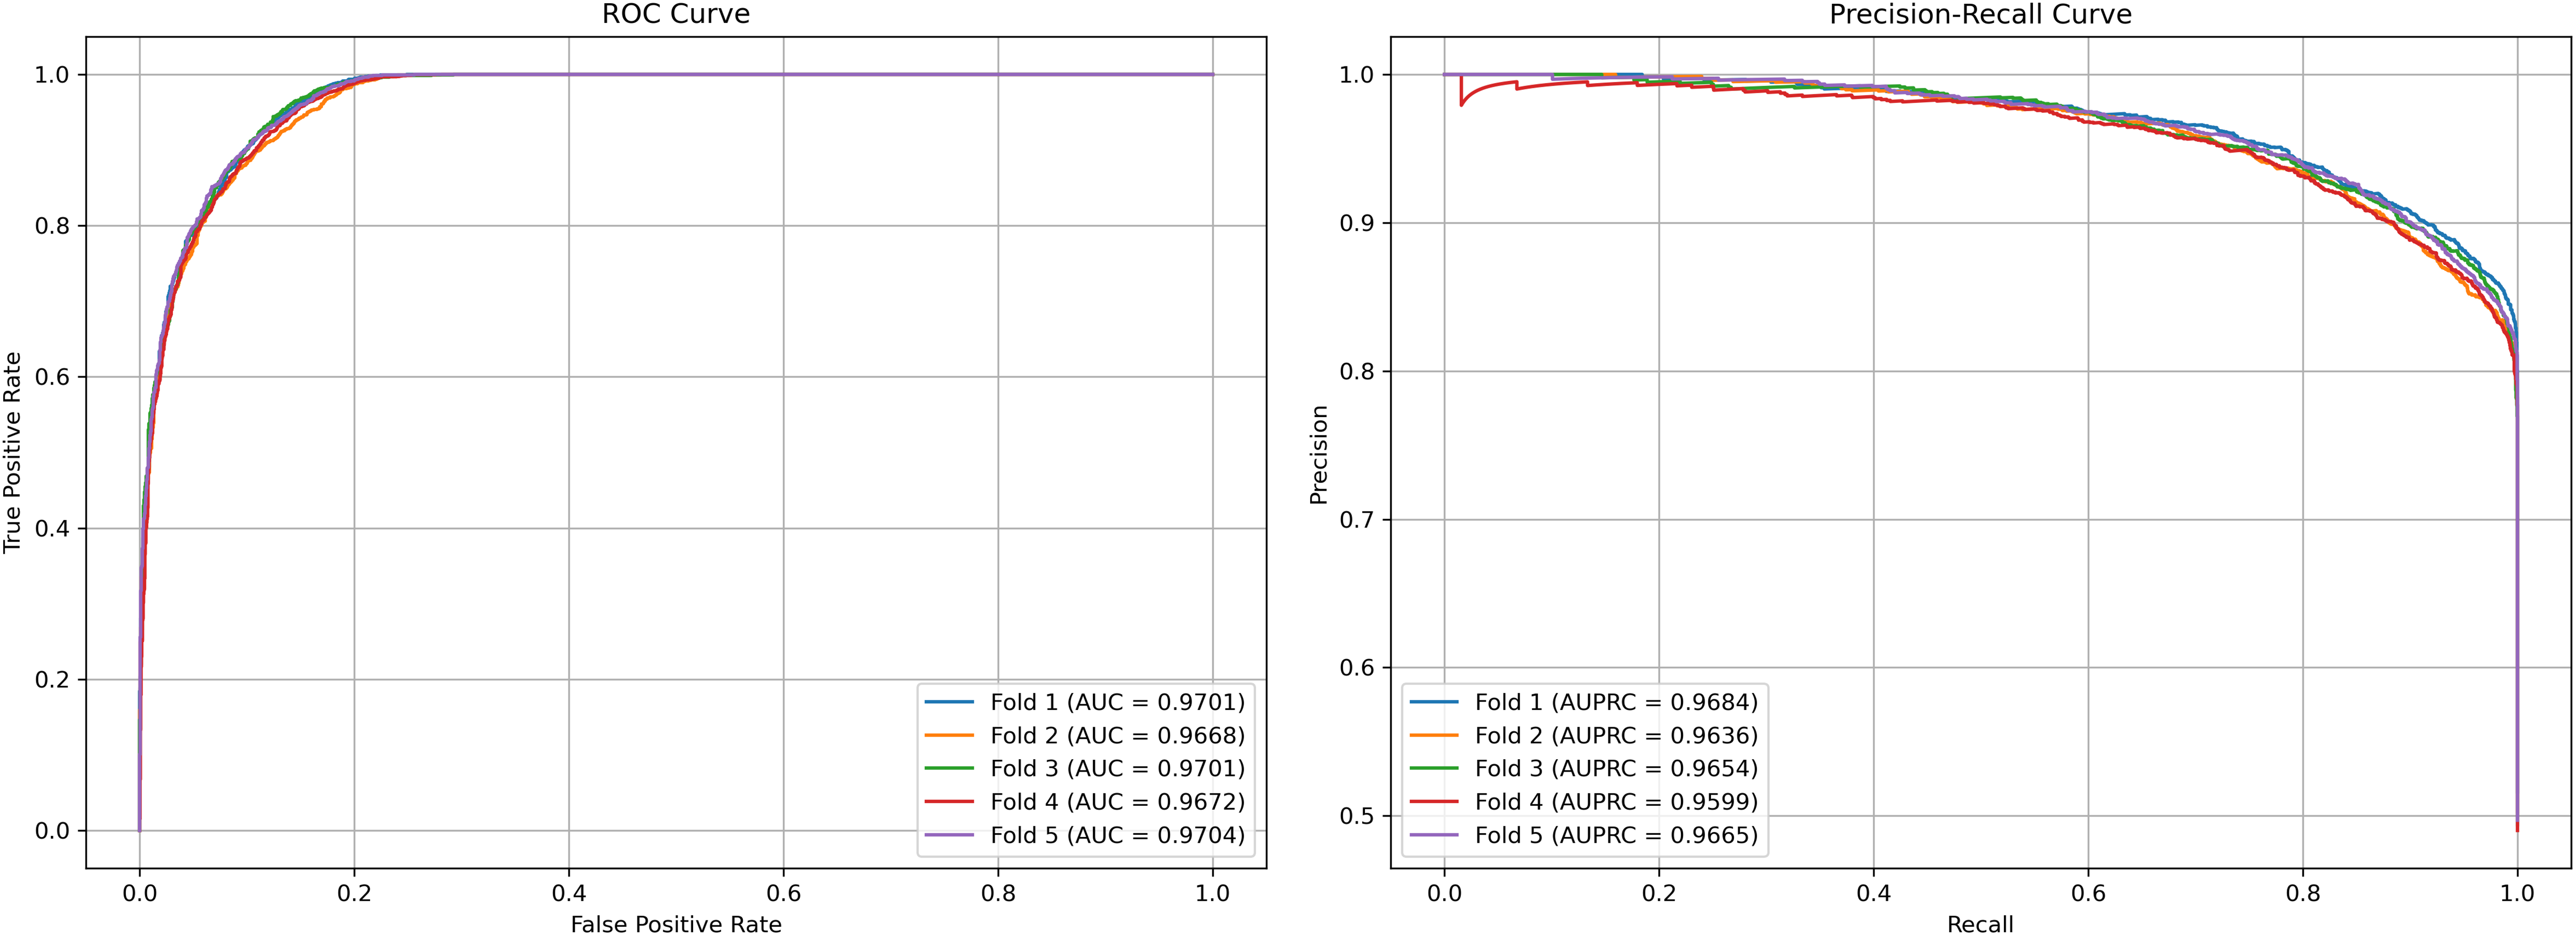
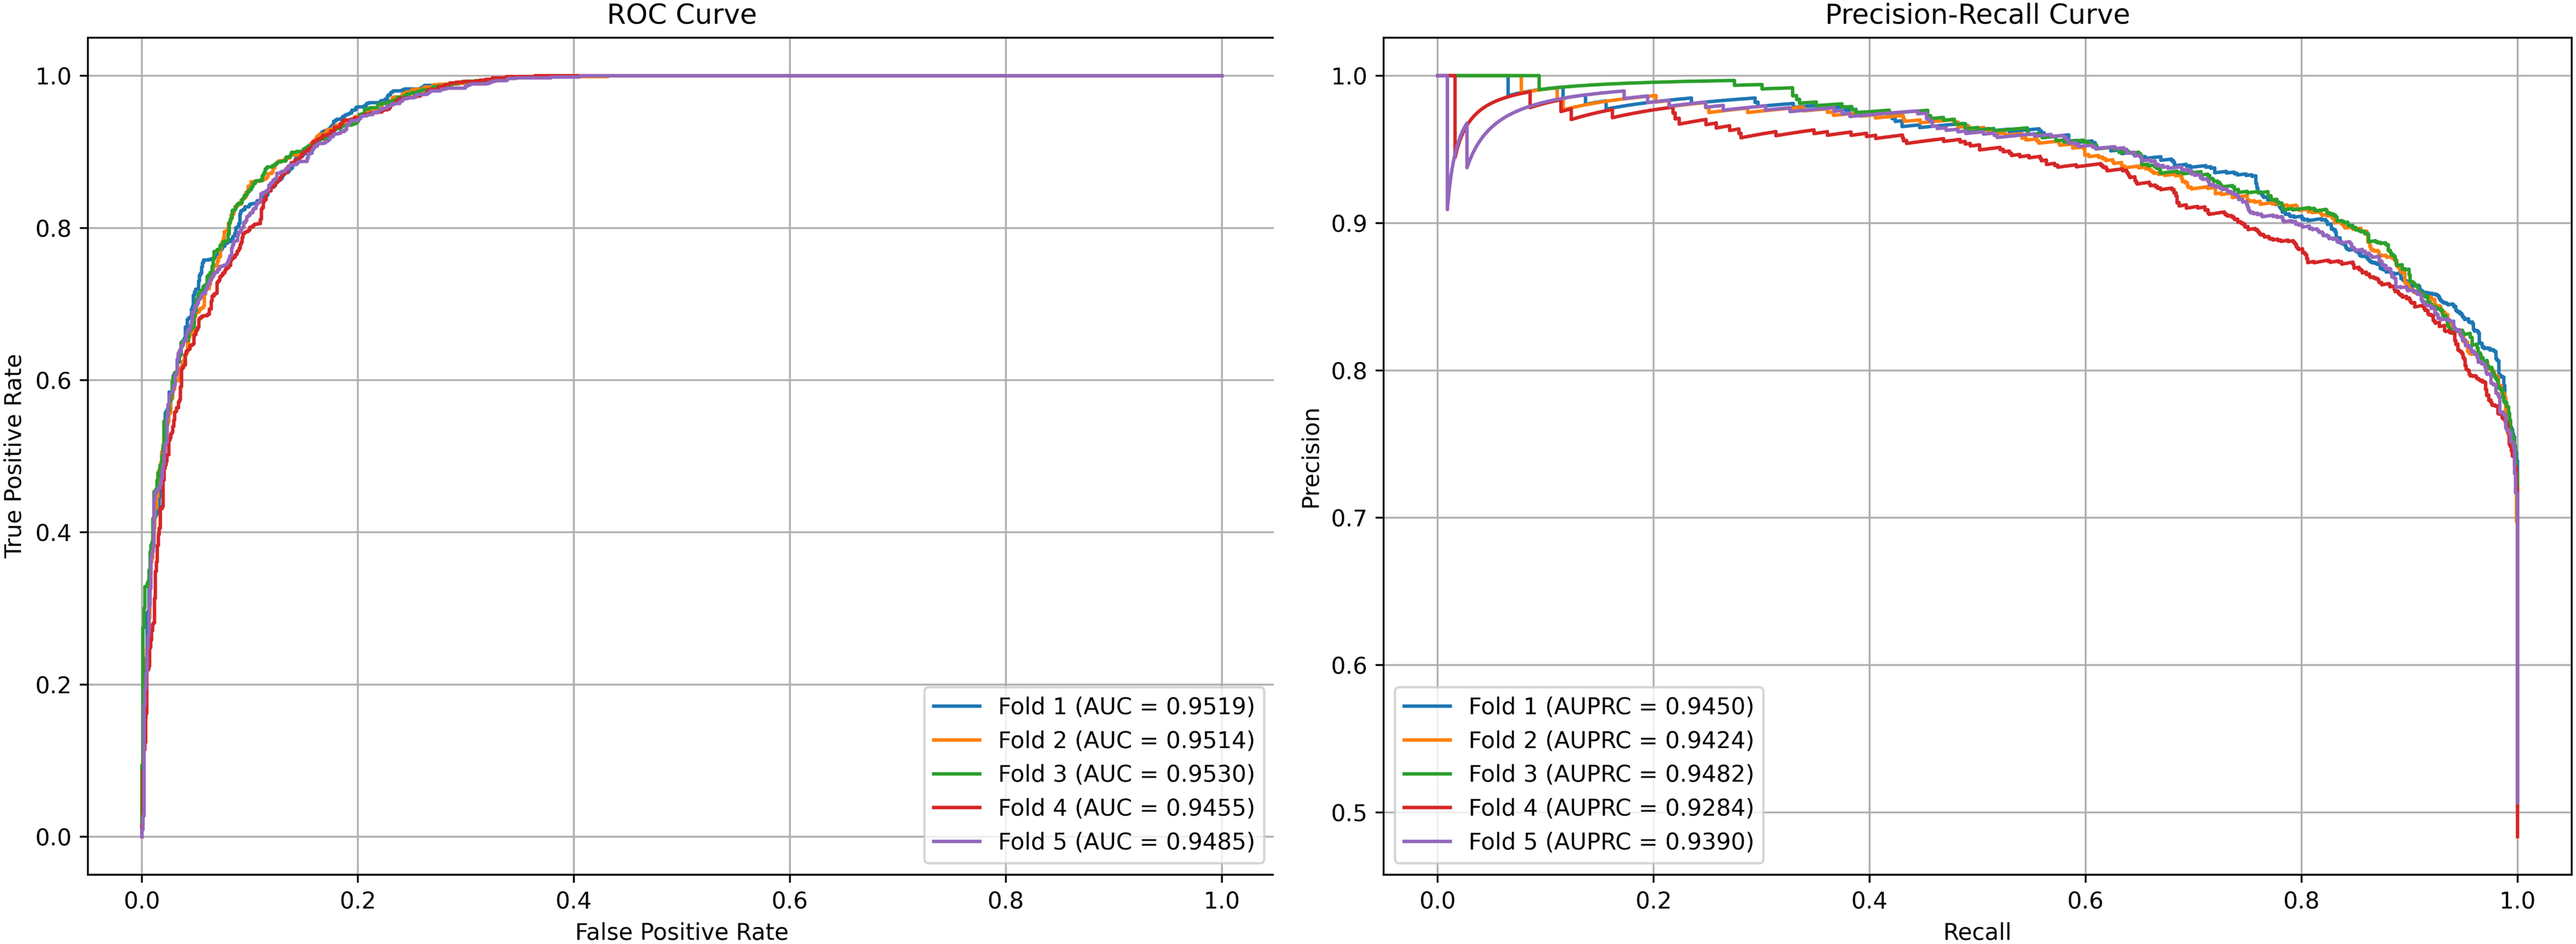
We plot the receiver operating characteristic (ROC) curve and precision-recall curves (PRC) as shown in Figs. 4 and 5. DCCM-MSIF achieves an average AUC of 96.89% in five-fold cross-validation on the HMDD v3.2 dataset and 95.01% on HMDD v2.0, indicating a high degree of accuracy for our model; detailed data are provided in Tables S1 and S2.
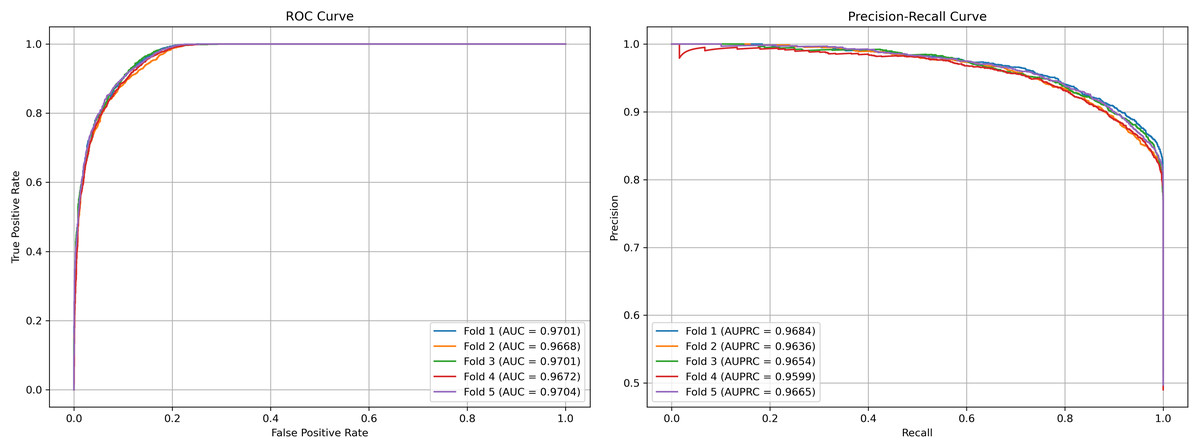
Figure 4: Performance curves of DCCM-MSIF under 5-fold cross-validation on the HMDD v3.2 dataset.
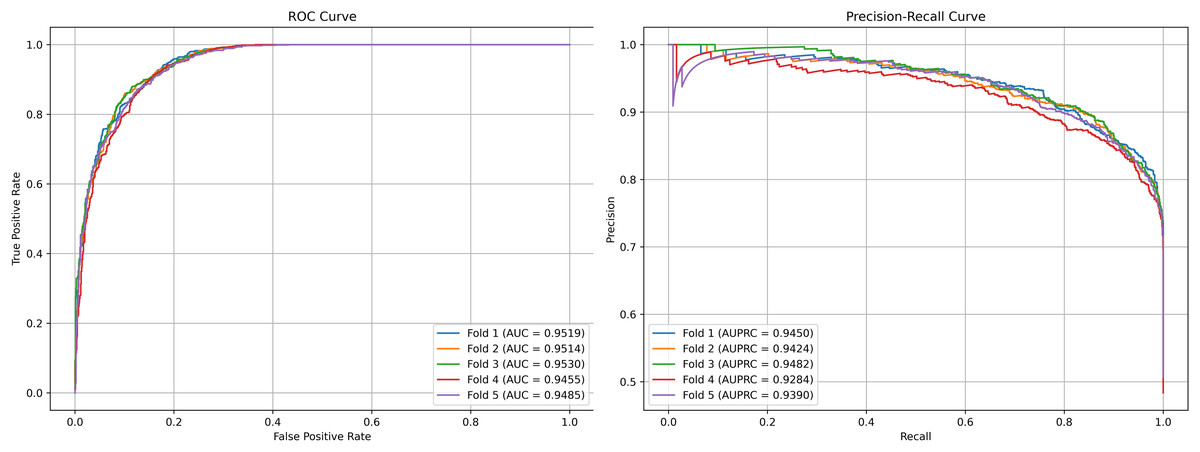
Figure 5: Performance curves of DCCM-MSIF under 5-fold cross-validation on the HMDD v2.0 dataset.
Parameter analysis and settings
Feature embedding sizes
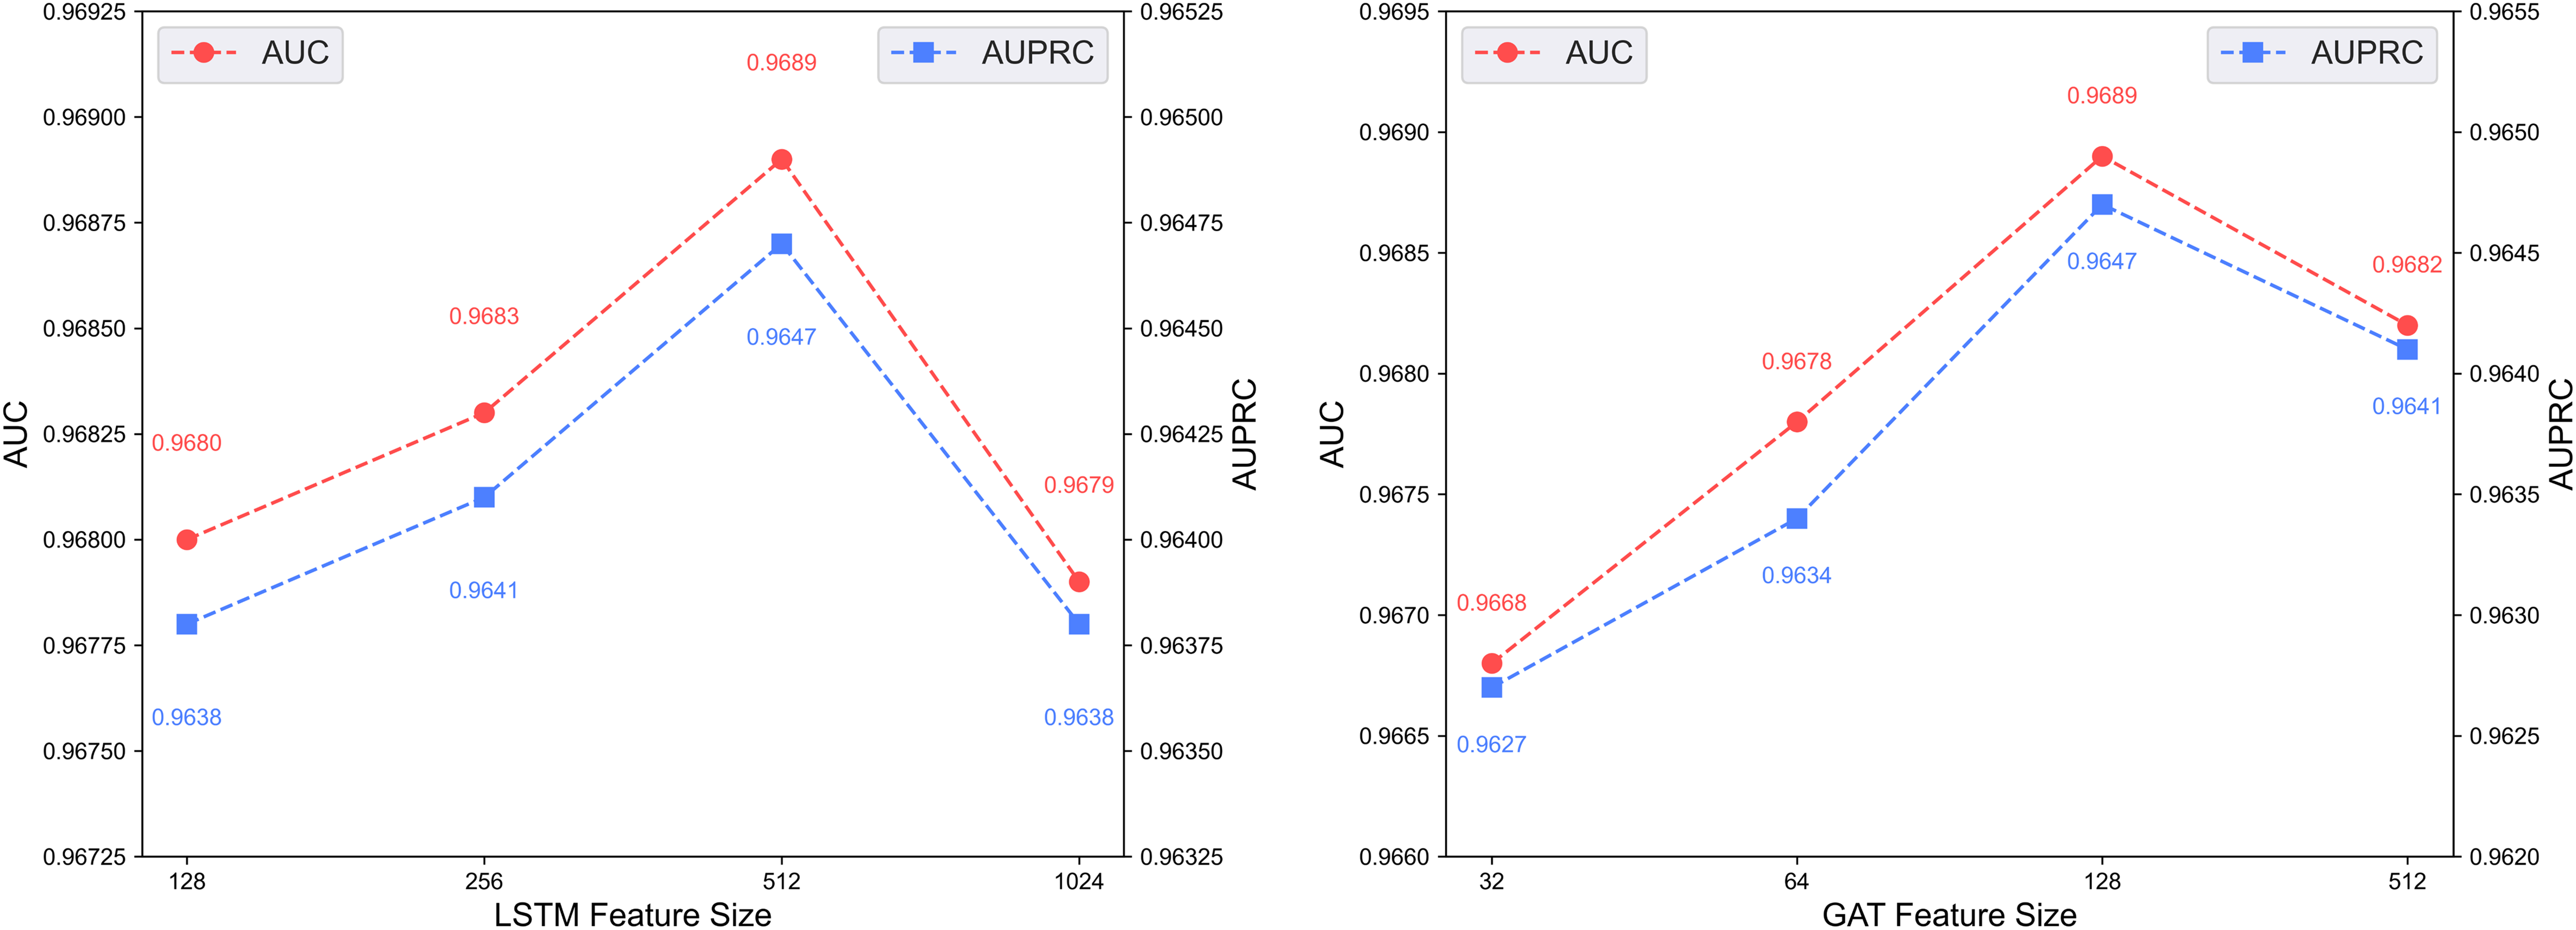
Figure 6 illustrates the predictive performance of the DCCM-MSIF model under varying feature dimensionalities in its dual-channel architecture. The model achieves optimal performance when the LSTM module in the first channel uses a feature dimensionality of 512, and the GAT module in the second channel uses 128. Accordingly, the feature dimensionalities of the LSTM and GAT modules are set to 512 and 128, respectively.
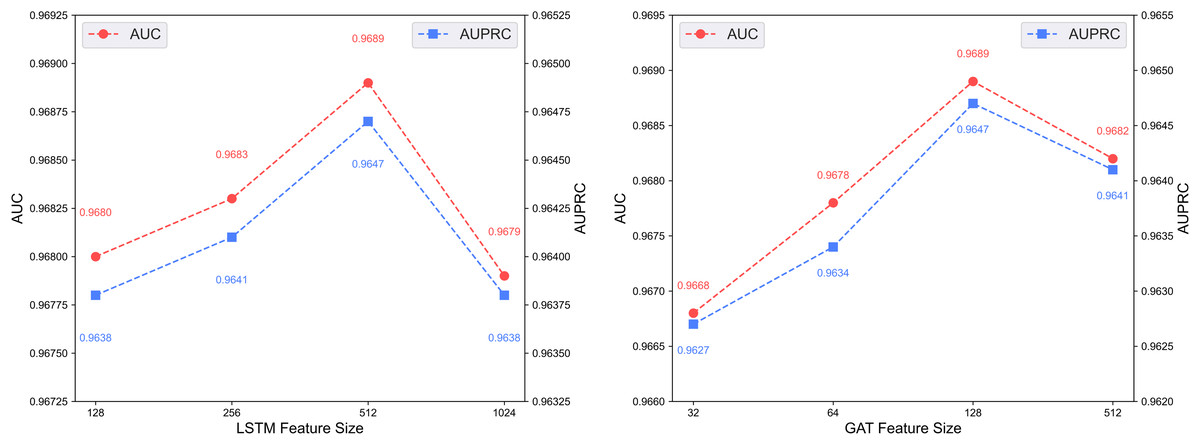
Figure 6: Effect of feature dimensionality on the dual-channel architecture.
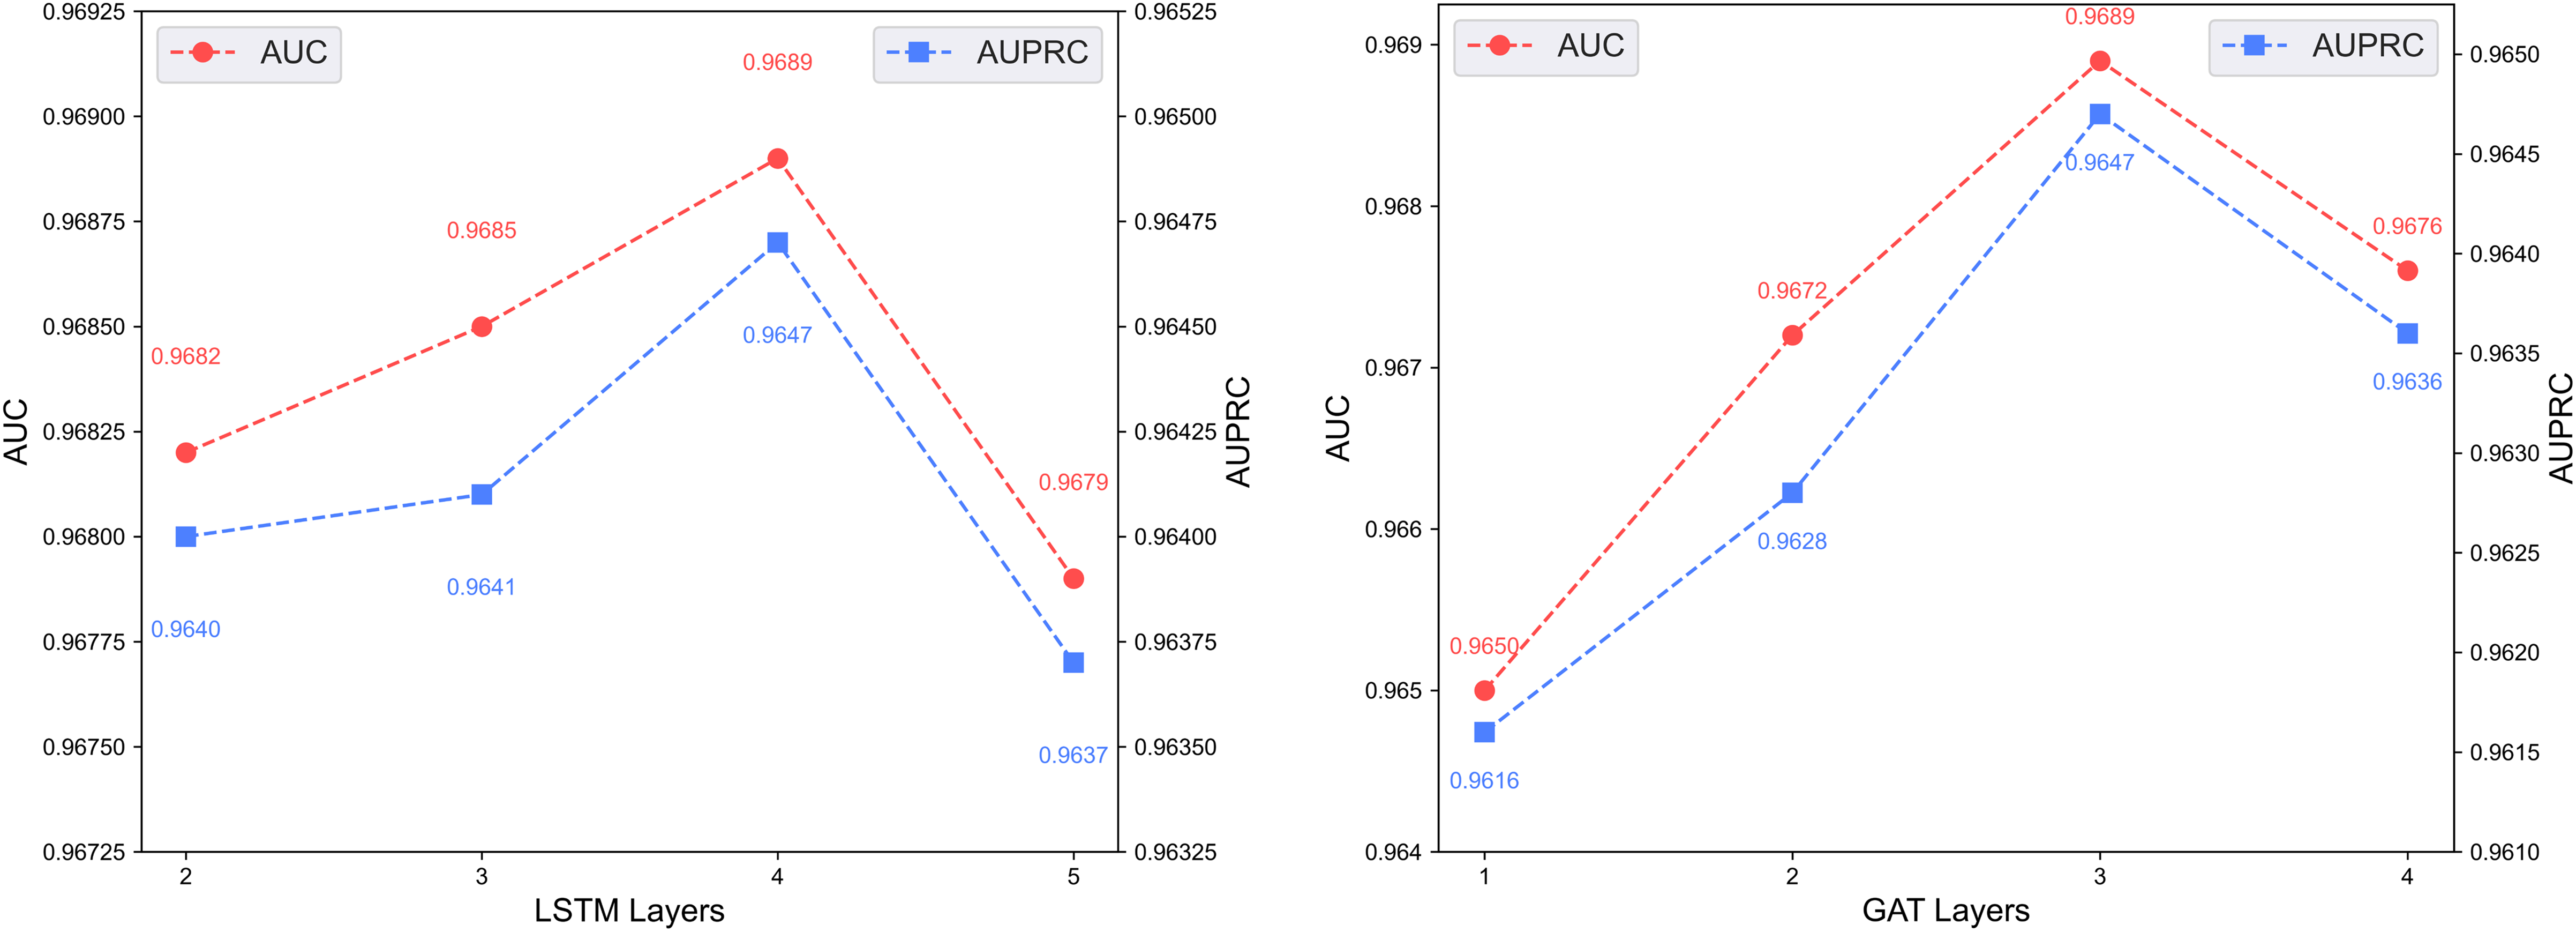
Number of layers
Figure 7 shows the predictive performance of the dual-channel network under different numbers of LSTM and GAT layers. In deep learning models, the number of layers determines network depth and representation capacity; we vary the LSTM and GAT layers in the two channels and evaluate performance. As shown in the figure, increasing layers enhances feature extraction up to a certain point, but excessive depth causes vanishing or exploding gradients that degrade performance. The model performs best with 4 LSTM layers and 3 GAT layers.
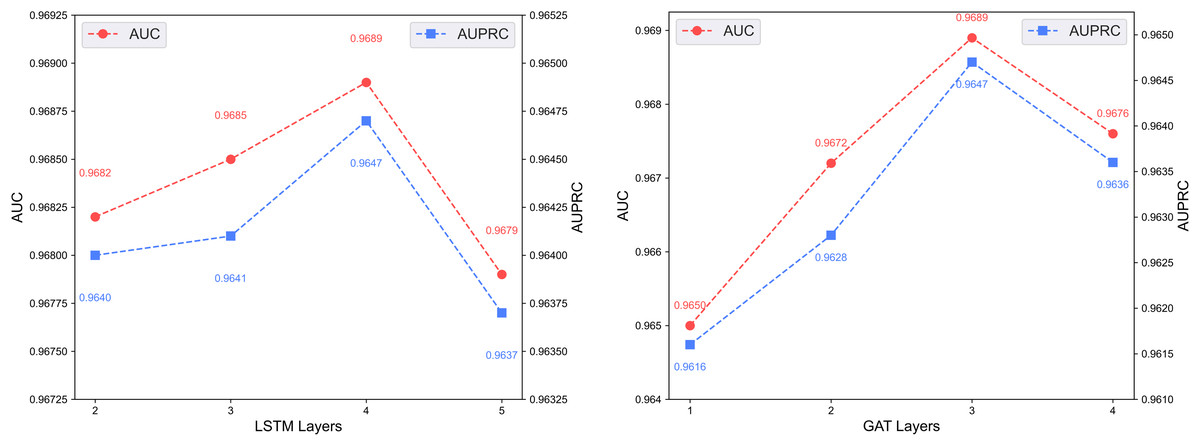
Figure 7: Effect of layer depth on dual-channel modules.
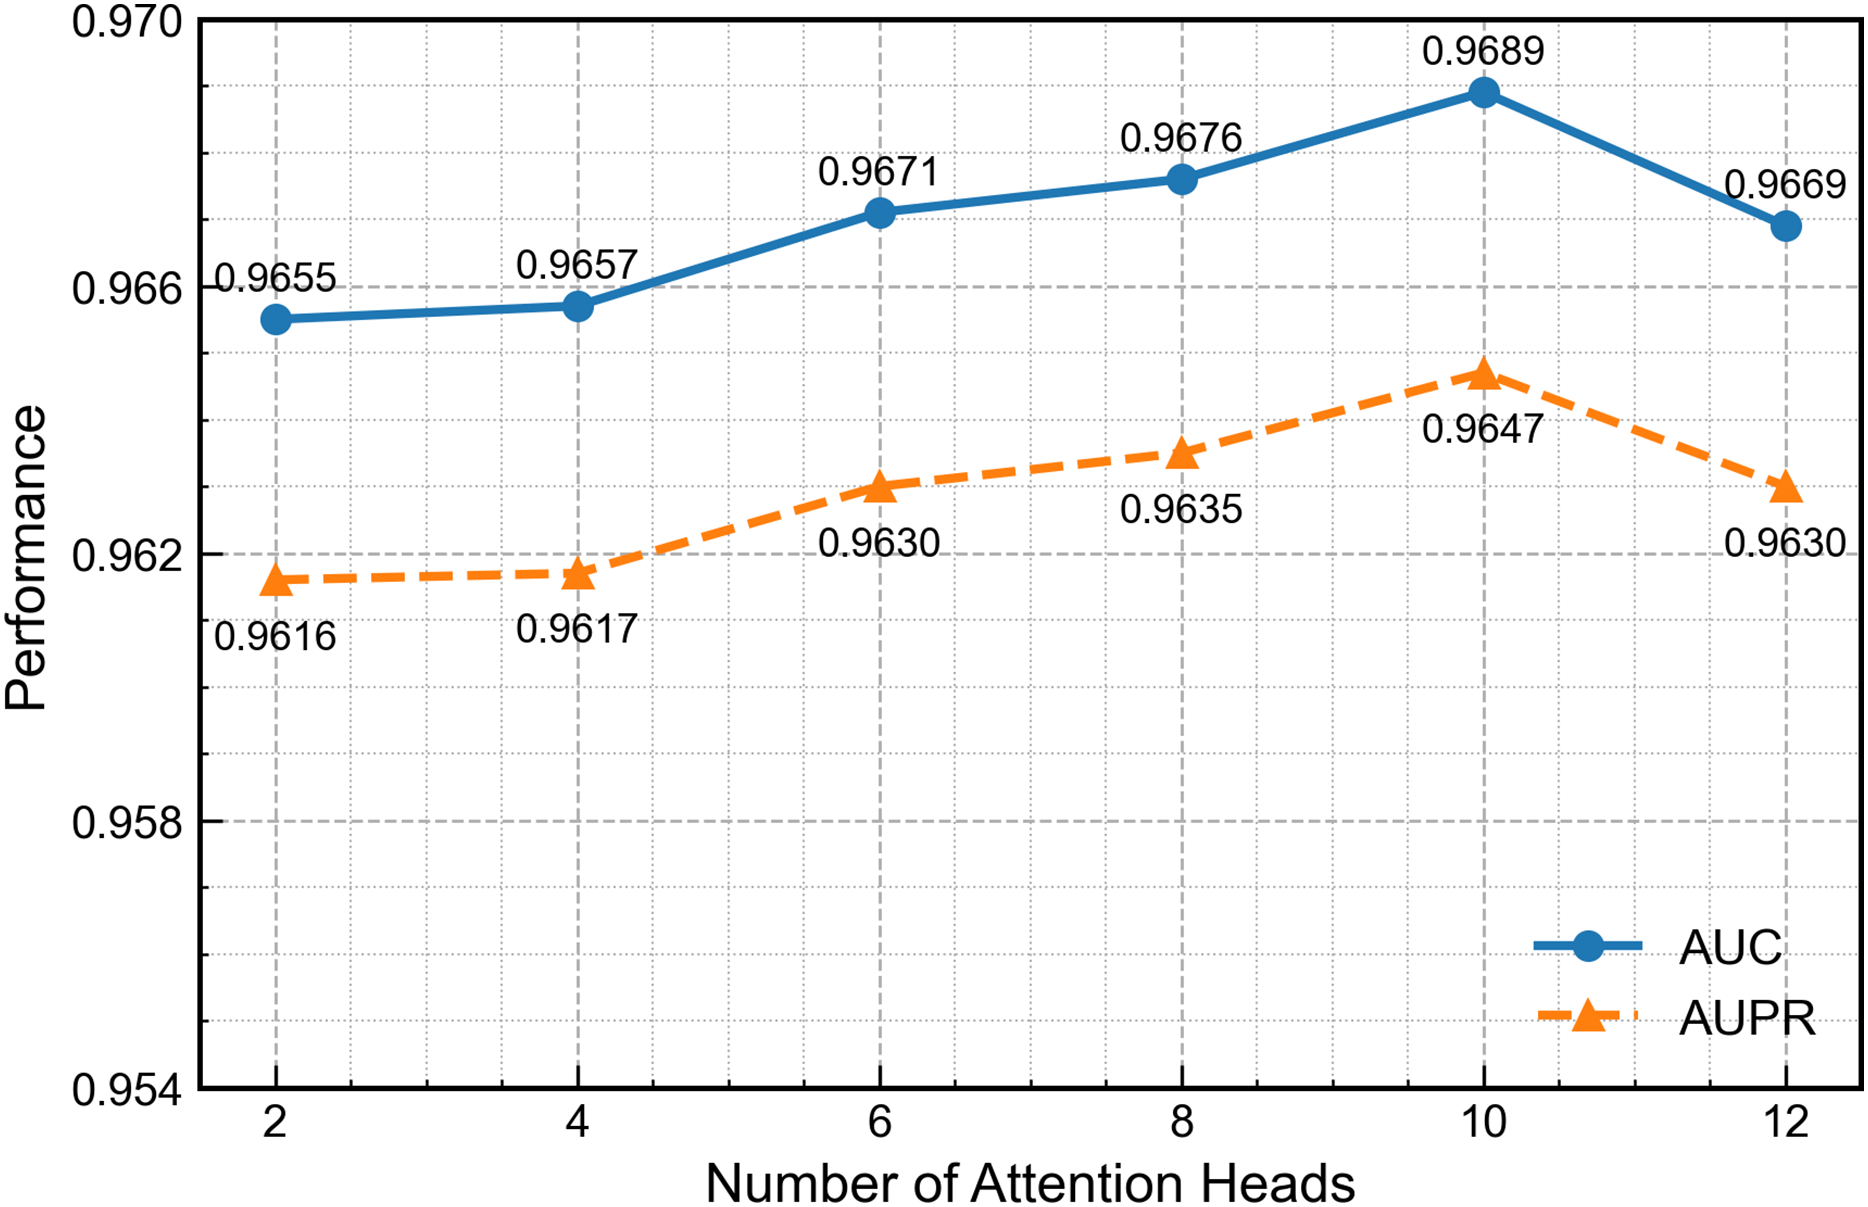
Number of attention heads
Figure 8 presents GAT performance across varying attention-head configurations. Increasing the head count to ten enhances feature-extraction capability, but further increases introduce excess parameters, redundancy and gradient instability that reduce overall performance. Therefore, ten heads provide the optimal balance between accuracy and stability.
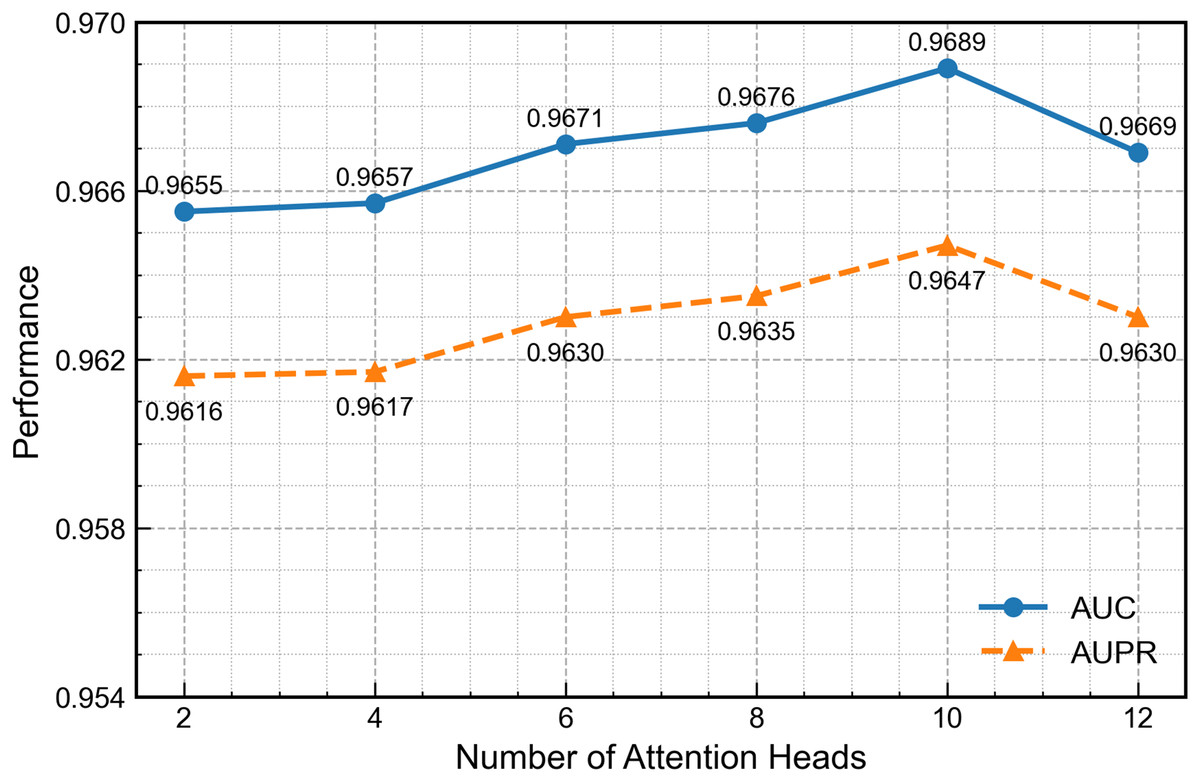
Figure 8: Effect of the number of attention heads on second-channel performance.
First-channel encoder selection
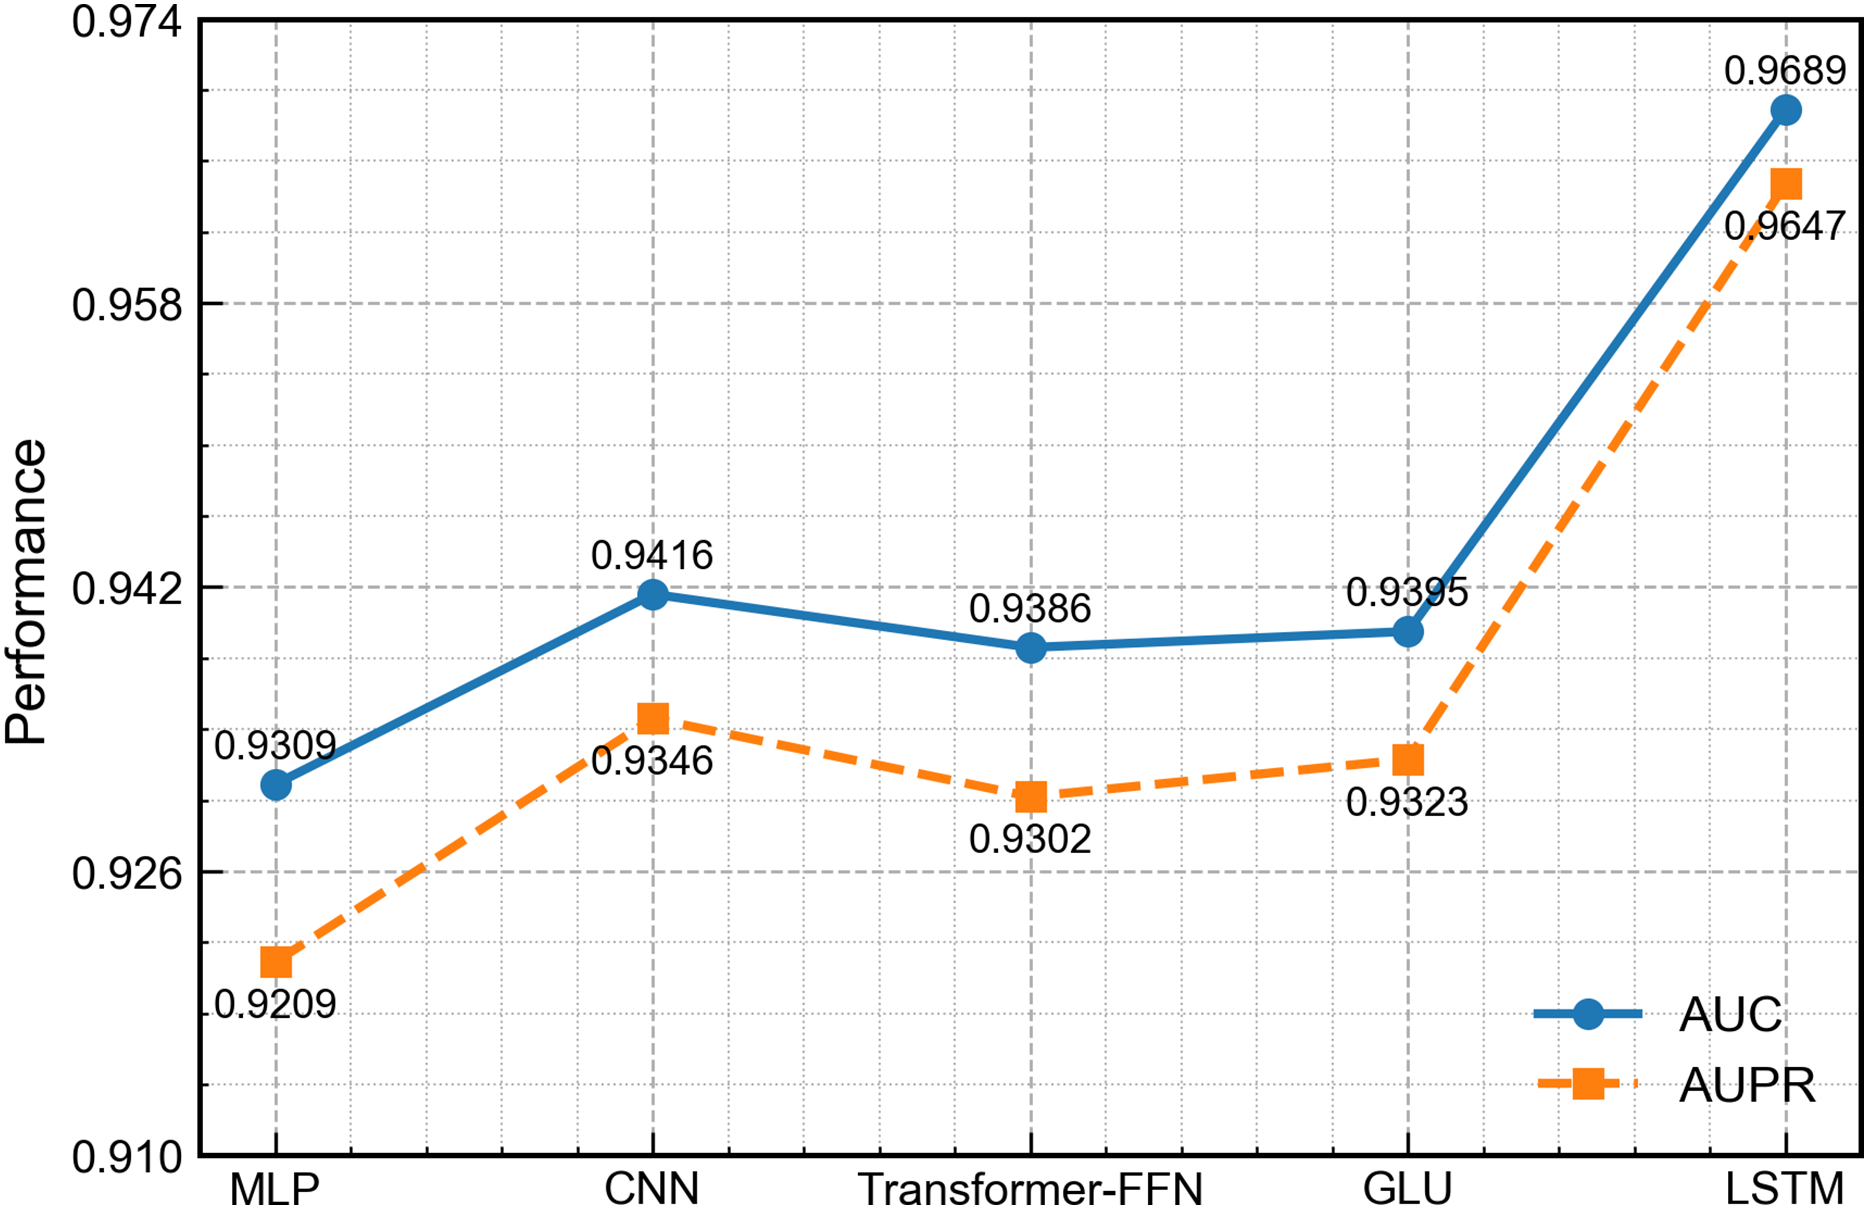
To evaluate the ability of the LSTM module to handle the non-temporal concatenated features in this work, we replace it with four widely used architectures in related work: MLP (Rumelhart, Hinton & Williams, 1986), one-dimensional convolutional neural network (CNN) (Athar et al., 2024), transformer-style feed-forward network (FFN) (Liu, Bai & Wang, 2024) and gated linear unit (GLU) (Dauphin et al., 2017). All other network parts and training settings remain the same. As shown in Fig. 9, the LSTM version achieves the best scores on every measure. Although the input is not a typical time series, LSTM can still learn deep links among the concatenated features and thus gives richer representations. By contrast, the MLP and FFN carry out only point-wise nonlinear mapping, the CNN mainly captures local patterns, and the GLU, while able to control the flow of information, cannot model long-range interactions well, leading to slightly lower overall performance.
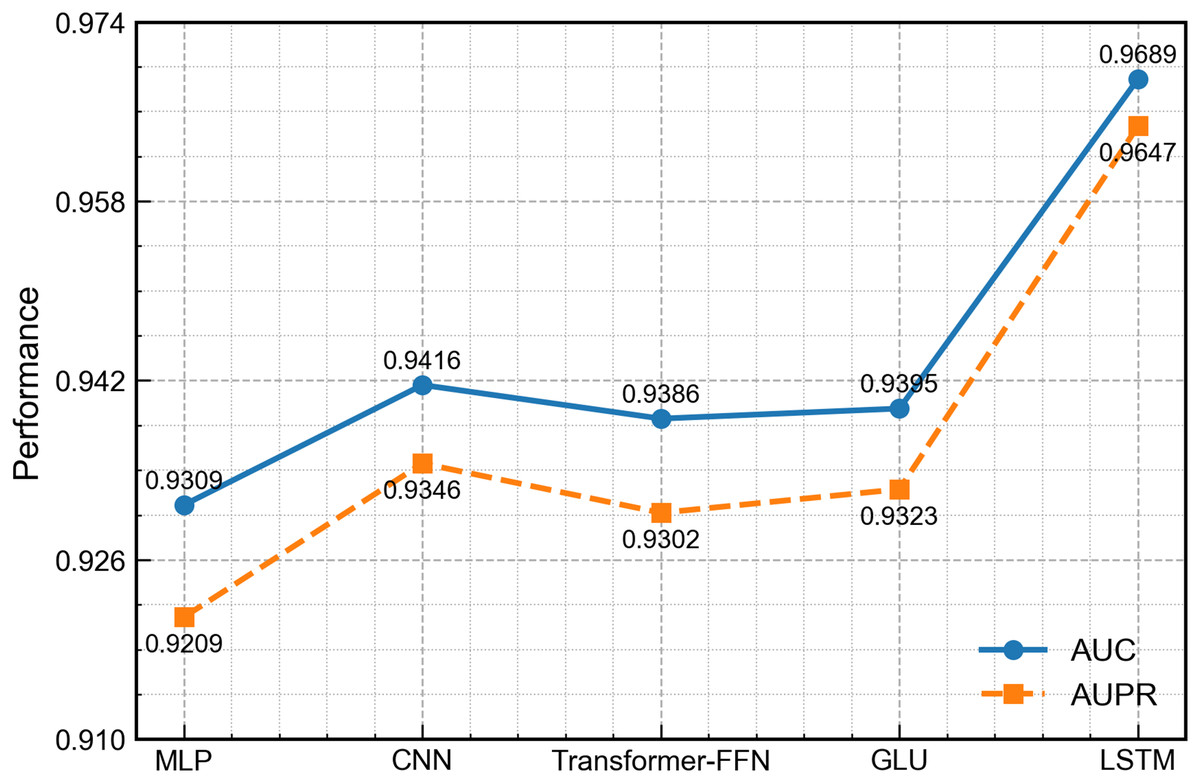
Figure 9: Performance comparison of DCCM-MSIF using different first-channel encoders.
When trained on the HMDDv3.2 dataset, DCCM-MSIF requires 0.23 s per epoch on average.
Ablation experiment
To evaluate the contribution of each component of DCCM-MSIF to overall performance, we design a series of ablation experiments on the HMDD v3.2 dataset, in which individual modules are systematically removed from the framework. The details of the experiments are as follows:
DCCM-MSIF_DASS: This experiment does not take into account known MDAs.
DCCM-MSIF_DSIM: In this experiment only heterogeneous graph similarity features are considered when constructing fusion similarity matrix.
DCCM-MSIF_DHG: This experiment does not consider the use of heterogeneous graph similarity features when constructing fusion similarity matrix.
DCCM-MSIF_DHGC: In this experiment only heterogeneous graph features are considered when constructing fusion similarity matrix.
DCCM-MSIF_DLOSS: The experiment eliminates comparative learning between modules.
DCCM-MSIF_DRESLINE: This experiment removes the residual connections from both the LSTM and GAT networks in the dual-channel architecture.
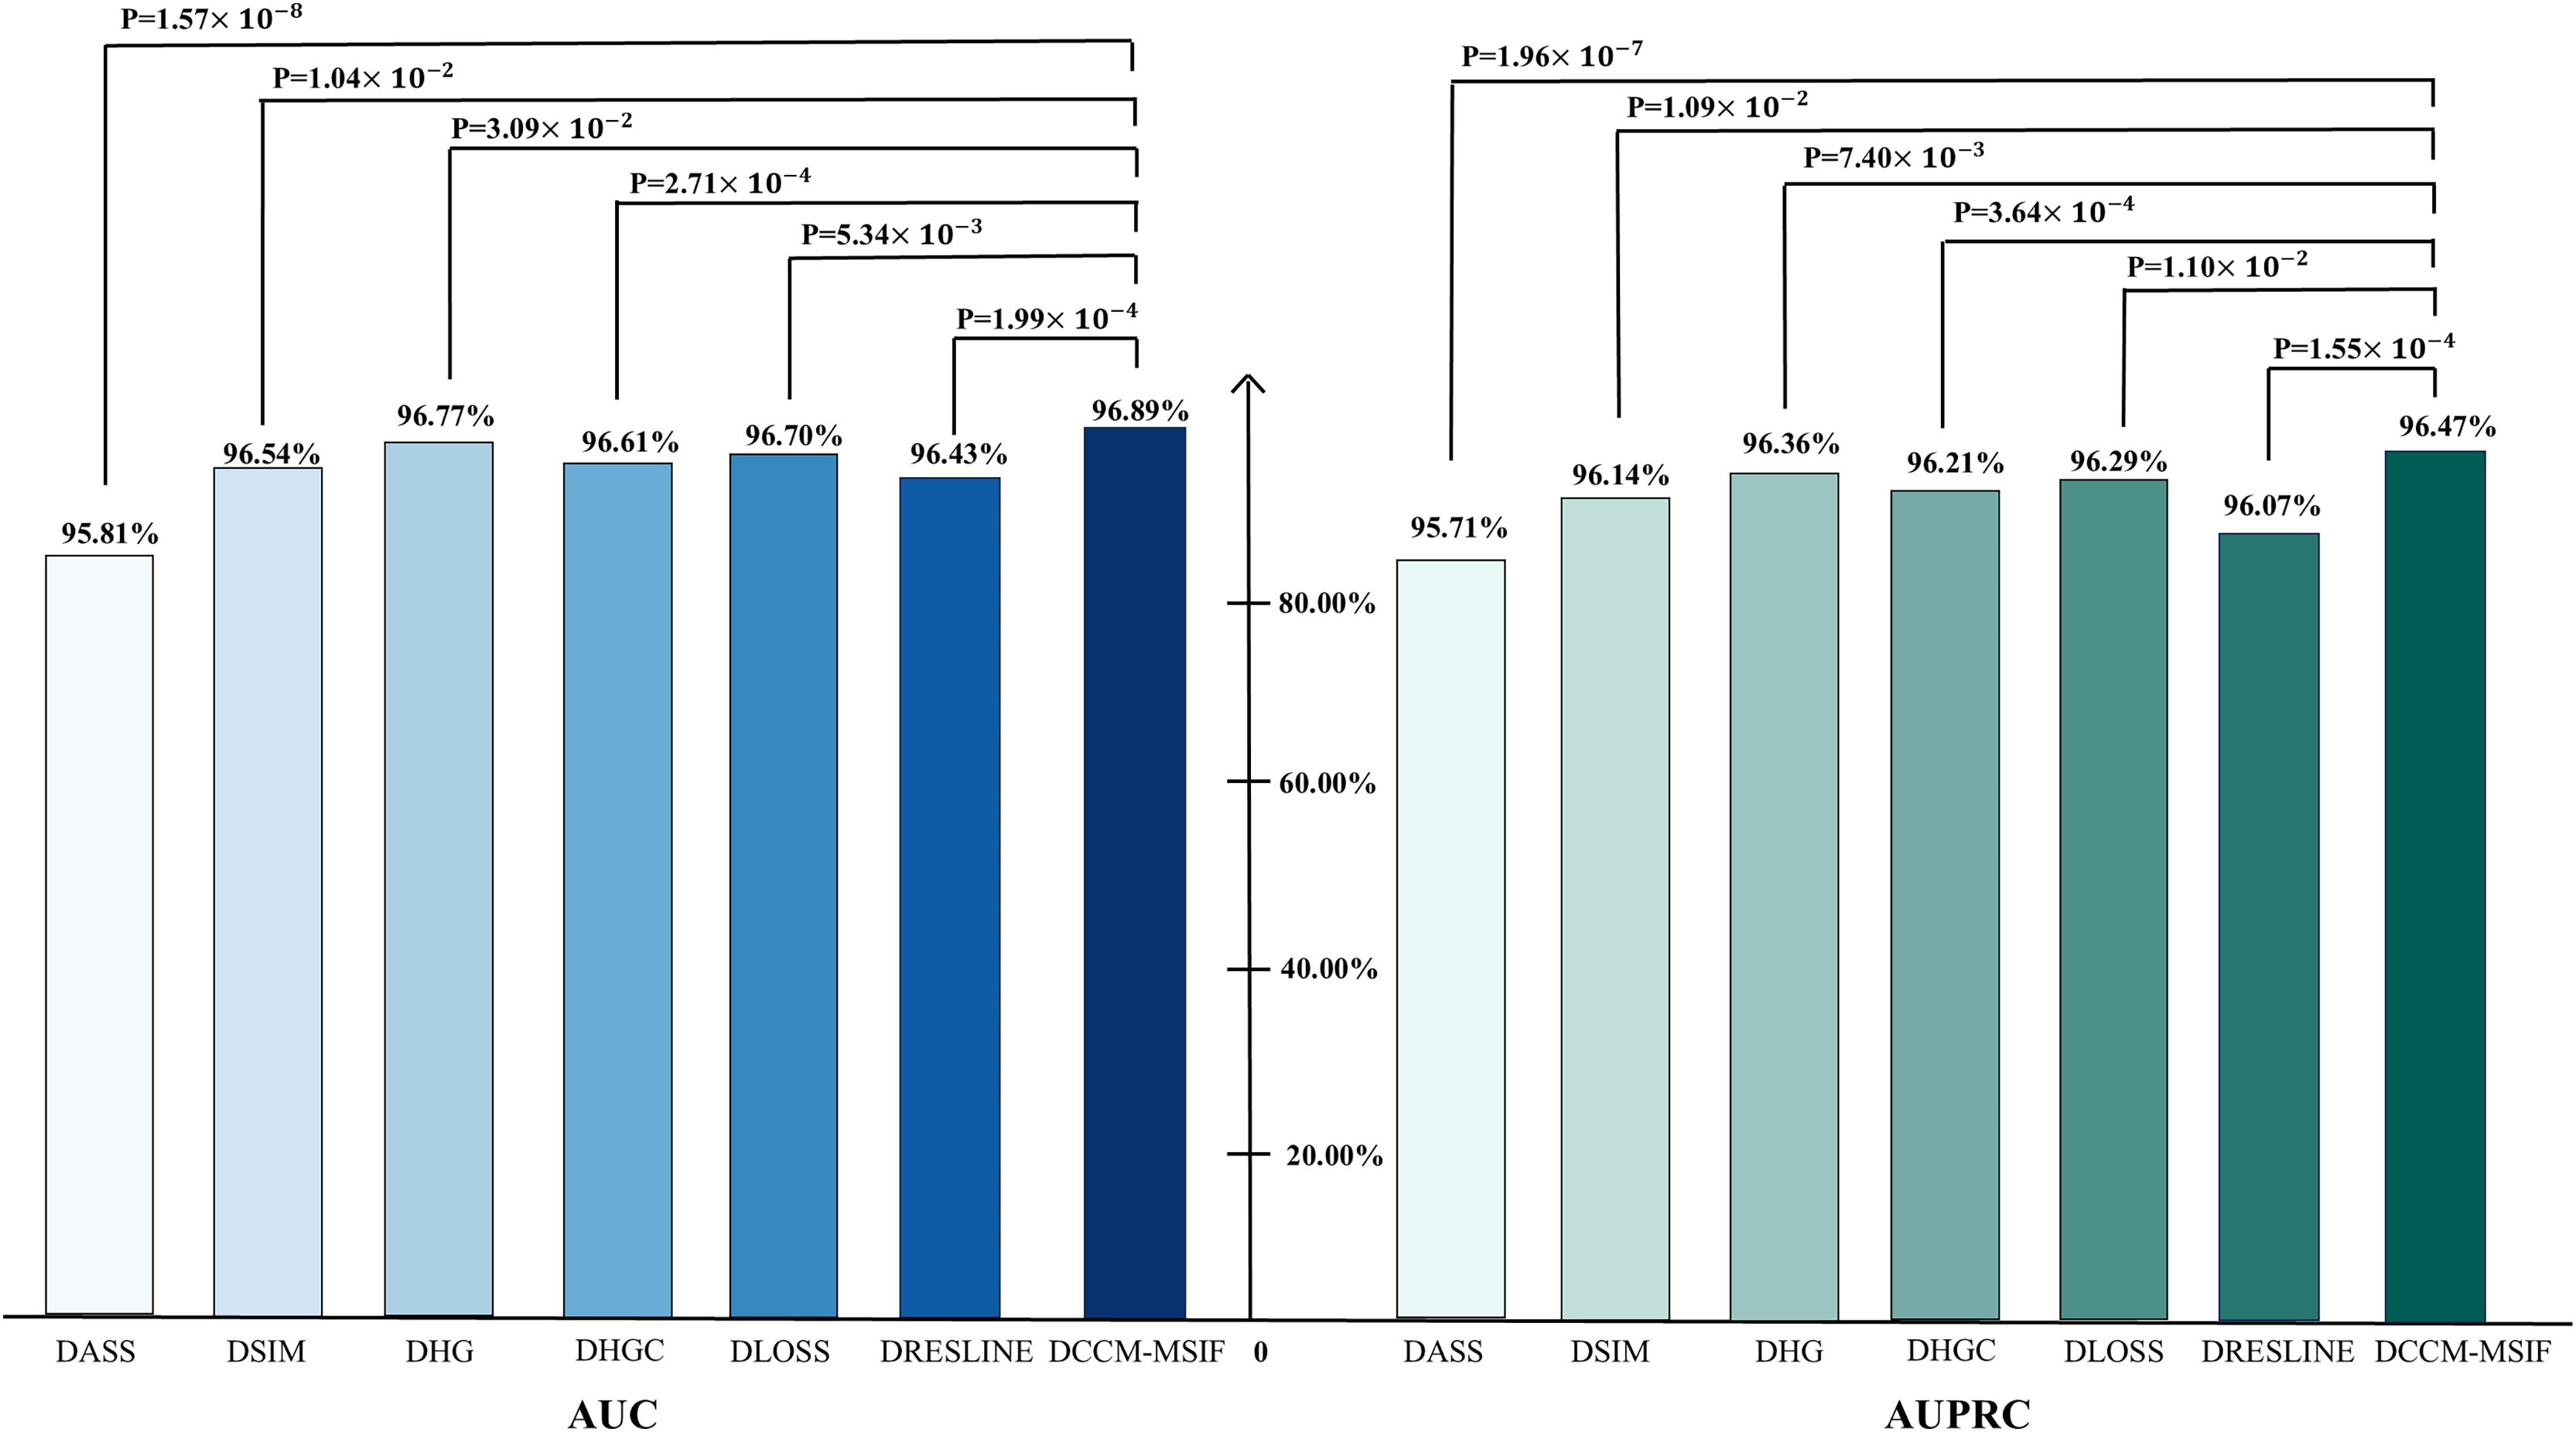
From Fig. 10, t-tests are conducted during the ablation experiments to compare each model variant against the original model, yielding p-values below 0.05. The analysis reveals notable differences in AUC and AUPR metrics between the model variants and the original model. We perform a performance comparison by excluding various designed modules and find that the original model yields the best prediction results. This serves as further evidence of the designed modules’ effectiveness. To further evaluate the contribution of each node class to the model, we perform node-level ablation experiments on the six nodes-microbe, circRNA, drug, lncRNA, mRNA and protein. Additionally, we conduct a leakage-free control experiment to systematically assess the potential label leakage introduced by GIP kernel similarity during cross-validation. The results show negligible performance differences between the two settings, further demonstrating the robustness of our conclusions. The complete results are presented in the Articles S2 and S3.
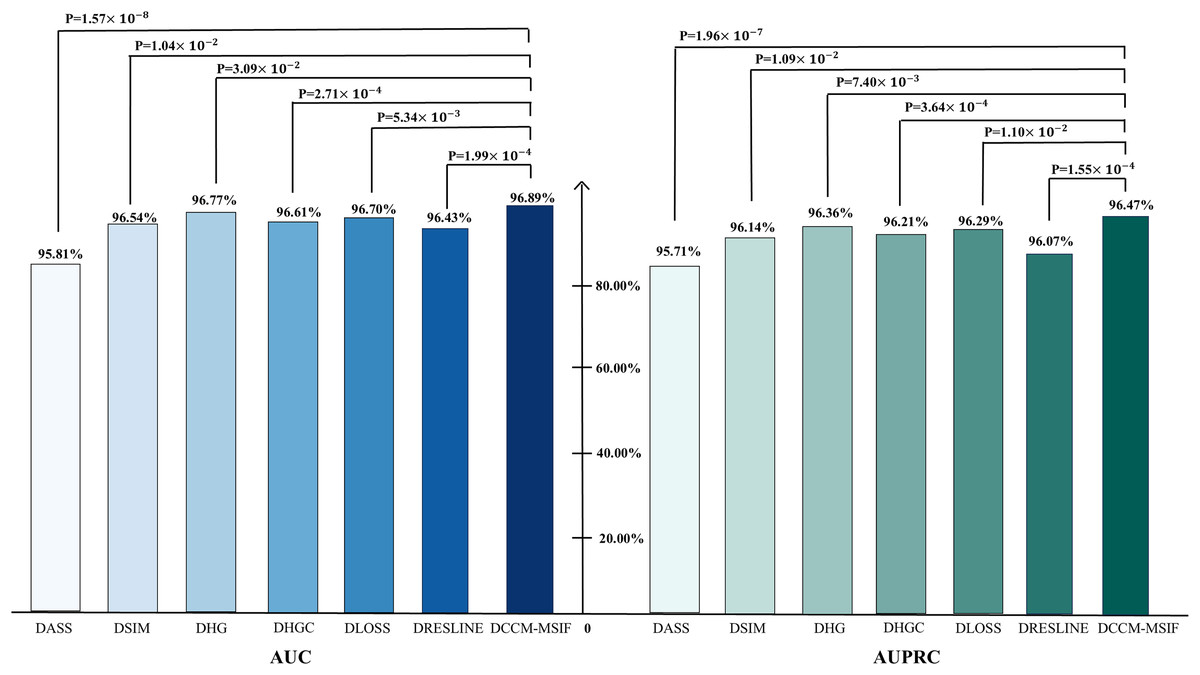
Figure 10: Ablation experiments of AUC and AUPR values with corresponding p-values.
Method comparison
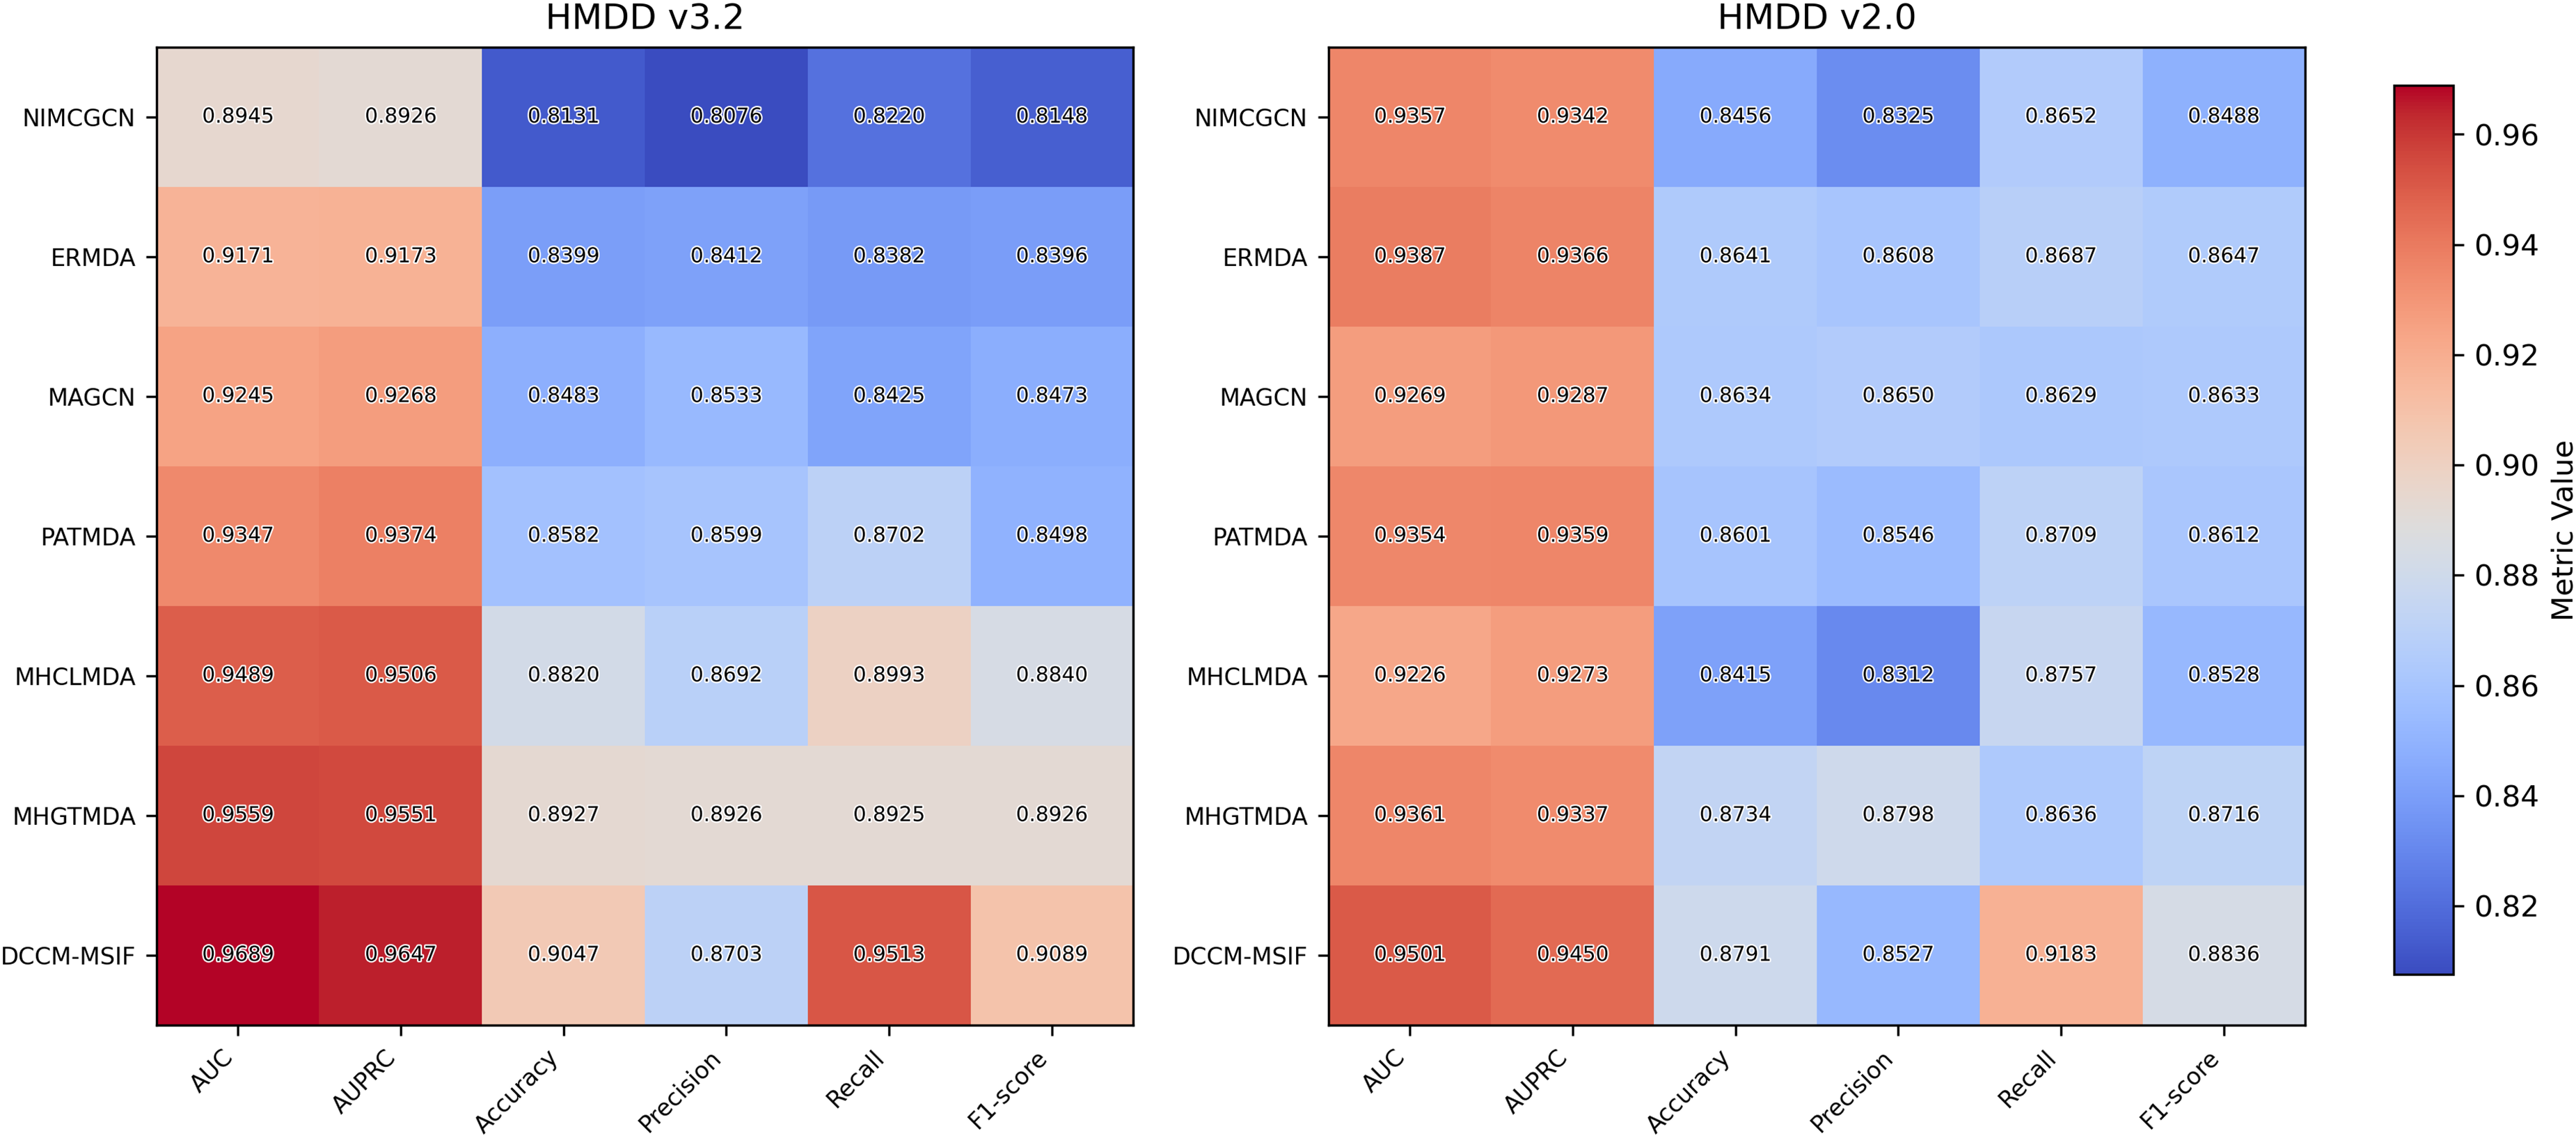
To examine DCCM-MSIF’s ability to predict MDAs, we test it against six leading baseline models (Li et al., 2020a; Dai et al., 2021; Zhan, Wu & Gan, 2021; Xie et al., 2023; Peng et al., 2024; Zou et al., 2024). Figure 11 demonstrates the performance of comparing different models on six evaluation metrics, with our model performing well in all six evaluation metrics; detailed data are provided in Tables S3 and S4. Notably, although its precision rate does not reach the highest value among all models, the remaining five metrics achieve the best results. The overall performance still significantly outperforms the other comparative models, demonstrating the excellent performance and effective optimization of our model in each task. In addition, to further enhance the comprehensiveness of the results, we include five representative recent models and present their complete data and comparative results in Article S4.
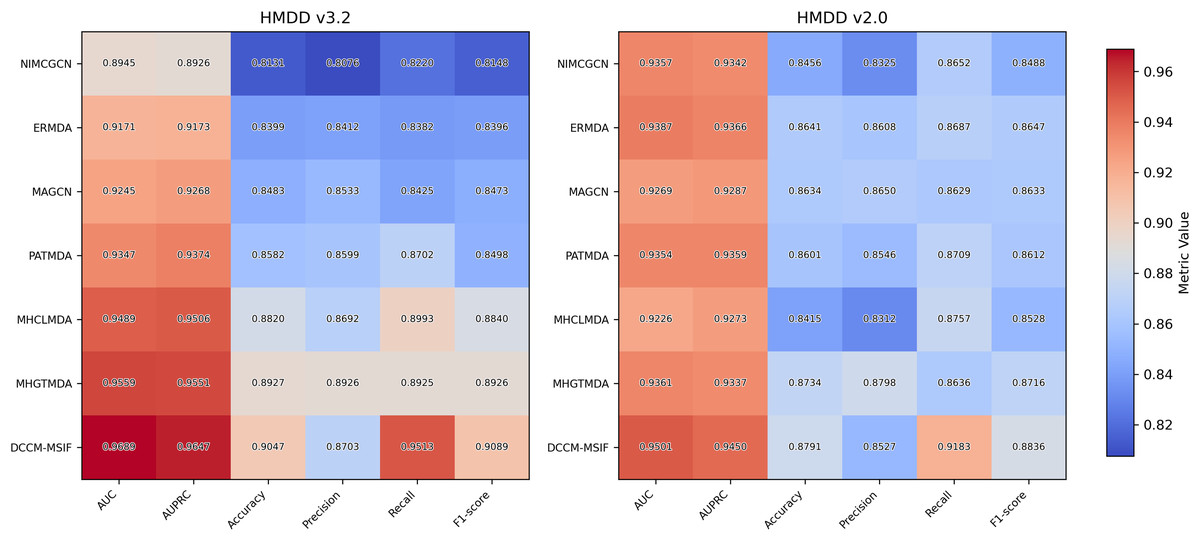
Figure 11: The result of performance comparison among different methods.
Case study
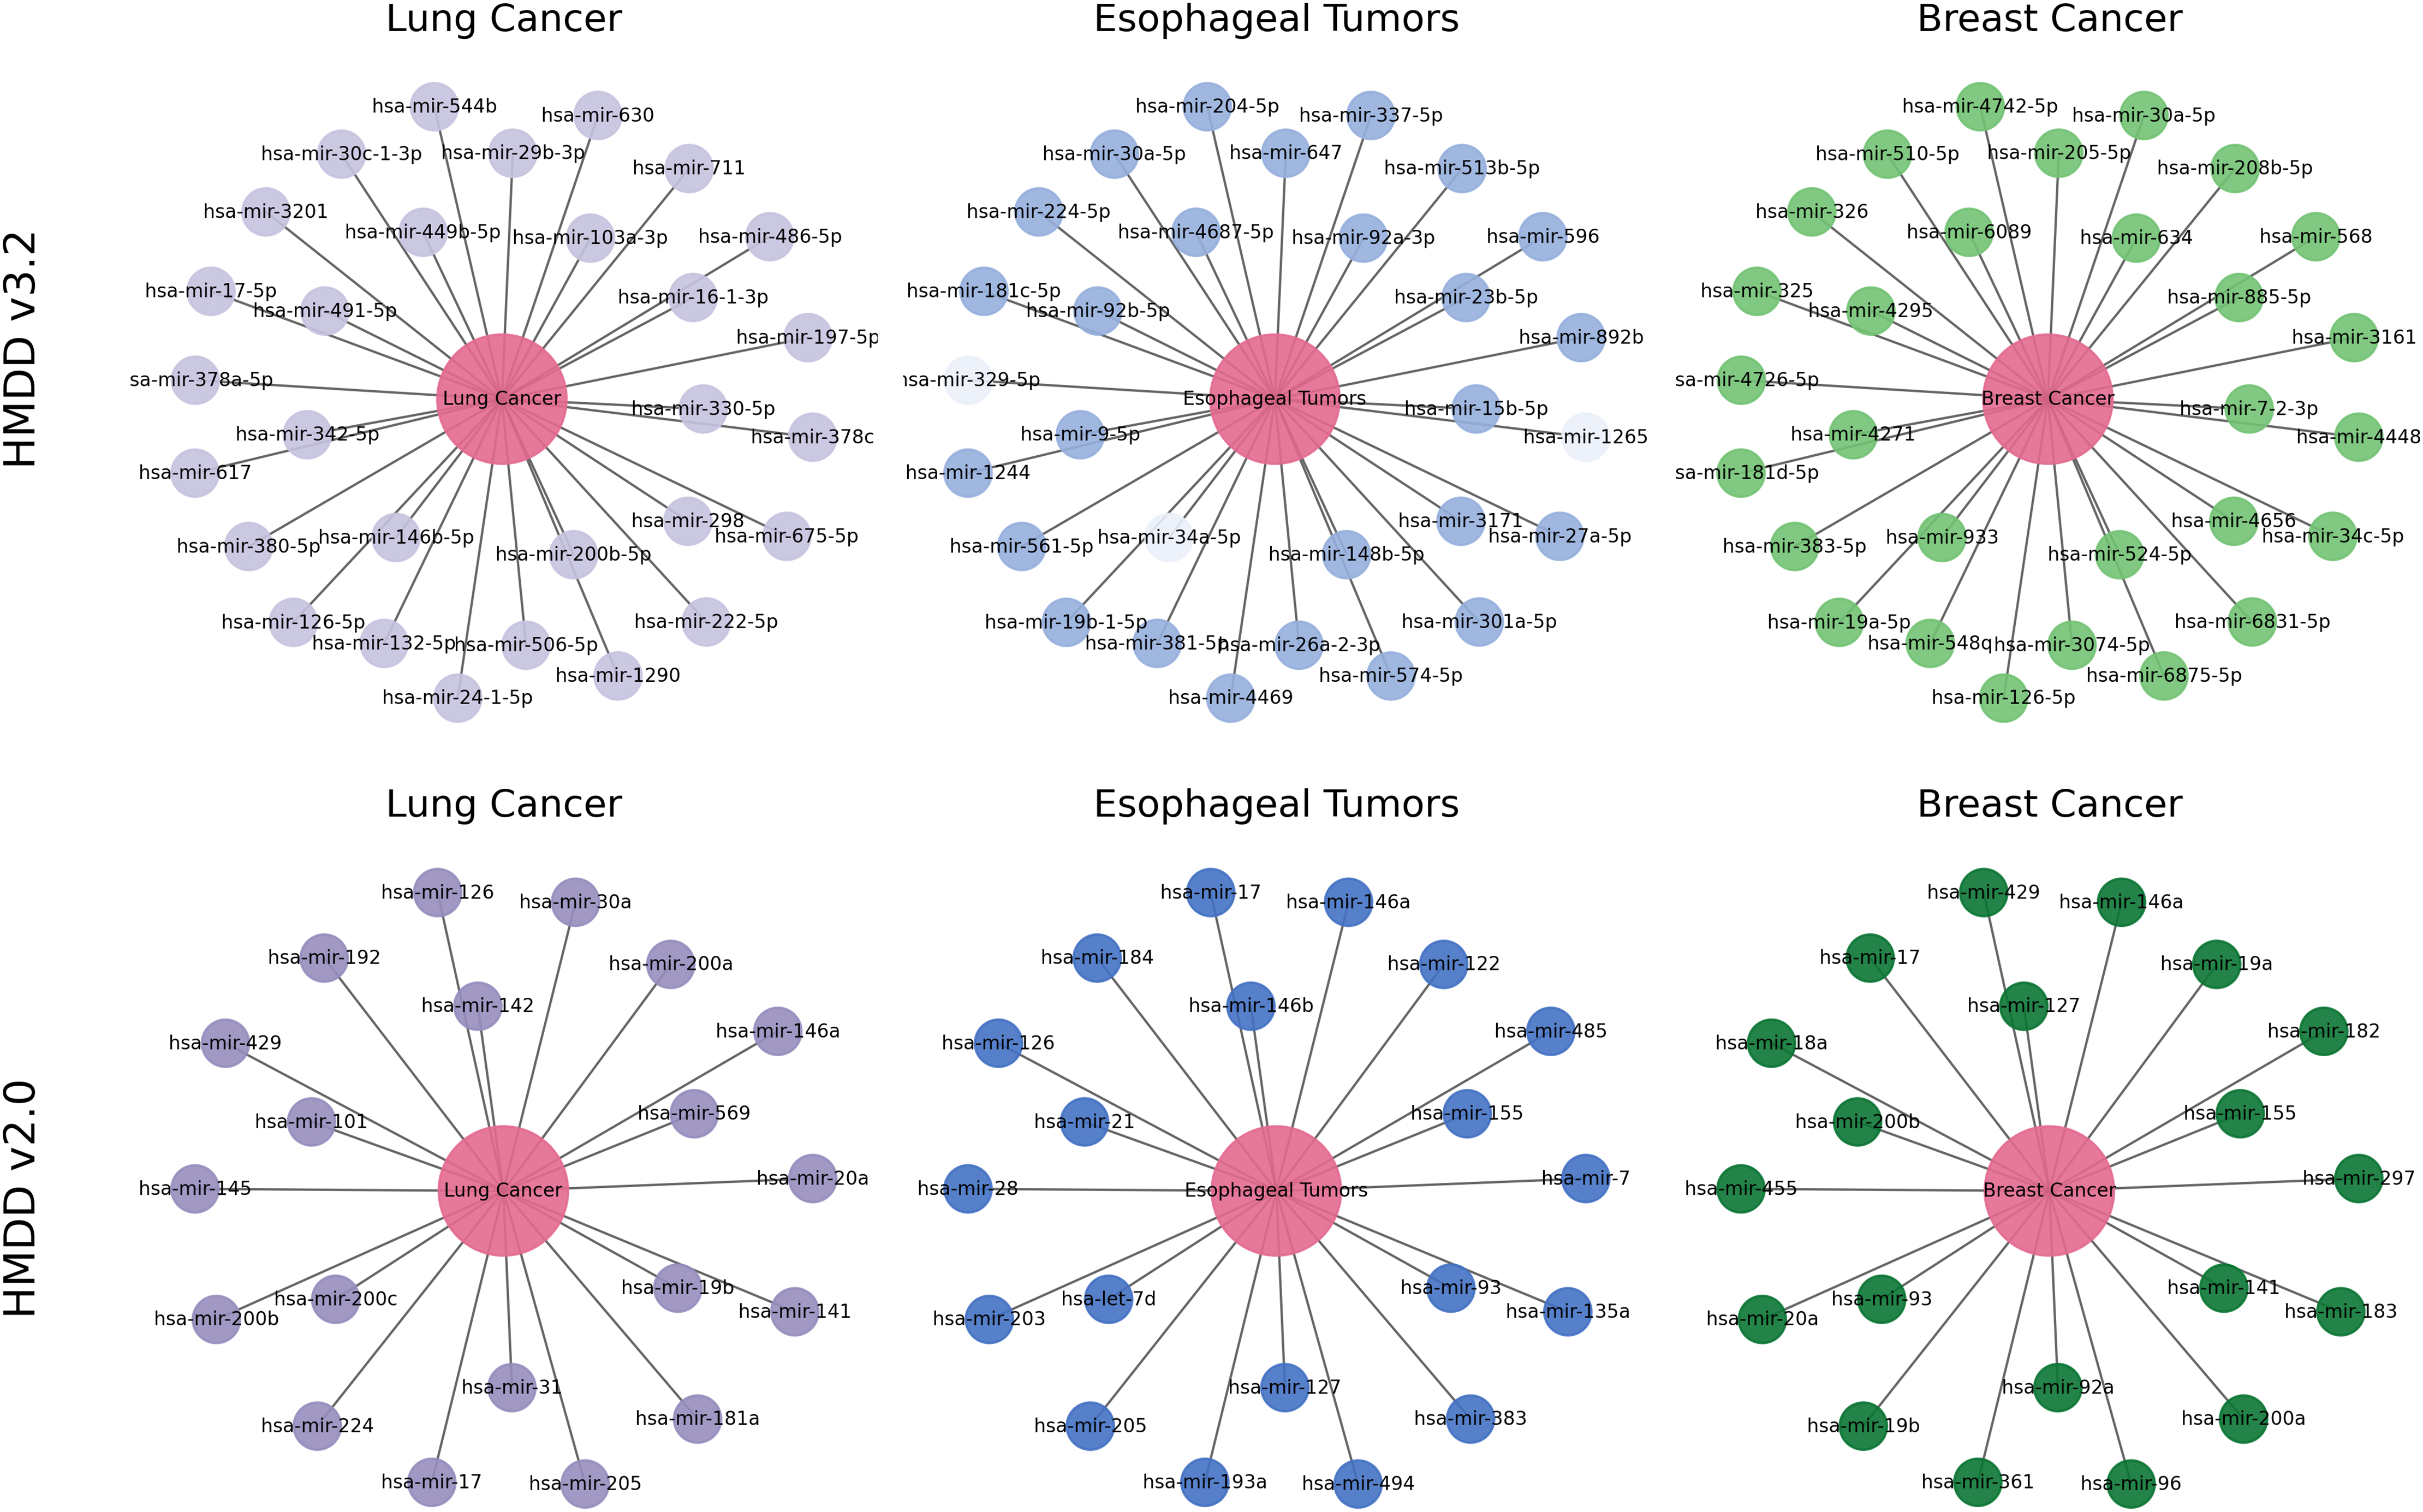
To further examine how reliably and biologically interpretable DCCM-MSIF predicts potential MDAs in practical applications, we perform case studies on lung cancer, esophageal tumors, and breast cancer. Specifically, we take the 15,186 known positive associations from the HMDDv3.2 database to construct the positive training set. An equal number of negative samples are randomly drawn from the remaining unknown pairs and included in the training data. We exclude all known positive association points for the specific diseases selected in the case studies and select the 30 highest-scoring miRNAs from the remaining points. We apply the same procedure to the HMDDv2.0 dataset. Final validation is conducted using known associations recorded in the dbDEMC 3.0 (Xu et al., 2022) and HMDDv4.0 (Cui et al., 2024) databases.
Lung cancer refers to a malignant tumor that occurs in the lungs, typically originating from the epithelial cells of the bronchi or alveoli. It is one of the deadliest cancers worldwide. MiRNAs are widely recognized as stable, reproducible biomarkers in lung cancer and have been extensively studied as a non-invasive diagnostic tool (Varela et al., 2021). As shown in Fig. 12, the top 30 lung cancer-related miRNAs predicted by our model are all confirmed by external databases. The highest-scoring candidate, hsa-miR-16-1-3p, remains consistently downregulated in the most recent plasma cohort and demonstrates tumor-suppressive activity by targeting BCL2 to induce apoptosis in non–small-cell lung cancer (NSCLC) cells (Sromek et al., 2025). Moreover, hsa-miR-126-5p inhibits angiogenesis by downregulating VEGFA and blocking the phosphatidylinositol 3-kinase-Akt (PI3K-Akt) pathway, and it is validated in multicenter clinical cohorts as a key biomarker for early diagnosis and immunotherapy response (Niu et al., 2025). Our model also identifies miR-569, which drives tumor-associated neutrophils toward an N2 phenotype and accelerates lung adenocarcinoma progression (Zhang et al., 2025). These experimental results further substantiate the biological validity and clinical promise of the DCCM-MSIF predictions.
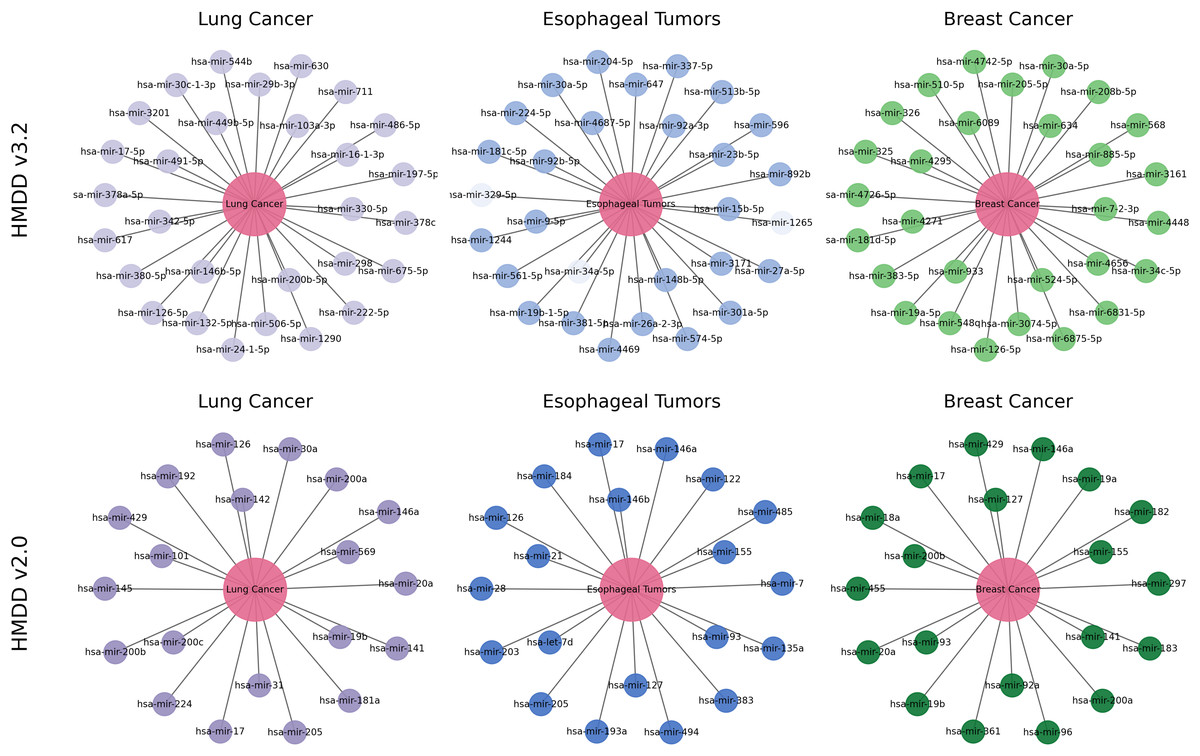
Figure 12: Case study of DCCM-MSIF.
Esophageal tumors, particularly esophageal squamous cell carcinoma (ESCC), are highly prevalent and carry a poor prognosis worldwide, with five-year survival rates remaining low. Aberrant miRNA expression is closely associated with tumor initiation, progression and metastasis. For instance, our model predicts miR-92a-3p, which promotes ESCC cell proliferation and metastasis by downregulating phosphatase and tensin homolog (PTEN) to activate the phosphatidylinositol PI3K-Akt pathway (Wen et al., 2024). Likewise, miR-146b-5p is upregulated in early ESCC and modulates the tumor inflammatory microenvironment via the tumor necrosis factor receptor-associated factor 6 nuclear factor B (NF- B) axis (Qi, Huang & Jin, 2024), whereas miR-21-5p drives exosomal programmed death-ligand 1 mediated therapy resistance and tumor progression through the PTEN and programmed cell death protein 4 pathway (Ning et al., 2023). These findings further reinforce the predictive reliability of DCCM-MSIF.
Breast cancer is one of the most common cancers in women worldwide, and early screening remains a challenge. Our model delivers equally accurate predictions for breast cancer on both the HMDD v3.2 and HMDD v2.0 datasets. As shown in Fig. 12, among the top 30 miRNAs ranked by DCCM-MSIF, hsa-miR-19a-5p and hsa-miR-19b-5p (members of the miR-17-92 cluster) are highly expressed in breast cancer and promote tumor cell growth and chemotherapy resistance by inhibiting PTEN and activating the PI3K-Akt pathway (Niu et al., 2023). The miRNA hsa-miR-155-5p is highly expressed in triple-negative breast cancer and promotes epithelial-mesenchymal transition and immune escape by downregulating suppressor of cytokine signaling 1 and activating both signal transducer and activator of transcription 3 (STAT3) and NF- B signaling (Degheidy et al., 2025). In contrast, hsa-miR-34c-5p is often downregulated in breast cancer tissues, and its restoration suppresses the Notch pathway and lowers cyclin-dependent kinase 4 and Cyclin D1 levels, thus blocking the cell cycle and inhibiting tumor growth (Yan et al., 2024). These biological data align with our model’s predictions and demonstrate that DCCM-MSIF accurately identifies key miRNAs involved in breast cancer onset, progression, and therapy resistance, further highlighting the method’s reliability in uncovering potential biomarkers and its clinical value. Detailed information on the three case studies is provided in Tables S5 and S6.
In summary, the DCCM-MSIF model demonstrates broad potential at the biological level. By incorporating miRNA sequence similarity, disease semantic similarity and heterogeneous graph similarity, the model captures the regulatory patterns between miRNAs and diseases, reveals key miRNAs across multiple signaling pathways and shows predictive consistency and cross-dataset generalization. DCCM-MSIF also employs a contrastive fusion strategy to integrate multi-source information effectively, improving the identification of low-abundance and atypical miRNAs and providing more targeted candidates for functional validation. The high-confidence miRNAs identified by the model receive experimental support in recent studies, emphasizing their clinical translation potential as diagnostic biomarkers or therapeutic targets. These miRNAs play critical roles in tumor initiation, progression, metastasis, therapy resistance and immune regulation, highlighting the model’s biological significance in uncovering potential biomarkers and guiding subsequent functional studies and clinical applications.
Discussion
In this work, we propose a novel prediction model named DCCM-MSIF, which introduces innovations in both its architecture and its feature-fusion mechanism. Unlike existing approaches that employ a single channel or a solitary feature path, DCCM-MSIF constructs a dual-channel parallel feature-extraction framework: integrating sequence-based and topology-based feature extraction. This design allows the model to simultaneously capture multi-source dependencies and hidden topological cues, thereby achieving superior accuracy with improved computational efficiency. In terms of the algorithmic mechanism, DCCM-MSIF introduces a module-level contrastive learning strategy as a regularization approach. This mechanism differs fundamentally from traditional sample-level contrastive learning, as it constrains representations across modules to enhance feature distinctiveness and robustness, thereby effectively mitigating overfitting and information loss in deep networks. Finally, by fusing the outputs of both channels through an MLP, DCCM-MSIF outperforms existing methods on multiple evaluation metrics and demonstrates robust generalization and biological reliability in cancer case studies. Altogether, the combined innovations in model structure, feature fusion, and regularization mechanisms provide new technical avenues and theoretical support for MDA prediction.
Conclusions
The model proposed in this work is expected to improve the precision of predicting MDAs, thus helping researchers and clinicians to identify potential miRNA markers of disease earlier and more accurately. This provides an important basis for disease prevention, early diagnosis, and personalized treatment, and ultimately contributing to the improvement of disease management and patient quality of life.
Although this work has fully utilized the rich multi-source information, it has been shown in the literature that miRNA target genes, transcription factors, and other biological factors also play an important role in predicting MDAs. Moreover, current deep-learning approaches remain limited in explaining the underlying biological mechanisms of MDA, highlighting the necessity of improving model interpretability. Future research that systematically integrates relevant biological factors associated with MDA and develops interpretable models could therefore comprehensively enhance predictive performance and reliability.
Supplemental Information
Node-Level ablation experiments on six biological node classes.
The result of performance comparison among different methods.
Performance of DCCM-MSIF across 5-fold cross-validation on the HMDD v3.2 dataset.
Performance of DCCM-MSIF across 5-fold cross-validation on the HMDD v2.0 dataset.
The results of different methods on the HMDD v3.2 dataset.
The results of different methods on the HMDD v2.0 dataset.
The top 30 associated miRNAs for lung cancer, esophageal tumors and breast cancer predicted by DCCM-MSIF based on the HMDDv3.2.
The prediction results were verified in dbDEMC database and HMDDv4.0.