
Artificial intelligence-enhanced CSI-based Wi-Fi sensing for non-contact vital sign monitoring: a systematic review
- Published
- Accepted
- Received
- Academic Editor
- Sara Comai
- Subject Areas
- Artificial Intelligence, Data Mining and Machine Learning, Emerging Technologies, Security and Privacy, Internet of Things
- Keywords
- AI in health monitoring, Wi-Fi signal-based health monitoring, Security in health monitoring systems, Non-contact vital signs monitoring, Machine learning in healthcare, Remote patient monitoring
- Copyright
- © 2026 Al-Rajab et al.
- Licence
- This is an open access article distributed under the terms of the Creative Commons Attribution License, which permits unrestricted use, distribution, reproduction and adaptation in any medium and for any purpose provided that it is properly attributed. For attribution, the original author(s), title, publication source (PeerJ Computer Science) and either DOI or URL of the article must be cited.
- Cite this article
- 2026. Artificial intelligence-enhanced CSI-based Wi-Fi sensing for non-contact vital sign monitoring: a systematic review. PeerJ Computer Science 12:e3375 https://doi.org/10.7717/peerj-cs.3375
Abstract
Background
In the recent era, non-invasive health monitoring has gained attention as a crucial component of healthcare. Especially with the advancements in artificial intelligence (AI) and Wi-Fi-based sensing technologies offering promising solutions. These technologies can detect vital signs and human activity without physical contact, making them well suited to diverse healthcare environments. However, research on AI-enhanced Wi-Fi signal processing for health monitoring needs to be synthesized to understand its current capabilities, limitations, and potential.
Objectives
This systematic review evaluates Channel State Information (CSI)-based Wi-Fi health monitoring systems, both with and without AI integration. It focuses on key advancements in vital signs detection, assessing the effectiveness of different AI techniques and identifying opportunities for future research.
Methods
Following PRISMA and Kitchenham guidelines, we systematically searched six databases (IEEE Xplore, ScienceDirect, SpringerLink, ACM Digital Library, Google Scholar, and ResearchGate-), retrieving 8,573 records. After screening, 45 published peer-reviewed studies from 2019 to 2024 were selected for analysis. The review focused on AI techniques, including Convolutional Neural Networks (CNNs), Long Short-Term Memory (LSTM) networks, and Support Vector Machines (SVMs). Performance was evaluated using metrics such as precision, recall, F1-score, and sensitivity in scenarios, including multi-user detection and real-time applications.
Results
Experimental findings revealed that AI models demonstrate high accuracy rates, achieving over 95% for heart rate and respiration monitoring, and demonstrate strong scalability and adaptability across various healthcare environments. However, significant challenges remain, including reduced performance in multi-person settings, privacy concerns, and computational efficiency limitations.
Conclusions
AI-enhanced Wi-Fi sensing technologies show immense potential for non-invasive health monitoring, with high accuracy in vital sign detection. But challenges related to multi-user environments, privacy, and computational demands must be addressed. Future research should focus on overcoming these obstacles to advance AI-driven health monitoring technologies in clinical and home settings.
Introduction
In recent years, health monitoring systems have emerged as a crucial component of modern healthcare, with the potential to transform patient care, improve health outcomes, and reduce costs (Majumder, Mondal & Deen, 2017). Advances in technology have enabled innovative approaches that leverage Wi-Fi signals and AI for non-invasive and continuous health monitoring (Armenta-Garcia, Gonzalez-Navarro & Caro-Gutierrez, 2024). These technologies offer unique advantages, including operation without direct patient contact and the ability to process complex data patterns to detect health issues in real time (Wang, Yang & Mao, 2020a).
However, despite these systems’ potential, ensuring their security remains a critical challenge. Health data are highly sensitive, and breaches can have serious consequences for patient privacy and well-being (Meingast, Roosta & Sastry, 2018). Moreover, the accuracy of such health monitoring systems is a significant concern, as environmental factors such as signal interferences can introduce noise, leading to false alarms or missed detections (Wang, Liu & Shahzad, 2016). Additionally, variations in hardware, user positioning, and individual physiological differences can affect system reliability (Abdelnasser, Youssef & Harras, 2015).
This literature review provides a comprehensive overview of the current state of Wi-Fi-based vital sign monitoring systems, with a particular focus on using Channel State Information (CSI) for contactless estimation of heart and respiration rates. Both artificial intelligence (AI)-based and deterministic (non-AI) approaches are examined. We evaluated their effectiveness, reliability, and clinical potential. This review is intended to support clinicians, biomedical engineers, and healthcare policymakers seeking non-invasive, scalable solutions for continuous patient monitoring in both home and clinical settings. Our objectives are fivefold: first, to report recent advances in CSI-based vital signs monitoring systems; second, to compare the methodologies used in CSI-based vital signs monitoring; third, to assess their noted performance in various settings; fourth, to identify the gaps and challenges in the field; and fifth, to suggest promising recommendations for future research and development. By analyzing the findings of recent studies, this review offers valuable insights for researchers, healthcare professionals, and engineers working toward enhancing these critical systems (Newaz et al., 2022).
The scope of this review comprises peer-reviewed journal studies published within the last 5 years. We focus primarily on health monitoring systems using Wi-Fi signals, in particular CSI, for non-invasive tracking of heart rate and respiration rate (Yang, Zhou & Liu, 2013). We consider both AI-based solutions and deterministic solutions to analyze their performance, reliability, and feasibility for clinical or home use. Studies on human activity recognition, fall detection, or those based on non-Wi-Fi wireless protocols were excluded to maintain a focused scope (Zou et al., 2018).
The primary contribution of this work can be outlined as follows:
-
1.
A structured systematic review adhering to the guidelines proposed by both Kitchenham & Charters (2007) and PRISMA (Page et al., 2021).
-
2.
Formulation of essential research questions exploring CSI-based vital sign monitoring systems, including both AI- and non-AI-based approaches.
-
3.
A comprehensive survey of methodologies used for Wi-Fi-based vital sign monitoring systems published over the past five years, including a critical analysis of their findings, strengths, and weaknesses.
-
4.
Identification and evaluation of proposed machine learning (ML) and deep learning models used to enhance Wi-Fi-based monitoring systems to make them reliable and trustworthy for clinician adoption.
-
5.
A focused discussion on current research in vital sign monitoring using Wi-Fi signals, highlighting its benefits, limitations, challenges, and future directions.
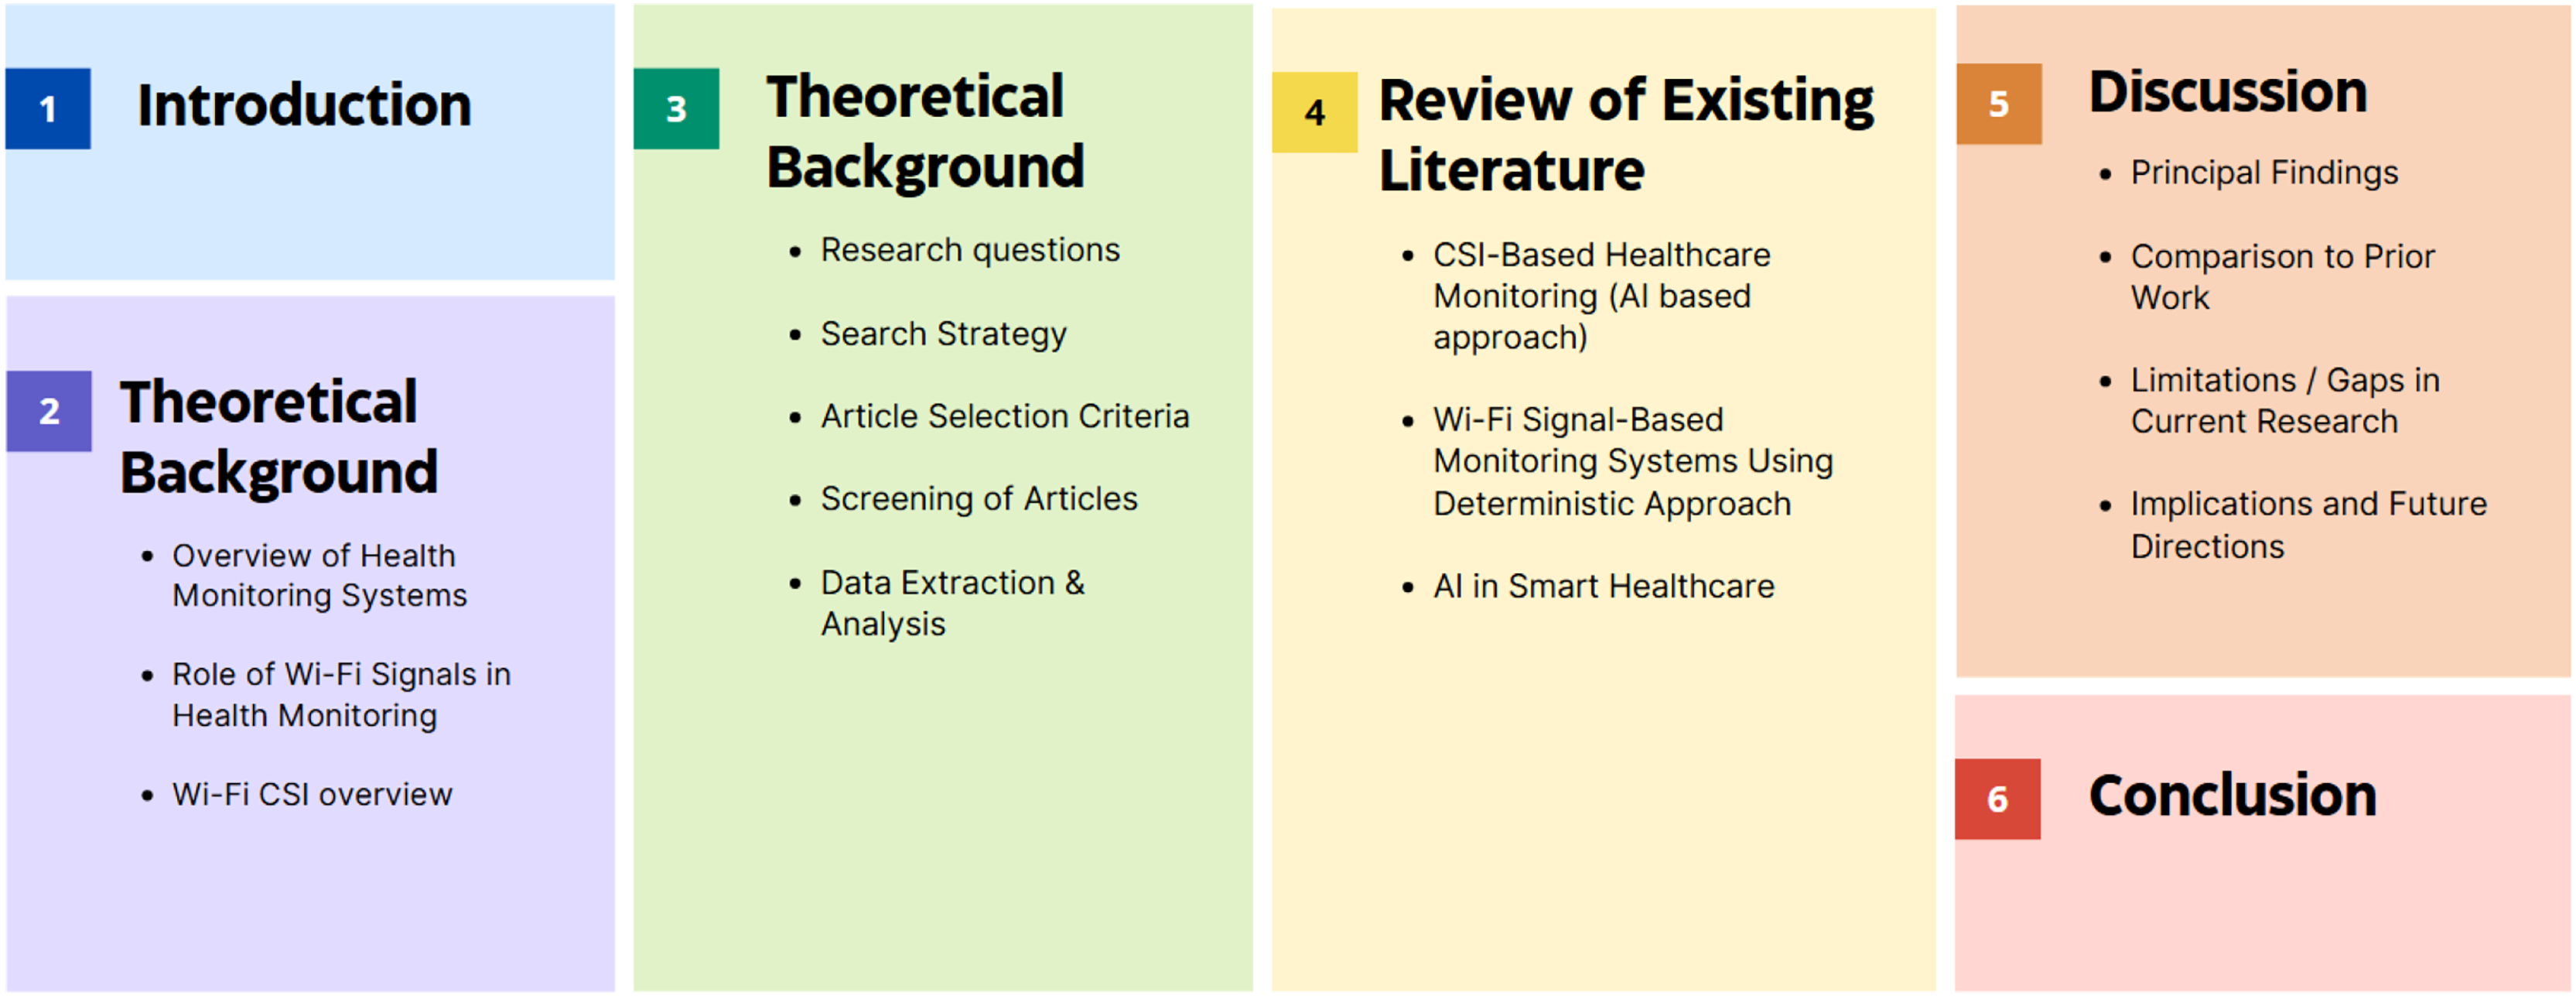
The rest of the article is organized as visualized in Fig. 1.
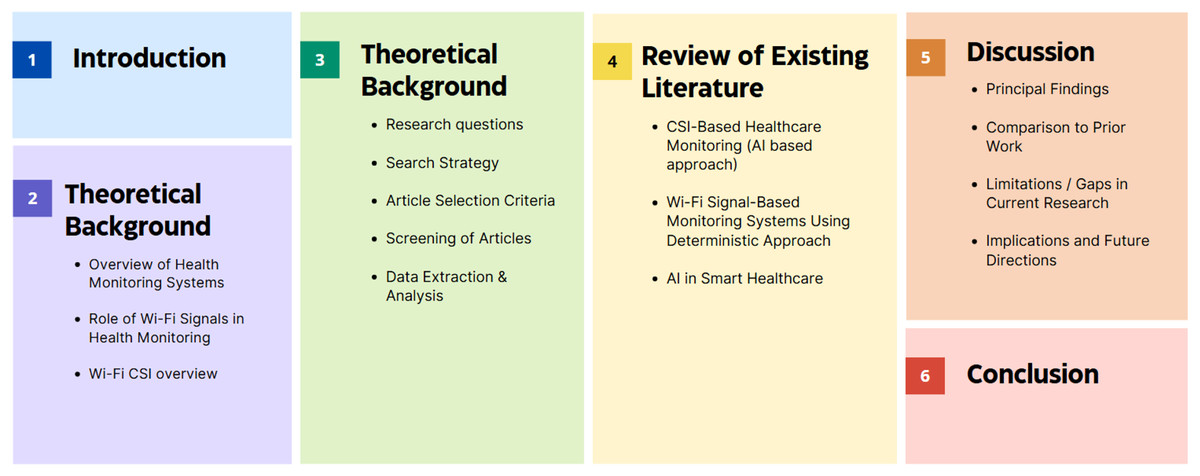
Figure 1: Overview of the article structure.
Theoretical background
Overview of health monitoring systems
Health monitoring systems have revolutionized healthcare by offering continuous methods to track vital signs and detect potential health issues. These systems range from wearable devices to ambient sensors, providing real-time data on various physiological parameters. Traditional hospital-based methods typically rely on multiple wired sensors, which restrict patient mobility and comfort (Zhang et al., 2023). These systems often require manual checks, increasing staff workload. Moreover, subtle patient movements can easily affect these devices, leading to inaccurate readings and multiple false alarms (Liu et al., 2021).
To address the limitations of traditional devices, recent advancements in healthcare monitoring have embraced Wi-Fi-based sensing technologies, which show promising results for non-contact vital signs monitoring. For instance, Wang, Yang & Mao (2020b) demonstrated that Wi-Fi can accurately monitor breathing and heart rates. However, challenges remain in data privacy, real-world accuracy, and healthcare workflow integration. Therefore, addressing these issues is crucial for the widespread adoption of advanced health monitoring systems.
CSI and its role in health monitoring
When a transmitter (TX) and a receiver (RX) communicate wirelessly through Wi-Fi, various environmental factors, including walls, windows, obstacles, and even human bodies, can affect the signals. Even the smallest change in surroundings can alter how signals propagate in the medium. CSI essentially describes the characteristics of the communication medium between the transmitter and receiver, providing detailed insights into movements and changes in the environment with each packet. CSI sensitivity to micro movements makes it a perfect fit for sensing vital signs such as respiration rate and heart rate. For instance, subtle chest movements during the breathing cycle—inhaling and exhaling—affect signal propagation, and are therefore captured by CSI. Thus, Wi-Fi signals are a promising tool for non-invasive health monitoring. By analyzing subtle changes in Wi-Fi signal patterns caused by human presence and movement, researchers have developed innovative methods for detecting vital signs and activities. CSI extracted from Wi-Fi signals has been successfully used to monitor respiratory and heart rates. For instance, Zhang et al. (2023) achieved 96.887% accuracy for estimating breathing rate and 94.708% accuracy for heart rate using CSI data. Similarly, Zeng et al. (2019) demonstrated respiration monitoring with 98% detection rate at distances up to 9 m.
More advanced applications include sleep monitoring and apnea detection. Yu et al. (2021) developed Wi-Fi sleep, achieving 81.8% accuracy in four-stage sleep classification, while Yang et al. (2021) created a system for detecting sleep apnea with over 95% accuracy.
Wi-Fi-based health monitoring offers several advantages, such as:
Non-invasive and contactless monitoring, ideal for long-term patient observation.
Utilizing existing Wi-Fi infrastructure, reducing implementation costs.
Ability to operate through walls and furniture, allowing for discreet monitoring.
High accuracy in readings and predictions, aiding early intervention in critical cases.
Potential for muti-person monitoring, as demonstrated by Gao et al. (2020) for respiration tracking.
However, researchers have yet to fully address challenges such as sensitivity and environmental changes. Ongoing research focuses on improving accuracy of readings and expanding the range of detectable health parameters to enable better health assessments and early disease detection.
Wi-Fi CSI overview
Wi-Fi CSI extraction
CSI extraction can be achieved through various tools, each of which is associated with specific Wi-Fi chipsets. One widely used tool is the Linux 802.11n CSI, which is built on top of the Intel 5300 Wi-Fi chipset. This tool is popular because it can be plugged directly into a PC or laptop, facilitating both CSI extraction and data processing within a single setup.
Another tool for CSI extraction is the Atheros CSI, which is now somewhat outdated. Although building this system from source code is no longer possible due to its obsolescence, prebuilt images are available on GitHub. These images can be flashed onto routers equipped with Atheros Wi-Fi chipsets, such as the TP-Link TL-WDR4300, which is often used with this system. This method allows users to collect CSI data without manually compiling the software.
The ESP32 chip is another versatile and powerful option for capturing CSI data. As a system on chip, it integrates both Wi-Fi and Bluetooth functionalities, making it highly flexible for various applications. The ESP32 supports a wide range of IEEE 802.11 Wi-Fi standards, ensuring compatibility with most Wi-Fi networks. One of its key features is its ability to function in multiple modes: it can act as a transmitter (TX), receiver (RX), or both. Additionally, it can be set up as an access point or operate in master mode, allowing interaction with other devices in various network configurations. For CSI measurement, the ESP32 provides detailed data from 64 subcarriers, enhancing the quality of the collected data. Furthermore, it supports up to 16 antennas, increasing its capacity to capture and analyze complex signal interactions. Thus, the ESP32 is highly effective for collecting and processing CSI data in research and applications such as health monitoring (Atif et al., 2020).
Moreover, CSI can be captured using a Raspberry Pi 4 (RPi), which is equipped with the BCM43455C0 Wi-Fi chip. To enable effective CSI extraction, the chip requires a specialized firmware patch, Nexmon, which modifies the BCM43455C0 to operate in monitor mode. Monitor mode allows the Wi-Fi chip to capture all 802.11 frames, including those not normally visible in standard operating modes—a capability crucial for analyzing Wi-Fi signal interactions as they travel through or bounce off objects. Once Nexmon firmware is installed, the RPi can collect raw CSI data from monitored Wi-Fi frames. Beyond mere CSI capture, the RPi can filter and process CSI data (Chafni, 2022), enhancing its utility in research and applications by providing a comprehensive solution for both data collection and initial data handling.
It is important to point out that CSI extraction at the chipset level is usually handled by low-level tools and firmware written in languages such as C or C++. For instance, the Intel 5300 CSI or Nexmon operate at the Wi-Fi driver or firmware layer, allowing raw CSI data to be captured directly from the network interface card (NIC). Once CSI data are gathered and stored, either as logs or structured data, more advanced tools, such as Python, are commonly used later for post-processing, filtering, visualizing, or applying machine learning and deep learning techniques.
Understanding CSI
Wi-Fi signals can be described using two main metrics: received signal strength (RSS) and CSI. RSS is not always ideal due to its sensitivity to environmental changes, which can lead to false detections (Wang et al., 2018). In contrast, CSI has gained popularity in recent years for its ability to accurately describe signal properties as they travel between transmitters and receivers. CSI offers detailed insights into signal behavior, including reflections, multipath propagation, and the detection of human movements (Ma, Zhou & Wang, 2020).
CSI values are typically represented as complex numbers, comprising both amplitude and phase components of the received wireless signals. The amplitude represents the magnitude of the complex number, while the phase represents the vector’s shift angle. To analyze these values, research articles often segment CSI data into amplitude and phase components before preprocessing. Some studies focus exclusively on either amplitude or phase, while others utilize both, stating that the two features offer complementary information. The general representation of CSI can be expressed as:
(1)
Instead of relying on manual processes, the NumPy library in Python can simplify the extraction of amplitude and phase information from complex numbers. The NumPy library provides functions such as abs() to compute amplitude (magnitude) and angle() to determine phase angle. By applying these functions to a given complex number (a + bj), researchers can efficiently break down a CSI value into its amplitude and phase components.
Typical setup
While study setups vary, the core elements remain consistent. Generally, the setup includes Wi-Fi-enabled devices acting as a transmitter and a receiver, both equipped with antennas. The hardware may consist of routers, laptops, or RPi (Abdelnasser, Youssef & Harras, 2015; Zeng, Pathak & Mohapatra, 2016). However, CSI extraction is limited by the availability of the specific tools discussed above, as each tool supports only a certain NIC, which restricts the range of compatible hardware (Abdelnasser, Youssef & Harras, 2015; Li et al., 2020). The main advantage of this setup is that individuals do not need to wear any devices; instead, existing Wi-Fi signals are employed. As people move or breathe, these signals are affected, and the resulting changes are captured in the CSI data. The data are then sent to a computer for preprocessing, such as noise removal or dimension reduction, and then analyzed using machine learning or AI models for tasks like breathing tracking, fall detection, or gesture recognition (Abdelnasser, Youssef & Harras, 2015).
Methodology
This section presents the systematic review process used to search, screen, and evaluate applicable studies. This review investigates peer-reviewed articles from the past 5 years that use Wi-Fi CSI for contactless vital signs monitoring. To identify relevant contributions and summarize results, we examined published articles on AI and its associated fields were examined. The main aim of this review is to summarize methodologies, evaluate reported performance, and identify research gaps in the use Wi-Fi-based technologies for monitoring vital signs. To ensure the inclusion of the most relevant articles, we followed established guidelines set by Kitchenham & Charters (2007) and PRISMA (Page et al., 2021), as shown in the Appendix of this article. In addition, the detailed search procedure is outlined in the Appendix.
Research questions
The aim of the research questions is to identify a well-established plan to retrieve articles restricted only from the areas of consideration. Table 1 outlines the research questions identified in this article.
| No. | Research question | Motivation |
|---|---|---|
| RQ1 | What methods have been used in Wi-Fi sensing systems for non-invasive monitoring of vital signs such as heart rate and respiration rate? | To identify and classify the technical approaches used in Wi-Fi-based vital signs monitoring. |
| RQ2 | How reliable and effective are Wi-Fi signals for monitoring vital signs such as heart rate and breathing rate? | To assess the effectiveness of incorporating Wi-Fi signals to non-invasive health monitoring in real-world healthcare environments. |
| RQ3 | What are the main AI techniques which can enhance the accuracy and reliability of Wi-Fi health monitoring systems? | To explore the impact of incorporating AI to enhance the performance of the vital signs monitoring systems, so that they become reliable to be used for clinical and home use. |
| RQ4 | What are the key challenges, limitations, and research gaps in deploying Wi-Fi-based vital signs monitoring systems in clinical or home settings? | To identify the challenges and research gaps in the application of these technologies along with highlighting future research opportunities. |
Search strategy
To ensure a comprehensive and inclusive search of the literature, we developed a multi-layered keyword-based strategy using Boolean logic across six major databases: IEEE Xplore, ScienceDirect, SpringerLink, ACM Digital Library, Google Scholar, and ResearchGate. We focused on keyword searches in titles, abstracts, and keywords, which is appropriate given the topic’s engineering and computer science orientation. While PubMed and MeSH indexing are highly valuable for biomedical and public health research, many studies on Wi-Fi-based sensing and signal-level data processing are not indexed there. Therefore, we prioritized repositories that more comprehensively cover technical research. At the same time, we recognize the clinical relevance of our topic and the importance of including healthcare-related work. Although PubMed was not part of our main search strategy due to its limited coverage of wireless sensing technologies, we sought to compensate by using broader repositories such as Google Scholar and ResearchGate, which include research across both technical and medical disciplines. We also incorporated clinically related keywords, such as “heart rate,” “respiration rate,” “health monitoring,” and “patient monitoring,” to capture articles that bridge both fields. This approach helped us address the overlap between clinical applications and signal-level AI techniques. More details about the search logic, keywords used, and database selection are provided in Appendix.
Articles selection criteria
Choosing the right search terms is an important step in conducting a thorough and wide-ranging systematic review. In this study, we carefully selected search terms that included key concepts such as Wi-Fi signals and CSI. The goal was to strike a balance, not too generic to avoid unrelated articles and not too narrow to not miss related articles (Cooper et al., 2018). The primary keywords were derived from the research questions and refined through several iterations. Searches were then conducted using the six major databases mentioned earlier. A full list of search strings, keyword combinations, and databases searched as well as the overall search process are outlined in the Appendix.
Screening of articles
The results of the individual searches returned a total of 8,573 publication records: (IEEEXplore = 5,473, Springer Link = 250, ScienceDirect = 1,412, Google Scholar = 312, ACM Digital Library = 576, ResearchGate = 550). Following title and abstract screening, and the application of our inclusion/exclusion criteria (Table S3), 45 studies were included in the final analysis. A comprehensive description of the screening and exclusion process is available in the Appendix, along with figures and tables showing study selection by database, timeline, and final inclusion outcomes.
Taxonomy for study categorization and quality assessment
-
Taxonomy table: to facilitate comparative analysis, with classification dimensions (see Table 2).
Sensing technique: indicates if the study was relying on extracting CSI amplitude, phase, or both.
Use case: describes the health parameter being monitored by the study, such as respiration rate, heart rate, and sleep apnea.
AI integration level: specifies the degree of AI involvement, ranging from no AI integration to traditional machine learning or deep learning approaches.
Evaluation: defines the complexity of the environment in which the system was tested, including the number of people considered and whether the system was running in real-time.
Metrics reported: lists the metrics used to evaluate the system, including Mean Absolute Error (MAE), accuracy, recall, precision, specificity, and F1-score.
| Study | Sensing technique | Use case | AI integration level | Evaluation context | Metrics reported |
|---|---|---|---|---|---|
| Yu et al. (2021) | Amplitude and phase | Sleep stage | Deep learning | Single-person, Real-time | MAE, Accuracy, Recall, Precision, F-score |
| Bao et al. (2023) | Amplitude and phase | Respiration rate | Machine learning | Single-person, Real-time | MAE, Accuracy |
| Khan et al. (2023) | Amplitude and phase | Respiration rate | Machine learning | Single-person | Accuracy |
| Kumar et al. (2022) | Amplitude and phase | Respiration rate and heart rate | Deep learning and machine learning | Single-person | Accuracy |
| Zhang et al. (2024) | Amplitude and phase | Respiration rate | Machine learning | Multi-person | Accuracy |
| Guo et al. (2023) | Amplitude and phase | Respiration rate | Machine learning | Single-person, Real-time | MAE |
| Kontou, Smida & Anagnostou (2024) | Amplitude | Respiration rate | Deep learning | Single-person | MAE, Accuracy |
| Hu et al. (2023) | Amplitude and phase | Respiration rate | Deep learning | Multi-person, Real-time | MAE, Accuracy |
| Armenta-Garcia et al. (2021) | Amplitude | Respiration rate | Machine learning | Single-person, Real-time | Accuracy, Recall, Precision, Specificity, F-score |
| Mosleh et al. (2022) | Amplitude and phase | Respiration rate | Deep learning | Single-person | Accuracy, Recall, Precision, Specificity, F-score |
| Armenta-Garcia et al. (2023) | Amplitude | Respiration rate and heart rate | Machine learning | Single-person | Accuracy, Recall, Precision, Specificity, F-score |
| Yang et al. (2021) | Amplitude and phase | Sleep Apnea | Deep learning | Single-person, Real-time | Accuracy, Recall, Precision, F-Score |
| Zhang et al. (2023) | Amplitude | Respiration rate and heart rate | No AI | Single-person, Real-time | Accuracy |
| Zhang et al. (2019) | Phase | Respiration rate | No AI | Multi-person | Accuracy |
| Wang, Yang & Mao (2020b) | Phase | Respiration rate and heart rate | No AI | Multi-person | MAE |
| Liu et al. (2021) | Amplitude | Respiration rate | No AI | Single-person | MAE |
| Hussain et al. (2021) | Amplitude and phase | Respiration rate | No AI | Single-person, Real-time | MAE |
| Wang, Yang & Wang (2022) | Amplitude and phase | Respiration rate | No AI | Single-person, Real-time | Accuracy |
| Qiu et al. (2022) | Amplitude and phase | Respiration rate | No AI | Multi-person, Real-time | MAE |
| Xie et al. (2022) | CSI ratio (Amplitude and phase) | Respiration rate | No AI | Single-person, Real-time | MAE |
| Li et al. (2021) | Amplitude and phase | Respiration rate | No AI | Single-Person | MAE |
| Wang et al. (2020) | Amplitude | Respiration rate | No AI | Multi-person | Accuracy |
| Sun, Bian & Li (2024) | Amplitude and phase | Respiration rate | No AI | Single-person | MAE, Accuracy |
| Zhuo et al. (2023) | Amplitude and phase | Respiration rate | No AI | Single-person | Accuracy |
| Alzaabi, Arslan & Polydorides (2024) | Amplitude | Respiration rate | No AI | Single-person | MAE |
| Zeng et al. (2019) | Amplitude and phase | Respiration rate | No AI | Single-person, Real-time | Accuracy |
| Wang & Liu (2024) | Amplitude | Respiration rate | No AI | Single-person, Real-time | Accuracy |
| Zeng et al. (2020) | Amplitude | Respiration rate | No AI | Multi-person | MAE |
| Dou & Huan (2021) | Amplitude and phase | Respiration rate | No AI | Single-person | MAE |
| Wang & Sun (2022) | Phase | Respiration rate | No AI | Single-person, Real-time | Accuracy |
| Peng et al. (2024) | Amplitude | Respiration rate | No AI | Single-person, Real-time | MAE |
| Atif et al. (2022) | Amplitude | Respiration rate | No AI | Single-person, Real-time | Accuracy |
| Guo et al. (2023) | Amplitude and phase | Respiration rate | No AI | Single-person | MAE, Accuracy |
| Gao et al. (2020) | Amplitude and phase | Respiration rate | No AI | Multi-person | Accuracy |
| Gui et al. (2023) | Amplitude | Respiration rate | No AI | Single-person | MAE |
| Gu et al. (2019) | Amplitude | Respiration rate and heart rate | No AI | Single-person, Real-time | MAE, Accuracy |
| Guo et al. (2021) | Amplitude and phase | Sleep Apnea | No AI | Single-person | Accuracy |
| Wang, Yang & Mao (2020c) | Amplitude and phase | Respiration rate | No AI | Single-person, Real-time | MAE, Accuracy |
| Guan et al. (2023) | Phase | Respiration rate | No AI | Multi-person | Accuracy |
| Ali et al. (2023) | Amplitude | Respiration rate | No AI | Single-person, Real-time | MAE |
| Zhang et al. (2022) | Amplitude and phase | Respiration rate and heart rate | No AI | Single-person | Accuracy |
| Li et al. (2020) | Amplitude and phase | Respiration rate | No AI | Single-person, Real-time | None |
| Yin et al. (2022) | Amplitude | Respiration rate | No AI | Multi-person, Real-time | MAE |
| Khamis et al. (2020) | Amplitude and phase | Respiratory cycle | No AI | Single-person, Real-time | MAE |
| Zhuo, Zhong & Zhuo (2022) | Amplitude and phase | Respiration rate | No AI | Single-person, Real-time | Accuracy |
Table 3 assesses the quality of each study using seven criteria. Sample size defines the size of the dataset used. Validation method reflects the process used to train and test the data in AI studies, and how vital signs ground truth was obtained in non-AI articles. Benchmarking indicates whether the study compared its performance to previous work. Dataset, code, and algorithms availability, notes whether any of these resources are publicly accessible or included in the article. Reproducibility assesses how replicable the system’s performance is, considering factors such as dataset availability and the sufficiency of the data provided. Measurement method specifies the device, sensor, or method used to identify the ground truth data. Finally, overall quality ranks the study into one of three levels based on the information provided.
| Study | Sample size | Validation method | Benchmarking | Dataset, Code, & Algorithms availability | Reproducibility | Measurement method | Overall quality |
|---|---|---|---|---|---|---|---|
| Yu et al. (2021) | 12 | 64–36 split | Yes | None | Moderate | PSG system | Moderate |
| Bao et al. (2023) | 5 | 10-fold cross-validation |
No | None | Moderate | Respiration band | Moderate |
| Khan et al. (2023) | 1 | 80–20 split, 10-fold cross-validation | No | None | Moderate | Not mentioned | Low |
| Kumar et al. (2022) | 84 | cross-validation | Yes | None | Moderate | Oximeter | High |
| Zhang et al. (2024) | 12 | 70–30 split | No | None | Moderate | Wi-side | Moderate |
| Guo et al. (2023) | Not mentioned | Wearable Sensor | No | None | Moderate | Not mentioned | Low |
| Kontou, Smida & Anagnostou (2024) | 1 | 72% training, 18% validation, and 10% testing | Yes | None | Moderate | Not mentioned | Moderate |
| Hu et al. (2023) | 8 | 70–30 split | No | None | Moderate | Neulog respiration monitor belt logger sensor NUL-236, Pulse oximeter | Moderate |
| Armenta-Garcia et al. (2021) | 6 | 10-fold cross-validation | No | Algorithms | Moderate | Metronome | Moderate |
| Mosleh et al. (2022) | 1 | 10-fold cross-validation | No | Dataset (https://doi.org/10.18434/mds2-2963) | High | RespiPro: Calibrated breathing manikin | Moderate |
| Armenta-Garcia et al. (2023) | 17 | 10-fold cross-validation | No | Dataset, Code (https://github.com/AlbanyArmenta0711/WiFi-CSI-MiningTool) | High | Metronome + Triaxial Accelerometer for Breathing Rate, Polar H9 Sensor for Heart Rate | High |
| Yang et al. (2021) | Not mentioned | Uknown | No | None | Low | Simulated patterns | Low |
| Zhang et al. (2023) | 10 | Wearable sensor | Yes | None | Moderate | Accelerometer, pulse oximeter | Moderate |
| Zhang et al. (2019) | 8 | Controlled breathing | No | None | Moderate | Metronome | Moderate |
| Wang, Yang & Mao (2020b) | 4 | Wearable sensor | No | None | Moderate | Neulog Respiration Monitor Belt logger sensor NUL-236, Pulse Oximeter | Low |
| Liu et al. (2021) | 8 | Wearable sensor | No | None | Moderate | Neulog Respiration Monitor Belt logger sensor NUL-236 | Moderate |
| Hussain et al. (2021) | 1 | Manual counting | No | None | Low | Manual Counting | Low |
| Wang, Yang & Wang (2022) | Not mentioned | Wearable sensor | No | None | Moderate | HKH-11C Digital Respiration Wave Sensor | Low |
| Qiu et al. (2022) | Not mentioned | Controlled breathing | Yes | Algorithms | Moderate | Metronome | Moderate |
| Xie et al. (2022) | 1 | Wearable sensor | Yes | None | Moderate | Respiration band | Moderate |
| Li et al. (2021) | 8 | Public dataset | Yes | Dataset (https://doi.org/10.7910/DVN/X7AYXQ) | High | PSG data | High |
| Wang et al. (2020) | 12 | Controlled breathing | Yes | Algorithms | Moderate | Metronome | Moderate |
| Sun, Bian & Li (2024) | 9 | Wearable sensor | No | None | Moderate | Lepu Medical PalmECG PC-80D | Moderate |
| Zhuo et al. (2023) | 11 | Controlled breathing | Yes | None | Moderate | Metronome | Moderate |
| Alzaabi, Arslan & Polydorides (2024) | 1 | Wearable sensor | Yes | Dataset (doi.org/10.21227/d7d1-sg82) | High | Neulog Respiration Monitor Belt logger sensor NUL-236 | High |
| Zeng et al. (2019) | 12 | Wearable sensor | Yes | None | Moderate | Neulog Respiration Monitor Belt logger sensor NUL-236 | Moderate |
| Wang & Liu (2024) | Not mentioned | Wearable device | No | None | Moderate | Not mentioned | Low |
| Zeng et al. (2020) | 21 | Wearable sensor | Yes | None | Moderate | Neulog Respiration Monitor Belt logger sensor NUL-236 | Moderate |
| Dou & Huan (2021) | Not mentioned | Wearable sensor | Yes | None | Moderate | Neulog Respiration Monitor Belt logger sensor NUL-236 | Moderate |
| Wang & Sun (2022) | Not mentioned | Wearable sensor | No | None | Moderate | HKH-11C Digital Respiration Wave Sensor | Low |
| Peng et al. (2024) | 5 | Controlled breathing | Yes | None | Moderate | Metronome | Moderate |
| Atif et al. (2022) | 5 | Non-wearable sensor | Yes | None | Moderate | Beddit | Moderate |
| Guo et al. (2023) | 11 | Controlled breathing | Yes | None | Moderate | Metronome | Moderate |
| Gao et al. (2020) | 3 | Controlled breathing | Yes | Algorithms | Moderate | Metronome | Moderate |
| Gui et al. (2023) | 15 | Wearable device | Yes | None | Moderate | Phone attached to the sleeper’s chest recording breathing audio | Moderate |
| Gu et al. (2019) | 5 | Controlled breathing | Yes | None | Moderate | Simulated Patterns | Moderate |
| Guo et al. (2021) | 5 | Wearable device | No | None | Moderate | Accelerometer | Moderate |
| Wang, Yang & Mao (2020c) | Not mentioned | Wearable sensor | Yes | Algorithms | Moderate | Neulog Respiration Monitor Belt logger sensor NUL-236 | Moderate |
| Guan et al. (2023) | 5 | Wearable sensor | Yes | Algorithms | Moderate | HKH-11C Digital Respiration Wave Sensor | Moderate |
| Ali et al. (2023) | 5 | Non-wearable sensor | No | None | Moderate | Xethru X4M200 Respiration sensor | Moderate |
| Zhang et al. (2022) | 2 | Non-wearable sensor | No | None | Moderate | RestOn Smart Sleep Monitor | Moderate |
| Li et al. (2020) | 19 | Controlled breathing | No | None | Moderate | Simulated Patterns | Low |
| Yin et al. (2022) | 10 | Manual counting | No | None | Moderate | Manual Counting | Low |
| Khamis et al. (2020) | 1 | Non-wearable sensor | Yes | None | Moderate | Xethru X2-M200 Respiration Sensor | Moderate |
| Zhuo, Zhong & Zhuo (2022) | 11 | Controlled breathing | No | None | Moderate | Metronome | Moderate |
Data extraction and analysis
After the final primary studies that met the quality assessment standards were identified, data were extracted to help answer the research questions. These studies were organized into two comparative tables: one focusing on AI-based healthcare monitoring using CSI, and the other on deterministic CSI-based healthcare monitoring systems. In both tables, the first three columns summarize the essential details of each publication.
In both tables, the “Estimation Method” column refers to the fundamental algorithms or techniques used for to evaluate the data. The “Preprocessing Phase” column identifies the first steps that data undergoes before being fed into the system. The approach used to ensure that the credibility of study results is presented under “Validation Strategy.” The “Dataset” column details the source of the data, while the “Results” column summarizes the main conclusions of the research. The “Limitations” column points to the restrictions or difficulties encountered during the study. This table structure facilitates a systematic comparison of various strategies in CSI-based monitoring across various applications.
Review of existing literature
CSI-based healthcare monitoring (AI-based approach)
Tables 4 and 5 present a comparative overview on how researchers have leveraged Wi-Fi CSI to detect and measure crucial physiological parameters such as respiration and heart rates. Table 4 contain articles utilizing AI-based methods and Table 5 includes those employing non-AI techniques. With this division, we can observe the evaluation of CSI-based vital sign monitoring from traditional signal processing approaches to more advanced machine learning algorithms. By examining these studies, we gain insights into the accuracy of non-invasive, contactless health monitoring systems and can compare the results achieved using both non-AI and AI methods.
| Ref. | Author, Year | Article type | eHealth objective | Estimation method | Preprocessing phase | Validation strategy | Dataset | Results | Limitations |
|---|---|---|---|---|---|---|---|---|---|
| Yu et al. (2021) | Yu et al., 2021 | Journal (IEEE) | Sleep stage monitoring in home environments |
CNN-BiLSTM with CRF | CSI ratio calculation, MRC-PCA fusion, Doppler-MUSIC for body movement detection |
Experiments with 12 subjects over 19 nights |
Collected by authors | 81.8% accuracy for four-stage sleep classification |
Only applicable to single person situations, Wi-Fi devices need to be placed in specific positions, can be influenced by changes in the environment, and cannot identify specific sleep disorders |
| Bao et al. (2023) | Bao et al., 2023 | Journal (IEEE) | Contactless respiration monitoring for remote healthcare | Support Vector Machine (SVM) | Phase flipping detection, antenna and subcarrier selection and discrete wavelet transform (DWT) | Five subjects participated in the experiments. The distance between the transmitter and receiver was 2.5 m. | Collected by authors | The framework reached an average accuracy of around 91.2% | Lacks the feature of monitoring the heart rate, does not recognize multiple people, and has a low accuracy in Non-Line of Sight (NLOS) |
| Khan et al. (2023) | Khan et al., 2023 | Journal (IEEE) | Decision support for patient respiration in hospital settings | ML classification and regression processes | DC offset removal, smoothing, bandpass filtering, Principal Component Analysis (PCA) | K-fold cross-validation (10-fold) |
Collected by authors | Fine Tree model: 96.9% accuracy for multi-class, 95.8% for binary classification | Single subject data, short data collection period, no real-world testing, and cannot support multiple people monitoring. |
| Kumar et al. (2022) | Kumar et al., 2022 | Journal (SpringerLink) |
Activity-aware vital signs tracking in smart homes | CNN for breathing rate and heart rate prediction and SVM with various kernels | CSI data extraction, complex data separation into real and imaginary parts | Experiments with 84 volunteers in four different positions (sleeping, sitting, standing, walking) | Collected by authors | Best accuracy with CNN and SVM 98.46% for sleeping position | It is only applicable in indoor environments, there may be problems with the recognition of multiple subjects, and there is no assessment of the speed of work. |
| Zhang et al. (2024) | Zhang et al., 2024 | Journal (ACM) | Multi-person respiration monitoring in residential settings | PCA, Density-Based Spatial Clustering of Applications with Noise (DBSCAN) clustering, and Autocorrelation | PCA-based denoising, and K-Means-based DBSCAN | Experiments with 12 participants in various scenarios | Collected by authors | 98% accuracy at 7 m distance with 5 m Line of Sight (LOS) | Affected by body motions, a smaller number of people that can be tracked simultaneously, and low sensing sensitivity with some smart devices |
| Guo et al. (2023) | Guo et al., 2023 | Journal (ACM) | Fine-grained respiration analysis in home/clinical environments | Multi-antenna CSI-Subpopulation Genetic algorithm, and Mixed Cluster Gaussian-Hidden Markov Model |
Data segmentation, interpolation, and subcarrier selection | Experiments with multiple participants in various scenarios, and comparing with respiration monitor belt | Collected by authors | Mean absolute error of respiration rate approximately 0.1 brpm, average UPD around 1.2 | It declines with distance, works only inside, and does not consider monitoring of multiple people, or number of participants. |
| Kontou, Smida & Anagnostou (2024) | Kontou et al., 2024 | Journal (IEEE) | Respiration rate monitoring in small home spaces | Principal Component Analysis (PCA) for subcarrier selection, and Artificial Neural Network (ANN) for respiration frequency detection | Hampel filter, smoothening filter, and detrending, normalization | Experiments at different distances (up to 2 m), compared to ground truth from wearable sensor | Collected by authors | Average error of 4.7% in breathing rate estimation compared to FFT method across 20 measurement datasets |
The accuracy was only tested for single person and not beyond 2 m, offline processing, not in real time, and the targets were non-moving; accuracy drops as the target moves. |
| Hu et al. (2023) | Hu et al., 2023 | Conference article (ACM) | Multi-person respiration monitoring in crowded indoor areas | Near-field domination effect, Sparse Recovery Algorithm (SRA), and Temporal Convolutional Network (TCN) based autoencoder | Data transformation pipeline including segmentation, resampling, transformation, and normalization | Experiments with eight subjects for respiration monitoring | Collected by authors | Respiration monitoring: Mean error < 1 brpm | Subjects need to be in the near field of their Wi-Fi devices (within ~0. 2 m), the performance may decrease with the distance between the subject and the device, it can be influenced by changes in the dynamics and layout of the environment, and specific Wi-Fi hardware and software modifications are necessary. |
| Armenta-Garcia et al. (2021) | A. Armenta-Garcia et al., 2021 |
Journal (IEEE) | Real-time contactless respiration monitoring | Support Vector Machines (SVM), K-Nearest Neighbor (K-NN) and Quadratic Discriminant Classifier (QDC) | Hampel, Savitzky-Golay, and Band-pass filters | 10-fold cross- validation. Participants were asked to control their breath according to a device. | Collected by authors | Accuracy K-NN: 99.09% QDC: 99.65% SVM: 99.21% |
The evaluation of the study was done on stationary data instead of using data from different subjects with different body types. Moreover, it lacks heart rate estimation. |
| Mosleh et al. (2022) | S. Mosleh et al., 2022 | Journal (IEEE) | AI-based respiratory pattern classification | Long Short-Term Memory (LSTM) | FFT and normalization | Confusion Matrix Accuracy, Precision, Recall, Specificity, and F1-score | Collected by authors (https://doi.org/10.18434/mds2-2963) | Accuracy: 99.97% in perfect settings |
The evaluation was conducted under controlled conditions with significant hardware setup, limiting its applicability in diverse scenarios. Additionally, BreatheSmart categorizes data into a just nine classes. not provide measurements of respiration rate. |
| Armenta-Garcia et al. (2023) | Jesus A. Armenta-Garcia et al., 2023 | Journal (ScienceDirect) | Multi-parameter estimation for respiration and heart rate | Support Vector Machines (SVM), K-Nearest Neighbor (K-NN) and Quadratic Discriminant Classifier (QDC) | Hamel, Savitzky-Golay, band-pass, FFT, and DWT | Accuracy, Recall, Precision, Specificity, and F1-score | Collected by authors (https://github.com/AlbanyArmenta0711/WiFi-CSI-MiningTool) | Accuracy: Breathing rate: K-NN: 99.18% QDC: 91.35% SVM: 90.71%, Heart Rate: QDC: 55% SVM: 55.06% |
Breathing rate is categorized to limited number of classes with steps of 2. Heart rate is categorized to three classes only giving high-level overview, but not suitable for clinical or remote monitoring use. In addition, the heart rate estimation yielded very poor results. |
| Yang et al. (2021) | X. Yang et al., 2022 | Article (SpringerLink) | Sleep apnea detection in clinical and home settings | Back-Propagation (BP) neural network to learn and map features (mean, variance, range, quartile) | Phase error elimination using linear fitting; noise cancellation with median absolute deviation; wavelet denoising (‘db3’ basis); subcarrier selection based on variance | Accuracy, Precision, Recall, Macro F1- score | Dataset composed of 450 sets of data for each state | Accuracy rate over 95.6% for detecting sleep apnea. |
Does not address multiple-person status. Some confusion between apnea and unmanned states. Lacks user interface for alarms and trigger notifications. |
| Ref. | Author, year | Article type | eHealth objectives | Estimation method | Preprocessing phase | Validation strategy | Dataset | Results | Limitations |
|---|---|---|---|---|---|---|---|---|---|
| Zhang et al. (2023) | Zhang et al., 2023 | Journal (ResearchGate) |
Breathing and heart rate monitoring during sleep | Fast Fourier Transform (FFT) |
Subcarrier selection, and Data denoising using Hampel filter | Experiments with 10 volunteers in different sleeping postures | Collected by authors | 96.887% accuracy for breathing rate 94.708% accuracy for heart rate | Cannot retrieve the actual waveform of the heartbeat. The article Discards periods with interfering sleep activities and the study is confined to single person situations |
| Zhang et al. (2019) | Zhang et al., 2019 | Journal (ResearchGate) | Contactless breath rate estimation across scenarios | Fast Fourier Transform (FFT) |
Hardware and software correction for phase distortions | Experiments with eight participants in different scenarios | Collected by authors | Over 99% median accuracy in most scenarios for breath rate estimation | Performance declines in NLOS situations and is restricted to a 4 m range because of lost packets, in addition, data is not updated in real time. |
| Wang, Yang & Mao (2020b) | Wang et al., 2020 |
Journal (Google Scholar) |
Multi-subject respiratory and HR monitoring in indoor environments | Peak Detection and FFT |
Environment detection, data calibration and subcarrier selection | Experiments with four persons over 3 months in various indoor environments |
Collected by authors | Median error of 0.25 brpm for breathing rate and 1.19 beats per minute (bpm) for heart rate | Performance drops with distance and through-wall conditions; furthermore, the need for a directional antenna for heart rate monitoring increases the system’s complexity and cost. |
| Liu et al. (2021) | Liu et al., 2021 |
Journal (Google Scholar) | Respiration rate monitoring in indoor spaces | Fast Fourier Transform (FFT) |
DBSCAN-based clustering, threshold selection | Experiments with eight subjects in various indoor scenarios | Collected by authors | Average respiration rate error of 0.31 brpm in NLoS scenarios | Does not function when there are other human movements, not effective when there are multiple targets, and operates only with single antenna smartphones. |
| Hussain et al. (2021) | Hussain et al., 2021 | Journal (IEEE) | Monitoring driver/passenger respiration in parked vehicles | Peak Detection | Conjugate Multiplication, Phase Sanitization, and Butterworth Filtering | Experiments in a stationary vehicle with an adult volunteer, and compared to manual breath counting | Collected by authors | Median percentage errors of 8.5% for phase and 7.4% for amplitude with three antennas | Valid only for cases when the vehicle is parked, tested only on adult subjects, needs a specific antenna setup, and the performance depends on the position of the passengers. |
| Wang, Yang & Wang (2022) | Wang et al., 2022 |
Journal (IEEE) | Accurate respiratory rate estimation using Wi-Fi in labs | Autocorrelation and BNR-based selection |
Motion detection, Exponentially Weighted Moving Average (EWMA), CSI ratio calculation | Experiments in a laboratory setting, compared with contact respiratory sensor | Collected by authors | Over 97% accuracy for respiratory rate estimation using CSI ratio model | Applicable only to one-person cases, only proved in laboratories, higher complexity of algorithms, may decrease performance with the growth of distance between antennas |
| Qiu et al. (2022) | Qiu et al., 2022 |
Journal (IEEE) | Breath monitoring in high-dynamic environments | Power Delay Profile and Least Square Method | Wire Direct Connection-based denoising and Phase offset compensation |
Experiments in lab with multiple scenarios and moving subjects | Collected by authors | Less than 0.5 brpm detection error in high-dynamic environments | Must connect the wires directly to TX/RX pins, applicable only to a stationary target subject, the performance may decrease in some extreme conditions, the system has been tested only in a laboratory environment. |
| Xie et al. (2022) | Xie et al., 2022 |
Journal (IEEE) | Lab-based single person respiration tracking at varied distances | Principal Component Analysis, Doppler Frequency Extraction |
PCA, Human presence detection, Respiratory signal detection | Experiments in lab with different distances and scenarios | Collected by authors | Less than 0.7 brpm error within 6 m range, velocity measurement error less than 0.4 cm/s | Single person only, cannot operate through the wall, may raise privacy issues, never tested in real life settings |
| Li et al. (2021) | Li et al., 2021 |
Journal (IEEE) | Breathing rate estimation for sleep monitoring validation | Power Spectral Density (PSD) detection | Amplitude calibration, Phase calibration, and Delay domain filtering | Experiments using public dataset with ground truth from polysomnography | Collected by authors |
86% of estimation errors below 0.5 brpm for breathing rates between 0.2–0.3 Hz (https://doi.org/10.7910/DVN/X7AYXQ) | Applicable only to single-person cases, not verified in actual-time or actual-world scenarios, and needs special Wi-Fi hardware configuration. |
| Wang et al. (2020) | Wang et al., 2020 |
Journal (IEEE) | Indoor respiratory sensing and people identification | An adaptive subcarrier combination method that boosts the Signal-to-Noise Ratio (SNR) of breathing signals | Adaptive signal processing techniques to combine subcarriers and links for optimal breathing signal enhancement. | Experiments conducted in an indoor lab setting and a car setting, with 12 participants | Collected by authors | Achieved over 86% accuracy for people counting and 85.78% accuracy for people recognition. | The system does not assume a priori how many people or different breathing rates there are, the system is set for static conditions, it would not be very efficient in a moving car because of the vibrations. |
| Sun, Bian & Li (2024) | Sun et al., 2024 |
Journal (ResearchGate) | Vital sign monitoring in semi-realistic indoor scenarios | Discrete Wavelet Transform, FFT |
Down sampling, CSI ratio calculation, and SG filtering | Experiments with nine participants in two real-world scenarios (meeting room and dormitory) | Collected by authors | 96.8% average accuracy, 0.8 brpm median error |
Distance degrades performance and it only works indoors. |
| Zhuo et al. (2023) | Zhuo et al., 2023 | Journal (IEEE) | Breath monitoring during sleep in varied positions | Projection model, PCA-VMD fusion, and Peak detection | CSI ratio extraction, and Savitzky-Golay filtering | Experiments with 11 volunteers in six different sleep positions | Collected by authors | >99% median accuracy across all sleep positions |
Works only for indoor spaces, problems with several people, and does not consider the question of real-time data processing. |
| Alzaabi, Arslan & Polydorides (2024) | Alzaabi et al., 2024 | Journal (IEEE) | Laboratory-based respiratory rate monitoring for clinical feasibility | Discrete Wavelet Transform, Principal Component Analysis, and Peak detection | Interpolation, down sampling, and Discrete Wavelet Transform filtering | Experiments with one participant | Collected by authors | Limits of agreement of [−1.29, 1.06] BrPM with −0.11 BrPM bias for 60-s window (doi.org/10.21227/d7d1-sg82) | Restricted to a laboratory setting, only one participant, the subject is quasi-stationary and does not consider real-time processing. |
| Zeng et al. (2019) | Zeng et al., 2019 |
Journal (ACM) | Extended-range non-contact respiration monitoring | PCA for subcarrier selection, and autocorrelation for respiration rate estimation |
CSI ratio calculation, and Savitzky-Golay filter for smoothing | Experiments with 12 participants in various scenarios | Collected by authors | Sensing range increased to 8–9 m with 98% detection rate | Through-wall-twice: some difficulties are not solved, and multi-person sensing not addressed |
| Wang & Liu (2024) | Wang et al., 2024 |
Conference article (ACM) | Short-range respiration monitoring with sensitivity to breathing strength | Discrete Fourier Transform (DFT), and Fast Fourier Transform (FFT) | Down sampling, and mean subtraction | Experiments with multiple participants at different distances and breathing intensities | Collected by authors | Best accuracy at 10 cm distance; accuracy decreases with weak breathing | Highest accuracy at 10 cm range; decreases in the case of weak breathing; lacks provisions for monitoring multiple people, or the number of subjects. |
| Zeng et al. (2020) | Zeng et al., 2020 |
Journal (ACM) | Multi-person abnormal respiration event detection | Blind Source Separation (BSS) and Independent Component Analysis (ICA) | Savitzky-Golay filter to smooth the respiration signals and Cross-multiply and DACM algorithm to estimate the rotation direction of the respiration signals. | Recruiting 21 participants with a range of natural respiration rates, including some with similar rates | Collected by authors | Achieves a mean absolute respiration rate error of only 0.73 brpm even with four people present | The ICA method requires the number of persons as an input, but ICA cannot generally identify the actual number of source signals and While MultiSense can detect abnormal respiration events, it cannot identify which respiration pattern belongs to which person. |
| Dou & Huan (2021) | Chendan Dou and Hao Huan, 2021 | Journal (ResearchGate) | Non-contact respiratory rate detection across different home environments | Doppler spectral energy extraction, and peak detection for respiration rate | Random phase elimination, multipath decomposition, and STFT | Experiments in three indoor environments (living room, bedroom, balcony) | Collected by authors | Mean estimation errors of 0.16, 0.15, 0.14 brpm in three scenarios: over 90% of errors <0.4 brpm | Tested only one person use case, only works indoors, and does not support any real time functionality. |
| Wang & Sun (2022) | Yi Wang and Jianan Sun, 2022 | Conference article (IEEE) | Single-subject respiratory monitoring with improved signal modeling | CSI ratio model, FFT, and autocorrelation |
Random phase, and offset elimination using CSI ratio | Experiments at different distances with 30 tests at each distance | Collected by authors | Improved accuracy from 99.2% to 99.7% compared to original CSI ratio model | Higher computational cost and time and was tested only for one person and not for multiple people. |
| Peng et al. (2024) | Peng et al., 2024 |
Journal (IEEE) | Orientation-aware respiration monitoring in hall and lab conditions | Dominant Frequency-to-Amplitude Ratio (DFAR) for subcarrier selection, and Zero-Peak (ZP) detection | CSI ratio operation, and DC bias removal | Experiments in two environments (hall and laboratory) with five subjects at different orientations and distances | Collected by authors | Error less than 0.7 brpm for body orientations from 0 to 180°, nearly double the angle range compared to Fresnel zone model | Suitable for only one person environment, maximum sensing distance is up to 3. 5 m, performance decreases in through-wall scenarios more than 1 m, sensitive to large-scale people motion in the environment, and needs certain type of antennas |
| Atif et al. (2022) | Atif et al., 2022 |
Journal (ResearchGate) | Indoor respiration tracking across diverse real-life scenarios | Power Spectral Density (PSD) analysis after subcarrier selection and fusion | Hampel filter for outlier removal, and bandpass filtering | Experiments with five participants in different scenarios | Collected by authors | Maximum accuracy of 99.6% and minimum accuracy of 91.81% across different scenarios | Valid only for single subject cases, decreases with the distance between the subject and the devices, depends on the type of antennas used, can be influenced by the surrounding environment and multipath interference, and has only been tested in indoor conditions. |
| Guo et al. (2023) | Guo et al., 2023 |
Journal (IEEE) | Respiration monitoring and human identification using CSI in controlled indoor scenarios | CSI ratio model, Discrete Wavelet Transform (DWT), and fake peak removal method | Data interpolation, Savitzky-Golay filter, down sampling, and Hampel filter | Experiments with 11 participants in three scenarios | Collected by authors | Average absolute error of 0.1 brpm for respiration rate, 97.52% average accuracy for human identification across 11 users | Accuracy declines after intensive movements, depends on the position of the user relative to the devices, needs 4–6 breaths to identify the user, and is affected by the presence of other people with 1 m distance required, and the experiment was not conducted in various real-life scenarios. |
| Gao et al. (2020) | Gao et al., 2023 | Journal (IEEE) | Multi-person respiration monitoring using CSI-based Angle of Arrival (AoA) estimation | Two-dimensional Doppler-Angle of Arrival (AoA) map construction using super resolution method, followed by DBSCAN clustering | CSI calibration | Experiments with 1–3 persons, and, compared to metronome-guided breathing | Collected by authors | Accuracy of 98.8%, 98.4%, and 97.5% for 1, 2, and 3 persons respectively | It also does not take into consideration a person’s ability to move closer or further apart from each other and how this affects the respiration rates; the ability to separate close angles depends on data, time, length, and the number of antennas. |
| Gui et al. (2023) | L. Gui et al., 2023 | Journal (IEEE) | Sleep position-based respiration tracking in smart bedroom environments | Peak-to-Peak interval | Hampel and Butterworth low-pass filters | Tested in controlled environment with different sleeping positions | No dataset | 0.13 and 0.16 brpm for supine and prone, respectively |
The article does not take security into consideration and does not provide real-time data visualization graphs. Moreover, it lacks heart rate estimation. It takes only one subcarrier and does not utilize phase. |
| Gu et al. (2019) | Y. Gu et al., 2019 | Conference article (IEEE) | Breathing and heart rate monitoring during sleep using non-invasive CSI sensing | FFT-based method | Hampel, Butterworth band-pass, and FFT filters and Frensel diffraction-based setup | Tested with five participants and different sleeping positions | No dataset | - Breathing: AE: 0.575 brpm - Accuracy: 96.636% - Heart: AE: 3.9 bpm - Accuracy: 94.215% |
The results varied slightly based on the participant body type. AI is not used to enhance the accuracy of the breathing and heart rate estimations. In addition, it only takes amplitude from one subcarrier only, limiting the amount of information gathered from CSI. |
| Guo et al. (2021) | L. Guo et al., 2021 | Journal (IEEE) | Abnormal breathing rate detection in home-like environment | Number of Peaks | Conjugate multiplication, Hampel filter, FFT, and db4 wavelet decomposition | Experiments conducted on five volunteers with smartphone acetometer used to validate the system results | No Dataset | Average correlation of 80 and accuracy of 91.2% | The study focuses more on detecting whether the breathing rate is abnormal or not rather than estimating specific value. In addition, the proposed system does not work in real-time and does not take heart rate into consideration |
| Wang, Yang & Mao (2020c) | X. Wang et al., 2020 | Journal (IEEE) | Non-invasive respiration monitoring using CSI for static settings (e.g., home, car) | Peak-to-Peak interval | EWMA and Moving Average filter | Many experiments were conducted investigating different setups. NEULOG Respiration Sensor is used to get ground truth respiration rate | No dataset | Accuracy: 91.54% Median Error: 0.25 brpm |
The study does not test the system against different participants, which may affect the system performance with the body change. Moreover, the study lacks estimating heart rate and vital signs visualization. |
| Guan et al. (2023) | L. Guan et al., 2023 | Journal (IEEE) | Multi-subject respiration tracking using CSI-based clustering | FFT-based method | FFT Density-Based Spatial Clustering | Experiments conducted with five volunteers, using piezoelectric respiratory belt (HKH-11C) as respiration rate ground truth | Collected by authors | Accuracy: 97.04% | The study requires extra hardware to make use of four antennas. Moreover, the accuracy of the system drops significantly as the distance between the targets and transceivers increases. |
| Ali et al. (2023) | K. Ali et al., 2023 | Journal (IEEE) | Overnight respiration monitoring during sleep in residential environments | Number of Peaks | Butterworth Low-pass filter PCA Band-pass filter Median filter Exponential moving average filter Density-Based Spatial Clustering |
More than 550 h of experimentation data from five users. Xethru X4M200 Breath sensors was used as the ground truth respiration rate | No Dataset | Median error: 1.19 brpm |
Through experimentation it appeared that the activities done by other people while the user is sleeping affects the system performance. Furthermore, the error rates vary significantly throughout different sleeping postures and distance from the device. Additionally, subtle movements such as user turning over while sleeping would cause outages on the system where it is not able to detect any breathing movement. |
| Zhang et al. (2022) | R. Zhang et al., 2022 | Journal (IEEE) | Simultaneous breathing and heart rate detection in a simplified smart health monitoring setup | FFT-based method | Hampel, threshold-based segmentation, Discrete Wavelet Transform, and FFT | Experiments were conducted with different setups and two participants, one male and one female | No Dataset | Breathing rate: Accuracy: 96.1% |
The proposed system is not real-time; thus the heavy preprocessing might cause some issues when deploying the system to monitor in real time. Experiments were only conducted on two participants, so the system was not tested thoroughly. |
| Peak-to-Peak interval | The ground truth data was extracted from RestOn Smart Sleep Monitor | Heart Rate: | |||||||
| Accuracy: 94.3% | |||||||||
| Li et al. (2020) | Fangyu Li et al., 2020 | Journal (ScienceDirect) | COVID-19 symptom detection through respiratory tracking in home-isolation settings | Using Principal Component Analysis (PCA) to extract the respiration component, then applies a high-resolution spectrogram to estimate respiration rate | A Hampel filter is used to remove outliers and a bandpass filter to suppress noise | Following self-quarantine guidelines for COVID-19 patients, to evaluate the shortness of breath indicators, the participant pretends to have a shortness of breath between 20 and 22 s. | Collected by authors | Not much testing was done, authors just mention that preliminary results were satisfying | Training is on a small dataset and vital sign monitoring is limited to RR only. |
| Yin et al. (2022) | Y. Yin et al, 2021 | Journal (IEEE) | Real-time respiration tracking using smartphone and Wi-Fi signals in smart home applications | DWT was used to select subcarriers relevant to respiration activity, and FTT for respiration rate calculation | Hampel and moving average filters for noise reduction, and a bandpass filter to extract subcarriers with rich respiratory information. | Each participant was asked to breath for 10 min. For ground truth data, one observer visually counted the number of breaths. | Collected by authors | An error rate of 0.34 breaths per minute was recorded | The system faces challenges such as the “dead zone” issue, where sensing performance can degrade at certain locations |
| Khamis et al. (2020) | Abdelwahed Khamis et al., 2022 | Journal (ScienceDirect) | Hybrid Wi-Fi and UWB-based respiratory cycle and inhalation/exhalation monitoring | Processing techniques include mapping PD to chest displacement and a novel subcarrier filtering and selection method | Hampel filter for outlier removal, moving average filter for high-frequency noise reduction and Savitzky-Golay filter to smoothen the data | A real-world setup captured data from a single subject using Wi-Fi and UWB radar for ground truth. Breathing sessions lasted 10-15 min with specific exercises. The system’s performance was evaluated by timing errors in breath cycle estimation and inhalation/exhalation ratio accuracy. | Collected by authors | The system achieved a median timing error of less than 0.25 s | Small datasets which limit generalizability & the system requires calibration which involves a pre-defined breathing sequence to adapt the system to individual users and environmental conditions |
| Zhuo, Zhong & Zhuo (2022) | H. Zhuo et al., 2022 | Conference article (IEEE) | Accurate respiration estimation during sleep in controlled multi-position scenarios | Peak-to-Peak interval | Savitzky-Golay filtering for noise reduction; Hampel filter for DC component removal; Outlier removal; Wavelet denoising; Subcarrier selection based on variance | Experimental validation in different sleeping positions using a metronome as ground truth; Comparison of different weights for periodicity and variance. | Data collected from 11 people in various sleeping positions over 3 months | Achieved 97.25% accuracy for respiration rate estimation. Effective in various sleeping positions | Limited to single-person scenarios. |
| Does not include a user interface for real-life alerts. | |||||||||
| Limited to only respiration rate estimation. |
Armenta-Garcia et al. (2021) proposed BReML, a system that combines Fast Fourier Transform (FFT) method for estimating breathing rate with machine learning and compares three models: Support Vector Machines (SVM), K-Nearest Neighbor (K-NN), and Quadratic Discriminant Classifier (QDC). BReML filters CSI amplitude using Hampel, Savitzky Golay (SG), and Butterworth band-pass filters. Rather than using all subcarriers, it selects the 10 most sensitive ones to reduce computational power. FFT is then applied to extract additional features for the AI models, including an initial estimation of the breathing rate. Then Discrete Wavelet Transform (DWT) is also applied to generate extra features, which are fed into multiple classification models for comparison. The classification consists of five classes covering 12 to 20 breaths per minute (brpm) in steps of two. The proposed system achieved high accuracy, with 99.09%, 99.21%, and 99.65% for K-NN, SVM, and QDC, respectively. However, the system was not tested on subjects outside the training data and did not estimate the heart rate.
To extend the research in Armenta-Garcia et al. (2021) and estimate both breathing and heart rate, Armenta-Garcia et al. (2023) proposed a system following similar concept of Armenta-Garcia et al. (2021). However, they collected more data to train the system for heart and breathing rate estimation and made both the dataset and the system publicly available for further research. As for the class division, they divided respiration rate into five classes: <=10, 11–13, 14–16, 17–19, and >=20 with only three classes for heart rate: <= 60, 61–79, and >= 80. Nevertheless, the proposed system achieved an accuracy of 99.18%, 90.71%, and 91.35% using K-NN, SVM, and QDC, respectively, for breathing rate. On the other hand, the system did not perform well when estimating the heart rate with accuracy of 56.55%, 55.06%, and 55% for K-NN, SVM, and QDC, respectively. Additionally, the heart rate classification used only three broad categories with wide ranges, making it unsuitable for continuous health monitoring use.
Mosleh et al. (2022) explored employing two off-the-shelf routers in their experimental setup. They adopted a machine learning approach by introducing an innovative algorithm, BreatheSmart, which comprises seven layers that leverage the LSTM network. BreatheSmart processes both the phase and amplitude information of each subcarrier and subsequently assigns the data to one of the predefined respiration pattern classes. Data are acquired from three transmitting and three receiving antennas, utilizing all 56 subcarriers within the 2.4 GHz network spectrum. The results revealed BreatheSmart’s ability to correctly predict respiration pattern classification with up to 99.97% accuracy. However, the evaluation was conducted under controlled conditions, with significant hardware setup, limiting its applicability in diverse scenarios. Additionally, BreatheSmart does not provide specific measurements for respiration rate, because it categorizes data into a limited number of nine distinct classes.
To summarize, the articles in Table 4 all leverage AI classifiers to assign respiration rate to one of the predefined classes. Reference (Mosleh et al., 2022) stands out with an impressive accuracy of 99.97% using an LSTM-based model. Unlike other studies, it uses both CSI amplitude and phase for estimating the breathing rate, rather than relying on one only. In addition, it is the only study that does not use conventional filters, such as Hampel filter, to remove noise and outliers, relying only on FFT. However, it is noteworthy that the system was evaluated in a controlled environment with a breathing simulator, which yields constant patterns unlike human respiration. Moreover, the nine classes had varying steps, with some classes much further apart and no intermediate class. Both Armenta-Garcia et al. (2021) and Armenta-Garcia et al. (2023) used Hampel, Savitzky Golay, and band-pass filters and experimented with SVM, K-NN, and QDC. Despite this, Armenta-Garcia et al. (2021) achieved higher accuracy of 99.65% with QDC. Nevertheless, the study did not address heart rate estimation, whereas (Armenta-Garcia et al., 2023) attempted to estimate pulse rate but achieved poor results, with only 55.65% accuracy using K-NN.
Wi-Fi signal-based monitoring systems using a deterministic approach
Guan et al. (2023) advances takes breathing estimation in proposing a new method to estimate multi-person breathing rates simultaneously. The proposed system utilizes the variance of CSI amplitude to determine the most sensitive subcarrier across different antennas. FFT is then applied on the CSI phase to produce a frequency spectrum. To distinguish between different individuals, the study utilizes Density-Based Spatial Clustering to separate each person’s data, so that each cluster represents one individual. Thereby, the system finds the breathing rate of each person by identifying the maximum frequency within each cluster. The system demonstrated good performance, with a 97.04% accuracy; however, the accuracy drops significantly as the distance between the targets and transceivers increases. In addition, the study did not consider two individuals with the same breathing rate, so it categorizes them as one person.
Gui et al. (2023) explored a setup in which a router served as the TX and a PC equipped with three antennas functioned as the RX. They introduced a system designed to monitor respiration rate and detect sleep-related activities utilizing Wi-Fi CSI data. The system uses the peak-to-peak interval method to calculate respiration rates in the absence of movement, deriving the rate as 60 divided by the average of peak-to-peak intervals. To enhance accuracy, Gui et al. (2023) proposed a new dynamic subcarrier selection method and peak identification technique. Upon detecting an activity, the system suspends respiration rate monitoring to identify specific activities such as lying on the spine, prone, or in lateral positions. Upon settling into a new position, the system recalibrates by repeating the subcarrier selection process to ensure optimal selection for each posture. Experimental results demonstrated promising performance, with estimation errors of 0.13 and 0.16 breaths per minute for supine and prone sleeping postures, respectively. However, while the proposed system exhibited robust performance, it did not operate in real time and did consider multiple persons.
Guo et al. (2021) proposed a system for emergency detection based on three vectors: position, behavior, and breathing condition. Position refers to the patient’s location within the household. Behavior encompasses the patient’s movements, such as falling. Breathing indicates whether respiration is abnormal, including apnea, dyspnea, or tachypnea. Position and behavior data are derived from keypoint maps generated via a neural network algorithm trained using camera data sourced from the OpenPose library. Breathing condition, notably apnea detection, is determined using filtered CSI data via the DWT method. The system leverages both phase and amplitude components of the CSI data, as they offer complementary information. To construct the keypoint map, data are collected from two receivers positioned in different locations to ensure comprehensive coverage. Patient movement is required for accurate keypoint map generation, as the method relies on the dynamic component of the CSI. In tests involving the same volunteer and within the same room, the system achieved impressive results, accurately matching 80.7% of points exactly to the original keypoint maps, with 99.3% showing close alignment. Furthermore, apnea detection accuracy reached 91.2%. However, when tested with different volunteers who were not part of the neural network training or when obstructed by a wall, accuracy dropped significantly.
Overall, the articles in Table 5 relied on manual estimation of vital signs, implemented in one of three ways. First, the FFT method, as followed by Gu et al. (2019), Guan et al. (2023), Zhang et al. (2022), selects the frequency corresponding to the highest peak within the normal respiration or heart rate range. Second, peak counting over a specific interval, used by Guo et al. (2021), Ali et al. (2023), relies on identifying inhalation and exhalation phases, with each peak representing one breathing cycle. Third, the peak-to-peak interval method, conceptually similar to peak counting, calculates the average interval between consecutive peaks (time from one breath to the next). Dividing 60 by this average interval yields the number of breaths per minute. This method, followed by Gui et al. (2023), Wang, Yang & Mao (2020c), Zhang et al. (2022), has achieved the most success in estimating breathing rate; for instance, Gui et al. (2023) reported an average estimation error of 0.13 breaths per minute (brpm) in the supine position.
In addition to using common filters such as Hampel and Butterworth low-pass filters, Gui et al. (2023) also proposed a new subcarrier selection method based on the relative difference using FFT. They also introduced additional steps to remove false peaks. However, the system did not estimate heart rate or operate in real time, limiting its efficiency for real life use. Furthermore, Gui et al. (2023) did not account for multiple people breathing in the same room, unlike (Guan et al., 2023), which applied a clustering algorithm after FFT to group data corresponding to each individual. Although (Guan et al., 2023) achieved high accuracy of 97.04%, the system could misclassify multiple people with the same breathing rates as one person.
Regarding heart rate estimation, both Gu et al. (2019) and Zhang et al. (2022) went for FFT-based method for estimating the heart rate. Both studies used Hampel filter and achieved an accuracy of 94% even though (Gu et al., 2019) used Butterworth band-pass filter and only amplitude while (Zhang et al., 2022) used DWT and considered both phase and amplitude. Still, Zhang et al. (2022) managed to achieve a slightly better result of 94.3%.
Discussion
While preparing this literature review, no standardized performance metrics were reported by all research articles, as highlighted in Table 2. Less than half of the AI-based articles included recall, precision, and F1-score, while the rest did not. Besides four non-AI articles that reported both accuracy and MAE, half of the others reported only accuracy, and the other half reported only MAE. This poses a major challenge for proper comparative analysis. In this article, we propose that the gold standard for performance metrics should be accuracy and MAE for all articles, with recall, precision, and F1-score included for AI-based research. To address this challenge, we selected accuracy as the primary performance metric for all articles, given its prevalence, and considered MAE as the secondary performance metric when accuracy was not reported. It is also worth noting that all articles discussed vital signs either in stable conditions, where heart rate and breathing rate are not changing rapidly, or in cases of apnea detection, addressing specific patterns of sleep apnea.
Principal findings
Across the included studies, approximately 70% were classified as having moderate quality, primarily due to testing with a sufficient sample size and using reliable methods to obtain ground truth, such as the Neulog Respiration Monitor Belt logger sensor (NUL-236), rather than relying on error-prone methods like manual counting. High-quality studies also increased reproducibility by using public datasets, sharing their dataset or code, and comparing their systems’ performance to previous studies. In contrast, low-quality studies typically did not compare their results to previous studies, did not report their sample size or used minimal samples, or employed less accurate methods for measuring ground truth. None of the articles attempted to validate performance against publicly available datasets. Non-AI studies more often compared their system performance with older studies; over 55% of non-AI articles did so, compared to only 25% of AI articles. Out of the 45 reviewed articles, only four shared their dataset, and just one shared the code as well. More than 75% of the studies did not disclose algorithms, code, or data, highlighting the need for stronger community standards around openness in CSI-based vital signs monitoring.
As presented in Table 2, the taxonomy of studies in CSI-based vital signs sensing reveals key trends and observations that highlight the current state of the field and provide insight for future of research in this field. In terms of the sensing techniques, using both amplitude and phase is the most common approach, especially in AI-based studies monitoring respiration rate, as it provides a holistic view and enables AI to analyze complex patterns in both amplitude and phase simultaneously. Deterministic approaches more commonly use amplitude alone for estimating heart rate and respiration rate and phase achieved similar accuracies of 94.5% and 94.3%, respectively. Conversely, an AI-based study using both amplitude and phase showed higher accuracy (98.5%) for heart rate estimation. Other applications, such as predicting sleep stage and sleep apnea, also utilized both amplitude and phase. Studies predicting heart rate and breathing rate with AI only investigated a single-person context, whereas deterministic studies researched various contexts, including multi-person, single-person, and single-person in real time. Regarding reported metrics, only four deterministic articles reported both MAE and accuracy; the remainder reported either MAE or Accuracy only. Among AI studies, only one did not report accuracy, while 41.66% reported accuracy, recall, precision, and F1-score, with the rest reporting either accuracy, MAE, or both. Figure 2 displays a graphical summary of the categorization of studies.
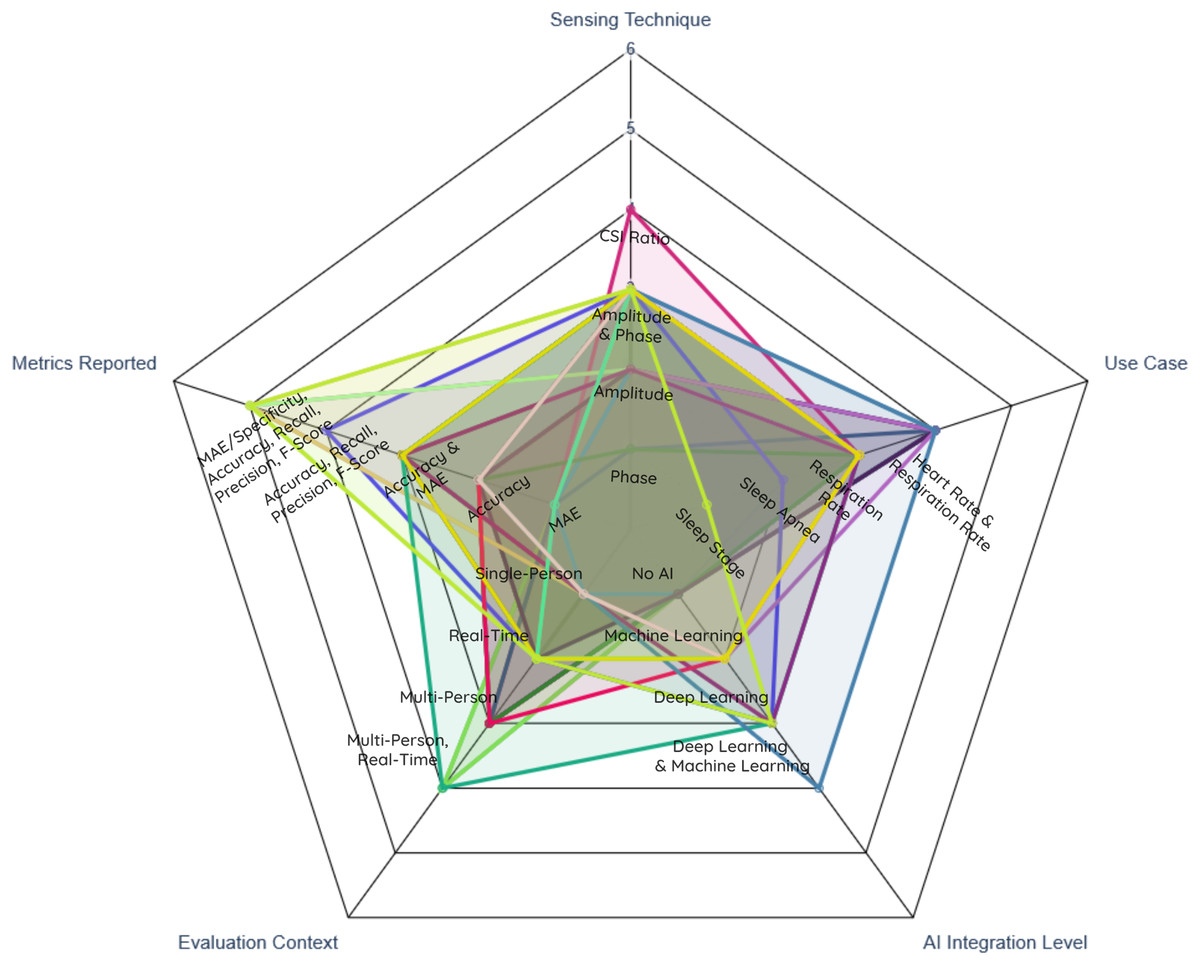
Figure 2: Taxonomy radar plot for the reviewed studies.
Our literature survey on AI-based health monitoring systems using Wi-Fi signal shows considerable improvements in accuracy, real-time operation, and multi-person monitoring. Heart rate estimation has achieved accuracies of up to 96% (Sun, Bian & Li, 2024), while breathing rate estimation has reached very high precision, with errors of 0.13 brpm (Gui et al., 2023). Multi-person tracking systems have successfully monitored up to four people simultaneously, achieving accuracies above 86% (Zeng et al., 2019). Subsequent developments in AI approaches, including deep learning models (Yu et al., 2021; Kumar et al., 2022; Mosleh et al., 2022), have further fine-tuned overall system performance, enabling highly sophisticated health assessments and increasing robustness across diverse environments. These advancements pave the way for less invasive, more user-friendly monitoring systems, with the possibility for use in sleep monitoring (Yu et al., 2021) and early detection of respiratory problems (Yang et al., 2021). Taken together, these findings suggest an optimistic trend toward developing efficient, individualized health monitoring systems that could radically impact both hospital and outpatient care.
With these results in mind, we present a comprehensive summary of the studies leveraging AI techniques for CSI-based vital signs monitoring. Table 6 offers an in-depth analysis of the AI algorithms employed, the results achieved, the datasets used, and the unique contribution of each study. The table highlights the diverse approaches applied to vital signs monitoring using CSI, with the “Contribution” column showcasing novel aspects such as new methodologies, multi-person tracking, and real-time capabilities. This detailed overview helps us better understand the progress made in applying AI to Wi-Fi-based vital signs monitoring and identifies areas for future research. Figure 3 illustrates the most commonly used AI models in Wi-Fi vital signs monitoring.
| Ref. | AI algorithms | Results | Dataset | Contribution |
|---|---|---|---|---|
| Yu et al. (2021) | CNN-BiLSTM with CFR | Accuracy 81.8% | Dataset collected by authors, 12 subjects | Implemented a Muti-stage sleep monitoring classification with real-time capability |
| Bao et al. (2023) | Support Vector Machine (SVM) | Accuracy 91.2% | Collected by authors, five subjects | Developed a remote healthcare application for real-time respiration monitoring |
| Kumar et al. (2022) | CNN, SVM | Accuracy 98.46% | Collected by authors, 84 subjects | Built a multi-position health monitoring for sleeping, sitting, standing and walking |
| Zhang et al. (2024) | PCA, DBSCAN Clustering, Autocorrelation | Accuracy 98% | Collected by authors, 12 subjects | Developed a multi-person respiration monitoring system using a single antenna |
| Guo et al. (2023) | Multi-antenna CSI-Subpopulation Genetic algorithm, Mixed Cluster Gaussian-Hidden Markov Model | Mean absolute error of 0.1 brpm | Collected by authors | Real-time respiration monitoring with multi-antennas |
| Kontou, Smida & Anagnostou (2024) | Artificial Neural Network (ANN) | Average error of 4.7% | Collected by authors | ANN-based respiration frequency detection method |
| Hu et al. (2023) | Temporal Convolutional Network (TCN) | Mean error of <1 brpm | Collected by authors, eight subjects | Multi-person respiration monitoring system |
| Armenta-Garcia et al. (2021) | SVM, K-NN, Quadratic Discriminant Classifier | Accuracy SVM 99.21% K-NN 99.09% QDC 99.65% | Collected by authors | Compared multiple ML algorithms for breathing rate estimation |
| Mosleh et al. (2022) | Long Short-Term Memory (LSTM) | Accuracy 99.97% | Collected by authors (https://doi.org/10.18434/mds2-2963) | Respiration monitoring using LSTM |
| Armenta-Garcia et al. (2023) | SVM, K-NN, Quadratic Discriminant Classifier | K-NN accuracy of 99.18% for breathing and 56.55% for heart rate | Collected by authors, 17 subjects (https://github.com/AlbanyArmenta0711/WiFi-CSI-MiningTool) | Classification of both heart and respiration rates |
| Yang et al. (2021) | Back-propagation (BP) neural network | Accuracy 95.6% | Collected by authors, 450 sets for each state | Developed sleep apnea detection system |
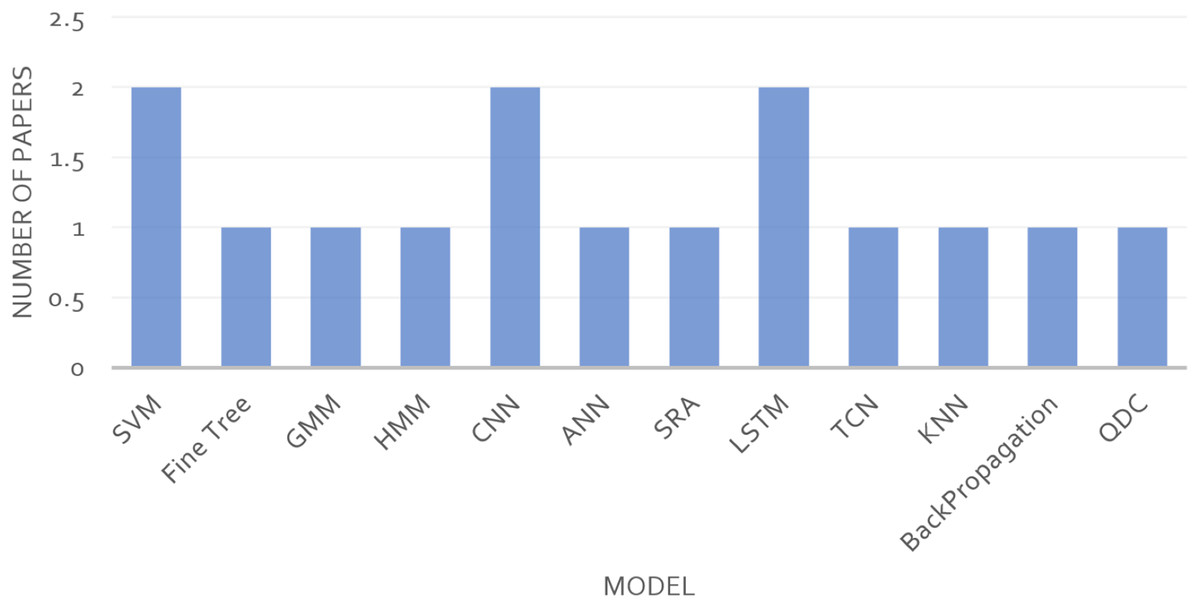
Figure 3: Widely applied AI models in Wi-Fi vital signs monitoring research.
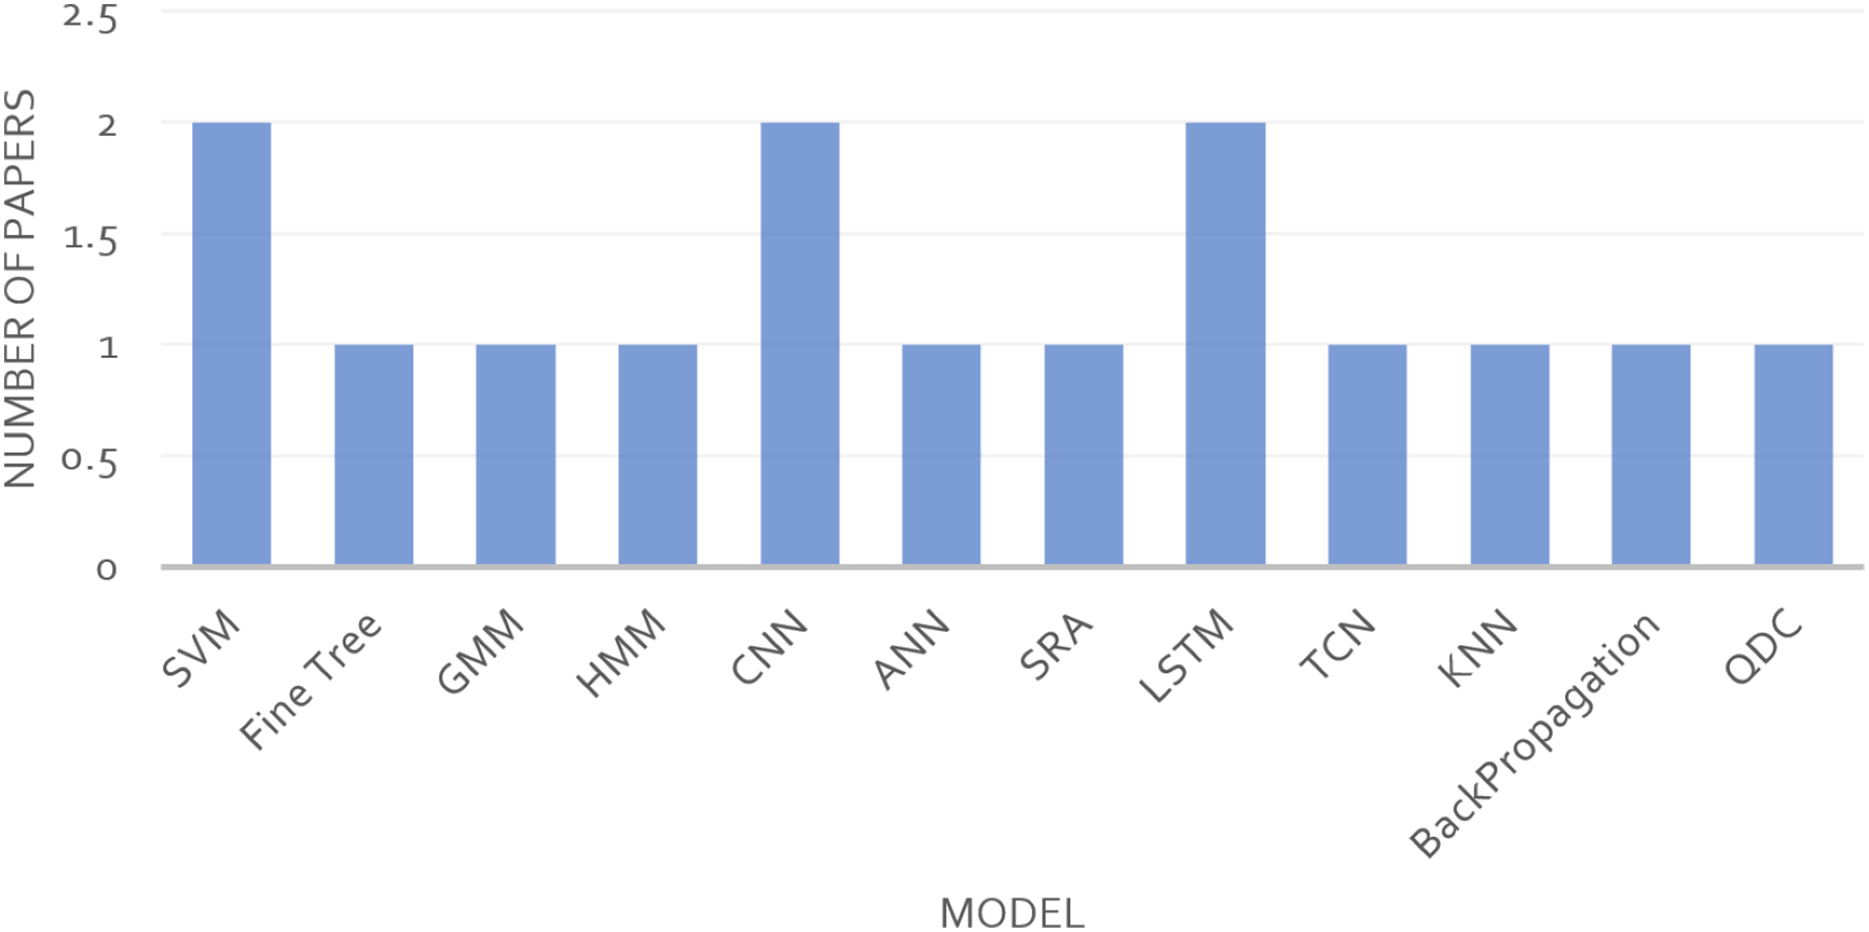
Table 7 presents an AI technique comparison framework for Wi-Fi-based health monitoring, summarizing all models from the surveyed articles and highlighting their respective strengths and weaknesses.
| AI Model | Accuracy | Computational efficiency | Scalability | Real-time suitability | Multi-person support | Strengths | Weaknesses |
|---|---|---|---|---|---|---|---|
| CNN (Convolutional Neural Network) | High (>95%) in activity recognition and vital sign detection | Moderate to high as it requires GPUs for complex tasks | Scalable for large datasets but requires hardware | Limited due to high computational demands |
Limited without further optimization | Excellent for image-like data and feature extraction | Expensive and may overfit without large datasets |
| LSTM (Long Short-Term Memory) |
High for sequential data like breathing and heart rate (95–99%) | Low to moderate as it depends on model complexity | Limited for large user environments due to memory usage | Suitable for near real-time but latency can occur | Limited without multi-user-specific adaptation | Effective for sequential time-series data | High memory consumption, struggles in multi-user environments |
| SVM (Support Vector Machine) |
Moderate (85–95%) in simpler tasks like binary classification | High (lightweight, even for large datasets) | Scalable for small to medium datasets | Suitable for real-time processing | Poorly designed and primarily for single-user cases | Simple, easy to implement, efficient for small datasets | Performance declines with increasing dataset size and complexity |
| RF (Random Forest) |
Moderate to high (90–95%) depending on features used | Moderate (more efficient than deep learning models) | Good for medium datasets, not ideal for very large datasets | Generally suitable for real-time applications | Limited by design to single or basic multi-user environments | Handles missing data well, robust for diverse input | Inefficient for extremely large or complex datasets |
| KNN (K-Nearest Neighbors) | Moderate (80–90%) | High for small datasets, low for large datasets | Poor scalability with larger datasets | High latency for large datasets | Designed for single-user environments | Simple to implement, no training phase needed | Not suitable for high-dimensional datasets or multi-user setups |
To synthesize the reported performance across different use cases, Table 8 summarizes the minimum, maximum, and average values of the reported metrics for each use case. Heart rate estimation had the lowest accuracy when first explored through CSI, at 56.55%. However, more recent studies have achieved accuracies up to 94.71%, with an average of 84.22% across five studies. Respiration rate detection demonstrated better overall performance, with a minimum accuracy of 78.6%, a maximum of 99.65%, and the highest average among all use cases at 95.7%. Fewer studies investigated sleep apnea, sleep stage, and respiration cycle detection, reporting average accuracies of 93.4%, 81.8%, and a MAE of 0.27 s, respectively.
| Metrics reported | No. of studies | Minimum | Maximum | Average |
|---|---|---|---|---|
| Heart rate | ||||
| Accuracy | 5 | 56.55 | 94.71 | 84.22 |
| F1-score | 1 | 30.91 | 30.91 | 30.91 |
| MAE | 2 | 1.19 | 3.9 | 2.55 |
| Precision | 1 | 40.28 | 40.28 | 40.28 |
| Recall | 1 | 35.91 | 35.91 | 35.91 |
| Specificity | 1 | 68.03 | 68.03 | 68.03 |
| Respiration rate | ||||
| Accuracy | 25 | 78.6 | 99.65 | 95.70 |
| F1-score | 3 | 76.82 | 99.11 | 91.29 |
| MAE | 20 | 0.1 | 1.19 | 0.50 |
| Precision | 3 | 97.96 | 99.59 | 98.94 |
| Recall | 3 | 97.95 | 99.28 | 98.63 |
| Specificity | 3 | 99.49 | 99.97 | 99.79 |
| Respiratory cycle | ||||
| MAE (second) | 2 | 0.25 | 0.28 | 0.27 |
| Sleep Apnea | ||||
| Accuracy | 2 | 91.2 | 95.6 | 93.40 |
| F1-score | 1 | 98 | 98 | 98.00 |
| Precision | 1 | 99.33 | 99.33 | 99.33 |
| Recall | 1 | 99.11 | 99.11 | 99.11 |
| Sleep stage | ||||
| Accuracy | 1 | 81.8 | 81.8 | 81.80 |
| F1-score | 1 | 83.5 | 83.5 | 83.50 |
| Precision | 1 | 83.8 | 83.8 | 83.80 |
| Recall | 1 | 83.2 | 83.2 | 83.20 |
To visually illustrate the relationship between healthcare use cases and the evaluation metrics reported in the studies, we created a snake diagram connecting the use cases to their corresponding metrics, as shown in Fig. 4. Studies monitoring respiration rate are strongly associated with accuracy and MAE, with 25 and 20 studies reporting these metrics, respectively. However, metrics such as precision, recall, and specificity appear less frequently. For heart rate estimation, accuracy remains the most commonly reported metric, while MAE and the other matrixes are less frequently included. Among the smaller use cases, articles reporting respiratory cycles are unique in reporting only MAE in seconds, whereas the remaining use cases report accuracy, F1-score, Precision, and Recall.
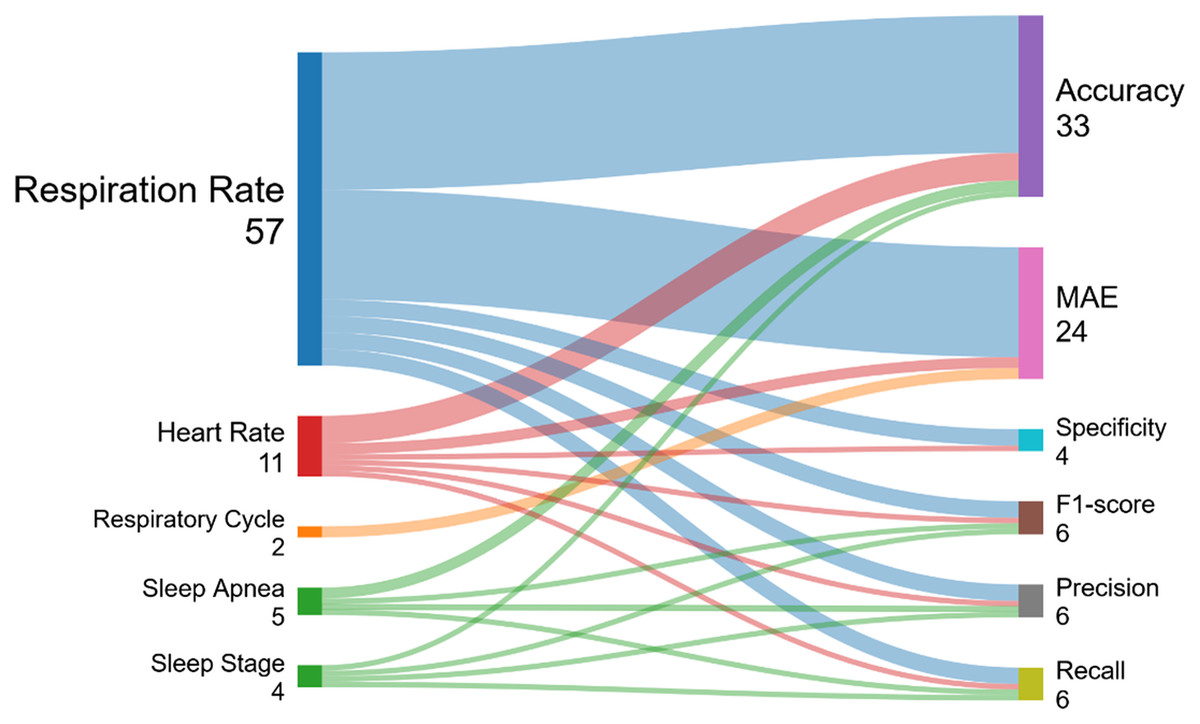
Figure 4: Evaluation metrics reported based on the use cases.
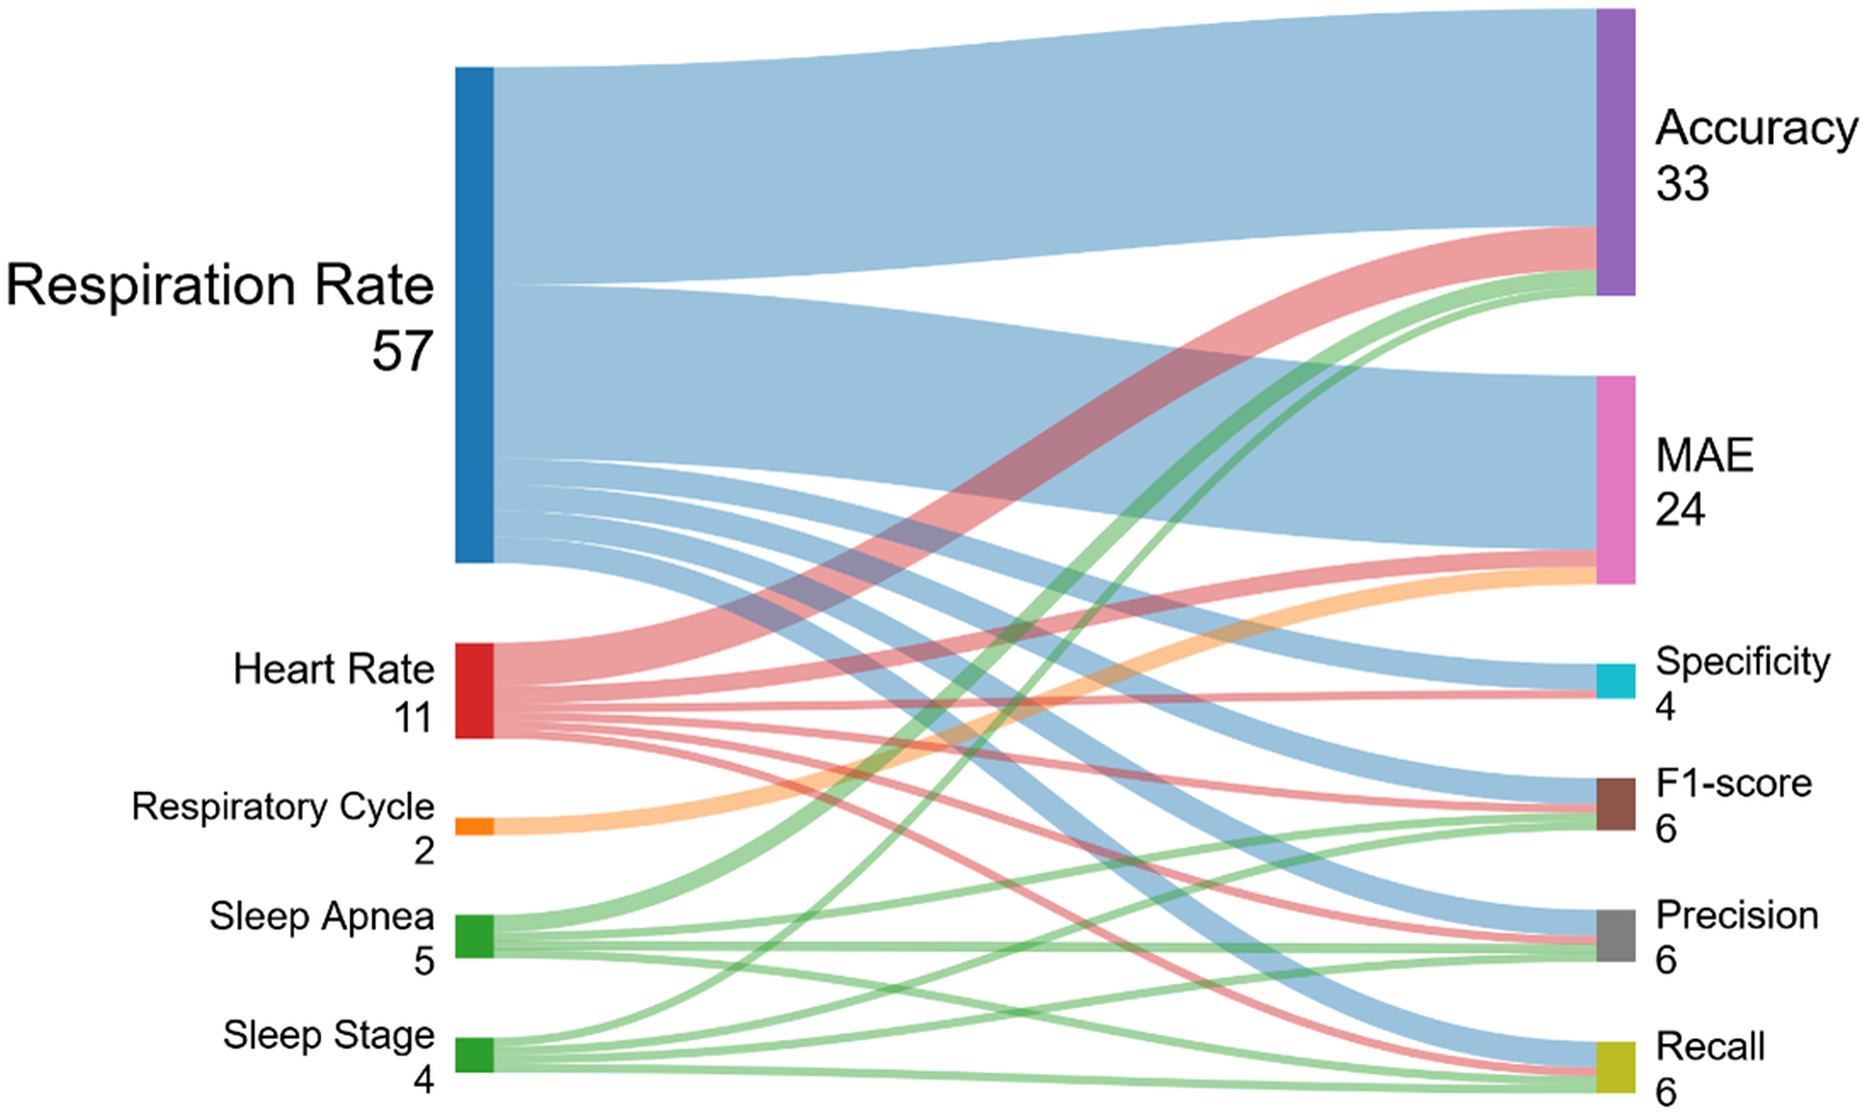
Comparison to prior work
Several recent studies have examined Wi-Fi-based sensing for healthcare applications, but they differ significantly from this work in scope, methodology, and focus. For instance, Soto et al. (2022) present a survey on vital signs monitoring using Wi-Fi CSI, reviewing approximately 34 articles (not explicitly listed) without following a systematic protocol such as PRISMA. Their inclusion criteria and article selection process are not clearly defined, and the survey does not cover articles that use AI approaches to enhance estimation. Similarly, Miao et al. (2025) introduce a general overview of Wi-Fi sensing approaches for human activity recognition. Their review is not PRISMA-compliant, includes no database search methodology, and focuses more on wireless signal processing and sensing theory than healthcare-specific applications. Ahmad, Ullah & Choi (2024) offer a narrative explanation of contactless Wi-Fi sensing in healthcare, listing emerging trends and application scenarios rather than systematically reviewing recent methodologies or implementation results. Their work does not distinguish between CSI-based and RSS/radar-based systems, nor does it classify studies by performance, signal type, or clinical feasibility.
In contrast, our systematic review strictly follows PRISMA and Kitchenham standards, with clearly defined inclusion and exclusion criteria, screening procedures, and documented reasons for study inclusion. We conducted a systematic multi-database search (IEEE Xplore, ScienceDirect, SpringerLink, ACM Digital Library, ResearchGate, and Google Scholar), downloading 8,573 articles, from which 45 primary studies were selected following rigorous screening. This review focuses on CSI-based heart and respiratory rate monitoring in particular, contrasting AI-based and non-AI-based methods while emphasizing their reliability, performance, and feasibility for clinical or home settings. The included studies, published between 2019 to 2024, provide a contemporary synthesis of the field. Additionally, we present structured tabular summaries, performance metrics, setup requirements, and limitations, allowing healthcare professionals and engineers to interpret and apply the findings. This level of systematic depth and clinically relevant focus is currently absent in existing literature, highlighting the novelty and value of our work. Table 9 provides a comparison between our systematic review and prior works.
| Aspect | Soto et al. (2022) | Miao et al. (2025) | Ahmad, Ullah & Choi (2024) | This review |
|---|---|---|---|---|
| Review type | Narrative survey | Narrative survey | Narrative survey | Systematic review |
| PRISMA followed | No | No | No | Yes (PRISMA + Kitchenham) |
| Focus | CSI-based vital signs monitoring (esp. respiration & HR) | Wi-Fi-based Human Activity Recognition (HAR) | Wi-Fi-based sensing using deep learning for human activity recognition and different healthcare applications | CSI-based vital signs monitoring specifically respiration & heart rate estimation. Examines both (AI + non-AI) based approaches. |
| Years covered | 2014–2022 | Not mentioned | 2016–2022 | 2019–2024 |
| Databases | Not specified | Not specified | Not explicitly stated (general literature review across academic sources like IEEE, ACM, and Elsevier). | 6 (IEEE, ACM, Springer, ScienceDirect, etc.) |
| Study selection method | Not clearly stated | Not clearly stated | Not clearly stated | Transparent, structured screening & inclusion |
| # of Papers included | Not explicitly mentioned | Not explicitly mentioned | Not explicitly mentioned | 45 (post-screening) |
| Limitation/novelty | Overview of respiration/HR estimation but lack covering articles that use AI approaches to aid their estimation process. | Broad survey on HAR but not vital signs estimation. | CSI monitoring in various applications, but predominantly on human activity recognition (HAR) rather than vital signs monitoring. | First to conduct structured PRISMA-based review specifically comparing AI & non-AI CSI-based vital signs monitoring systems with performance, hardware, and deployment insights |
Methodological limitations and reproducibility concerns
A number of methodological concerns were identified across surveyed literature, which restrict the ability to compare, reproduce, and reliably interpret results in Wi-Fi-based health monitoring studies.
-
•
Statistical significance and robustness
Only a small proportion of studies reported formal measures of statistical significance, such as p-values, confidence intervals, or variance across repeated runs. In most cases, results were presented as single-point performance data without any statistical analysis, making it difficult to determine whether observed differences are meaningful or a result of chance.
-
•
Replication and external validation
Reproducibility is a major issue. As Table 3 shows, only 10 studies provided publicly available code, algorithms, or datasets, while 35 studies shared no implementation resources. Even fewer studies tested their models on independent, external datasets, relying instead on in-house or proprietary datasets that were not released publicly. This lack of transparency prevents independent validation and fair comparisons within the filed. Consequently, our search did not include clinical databases such as PubMed or Embase, which may contain reports of early-stage trials or clinical evaluations. This omission limits our ability to assess the clinical readiness or real-world deployments of CSI-based sensing.
-
•
-
•
Metrics: Accuracy was the most frequently reported metric (29 studies), followed by MAE in 23 studies coming in second. Five studies reported F1-score as well as precision and recall as primary metrics. Figure 5 illustrates the frequency of these reported metrics. A clear trend emerges: non-AI studies tend to report accuracy and MAE, while AI-based studies tend to report accuracy and F1-score, and sometimes precision and recall, to account for class imbalance and better reflect overall model performance.
-
•
Validation methods: Seven studies used k-fold cross-validation or similar resampling methods, whereas most relied on a single train-test split. Using only one split increases the risk of overfitting and can exaggerate reported performance.
-
•
Testing environments: Most systems were tested in controlled conditions with a single user. Only 10 studies directly measured performance in multi-user scenarios or more dynamic, realist environments, an important step toward measurement of real-world applicability in the healthcare setting.
-
•
Benchmarking practices
Among the 45 studies, 22 engaged in benchmarking, directly comparing their results against findings reported in previous literature. This practice helps position new approaches within the broader research landscape and provides a relative measure of performance improvements over existing methods. However, benchmarking alone does not fully confirm a model’s generalizability, as many of these studies did not evaluate their systems on entirely independent datasets or in substantially different real-world environments. The remaining studies relied solely on internal validation, which, while useful for development, can overestimate real-world performance when not supplemented with external testing.
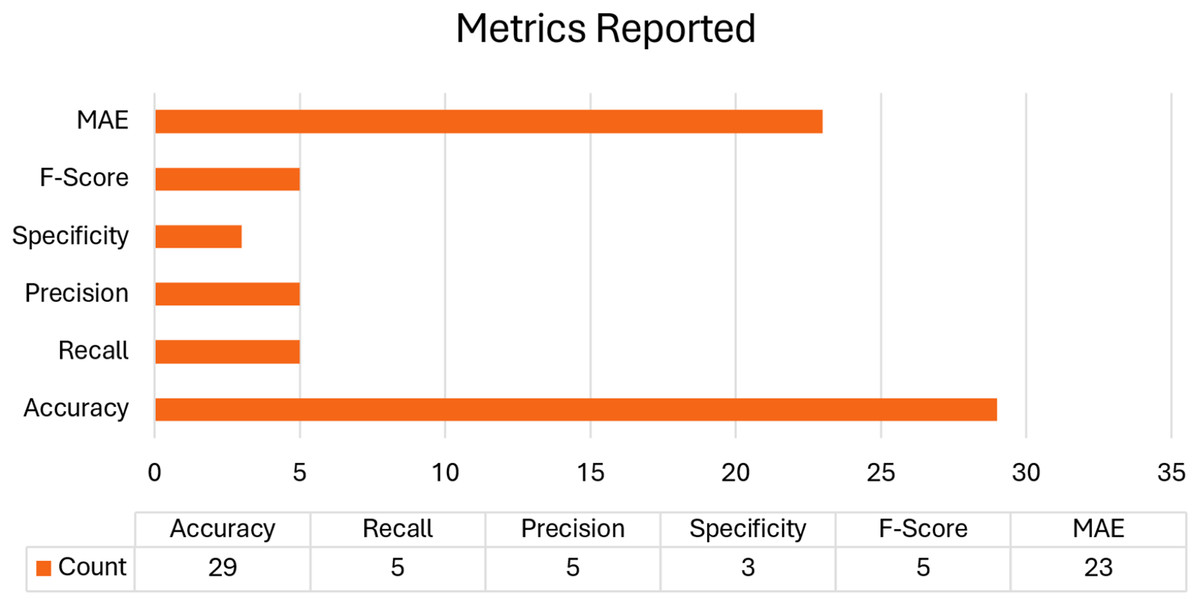
Figure 5: Frequency of the metrics reported.
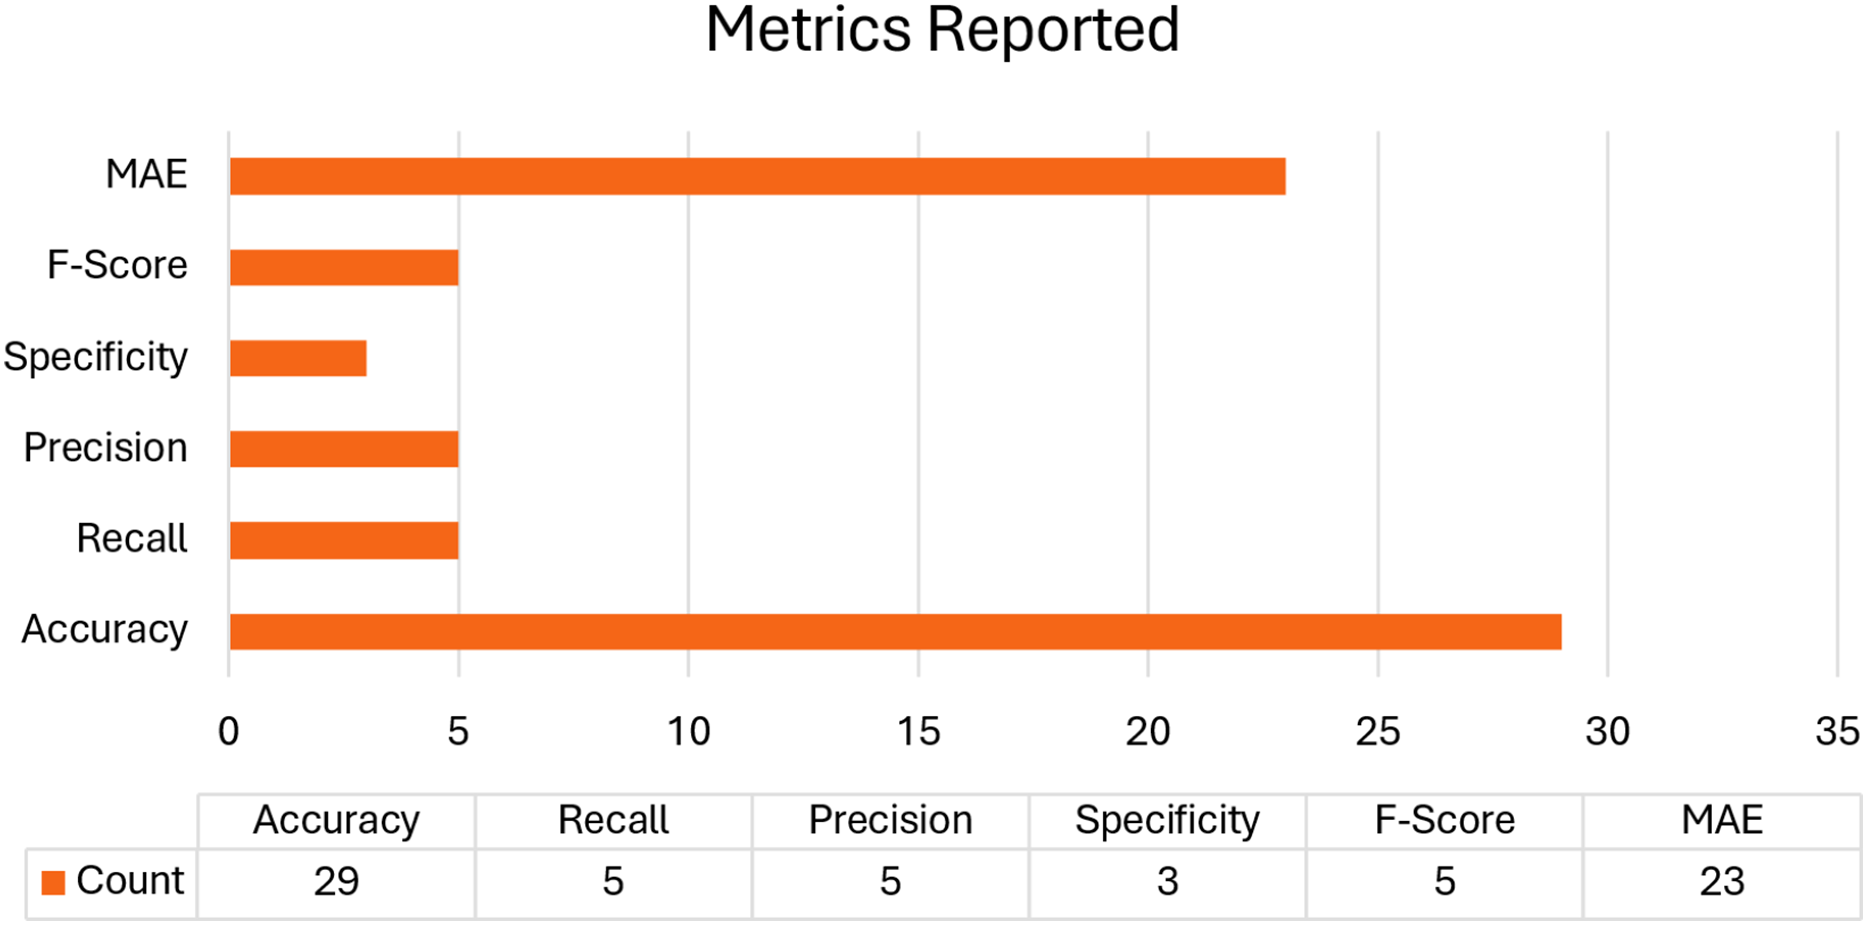
The lack of reliable evaluation frameworks, limited use of high-quality statistical reporting, and restricted availability of code and data combine to form a fragmented evidence base. To advance this technology toward clinical application, the research community needs to adopt uniform evaluation methods, prioritize reproducibility through open-source principles, and embrace statistical rigor when reporting performance.
Limitations and recommendations
Despite the accuracy and potential of using AI-enhanced Wi-Fi sensing non-invasive health monitoring systems, a range of technical and practical challenges remain. These limitations are interrelated and directly inform our proposed recommendations for future research.
-
•
High computational demands and edge deployment constraints
Most AI-based solutions (e.g., Convolutional Neural Networks (CNNs), Long Short-Term Memory (LSTMs)) are computationally intensive and rely on powerful GPUs (Graphics Processing Units) or multi-core CPUs (central processing units) to analyze high-resolution CSI data in real time. This poses challenges for portable or embedded systems such as home gateways, low-power Internet of Things devices, or wearable hubs. The computational overhead affects latency, increases cost, and reduces viability in resource-limited clinical environments. Research should focus on lightweight, optimized models through pruning, quantization, knowledge distillation, and architectural simplification, enabling high performance on low-power, edge-based systems without costly hardware.
-
•
Energy efficiency limitations
Constant CSI acquisition and high-rate sampling can be very energy-intensive, particularly for systems intended to monitor patients continuously over long intervals. This results in frequent battery charging, higher maintenance demands, and lower patient compliance in mobile or battery-based healthcare devices. It also wastes energy and bandwidth by processing data during inactivity. Adaptive sensing and event-based monitoring, where data are gathered more frequently when an anomaly is detected, providing a roadmap toward using less power without loss of monitoring capabilities of critical interest.
-
•
Integration gaps with healthcare IT systems
Although numerous studies have demonstrated technical feasibility in controlled environments, few show interoperability with hospital electronic health record (EHR) systems, remote patient monitoring dashboards or telemedicine platforms. Without integration into existing healthcare IT workflows, these systems remain stand-alone prototypes that cannot contribute to continuous patient history or automated clinical decision support. Interoperability requires standardized data formats, secure Application Programming Interfaces (APIs), and compliance with regulations like the Health Insurance Portability and Accountability Act and General Data Protection Regulation. Using Standardized APIs, secure communication protocols, and compliance frameworks will help fill this gap so that CSI-generated health data can be transported, stored and retrieved within current healthcare infrastructure.
-
•
Security and privacy risks
The transmission of sensitive physiological data over Wi-Fi raises risks of interception, tampering, or unauthorized access. Breaches may occur not only from weak or absent encryption but also from the passive nature of monitoring, where explicit consent may not be obtained. Security-by-design principles, such as robust encryption, authentication, secure storage, and anonymization, are essential for compliance and building patient trust.
-
•
Lack of high-quality, standardized datasets
Most studies use small, self-generated datasets with limited demographic diversity, environmental variation, or sensing conditions. Public datasets, when available, tend to be incomplete, restricted to amplitude or phase data, or often partially pre-processed. This limits reproducibility and hinders cross-study comparison, forcing researchers to recreate data collection pipelines. Standardized, well-documented datasets would establish a common foundation for rapid innovation, reproducibility, and stringent performance testing between research teams.
-
•
Limited scope of monitored vital signs
Current research focuses on respiration and heart rate, omitting other important measures, such as blood pressure, oxygen saturation, or arrhythmia. This narrow scope limits clinical applicability, particularly in use cases such as intensive care unit monitoring where multiple vitals must be measured simultaneously. Future work should focus on the development of algorithms and sensing methods that would be able to derive more pertinent physiological data concerning CSI data, and in that way, these systems could be upgraded into holistic health monitoring systems.
-
•
Environmental sensitivity and performance degradation
CSI-based monitoring is strongly influenced by environmental factors such as furniture formations, wall compositions, or Wi-Fi signal fluctuations. These can degrade performance, increase false positives, or cause missed detections. Although some techniques freeze measurements during disturbances, they fail under frequent or persistent changes. Environment-adaptive calibration and robust signal processing methods are needed to guarantee stable performance with a large change in environmental conditions.
-
•
Multi-person monitoring
Overlapping CSI patterns of multiple individuals remain a major challenge. Current methods perform poorly in multi-user or unsynchronized movement scenarios, limiting applicability in hospital wards, senior care facilities, or family homes. Research into clustering, angle-of-arrival estimation, and deep learning-based separation could help achieve credible performance in multi-person environments.
In addition to system level constraints, it is important to note the methodological limitations revealed in the literature. Inconsistencies in statistical reporting, evaluation measures, and validation procedures, combined with insufficient sharing of codes and datasets discussed in the previous section, compromise reliable cross-study comparison and replication. Addressing both technical and methodological challenges in parallel to advance Wi-Fi-based health monitoring toward standardized, clinically deployable solutions.
By explicitly linking these shortcomings to actionable recommendations, this review not only highlights what current Wi-Fi-based health monitoring systems lack but also provides a viable guide for how future research and development should proceed. Solving these problems will be central to the transition from exciting prototypes to dependable, secure, and clinically integrated systems that can function productively across diverse environments and patient populations.
Future directions and implications
Based on the outlined limitations and recommendations, there are several promising directions for the continued development of Wi-Fi-based health monitoring systems. These directions are not only oriented toward technical refinement but also toward integrating the technology into healthcare requirements, policy systems, and user acceptance. From a research perspective, investigation into the following areas is worth consideration:
Edge-optimized architectures: Train highly efficient AI models that avoid major accuracy trade-offs while being deployable on low-power and embedded devices. Techniques such as model pruning, quantization, and on-device inference pipelines can support real-time monitoring without reliance on high-performance servers.
Energy-aware sensing strategies: Develop adaptive sensing methods where data collection and processing rates vary according to patient activity, health status, or environmental stability. This minimizes power consumption without compromising the necessary measurements.
Multi-person tracking: Seek efficient algorithms to differentiate concurring CSI designs in a common area. Hybrid signal separation, beamforming, and spatial filtering with AI are potential solutions for enabling multi-user monitoring in hospitals and home care.
Increased physiological coverage: Extend monitoring beyond heart rate and respiration to include blood pressure, oxygen saturation and early detection of arrhythmia. An integration of multi-parameter monitoring and predictive analytics can be used to deliver proactive interventions in healthcare.
Diverse and well-labeled datasets: Design standardized, diverse, and well-labeled datasets that capture different environments, demographics, and medical conditions, and make them publicly available. This would accelerate innovation, reproducibility, and fair benchmarking across research groups.
The implications of these directions are equally important from a practical and policy standpoint:
Clinical integration and workflow adaptation: Collaboration between technologists and healthcare providers is required to ensure interoperability with EHRs, clinical dashboards, and telemedicine platforms.
Regulatory and ethical regulation: Policymakers should establish clear deployment guidelines on deployment addressing data ownership, informed consent, and monitoring ethics, while also creating reimbursement models for remote patient monitoring.
Public awareness and acceptance: Communication plans should ensure that patients and caregivers are informed about the benefits, limitations, and security of Wi-Fi-based monitoring, thereby leading to user acceptance and participation.
Following these directions, the field can move from isolated experimental successes toward sustainable real-world healthcare solutions that are technically dependable, ethically responsible, and socially acceptable. This two-pronged approach, innovation paired with readiness, will be crucial in making Wi-Fi-based health monitoring reach its full potential in improving patient outcomes and streamlining healthcare delivery. To conclude our synthesis, we have compiled all the keywords and search terms used during our research and created a network map showing the most frequently utilized terms in the literature. Figure 6 presents this keyword network map.
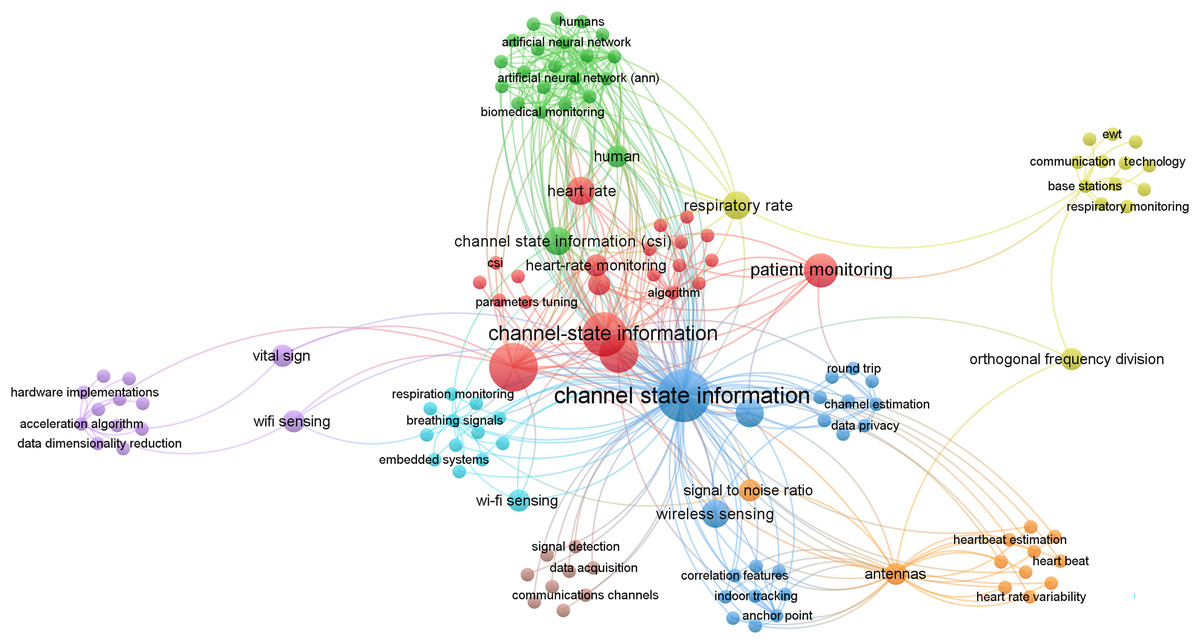
Figure 6: Bibliographic network map based on the articles’ keywords.
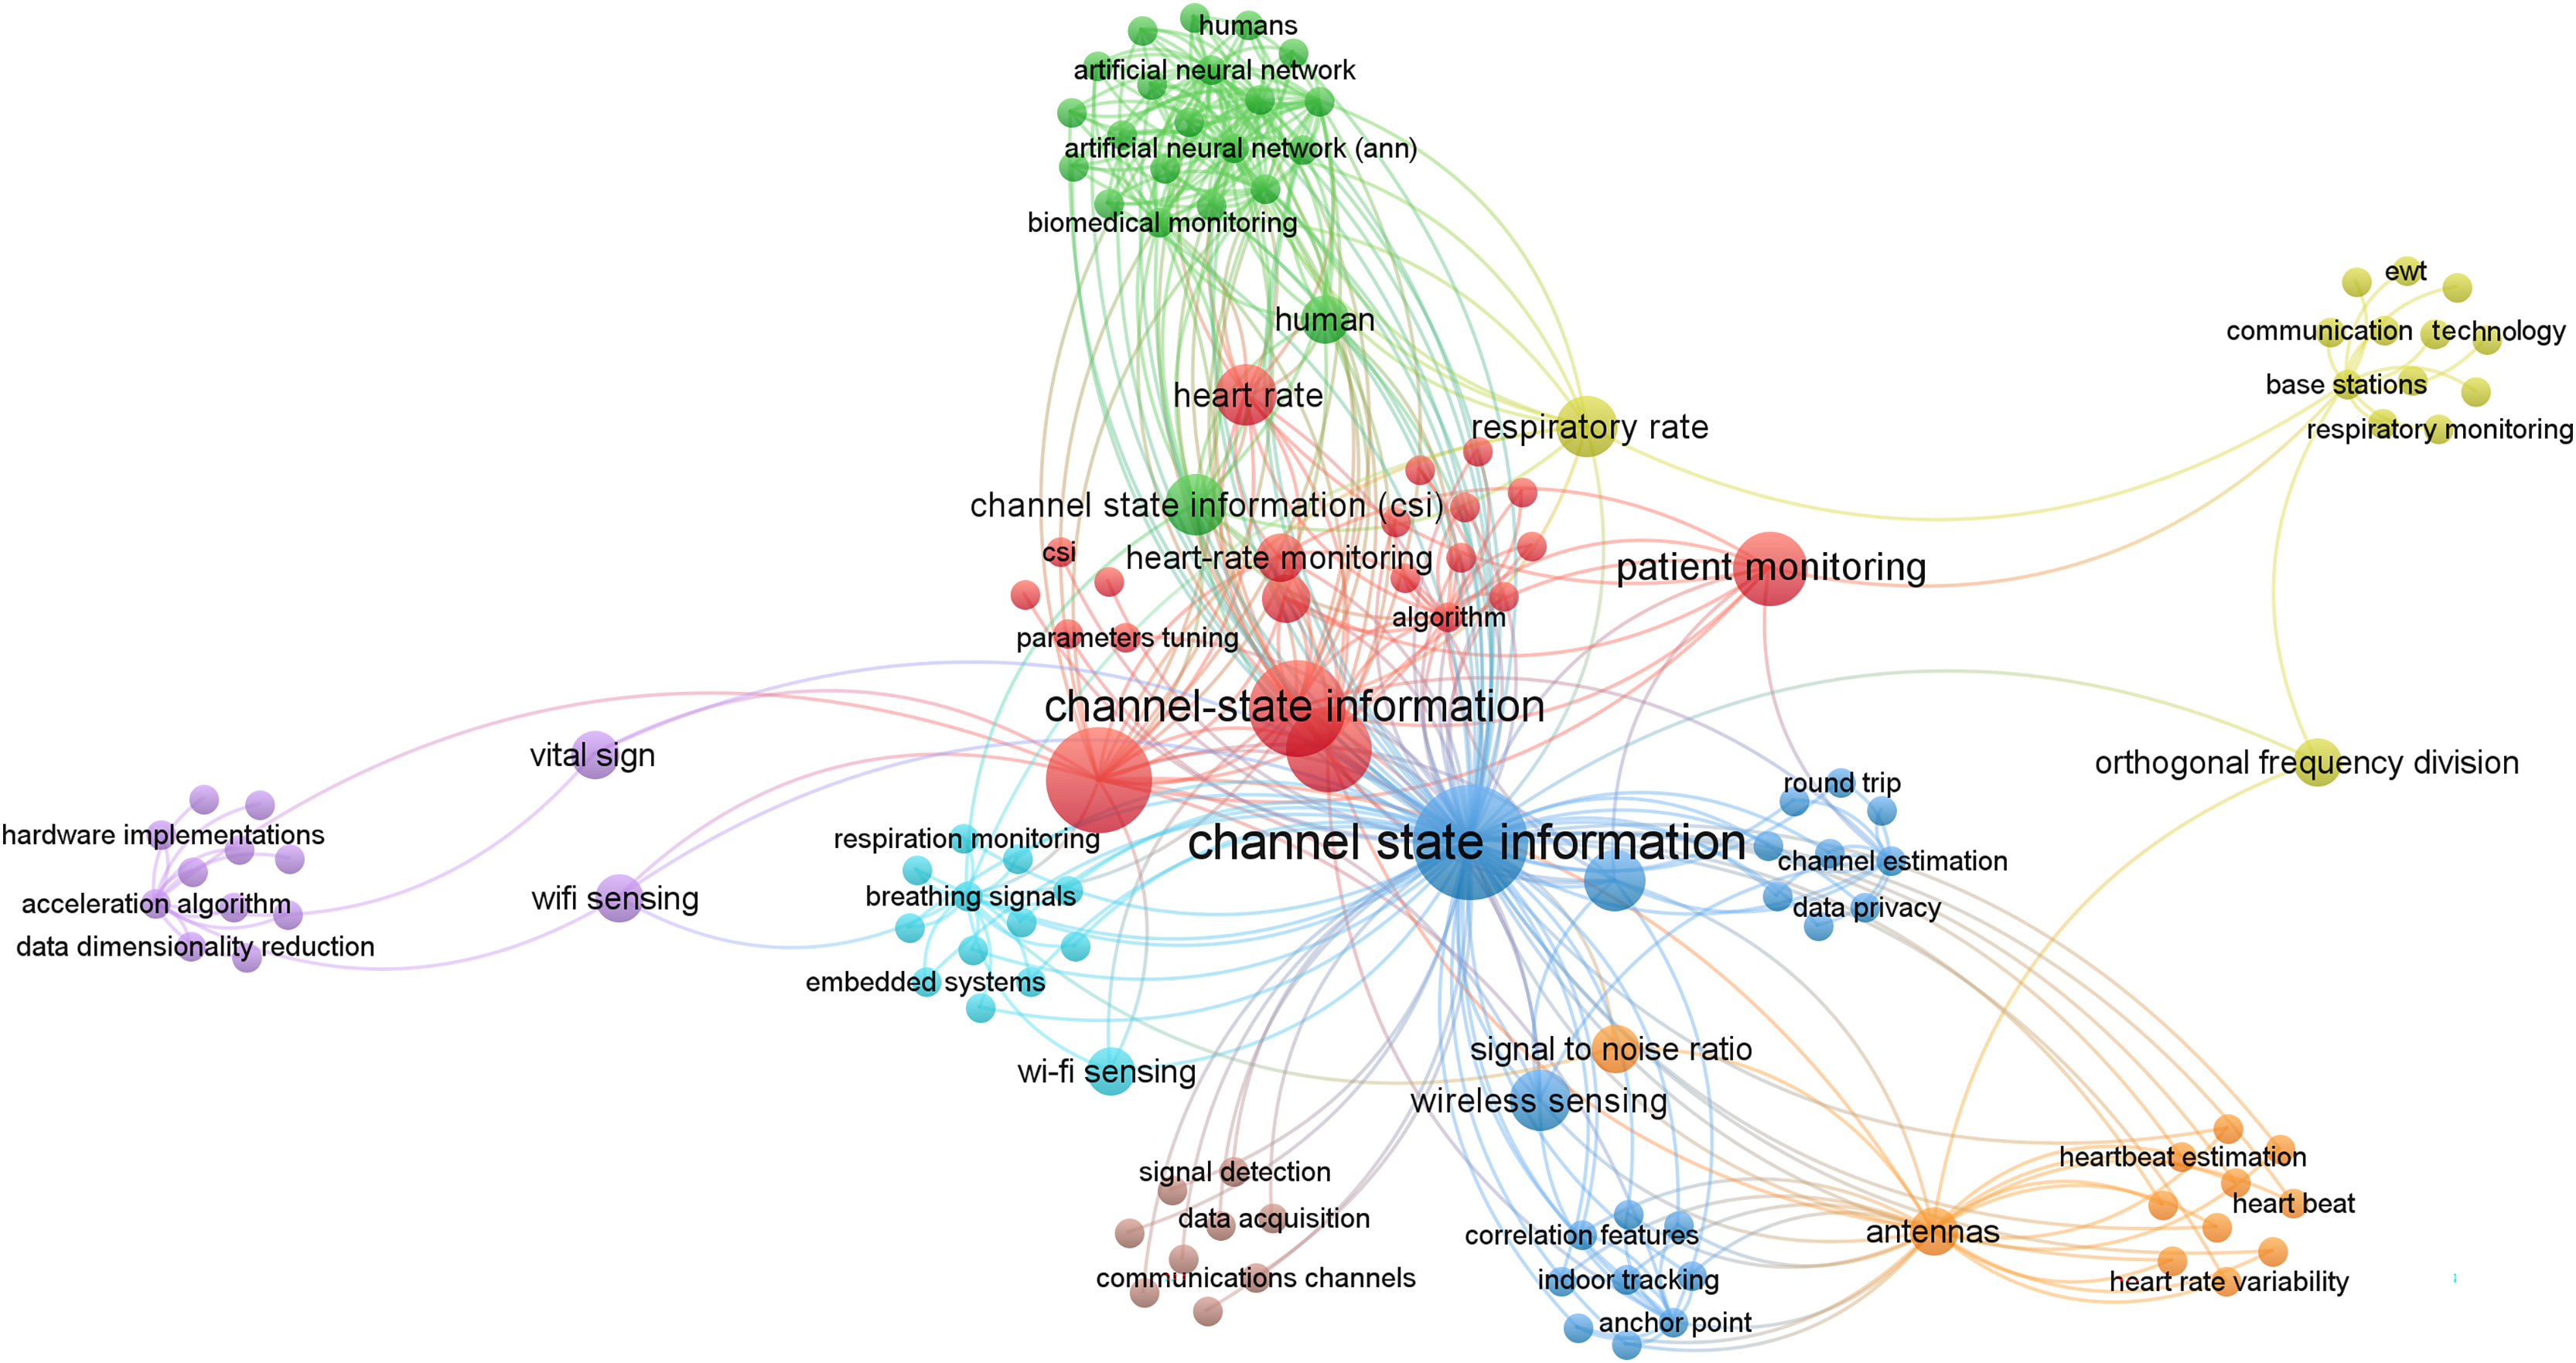
Conclusion
Considering the findings of the present review on Wi-Fi signal-based health monitoring systems, this technology has high potential in non-invasive, continuous health monitoring. Key findings include high accuracy in identifying respiratory and heart rates, successful tracking of multiple people, and diverse applications such as monitoring sleep patterns or COVID-19 symptoms. AI techniques have also been incorporated to enhance their effectiveness and precision, enabling additional forms of health evaluation. The following is a summary of the major findings and contributions of this survey:
Accuracy improvements: AI-driven models, particularly CNN, LSTM, and hybrid models, demonstrate significant improvements in accuracy for heart and respiration monitoring, with some models achieving over 95% accuracy in controlled environments.
Non-invasive monitoring: Wi-Fi-based systems provide a contactless solution, enabling accessible and less intrusive monitoring in clinical and home settings, particularly for vulnerable populations such as elderly or chronic patients.
Diverse use cases: Wi-Fi-based sensing demonstrate versatility across healthcare applications, including fall detection, activity recognition, and real-time vital sign monitoring.
Nevertheless, some issues remain, such as data protection and privacy, enhancing the model’s performance in various environments, and multi-user cases. The following is a summary of this survey’s major challenges and limitations:
Multi-user cases: Current systems struggle with multi-person monitoring due to overlapping signals and interference, highlighting the need for stronger algorithms for distinguishing between individuals.
Privacy concerns: Given the sensitivity of health data, robust data protection and secure Wi-Fi transmission are critical. Strategies such as encryption and user anonymization should be implemented.
Real-time processing: Real-time monitoring remains challenging, optimization to reduce latency and computational overhead without compromising accuracy.
The importance of these findings is the ability to ensure a significant change to healthcare delivery, particularly in remote and continuous monitoring. Future research must consider the following areas to address the gaps identified in the current literature.
Develop a multi-person health monitoring system that can simultaneously track complex health parameters like heart and breathing rates in real time, with a focus on mitigating environmental interventions and improving overall system performance.
Implement robust data protection strategies, including advanced encryption methods, secure storage solutions, and privacy-preserving algorithms to safeguard sensitive health information.
Expand the scope of AI-based health monitoring by integrating additional vital signs such as blood pressure and body temperature, emphasizing the creation of predictive models that can anticipate and proactively alert potential health emergencies.
Contribute to the research ecosystem by developing high-quality, publicly available datasets that include annotated activities, precise vital sign measurements, and comprehensive phenotypical information to support more effective AI model training, validation, and future advancements in health monitoring technologies.
Develop standardized procedures of data collection, preprocessing, and performance assessment that will allow comparing and reproducing studies.
Collaborate with healthcare regulators and policymakers to define regulatory pathways, compliance requirements, and ethical principles of clinical deployment of Wi-Fi-based monitoring systems.
Share codes and datasets publicly in the research community to foster innovation, allow independent verification, and translate research findings to real life.
Appendix
Search strategy overview
The search strategy was developed to identify peer-reviewed articles focusing on Wi-Fi CSI) and AI-based non-invasive vital signs monitoring. The search was conducted across six databases: IEEE Xplore, ScienceDirect, SpringerLink, ACM Digital Library, Google Scholar, and ResearchGate.
The overall search strategy could be outlined below:
-
1.
Research questions formulation.
-
2.
Develop search phrases.
-
3.
Choose digital libraries and conducting searches.
-
4.
Apply specific inclusion/exclusion criteria to select articles relevant to our topics of interest.
-
5.
Gather essential details from the articles we chose.
-
6.
Analyze the research questions in depth, allowing us to conduct a comprehensive study on the existing methods, their advantages, and the potential for future research, as well as their limitations.
Figure S1 illustrates the visual breakdown of these steps. A detailed list of the keyword combinations, Boolean query strings, and individual database inputs used during the search process is provided below.
Boolean query and keywords
To retrieve relevant articles that address the research questions from various search resources, a query string was necessary. Initially, we determined the primary search terms derived from the research questions. Subsequently, we listed synonyms and alternative expressions for these primary terms. These were then linked to each corresponding primary term using the OR operator. Finally, all primary search terms were connected using the AND operator. The culmination of these processes produced the query string that was utilized to search in different databases. The Boolean logic used is shown below:
(“Vital signs” OR “Heart Rate” OR “Respiration Rate” OR “Body Temperature” OR “Breathing” OR “Cardiac”) AND (“Wi-Fi Signals” OR “Channel State Information” OR “CSI” OR “Wireless security” OR “Router” OR “Wireless” OR “CSI-based healthcare monitoring”) AND (“Health monitoring” OR “Remote monitoring” OR “non-invasive” OR “Healthcare” OR “Tracking” OR “ECG” OR “Health Monitoring Application” OR “Patient-monitoring” OR “Sleep monitoring” OR “Home monitoring” OR “Secure Remote Monitoring” OR “Smart Health Monitoring” OR “Signal Processing in Healthcare” OR “Monitoring” OR “Detection” OR “Abnormality” OR “AI-driven Healthcare” OR “COTS device" OR “COTS router” OR “Wireless sensing” OR “Contactless Monitoring” OR “Multi-Person Detection” OR “Wi-Fi device”)
After experimenting with several combinations and permutations of key terms, we finalized our search terms, which are presented in Table S1. Searches were conducted using six major academic databases listed in Table S2.
Screening and selection process
Screening rationale and initial results
We opted to focus our search on research articles published in the last five years up to August 2024. Following this, we removed duplicates, non-journal sources, and articles out of our scope left us with 851 unique records.
In the next step, we screened the articles identified using the inclusion-exclusion criteria as shown in Table S3. This refinement process narrowed our selection down to 269 records that met our criteria. Additionally, we eliminated records that were inaccessible, studies that merely offered discussions without demonstrating model performance and outcomes, and those unrelated to our defined research questions. Moreover, we excluded articles that relied on frequency Modulated Continuous Wave (FMCW) radar systems. Despite the higher proven accuracy of these systems, they require specialized hardware which is often costly. In contrast, the CSI-based approach is considered more convenient and cost effective as it utilizes off-the-shelf Wi-Fi devices. CSI is increasingly supported by modern Wi-Fi chipsets and can be extracted with open-source tools, making it both practical and scalable for clinical and real-world deployment. We also excluded articles that used RSS for sensing, as RSS provides only basic signal strength information, which is not detailed enough to detect small body movements like breathing or heart rate. Furthermore, any studies incorporating wearable technology were excluded, since it contradicts our primary goal of contactless vital sign monitoring. The remaining records underwent further screening to identify articles pertinent to our research inquiries. Moreover, assessing metrics of accuracy, F1-score, specificity, sensitivity, and area under curve (AUC) for machine learning or deep learning models was essential for our review. Consequently, we discarded studies that failed to report on model performance.
Final selection outcome and visuals
Overall, this phase concluded with the identification of 45 trustworthy research articles from esteemed journals that align with our established research questions.
Figure S2 displays the detailed steps involved in this process and the breakdown of methodology, including search term design, screening criteria, inclusion/exclusion filters, and thematic classification for research conducted across global datasets.
Figure S3 presents a flowchart based on PRISMA guidelines illustrating identification, screening, eligibility, and inclusion of 45 peer-reviewed studies related to AI-based Wi-Fi signal monitoring systems in healthcare.
Table S4 reveals the origin of these articles.
Figure S4 presents the distribution of 45 eligible studies related to CSI-based health monitoring using Wi-Fi signals, highlighting the increasing trend in publications post-2020.
Figure S5 shows the distribution of these articles among all the researched databases. The data indicate that scientific research on Wi-Fi signal-based vital signs health monitoring is uncommon and has only recently seen significant growth.
Abbreviations
The nomenclature used in this article is listed in Table 10.
| Acronym | Term | Definition |
|---|---|---|
| 1. ANN | Artificial Neural Network | A computing system that constitutes animal brains. |
| 2. BiLSTM | Bidirectional Long Short-Term Memory | A type of recurrent neural network architecture that processes data in both forward and backward directions. |
| 3. CNN | Convolutional Neural Network | A deep learning algorithm designed to process structured grid data like images. |
| 4. CSI | Channel State Information | Refers to the estimation of channel properties such as amplitude and phase in a wireless communication medium. |
| 5. DACM | Direction-based Adaptive Combination Method | An algorithm for combining multiple signals based on their directions. |
| 6. DBSCAN | Density-Based Spatial Clustering of Applications with Noise | An unsupervised learning method used for model construction; utilized for separating high-density clusters from low-density clusters. |
| 7. DWT | Discrete Wavelet Transform | A signal processing technique that decomposes a signal into its wavelet components. |
| 8. ECG | Electrocardiogram | A test that records the electrical activity of the heart over a period. |
| 9. ENN | Ensemble Neural Network | A learning paradigm where multiple neural networks are combined to improve performance. |
| 10. EWMA | Exponentially Weighted Moving Average chart | A type of control chart used to monitor attributes and describe a time series. |
| 11. FFT | Fast Fourier Transformation | An efficient algorithm to compute the Discrete Fourier Transform (DFT) and its inverse, transforming a signal into the frequency domain. |
| 12. FMCW | Frequency Modulated Continuous Wave | A radar technique using frequency modulation of a continuous wave signal to measure distance and velocity via frequency shift. |
| 13. K-NN | K-Nearest Neighbor | A classification algorithm that classifies data points according to the k nearest neighbors. |
| 14. MAE | Mean Absolute Error | A measure of errors between paired observations. |
| 15. NLoS | Non-Line of Sight | Refers to a signal path between transmitter and receiver being obstructed by physical objects. |
| 16. PCA | Principal Component Analysis | A dimensionality reduction method used to simplify large datasets. |
| 17. PSD | Power Spectral Density | A measure of a signal’s power content against frequency, used to describe broadband random signals. |
| 18. RSS | Received Signal Strength | The power level of a radio signal as received by a device, used to assess wireless connection quality. |
| 19. SNR | Signal-to-Noise Ratio | A measure of signal strength relative to background noise. |
| 20. SVM | Support Vector Machine | A classification algorithm that finds a hyperplane with the maximum margin to separate data points of different classes. |
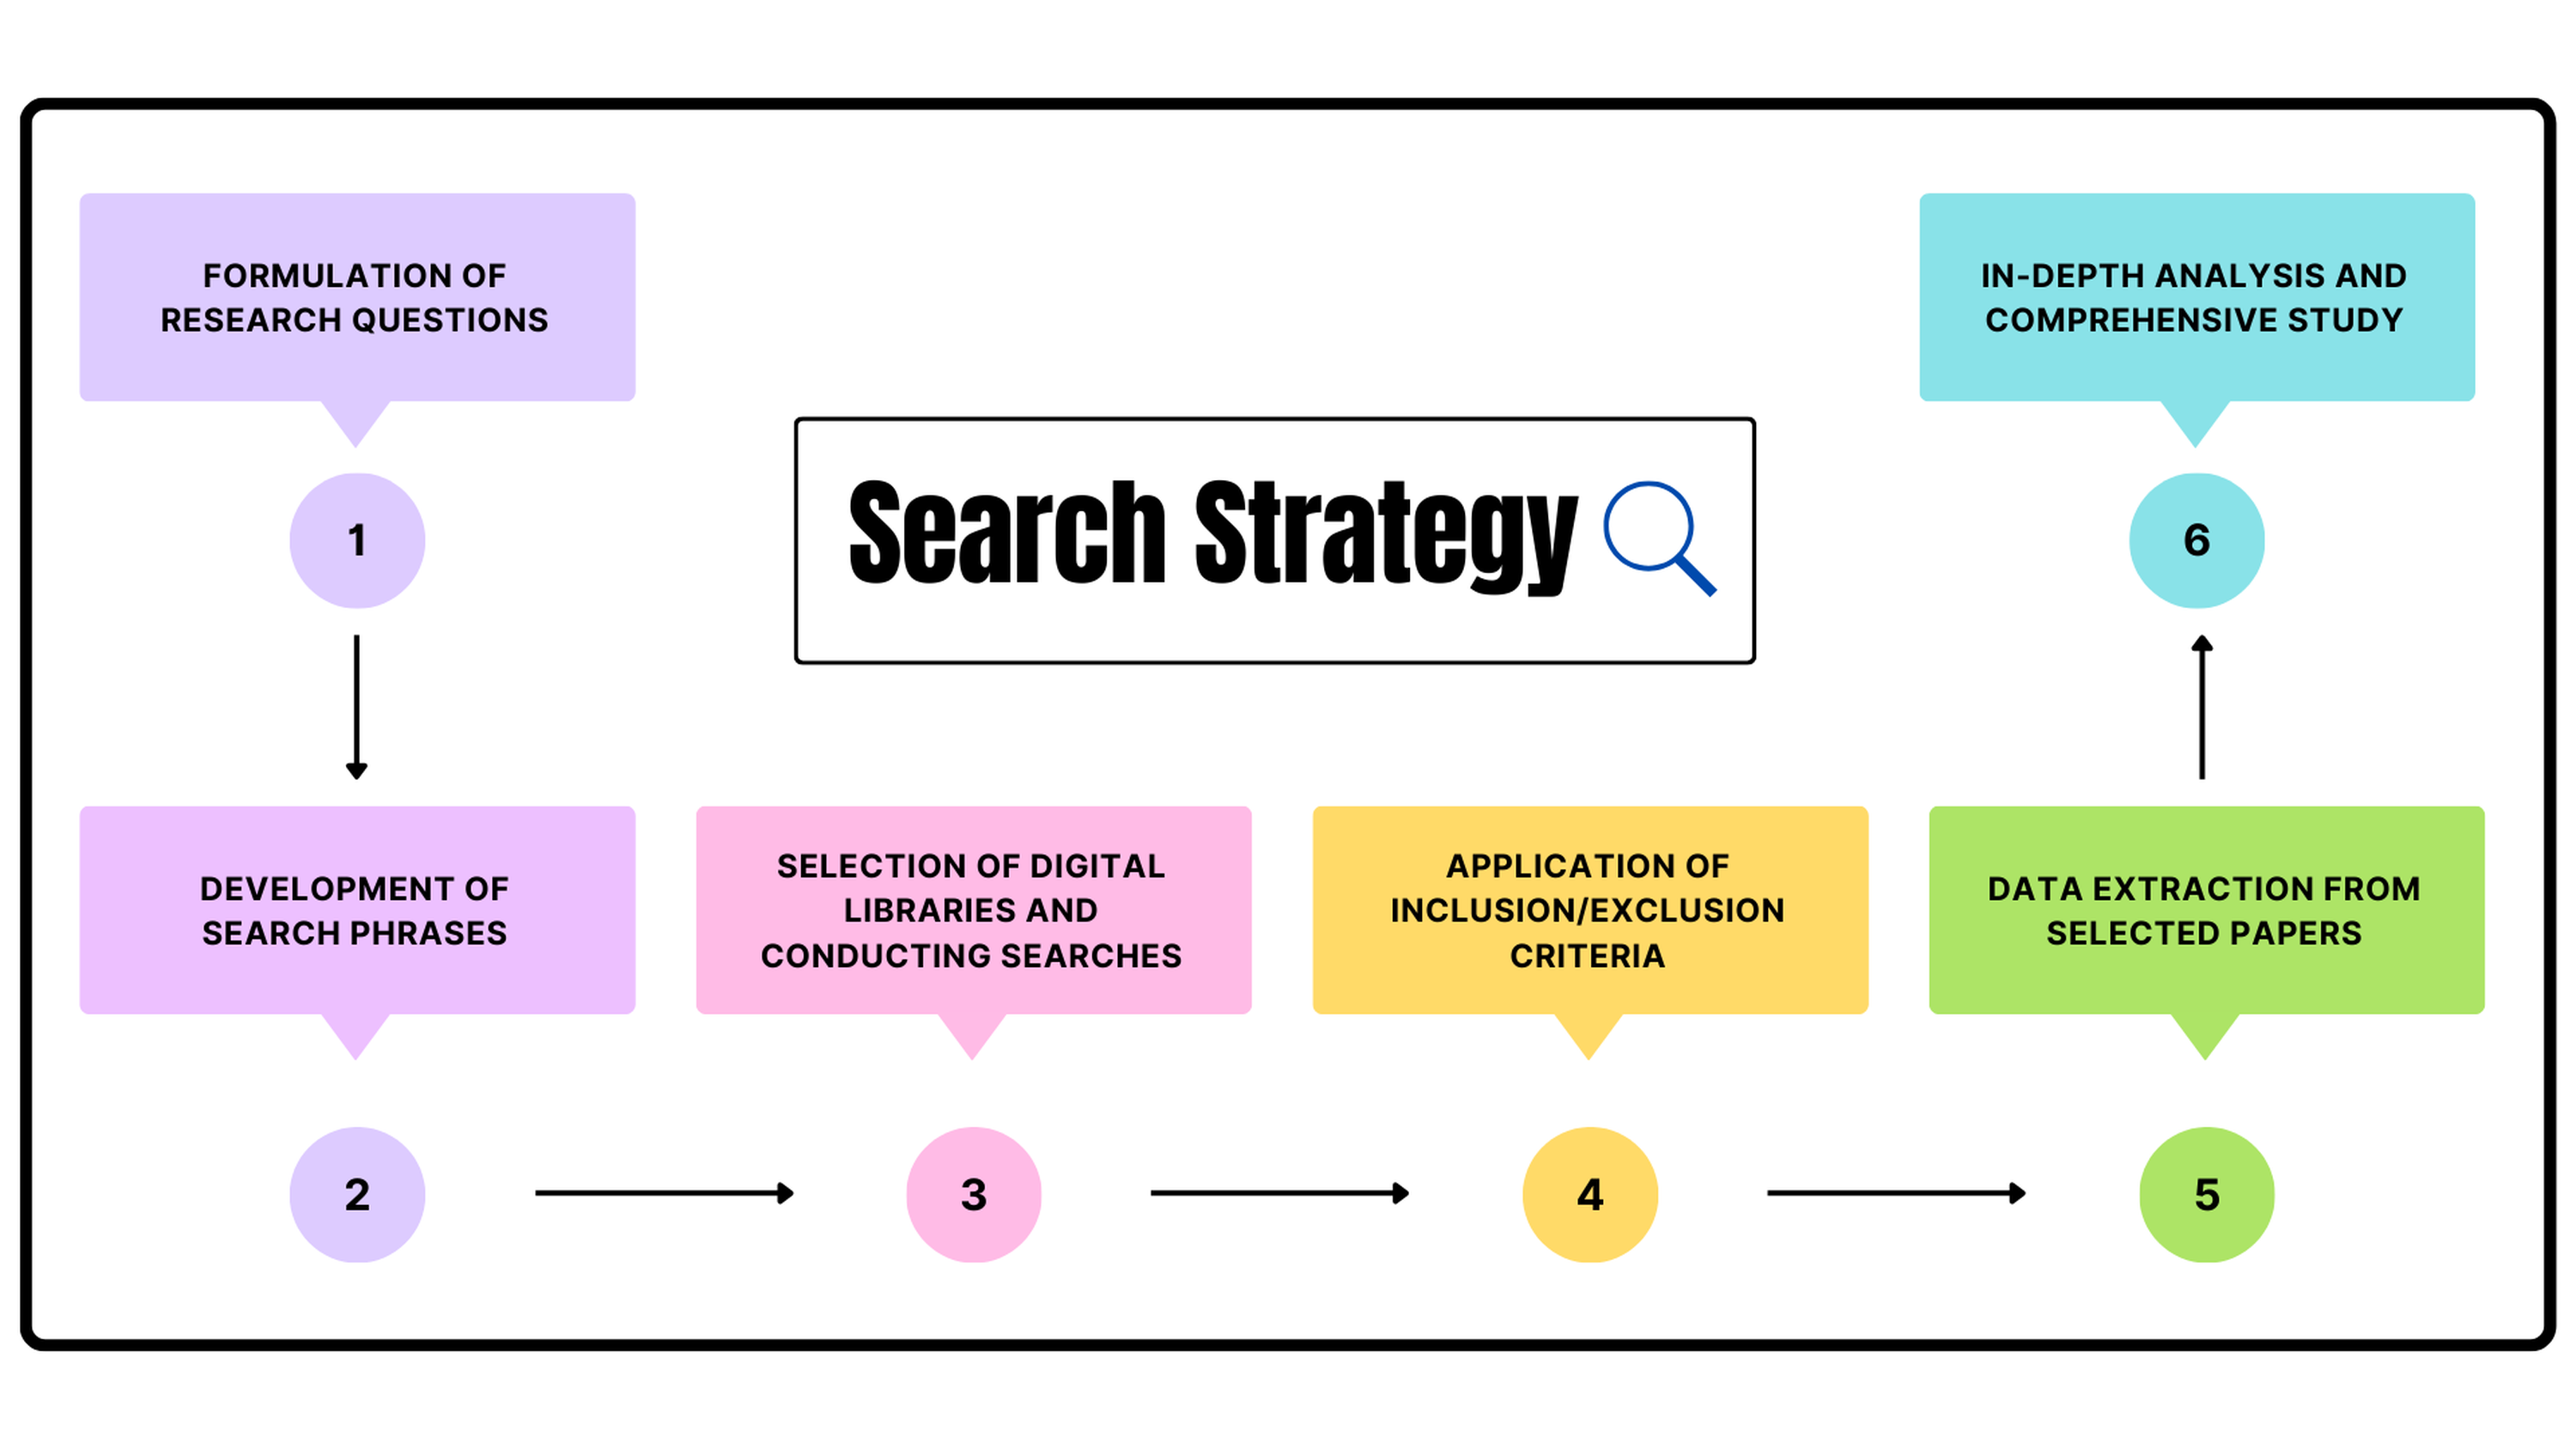
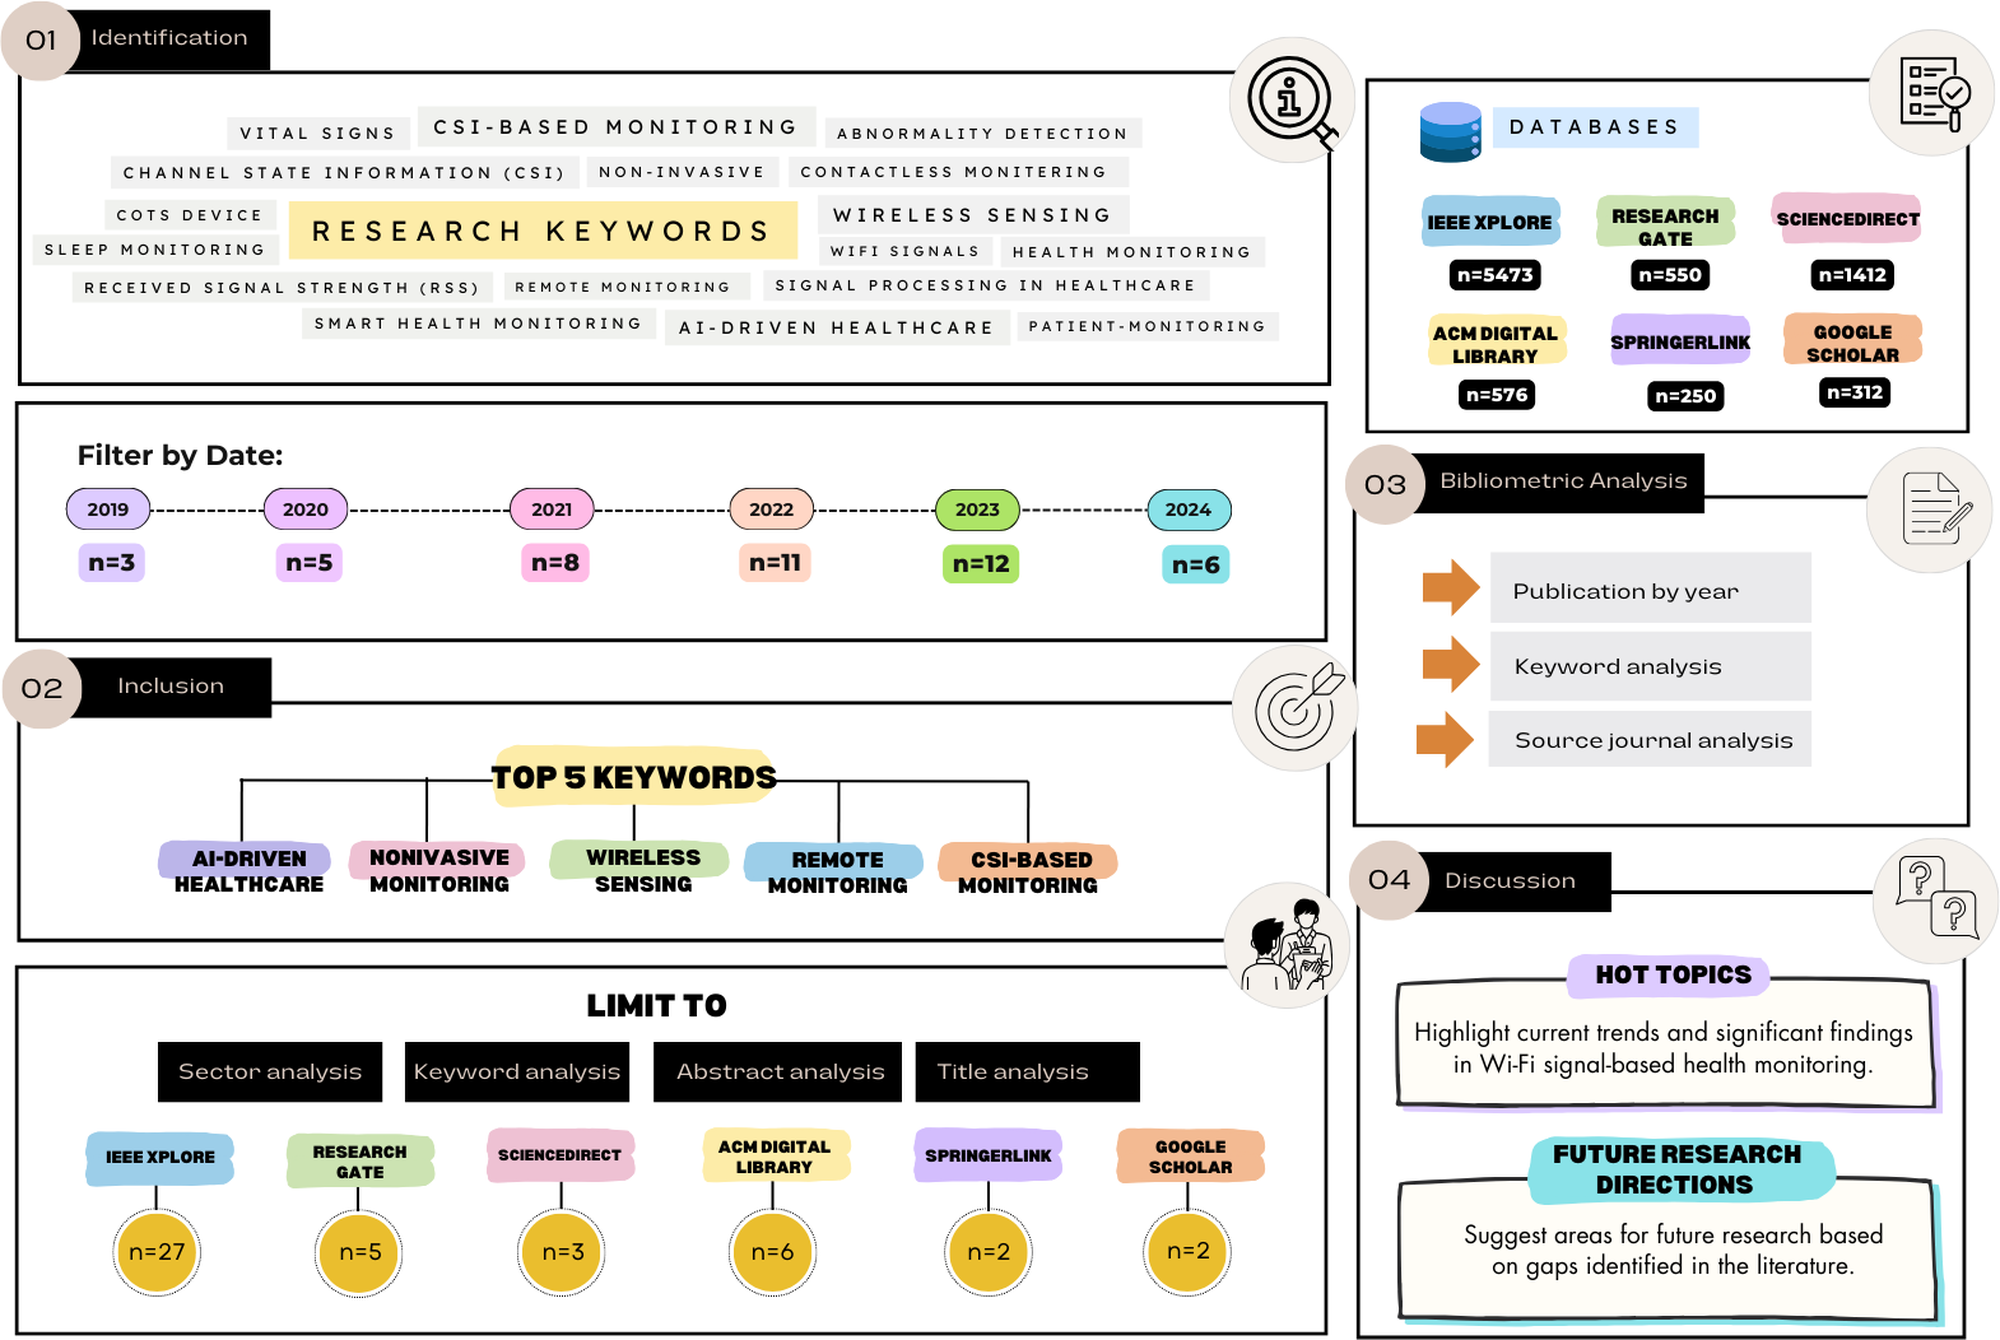
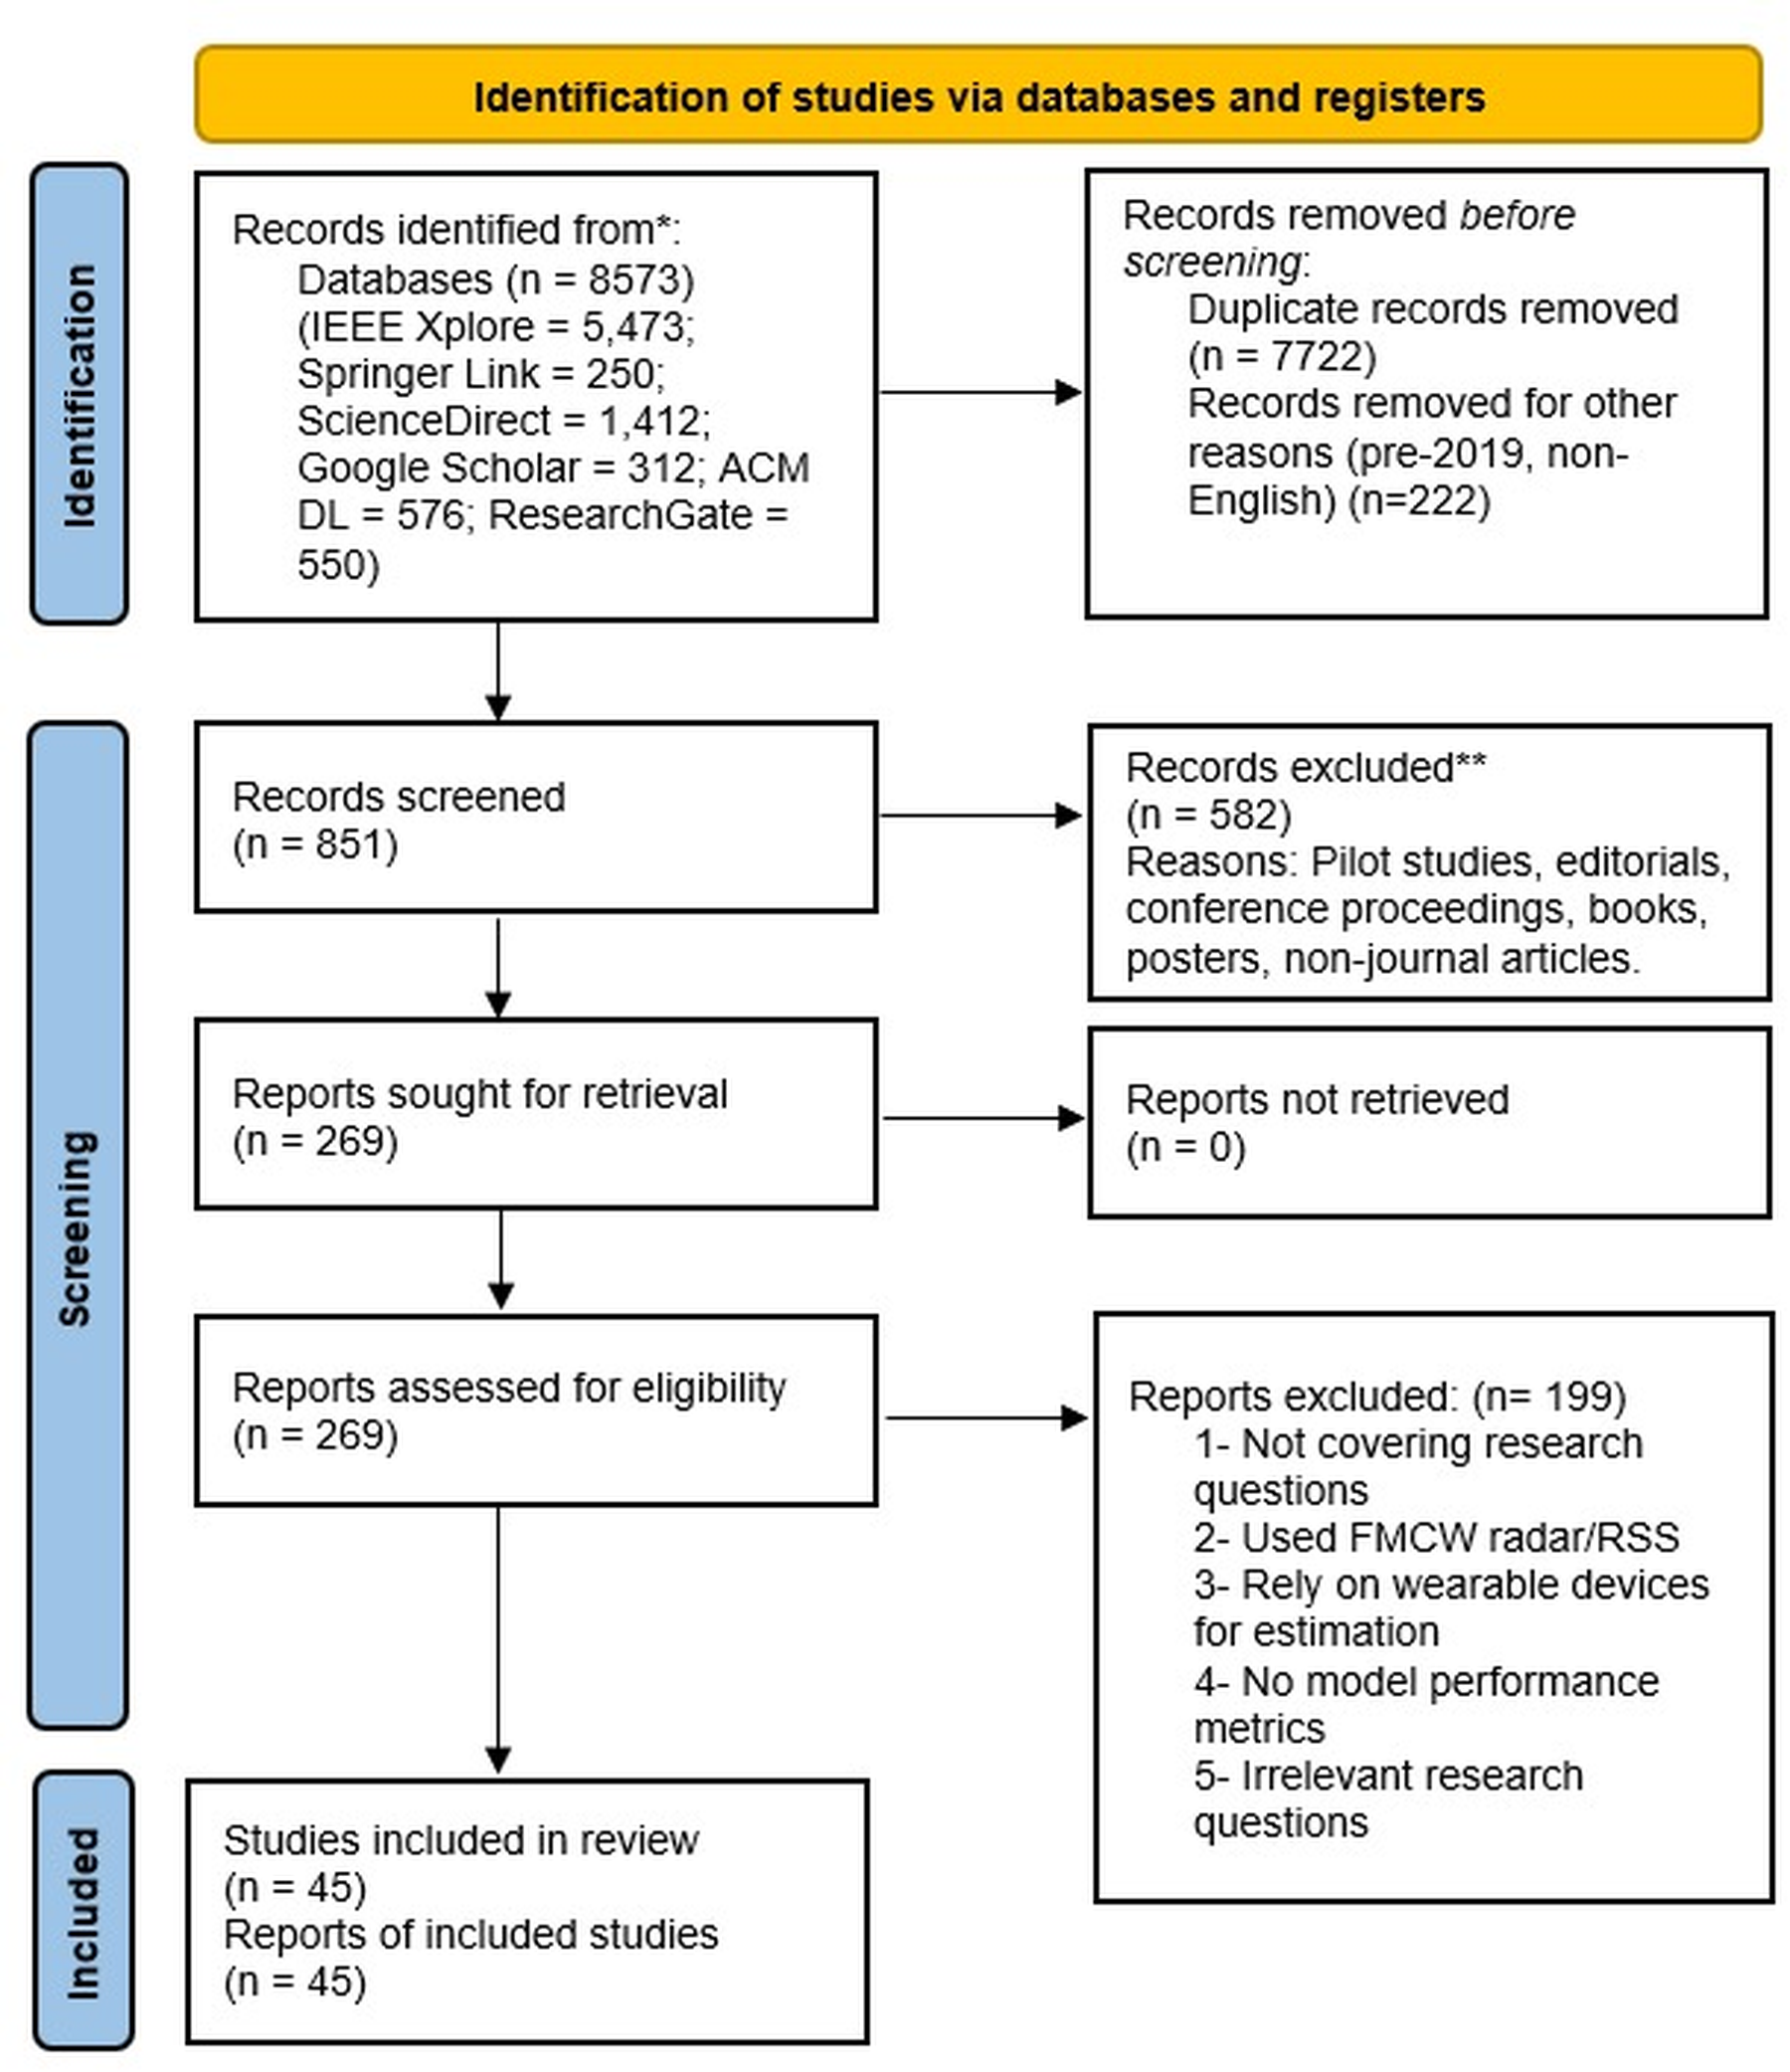
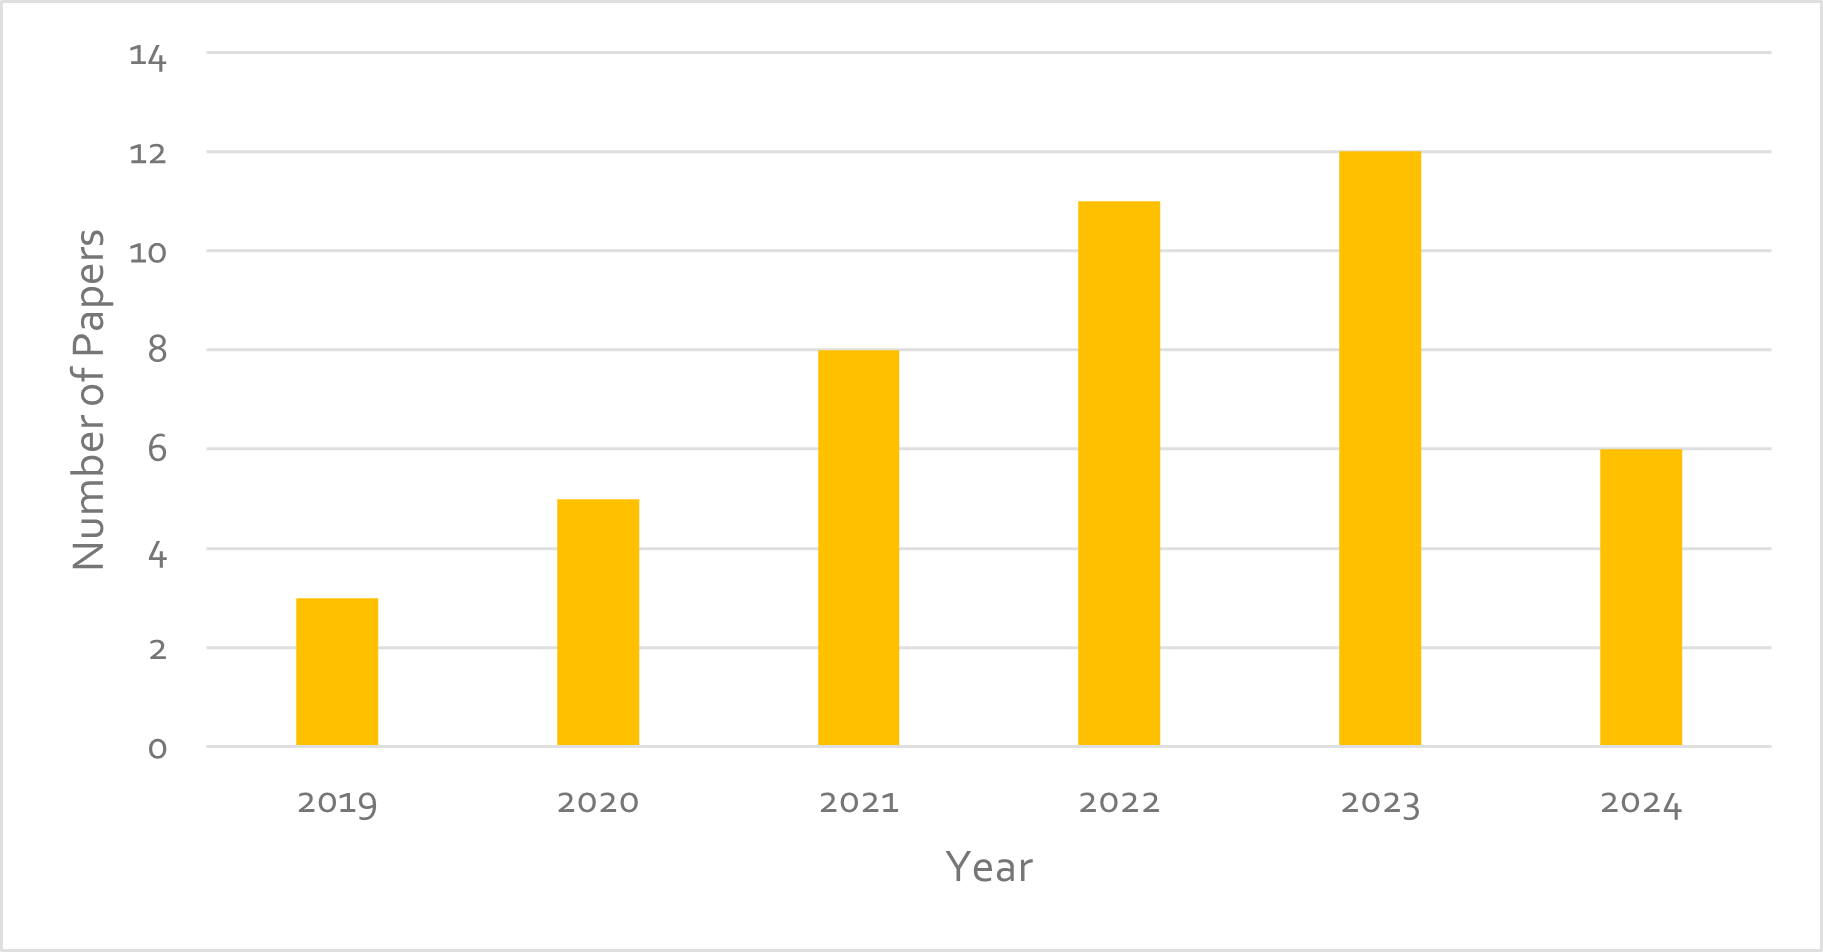