
PETRoberta: a novel method for charging station site selection evaluation
- Published
- Accepted
- Received
- Academic Editor
- Davide Chicco
- Subject Areas
- Algorithms and Analysis of Algorithms, Artificial Intelligence, Natural Language and Speech, Text Mining, Neural Networks
- Keywords
- Electric vehicle charging station siting, Prompt learning, Natural language processing, Text classification, Data mining
- Copyright
- © 2026 Tang et al.
- Licence
- This is an open access article distributed under the terms of the Creative Commons Attribution License, which permits unrestricted use, distribution, reproduction and adaptation in any medium and for any purpose provided that it is properly attributed. For attribution, the original author(s), title, publication source (PeerJ Computer Science) and either DOI or URL of the article must be cited.
- Cite this article
- 2026. PETRoberta: a novel method for charging station site selection evaluation. PeerJ Computer Science 12:e3373 https://doi.org/10.7717/peerj-cs.3373
Abstract
With the rapid adoption of electric vehicles, rational planning for charging station locations has become increasingly important. This study proposes a data-driven prompt learning–based approach for evaluating the suitability of charging station placement. By transforming regional features into natural language text, we introduce the Prompt-Enhanced Transportation RoBERTa (PETRoberta) model based on prompt learning to capture the relationship between regional characteristics and charging station operational conditions. Using Wuhan as a case study, we compare our method with several baseline models. The results show that PETRoberta achieves the highest average accuracy of 91.76% on the test set under five-fold cross-validation and reaches state-of-the-art performance across multiple evaluation metrics. Furthermore, ablation experiments demonstrate that the number of points of interest (POI) is the key factor influencing charging station operational efficiency. The confusion matrix also verifies that PETRoberta achieves the highest accuracy within each individual category. Overall, our method can effectively support charging station layout planning and make a significant contribution to the wider adoption and promotion of electric vehicles.
Introduction
As energy resources dwindle and environmental degradation escalates, an increasing number of people are embracing energy-efficient and eco-friendly lifestyles. Electric vehicles (EV), known for utilizing clean and affordable electric power, are gaining widespread popularity. In recent years, the global electric vehicle market has experienced rapid expansion due to a significant increase in the number of EV. According to research predictions by Canalys, global electric vehicle sales reached 13.7 million units in 2023, accounting for 17.1% of the total automotive market sales. The market is expected to grow by 27.1% in 2024, with sales reaching 17.5 million units. S&P Global Mobility’s 2024 global sales forecast indicates that electric passenger car sales will hit 13.3 million units, comprising 16.2% of the global passenger car sales. Particularly in the Chinese market, EV sales reached 7.6 million units in 2023, capturing a substantial 55.5% market share. Forecasts suggest that in 2024, China’s EV sales will reach 9.1 million units, representing 40% of the total sales. Data from the International Energy Agency (IEA) shows that in 2022, China accounted for 60% of global electric vehicle sales, making it the largest EV market worldwide. Furthermore, China’s EV sales will grow by 15% in 2022. This shift has exacerbated ecological pollution and led to the gradual depletion of fossil resources, with the global transportation sector now contributing a quarter of the world’s total carbon dioxide emissions (Fan et al., 2023). In addressing environmental issues in transportation, electric vehicles have emerged as a key solution (Mądziel & Campisi, 2023), with an increasing number of governments and businesses worldwide actively promoting the development of EV.
While EV exhibit significant advantages in environmental protection and energy efficiency, their development still faces numerous challenges (Yong et al., 2023). These include suboptimal site selection planning and inadequate charging infrastructure. Moreover, constraints such as limited driving range, charging difficulties, and potential long queues at charging stations further affect the convenience of EV use, user acceptance, and the profitability of charging stations, greatly hindering the wider adoption of EV. Consequently, the strategic planning of EV charging station locations holds significant importance for enhancing the charging infrastructure for EV users, boosting the operational profitability of service providers, and fostering the continued growth of the electric vehicle industry.
In response to the aforementioned issues, some scholars have proposed the construction of multi-objective functions, coupled with the establishment of constraint conditions tailored to local circumstances, to optimize the function and thereby complete the planning process (Gu et al., 2021). Additionally, there are studies suggesting the use of heuristic algorithms. However, these approaches often require stringent data input formats and are susceptible to overfitting. Others have proposed site planning based on rich user trajectory data (Hehuan & GeQin, 2021; Lei et al., 2022; Wang et al., 2021). Additionally, with the rise of deep learning, some research has integrated deep learning methods with charging station site selection tasks (Xia, Liao & Chen, 2021; Lee et al., 2020; Haoyu et al., 2020; Petratos et al., 2021). However, these methods often only apply to specific scenarios and lack generalizability to other cities and regions.
However, these methods usually impose strict requirements on the format of input data. Moreover, both in the process of constructing constraints and in designing objective functions, they rely heavily on human preferences, which greatly limits their scalability. On the other hand, such methods often find it difficult to evaluate site suitability for certain specific regions. Natural language, due to its flexible form, can provide detailed descriptions of various features in a highly adaptable manner. Some studies have already attempted to describe other tasks using natural language and to solve them with text models. However, very few studies have combined regional site selection evaluation with natural language models. Against this background, this study proposes to integrate electric vehicle charging station siting with text models, introducing a data-driven prompt learning–based suitability evaluation model for site selection. Specifically, the data-driven Prompt-Enhanced Transportation RoBERTa (PETRoberta) charging station site evaluation model first conducts clustering analysis of charging station operational features based on real-world conditions to derive operational states. Then, using existing samples, the PETRoberta model is trained to learn the internal relationship between regional characteristics and post-construction operational states. In this way, the model can evaluate the operational status levels of regions without existing or planned stations, providing references for charging station providers when selecting sites. Portions of this text were previously published as part of a preprint (Tang et al., 2024).
The main contributions of this study are summarized as follows:
-
(1)
Natural language usually carries rich semantic information and can flexibly and comprehensively describe charging station characteristics and regional attributes, while placing fewer restrictions on input formats. We propose transforming the charging station siting task into a natural language text classification problem and using language models to mine deep semantic information from text, thereby offering optimized site selection recommendations for areas without charging infrastructure. Our method enables site suitability evaluation for any region, demonstrating strong flexibility and scalability.
-
(2)
We propose using the prompt learning-based PETRoberta model. By constructing specific prompt templates, regional structured features are transformed into natural language text. A natural language encoder then encodes the input text, and the extracted features are combined with the original input features as semantic supplements. Finally, these are fed into a classification model to complete prediction. Multiple cross-validation experiments have proven the effectiveness of the proposed method.
-
(3)
In this study, we propose a data-driven regional charging evaluation model. By clustering features directly related to charging station operations, we obtain operational grades and use the PETRoberta model for prediction. Through ablation experiments, the study further identifies the core factors influencing charging station siting. The proposed framework demonstrates strong generalizability, and the method has been validated to improve performance when additional input features are incorporated, without altering the original structure. This provides a new research paradigm for charging station site evaluation and lays the foundation for further developments in the field.
Related work
Research progress on EV charging station location
Facing the rapid growth of EVs, effective charging station site assessment is crucial for optimal placement, demand satisfaction, resource allocation, and user experience. The charging station location problem, a type of non-special facility location issue, is NP-hard, making exact solutions in polynomial time difficult.
Current research mainly falls into four categories: optimization models, biogeographic optimization, decision support, and behavior- or policy-based methods (Zhou, Zhu & Luo, 2022). Optimization approaches use mathematical models to seek optimal or near-optimal solutions. For example, He, Song & Liu (2019) formulated charging station layout as a mixed-integer linear program minimizing total costs; other works focus on cost reduction under reliability and service quality constraints (Davidov & Pantoš, 2019), maximum coverage (Frade et al., 2011), or bi-level programming solved with genetic algorithms (He, Yin & Zhou, 2015). Studies have also optimized placement based on driving patterns (Shahraki et al., 2015), stochastic flow models (Wu & Sioshansi, 2017), and particle swarm optimization in smart cities (Aljaidi et al., 2024b).
Biogeographic approaches mimic ecological adaptation strategies, useful for complex settings. Liu et al. (2018) applied a multi-objective biogeography-based method considering battery characteristics. Decision support methods include Bayesian networks for quantitative and qualitative factors (Hosseini & Sarder, 2019) and Geographic Information System (GIS) with multi-criteria decision making for photovoltaic stations (Zhou et al., 2020). Behavior-policy frameworks also emerged, such as Zeng et al.’s (2021) site-level optimization for pricing and charging plans and Quality of Experience (QoE)-based assignment models prioritizing user experience (Aljaidi et al., 2024a).
Algorithmic strategies remain central. Arslan & Karaşan (2016) used Benders decomposition to maximize mileage and minimize transport costs; Dong et al. (2016) applied clustering for cost reduction; Zhu et al. (2016) employed genetic algorithms for site and pile decisions; Brandstätter, Kahr & Leitner (2017) applied stochastic optimization with heuristics; Wu et al. (2019) combined dynamic programming and evolutionary algorithms for optimal charging times. Sustainability is also emphasized, e.g., energy-efficient placement strategies (Aljaidi et al., 2020).
Emerging directions integrate autonomy and intelligence. Quttoum et al. (2024) proposed Anxiety-Free Autonomous Routing Model for Electric Vehicles with Dynamic Route Preferences (AFARM), an anxiety-free routing model incorporating charging into navigation. Surveys further synthesize techniques, gaps, and future directions (Aljaidi et al., 2022).
Overall, optimization models, heuristics, and machine learning approaches dominate charging station location studies. Yet, they often rely on domain-specific assumptions and struggle in highly complex environments, risking local optima and limited generalization.
Advances in data-driven siting evaluation
To overcome the limitations of traditional optimization methods in terms of complexity and generalization, researchers have recently begun exploring data-driven and machine learning approaches in charging station siting and evaluation. These methods, through large-scale data mining and statistical modeling, can more effectively capture the latent relationships between regional characteristics and charging demand, thus providing more flexible tools for siting decisions (He, Kuo & Wu, 2016).
In demand forecasting, existing studies have modeled regional charging demand using supervised learning models based on historical travel data, traffic flow, and points of interest information. Common methods include random forest, support vector machines, and gradient boosting trees. These approaches predict the demand and potential utilization of charging station construction in different regions by modeling multidimensional input features (Jeon, Kang & Seo, 2022; Wang et al., 2023). Compared with traditional optimization methods, machine learning models show stronger adaptability in handling high-dimensional inputs, nonlinear relationships, and complex constraints.
In explorations of deep learning, some studies have introduced neural network models that integrate spatial, temporal, and socioeconomic data for station evaluation. For example, convolutional neural networks (CNNs) have been used to capture spatial patterns and traffic flow features, while recurrent neural networks (RNNs) have been employed to model temporal variations in charging demand (Zheng et al., 2019; Kong et al., 2017). These methods have improved prediction accuracy to some extent and better reflect siting suitability under dynamic environments.
At the same time, clustering and unsupervised learning methods have also been widely applied in regional segmentation and demand pattern discovery. By clustering travel trajectories, population distribution, and energy consumption characteristics, researchers identify functional attributes and potential demand features of different regions, thereby providing auxiliary information for downstream siting planning (Sun, Chen & Yin, 2020; Yang, Dong & Hu, 2017).
Despite the greater flexibility and predictive power of data-driven methods, they still face certain limitations in application. First, these methods rely heavily on large volumes of labeled or high-quality historical data; when data are scarce or regional features are missing, predictive performance declines significantly (Li, Yang & Sandu, 2018). Second, most studies treat regional features merely as numerical inputs, ignoring their complex semantic associations, which leads to shortcomings in model generalization and interpretability (Zhang et al., 2019).
Therefore, how to integrate semantic information of regional features with data-driven modeling to enhance the accuracy and generalization of charging station siting evaluation has become an urgent problem to address. This also provides the motivation and entry point for the siting suitability evaluation method proposed in this article, which is based on natural language processing and prompt learning.
Pre-trained language models and prompt learning
In recent years, with the rapid development of large-scale pre-trained language models (PLMs), natural language processing (NLP) has demonstrated outstanding performance in many downstream tasks (Devlin et al., 2019; Brown et al., 2020; Raffel et al., 2020). Unlike traditional methods that rely on handcrafted features and domain knowledge, PLMs learn rich semantic representations from large-scale corpora, enabling them to flexibly capture deep relationships among complex features. This advantage has motivated research in some non-linguistic fields to reformulate structured problems as natural language tasks, leveraging language models for prediction and reasoning (Liu et al., 2023; Han et al., 2021).
Within this trend, prompt learning has emerged as an important research direction in recent years (Zhao et al., 2023). The core idea of prompt learning is to construct suitable “prompt templates” that transform input features into natural language expressions, thereby activating the knowledge and representational capabilities already embedded in pre-trained models. Representative methods include Pattern-Exploiting Training (PET) (Schick & Schütze, 2020), P-tuning (Liu et al., 2024), and prompt tuning (Newman, Choubey & Rajani, 2021), which, through template design and a small number of labeled samples, can achieve performance on downstream classification, relation extraction, and knowledge transfer tasks that rivals or even surpasses traditional fine-tuning.
Existing research shows that prompt learning not only effectively mitigates the problem of insufficient labeled data but also enhances model generalization across tasks and domains (Gao, Fisch & Chen, 2020). For instance, in tasks such as sentiment analysis, textual entailment, and question answering, prompt-based methods have achieved significant progress (Schick & Schütze, 2020). Meanwhile, some studies have explored its applications in cross-modal tasks, such as converting images or structured data into textual descriptions and then feeding them into language models for processing (Radford et al., 2021; Alayrac et al., 2022). This approach opens new possibilities for extending NLP techniques to more non-linguistic tasks.
However, research on transforming charging station site selection and evaluation tasks into natural language problems remains quite limited. Most existing methods remain at the stage of modeling numerical features, lacking in-depth exploration of semantic associations between regional characteristics and operational conditions (Zhang et al., 2019; Li, Yang & Sandu, 2018). Therefore, how to leverage prompt learning to convert structured regional features into natural language forms, and use PLMs for semantic modeling, becomes an important direction worth exploring.
Against this backdrop, this article proposes a PETRoberta model based on prompt learning, which transforms regional features into natural language text inputs and enhances semantic modeling through prompt templates, thereby enabling the evaluation of charging station site suitability. This method not only enriches the application scenarios of NLP in emerging tasks but also provides a new research paradigm for electric vehicle charging station site selection.
Materials and Methods
This section provides a detailed exposition of the methodology and underlying principles for electric vehicle (EV) charging station siting planning based on prompt learning. The process begins by gridding the selected study area. For each training grid, “charging station features” and “regional features” are aggregated from existing data. Using the charging station features, unsupervised clustering is then applied to the training samples in order to capture the operational status of existing charging stations within each grid. Subsequently, a prompt-learning-based text constructor is employed to generate textual representations of the regional features. Finally, by integrating the text prompt module with the original grid information, a classification model is utilized to predict the category of each grid. The core workflow of the proposed framework is illustrated in Fig. 1.
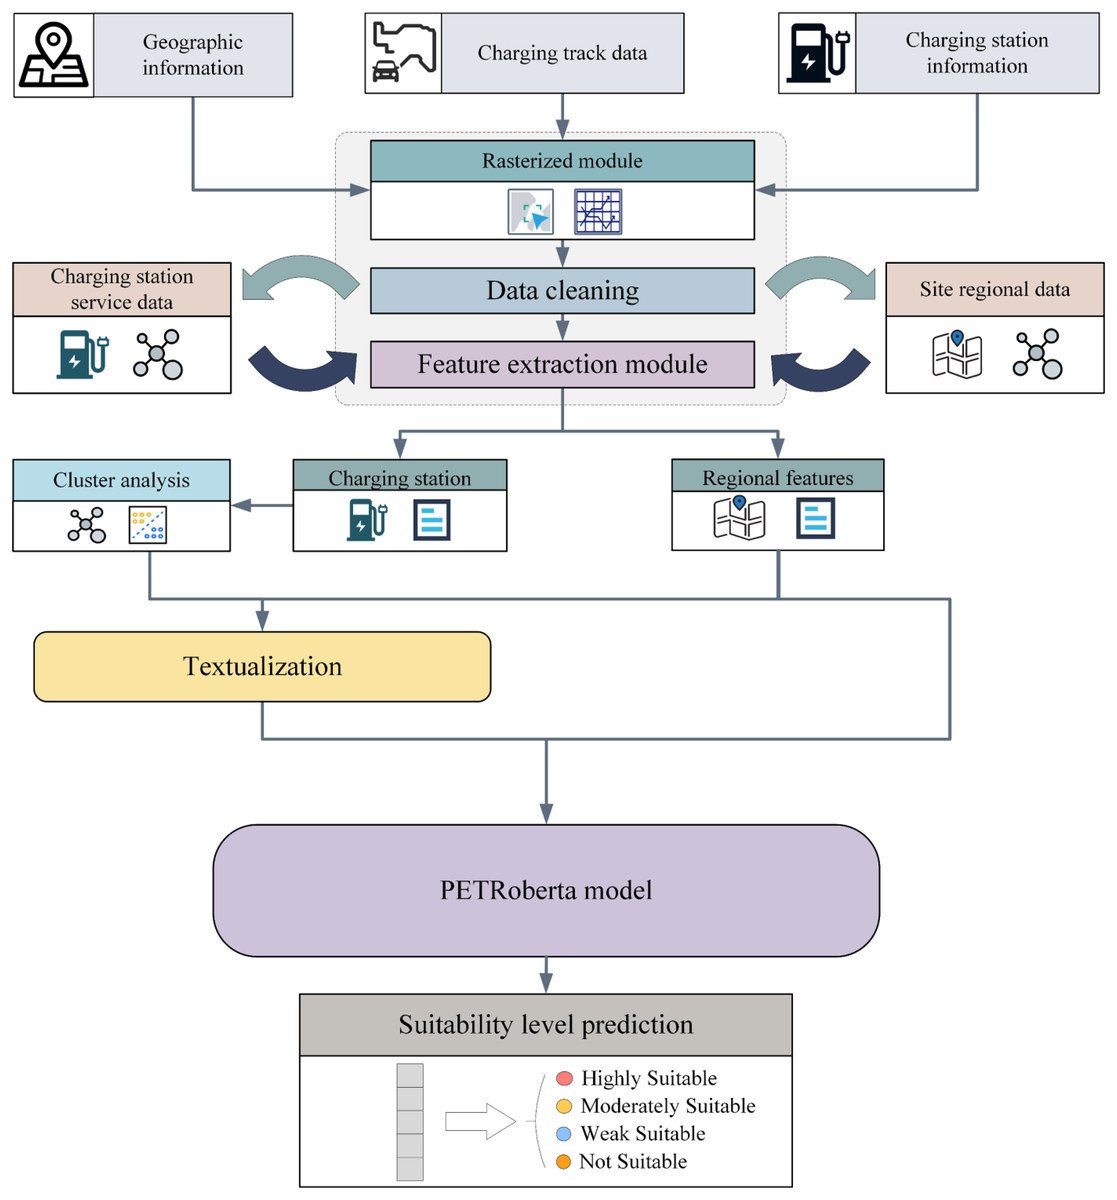
Figure 1: The overall workflow structure.
The data are derived from geographical information, charging trajectories, and charging characteristics. After rasterizing the regions, data aggregation is performed to obtain charging station features and regional features. Clustering analysis is then applied to the charging station features, and after obtaining the labels, the regional features are transformed into natural language text through textualization. Finally, both are fed into the PETRoberta model for prediction.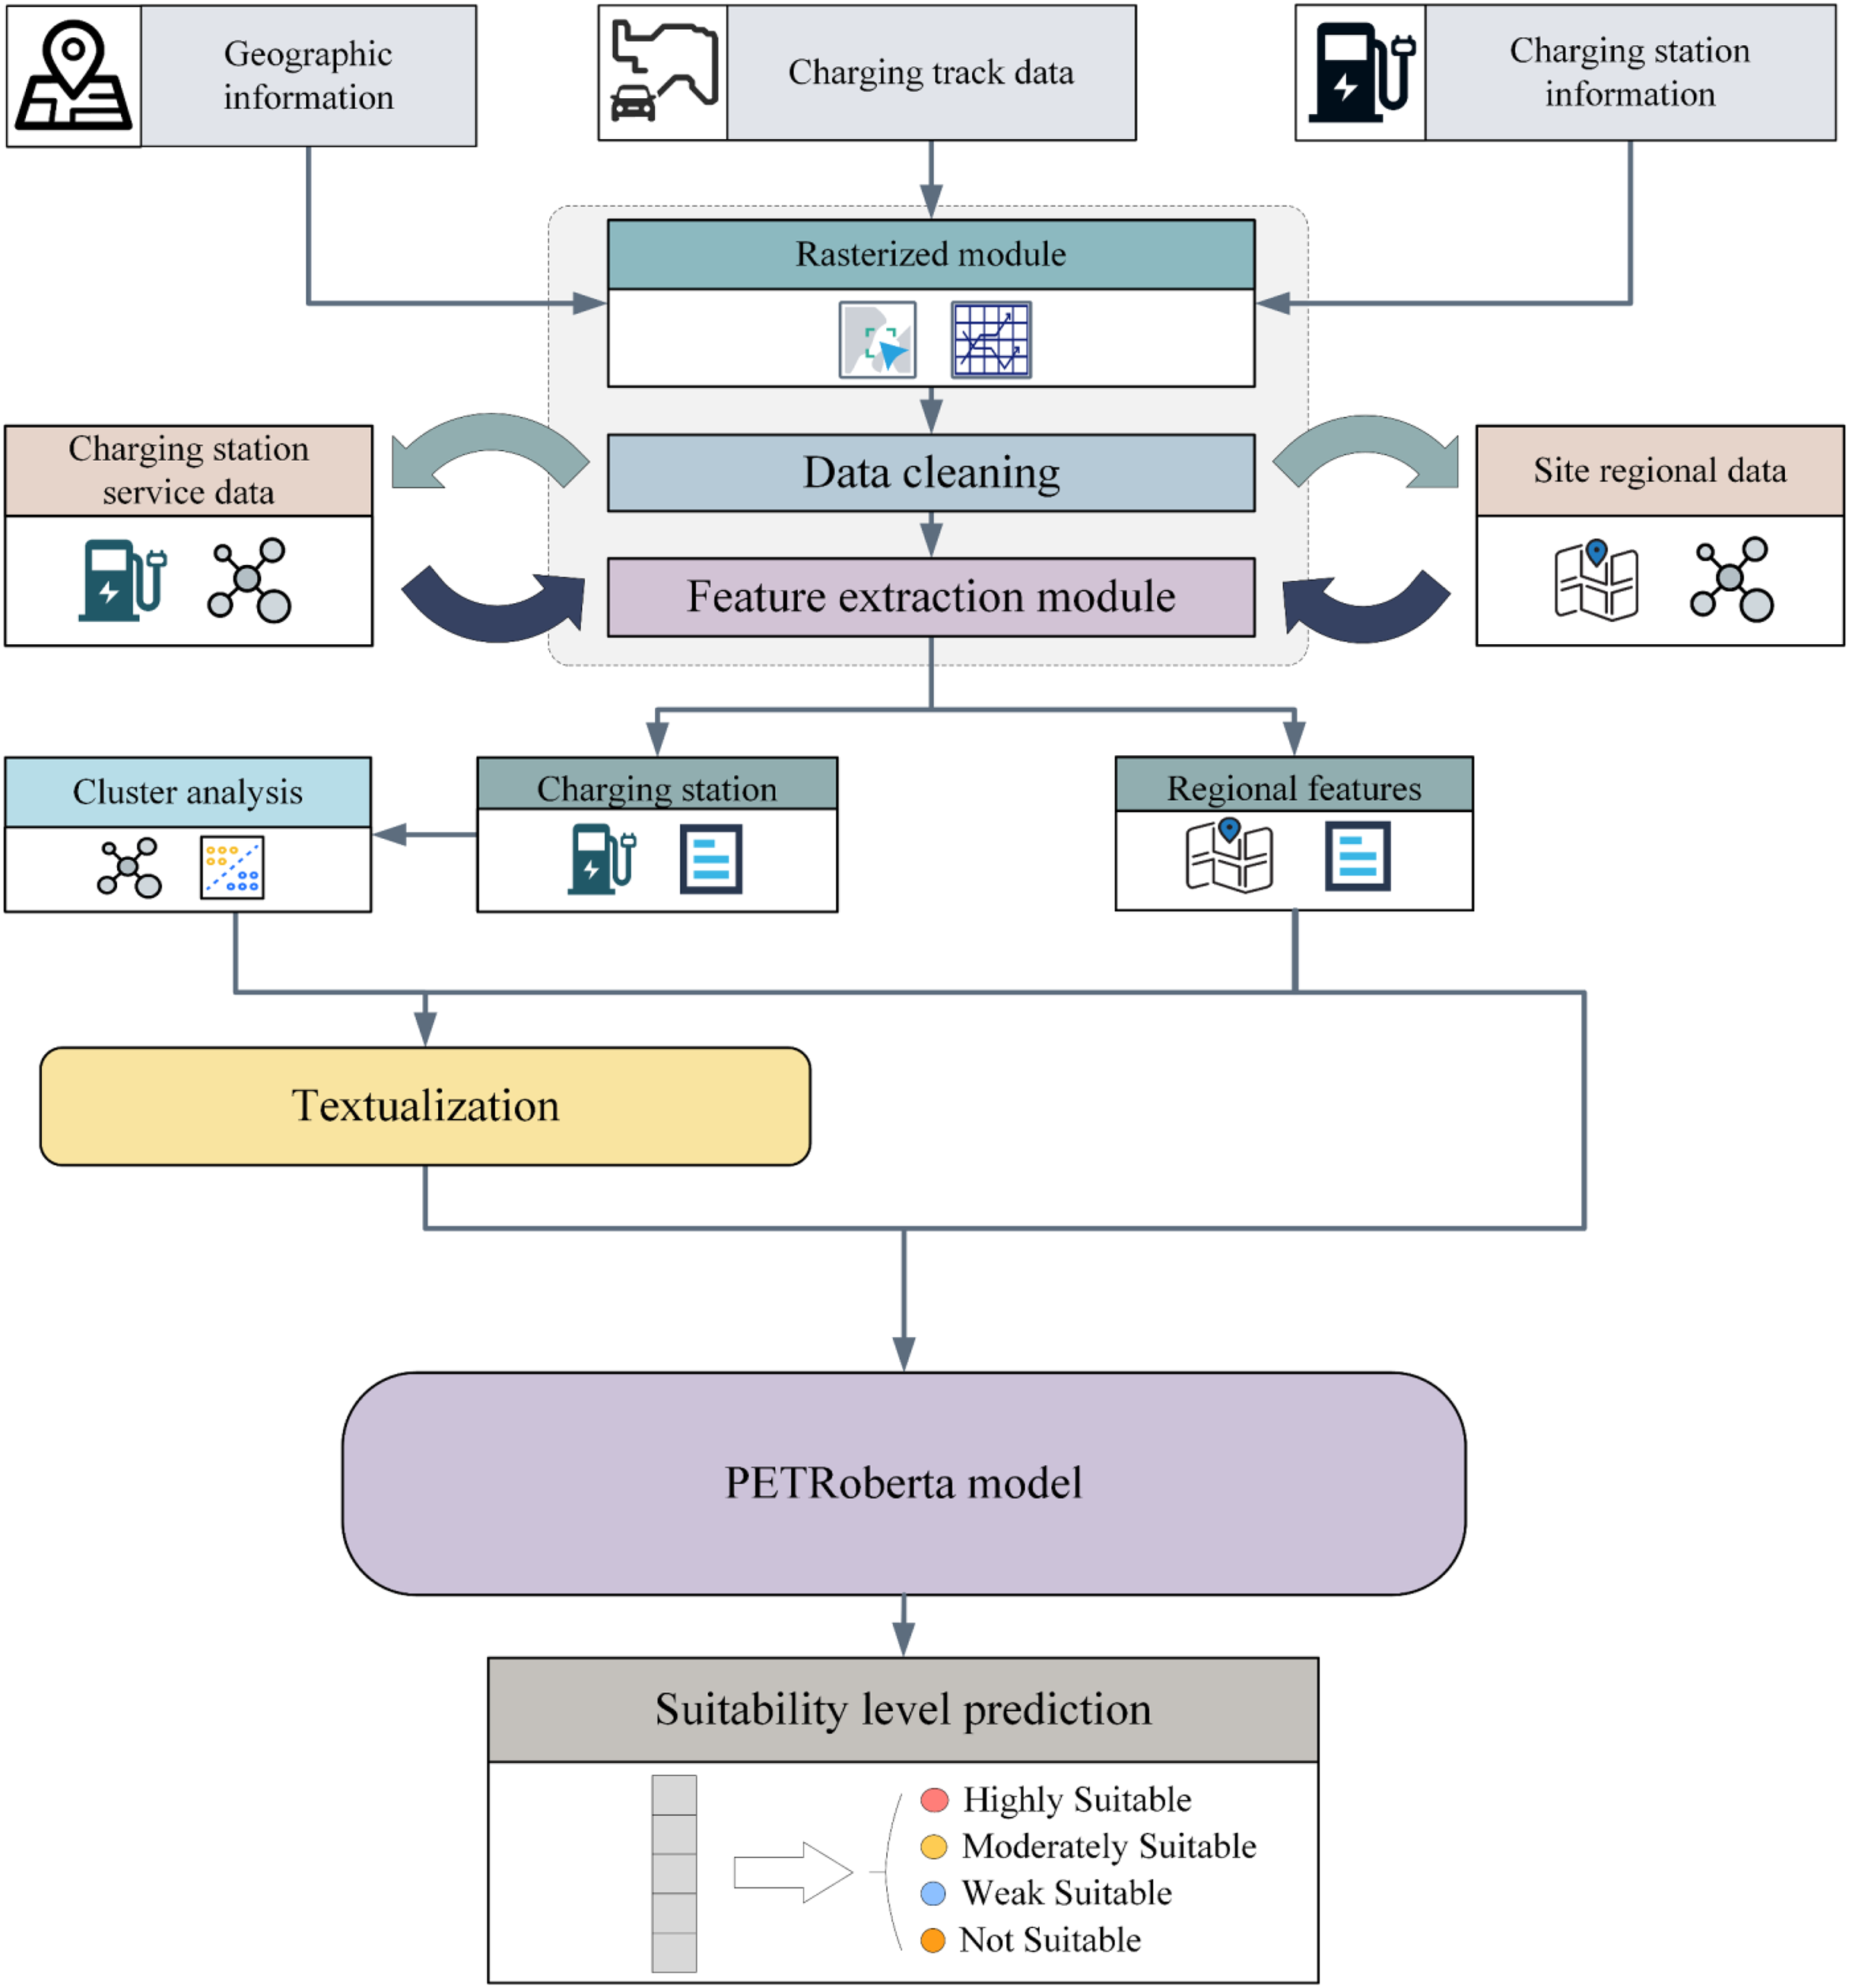
Modeling framework for future-oriented evaluation
This study proposes a forward-looking modeling framework that builds mappings between features that can be collected at the current moment and outcomes that can only be observed in the future. In this way, it becomes possible to evaluate future situations. Specifically, suppose the currently observable features are , the future observable evaluation outcomes are , and these outcomes are in fact derived from other features, only collectable in the future, , through a certain interpretable aggregation strategy: , Here, W represents the weight matrix, and is the bias term. Correspondingly, our proposed evaluation framework aims to directly model the mapping between the currently observable features and the future outcomes, which can be formalized as:
here, denotes the predictive function to be learned.
Taking the siting of electric vehicle charging stations as an example, after discretizing the target area into grids, we classify the features within each grid into two categories: charging-station features and regional features. Charging-station features can only be obtained after a station has been built and put into operation; they are mainly related to usage and operation of the station, such as the number of times it is chosen or the amount of electricity supplied. These features directly reflect operational performance, and thus correspond to in the above formulation.
On the other hand, regional features refer to information that can already be collected to reflect the basic attributes of the grid, such as population density, transportation accessibility, or the availability of surrounding facilities. Our modeling objective is to explore the relationship between regional features and charging-station operational features, so that in areas where stations have not yet been built, the potential operational performance of a station can be evaluated, thereby providing guidance for siting decisions.
Prompt-learning-based natural language enhanced feature representation
Natural language can transform originally isolated numerical or categorical features into intuitive semantic representations, thereby helping the model capture potential feature associations. To this end, this study proposes describing regional features using natural language text, in order to assist the model in better understanding these features. Specifically, let the set of regional features be defined as , where represents a numerical or categorical feature. If we directly input , the model may find it difficult to perceive its relative position within the overall distribution. Therefore, we define a quantile function:
to indicate the distribution interval in which feature lies. The four quantile intervals are mapped to “low,” “medium,” “high,” and “highest.” Based on this, we construct a natural language description function, which converts the above prompt information into a textual representation. An example is as follows:
“The value of feature in this region is , and its quartile interval is ‘low’; the value of feature is , and its quartile interval is ‘highest’; …; after the station is built in this region, what is the categorical state of charging station operation?”
In this way, each numerical feature not only retains its original numerical information, but also carries semantic cues of its distributional level.
Within the prompt-learning framework, we further construct a prompt template and an answer space , and embed all natural language prompts into a vector space:
here, denotes the text embedding model (e.g., a RoBERTa encoder).
After constructing the natural language prompts, we not only treat them as independent input features, but also regard them as a semantic supplement and explanation to the original tabular features.
The conventional tabular feature encoding contains only numerical information, lacking global distributional cues and semantic context.
In contrast, the natural language prompt vector h, by describing each feature’s distributional position and semantics, can serve as an “explanatory signal” to guide the model toward a deeper understanding of the meaning embedded in z. Therefore, in the fusion stage, we do not simply concatenate vectors; instead, we inject the natural language embedding h as a conditional prompt into the tabular feature representation z.
Formally, the fusion process is defined as:
where denotes the feature fusion operator.
Unlike traditional concatenation, our implementation leverages h as a prompt signal, guiding the model to learn higher-order semantic relations of z. For example, when the numerical feature , inputting only the raw value may not sufficiently capture its meaning in the sample space. However, through the natural language prompt “this feature lies in the 4th quantile interval of the overall distribution,” the model can more clearly perceive its relative importance.
Finally, the fused representation u incorporates both the raw numerical information and the global distributional and semantic explanations provided by the natural language prompts, thereby enabling more accurate predictions:
where is the classification model. In this study, we adopt RoBERTa as the core classifier.
Unsupervised clustering-based label generation and optimization
To avoid subjective bias leading to erroneous evaluation of charging station operation, this study adopts a data-driven unsupervised labeling approach. Specifically, with respect to the aforementioned “charging station features,” we propose clustering the feature representations of charging stations, thereby deriving operational status labels from the clustering results. Concretely, suppose there are M charging stations under study, where each station is represented by a feature vector:
where denotes the dimensionality of the regional feature space. To eliminate discrepancies in feature scales, all dimensions are standardized prior to clustering. In the standardized feature space, the objective of clustering is to minimize the within-cluster sum of squared errors. Let the number of clusters be K, with clustering results denoted by and corresponding cluster centroids . The optimization objective is:
The iterative algorithm proceeds as follows: first, initialize K centroids randomly. At iteration t, assign each sample to its nearest cluster according to Euclidean distance:
and then update each cluster centroid as the mean of the assigned samples:
The iterations continue until convergence of the objective function or until a maximum iteration number T is reached.
Finally, this study adopts the cross-entropy loss function as the optimization objective for the classification model. This function effectively measures the discrepancy between the predicted probability distribution and the ground-truth labels, and updates model parameters through backpropagation. Formally, the loss function is defined as:
where M is the number of samples, C is the number of classes, is the ground-truth label of the -th sample for class , and is the predicted probability. By minimizing this loss function, the model progressively improves its classification performance.
Experiment and results
Data collection and preprocessing
During the data collection phase, this study gathered charging data and user trajectory information from select users of the State Grid Hubei Electric Power Research Institute for the third quarter of 2023. Firstly, to ensure user privacy, the collected data underwent rigorous anonymization. Then, the study conducted a comprehensive analysis of user trajectory data combined with charging behavior data. By extracting data daily, the study acquired multi-dimensional secondary features such as charging load, number of low-battery vehicles, frequency of charging station choice, power supply, average waiting time of users, and average charging distance. In total, 8,740 standardized data records were obtained.
To obtain label information for each grid in order to complete subsequent evaluation model training, and to avoid errors caused by human subjective bias, this study adopts an unsupervised clustering method to determine the operational levels of charging stations. The features involved in clustering are mainly those directly related to the operation of charging stations, such as power supply of the station, the number of times the station is selected, charging fees, the average charging distance per user, and the average waiting time for charging.
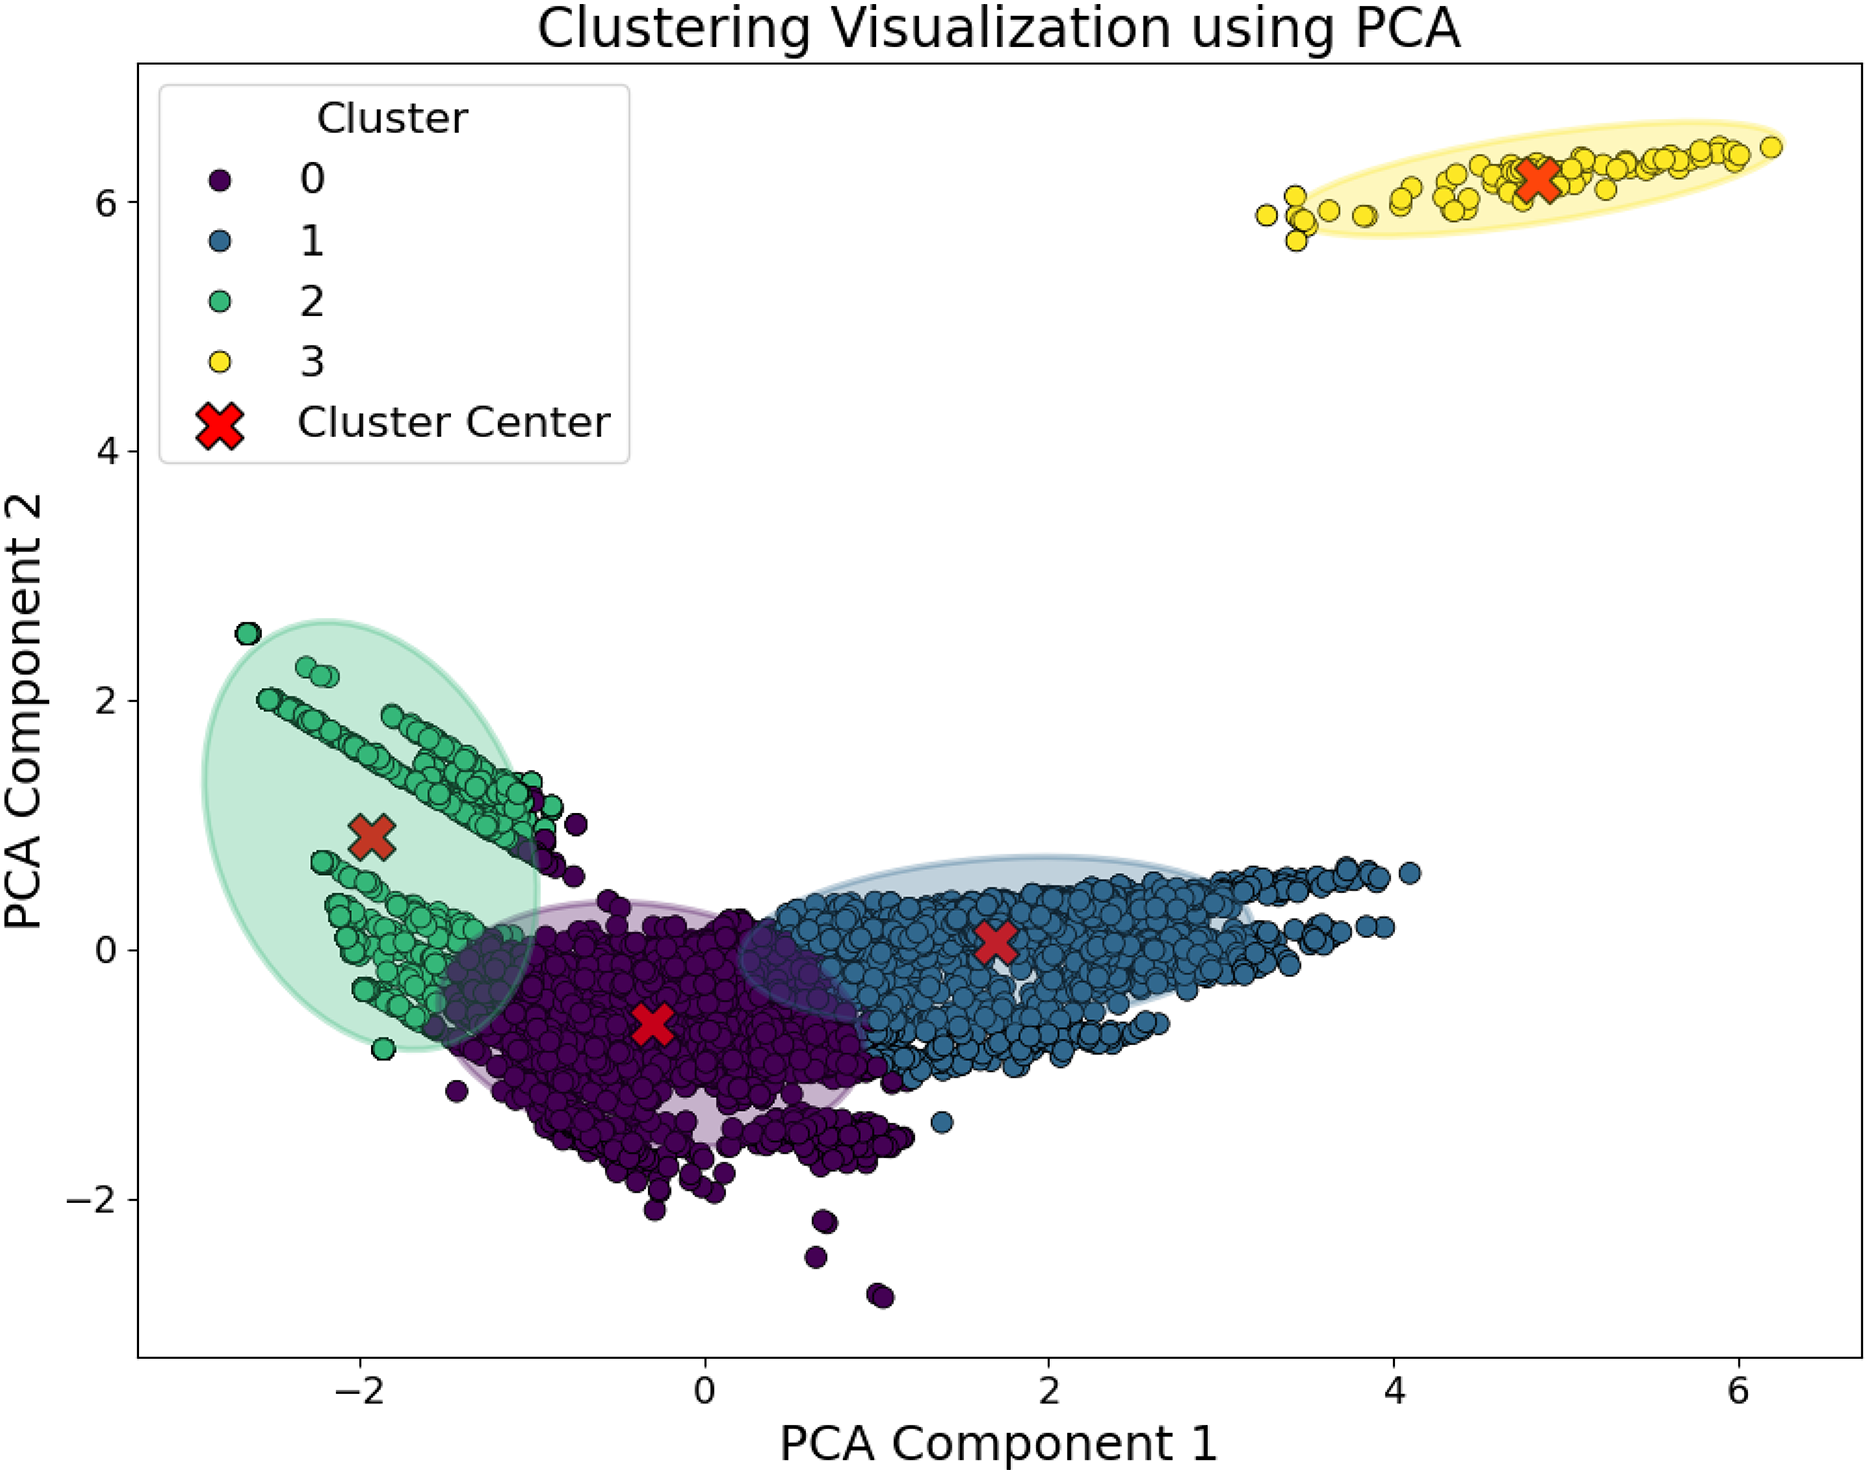
Specifically, the power supply of a charging station and the number of times it is selected determine users’ preferences for the station, serving as indicators of its objective utilization rate. In contrast, features such as the average charging distance and average charging time reflect the user experience, indirectly indicating both the station’s location and the utilization efficiency of its charging piles. Charging fees and service fees, on the other hand, represent the station’s revenue-generating capacity. All of these features are directly related to charging station operations and can be obtained once the station has been built. Based on in-depth analysis across these multiple dimensions, we applied the k-means clustering algorithm to group charging stations by operational performance. Ultimately, the stations were categorized into four clusters. To further visualize the clustering results, principal component analysis (PCA) was employed for dimensionality reduction, and the visualization results are shown in Fig. 2.
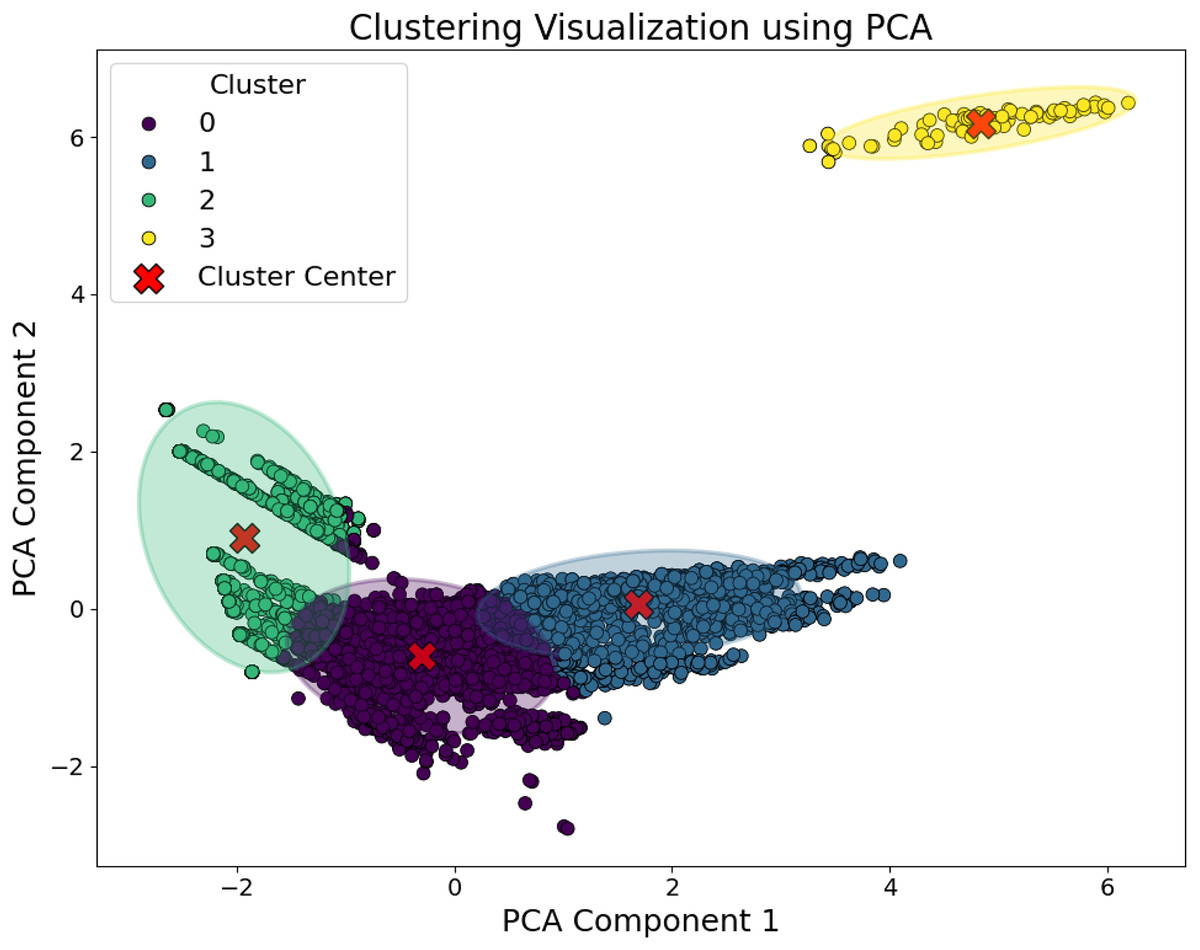
Figure 2: Clustering visualization after PCA dimensionality reduction.
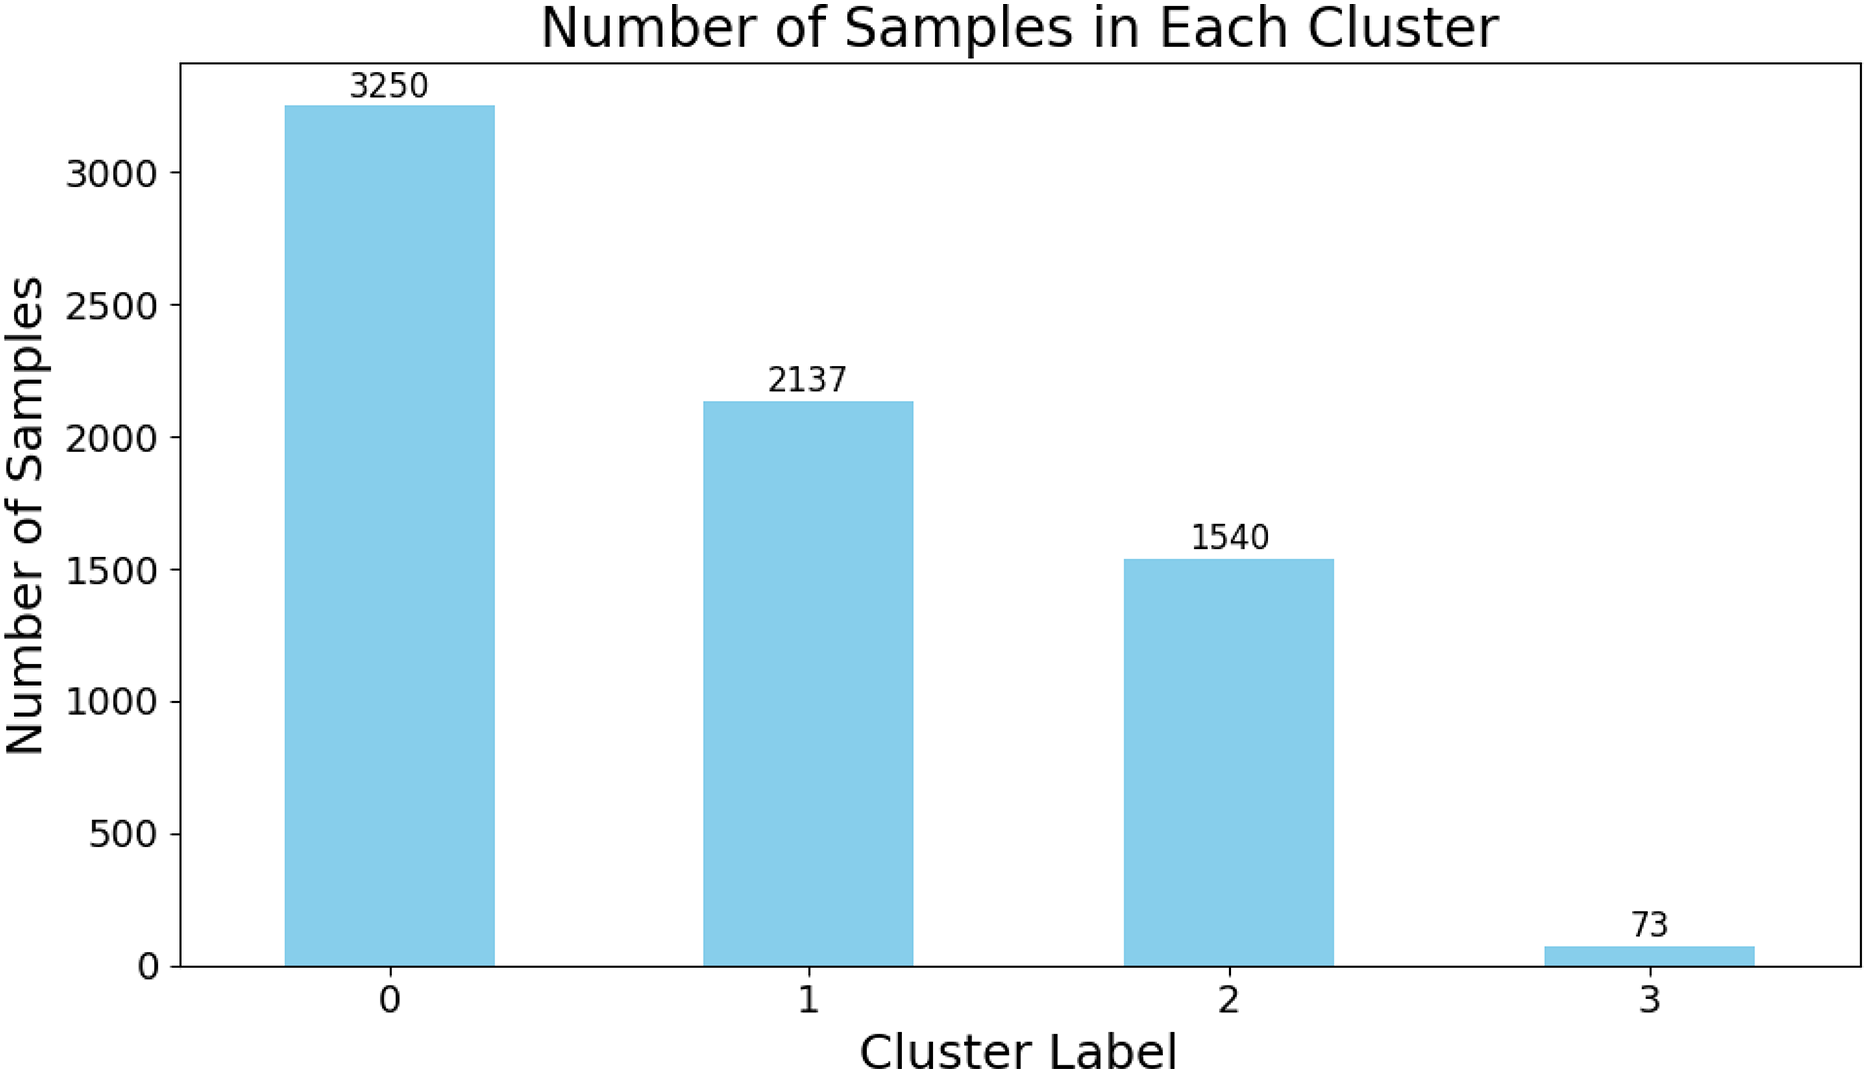
The sample distribution of each category is shown in the Fig. 3. Among them, Category 1 contains the largest number of charging stations, while Category 4 has the fewest. The numbers of charging stations in Categories 2 and 3 are relatively similar. The reason for the small number of stations in Category 4 is that this group typically represents stations with poor operational efficiency, higher fees, and unsatisfactory user experience. In practice, such extreme cases are usually located in remote areas with low traffic flow and sparse population. Consequently, operating companies deploy fewer charging stations in these regions.
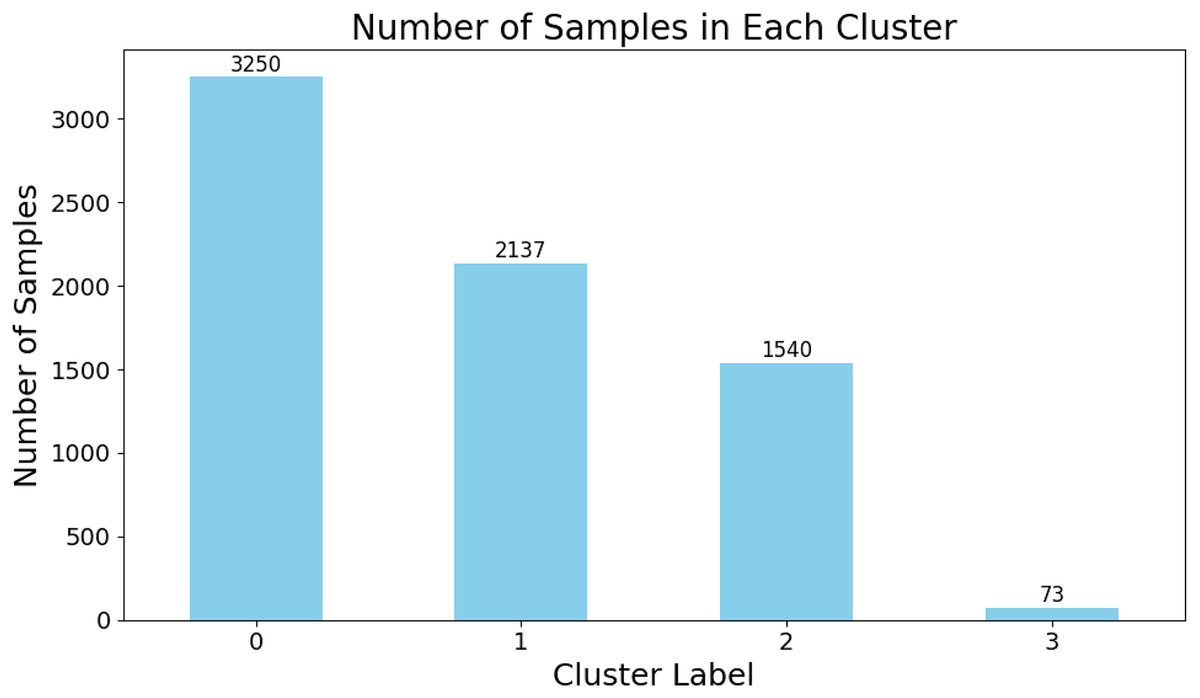
Figure 3: Distribution of cluster labels obtained from data-driven clustering results.
Comparative baseline architecture configuration
After converting region-related features into natural language text, the focus of this study shifted to predicting the suitability of regions for charging station construction. As the construction of natural language text was completed, this task essentially transformed into a text classification problem. Therefore, the study employed various common text classification models for baseline comparison, to ensure the accuracy and robustness of the results. The parameter settings for each baseline model in this experiment are described as follows:
Multi-Layer Perceptron (MLP): Utilizes a three-layer fully connected neural network as its main architecture. The input text is represented by word embedding vectors of dimension 512, followed by three hidden layers with 256, and four units respectively, each activated by Rectified Linear Unit (ReLU). The output layer uses softmax for classification.
TextRNN (Cai et al., 2018): Utilizes a bidirectional two-layer long short-term memory (LSTM) as its main network. The padding size is set to 128, the learning rate is 0.001, the number of units in the hidden layer is 256, and the dimension of the word embedding vector is 512.
TextCNN (Guo et al., 2019): The padding size is set to 128, and the learning rate is 0.001. The word embedding vector dimension is 512. The convolutional layer uses three different sizes of convolutional kernels: 256 of , 256 of , and 256 of ;
TextRCNN (Lai et al., 2015): Employs a single-layer LSTM network as the backbone of TextRCNN. The LSTM’s hidden layer has 512 units, the batch size is 128, the padding size is 128, the learning rate is 0.001, and the word embedding vector dimension is 512. The convolutional pooling layer uses the max pooling method.
TextRNN-Attention model (Zhou et al., 2016): The basic parameter settings are consistent with the traditional TextRNN. The key difference lies in the addition of an attention layer to the model structure, focusing particularly on key parts of the text.
FastText (Joulin et al., 2016): The batch size is set to 128, the padding size is 128, the learning rate is 0.001, the number of units in the hidden layer is 256, the word embedding vector dimension is 512, and the size of the ngram vocabulary is 250,499.
Dual-Path Convolutional Neural Network (DPCNN) (Johnson & Zhang, 2017): The batch size is 128, the padding size is 128, the learning rate is 0.001, the word embedding vector dimension is 512, the number of convolutional kernels is 250 with a size of , dropout is set at 0.5, and the number of training iterations is 300, with early termination if no improvement is observed within 20 epochs.
Robustly Optimized BERT Approach (RoBERTa): RoBERTa is a pre-trained language representation model optimized from BERT. In this experiment, the RoBERTa pre-trained model is first called, and then a linear layer is added at the end of RoBERTa for classification. The cross-entropy loss function is used, and parameters are optimized with the gradient descent method. The learning rate is set to , the batch size is 32, and the number of training epochs is 300. Early stopping is applied if there is no improvement in model performance within 20 consecutive epochs.
PETRoberta: Based on the text constructor, PETRoberta directly encodes the constructed text using the RoBERTa pre-trained model. A linear layer with a hidden dimension of 256 is applied for dimensionality reduction, and its output is combined with a three-layer MLP. The MLP architecture is consistent with the baseline setting, with hidden layer dimensions of 512, 128, and 64. Finally, the outputs from RoBERTa and the MLP are concatenated and fed into the classification layer. Other hyperparameters such as learning rate, batch size, and training strategy remain consistent with the baseline.
Experimental results
Model performance evaluation with five-fold cross-validation
For the baseline models introduced above, this study employs five-fold cross-validation to quantitatively assess model performance on the dataset. Given that the data originates from real-world electric vehicle charging stations and exhibits significant class imbalance, we adopt a comprehensive set of evaluation metrics commonly used in imbalanced classification tasks: Accuracy, Precision, Recall, F1-score, and the Matthews Correlation Coefficient (MCC). While Accuracy provides an overall measure of prediction correctness, Precision and Recall capture the model’s behavior with respect to the positive class—Precision reflecting the reliability of positive predictions, and Recall indicating the model’s ability to identify all true positives. The F1-score, as the harmonic mean of Precision and Recall, offers a balanced view of these two aspects. Importantly, MCC is included as a robust metric for imbalanced datasets, as it accounts for all four entries of the confusion matrix (true positives, true negatives, false positives, and false negatives) and yields a high score only when the classifier performs well across all classes. The evaluation results are summarized in Table 1.
| Model | Accuracy | Precision | Recall | F1 | MCC |
|---|---|---|---|---|---|
| MLP | 0.8993 (0.0027) | 0.9173 (0.0080) | 0.9213 (0.0034) | 0.9191 (0.0051) | 0.8361 (0.0088) |
| TextRNN | 0.9084 (0.0094) | 0.9266 (0.0063) | 0.9310 (0.0103) | 0.9282 (0.0073) | 0.8440 (0.0192) |
| TextCNN | 0.9107 (0.0059) | 0.9288 (0.0041) | 0.9305 (0.0067) | 0.9108 (0.0060) | 0.8676 (0.0084) |
| TextRCNN | 0.9090 (0.0052) | 0.9261 (0.0037) | 0.9315 (0.0058) | 0.9285 (0.0042) | 0.8528 (0.0080) |
| FastText | 0.8966 (0.0057) | 0.9149 (0.0109) | 0.9210 (0.0024) | 0.9177 (0.0067) | 0.8351 (0.0232) |
| DPCNN | 0.9111 (0.0062) | 0.9278 (0.0043) | 0.9330 (0.0062) | 0.9302 (0.0049) | 0.8693 (0.0095) |
| TextRNN_att | 0.9096 (0.0069) | 0.9263 (0.0053) | 0.9335 (0.0058) | 0.9294 (0.0051) | 0.8580 (0.0056) |
| Roberta | 0.9127 (0.0039) | 0.9303 (0.0024) | 0.9324 (0.0042) | 0.9313 (0.0031) | 0.8643 (0.0108) |
| PETRoberta | 0.9176 (0.0056) | 0.9333 (0.0041) | 0.9368 (0.0041) | 0.9349 (0.0040) | 0.8740 (0.0079) |
From the results in the table, the PETRoberta model based on prompt learning achieved the best performance across all metrics, with an Accuracy of 0.9176, Precision of 0.9333, Recall of 0.9368, F1-score of 0.9349 and the highest MCC of 0.8740. This is significantly better than other models, confirming the effectiveness of the prompt learning strategy for this task. The strong MCC value confirms that PETRoberta maintains high predictive quality not only for the majority class but also for the minority class, which is critical in imbalanced settings. This consistent superiority underscores the effectiveness of integrating prompt learning into the Roberta architecture for this domain-specific classification task.
In contrast, the MLP model—which directly processes raw input features without leveraging sequential or contextual information—achieves the lowest overall performance among all evaluated models, with an accuracy of 0.8993 and an MCC of 0.8361. While its predictions show relatively small fluctuations across the five cross-validation folds, indicating stable behavior, its discriminative power remains inferior to that of deep learning–based alternatives. FastText exhibits similar stability but consistently underperforms across all metrics; its MCC of 0.8351, in particular, suggests limited ability to capture the subtle patterns present in electric vehicle charging behavior.
Among the deep learning baselines, DPCNN stands out with the second-highest MCC of 0.8693 and a strong F1-score of 0.9302, reflecting the effectiveness of deep pyramid architectures in modeling hierarchical representations. The standard Roberta model also delivers solid performance, reaching an accuracy of 0.9127 and an MCC of 0.8643. Nevertheless, it is uniformly surpassed by PETRoberta on every metric, underscoring how prompt-based tuning better aligns the pre-trained language model with the specific demands of this classification task.
Overall, the five-fold cross-validation results demonstrate that PETRoberta not only achieves the best absolute performance but also exhibits low variability in its predictions—for instance, its MCC varies by only 0.0079 across folds—highlighting both its effectiveness and robustness. By achieving a well-balanced trade-off between precision and recall and attaining the highest MCC, PETRoberta provides the most reliable and generalizable solution for classification under class imbalance, making it particularly well-suited for real-world deployment in electric vehicle charging station monitoring systems.
Comprehensive evaluation of optimal cluster number
In this study, since the labels for charging station operations were obtained using a data-driven unsupervised clustering algorithm, we determined the number of clusters by combining the elbow method and silhouette analysis.
First, the elbow method, a commonly used technique for identifying the optimal number of clusters, evaluates the total within-cluster sum of squares (WSS) under different cluster counts. By plotting the relationship between the number of clusters and the WSS, the “elbow” point—where the rate of decline in WSS slows significantly—is selected as the optimal cluster number. The analysis results of the elbow method on our dataset are shown in the Fig. 4.
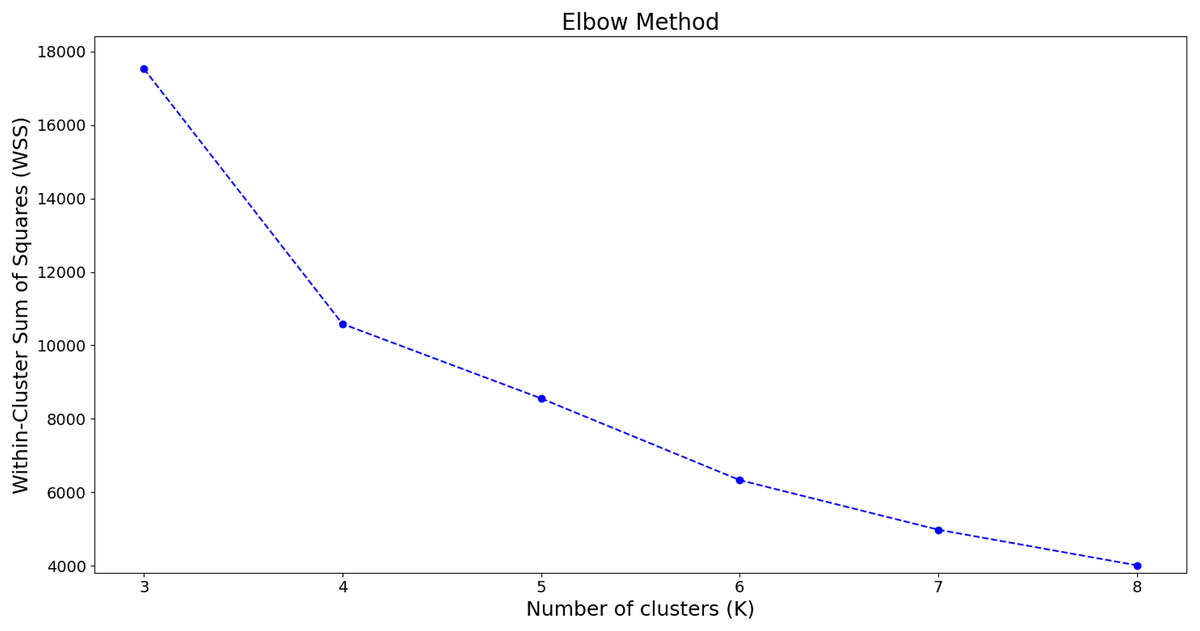
Figure 4: Evaluation of clustering results using the elbow method.
The x-axis represents the number of clusters, while the y-axis denotes the total within-cluster sum of squares for each clustering configuration.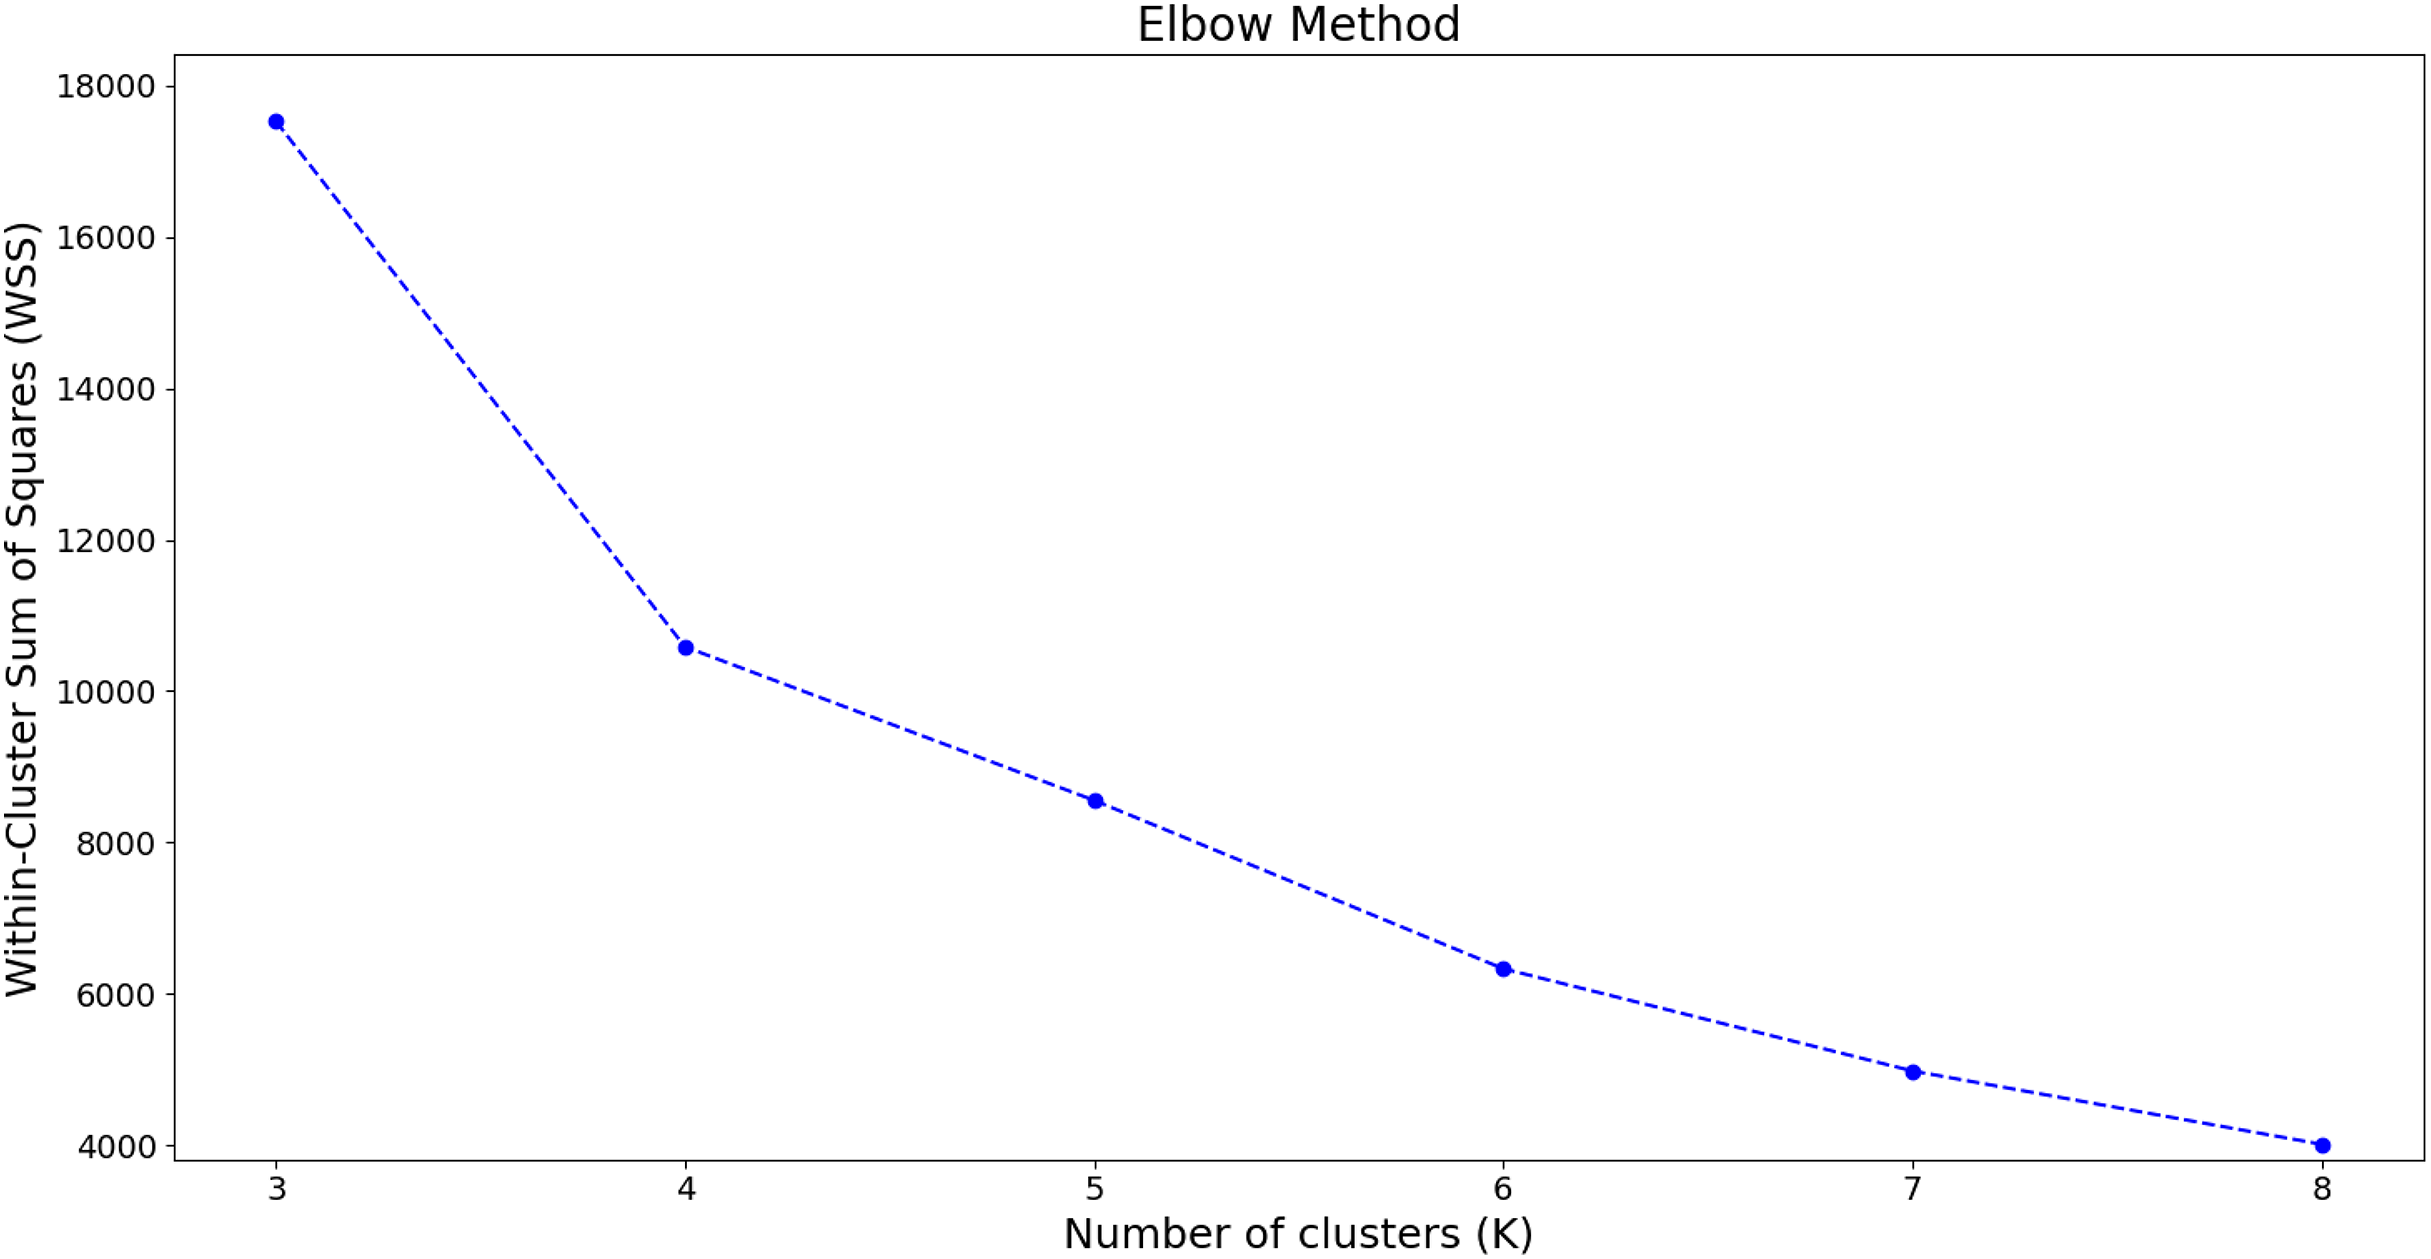
From the results shown in the figure, it can be observed that as the number of clusters K increases, the WSS gradually decreases. When K increases from 3 to 4, the WSS drops significantly, whereas the decline begins to slow down between 4 and 6, and becomes progressively smaller thereafter. This phenomenon indicates the presence of an “elbow” at . Since increasing the number of clusters beyond this point does not yield a substantial improvement in model performance, we consider to be an appropriate choice for the number of clusters.
Next, we evaluate the clustering results using silhouette analysis. This method assesses the clustering quality by calculating the silhouette coefficient of each sample, with a coefficient range from −1 to 1. The larger the value, the better the clustering performance. By calculating the average silhouette coefficient of all samples, we can assess the overall clustering quality. The results of the silhouette analysis on our dataset are shown in Fig. 5.
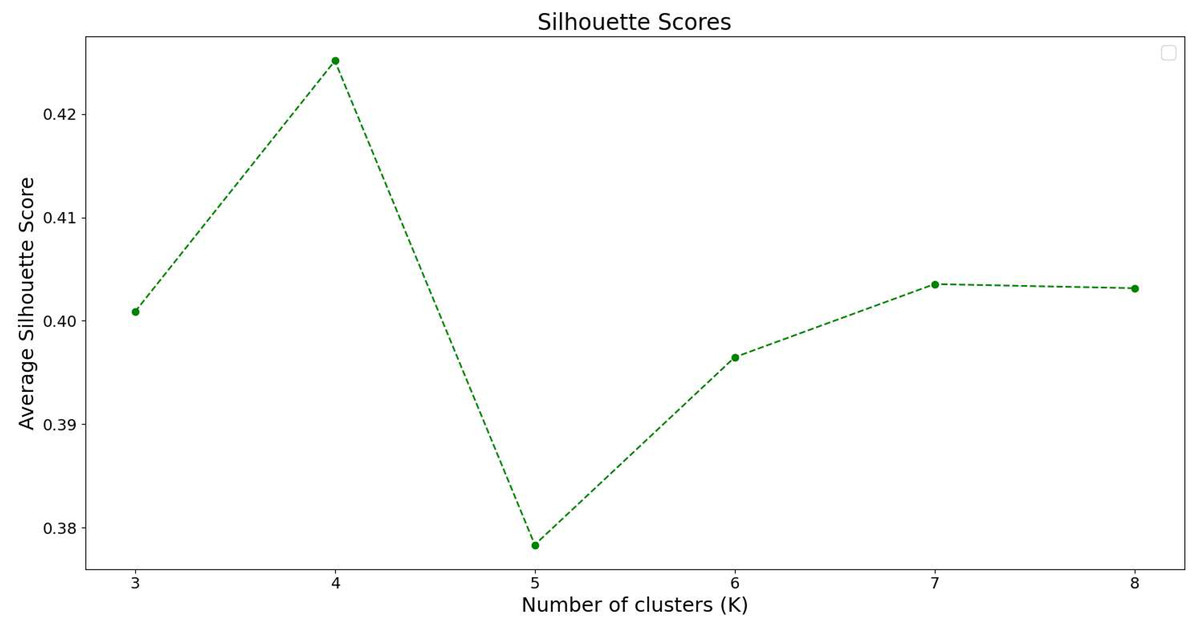
Figure 5: Silhouette analysis results.
The x-axis represents the number of cluster centers, while the y-axis denotes the silhouette coefficient scores for different cluster center configurations.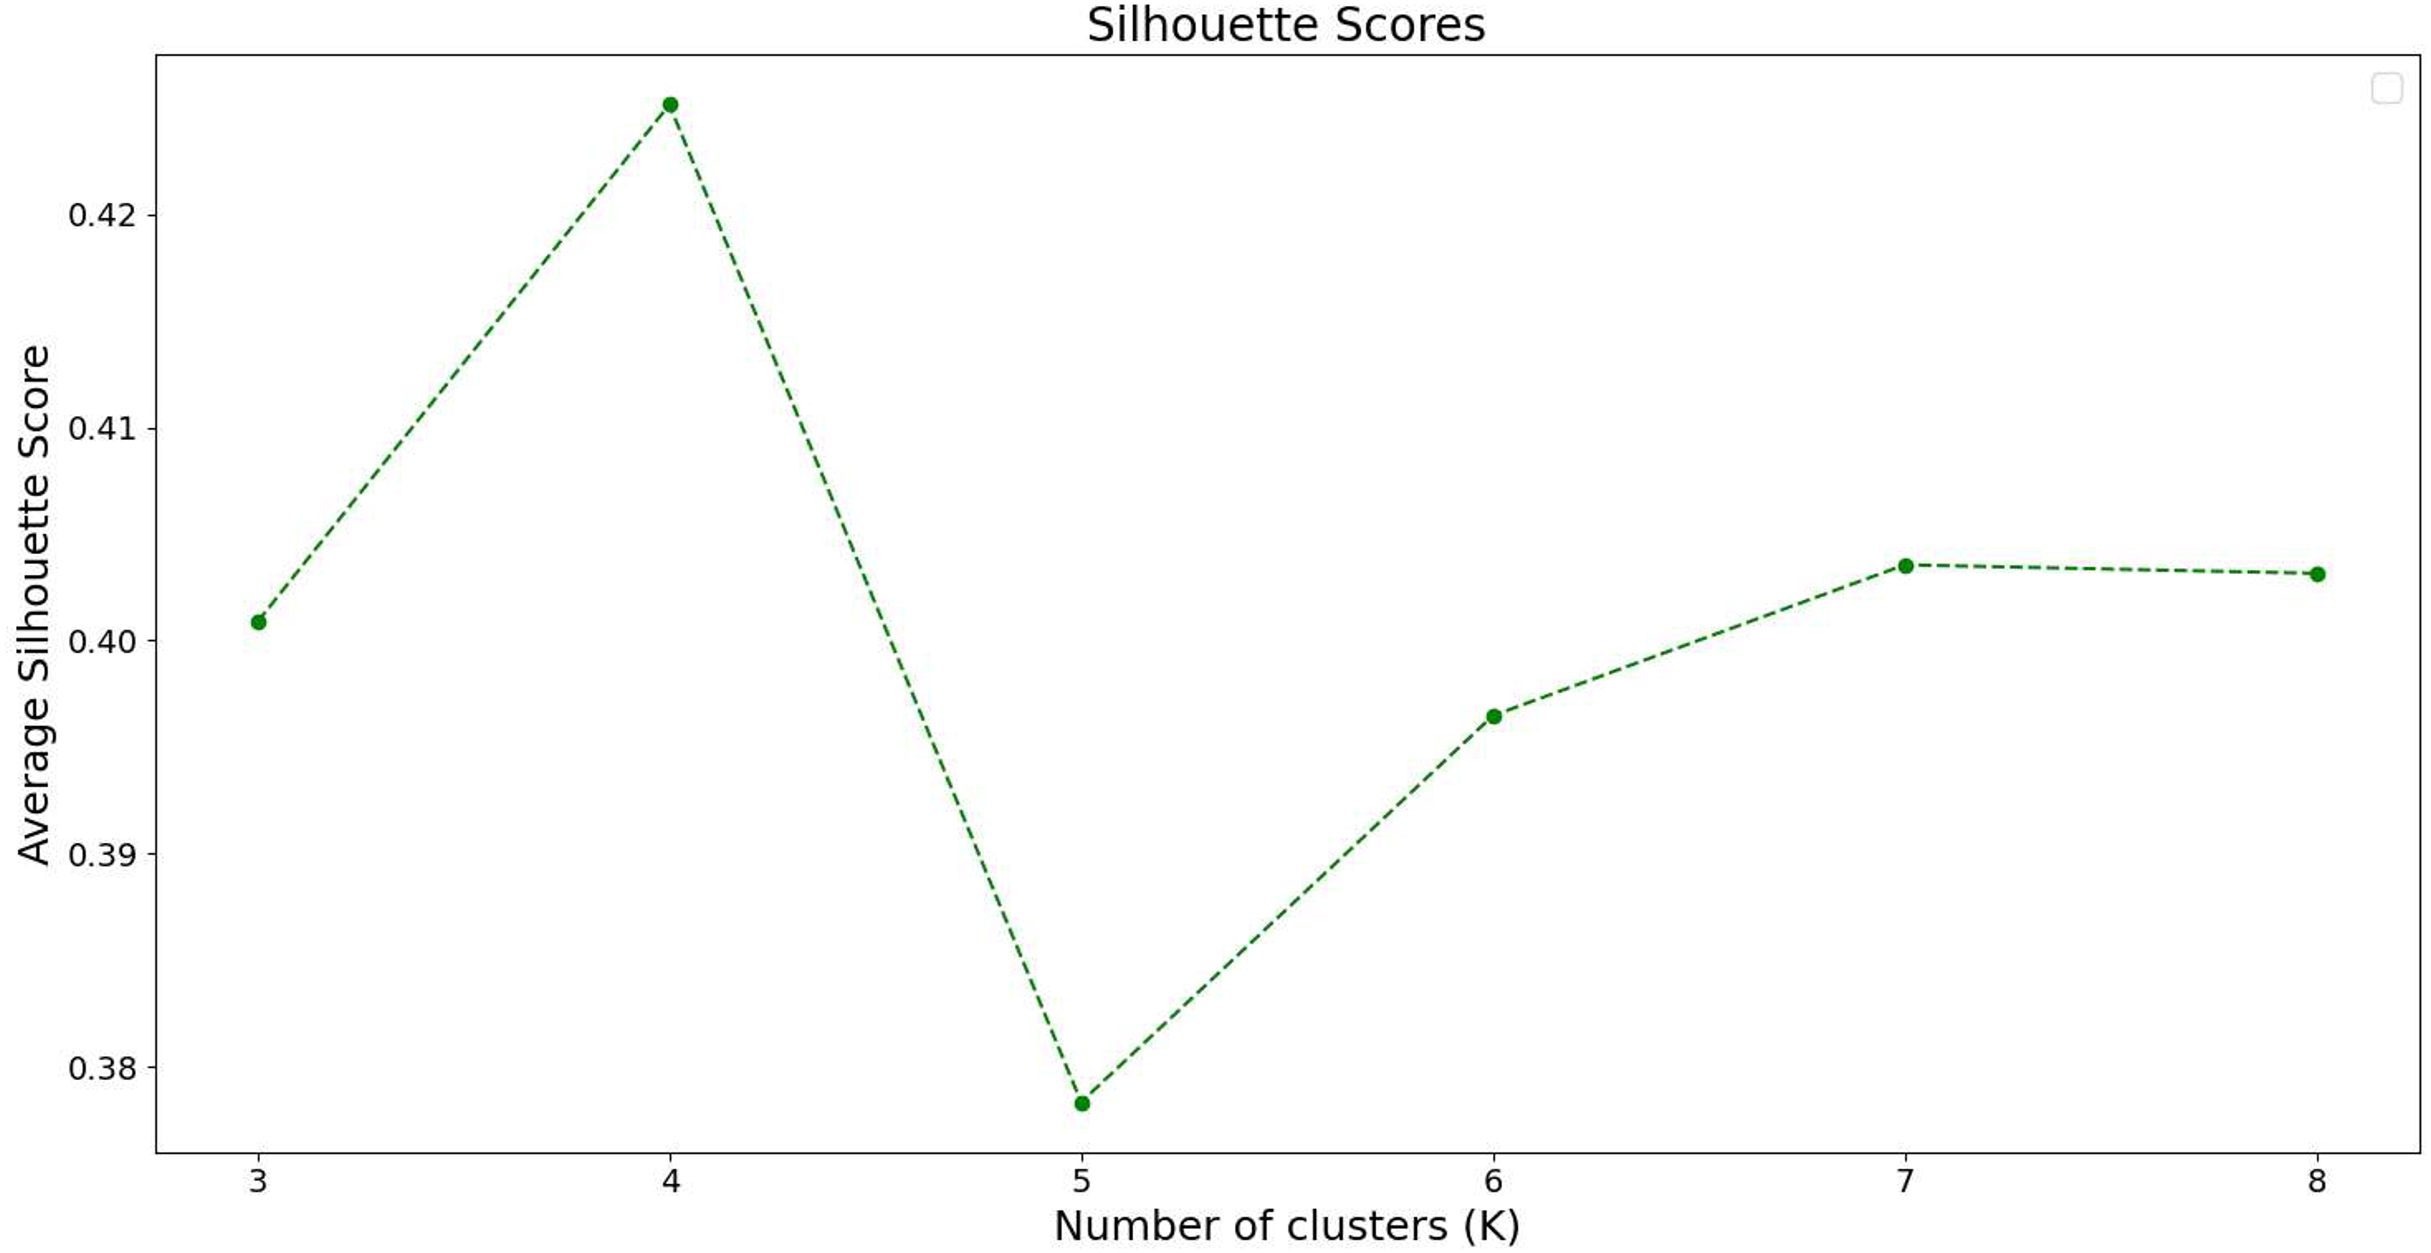
From the silhouette analysis result chart, it can be observed that as the number of clusters K increases, the silhouette coefficient also changes. When the number of clusters reaches 4, the silhouette coefficient score is at its highest, while it is lowest when the number of clusters is set to 5. Therefore, based on the silhouette analysis, it can be concluded that setting the number of clusters to 4 maximizes the differentiation between samples, resulting in the greatest variance between the samples of each cluster.
To further evaluate the clustering results, we employed the Davies–Bouldin index as the evaluation metric. The evaluation results are shown in the Fig. 6.
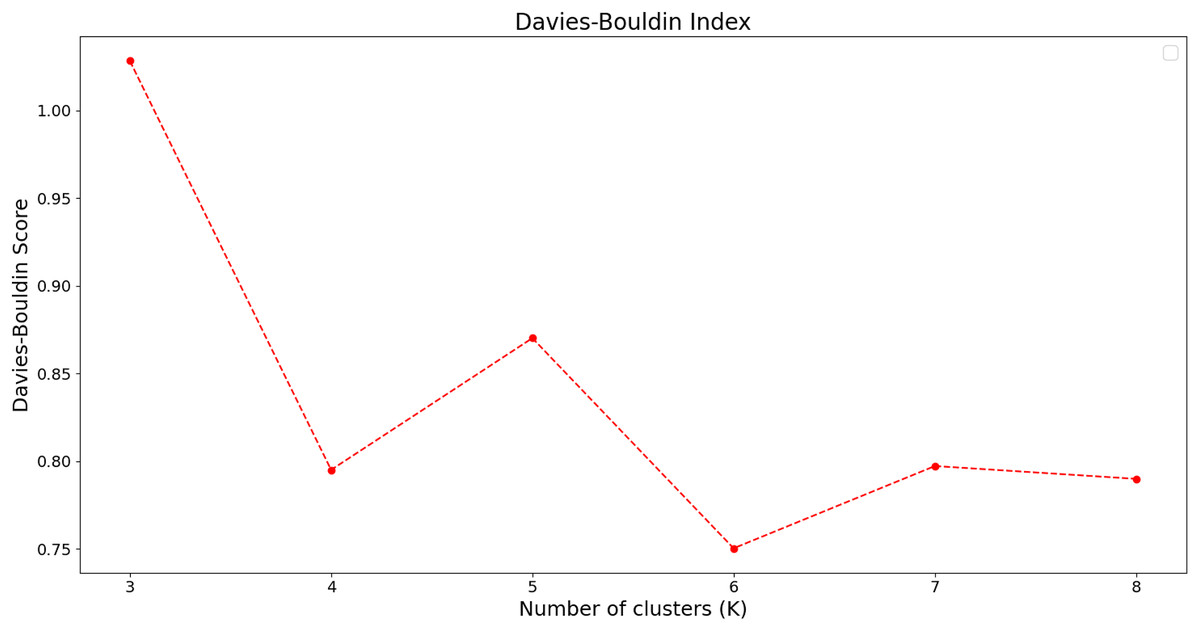
Figure 6: Davies–Bouldin index analysis results.
The x-axis represents the number of cluster centers, while the y-axis denotes the Davies–Bouldin index scores for different cluster configurations.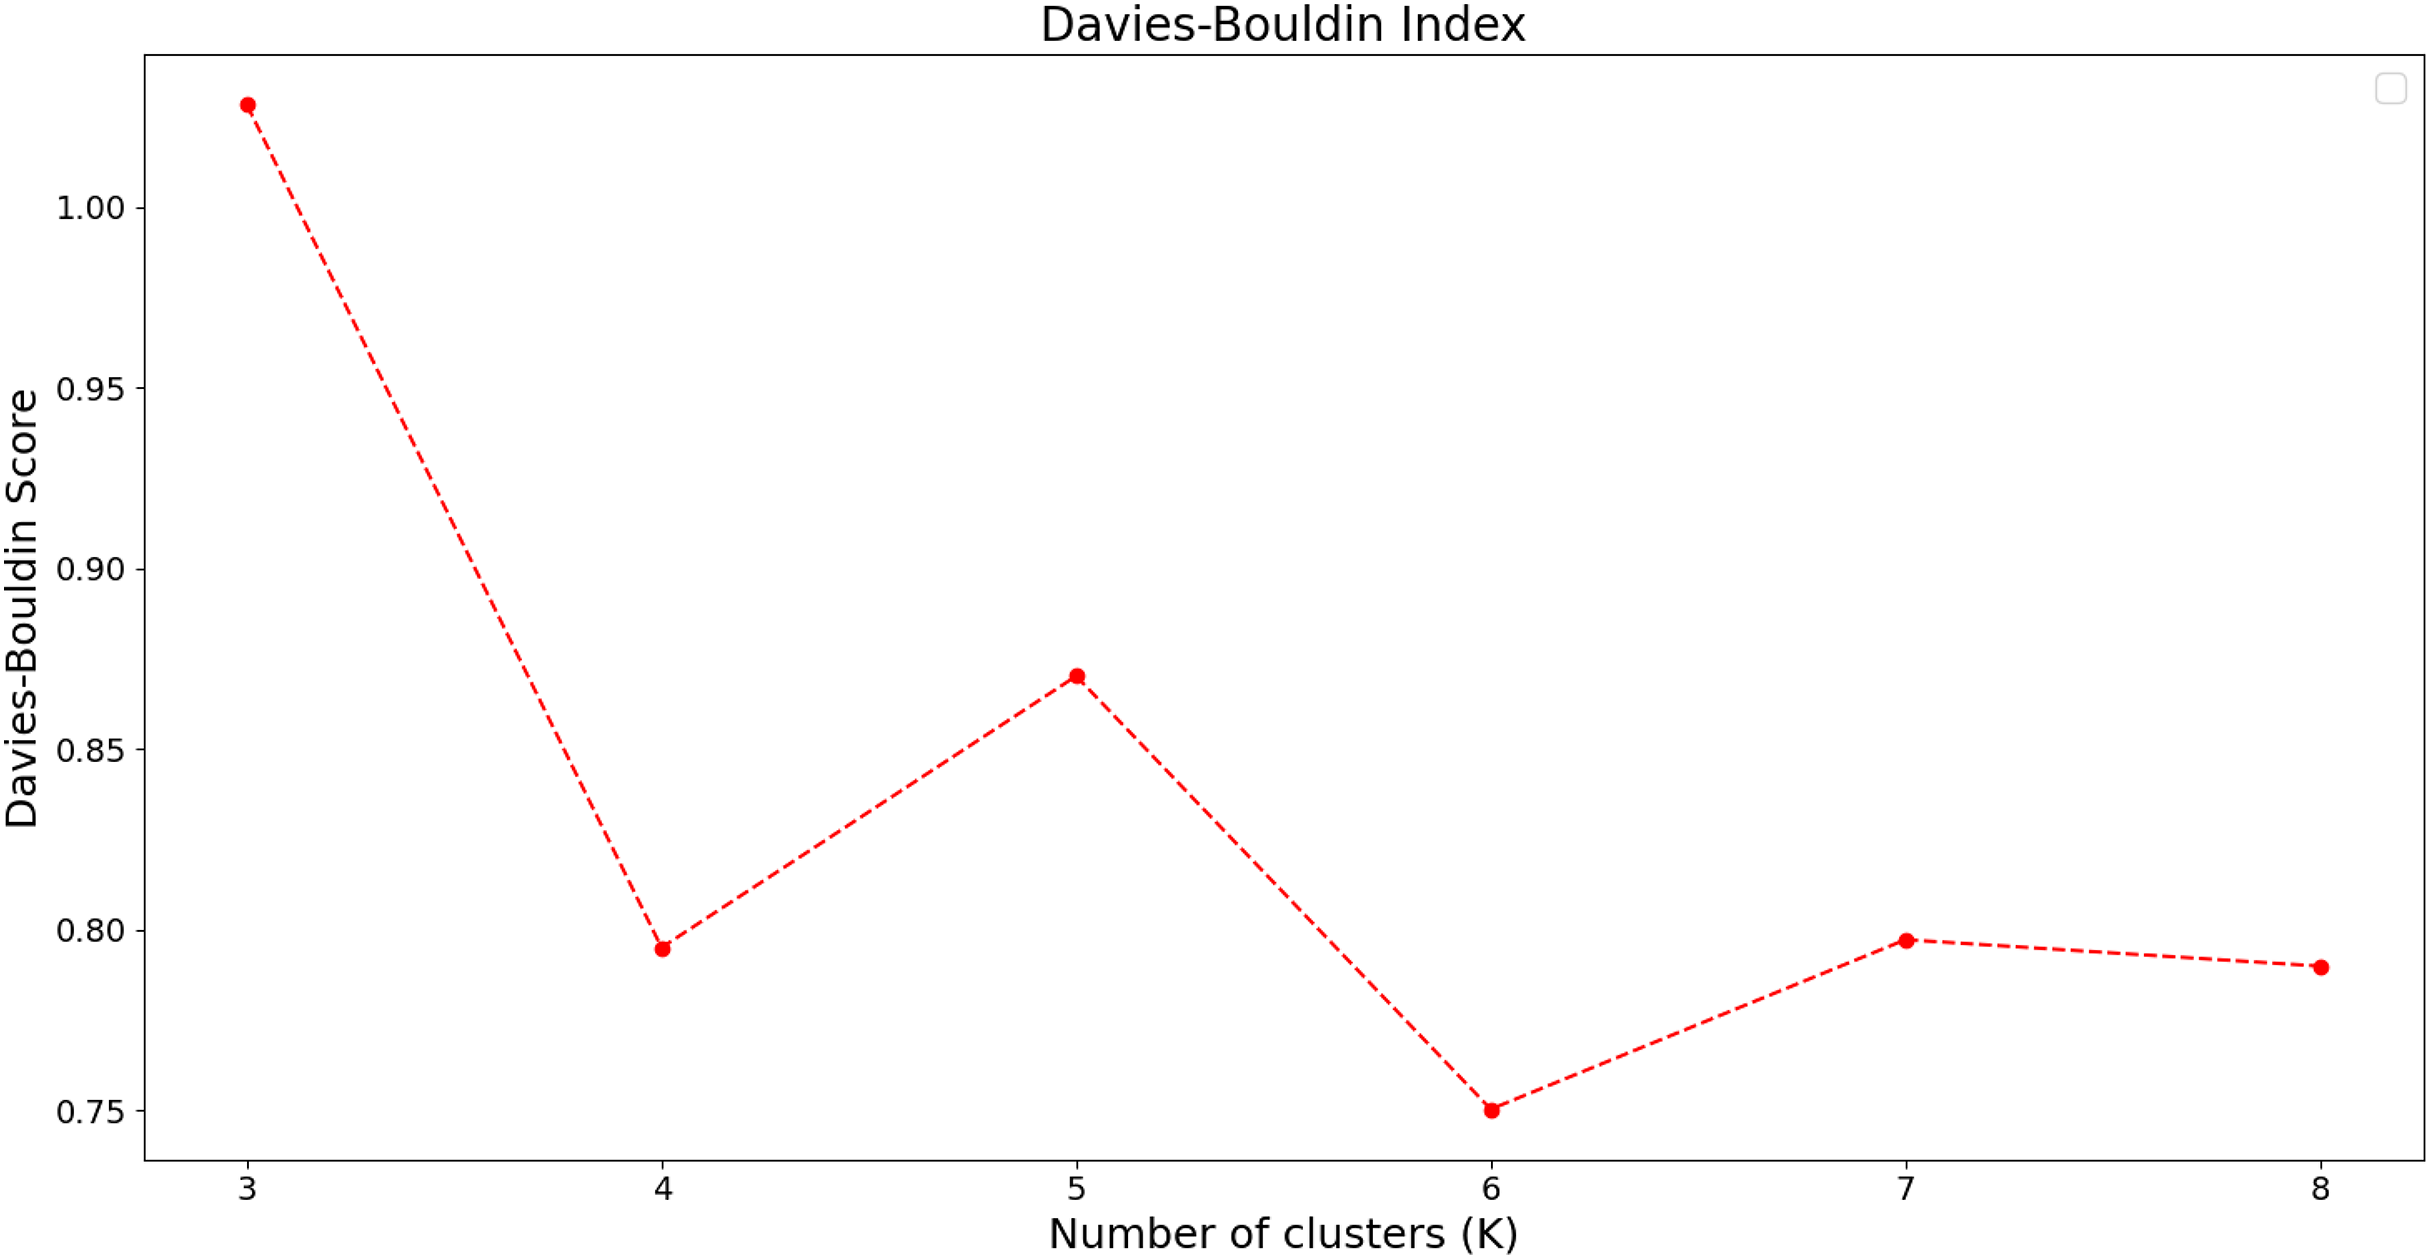
As shown in the figure, the Davies–Bouldin scores are relatively low when the number of clusters is set to 4 or 6, indicating that the samples can be better distinguished under these settings, making them suitable choices for the number of clusters. Although the Davies–Bouldin score reaches its minimum when the number of clusters is set to 6, this corresponds to a 50% increase in the number of clusters compared to 4, while the score decreases by less than 5%. Therefore, we also consider setting the number of clusters to 4 a reasonable choice, as it achieves a relatively low Davies–Bouldin score while keeping the number of clusters moderate, thereby effectively enhancing inter-cluster separability.
Based on the above experiment, we confirm that is the optimal number of clusters for this dataset and will use this clustering configuration in the main experiment. This approach accurately reflects the intrinsic structure of the data, resulting in a reasonable number of labels while reducing the risk of model overfitting or underfitting.
Key influencing factor analysis via ablation study
To further explore the key factors that influence the operational status of charging stations, this study attempts to verify the conclusions through ablation experiments. Since PETRoberta uses a text-based process for input attributes and requires consistency with the prompt vector, we chose to exhaustively test various combinations of all features and sequentially input them into the model. The results were evaluated using k-fold cross-validation.
In this study, the region-related features inputted into the evaluation model only include “Traffic Volume,” “Points of Interest (POI) Count,” and “Low Battery Vehicle Count.” Therefore, we separately explore the impact of single-feature inputs and multi-feature combinations on model performance. We first input the three features as individual inputs into the PETRoberta model. Consistent with the main process, we also conducted experiments using five-fold cross-validation on various evaluation metrics, and the experimental results are visually displayed in the Fig. 7.
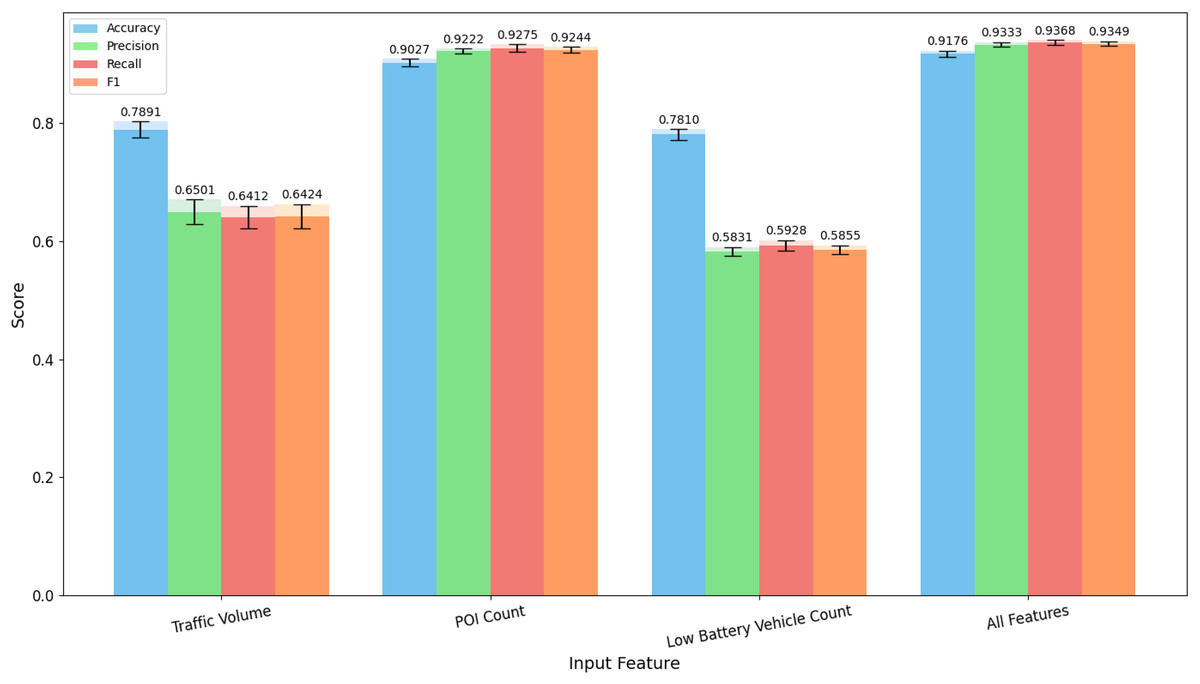
Figure 7: Evaluation results of single-feature inputs on the test set using five-fold cross-validation.
The values on top of the bars indicate the mean results across the five folds, while the black error bars represent the corresponding standard deviations.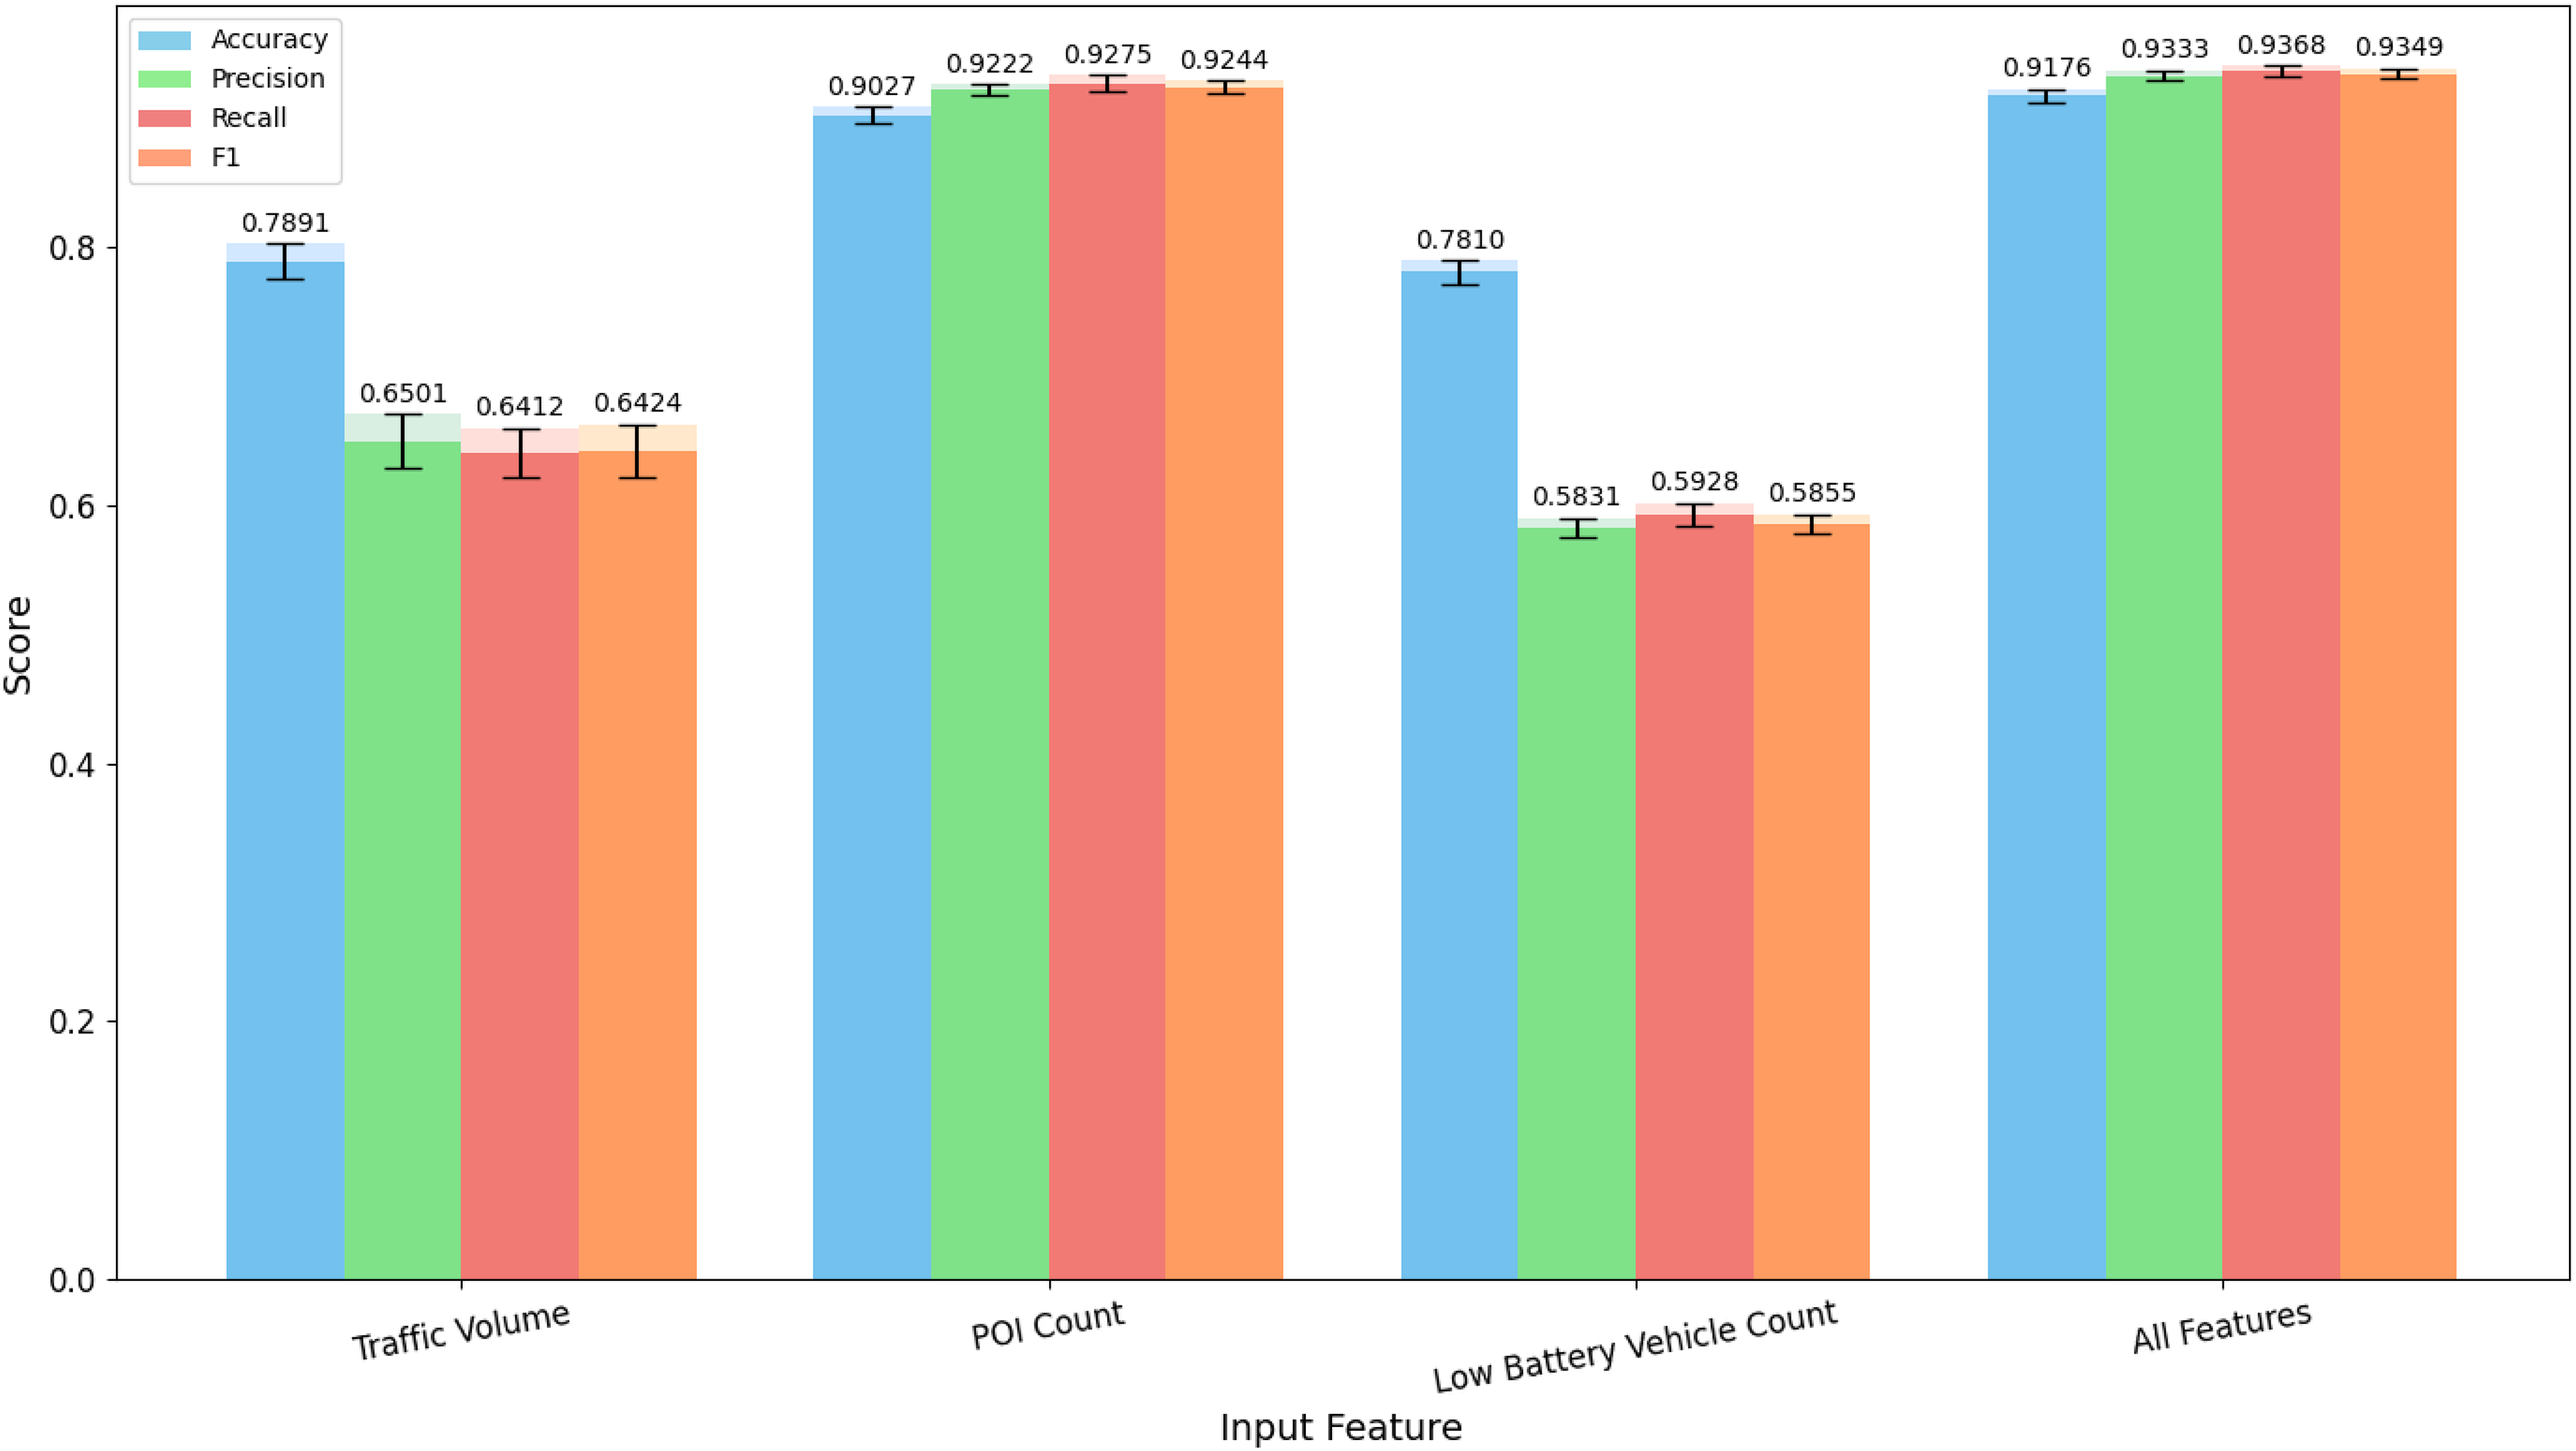
From the results in the figure, it can be observed that when POI Count is used as a single input, the scores of all evaluation metrics are close to the performance achieved when all features are inputted. On the other hand, when Traffic Volume and Low Battery Vehicle Count are used as individual features, their performance is relatively poor. This indicates that, from the perspective of individual feature importance, the number of POIs is the most important factor determining the operational performance of charging stations, while traffic volume and the number of low-battery vehicles have relatively smaller effects. Additionally, traffic volume has a slightly greater importance than the number of low-battery vehicles.
Since the importance of a single feature does not fully explain whether some features are the most important, the overall contribution of feature combinations is also a crucial perspective for evaluating the importance of features. Therefore, based on the evaluation of single features, we continue to conduct ablation experiments for dual-feature inputs. As in the previous experiments, we also use five-fold cross-validation to evaluate various feature combinations, and the experimental results are visually displayed in the Fig. 8.
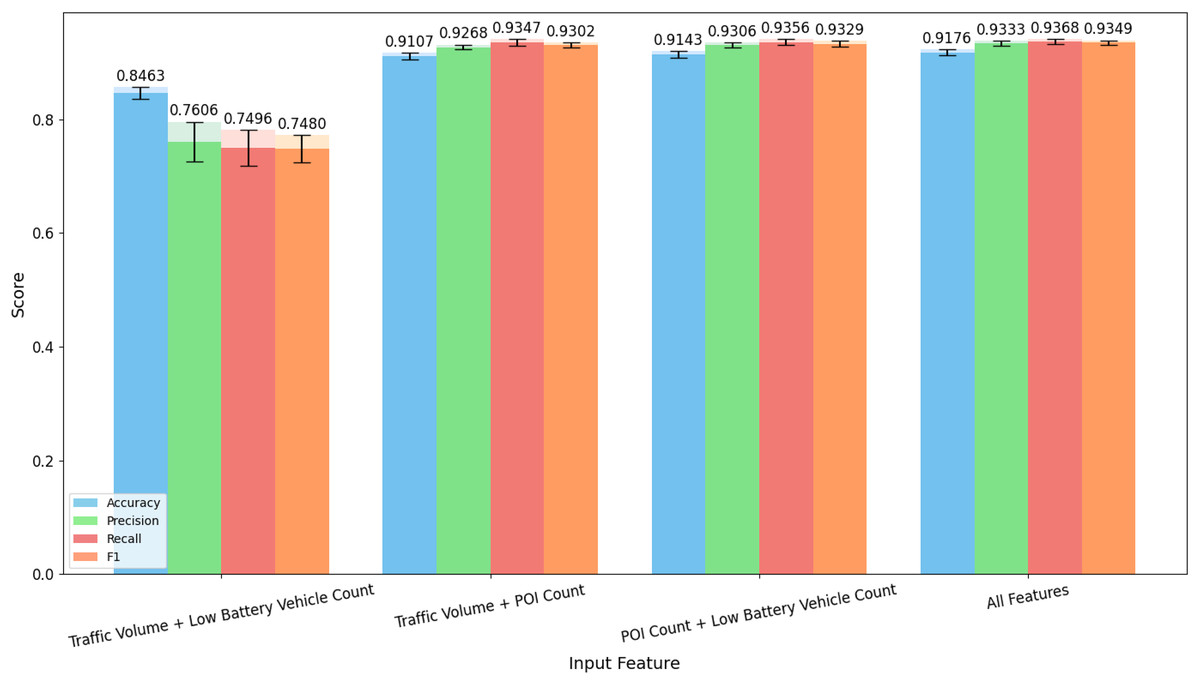
Figure 8: Evaluation results of two-feature inputs on the test set using five-fold cross-validation.
The values on top of the bars indicate the mean results across the five folds, while the black error bars represent the corresponding standard deviations.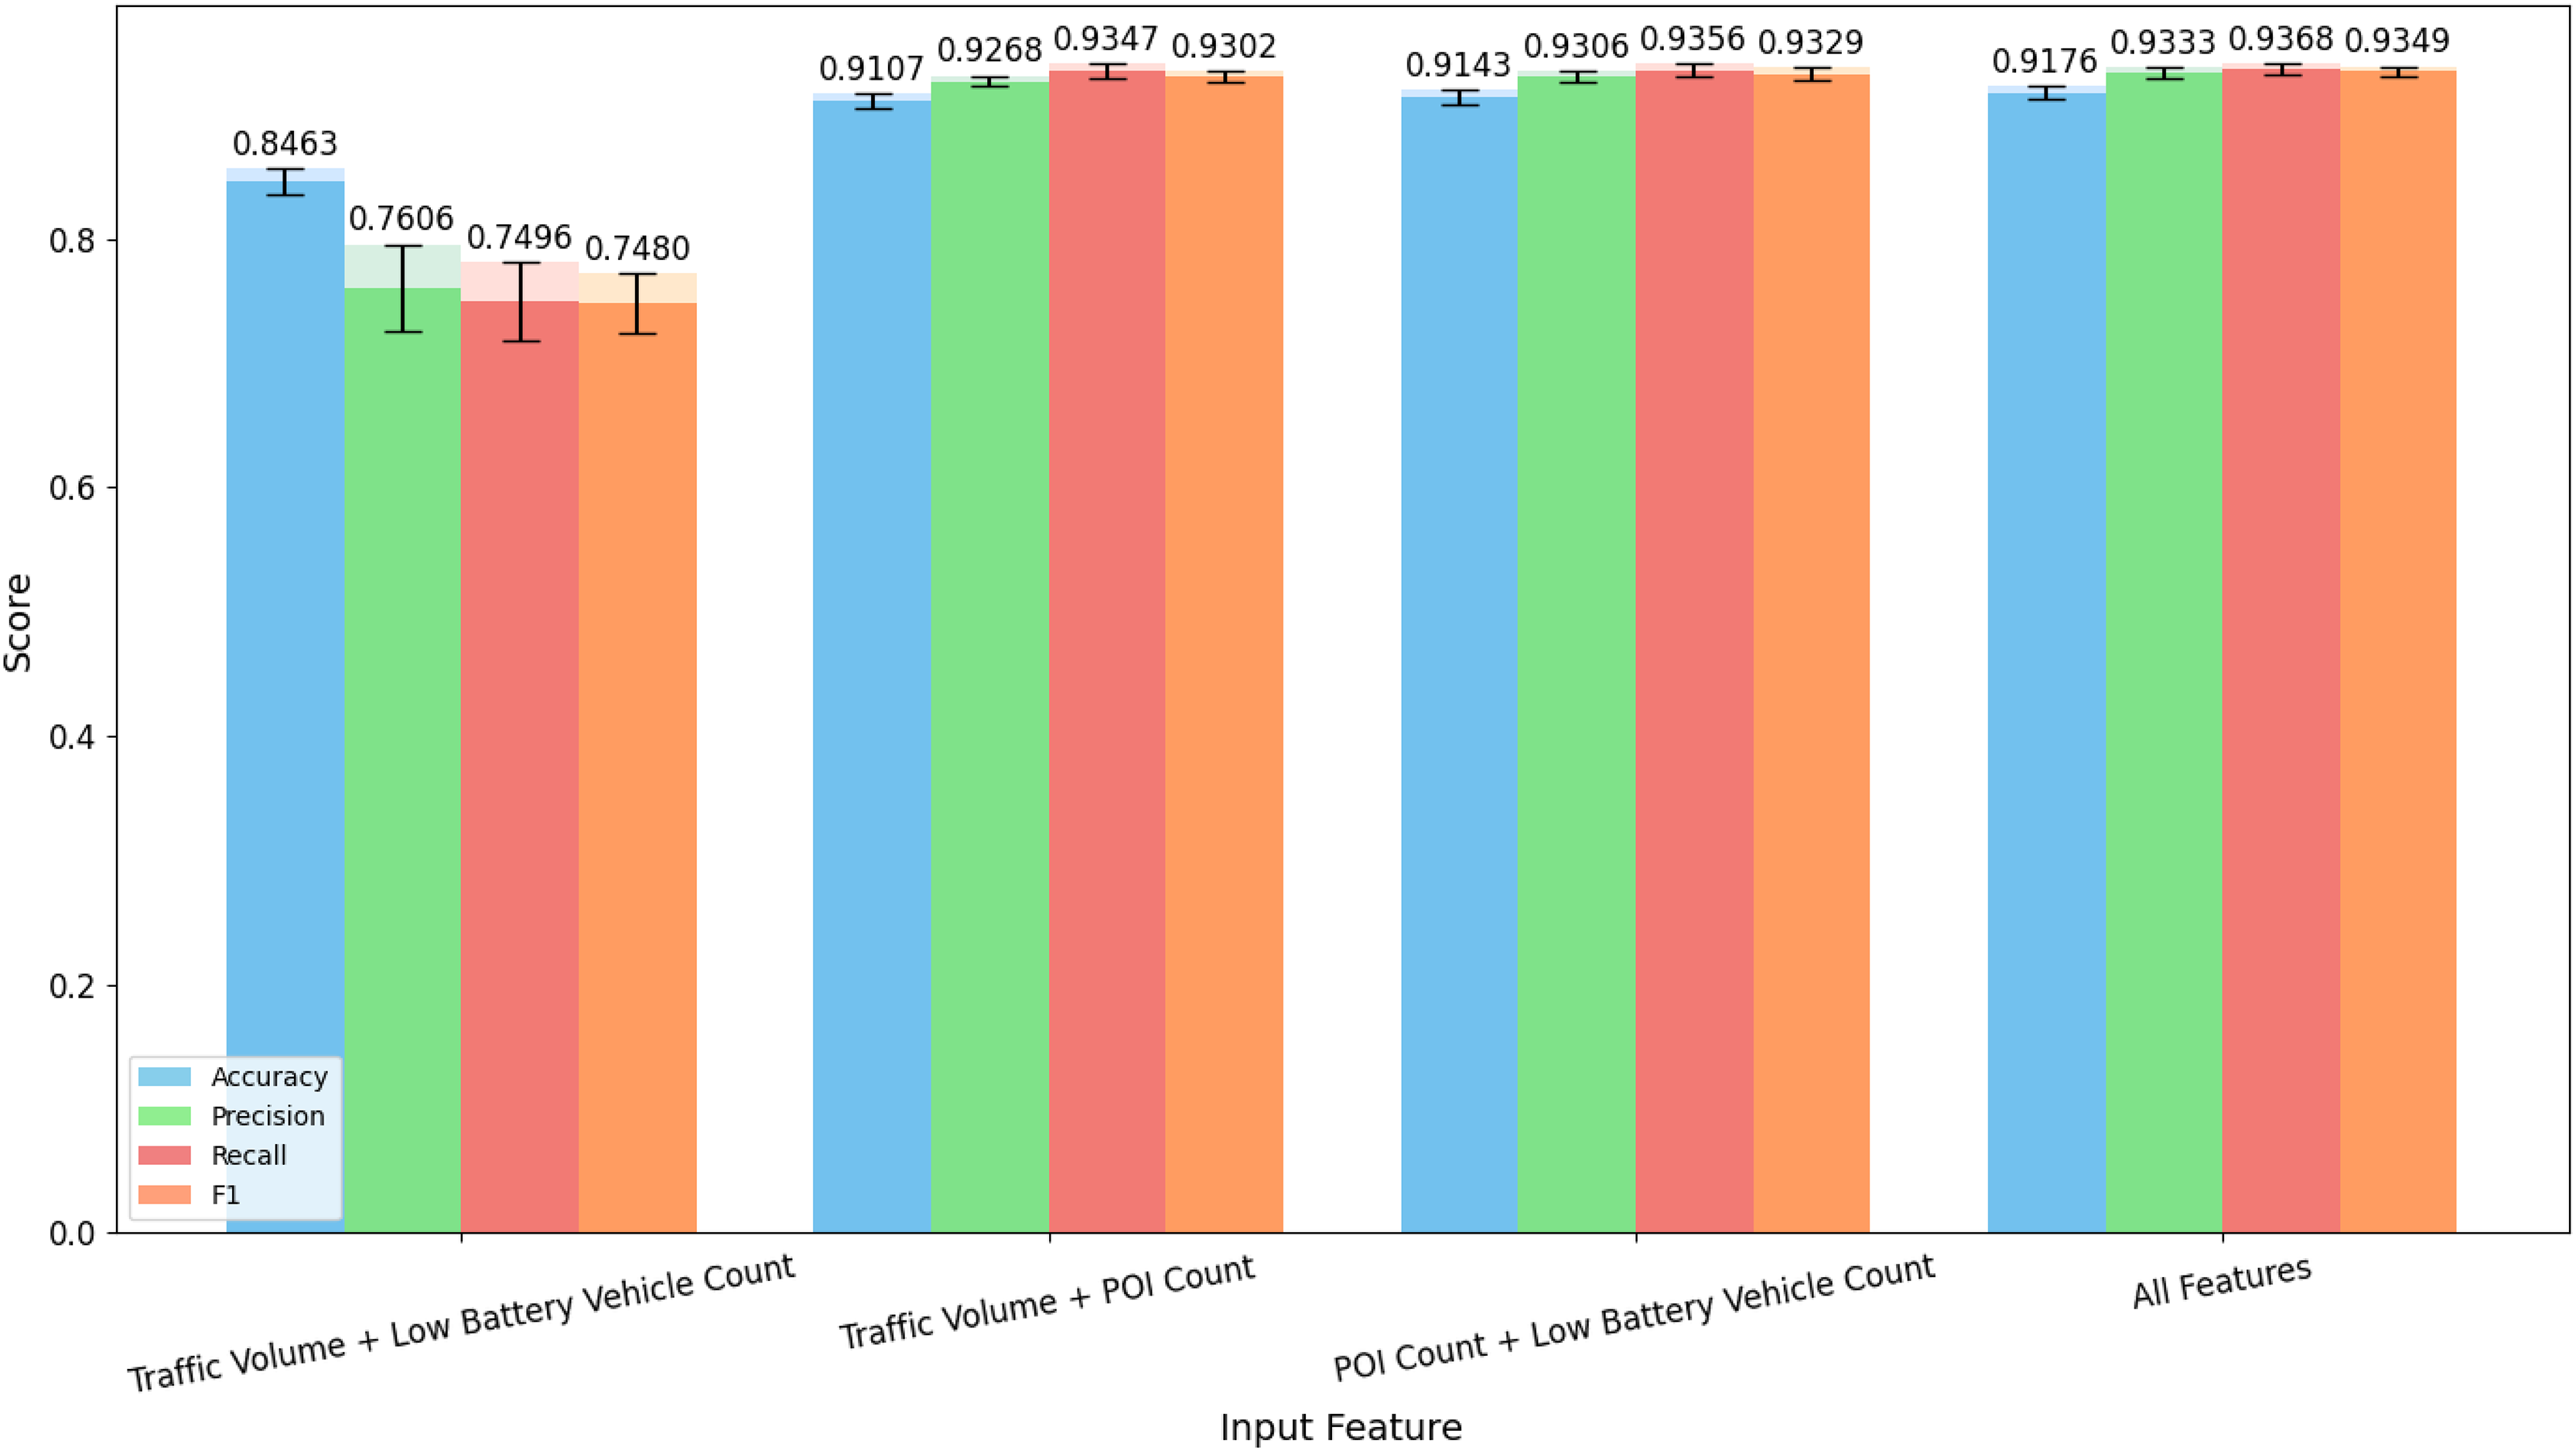
From the results in the figure, it can be seen that compared to one-dimensional input features, when two features are inputted, the performance is generally better in most cases. Additionally, when one or more features are added to the original features, there is always an improvement in the performance of all parameters. On the other hand, analyzing the dual-feature input evaluation results, when POI count is used as an input, the evaluation metrics show significant improvement compared to when the input features do not include POI count. In comparison, the improvement brought by the number of low-battery vehicles is greater than that brought by traffic volume.
Therefore, from the perspective of two-dimensional feature input, the evaluation results indicate that the number of POIs plays the most critical role in model assessment, while the importance of low-battery vehicle count is slightly greater than that of traffic volume. This conclusion contradicts the results from the one-dimensional perspective. Thus, we believe that the combined effect of low-battery vehicle count and POI count is stronger than the combined effect of traffic volume and POI count.
In conclusion, we believe that the core feature affecting the operational status of charging stations is the number of POIs in the region. While traffic volume is an important factor on its own, the combined effect of low-battery vehicle count and POI count is stronger.
Class prediction statistics analysis via confusion matrix
Due to the unique nature of charging stations, the dataset is imbalanced. As the development of electric vehicles is progressing rapidly, most regions are experiencing a supply-demand imbalance at their charging stations. As a result, during the data collection process, cases of very poor operational efficiency at charging stations were rare. To gain a deeper understanding of the model’s inference details, we chose to visualize the predictions of each category using a confusion matrix in this section. Since the performance of most models is quite similar, we selected the four models with the best Recall and F1 performance, which are DPCNN, TextRNN_Attention, Roberta, and PETRoberta. We chose the prediction results of any one fold and visualized them using the confusion matrix. The confusion matrix results for each model are shown in Fig. 9.
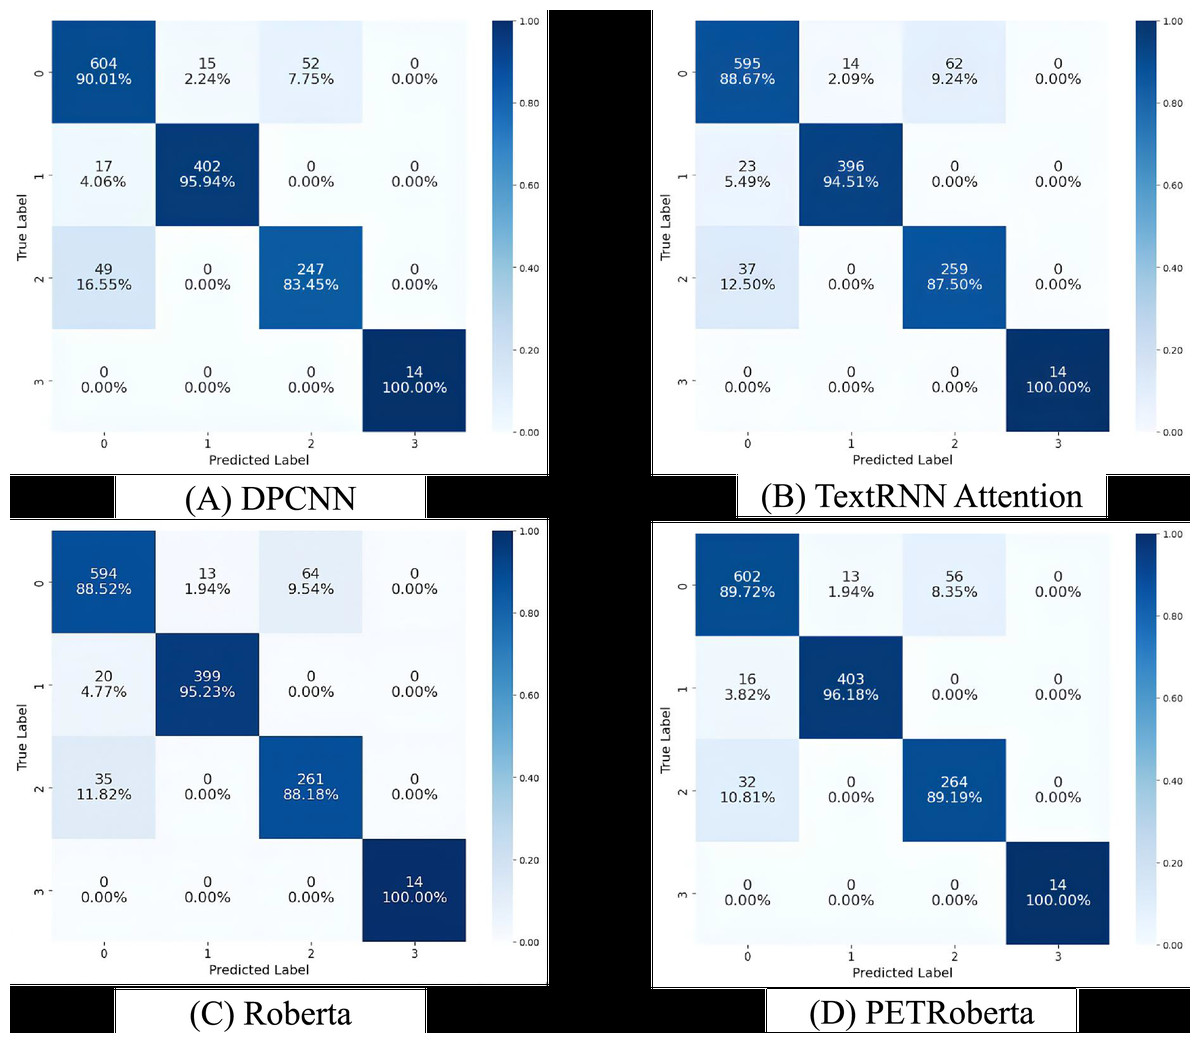
Figure 9: Comparison of confusion matrices of the four best-performing models on the validation set.
(A) Shows the confusion matrix results of the DPCNN model for each class; (B) shows the results of the TextRNN-Attention model; (C) shows the results of the RoBERTa model; and (D) shows the results of the PETRoBERTa model.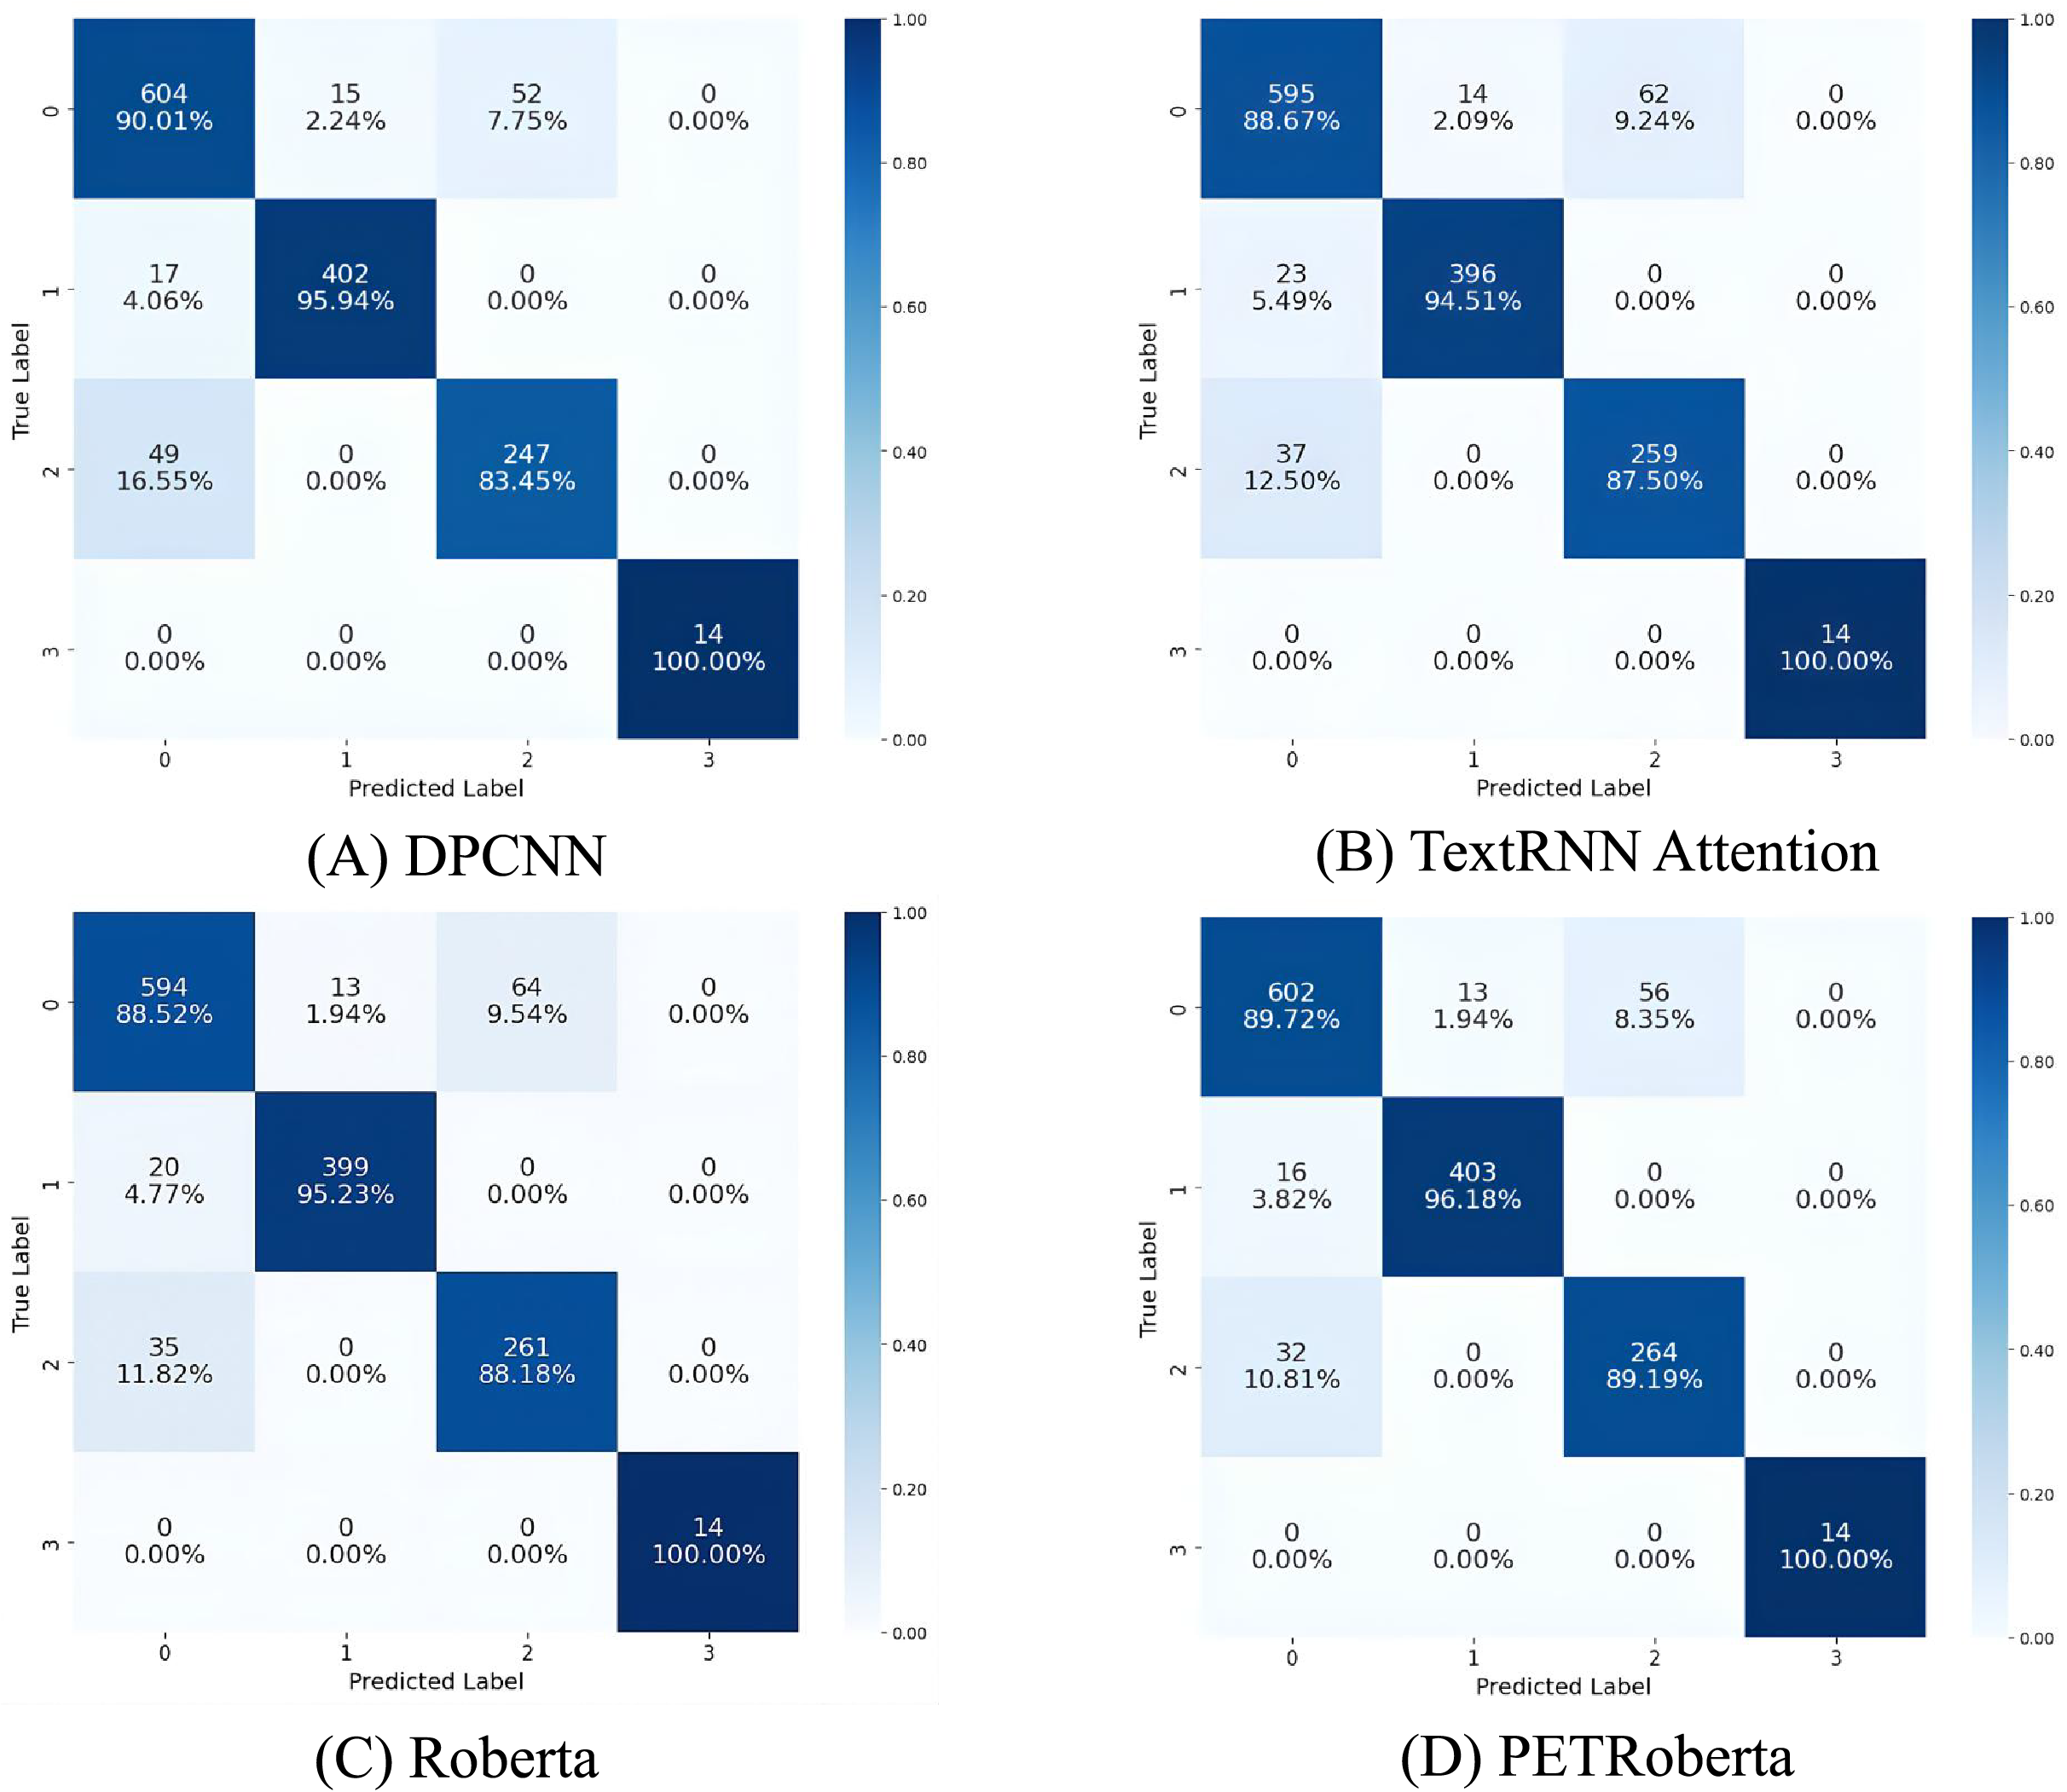
Specifically, in the first category, DPCNN achieved the highest accuracy. Out of a total of 669 samples, DPCNN correctly predicted 604, while PETRoberta, with a similar accuracy, correctly predicted 602 samples. Both performed better than TextRNN_Attention and Roberta. In the second category, for the 419 samples, PETRoberta and DPCNN still achieved the best and most similar results, both clearly outperforming TextRNN_Attention and Roberta. However, in the third category, the situation was different. PETRoberta achieved the best results, and DPCNN’s performance was relatively poor, falling below the accuracy of TextRNN_Attention and Roberta. In the last category, all models were able to correctly predict all samples.
Further analysis shows that in the last category, all models predicted correctly. As we discussed earlier, this is due to the fact that there are few charging stations with poor operational efficiency, and these cases usually have distinct features, such as low traffic and weak infrastructure, leading to fewer POIs. This allows the models to make more accurate predictions. Similarly, in the second category, although there were 419 samples, all models achieved around 95% accuracy or higher, indicating that the features of this category were also quite distinct. Analysis found that the first and third categories might share similar features, as most model errors occurred when samples from the third category were predicted as the first, or when the first category samples were predicted as the third. This suggests that these two categories may have a similar number of POIs as the core determining factor, with the only difference being in traffic volume and the number of low-battery vehicles, making it more difficult for the models to distinguish between them.
In conclusion, PETRoberta demonstrated the highest performance in evaluating the suitability for station construction. Its optimal performance is not only reflected in the overall accuracy but also in the good performance in individual category predictions. The above experiments validate the effectiveness of the method proposed in this study.
Conclusion and limitations
This study delves into the factors influencing the siting of EV charging stations, constructing the Wuhan EV Charging Station Siting Dataset, and employing clustering techniques for categorization and annotation. Subsequently, text classification models from natural language processing are applied to learn and analyze the siting data, facilitating a rational assessment and planning for EV charging station locations.
The innovation of this research lies in the application of NLP-based text classification techniques to the evaluation of EV charging station siting. By utilizing natural language models to analyze station data and adopting contrastive learning methods, this study achieves a reasonable assessment of the suitability of specific locations for establishing charging stations. This approach allows for a comprehensive evaluation of multiple influencing factors, enhancing the accuracy of the model. Experimental results demonstrate that the RoBERTa model, integrated with contrastive learning, exhibits high precision in evaluating and analyzing charging station siting. This research holds significant practical implications for the rational siting of EV charging stations and has broad application prospects for the methods and technologies used. Comprehensive analysis and evaluation of charging station siting using NLP techniques provide a deeper understanding of location influence factors and user preferences, assisting operators in developing more efficient and targeted strategies for EV charging station construction.
Overall, this study offers a novel approach to addressing EV charging station siting issues and serves as a practical example of deep learning and NLP model applications in the planning field. We hope that this research will inspire researchers in related fields and contribute valuably to the development and promotion of the EV market.
Regarding the limitations of this research, the current data lacks granularity, including only broad statistical information such as average waiting times. Refining this data could enhance the model’s effectiveness in analyzing influencing factors. Additionally, the study has not assessed the applicability of large-scale generative language models in the field of charging station siting. Future research plans to incorporate more comprehensive information on charging stations to thoroughly evaluate and analyze the various factors influencing their siting.
Supplemental Information
All the code for model training and inference.
The model’s parameter file: you can adjust the relevant model parameters. The model file includes the original Roberta model file. The utils folder mainly contains utility files, including data processing, area gridding, text prompt construction, and other functional files. The main file is the entry point of the project, and the train file is the model training file.
The training data for the model can be obtained in the file named input_data.csv, and the vehicle information has been anonymized. The inference results for the Suitability level in the Wuhan area can be obtained in the file named inference.xlsx.
The training data for the model is available in the file input_data.csv, where the vehicle information has been anonymized. The input features in the dataset represent the following: the timestamp of data collection, the latitude and longitude coordinates, the grid index after gridding, the traffic volume within the grid, the number of vehicles with battery levels below 20% within the grid, the number of POIs within the grid, and the category of the grid. The inference results for the Suitability level in the Wuhan area can be obtained in the file inference.xlsx, which evaluates the degree of recommendation for station construction in each grid within the Wuhan urban area.