
RetinoNet: an EfficientNet and feature pyramid network-based framework for accurate diabetic retinopathy classification
- Published
- Accepted
- Received
- Academic Editor
- Consolato Sergi
- Subject Areas
- Artificial Intelligence, Computer Vision, Data Science
- Keywords
- Diabetic retinopathy, Deep learning, Automated diagnosis, Feature pyramid network (FPN), Severity detection, Medical imaging
- Copyright
- © 2025 Jaikumar and Sangapu
- Licence
- This is an open access article distributed under the terms of the Creative Commons Attribution License, which permits unrestricted use, distribution, reproduction and adaptation in any medium and for any purpose provided that it is properly attributed. For attribution, the original author(s), title, publication source (PeerJ Computer Science) and either DOI or URL of the article must be cited.
- Cite this article
- 2025. RetinoNet: an EfficientNet and feature pyramid network-based framework for accurate diabetic retinopathy classification. PeerJ Computer Science 11:e3361 https://doi.org/10.7717/peerj-cs.3361
Abstract
Background
Damage to the blood vessels in the retina of the eye causes diabetic retinopathy (DR), one of the most common complications of diabetes. It is a major cause of vision impairment and blindness in several individuals. Due to the large number of cases, there is a lack of ophthalmologists performing conventional procedures, leading to a big challenge. Therefore, an efficient and scalable DR detection method is required.
Methods
This study introduced a hybrid model called RetinoNet, which is used to detect the severity of DR by minimizing the need for complex diagnostic procedures by ophthalmologists. First, the model uses a long chain of pre-processing steps consisting of adaptive histogram equalization, nonlocal means denoising, GrabCut for background masking, and simulated super-resolution to improve the resolution, particularly to extract small details in a given image, thereby partially addressing generalization when working with limited datasets. It then uses EfficientNet-B0 as the backbone for high-level feature extraction, along with a feature pyramid network (FPN) for multi-scale feature extraction, which helps increase the detection accuracy when an object of different scales is present in the image. Global average pooling (GAP) is used for dimension reduction and to prevent overfitting by minimizing the parameters for classification.
Results
RetinoNet captured fine details that were used to enhance the detection of small and large lesions, thereby achieving an accuracy of 96.8% on the Messidor dataset. It has been validated on the APTOS dataset with 2,400 imbalanced data samples and achieved 91.6% accuracy. To evaluate the results of pre-processing and classification, the model uses the image measurement metrics such in peak signal-to-noise ratio (PSNR), structural similarity index measure (SSIM), and mean squared error (MSE) with metrics such as the F1-score, precision, recall, and specificity. Across all classes, an average receiver operating characteristic (ROC) of 97.5% was obtained; the confusion metric findings showed fewer false positives and false negatives. Moreover, the analysis of variance (ANOVA) test on the picture measurements revealed bias-free image enhancement.
Introduction
Diabetic retinopathy (DR) is a severe complication of diabetes that leads to blindness if untreated. In this respect, early detection is essential for effective management of this complication to avoid loss of vision. Although many studies have been conducted to detect the severity of DR, this study also contributes to the advancement of DR detection, thereby helping the ophthalmologists focus on complex cases that require expert attention. This study aimed to create a high-performance and scalable framework for DR detection using hybrid representation learning models. In the present study, RetinoNet sought to increase diagnostic precision to improve diagnostic accuracy through the alignment of task characteristics, feature processing strategies, and optimization techniques. RetinoNet is novel in this context by effectively combining advanced image processing techniques such as adaptive histogram equalization, nonlocal means denoising, and GrabCut for image enhancement and further uses the extremely powerful pre-trained model EfficientNet-B0 for extracting initial deep features along with feature pyramid network (FPN) for multiscale feature detection, which improves the capability of feature extraction. Therefore, this novel approach helps to identify small and large lesions in images with greater accuracy, thereby enhancing the accuracy of the overall classification task. Global average pooling (GAP) is further used to reduce the dimension of the feature map, which helps to minimise the computational effort and accurately predicts the presence of DR based on the disease severity level (Vij & Arora, 2024). This study also addresses many issues, such as dealing with small datasets, poor generalisation, and low variation. The standard validation metrics used to evaluate the classification results also use statistical methods to validate whether the enhanced image is biased because the bias in the enhanced image can lead to the wrong prediction of the severity level. The quality of the images was measured using the peak signal-to-noise ratio (PSR), structural similarity index (SSIM), and mean squared error (MSE), which is a standard technique, and further double-checked by applying a one-way analysis of variance (ANOVA) test on those metrics to violate the bias in the result of image enhancement caused during the pre-processing stage (Yadav et al., 2024). The model uses the prefetch function as a computation efficiency optimization technique. It executes AutoTune to dynamically adjust prefetching data loaded for efficient memory usage, which leads to a fast tracking of the training time for DR detection across different severity levels.
Objective and motivation
This article presents a high-performance scalable framework for DR detection using a hybrid multimodal representation learning model. The properties of the task, feature processing techniques, and optimization strategies were aligned to enhance the diagnostic capability of RetinoNet. The search is motivated towards solving key challenges in dataset availability, class imbalance problems, image pre-processing biases, and diagnostic efficiency by incorporating optimizations for both image processing and classification into one effective scalable framework.
Research gaps
Limited expert annotation: Most current DR detection models suffer from the limited expert-annotated data required for model training. In practice, most data are unannotated because of resource constraints, apart from small portions.
Overfitting and generalization issues: Having either excessively small or imbalanced datasets may result in overfitting problems for the models, which consequently minimizes the generalization of their results across different levels of DR and limits practical applications beyond healthcare.
Bias in image enhancement: Most state-of-the-art image enhancement techniques introduce bias; they lose retinal features, which negatively impact the accuracy of the predictions. It will be quite important to have bias-free enhancement techniques to enable consistent detection at all levels of DR severity (Liu et al., 2024).
Optimized tuning and computation: Efficiency selecting a suitable hyper-parameter is a difficult task in deep learning models and also many current DR detection systems suffer from significant computational expenses.
The main contribution of this research
Multiscale feature integration: Using EfficientNet B0 as the backbone, hierarchical features from the input image were extracted to generate feature maps at several sizes. The FPN algorithm further refined these feature maps to improve multi-scale feature representation, therefore enabling the model to efficiently detect both small and large lesions in the image. The spatial dimensions of the feature maps were lowered using GAP, therefore transforming them into a fixed-sized vector. The severity of DR was then classified by running this vector through a feed-forward network—that is, entirely connected layers.
Optimised image pre-processing: Contrast stretching with adaptive histogram equalization was applied; nonlocal means denoising reduced noise, and Grab-Cut Segmentation isolated key image areas, enhancing image clarity while preserving essential diagnostic details.
Statistical validation: Image quality was determined using peak signal-to-noise ratio (PSNR), structural similarity index measure (SSIM), and mean squared error (MSE) metrics. ANOVA also verified that there was no bias from the consistency of the different DR stages in progressive enhancement.
Data augmentation and its optimizations: To emphasize certain characteristics of the images and increase the pool of data available for training the model, we implemented techniques such as rotation, flipping, and perturbing the image quality, including noise and brightness. This resolves data scarcity and enhances the detection accuracy (Agarwal & Bhat, 2023).
Computational efficiency: This has been achieved by means of other hyper parameter adjustments in addition to the pre-fetch mechanism. While the current batch is being handled, prefetch aids in pre-loading the following one of data. This guarantees a continuous flow of data, therefore reducing idle time and hence increasing training time.
Literature survey
This section conducts a study to identify recent advancements in DR detection and the importance of multiscale feature extraction in DR detection and other medical diagnostic fields. The findings can help in selecting the most optimized image enhancement technique along with the best feature extraction method to identify gaps and propose solutions. This process can have a high impact on developing a hybrid model designed to enhance the current model by addressing these gaps.
Tahir et al. (2024) proposed a lightweight FPN using ResNet34 and CBAM as backbone for microaneurysm detection in diabetic retinopathy screening. By leveraging simple image enhancement techniques, such as gamma correction and median filtering, their approach yielded better sensitivity and F1-scores on the IDRID and E-ophtha datasets (Tahir et al., 2024). The study by Praneeth, Kumar & Nagaraju (2024) use a FPN with an EfficientNet-B0 encoder for retinal exudates segmentation in diabetic retinopathy detection. This combines the strengths of both the FPN structure and EfficientNet-B0 to improve segmentation performance (Praneeth, Kumar & Nagaraju, 2024). Xu et al. (2023) also proposed Enhanced Feature Pyramid Network (EFPN) for Medical Image Classification feature extraction. EFPN: this extends FPNs by adding another top-down pyramid and feature fusion attention module to improve the representation of multi-scale feature (Xu et al., 2023). Deng et al. (2023) used an improved Faster-RCNN network to find the optic disc in diabetic retina images. This solved problem with model complexity and long inference times. It has achieved an average precision (mAP) of 97.42% and a precision rate of 98.96% (Deng et al., 2023). Modi & Kumar (2023) combined a bat-inspired feature selection algorithm with a deep forest approach, resulting in a 92.9% accuracy, although this resulted in increased computational requirements. Kalyani et al. (2023) presented capsule networks, which achieved an accuracy of 95.2%, though they exhibited reduced efficacy in detecting minute retinal features. Zhang, Chen & Lei (2023) devised a semi-supervised learning model utilizing multi-point attention for the classification of diabetic retinopathy. This model achieved an accuracy of 94% and improved interpretability, particularly in contexts with restricted data availability (Zhang, Chen & Lei, 2023). Özbay (2023) used an artificial bee colony method to create an active deep learning framework for segmented fundus images. The framework was able to identify diabetic retinopathy 93% of the time, even when segmentation accuracy varied (Özbay, 2023). Wang et al. (2023) utilized a particle swarm optimization (PSO)-guided self-tuning CNN for complex medical applications, demonstrating potential for DR adaptation, despite the lack of detailed performance metrics.
Thus, the survey suggests that various pre-trained models can be combined with multi-scale feature selection algorithms, such as FPN, for segmentation or classification to enhance the outcome of disease prediction. Using this method, we found both minor and large lesions in DR datasets. It also helps to choose suitable methods of image enhancement to increase the input image visibility, thereby increasing the efficiency of feature extraction.
Materials and Methods
The core architecture used to build the automated detection of DR severity in the resource-constrained dataset, which addresses the limitation of ineffective model training and reduced computational efficiency, is provided in detail in this section.
Materials
The dataset consists of 1,200 fundus images from the Messidor database (Krause et al., 2018) (Fig. 1), acquired using a 3CCD camera on a Topcon TRC NW6 non-mydriatic retinograph with a 45-degree field of view. Resolutions vary (1,440 × 960, 2,240 × 1,488, 2,304 × 1,536 pixels) and images were captured at 8 bits per color plane, with 800 images taken with pupil dilation (Tropicamide 0.5%) and 400 without. These images are divided into three sets, each with four subsets of 100 TIFF images, accompanied by an Excel file with medical diagnoses. Retinopathy is graded from 0 (Normal) to 3 (Severe) based on microaneurysms (μA), haemorrhages (H), and neovascularisation (NV): Grade 0 has μA = 0 and H = 0; Grade 1 has 0 < μA ≤ 5 and H = 0; Grade 2 has 5 < μA < 15 or 0 < H < 5, with NV = 0; Grade 3 has μA ≥ 15, H ≥ 5, or NV = 1. A random sample includes 120 Grade 0 images, 101 Grade 1 images, 120 Grade 2 images, and 120 Grade 3 images, referred to as classes 0, 1, 2, and 3 in results. Data augmentation techniques like flipping, rotating, and shearing doubled the dataset size, enhancing generalisation. The Messidor dataset is reliable, developed by experts with documented processes and labelled by medical professionals, and is widely used and cited in diabetic retinopathy research. The curated class-wise dataset from the raw dataset can be found at Kaggle: https://www.kaggle.com/datasets/anithajaikumar/dataset3. Also, in this study, the APTOS dataset has been used, with a total of around 2,400 samples, for validation of the proposed system. The computing infrastructure used for model training and evaluation includes an Intel Core i7 or higher processor and 32 GB RAM. The software used includes Python 3.8+ along with TensorFlow 2.8+, scikit-learn, NumPy, Pandas, and OpenCV. The proposed core architecture code is available at https://doi.org/10.5281/zenodo.16758657.
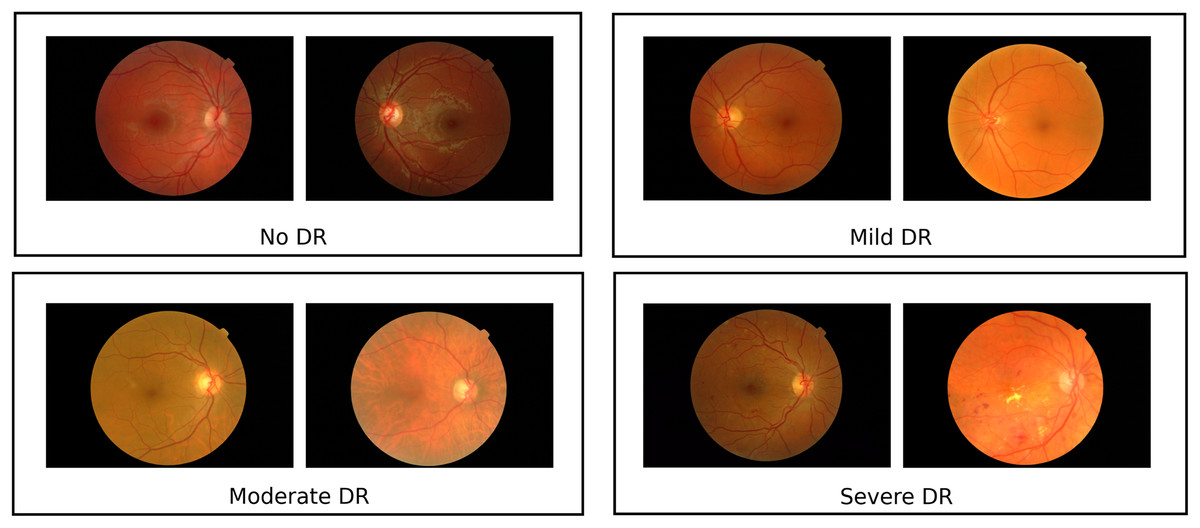
Figure 1: Sample images from messidor dataset.
The Messidor dataset contains representative retinal pictures that demonstrate the heterogeneity among DR classes Images sourced from Krause et al. (2018).
RetinoNet methods
The proposed framework showcases significant methodologies, including cutting-edge pre-processing, multi-scale feature extraction, and classification, which proficiently forecast DR phases, as depicted in Fig. 2. The class-specific input of fundus images is created based on an annotation table supplied by experts. The images have been divided into four categories of diabetic retinopathy severity: class 0 (no DR), class 1 (mild DR), class 2 (moderate DR), and class 3 (severe DR). The class-wise images were pre-processed and resized to maintain uniformity for feature extraction and to aid the model in recognizing patterns across various stages of DR. The step-by-step process of creating the RetinoNet model in explain below.
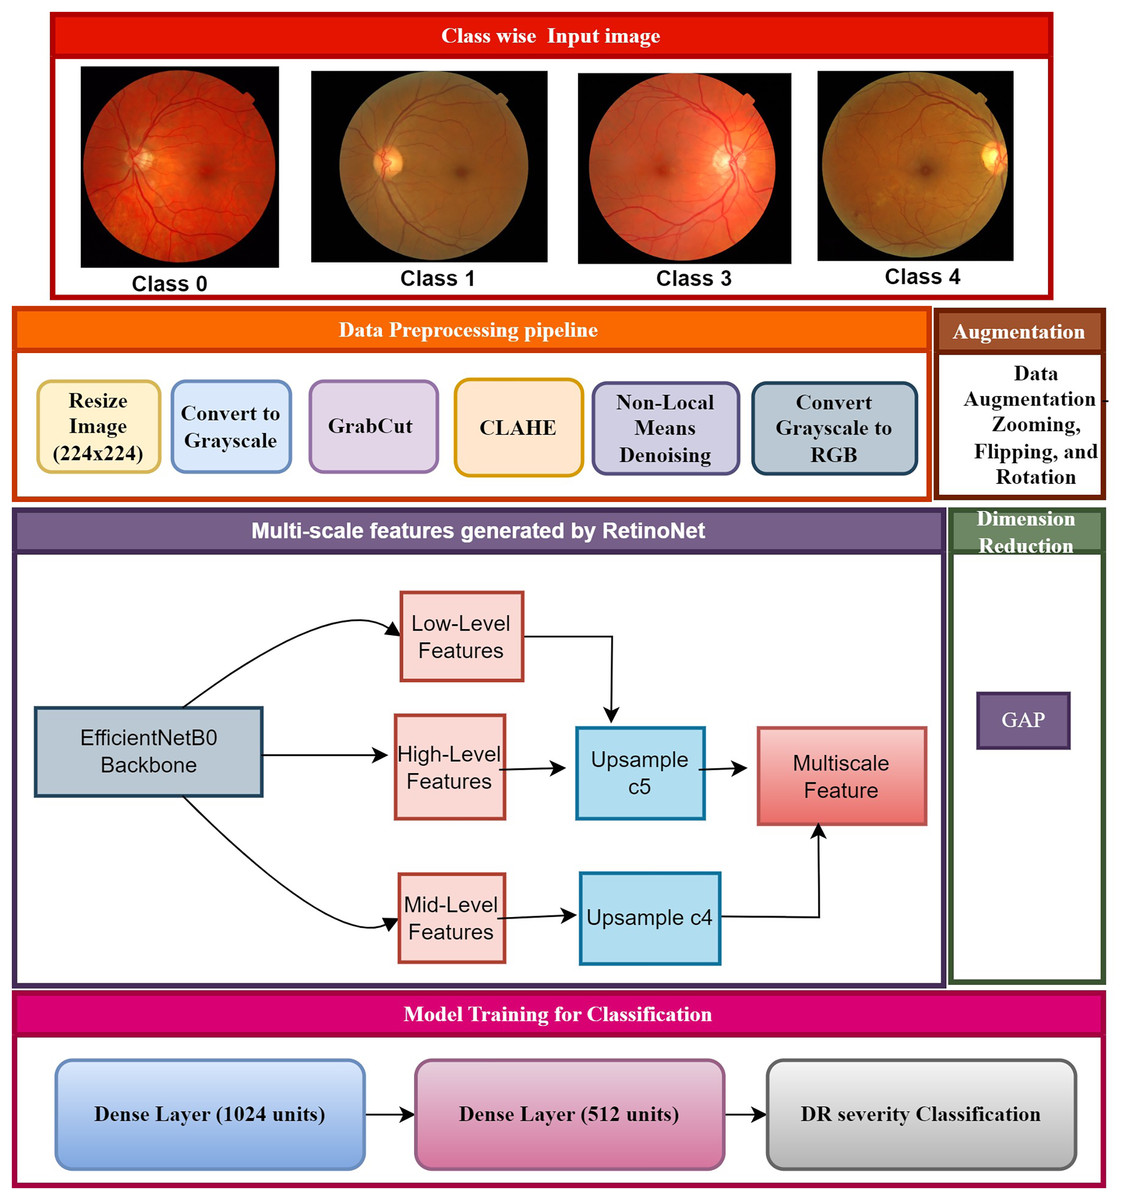
Figure 2: Proposed model of RetinoNet.
The proposed framework showcases significant methodologies, including cutting-edge pre-processing, multi-scale feature extraction, and classification, which proficiently forecast DR phases.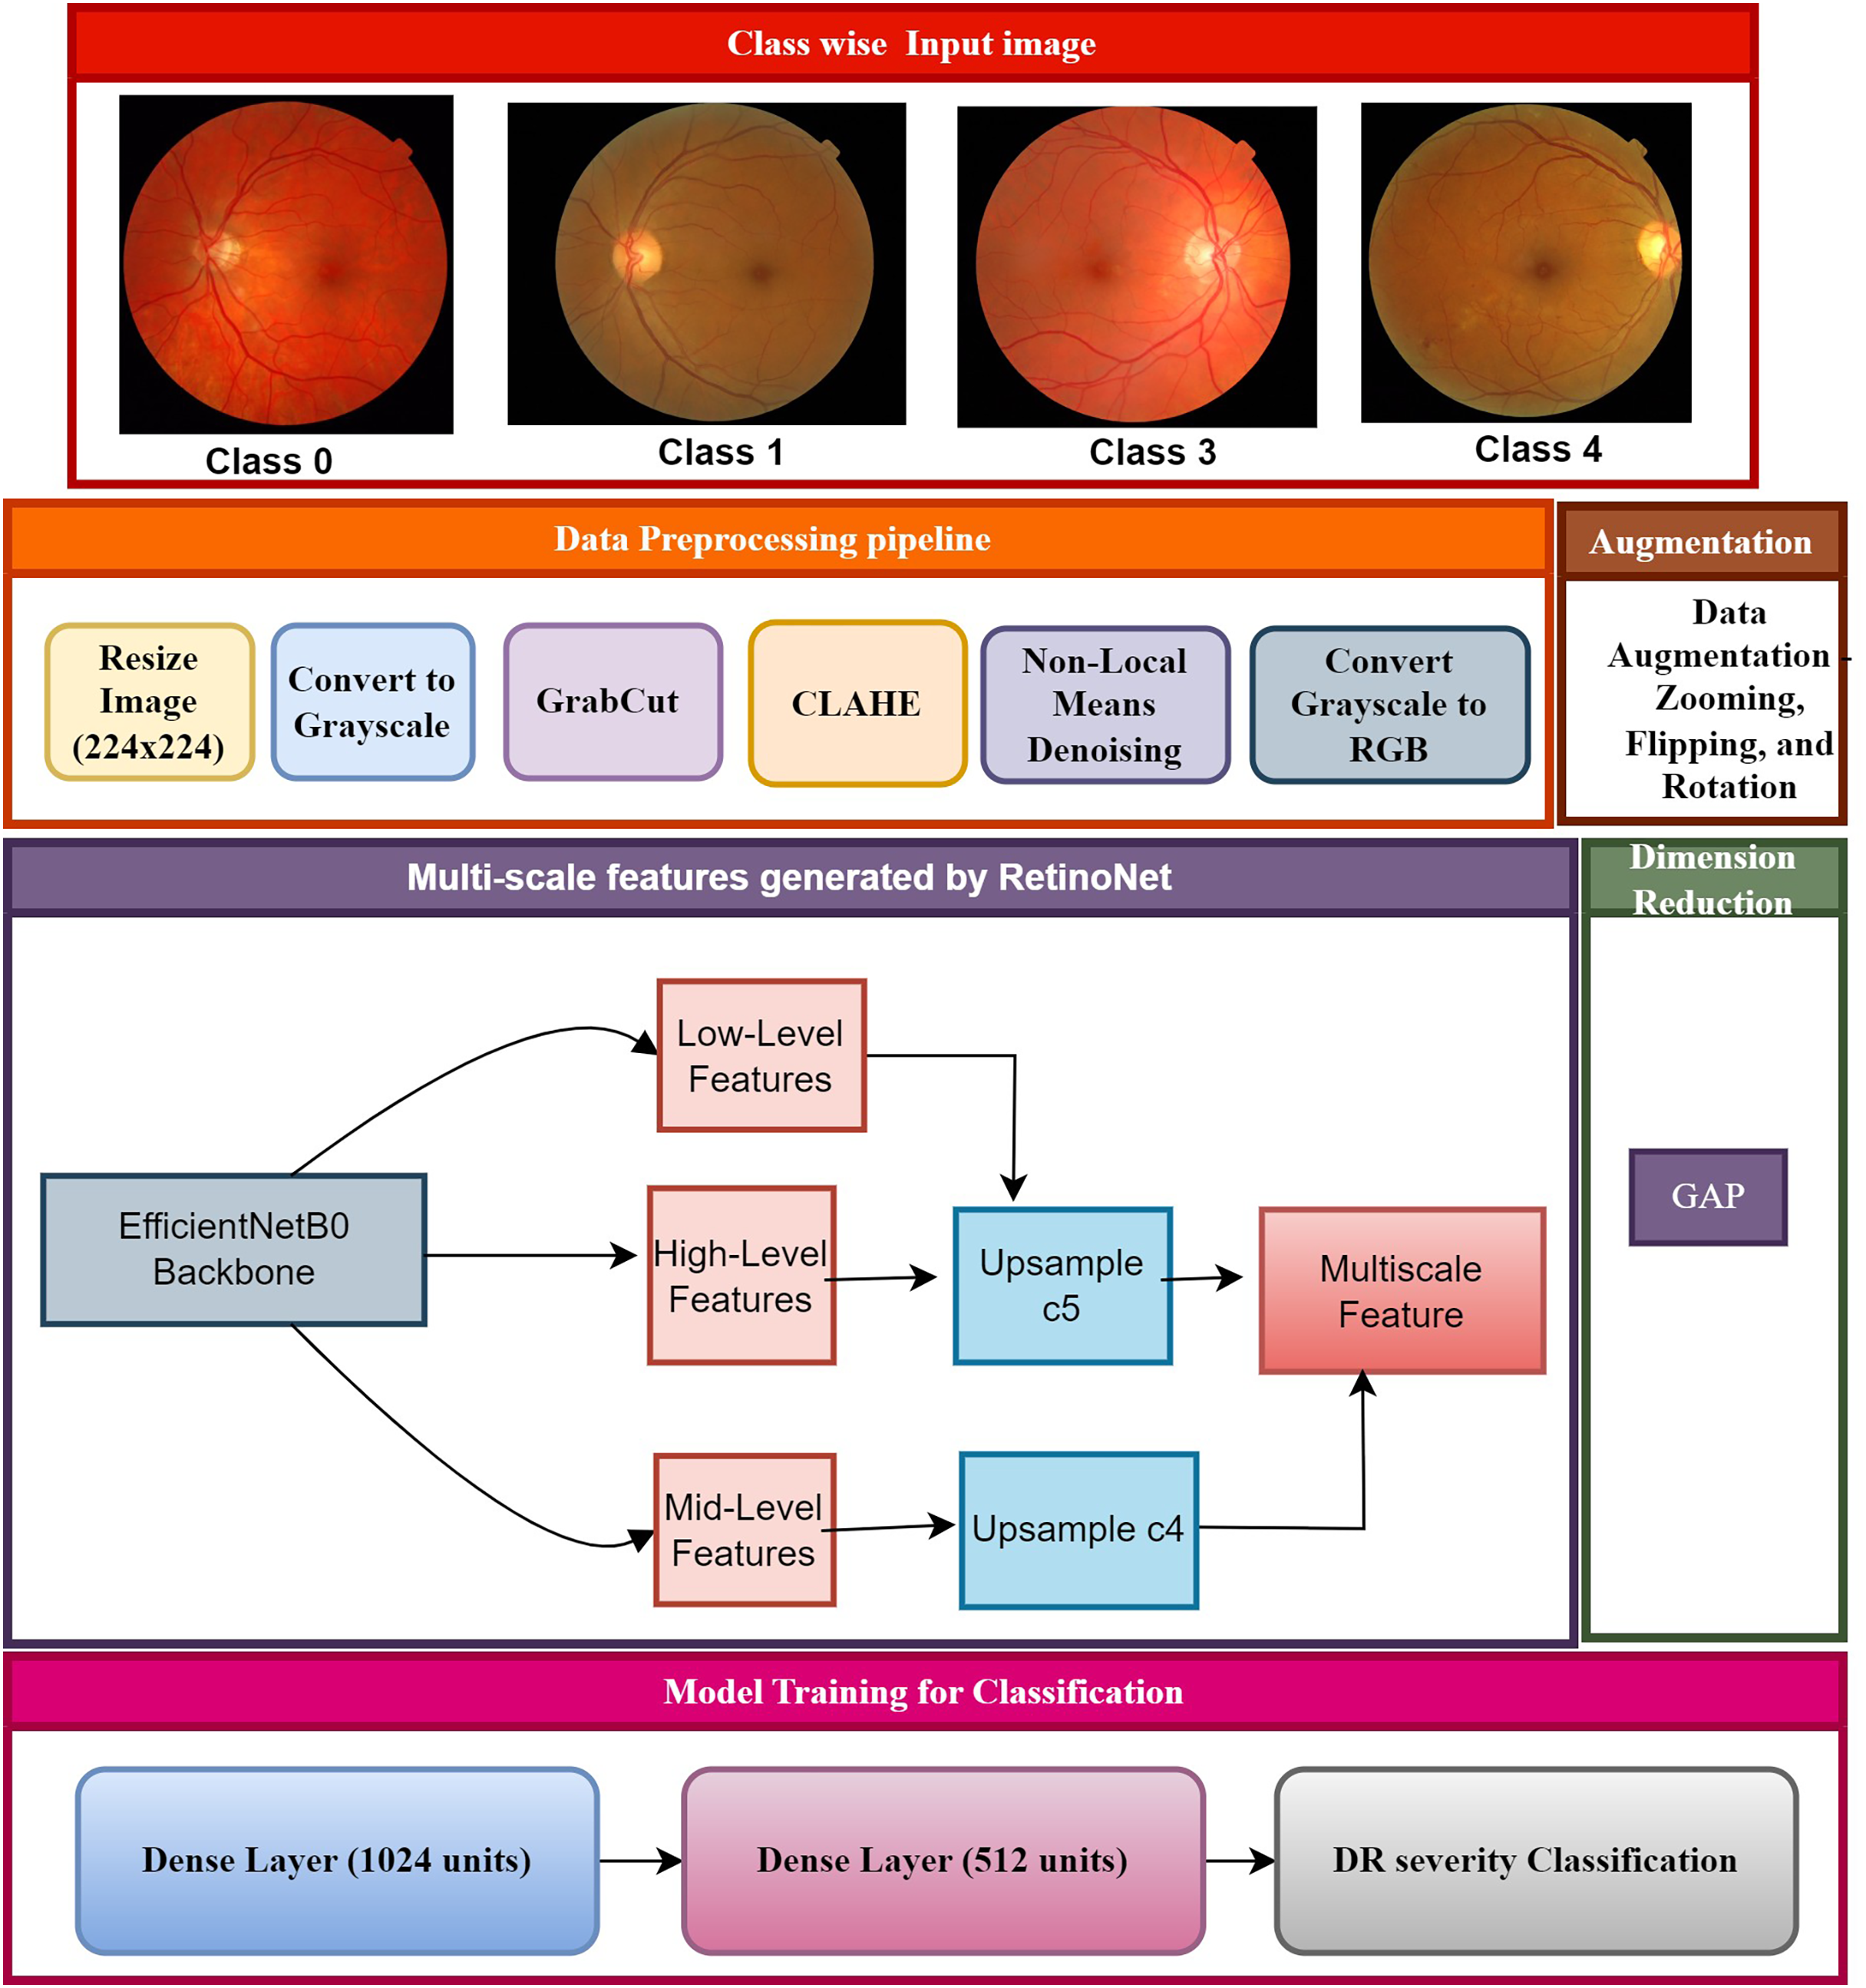
Data pre-processing pipeline
The data pre-processing pipeline has been used to improve the quality of raw retinal images suitable for feature extraction during DR detection. The pipeline also consists of various imaging processing steps to denoise and contrast-enhance the images and prepare it so that the features can be accurately and consistently extracted. This section lists all the steps and their wares in sequentially to assist to neutralize images and comprehensive to numerical analysis. Statistical tests have been used to ensure no bias was introduced during enhancement, maintaining consistency and reliability (Özbay, 2023). The retinal images have been converted into grayscale to allow for further structural analysis and to extract features. To convert to grayscale, it uses the following formula:
(1)
This reduces the image for DR detection providing simpler global representation while preserving structural features. GrabCut algorithm was applied for the segmentation of the retina to achieve the region of interest (ROI):
GrabCut energy function:
(2)
The central region of the greyscale fundus image (the retina that is the most interesting for the clinical fundus analysis) was specified as a seed of the foreground in order to have enough regions of interest to segment the fundus image, and the remaining part was set as a seed of the background seed, given that most of the fundus images have a similar anatomy where there is likely to be background. This procedure ensures that the retina is isolated from the background and results in an in-focus image, denoted as . Next step is applying Contrast Limited Adaptive Histogram Equalization (CLAHE) to increase local contrast and enhance the DR features like; microaneurysms.
The CLAHE uses the formula:
(3)
Non-local means denoising method have been applied to remove noise thereby preserving important details, such as blood vessels and lesions. The formula used for de-noising is
(4)
This results in denoised image , which retains essential DR features, and cubic interpolation is used to upscale the resolution for better visualization of DR features.
The upscaling formula is as follows:
(5)
The up scaled image provides greater clarity for detecting subtle abnormalities. Finally, CLAHE is reapplied to the up-scaled image to further enhance the contrast using the formula:
(6)
This generates the fully processed image, , ready for feature extraction.
The pre-processed retinal images are processed through the backbone of EfficientNet-B0 to model features. This process extracts , , and features, which are essential for identifying various DR abnormalities, including microaneurysms, hemorrhages, and blood vessel changes (Farag, Fouad & Abdel-Hamid, 2022).
This process can be represented as:
(7) where represents the EfficientNet feature extraction function. FPN upscale and fuses these features to produce a comprehensive multi-scale feature map, enabling the detection of both small and large retinal abnormalities. , , and are fused to generate the final feature map:
(8)
(9)
(10)
The multi-scale feature map is optimized for DR severity detection through a combination of Focal Loss for classification and Smooth L1 Loss for localization. Focal Loss, defined as:
(11) addresses the class imbalance inherent in DR detection, while Smooth L1 Loss:
(12) is used for precise localization of retinal features such as lesions. The total loss function is:
(13) guaranteeing accurate classification and precise localization in detecting DR severity stages. The output of RetinoNet is a multi-scale feature map which further reduced in dimensionality using GAP. This feed-forward network is then flattened from the reduced feature map and passed through a dense layer to combine features. It then performs Softmax activation to classify the severity of DR into its categories (Aswini & Vijayaraghavan, 2022; AbdelMaksoud, Barakat & Elmogy, 2022; Bilal et al., 2022).
Figure 3 shows the RetinoNet architecture used for DR detection, featuring convolutional (Conv2D), activation, batch normalization, pooling, and fully connected (Dense) layers. The diagram details the model’s components and the transformations applied to input images. The model starts with input pre-processing (rescaling, normalization), followed by Conv2D and pooling operations for hierarchical feature extraction. Batch normalization, dropout, and feature concatenation are employed to stabilize training and improve generalizability.
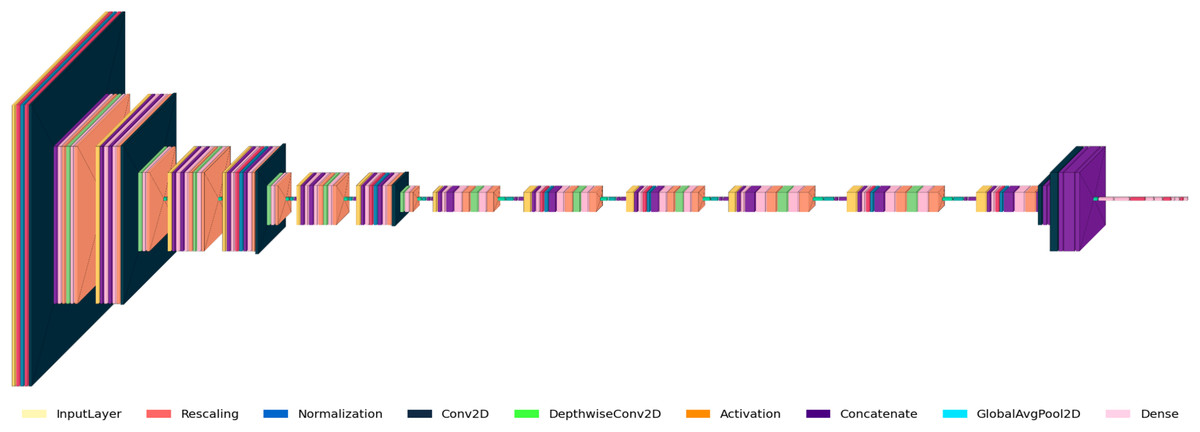
Figure 3: Model architecture of RetinoNet.
Detailed view of the internal components of RetinoNet, highlighting in the model architecture.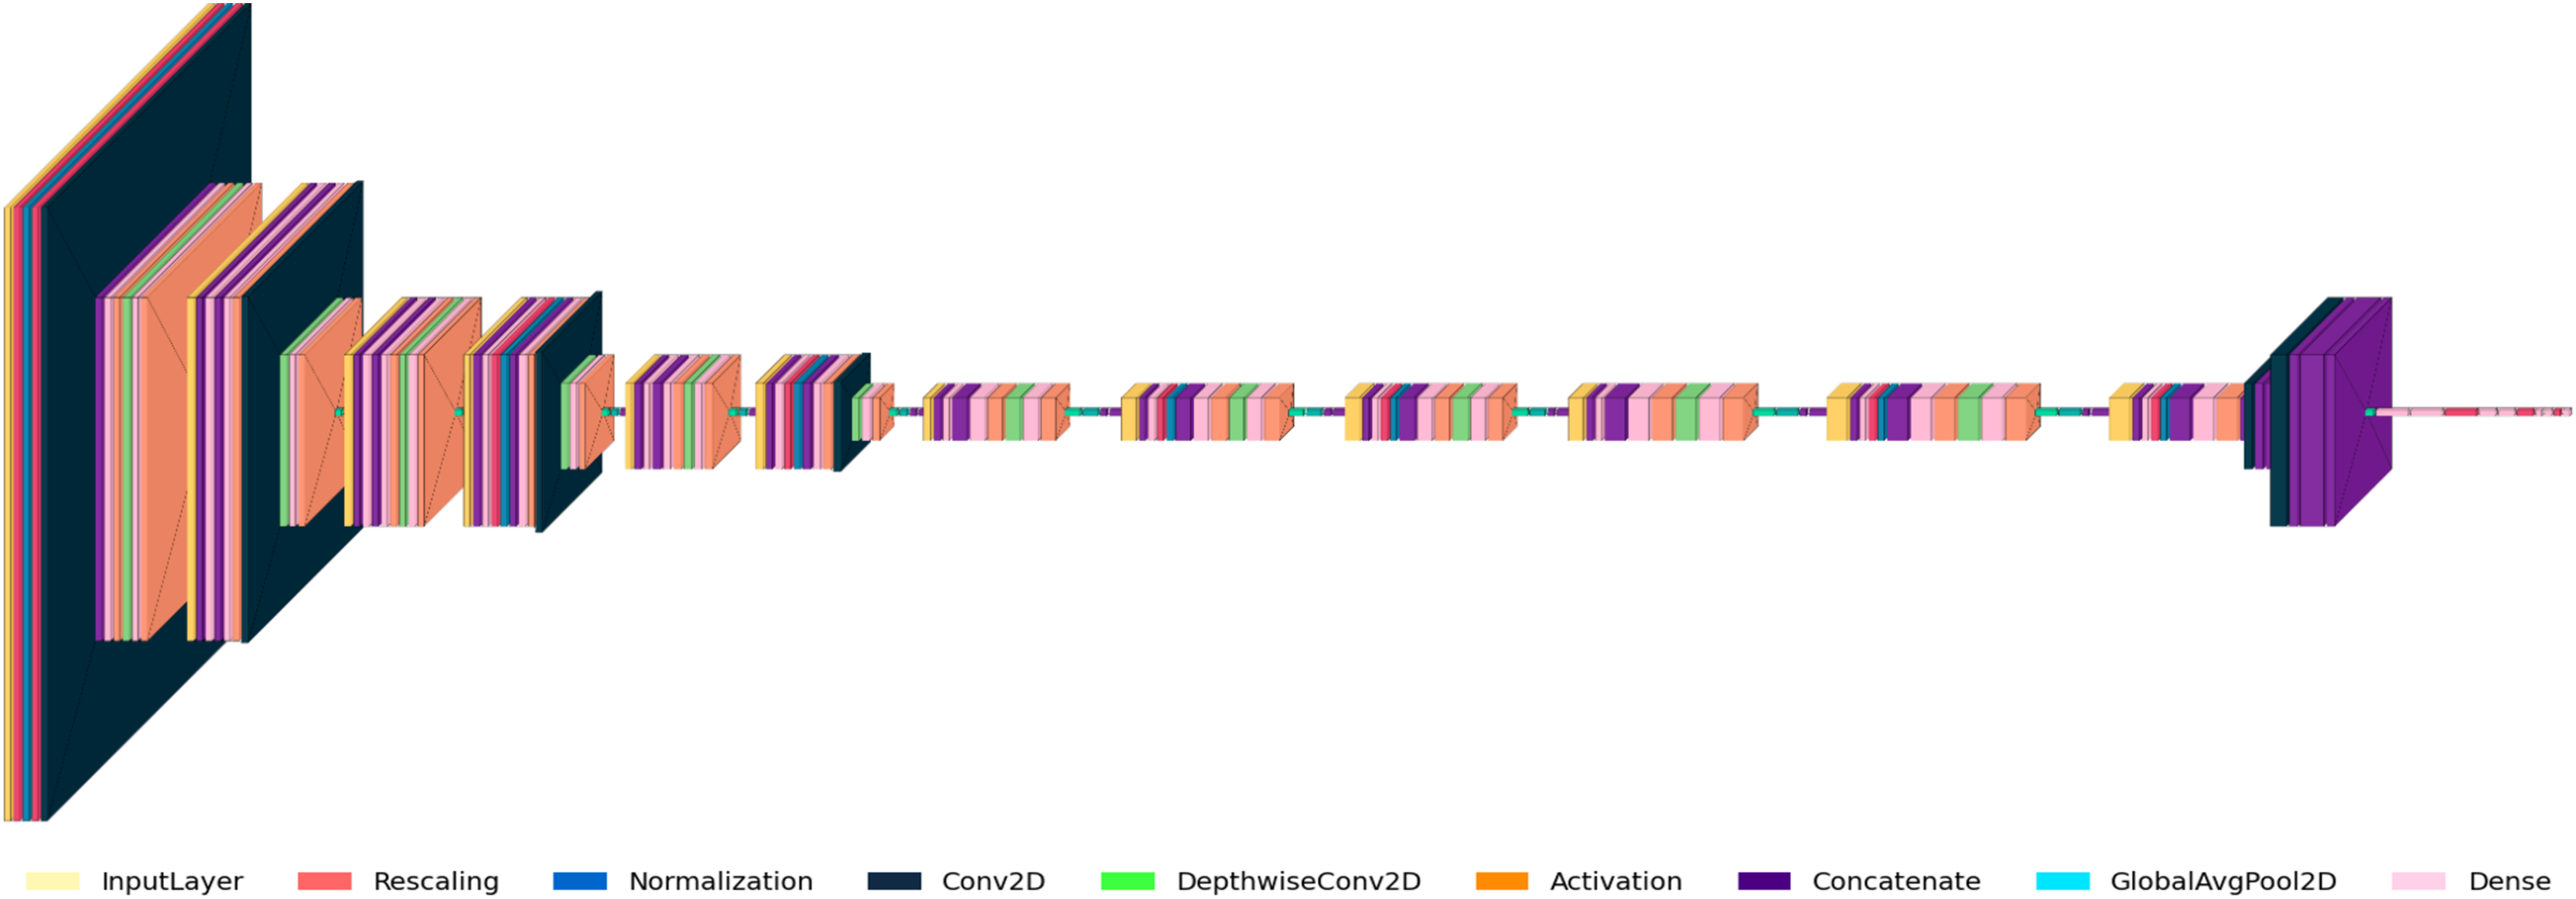
Table 1 presents a summary of the essential hyper-parameters of the RetinoNet model. These hyper-parameters are critical for the replication of the model for DR detection. The parameters encompass specifications such as the model architecture, input dimensions, feature extraction settings, optimization strategy, and augmentation techniques, which are instrumental in achieving high accuracy and generalization in model performance (Oh et al., 2021; Singh & Dobhal, 2024).
| Hyper-parameter | Description | Value (Messidor/APTOS) |
|---|---|---|
| Model architecture | Base neural network used for feature extraction. | EfficientNetB0 |
| Input shape | Dimensions of the input images. | (224, 224, 3) |
| FPN filters | Number of filters used in Conv2D layers of Feature Pyramid Network (FPN). | 256 |
| Optimizer | Algorithm used for updating model weights. | Adamax (0.001)/Adamax (0.00075) |
| Loss function | Function minimized during model training. | Categorical cross entropy |
| Dense layer units | Units in the Dense layers used after feature extraction. | 1024, 512, 128 |
| Augmentation techniques | Methods used to enhance data diversity. | Rotation: 20°, Shift: 10%, Zoom: 10%, etc. |
| Early stopping | Stops training when validation loss does not improve. | Patience: 6 epochs, restore best weights: true |
| Batch normalization | Normalizes the output of layers to stabilize and speed up training. | Applied after Conv2D and Dense layers |
| Dropout rate | Fraction of input units to drop to prevent overfitting. | 0.5, 0.3/0.5, 0.24 |
Visualization of the image enhancement
Figure 4 shows the stages of the enhancements which are obtained for an image. It shows a sample of the processing and segmentation stages used in this study for DR detection: the processes applied over an original image that consider important features of the retina. The pre-processed image is converted to grayscale, with contrast adjustment using contrast-limited adaptive histogram equalization (CLAHE), followed by non-local means denoising to avoid over-smoothing of detailed information. The up-scaled image, which is cubic interpolated, offers a higher resolution and finer details in the images, such as a finer view of the small blood vessels (Han et al., 2022; Huang et al., 2022). In addition, the contrast-enhanced image provides significant contrast to discern microaneurysms and haemorrhages, which are essential for performing segmentation of certain retinal features and for accurate classification. This standardized pipeline applies to all images with consistency and ensures no bias in image enhancement while respecting the variability in DR severity. Validation of image quality has been performed in the content of research using PSNR, SSIM, and MSE, and analysis of variance was conducted on all stages of DR to ensure consistency and unbiased enhancement, thus allowing for reliable segmentation and detection.
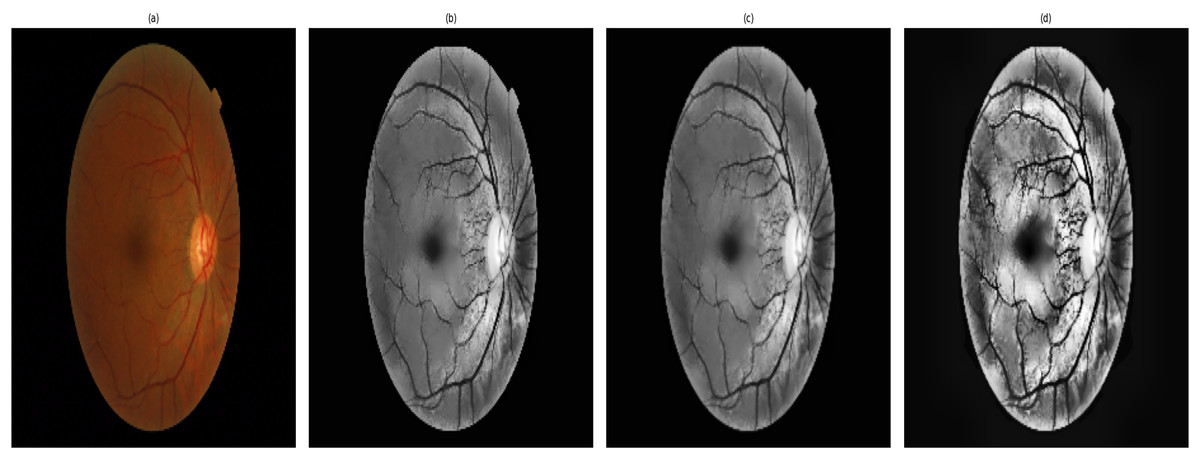
Figure 4: Retinal image enhancement and segmentation pipeline.
Pipeline showing enhancement and segmentation approaches used to improve DR feature visibility and input quality.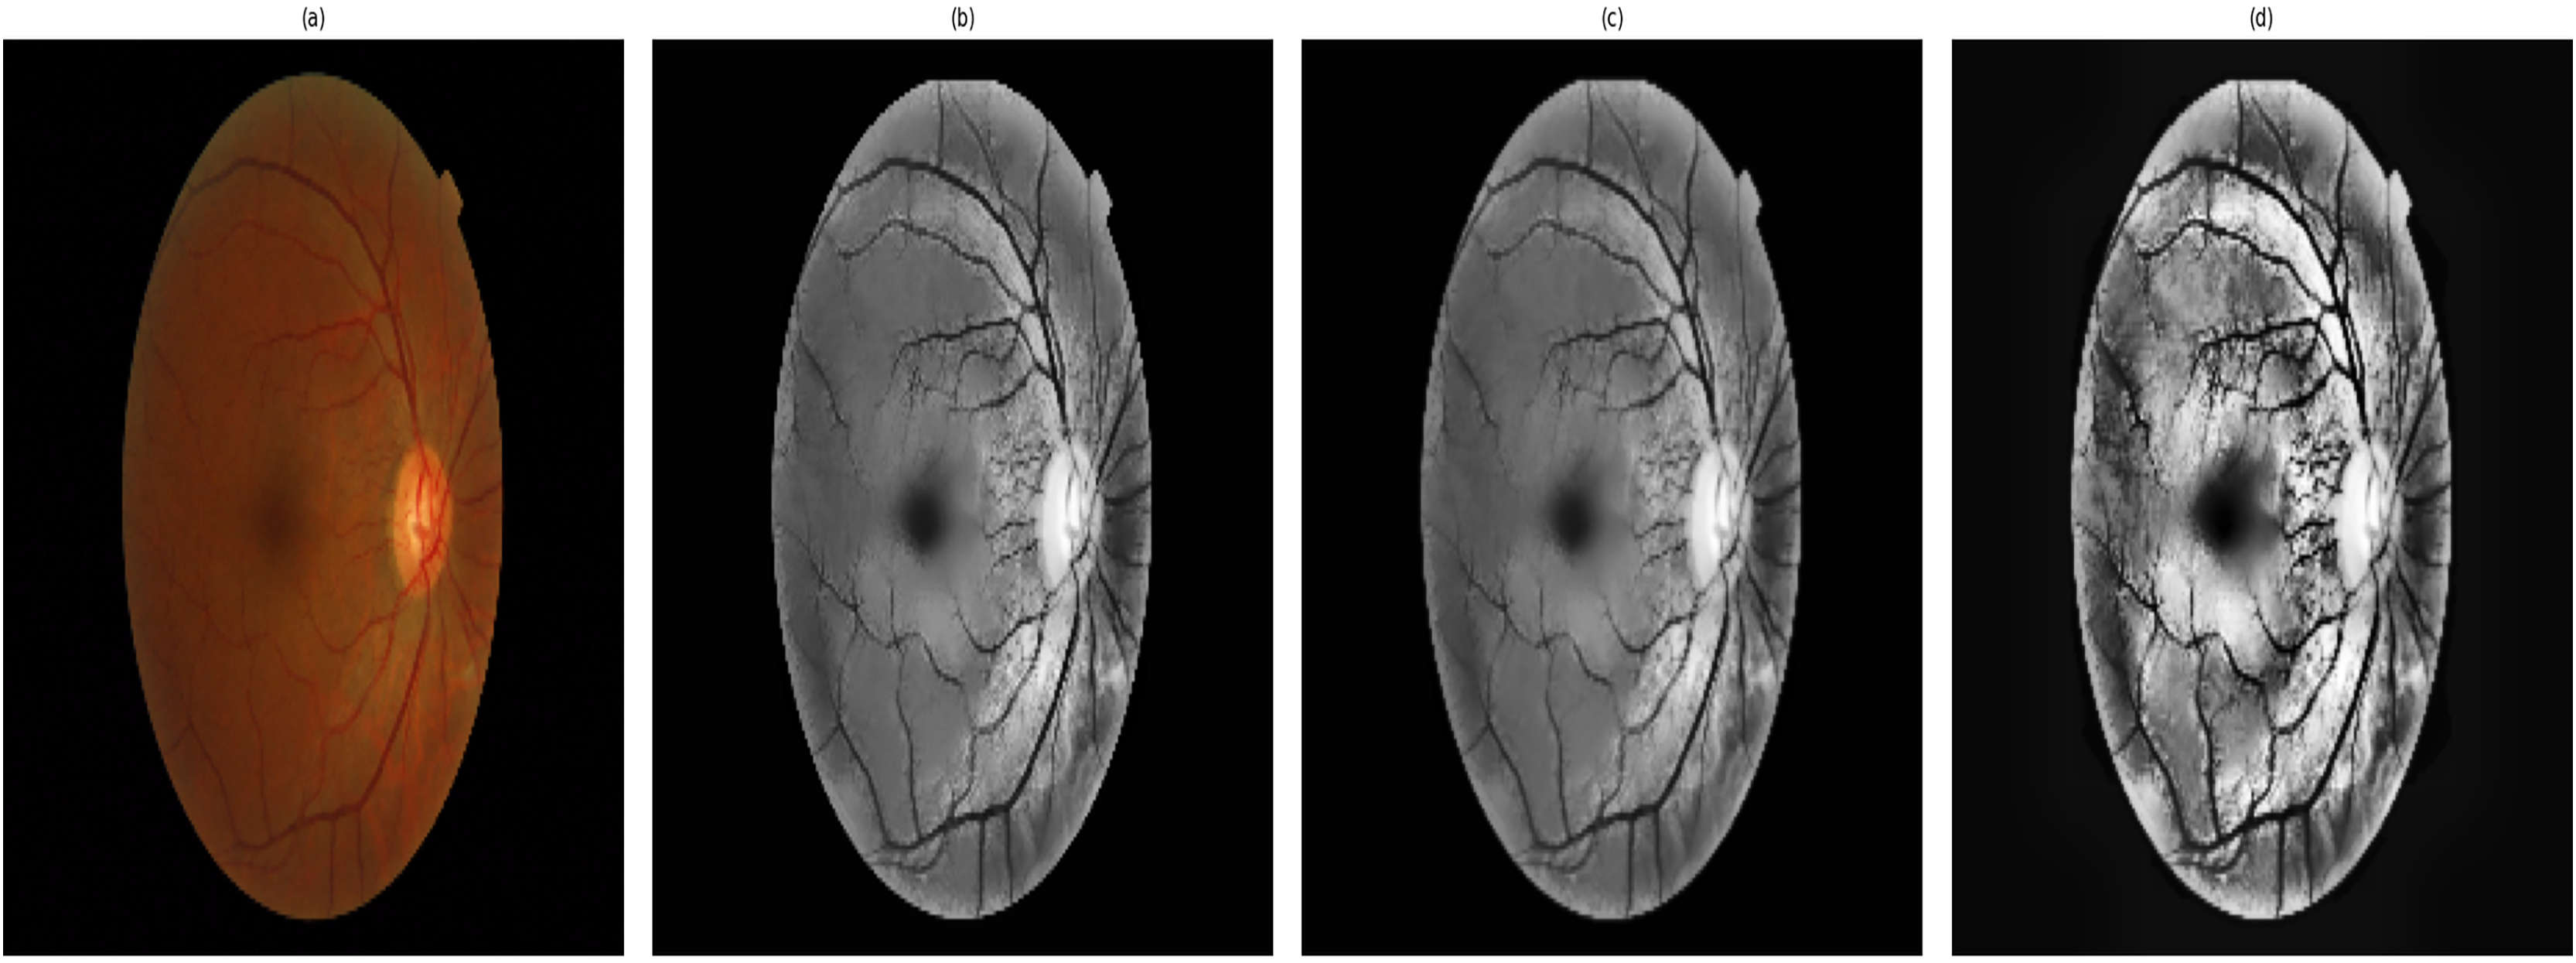
ANOVA for DR detection
A one-way ANOVA test was used to determine whether there were statistically significant differences between the means of three or more independent groups. Table 2 shows randomly selected values of metrics used in evaluating the enhanced image from various DR classes namely class 0: No DR, Class 1: Mild DR, Class 2: Moderate DR, Class 3: Severe DR. The abbreviation of each metrics is PSNR, SSIM, and MSE. These metrics are essential in the assessment of image performance. The metrics PSNR is used to assess the signal-to-noise ratio, SSIM measures structural similarity between the original and enhanced images, and MSE quantifies pixel-level error. The objective of performing ANOVA on these random sample was to statistically determine whether or not the output of the enhancement pipeline is unbiased and uniform across all DR severity levels. The ANOVA evaluation of these measures confirms the fairness and consistency of the process, ensuring uniform image quality improvement across all severity classes without any bias towards specific classes. This guarantees the accuracy and fairness of the process in a real-time implementation.
| Label | PSNR | SSIM | MSE |
|---|---|---|---|
| Class 0 | 20.024836 | 0.557328 | 85.369233 |
| Class 0 | 19.993087 | 0.548871 | 85.085684 |
| Class 0 | 20.032384 | 0.550338 | 84.942176 |
| Class 0 | 20.076151 | 0.542876 | 84.849448 |
| Class 0 | 19.988292 | 0.547278 | 84.260739 |
| Class 1 | 19.998293 | 0.551555 | 84.740078 |
| Class 1 | 20.088961 | 0.545245 | 84.869681 |
| Class 1 | 20.048372 | 0.552878 | 85.628561 |
| Class 1 | 19.986526 | 0.547997 | 85.271809 |
| Class 1 | 20.037128 | 0.549542 | 84.21848 |
| Class 2 | 19.996829 | 0.548991 | 85.362042 |
| Class 2 | 19.996714 | 0.561261 | 85.007459 |
| Class 2 | 20.032098 | 0.551933 | 84.861539 |
| Class 2 | 19.924336 | 0.546711 | 85.505838 |
| Class 2 | 19.933754 | 0.556113 | 85.7155 |
| Class 3 | 20.001886 | 0.546896 | 85.76564 |
| Class 3 | 19.979358 | 0.554044 | 84.880391 |
| Class 3 | 20.045712 | 0.543202 | 85.145394 |
| Class 3 | 19.984599 | 0.546359 | 85.465632 |
| Class 3 | 19.959385 | 0.553984 | 85.787773 |
Note:
Randomly selected peak signal-to-noise ratio (PSNR), structural similarity index measure (SSIM), and mean squared error (MSE) values from each class to further statistically analyze the consistency of image enhancement.
The steps involved to perform ANOVA are given as follows:
Step 1: Define the hypotheses:
Null hypothesis (H₀): There are no significant differences in PSNR, SSIM, or MSE across DR severity levels.
Alternative hypothesis (H₁): There are significant differences in PSNR, SSIM, or MSE across DR severity levels.
Step 2: Calculate the F-statistic and p-value
In statistical analysis of variance (ANOVA), the F-statistic compares the variance within each group to the variance between the groups (PSNR, SSIM, and MSE across DR severity levels). The formula is
(14)
Between-Group Variance (SSB): Measures the variability in PSNR, SSIM, and MSE across different DR severity levels (e.g., comparing Class 0 to Class 3).
Within-Group Variance (SSW): Measures the variability within each DR class (e.g., how PSNR varies within Class 1).
Step 3: Accept or reject the hypothesis
The chosen significance level is generally 0.05 which is compare the p-value.
If p-value ≤0.05, reject the null hypothesis (H₀) and conclude that there are significant differences in PSNR, SSIM or MSE across DR severity levels.
If the p-value is larger than 0.05, it fails to reject the null hypothesis (H₀), concluding that no significant difference exists in PSNR, SSIM, or MSE among the different DR levels
Table 3 shows the results of the ANOVA test, which show that there is no statistically significant difference in image quality metrics across different levels of DR severity. This shows that the method is very reliable. The provided information and statistical analysis provide strong proof that the suggested image enhancement method is effective and fair for all stages of DR.
| Metric | F-value | p-value |
|---|---|---|
| PSNR | 2.126616 | 0.136972 |
| SSIM | 0.768157 | 0.528464 |
| MSE | 1.721841 | 0.202714 |
Note:
Results of the ANOVA test, which show that there is no statistically significant difference in image quality metrics across different levels of diabetic retinopathy (DR) severity.
Statistical and visual analysis of image quality enhancement in DR detection
The histograms and density plots for the distribution of image quality metrics considered in this study are shown in Fig. 5 with detailed interpretations. These plots provide some insight into the effectiveness and consistency of different pre-processing techniques. The minimal variations in the values of PSNR (19.925 to 20.075), SSIM (0.5425 to 0.5600), and MSE (84.2 to 85.8) reflect that the resultant image quality appears quite similar for all samples used for experimentation. We can also confidently ascertain this consistency from each of the values that tend to cluster around some points: PSNR = 20, SSIM = 0.55, and MSE = 85. This type of uniformity is important to ensure that the pre-processing methods do not introduce any bias or differential enhancement across various DR severity levels (Khan et al., 2021).
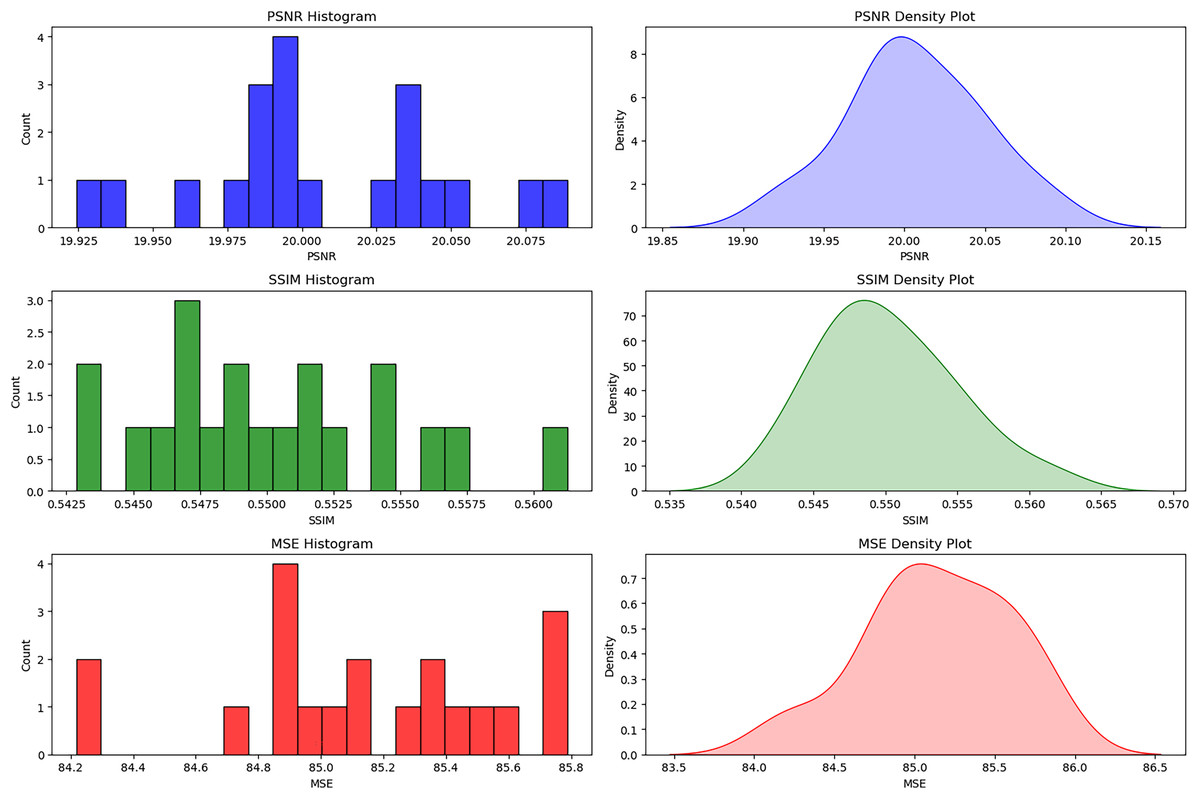
Figure 5: Distribution of PSNR, SSIM, and MSE for bias-free DR image enhancement.
The histograms and density plots for the distribution of image quality metrics considered in this study.
Assessment metrics used in RetinoNet
The standard assessment metrics used in evaluating the RetinoNet model is discussed in detail
(15)
Precision measures the accuracy of positive predictions, indicating how often DR-positive cases are correctly identified without false alarms.
(16)
Recall measures the model’s ability to detect all positive cases, ensuring that the model identifies most patients with DR correctly.
(17)
The F1-score balances both precision and recall, especially useful in DR detection where there may be an imbalance between positive and negative cases.
(18)
Specificity measures how well the model identifies negative cases, ensuring that healthy patients are not misclassified as having DR.
(19)
Accuracy measures the overall correctness of the model, providing an overall sense of the model’s effectiveness in detecting DR.
The Fig. 6 shows the comparatively strong performance of RetinoNet on precision, recall, F1-score, specificity and accuracy metrics for DR detection on the Messidor and APTOS datasets. The relatively high values for both datasets denote that the estimation model performs close to its upper bound, which indicates strong generalization ability. In addition, performance metrics, such as accuracy and specificity, do not vary significantly, which shows the reliability and consistency of the model for DR detection across classes. This clearly proves that RetinoNet can provide reliable results across all severity levels of DR (Sungheetha, 2021; Gadekallu et al., 2020).
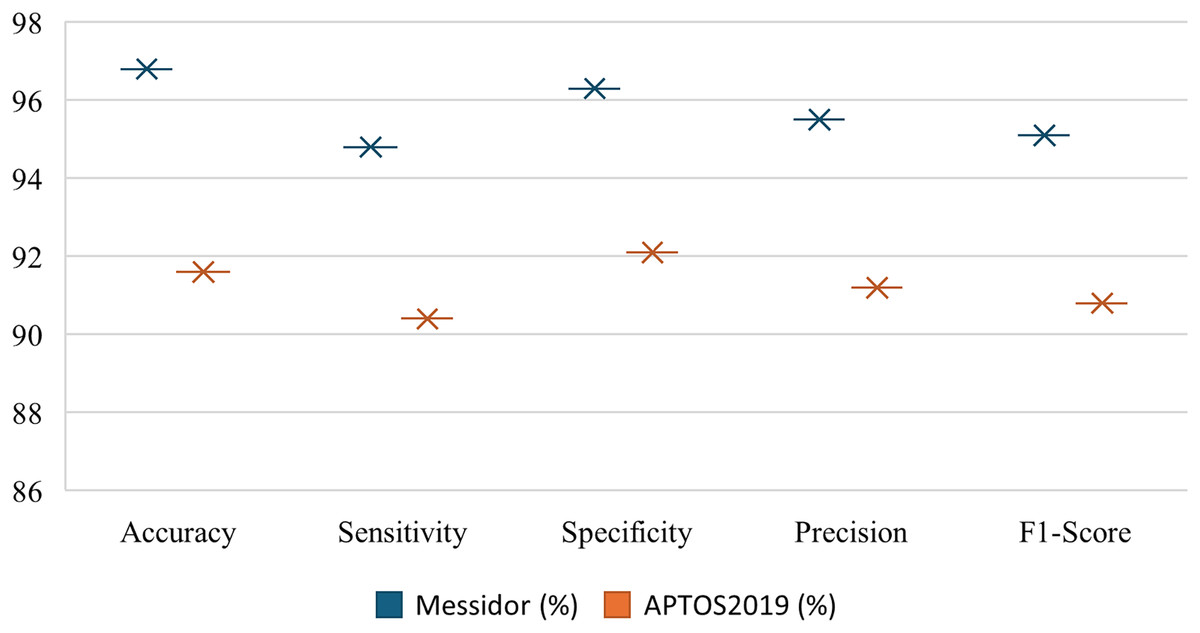
Figure 6: Performance metrics of proposed model—RetinoNet.
The plot shows the comparatively strong performance of RetinoNet on precision, recall, F1-score, specificity and accuracy metrics for DR detection using the Messidor and APTOS datasets.
Grad-CAM for lesion interpretation
Grad-CAM is used in this study to highlight the discriminative parts in fundus images that are vital for classification (Bilal et al., 2023). This enhances clinical interpretability and enables validation of the model for targeting of pathologically relevant features. Therefore, it supports clinical trust in model prediction. The DR-affected sample for each class are presented in Fig. 7.
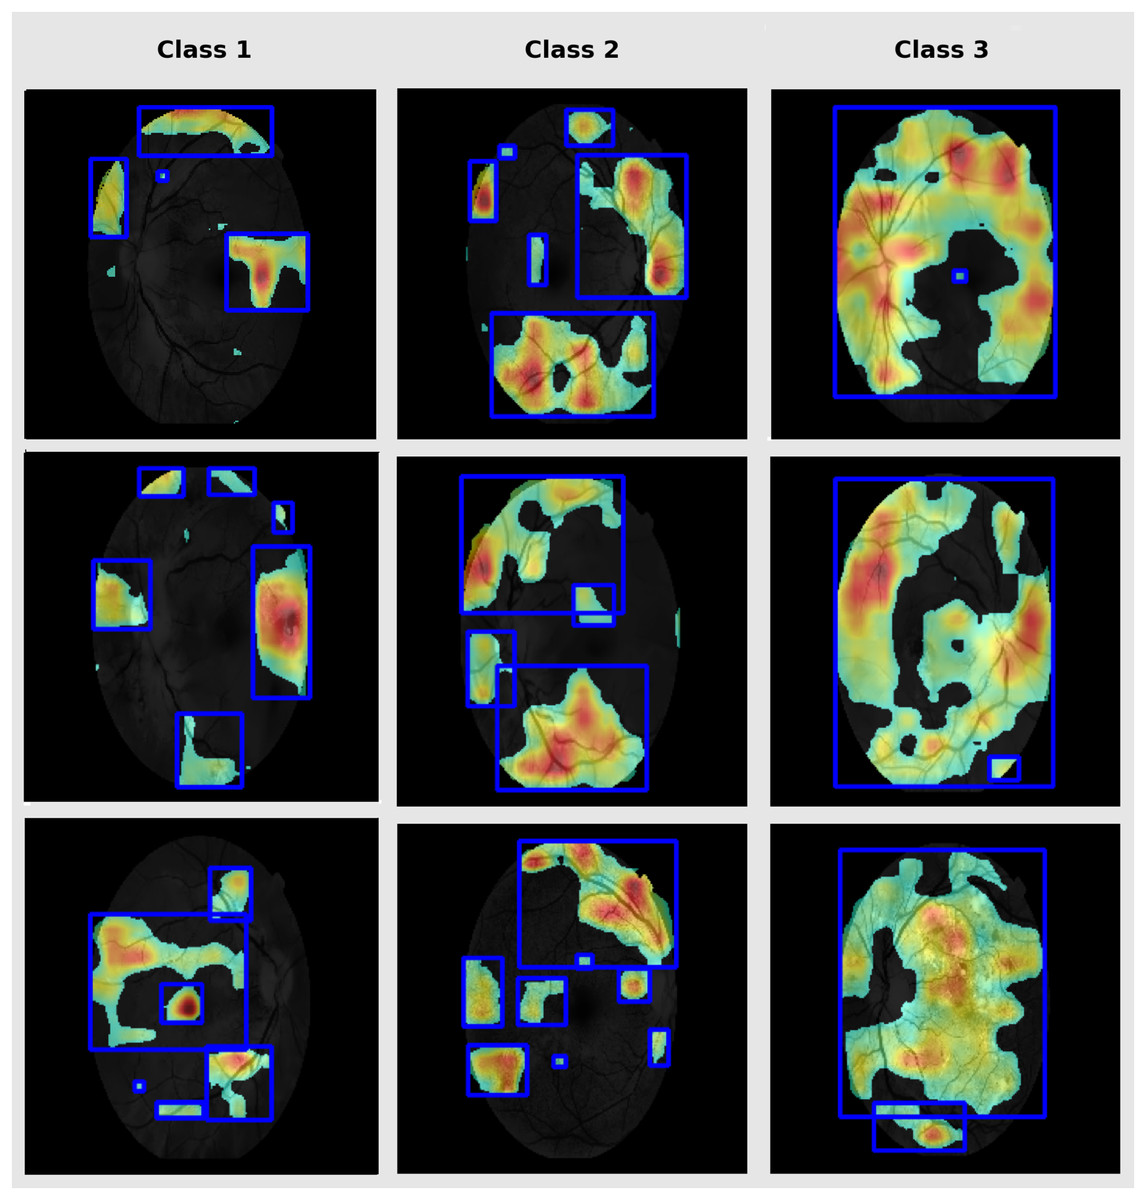
Figure 7: Grad-CAM lesion visualization.
Grad-CAM depicts the notable retinal regions used by RetinoNet for classification, which helps in the visual interpretation of decision patterns.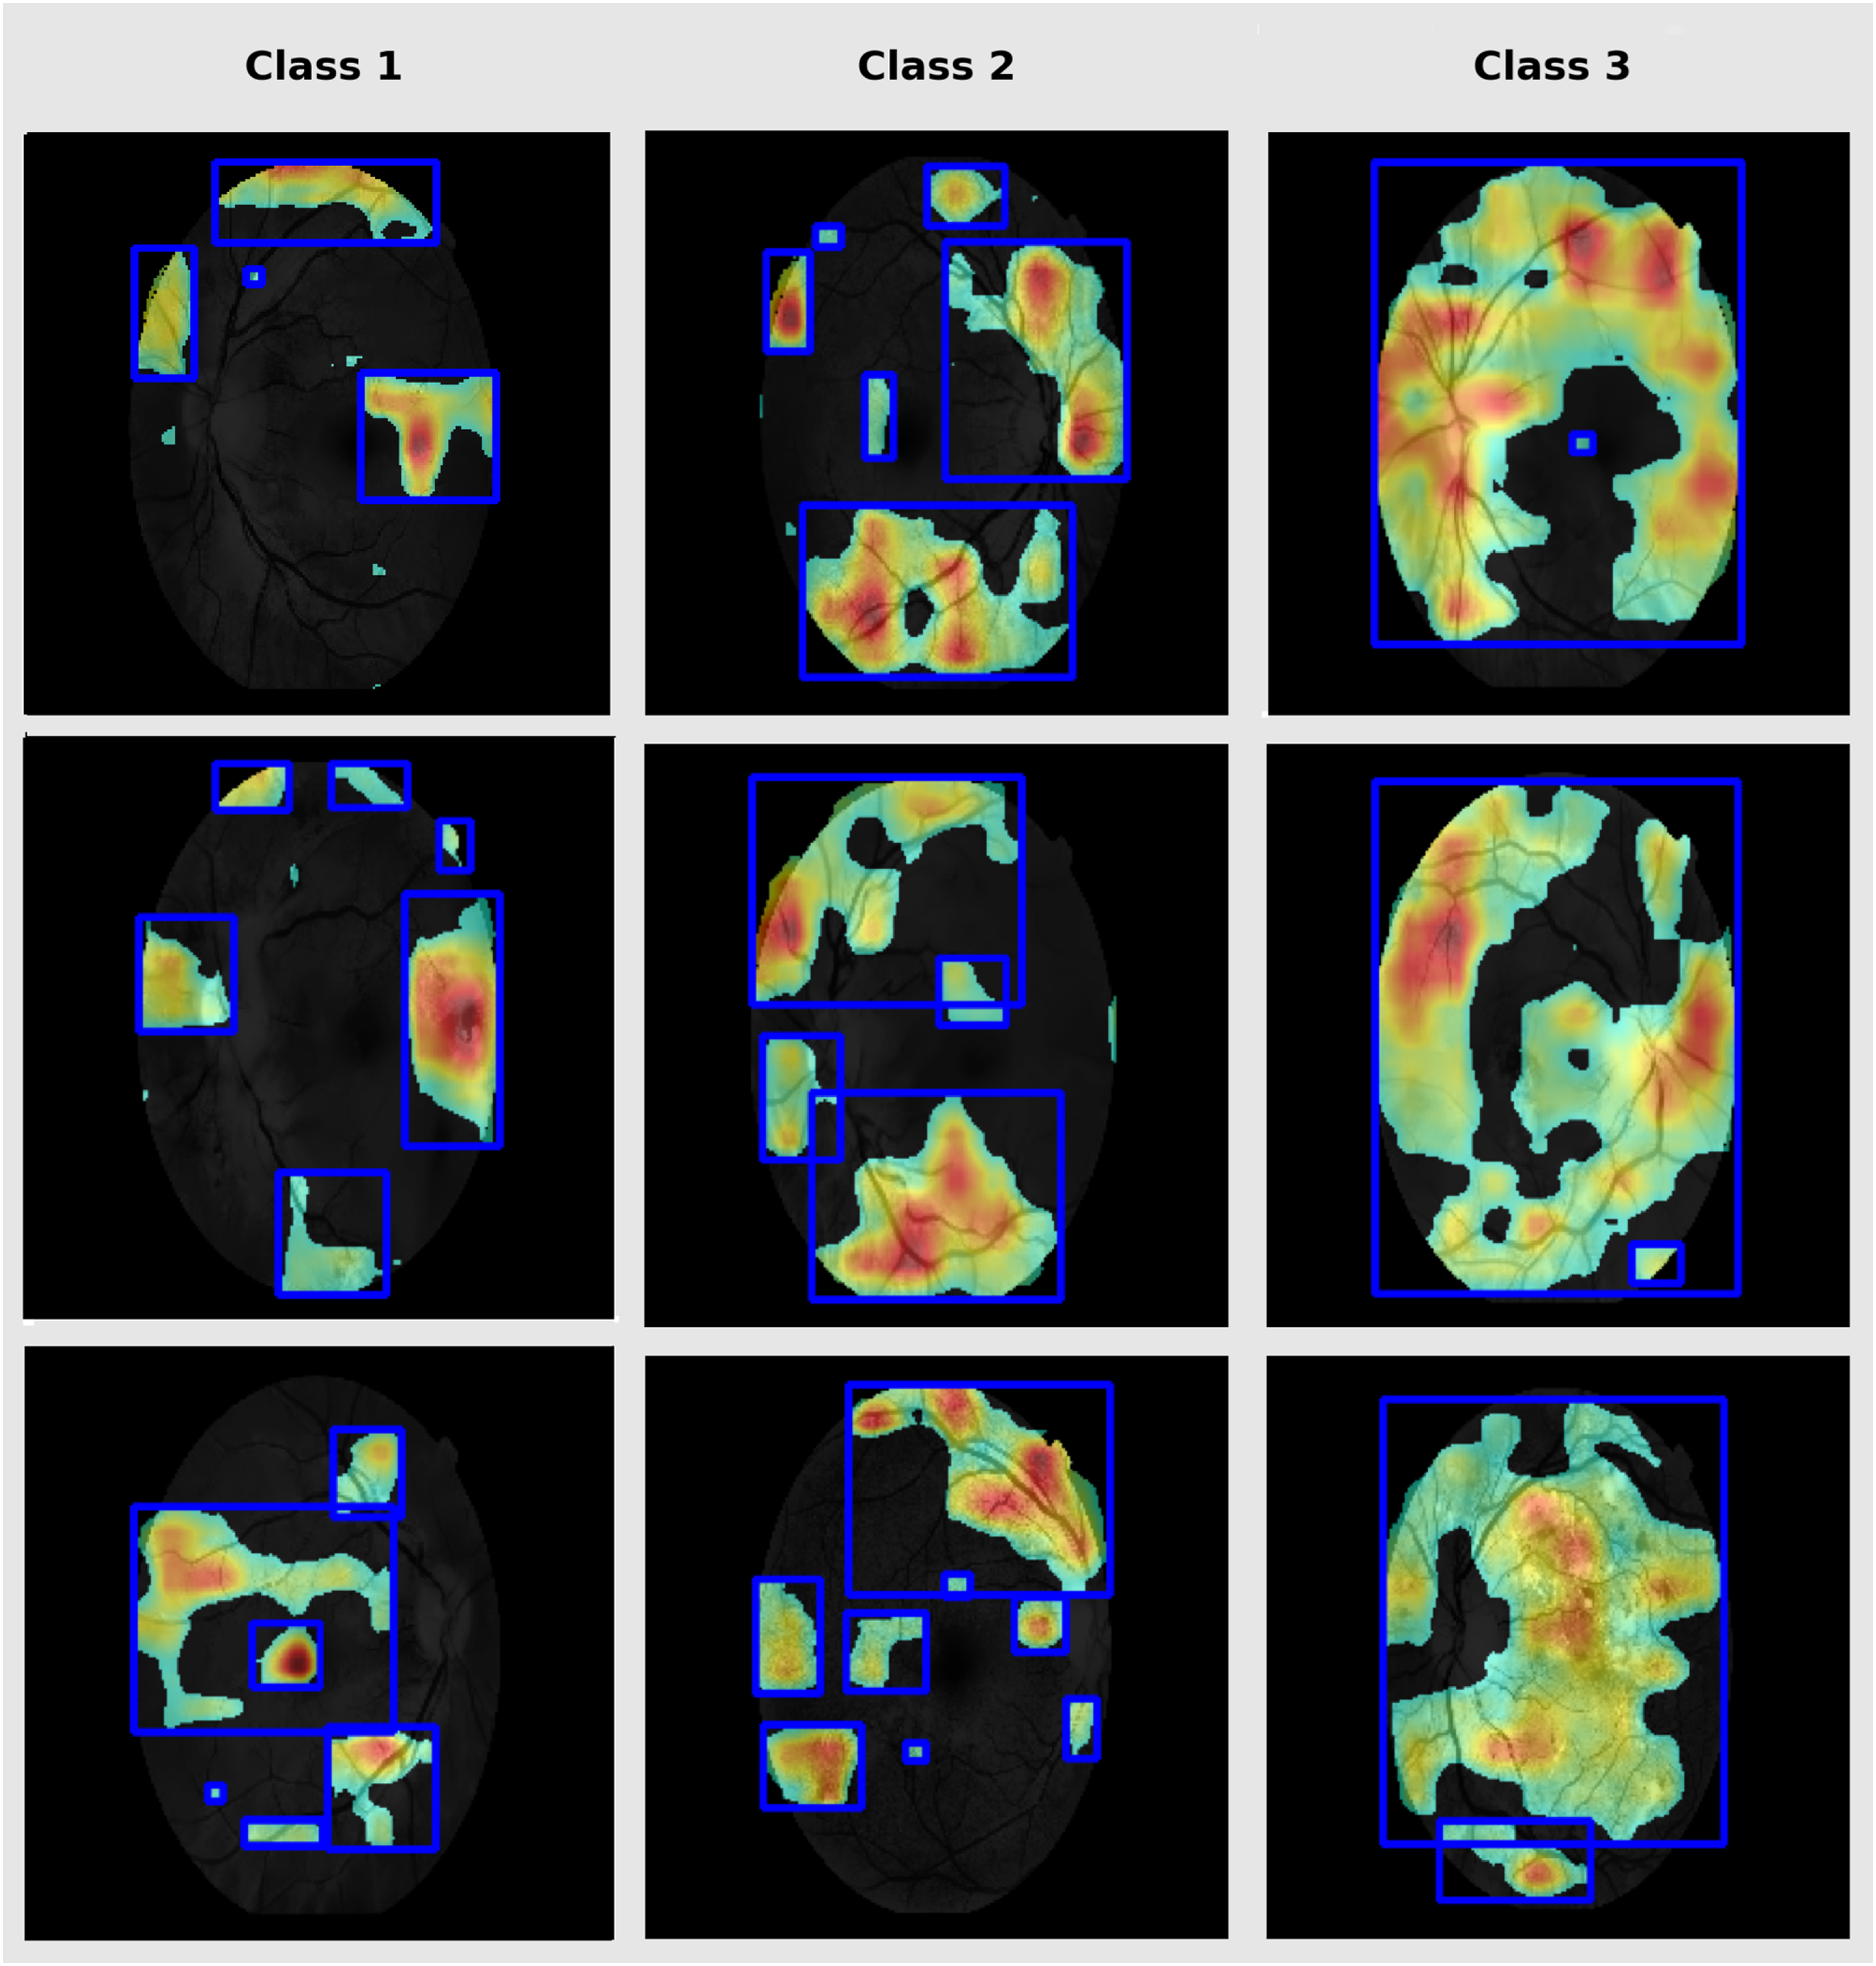
Evaluation method
In this section, we discuss RetinoNet performance with a dual comparative aspect. First, it was evaluated against a simple pre-trained model using key performance metrics. Second, we compare the optimization aspect of RetinoNet against other optimization techniques used in the state-of-the-art model (SOTA). This analysis provided a comprehensive assessment of the model.
Comparative analysis across model
Dealing with optimizations, including model-type selections, tuning hyper parameters, and creating a fusion of technology in every stage of model creation, this study systematically compares different perspectives of the model. Therefore, a performance comparison was performed to compare the proposed model with other simple models for DR detection. The comparison starts with the evaluation of metrics such as accuracy, precision, recall, and other relevant metrics that are used in evaluating a common DR detection model. The performance comparisons between the various models presented in Fig. 8 indicate the strengths and weaknesses of the models in terms of the performance assessment criteria. The performance comparison is done on both Messidor and APTOS dataset. Based on the comparative analysis, EfficientNet-B0 has been selected as the backbone model for the proposed system due to its superior performance over other baseline architectures. Subsequently, to enhance its feature extraction capabilities, the model was fused with FPN, resulting in RetinoNet. Therefore, the use of EfficientNet-B0 and its fusion with FPN is justified based on the empirical performance comparison. The proposed model achieved a relatively better performance compared to other transfer learning models, with marked improvements in accuracy, precision, and specificity, which are clearly visible in the graph. RetinoNet achieves 96.8% accuracy and 94.8% recall.
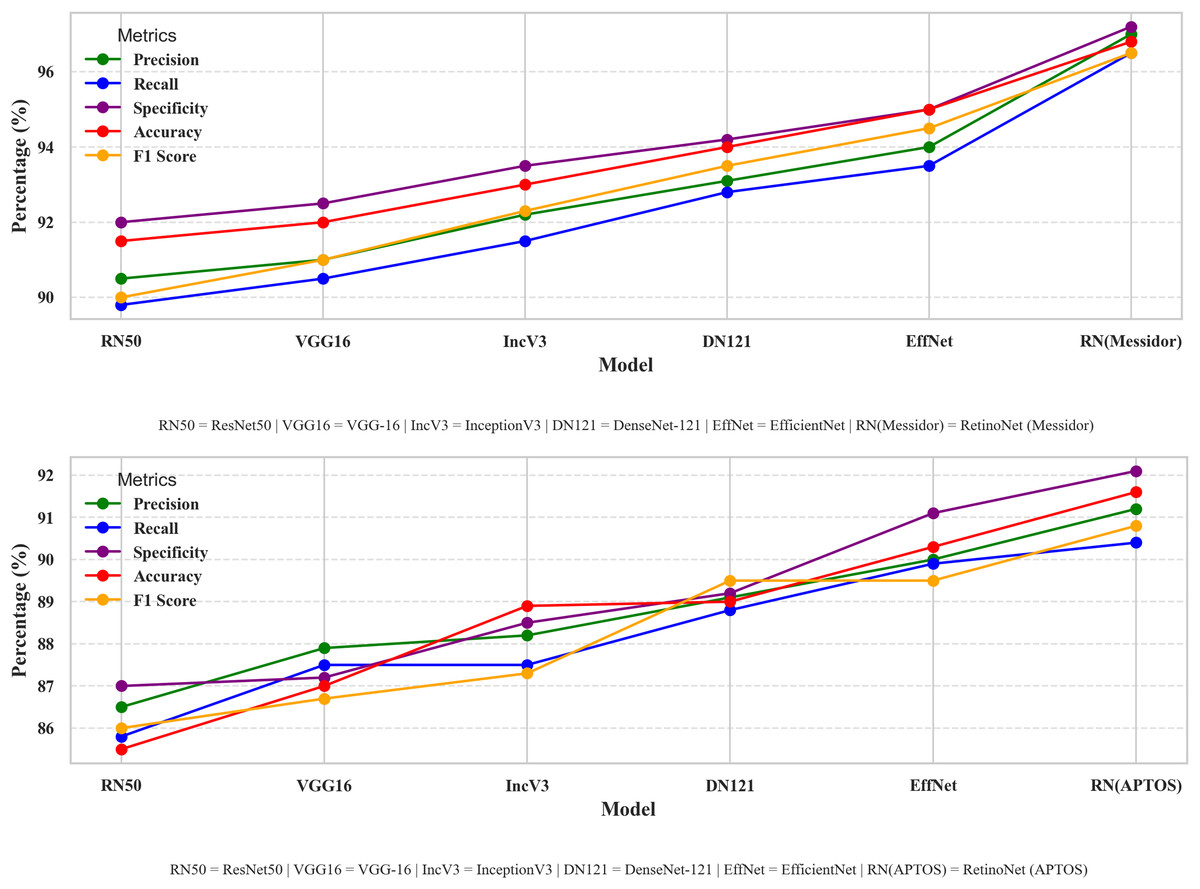
Figure 8: Performance metrics comparative analysis across models.
The performance comparisons between the various models indicate the strengths and weaknesses of the models in terms of the performance assessment criteria on both datasets.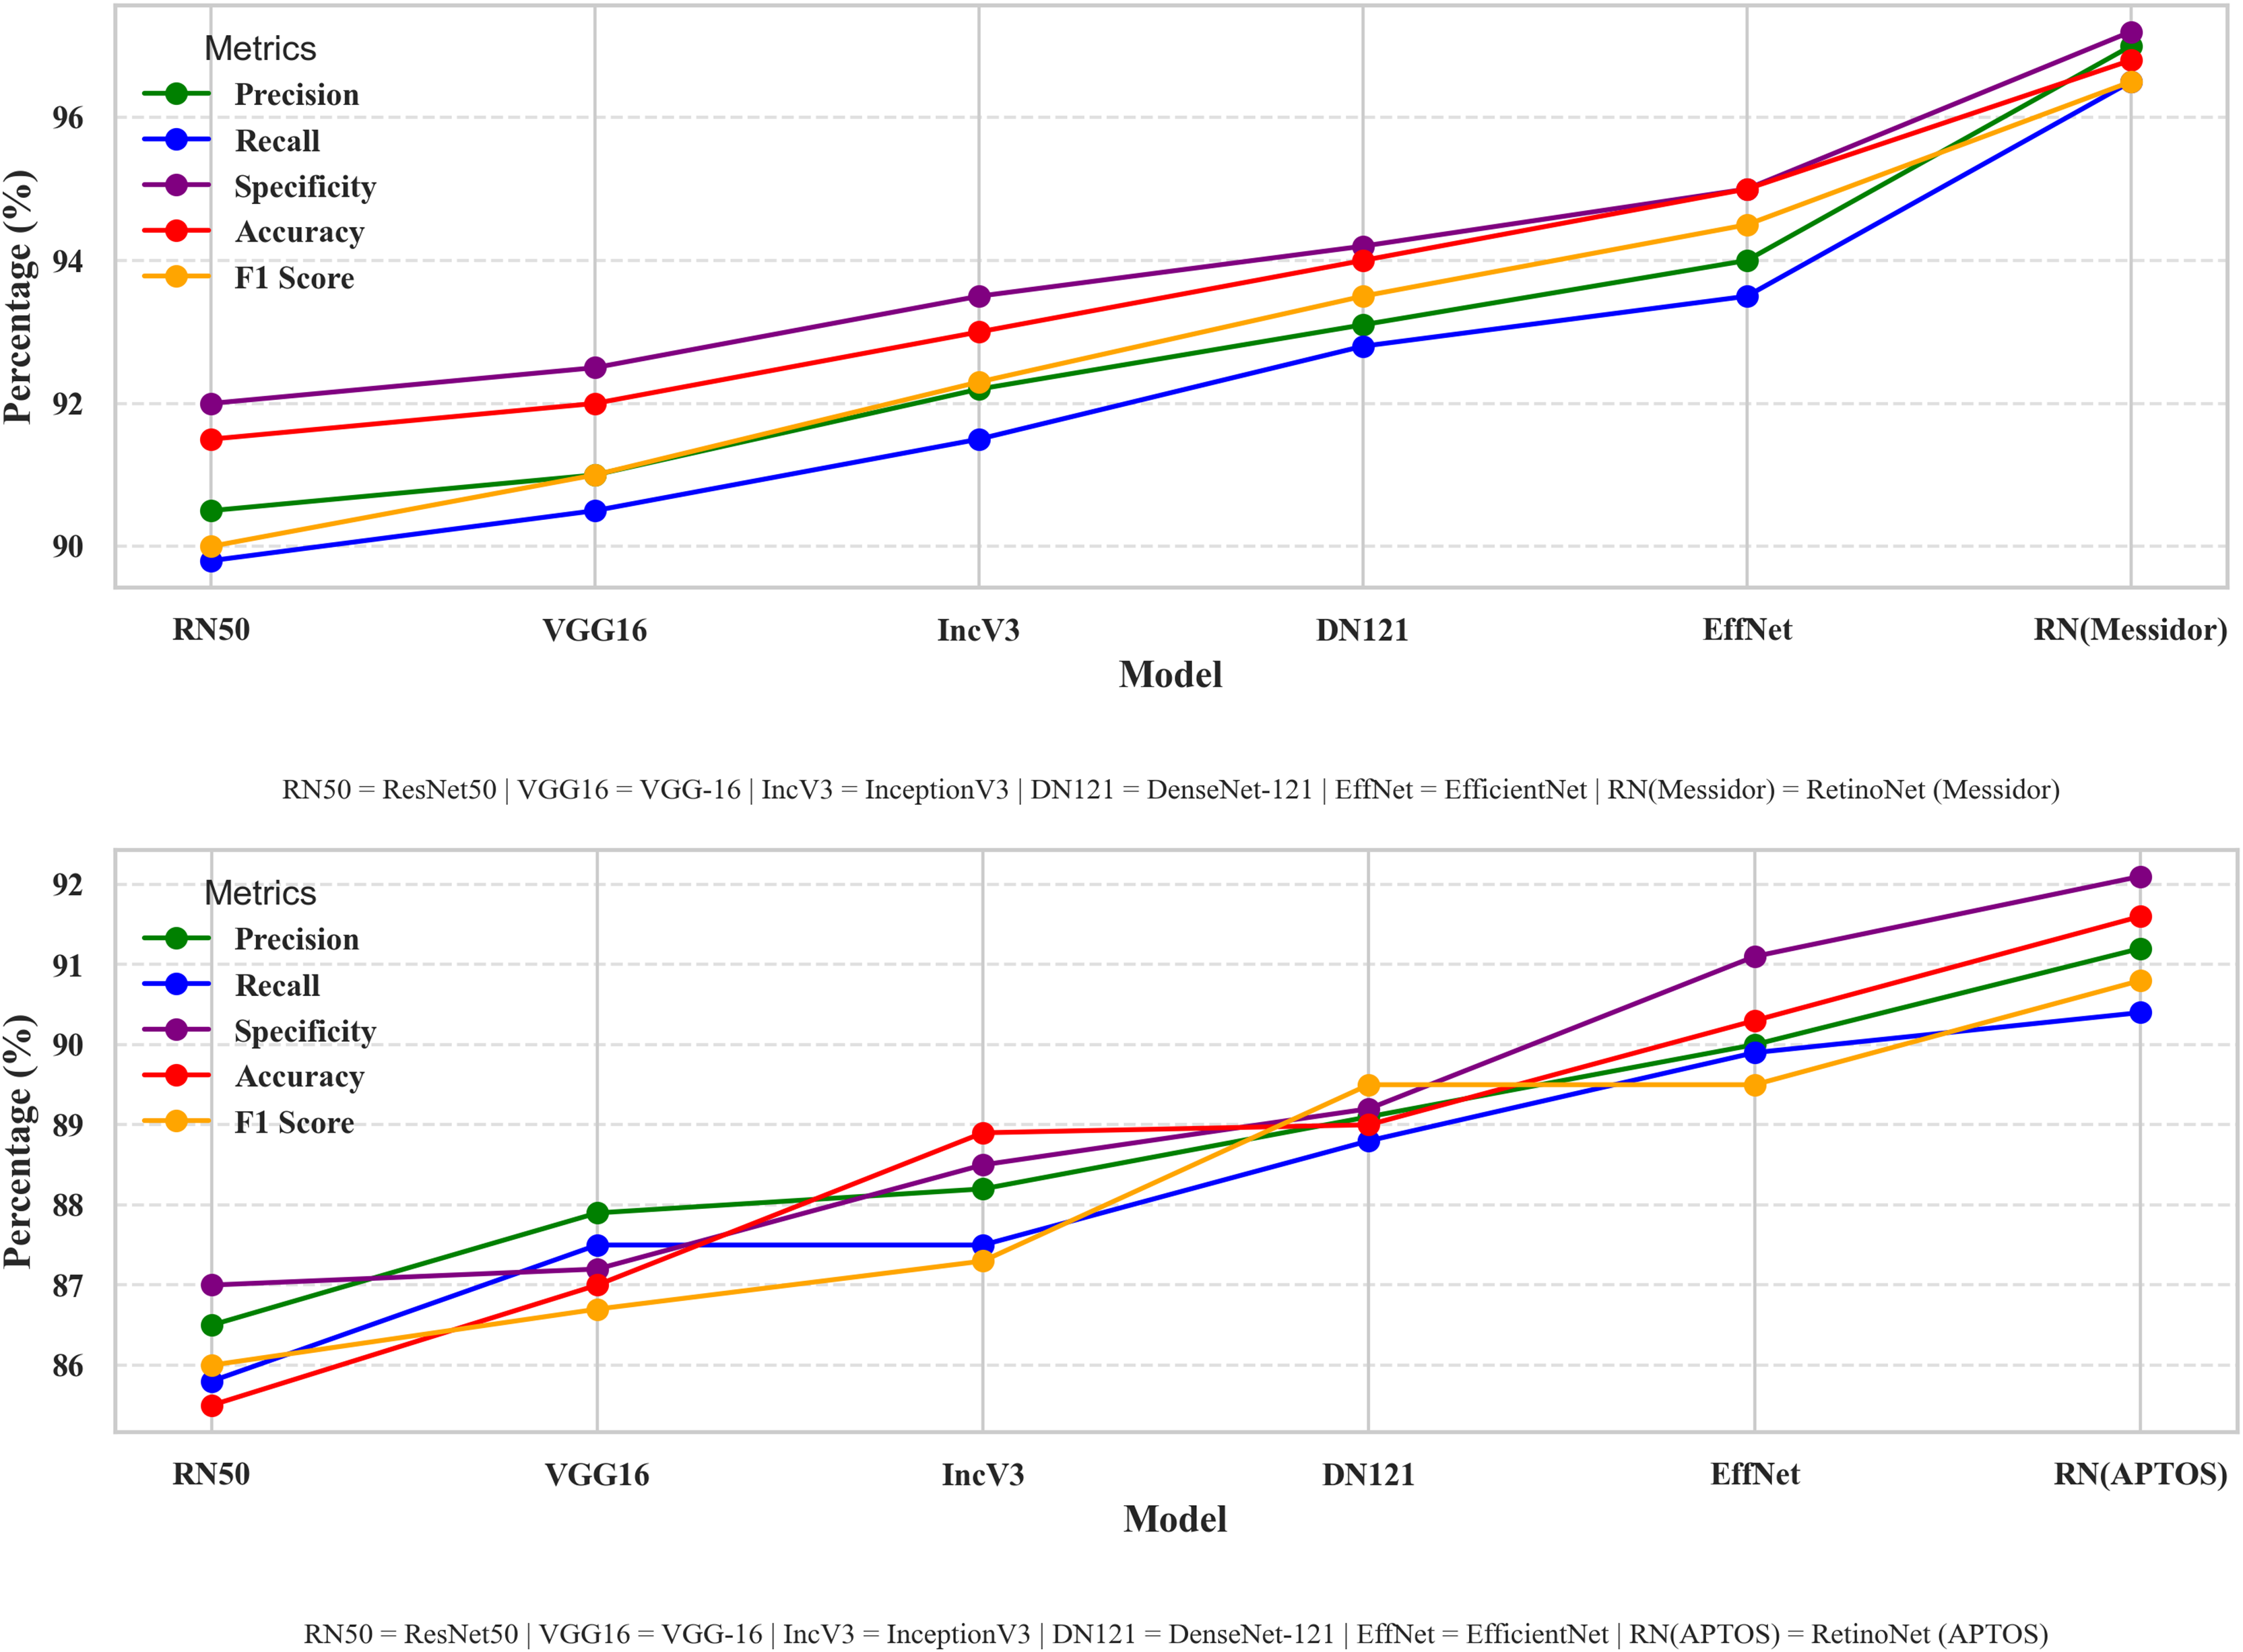
Table 4 presents the breakdown of important metrics like precision, recall, specificity, accuracy, and F1-score, allowing for a more detailed numerical analysis. By using both visual and numerical data, this approach enhances clarity and also helps make more informed decisions. Therefore, it enables researchers to identify the advantages and disadvantages of each model, thereby enhancing real-world DR diagnosis and ensuring consistent performance under diverse conditions.
| Method | Precision (%) | Recall (%) | Specificity (%) | Accuracy (%) | F1-score (%) |
|---|---|---|---|---|---|
| ResNet-50 | 83.5 | 80.2 | 91.5 | 89 | 81.8 |
| VGG-16 | 81.2 | 78.9 | 90.8 | 87.5 | 80.1 |
| Inception-V3 | 85.1 | 82.3 | 92.1 | 90.2 | 83.6 |
| DenseNet-121 | 84.3 | 81.2 | 91.8 | 89.4 | 82.6 |
| EfficientNet | 86.1 | 84.5 | 93.2 | 91.1 | 85.2 |
| RetinoNet (Messidor) | 95.5 | 94.8 | 96.3 | 96.8 | 95.1 |
| RetinoNet (APTOS) | 91.2 | 90.4 | 92.1 | 91.6 | 90.8 |
Note:
Breakdown of important metrics like precision, recall, specificity, accuracy, and F1-score, allowing for a more detailed numerical analysis.
In healthcare, obtaining a correct diagnosis is crucial. Comparing various models enhances comprehension of their own strengths and weaknesses. Prioritizing a model with elevated sensitivity helps diminish false negatives, which is especially vital in the early identification of DR. Therefore, by analyzing model outcomes comparatively, discernible patterns emerge that facilitate algorithm modification and highlight areas needing enhancement (Kaur & Mittal, 2018; Randive, Senapati & Rahulkar, 2019). This procedure facilitates the identification of optimal models grounded in empirical evidence. These efforts not only promote automated DR detection but also enable the conversion of research into applicable clinical instruments, ultimately improving patient care. By collaborating, researchers, physicians, and developers can produce advanced diagnostic tools that meet the needs of practical healthcare situations (Pandey & Sharma, 2018; Gadekallu et al., 2023).
Table 5 helps in understanding the proposed model in comparison with SOTA features such as model technology, optimization type, and comparison insight which indicates the manner in which RetinoNet is wise than other models. The comparison proves that the model RetinoNet, with the introduction of a chain of pre-processing, EfficentNetBo with FPN along with adaptive pipeline, attains promising results with 96.8% accuracy on Messidor and 91.6% accuracy in validation dataset i.e., APTOS, which ensures enhancing both speed and accuracy. There are other models that deal with optimizing in areas like feature selection, segmentation, or hybrid architectures in which our model focuses on optimization techniques chosen to enhance the speed and accuracy (Hu et al., 2025; Wang et al., 2025; Dao, Trinh & Nguyen, 2023). This systematic comparison demonstrated the effectiveness of RetinoNet for DR detection.
| Refs. | Model details | Dataset and size | Optimization | Metrics | Key insights |
|---|---|---|---|---|---|
| Tahir et al. (2024) | ResNet34 + Lightweight FPN + CBAM | IDRiD (516), E-ophtha (381) |
FPN combined with attention mechanisms | Acc = 78.2%; Sens = 76.4%; Spec = 68.1%; Prec = 72.8%; F1 = 73.6%; AUC = 78.0% |
Poor testing result need advance technology to address overfitting |
| Praneeth, Kumar & Nagaraju (2024) | FPN + EfficientNet-B0 Encoder | DiaRetDB1-V2.1 (89: 84 mild DR, 5 normal) | Efficient backbone with multi-scale fusion | Pixel Acc = 99.8%; mIoU = 81.52% | Segmentation needs classification validation |
| Xu et al. (2023) | EFPN + Faster R-CNN | PenD (6,012 X-rays), BraTs (259 MRIs) | Multi-scale detection | mAP ↑ 1.5–2.7; mR ↑ 3–4 | Feature-rich but need enhancement result on classification |
| Deng et al. (2023) | Improved Faster-RCNN (ResNet50 backbone) | Fundus dataset | Backbone improvements for stronger feature extraction | mAP = 97.42%; Precision = 98.96% | High precision but limited to object detection and further classification |
| Modi & Kumar (2023) | BA-DeepForest (10-fold CV) | Fundus (3,200), Messidor (1,748) | Ensemble optimization with adaptive learning | Acc = 92.9%; Prec = 91.9%; Sens = 90.6%; F1 = 89.9%; Spec = 91.7%; |
Strong feature selection but lacks advanced feature extraction |
| Kalyani et al. (2023) | Capsule Networks | Messidor (1,200) | Dynamic routing for spatial feature optimization | Acc = 94.9%; Pre = 93.4%; Sens = 93.9%; F1 = 92.9%; Spec = 93.4%; |
Struggles with small features compared to RetinoNet |
| Zhang, Chen & Lei (2023) | Multi-Point Attention Semi-Supervised | APTOS2019 (3,662), Messidor (1,200), EyePACS (35,126) | Semi-supervised learning | Acc = 90.3%; Prec = 82.8%; Sens = 89.9%; F1 = 88.9%; Spec = 89.4; AUC = 0.916 |
Reduced labels, added compute |
| Özbay (2023) | Artificial Bee Colony + ADL-CNN | EyePACS (35,122) | Metaheuristic feature selection | Acc = 93.6%; Pre = 91.6%; Sens = 93%.; F1 = 94.6%; Spec = 93.7% |
Performs well, biased enhancement |
| Ours | EfficientNet-B0 + FPN + Adaptive pipeline | Messidor (461), APTOS2019 (2,400) | Multiscale feature with speed and accuracy | Messidor: Acc = 96.8%; Prec = 95.5%; Sens = 94.8%; F1 = 95.1%; Spec = 96.3%; APTOS: Acc = 91.6%; Prec = 91.2%; Sens = 90.4%; F1 = 90.8%; Spec = 92.1% |
Balances speed and accuracy with advanced feature extraction |
Notes:
The proposed model in comparison with SOTA features such as model technology, optimisation type, and comparison insight which indicates the manner in which RetinoNet is wise than other models.
Acc, Accuracy; Prec, Precision; Sens, Sensitivity (Recall); Spec, Specificity; F1, F1-score; AUC, Area Under Curve; mIoU, Mean Intersection over Union; mAP, Mean Average Precision; mR, Mean Recall.
Figure 9 presents a bar chart comparing various metrics used in literature survey with the proposed models, i.e., RetinoNet model, for DR detection. This level of performance suggests that the proposed model could be a valuable tool in the field of automated DR detection, potentially contributing to improved screening and diagnosis processes in clinical settings.

Figure 9: Comparison of metrics of SOTA DR detection models.
Bar chart comparing various metrics used in literature survey with the proposed models.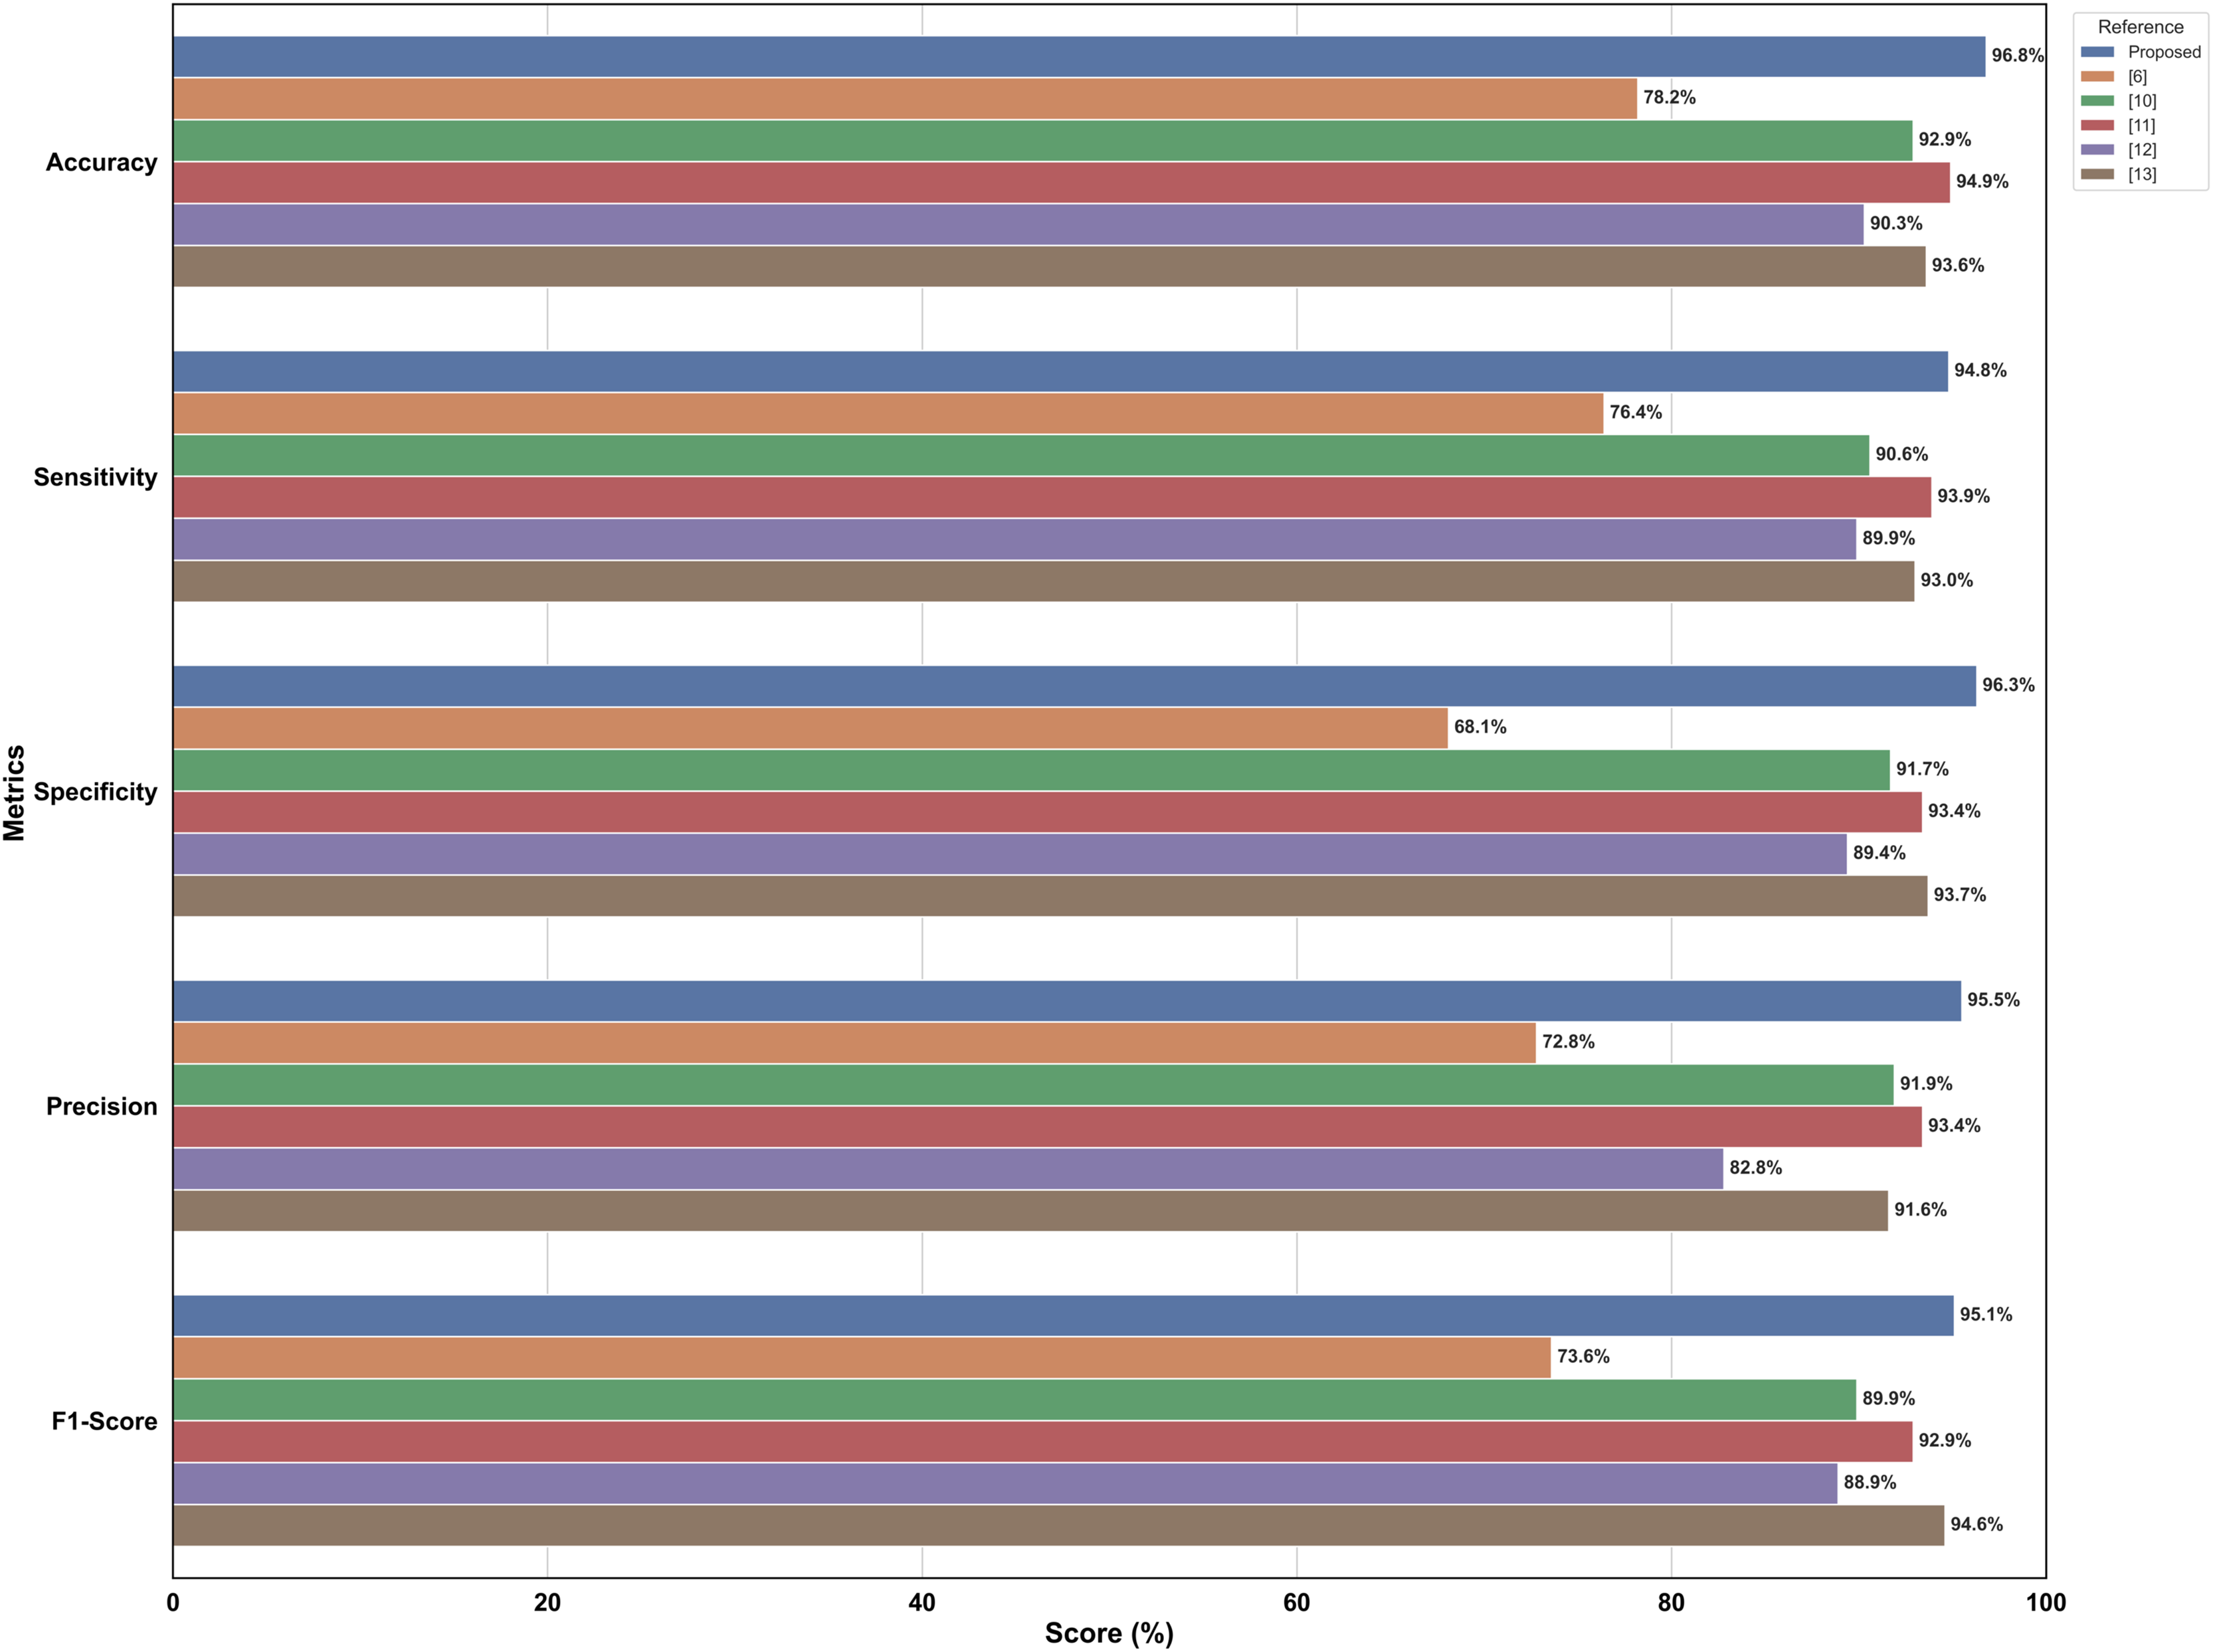
Experimental results
Confusion matrix
This study provides an analysis of performance assessment using a new model, called RetinoNet, for DR classification. These results are visualized in a confusion matrix (Fig. 10), which helps understand the effectiveness of the new model on both Messidor and APTOS datasets. By using the imbalanced APTOS dataset of around 2,400 samples, the study concludes that the proposed model performs well in varied generalization environments and can be useful for screening individuals with or at high risk of developing DR, particularly in its more severe forms (Mateen et al., 2020).
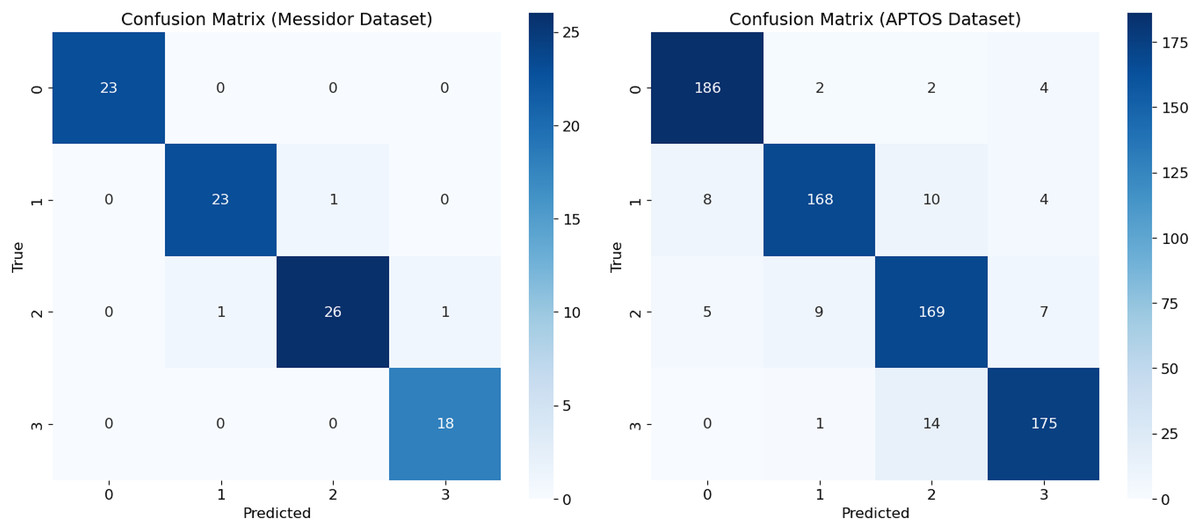
Figure 10: Confusion matrix of proposed model—RetinoNet.
Confusion matrix showing class-wise prediction of RetinoNet model for both the Messidor and APTOS datasets.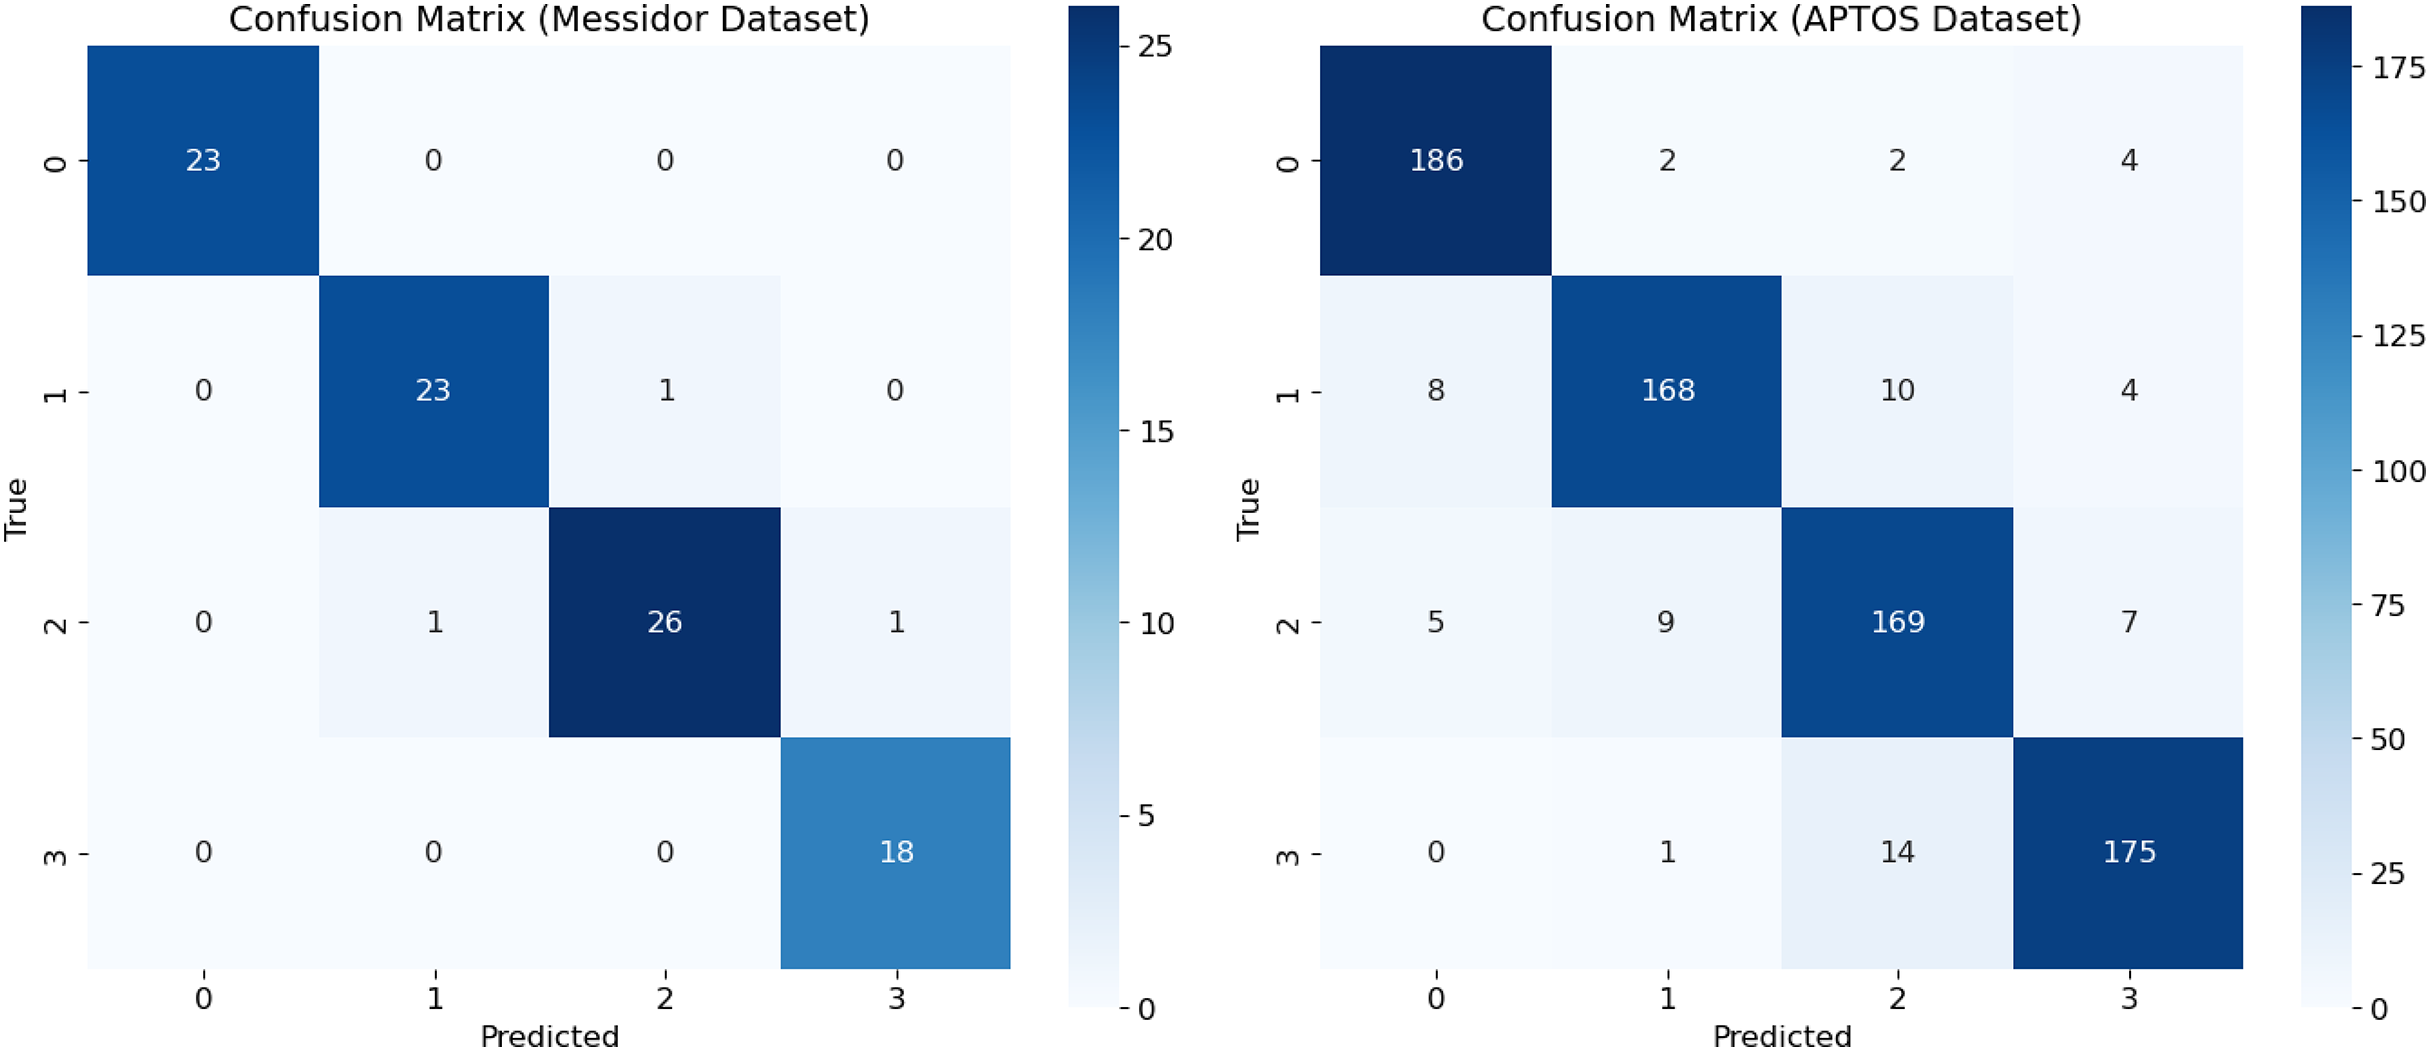
Receiver operating characteristic for different classes of DR in Messidor dataset
The receiver operating characteristic (ROC) curve is a significant curve that is used as a key evaluation metrics for performance in DR detection models, graphically shows a trade-off between sensitivity (True Positive Rate) and False Positive Rate at various classification thresholds (Tsiknakis et al., 2021; Wang et al., 2022). In DR, the ROC curves compare the model performance in discriminating No DR, Mild and Moderate, and severe levels AUC shows the capacity of a model to correctly classify DR at each stage; a larger value indicates better discrimination. The ROC curves of new model have been presented in Fig. 11 for both the Messidor and APTOS datasets. On Messidor dataset, the model obtained nearly perfect performance of area under the curve (AUCs) at 1.00 for most classes and 0.99 for Class 2, implicity indicate it work well on balanced and limited dataset. In order to find the generalization capacity of the model on unbalanced larger dataset, the study used APTOS. The receiver operating characteristic (ROC) performs with high classification accuracy with AUCs between 0.95 and 0.99 across the classes, ensuring that the model generalises well on a larger and diverse datatset. ROCs are popular metrics for evaluating the behavior of model computation with respect to different thresholds, in addition to its specific sensitivity and specificity values throughout all stages of DR, providing an overall robustness measure that enables clinicians to estimate local or regional population predictive reliability (Derwin et al., 2020). An AUC value greater than 0.8 indicated that the predictive model had substantial discriminative capacity and enabled proper clinical diagnosis. Based on the AUC differences, there could still be potential to enhance the classifier performance for particular DR stages, and future studies should elaborate adaptive models per stage level of severity and facilitate the screening and treatment of DR severity and facilitate the screening and treatment of DR.

Figure 11: Receiver operating characteristic (ROC) of proposed model—RetinoNet.
ROC curve depicting the true positive rate vs. false positive rate. Highlights model sensitivity and specificity of both the dataset.
Training and validation
The curve in Fig. 12 shows the training and validation accuracy on Messidor and the best validation performance of APTOS datasets. It provides useful information about how RetinoNet behaves in detecting DR at the moderate vs. severe stages. The training accuracy, at first, climbed rapidly within the initial 10–15 epochs and subsequently plateaued at a high value signaling that good features were learned from the dataset. Therefore, in the analysis below, it is clear from the plot that over 20 epochs, the validation accuracy continued to improve and started to converge with the training accuracy, which proves the better generalization of the model on unseen data. This is important for analyzing the learning behavior of the model, overfitting/underfitting behavior, and expected results from both the training and validation datasets (Dosovitskiy et al., 2020). The very close observation performed between the close training and validation curves confirms that RetinoNet does not face any type of overfitting, which certainly complies with its relevant strength in preserving reliable performance throughout the required training steps. These results verify the effectiveness of the proposed hybrid model.
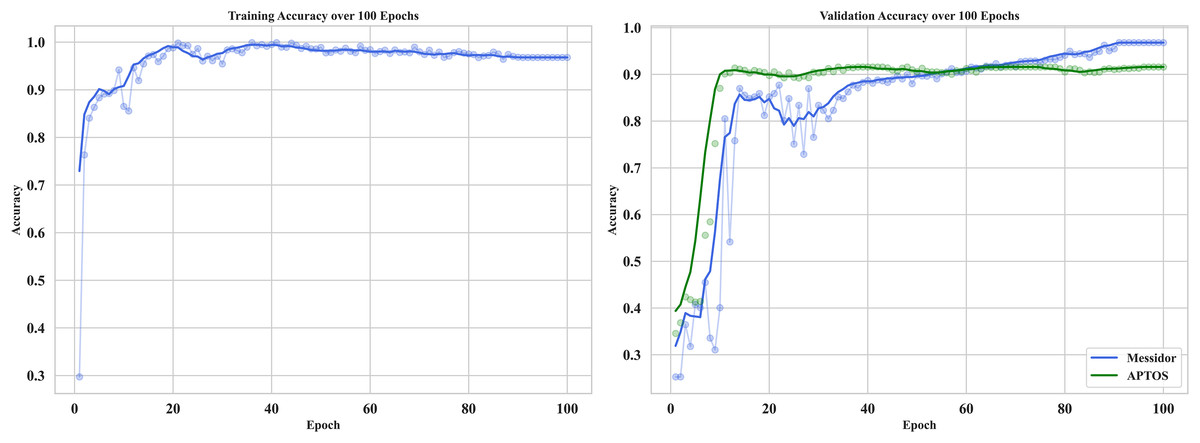
Figure 12: Training and validation of proposed model—RetinoNet.
The plots of training and validation accuracy for 100 epochs provide useful information about how RetinoNet behaves in detecting DR at the moderate vs. severe stages.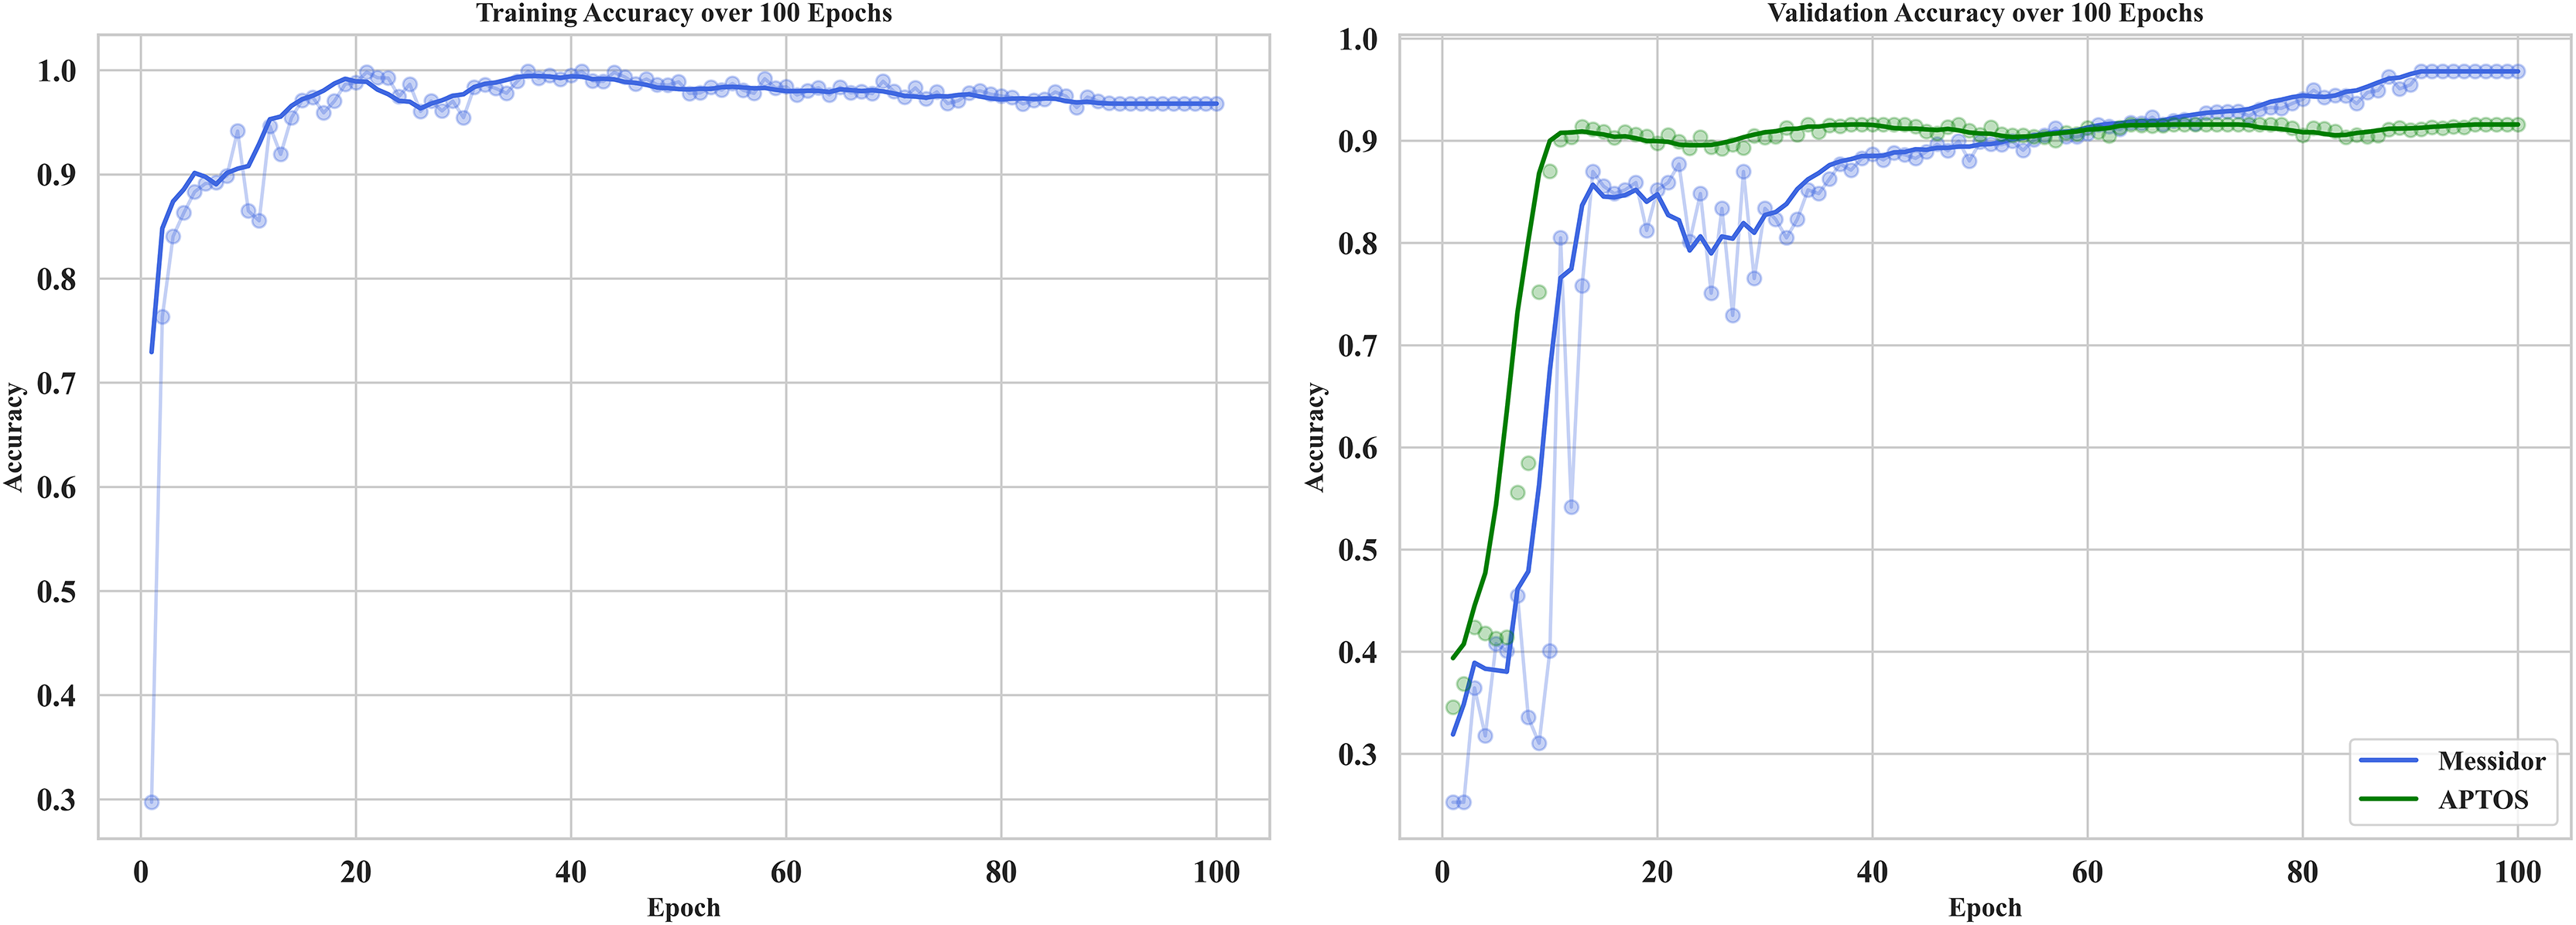
Optimization impact on computational efficiency
Table 6 provides computational efficiency between models with and without optimization methods. Incorporating FPN filters, Adam optimizer (learning rate: 0.001), categorical cross-entropy loss, and an adaptive pipeline (prefetch, cache, shuffle), the optimal model dramatically lowers computational time per epoch. While dropout (0.5, 0.3) avoids overfitting, batch normalizing helps to stabilize training. The results show a reduction in training time, reflecting a 30% reduction in training time over 100 epochs, which further raises confidence in the scalability and reliability of the technique. With various GPU the time difference may vary. The Efficiency Gain (EF) is calculated based on the below formula.
(20) where the values of the and is the average training time per epoch from base and adaptive pipeline respectively.
| Dataset | Samples | Config. | Avg. train time/epoch (s) | Total time (100 epochs, s) | Time saved/epoch (s) | Efficiency gain (%) | Throughput (images/s) |
|---|---|---|---|---|---|---|---|
| Messidor | 461 | Baseline | 13 | 1,300 | – | – | 35.5 |
| Adaptive pipeline | 9.1 | 910 | 3.9 | 30% | 50.7 |
Note:
The ablation study of RetinoNet.
Ablation study on Retinonet
An ablation study was conducted on the RetinoNet model to analyse the impact of each component to the overall performance (Bhulakshmi & Rajput, 2024; Bilal et al., 2024). The evaluation of four configurations, presented in Table 7, highlights the significance and role of each component in the model.
| Experiment | Accuracy (%) | Precision (%) | Recall (%) | F1-score (%) | Specificity (%) | |||||
|---|---|---|---|---|---|---|---|---|---|---|
| Messidor | APTOS | Messidor | APTOS | Messidor | APTOS | Messidor | APTOS | Messidor | APTOS | |
| Full RetinoNet model | 96.8 | 91.6 | 95.5 | 91.2 | 94.8 | 90.4 | 95.1 | 90.8 | 96.3 | 92.1 |
| Without Feature Pyramid Network (FPN) | 91.1 | 87.8 | 86.1 | 84.9 | 86.5 | 82.6 | 85.2 | 85.3 | 93.2 | 85.1 |
| Without Global Average Pooling (GAP) | 90.4 | 85.5 | 87.5 | 83.3 | 85.1 | 81.1 | 84.1 | 83.2 | 92.4 | 84.2 |
| Without enhancement pipeline | 89.4 | 84.6 | 84.3 | 82.5 | 83.2 | 84.3 | 82.6 | 81.1 | 91.8 | 83.2 |
| Without data augmentation | 88.6 | 83.7 | 83.2 | 81.2 | 82.2 | 83.2 | 82.4 | 82.4 | 90.7 | 82.7 |
Note:
The measurement differentiates RetinoNet’s training efficiency, where the baseline indicates standard training without optimization, whereas the adaptive pipeline applies optimizations that increase computational quality.
Conclusion
The study concludes with a model that uses a multi-technique framework, such as EfficientNet-B0 and an FPN, to combine low-resolution and high-resolution features. This makes it easier to find and classify DR. This framework integrates advanced image processing tools, such as adaptive histogram equalisation, nonlocal mean denoising, and simulated super-resolution, to address issues such as poor image quality, small datasets, and overfitting. FPN has an object detection method that aims to extract features effectively at many different scales, as various retinal abnormalities present different stages of DR at different scales. When compared to well-known models like ResNet-50, VGG-16, Inception V3, DenseNet-121, and EfficientNet, RetinoNet did pretty well, with a 96.8% success rate and a 94.8% recall rate. This demonstrates its potential for DR detection. Other metrics, including sensitivity, accuracy, PSNR, SSIM, MSE, and ANOVA, showed that RetinoNet not only performed uniformly across all levels of DR severity but also addressed all the identified gaps in this study, including the limited annotated dataset, generalization issues, and bias in enhancement. RetinoNet enables automatic detection and classification, which can help improve patient outcomes and strengthen health systems. It can act as a strong bridge between research and practical implementation and further open new pathways in the development of investigative diagnostic tools for artificial intelligence (AI)-enabled diagnostics in medicine. Future studies on RetinoNet include real-time health record integration, thorough patient management, extension to other retinal diseases, and interpretability with visualisation methods. Such optimisation of RetinoNet will further tune it for diverse clinical environments and will include the latest deep-learning innovations that will enhance its adaptability and resilience in healthcare applications. The identified limitation of this study is that the result of the image enhancement wholly depends on the quality of the input image and may behave differently for other datasets.