
From words to returns: sentiment analysis of Japanese 10-K reports using advanced large language models
- Published
- Accepted
- Received
- Academic Editor
- Giovanni Angiulli
- Subject Areas
- Artificial Intelligence, Natural Language and Speech, Text Mining, Sentiment Analysis, Neural Networks
- Keywords
- Sentiment analysis, 10-K report analysis, Predictive information extraction, AI based portfolio selection, Efficient market hypothesis, Return predictability, Japanese market, Natural language processing, Stock market, Long short portfolio
- Copyright
- © 2025 Okada et al.
- Licence
- This is an open access article distributed under the terms of the Creative Commons Attribution License, which permits unrestricted use, distribution, reproduction and adaptation in any medium and for any purpose provided that it is properly attributed. For attribution, the original author(s), title, publication source (PeerJ Computer Science) and either DOI or URL of the article must be cited.
- Cite this article
- 2025. From words to returns: sentiment analysis of Japanese 10-K reports using advanced large language models. PeerJ Computer Science 11:e3349 https://doi.org/10.7717/peerj-cs.3349
Abstract
The advent of advanced natural language processing techniques and large language models (LLMs) has revolutionized the analysis of qualitative financial data. This research harnesses the capabilities of LLMs—specifically ChatGPT, Claude, and Gemini—to extract sentiment from Japanese 10-K reports, aiming to predict future stock returns. By analyzing an extensive dataset encompassing all companies listed on the Tokyo Stock Exchange from 2014 to 2023—a total of 11,135 firm-years and over 70 million words—we conduct the first comprehensive study of its kind in Japan. Comparative analyses are performed using traditional dictionary-based methods and a DeBERTaV2-based model to evaluate efficacy in information extraction. Our findings reveal substantial differences in the models’ abilities to predict stock performance. Notably, while dictionary-based methods show no significant relationship between sentiment and subsequent stock returns, LLM-derived sentiments exhibit a significant negative correlation with future returns. These results challenge the efficient market hypothesis by demonstrating that sentiment extracted from publicly available reports can predict stock performance. This study reveals the transformative potential of advanced Natural Language Processing (NLP) technologies in financial analysis, highlighting how sophisticated language models can uncover predictive signals previously undetected by traditional methods. The article details the methodologies employed, the challenges encountered, and the implications for integrating advanced sentiment analysis into financial forecasting.
Introduction
The rapid evolution of artificial intelligence (AI) and natural language processing (NLP) is significantly transforming various industries, with the financial sector experiencing profound impacts. In finance, the ability to analyze vast amounts of textual data opens new avenues for understanding market dynamics and investor behavior. Annual financial reports, particularly the 10-K filings, are rich sources of qualitative information that can influence investor perceptions and, consequently, stock market performance. Despite the recognized importance of these reports, extracting meaningful insights from them remains a complex challenge due to the nuanced and sophisticated language used in corporate communications.
Traditional approaches to textual analysis in finance predominantly rely on dictionary-based methods and conventional machine learning models. While these techniques provide valuable insights, they often fall short in capturing the intricate linguistic patterns and contextual subtleties inherent in financial texts. This limitation is especially pronounced in non-English contexts, such as Japanese 10-K reports, where language structure and cultural nuances add layers of complexity to textual interpretation.
The advent of large language models (LLMs) such as ChatGPT, Claude, and Gemini presents an unprecedented opportunity to enhance the analysis of financial texts. These models, powered by deep learning and trained on extensive datasets, exhibit remarkable proficiency in understanding and generating human-like language. However, their application to large-scale financial textual data, especially in the Japanese market, remains underexplored. Recognizing this gap, we aim to conduct a comprehensive analysis of Japanese 10-K reports using advanced LLMs alongside traditional methods.
To achieve this, we analyze the complete set of 10-K reports from all companies listed on the Tokyo Stock Exchange over a 10-year period from 2014 to 2023. This extensive dataset comprises 11,135 firm-years and encompasses over 70 million words, making it, to our knowledge, the first study to undertake such a large-scale textual analysis of Japanese financial reports. By employing a comprehensive suite of state-of-the-art LLMs—specifically ChatGPT, Claude, and Gemini, which represent the leading models from OpenAI, Anthropic, and Google, respectively—we extract sentiment from the textual data. We then compare their performance with dictionary-based analysis and a DeBERTaV2-based model to assess the information extraction capabilities and predictive performance of advanced LLMs relative to traditional methods.
Our investigation reveals that while dictionary-based methods do not exhibit a significant relationship, the sentiment derived from LLMs shows a significant negative correlation with future stock returns. This finding suggests that stocks with high sentiment scores, as identified by LLMs, tend to be overpriced at time t, leading to negative abnormal returns in the subsequent period t + 1. Such overpricing may result from overly optimistic interpretations of corporate disclosures, which the market corrects over time. This challenges the efficient market hypothesis (EMH), which posits that all publicly available information is already reflected in stock prices. The ability of LLM-extracted sentiment to predict future returns implies that markets may not fully incorporate qualitative information from corporate disclosures promptly. Moreover, our research highlights the impact of advanced NLP technologies on financial analysis, demonstrating that sophisticated models can extract valuable insights from large textual datasets that traditional methods may overlook.
Prior studies in finance increasingly recognize the potential of textual analysis to enhance the understanding of market behavior, with research gradually expanding beyond traditional data sources like financial news and regulatory filings. Chen, Kelly & Xiu (2024) highlighted that early methodologies often rely on simplistic text representations, such as dictionary-based sentiment scores or “bag of words” (BoW), which fail to capture contextual relationships and nuanced language features. They argue that such limitations, coupled with high dimensionality and inefficiencies in statistical modeling, constrain the utility of textual data in predicting financial outcomes. The advent of large language models (LLMs) marks a significant advancement in this field, offering refined, high-capacity text representations trained on extensive and diverse corpora. Chen, Kelly & Xiu (2024) demonstrate that LLMs, such as Bidirectional Encoder Representations from Transformers (BERT) and Robustly Optimized BERT Pretraining Approach (RoBERTa), outperform traditional methods in predictive tasks, including return and volatility forecasting, and exhibit superior adaptability across languages and markets.
Building on these advancements, our study focuses on official corporate disclosures by analyzing a comprehensive dataset of Japanese 10-K reports. This approach minimizes noise and enhances the relevance of extracted information, offering new insights into the predictive power of textual sentiment in a non-English context. By leveraging state-of-the-art LLMs, we uncover a significant negative relationship between LLM-derived sentiment and future stock returns, suggesting that high sentiment scores may indicate overvaluation, followed by subsequent market corrections. These findings challenge the efficient market hypothesis, implying that markets may not fully incorporate qualitative information from corporate disclosures promptly. Moreover, our research highlights the transformative potential of advanced NLP technologies in extracting previously inaccessible insights from large-scale textual data, paving the way for more sophisticated applications of textual analysis in finance.
Our study makes several key contributions to the literature on financial textual analysis and market efficiency. First, to the best of our knowledge, this is the first large-scale study to apply and systematically compare a suite of state-of-the-art large language models—including GPT-4, Claude, and Gemini—to the narrative disclosures of Japanese 10-K reports. This provides crucial evidence on the capabilities of LLMs in a major non-English financial market. Second, our primary empirical finding is novel: while traditional methods show no predictive power, sentiment extracted by advanced LLMs exhibits a significant negative correlation with future stock returns. Third, this result presents a direct challenge to the efficient market hypothesis, implying that markets do not fully and efficiently incorporate the nuanced, qualitative information embedded in corporate disclosures, and that advanced NLP techniques can uncover these inefficiencies.
The remainder of this article is structured as follows. In the “Literature Review,” we discuss the evolution of sentiment analysis in finance, emphasizing the limitations of traditional methods and the opportunities presented by LLMs. “Data Collection” details our dataset and the methodologies employed for sentiment extraction and analysis. In “Results,” we present empirical findings, compare the performance of different models, and interpret the implications of the observed relationships. Finally, in the “Conclusion,” we explore the broader impact of our findings on financial theory and market behavior, while suggesting avenues for future research.
Literature review
Textual analysis has emerged as a pivotal tool in financial research, enabling the quantification of qualitative information from corporate disclosures, news articles, and other textual data sources. Tetlock (2007) highlighted the impact of media sentiment on stock market behavior, demonstrating that high levels of pessimistic language in news columns are associated with subsequent declines in market prices. This foundational research sheds light on the influence of investor sentiment, as shaped by media narratives, on financial markets. However, the application of general-purpose sentiment dictionaries in financial contexts has encountered significant challenges. Loughran & McDonald (2011) addressed these limitations by developing a finance-specific sentiment dictionary tailored to the unique language of financial documents, such as 10-K filings. Their innovation significantly improves the precision of sentiment analysis in financial texts and lays the groundwork for more robust correlations between textual sentiment and market performance. Building on this foundation, Jegadeesh & Wu (2013) introduced a return-based term weighting scheme that quantifies the tone of financial documents, such as 10-K filings and IPO prospectuses, demonstrating a significant relationship between tone and market reactions.
Despite these advancements, dictionary-based methods often fail to capture the nuanced and context-dependent nature of financial language. Li (2010) noted that corporate disclosures are crafted with sophisticated language and strategic ambiguity, which can obscure managerial intent and pose challenges for traditional textual analysis techniques. The advent of machine learning and deep learning methods introduces more sophisticated approaches to textual analysis. Kogan et al. (2009) utilized statistical models to predict firm risk by analyzing the textual content of financial reports, moving beyond simple word counts to incorporate linguistic patterns. However, these methods are limited by their reliance on BoW representations, which fail to account for the sequential and contextual nature of language.
Transformer-based models, such as BERT, mark a significant breakthrough in NLP by enabling the capture of contextual relationships (Devlin et al., 2019). The emergence of LLMs, such as GPT-3 and its derivatives, further revolutionizes the field by providing unprecedented capabilities in understanding and generating human-like text (Brown et al., 2020). Initial studies, such as Chen, Kelly & Xiu (2024), emphasized the transformative potential of LLMs for financial research. Chen, Kelly & Xiu (2024) showed that LLMs, such as BERT, RoBERTa, and Large Language Model Meta AI (LLaMA), significantly outperform traditional methods in predicting stock returns, volatility, and macroeconomic conditions. This new line of research is rapidly exploring the boundaries of what LLMs can analyze. For example, as highlighted in a recent survey by Nie et al. (2024), studies have shown that an LLM can analyze purely numerical financial statements—without any accompanying text—to predict future earnings changes, outperforming human analysts. Similarly, Kirtac & Germano (2024) evaluated the performance of advanced LLMs, including GPT-3-based OPT, BERT, and FinBERT, alongside traditional methods like the Loughran-McDonald dictionary. Their analysis of 965,375 U.S. financial news articles from 2010 to 2023 revealed that OPT significantly outperforms other models, achieving a stock market return prediction accuracy of 74.4%. A long-short investment strategy based on OPT delivers an exceptional Sharpe ratio of 3.05, generating a remarkable 355% gain from August 2021 to July 2023 after accounting for transaction costs. These findings underscore the transformative potential of LLMs in financial market prediction and portfolio management, emphasizing the need for sophisticated language models to effectively analyze sentiment and develop actionable investment strategies.
While these studies primarily focus on English-language financial texts, there is a pressing need to explore advanced NLP techniques in non-English contexts, such as the Japanese financial market. The unique linguistic features and cultural nuances of the Japanese language add layers of complexity to textual analysis, highlighting the limitations of traditional methods and the need for advanced models to effectively analyze non-English financial texts.
Our study builds upon this body of research by applying advanced LLMs to a comprehensive dataset of Japanese 10-K reports, aiming to bridge the gap in the literature regarding non-English financial textual analysis. By comparing the effectiveness of LLMs with traditional dictionary-based methods and transformer models like DeBERTaV2, we assess their capability to capture sentiment that correlates with future stock performance.
Materials and Methods
This section details the data and methodologies employed for our analysis. Figure 1 provides a comprehensive flowchart of our research design, outlining the process from data extraction and sentiment analysis to portfolio construction and the final asset pricing tests. The following subsections describe each stage in detail.
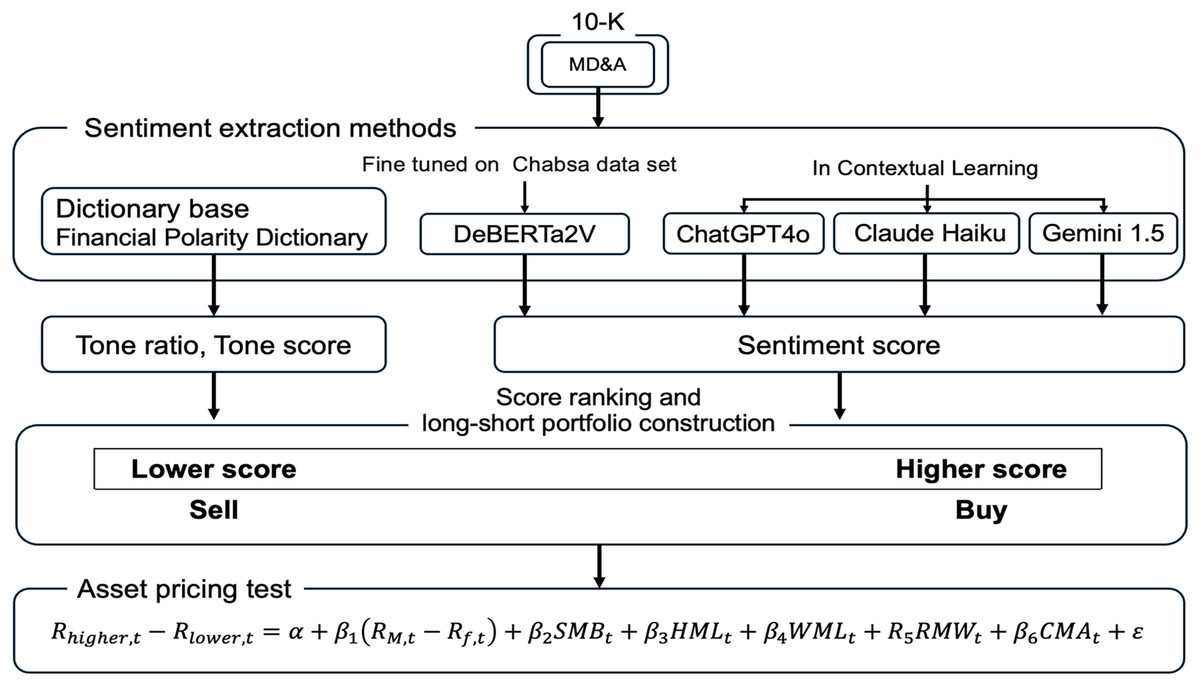
Figure 1: Overview of the research methodology.
The complete research process. The process begins with extracting the Management Discussion and Analysis (MD&A) section from 10-K reports. Five distinct methods are then used to extract sentiment scores. Following the intuitive ex-ante hypothesis that positive sentiment should predict positive returns, we constructed long-short portfolios by buying stocks with higher sentiment scores and selling stocks with lower sentiment scores. Finally, the returns of these portfolios are evaluated using asset pricing models, a test which ultimately revealed the significant contrarian nature of the Large Language Model (LLM)-derived sentiment signal.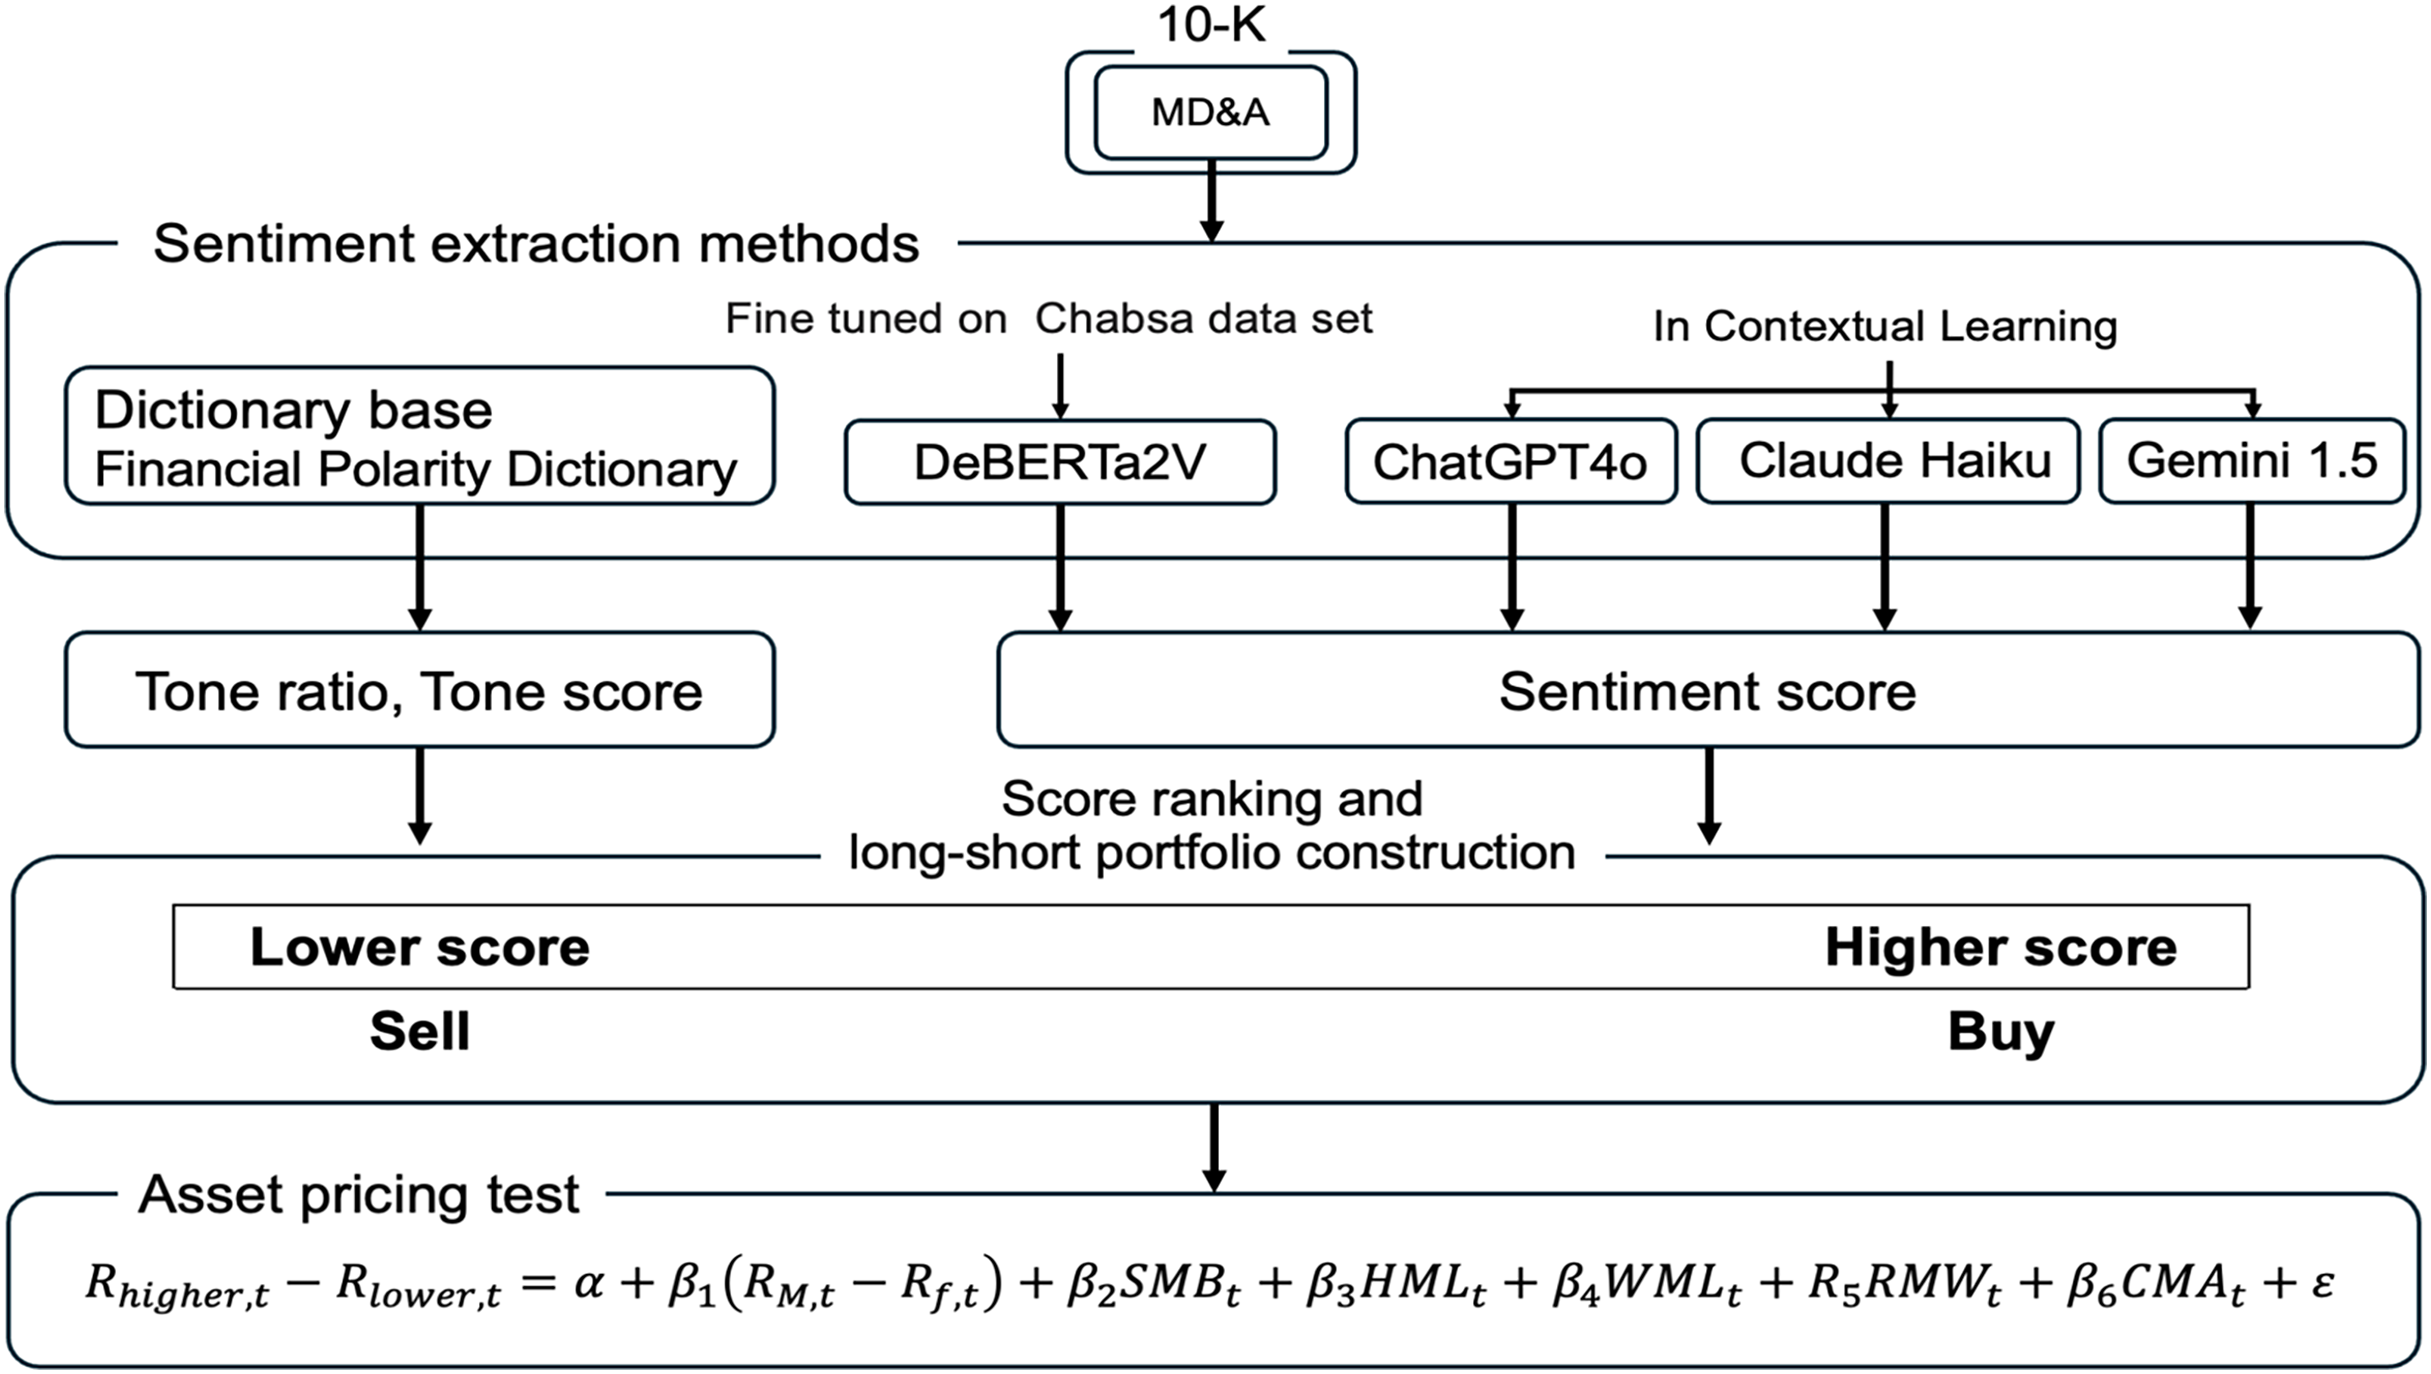
Computing infrastructure
We used Google Colaboratory, a cloud-based platform provided by Google. The computing environment is as follows.
– CPU: Intel Xeon 2.20 GHz.
– GPU: NVIDIA Tesla T4 GPU (RAM 15.0 GB).
– Operating System: Ubuntu 22.04.4 LTS (as provided by Google Colaboratory).
– Python Version: Python 3.11.
– Key Libraries: Detailed information on the libraries used is provided within the notebook.
Additionally, the code and datasets used in this study are publicly available at (https://doi.org/10.5281/zenodo.14892526) and are provided as supplemental files. The details of the hyperparameters are in ‘API Settings for Large Language Models’.
Data collection
To investigate the relationship between management sentiment and future stock returns in the Japanese market, we collected a comprehensive dataset of 10-K reports. The data spans a 10-year period, starting in 2014—the first year comprehensive reports were systematically available from Japan’s Electronic Disclosure for Investors’ NETwork (EDINET)—through 2023. From 2014 to 2022, our sample includes all firms listed on the former Tokyo Stock Exchange (TSE) First Section. Following a major market reform in April 2022, this section was replaced by the new Prime Market. Accordingly, for the 2023 fiscal year, our sample consists of firms listed on the Prime Market, which has stricter listing requirements. This change in the underlying sample universe explains the smaller number of firms in our final year. To ensure consistency in reporting cycles, our analysis focuses exclusively on companies with a fiscal year ending in March.
Data source
The primary source of the 10-K reports is the Electronic Disclosure for Investors’ NETwork (EDINET), an electronic disclosure system operated by Japan’s Financial Services Agency. EDINET provides access to official financial filings submitted by companies listed on Japanese stock exchanges, ensuring the authenticity and completeness of the data collected. We downloaded the annual financial reports for all firms listed on the TSE during the sample period, focusing exclusively on companies whose fiscal year ends in March, which is the case for most listed firms on the TSE (Please visit https://disclosure2.edinet-fsa.go.jp/WEEK0010.aspx for details.). This selection results in a total of 16,363 firm-year observations, encompassing over 90 million words of textual data. The size of this dataset provides a substantial basis for analyzing management sentiment across a broad cross-section of the Japanese market.
Table 1 summarizes the dataset, detailing the number of firms (10-K reports) per year, the total number of stocks analyzed, and the average length of the Management Discussion and Analysis (MD&A) sections in terms of the number of characters. The focus on the MD&A section is critical, as it provides management’s narrative on financial condition, operational results, and cash flow status, equivalent to the MD&A in U.S. filings. This section is particularly rich in qualitative information that can reflect management’s outlook and potentially influence investor perception.
| Number of firms | Average length of MD&A (Number of characters) | Min | 25% | Median | 75% | Max | |
|---|---|---|---|---|---|---|---|
| 2014 | 1,012 | 6,159 | 1,910 | 4,409 | 5,339 | 6,654 | 43,996 |
| 2015 | 1,052 | 6,136 | 2,230 | 4,384 | 5,365 | 6,764 | 43,943 |
| 2016 | 1,069 | 6,095 | 1,956 | 4,414 | 5,412 | 6,821 | 40,281 |
| 2017 | 1,091 | 5,829 | 2,094 | 4,290 | 5,149 | 6,491 | 32,411 |
| 2018 | 1,165 | 6,294 | 2,291 | 4,720 | 5,751 | 7,106 | 29,553 |
| 2019 | 1,190 | 6,510 | 2,233 | 4,896 | 5,960 | 7,289 | 29,542 |
| 2020 | 1,188 | 7,501 | 2,966 | 5,633 | 6,834 | 8,536 | 29,622 |
| 2021 | 1,191 | 7,345 | 2,855 | 5,537 | 6,639 | 8,233 | 29,576 |
| 2022 | 1,176 | 7,278 | 2,663 | 5,506 | 6,630 | 8,251 | 29,614 |
| 2023 | 1,001 | 7,210 | 2,797 | 5,497 | 6,607 | 8,117 | 29,558 |
| Total | 11,135 | 6,636 | 1,910 | 4,899 | 5,052 | 7,575 | 43,996 |
Sentiment extraction methods1
To extract sentiment from the Management Discussion and Analysis (MD&A) sections, we employed five different methodologies: a simple tone calculation using a financial polarity dictionary specifically developed and trained on Japanese financial texts, DeBERTaV2, and three advanced LLMs—GPT-4, Claude, and Gemini. The simple tone calculation involves two distinct metrics: the Tone Ratio, which measures the balance between positive and negative expressions by comparing the frequency of positive words to that of negative words, and the Tone Score, which captures the overall sentiment strength by summing up the individual sentiment scores assigned to each word in the text. By comparing these traditional dictionary-based methods, such as Tone Ratio and Tone Score, with state-of-the-art NLP models, we aim to assess the effectiveness of each approach in accurately capturing management sentiment and understanding its implications for future stock returns.
Simple tone calculation
To calculate the tone, we utilized the Financial Polarity Dictionary developed by the University of Tokyo (Visit https://sites.google.com/socsim.org/izumi-lab/tools/ for more information.). This lexicon is specifically designed for financial text analysis and provides two key pieces of information for each word, which we use to construct two distinct sentiment metrics: a Tone Ratio and a Tone Score. First, the dictionary categorizes each word as positive, negative, or neutral. This classification allows us to measure the balance of sentiment in a document. Following the approach of Li (2010), we compute the Tone Ratio as:
where is the number of positive words and is the number of negative words in the document.
Second, the lexicon assigns a real-numbered score to each word, reflecting its degree of positivity or negativity. Words with strongly positive connotations are assigned higher positive scores, while words with strongly negative connotations receive negative scores. Neutral words are assigned a score of zero. Using these fine-grained scores, we calculate the Tone Score as the cumulative sum of all individual word scores in the Management Discussion and Analysis (MD&A) section:
where is a real number expressing the sentiment score of the -th word and the sum is taken over all words in the document. This provides a different measure of overall sentiment compared to the proportional Tone Ratio, which is normalized by the total count of sentimental words rather than the total document length.
DeBERTaV2 model
For our transformer-based analysis, we employ a fine-tuned DeBERTaV2 model. We selected this architecture due to its documented performance improvements over earlier models, particularly its enhanced disentangled attention mechanism which is effective at capturing the nuances of complex sentences common in financial disclosures. Our implementation began with a Japanese-language DeBERTaV2 base model, pre-trained on a large general corpus. We then fine-tuned this base model specifically for financial sentiment classification using the chABSA2 dataset, a labeled corpus of sentences from Japanese financial reports. This specialization process adapts the model to the specific vocabulary and contextual phrasing of our target domain.
Let represent the input text sequence tokenized into subword units. The MLM objective is optimized by masking a fraction of tokens in , and the loss is computed as:
where is the set of masked token positions, represents with the i-th token masked, and is the predicted probability of the original token . For the sentiment classification task, the model predicts a probability distribution over sentiment class for each sentence . The sentiment classification loss is:
where N is the number of training samples and 1} is the ground-truth label for class for the -th sentence. is the predicted probability for class . The fine-tuning combines both losses:
where is the hyperparameter.
The model is fine-tuned using the chABSA dataset, which consists of sentences extracted from Japanese financial reports with sentiment labels assigned to specific terms. Each sentence is labeled with its sentiment polarity, indicating whether the expressed sentiment is positive, negative, or neutral. To ensure focus on unambiguous sentiment, we select sentences where all sentiment annotations are uniformly positive or negative, resulting in a subset of n = 2,227 sentences. The DeBERTaV2 model processes each sentence independently, generating a probability distribution over the sentiment classes . For each document consisting of sentences, the final sentiment score is computed as a weighted average:
where is the weight assigned to the -th sentence, determined by the model’s confidence and is the numerical score assigned to each sentiment class.
The DeBERTaV2 model processes each sentence in the MD&A sections independently, generating a probability distribution over the three sentiment classes. The final sentiment score for each document is computed as a weighted average of these probabilities, with weights determined by the model’s confidence in each prediction.
GPT-4
GPT-4 is a state-of-the-art language model developed with deep learning techniques that enable it to comprehend and generate human-like text across a variety of domains. The model demonstrates remarkable capabilities in understanding nuanced language, making logical connections, and adapting its response style based on specific task requirements. A key strength of GPT-4 is its ability to process and synthesize information from multiple perspectives, making it particularly effective for tasks requiring both analytical depth and contextual awareness.
In our study, we specifically utilize GPT-4o-mini (gpt-4o-mini-2024-07-18), which is optimized for efficient processing while maintaining high accuracy in sentiment analysis tasks. To guide GPT-4 in generating consistent and accurate sentiment scores, we crafted a detailed prompt in Japanese tailored to the financial context of the MD&A sections.
The prompt instructs the model to act as a securities analyst, read the company’s disclosure information, and calculate positive and negative sentiment scores that sum to 100, considering the context of the entire document. It includes specific rules and examples to ensure that the model’s output aligns with our analytical objectives. For instance, the model is instructed to output only the positive and negative scores without providing reasons or additional commentary, following a strict format for consistency.
An excerpt of the prompt is as follows (translated for clarity):
“You are a securities analyst. Read the company’s disclosure information below and, considering the context, calculate the positive sentiment score and negative sentiment score so that they sum up to 100.
Rules:
– Output in the following format: positive score: X (0–100), negative score: Y (0–100).
– Ensure that the positive score and negative score add up to 100.
– Evaluate the entire content of the disclosure information thoroughly and precisely, referencing the examples.
– Do not output reasons; only output positive score and negative score.”
By providing explicit instructions and examples of fully positive and fully negative disclosures, the prompt ensures that GPT-4 applies a consistent evaluation framework across all MD&A sections. The prompt detail is in the ‘LLM Hyperparameters and Prompt Details’.
Claude
Claude employs a unique approach to language modeling that sets it apart from both traditional dictionary-based methods and other large language models. While GPT-4 and Gemini rely on carefully designed prompts to guide their sentiment evaluations, Claude’s architecture emphasizes precise instruction-following and a deep, context-sensitive understanding of the text. Claude’s core strength lies in its ability to maintain logical consistency throughout complex analyses and consider multiple angles simultaneously. Whereas other LLMs may be more heavily influenced by their training data or specific examples provided in the prompt, Claude integrates instructions and contextual cues to produce balanced, well-reasoned sentiment assessments.
For our analysis, we employ Claude 3 Haiku (claude-3-haiku-20240307), configured to provide efficient processing while maintaining high accuracy in sentiment evaluation. Like GPT-4, we designed a standardized prompt for Claude in Japanese, instructing the model to produce positive and negative sentiment scores summing to 100 for each MD&A section. This approach ensures compatibility with our other analysis methods while leveraging Claude’s sophisticated natural language understanding capabilities to provide nuanced sentiment assessments.
Gemini
Gemini, developed by Google, distinguishes itself from models like GPT-4 and Claude in how it arrives at sentiment judgments without relying as heavily on explicit instructions or prompt engineering. While GPT-4 and Claude are notably effective at following detailed guidance—often producing sentiment assessments that closely align with the format and criteria specified in their prompts—Gemini’s approach is less about adherence to predetermined rules and more about organically interpreting the text’s underlying context. Unlike GPT-4, which excels at reasoning through instructions and examples to generate consistent output, and Claude, which emphasizes precise instruction-following and logical consistency, Gemini focuses on weaving together multiple layers of context—both at the micro-level of individual words and the macro-level of the document’s overarching narrative. This means that instead of primarily depending on how well the prompt guides it, Gemini dynamically recalibrates its understanding as it processes the text, extracting nuanced sentiment shifts that may emerge without direct cues or explicit scoring rules.
In our implementation, we utilize Gemini 1.5 Flash (gemini-1.5-flash), applying the same standardized scoring approach used with our other LLM implementations. The model evaluates each MD&A section to produce positive and negative sentiment scores that sum to 100, ensuring consistency across all analyses. The model processes the documents using a context-aware approach that considers both local semantic relationships and broader thematic elements in determining sentiment scores.
Incorporating custom prompts in LLMs
A critical aspect of leveraging LLMs for sentiment analysis in financial documents lies in the careful design of input prompts. In this study, we have employed carefully structured prompts to guide models such as GPT-4, Claude, and Gemini, ensuring that their responses align with the analytical goals of the research. For GPT-4, a tailored prompt was developed in Japanese, directing the model to adopt the perspective of a securities analyst when evaluating the disclosed material. This prompt included explicit instructions on how to interpret and report sentiment, including detailed guidelines on scoring and a range of examples illustrating both strongly positive and distinctly negative cases. By providing the model with a clear evaluative framework and concrete textual references, it becomes possible to produce highly consistent sentiment measures across multiple documents. This approach also ensures that the model focuses on the essential aspects of the disclosures rather than drifting into irrelevant commentary. It is important to emphasize that no alterations were made to the original MD&A language. Working directly with the source text ensures that the derived sentiment scores accurately capture the tone and content that the management intended to convey, thereby producing results that are well-positioned to inform subsequent analyses of the relationship between sentiment and financial outcomes.
Results
Sentiment based long-short portfolio return
Table 2 presents the summary statistics for the sentiment scores derived from our six different methods. A notable pattern emerges from these distributions: the mean scores for the dictionary-based methods (Tone Ratio and Tone Score) are negative, while those for the LLMs are positive. This is consistent with prior literature (e.g., Loughran & McDonald, 2011), which finds that finance-specific dictionaries tend to have a negative skew, as corporate disclosures often employ cautious language to mitigate legal risk. In contrast, our LLM scores are derived from a prompt that instructs the models to allocate scores summing to 100 between positive and negative sentiment, naturally centering the distribution around a positive mean (0.5 after normalization). We now proceed to test the predictive power of these different sentiment measures for future stock returns.
| Mean | Min | 25% | Median | 75% | Max | |
|---|---|---|---|---|---|---|
| Tone ratio | −0.144 | −0.393 | −0.184 | −0.142 | −0.102 | 0.083 |
| Tone score | −3.265 | −194.445 | −11.188 | −1.872 | 6.108 | 92.435 |
| DeBERTaV2 | 0.689 | 0.004 | 0.182 | 0.998 | 0.999 | 0.999 |
| GPT-4 | 0.575 | 0.100 | 0.400 | 0.600 | 0.700 | 0.900 |
| Claude | 0.616 | 0.000 | 0.500 | 0.600 | 0.700 | 0.800 |
| Gemini | 0.517 | 0.100 | 0.400 | 0.600 | 0.700 | 0.900 |
The primary aim of this study is to investigate whether large language models (LLMs) can identify information within Japanese 10-K reports that anticipates future stock returns. Under the Efficient Market Hypothesis (EMH) outlined by Fama (1970), all public information should already be embedded in asset prices, rendering attempts to achieve abnormal returns through conventional analysis futile. However, previous empirical work points to a more complex reality. Studies such as Tetlock (2007) and Loughran & McDonald (2011) reveal that textual characteristics of corporate disclosures can encode signals predictive of subsequent stock performance. This tension between theory and empirical evidence raises the question of how novel analytical tools—particularly LLMs—might bridge the gap.
To explore the predictive value of such sentiment measures, this research constructs value-weighted portfolios sorted on sentiment extracted from the Management Discussion and Analysis (MD&A) sections of 10-K reports. For each fiscal year from 2014 through 2023, all firms listed on the Tokyo Stock Exchange are ranked according to their sentiment scores as of June. These scores, derived from the previous fiscal year’s filings ending in March, determine which firms enter the long and short portfolios. The top quintile of firms with the highest sentiment forms the long portfolio, and the bottom quintile with the lowest sentiment forms the short portfolio. Both portfolios are value-weighted by market capitalization at the formation date and are held for one year, spanning from July of year t to June of year t + 1. We select value-weighting for our primary analysis as this approach reflects the performance of a realistic, investable portfolio and is standard in the asset pricing literature. A corresponding analysis using equal-weighted portfolios is presented in the “Robustness Check” section. This procedure repeats annually for each of the six sentiment extraction methods—Tone Ratio, Tone Score, DeBERTaV2, GPT-4, Claude, and Gemini—providing a comparative framework that evaluates conventional and advanced approaches in tandem.
Figure 2 presents the cumulative returns for the long-short portfolios derived from each method. The results reveal important distinctions in how these methods capture return-predictive sentiment. Contrary to conventional expectations, the long-short portfolios constructed with GPT-4 and Claude sentiment measures exhibit sustained negative cumulative returns. This finding indicates that firms displaying high positive sentiment underperform those classified as having strong negative sentiment, suggesting that positive sentiment may be overvalued, negative sentiment may be overvalued, or both. The portfolios based on Tone Ratio and Tone Score, while grounded in dictionary-based approaches, show only modest or even negative results, indicating that these traditional metrics do not isolate the type of sentiment that correlates with future stock performance. DeBERTaV2 similarly struggles to produce strong predictive signals. The Gemini-based portfolios produce intermediate results, performing better than the traditional methods yet not reaching the levels of GPT-4 and Claude. Together, these findings imply that certain LLM architectures yield a more nuanced sentiment measure that aligns with future returns, challenging the assumption that all publicly available information is already reflected in share prices.
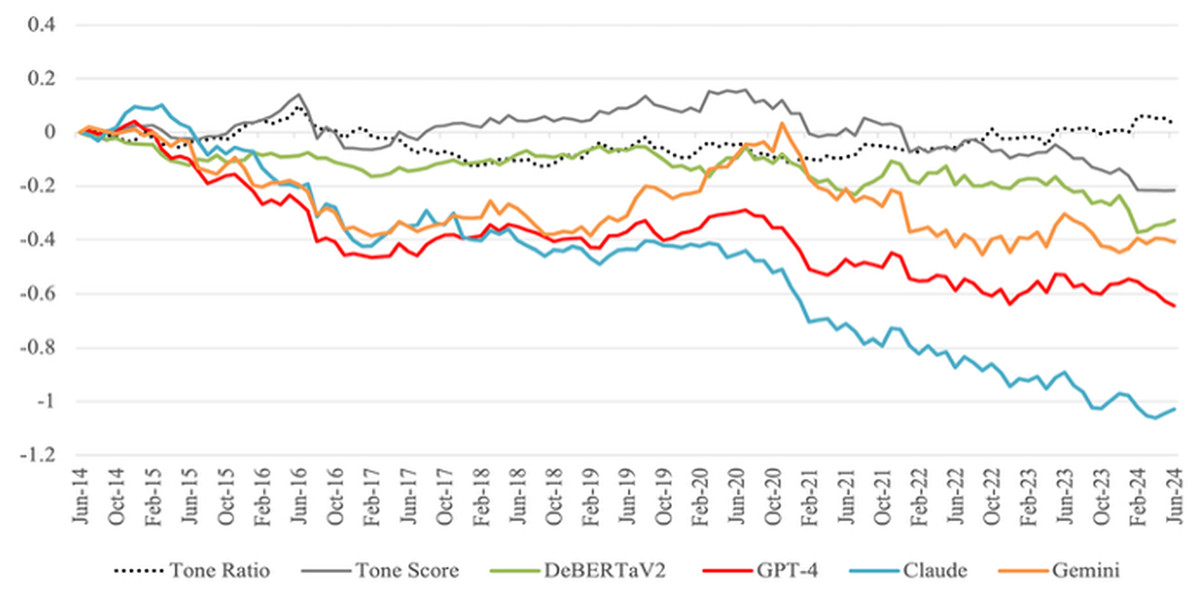
Figure 2: Cumulative returns of long-short portfolios based on sentiment scores.
The cumulative returns of long-short portfolios constructed based on sentiment scores from various extraction methods. The chart represents the cumulative performance of portfolios formed by taking a long position in stocks with sentiment scores greater than the top 20% threshold and a short position in stocks with sentiment scores less than or equal to the bottom 20% threshold at the end of each June, holding these positions for 1 year, and rebalancing at the subsequent June end. The y-axis represents the monthly cumulative return of the long-short portfolio, capturing the aggregated performance over time.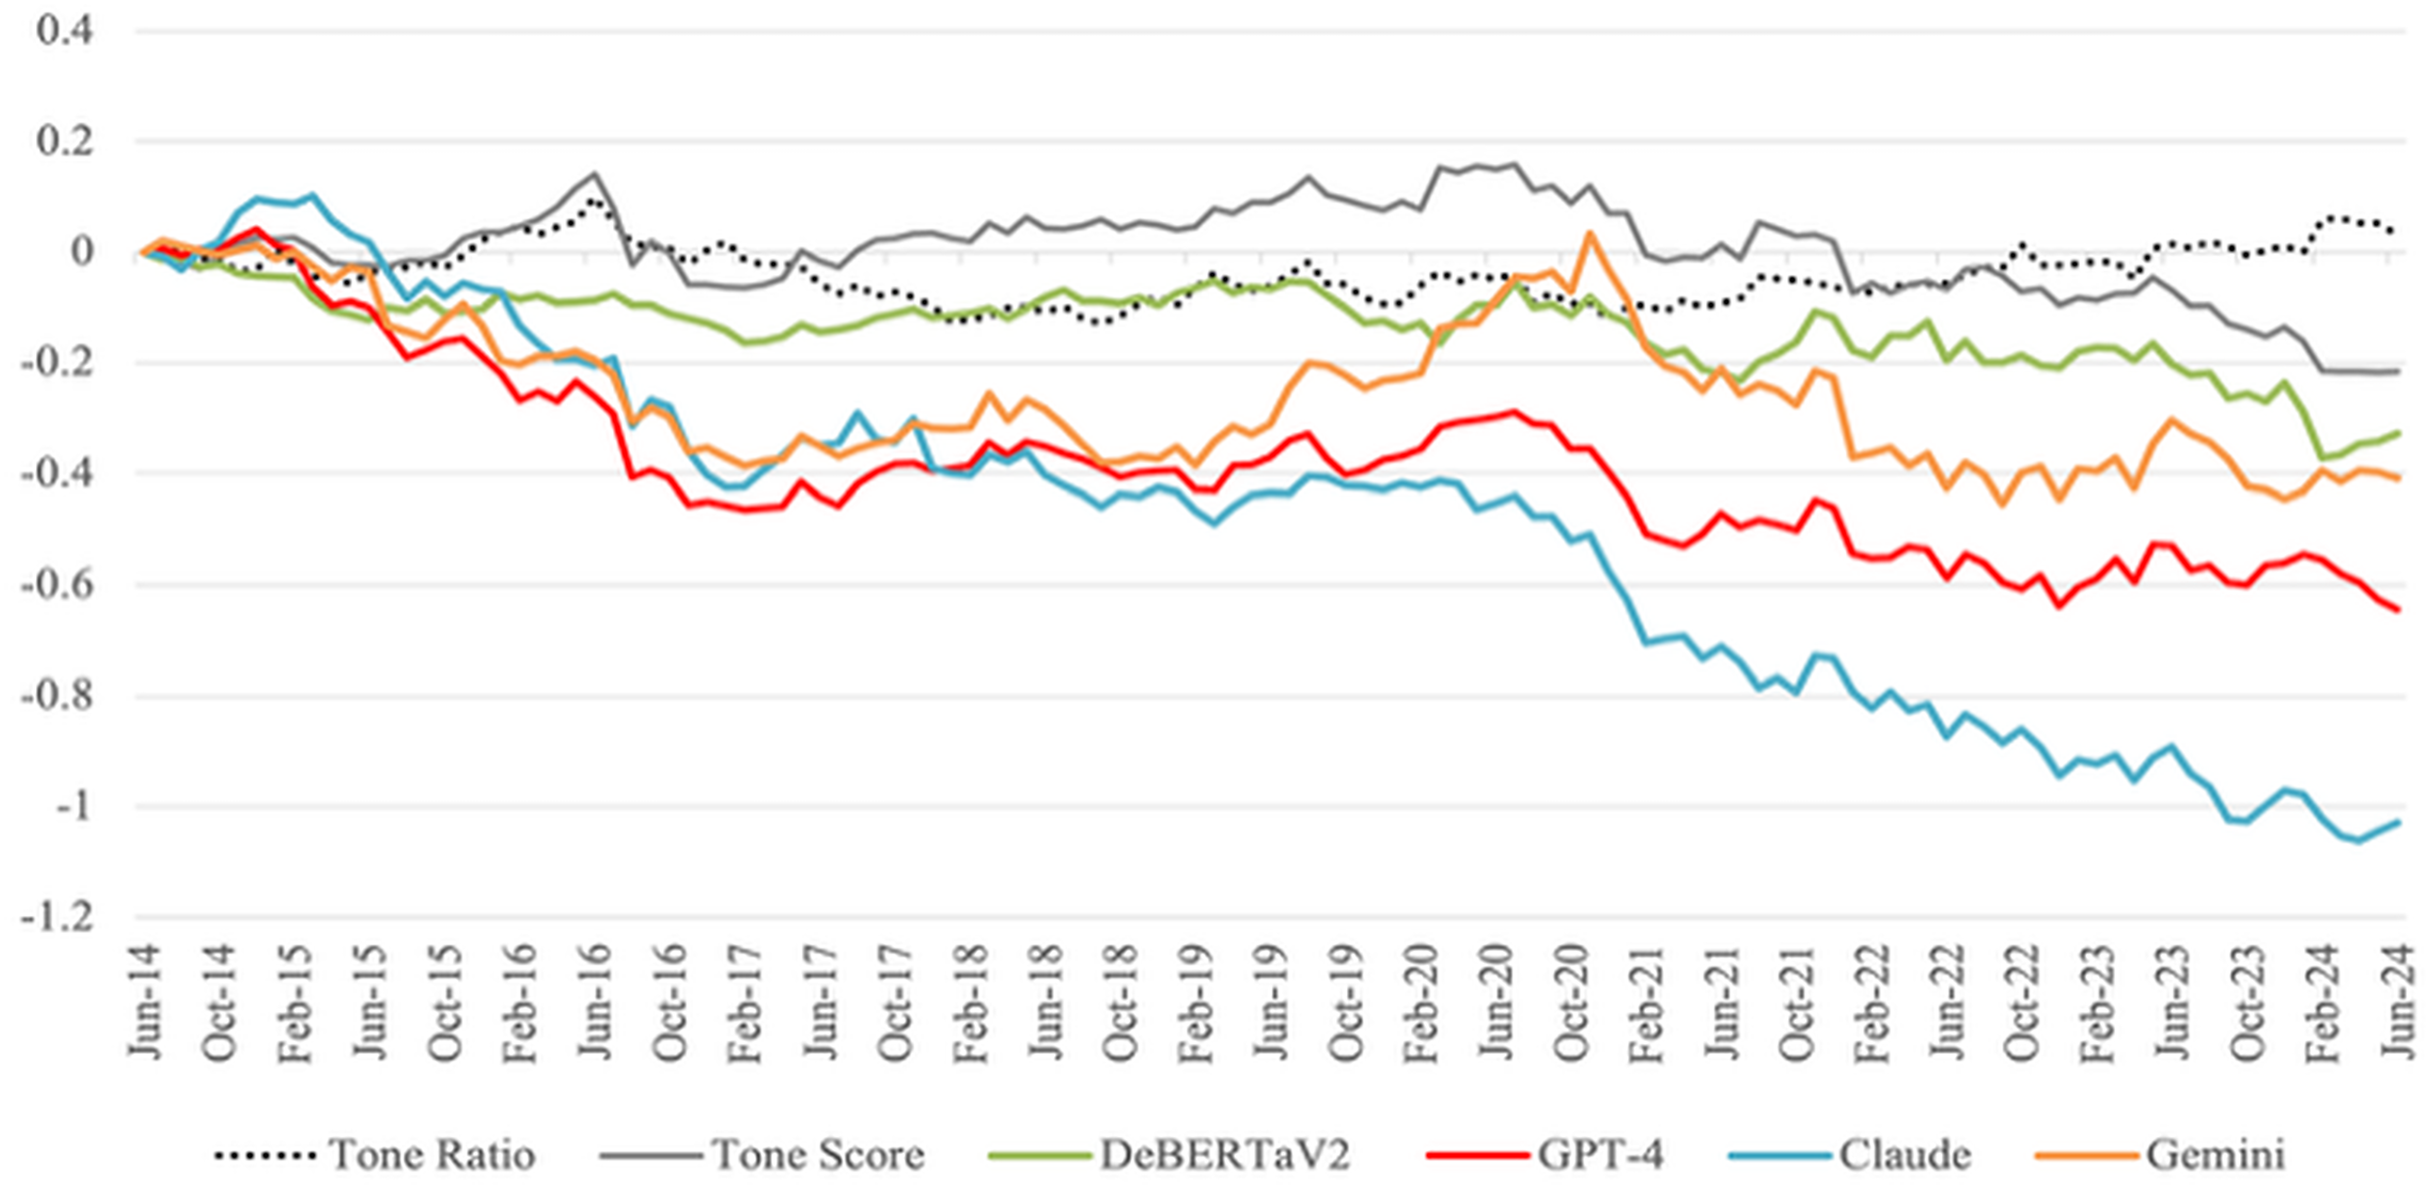
To decompose the result from Fig. 2 and provide a more granular view from an investor’s perspective, Fig. 3 presents the cumulative annual buy-and-hold returns for the long and short legs of the portfolios separately, benchmarked against the TOPIX index. The decomposition clearly illustrates the source of the contrarian signal. Panel A shows that the portfolio composed of the highest-sentiment stocks consistently underperforms the TOPIX benchmark. In contrast, Panel B demonstrates that the portfolio of the lowest-sentiment stocks significantly outperforms the benchmark. This clarifies why the long-short strategy in Fig. 2 generated negative returns: the long leg of the strategy (the positive-sentiment portfolio in Panel A) underperformed, while the assets in the short leg (the negative-sentiment portfolio in Panel B) outperformed the benchmark, leading to losses on the short positions.
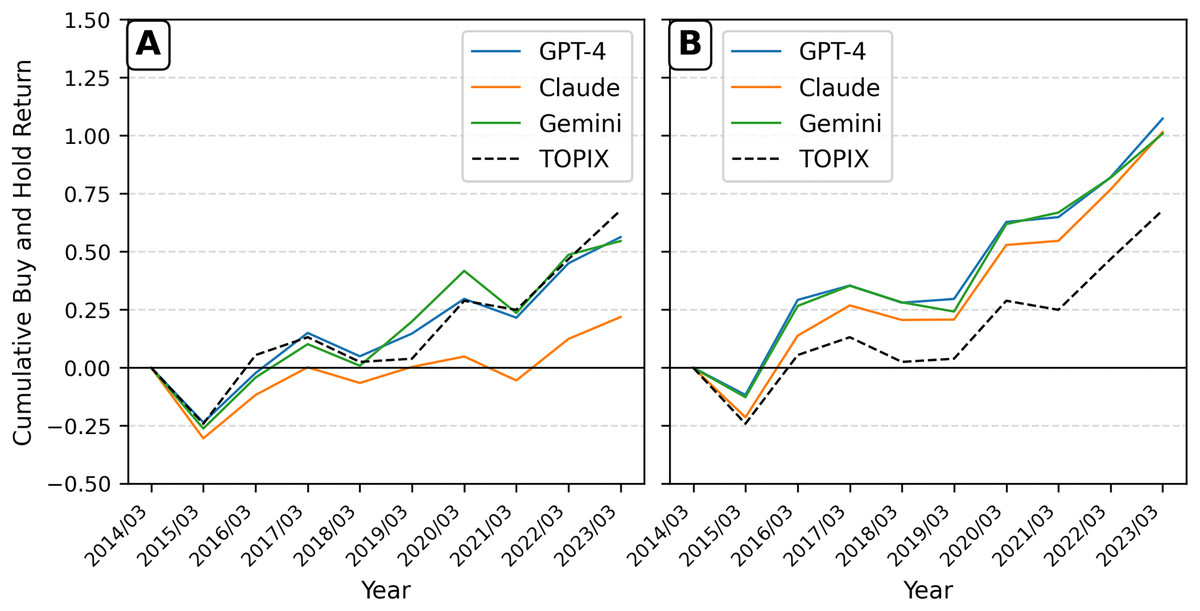
Figure 3: Cumulative annual buy-and-hold returns for sentiment portfolios.
The cumulative annual buy-and-hold returns (BHR) for value-weighted portfolios formed on sentiment quintiles, rebalanced each year. (A) Displays the performance of the portfolio containing stocks from the highest (most positive) sentiment quintile. (B) Displays the performance of the portfolio containing stocks from the lowest (most negative) sentiment quintile. The performance of portfolios based on GPT-4, Claude, and Gemini sentiment is benchmarked against the TOPIX index.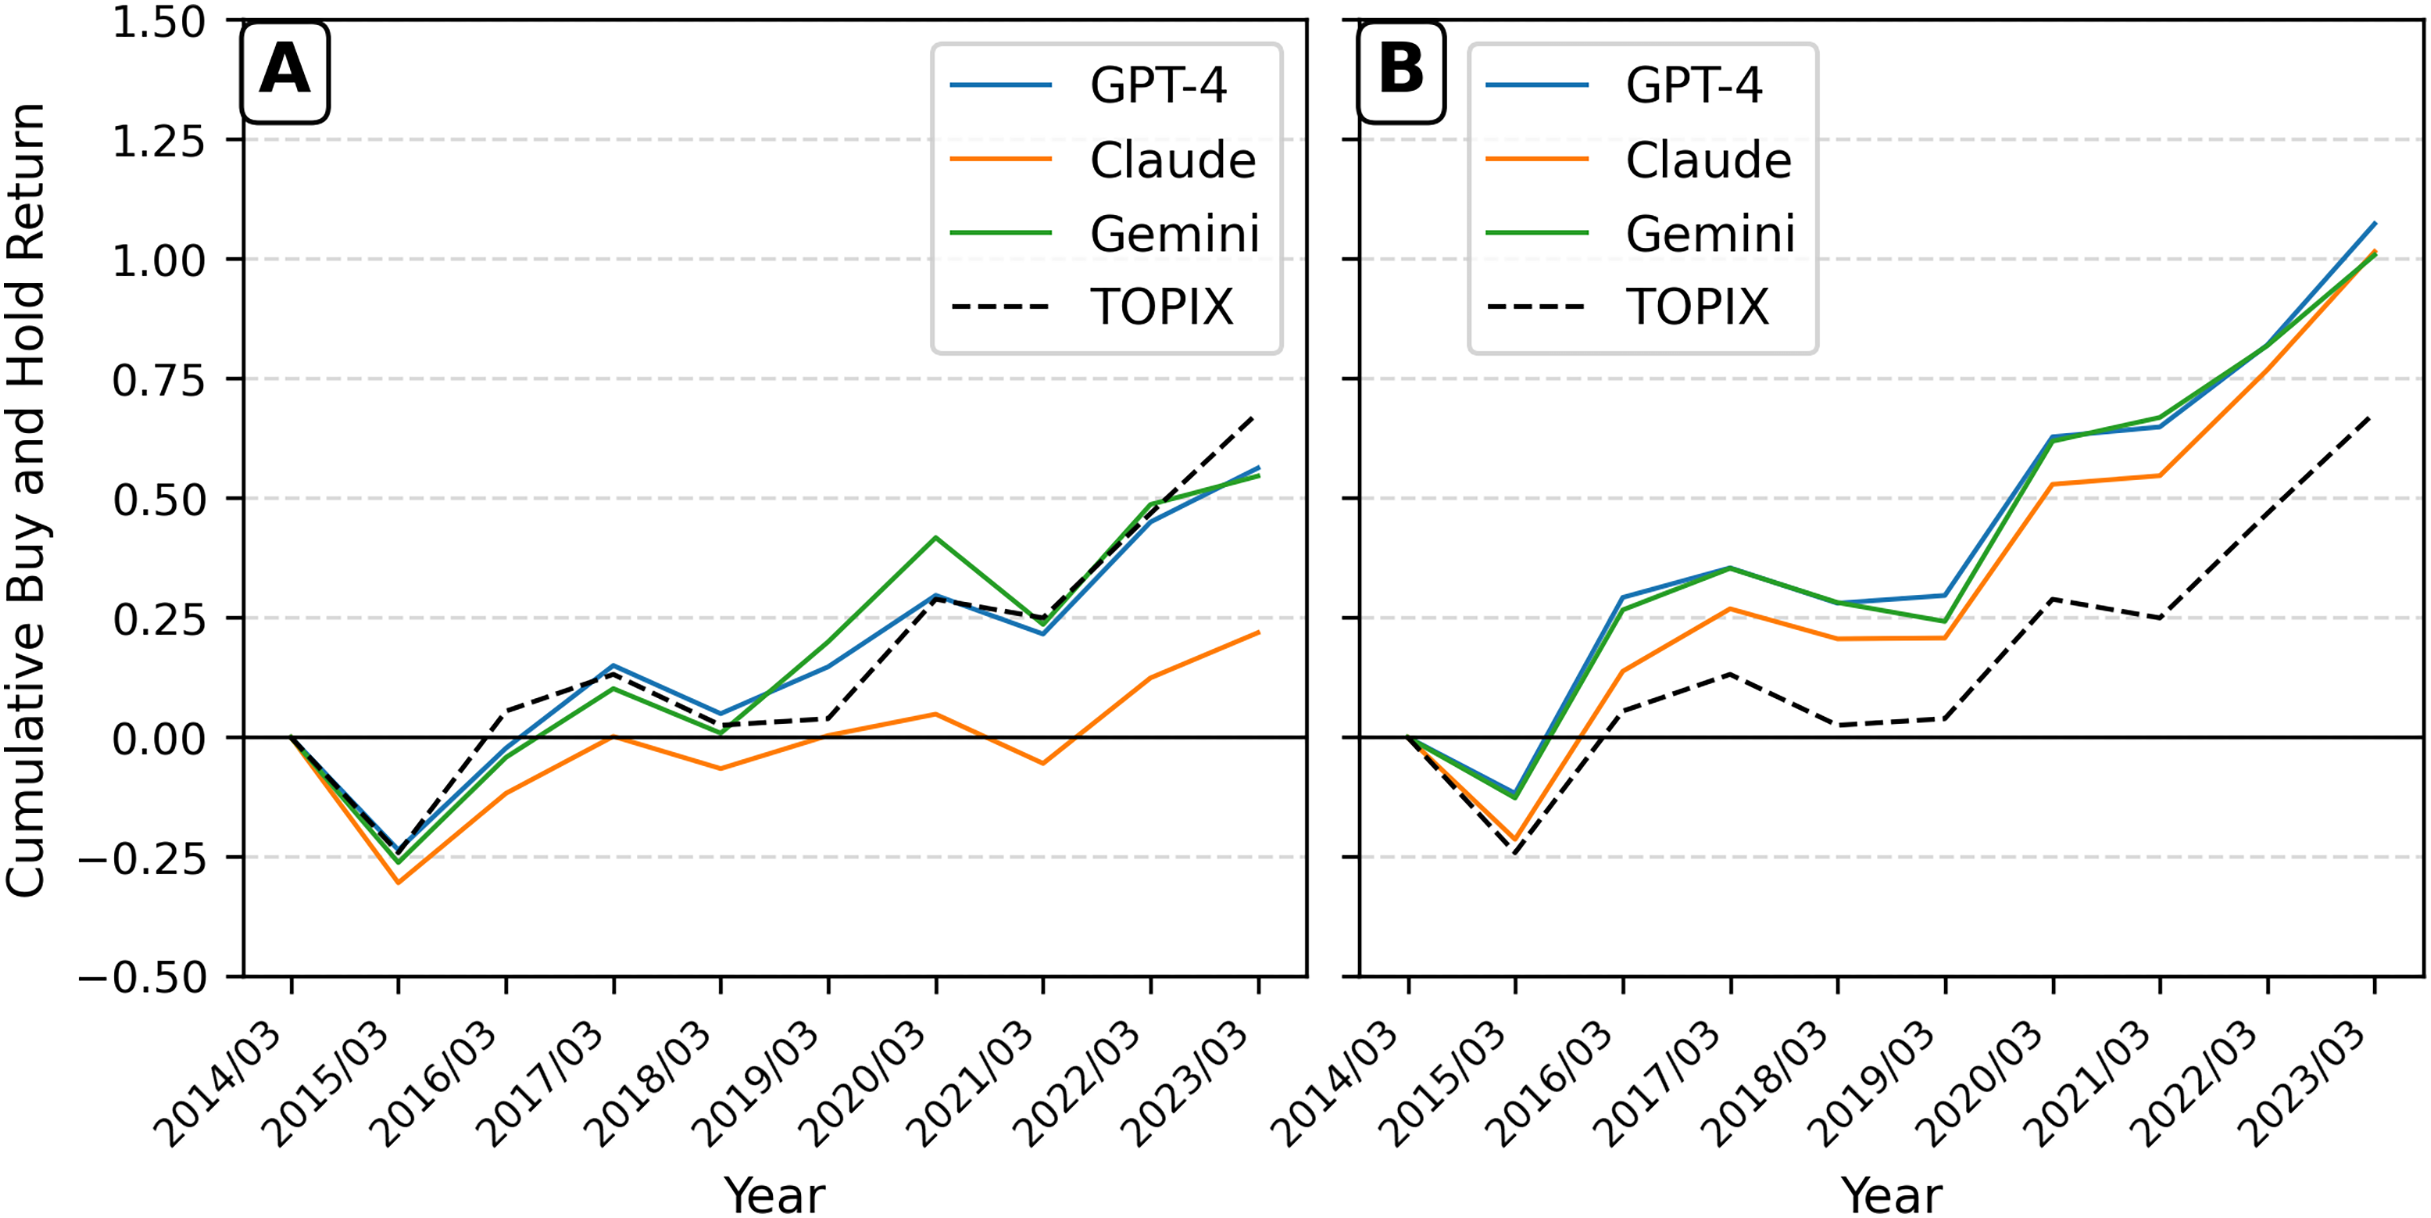
Discussion
Asset pricing test
To evaluate the performance of sentiment-based portfolios, we employ standard asset pricing models that describe stock returns as functions of systematic risk factors. These models serve to determine whether the returns of a portfolio can be explained by exposure to well-known risk factors or whether they demonstrate abnormal performance, often referred to as alpha.
The analysis begins with the Fama-French three-factor model (FF3), which explains portfolio returns based on three primary components: the market excess return, the size premium, and the value premium (Fama & French, 1993). The size premium captures the historical tendency of smaller firms to outperform larger firms, while the value premium reflects the superior returns of firms with high book-to-market ratios relative to those with low ratios. The model is expressed as:
where is the return of portfolio at time t, is the risk-free rate, represents the market excess return, denotes the size premium, and represents the value premium. The intercept αp captures the portfolio’s abnormal return, and is the idiosyncratic error term.
Next, we extend the analysis by incorporating the momentum factor, which accounts for the observed tendency of stocks with strong past performance to continue outperforming those with weak past performance. This results in the Carhart four-factor model (FFC4), which is given by (Please see Carhart (1997)):
In this equation, captures the momentum premium, reflecting the returns of winning stocks relative to losing stocks.
Finally, we consider the Fama-French five-factor model (FF5), which introduces two additional factors to account for profitability and investment patterns (Fama & French, 2015). Profitability captures the distinction between robust firms and weaker ones, while the investment factor contrasts conservative firms with aggressive ones in terms of capital expenditure. The FF5 model is expressed as:
Here, represents the profitability premium, and denotes the investment premium.
These models allow us to test whether the performance of sentiment-based portfolios can be attributed to common risk factors or if they exhibit abnormal returns. Specifically, a statistically significant intercept indicates the presence of abnormal performance that cannot be explained by the risk factors included in the model.
Table 3 reports the estimated alphas and factor loadings from these regressions for each portfolio. The results indicate that the long-short portfolios based on GPT-4 and Claude sentiment scores yield statistically significant negative alphas across all models. Specifically, the GPT-4-based portfolio exhibits annualized alphas of −5.95% (FF3, t-statistic = −2.01), −6.49% (FFC4, t-statistic = −2.21), and −6.29% (FF5, t-statistic = −2.18), all significant at the 5% level. Similarly, the Claude-based portfolio shows even more pronounced negative alphas of −9.15% (FF3, t-statistic = −2.66), −9.90% (FFC4, t-statistic = −2.92), and −9.46% (FF5, t-statistic = −2.76), all significant at the 1% level. Beyond their statistical significance, the abnormal returns generated by the LLM-based strategies are also of considerable economic magnitude. To place our findings in context, the annualized alpha for the GPT-4 portfolio was −5.95% and −9.15% for the Claude portfolio under the Fama-French three-factor model. During our sample period, the average annualized return for well-established factors in the Japanese market, such as the size premium (SMB), was 1.39%, while the value premium (HML) was approximately 1.35%. The magnitude of the negative alpha captured by our sentiment strategy is therefore exceeds the returns from these foundational market anomalies. This comparison highlights that the predictive signals extracted by sophisticated LLMs are not just statistically robust but also represent an economically significant market inefficiency.
| FF3 | FFC4 | FF5 | FF3 | FFC4 | FF5 | FF3 | FFC4 | FF5 | |
|---|---|---|---|---|---|---|---|---|---|
| TONE ratio | TONE score | DeBERTaV2 | |||||||
| α | 0.002 | 0.001 | 0.002 | 0.000 | −0.001 | 0.000 | −0.001 | −0.001 | −0.001 |
| Rm-Rf | −0.150*** | −0.117** | −0.113** | −0.034 | 0.026 | 0.039 | −0.035 | −0.020 | −0.076 |
| SMB | −0.089 | −0.127 | −0.112 | 0.074 | 0.006 | 0.060 | −0.133 | −0.149 | −0.117 |
| HML | −0.221*** | −0.178** | −0.303*** | −0.569*** | −0.489*** | −0.653*** | −0.447*** | −0.428*** | −0.238*** |
| WML | 0.135* | 0.246*** | 0.057 | ||||||
| RMW | −0.225 | 0.093 | 0.331* | ||||||
| CMA | −0.029 | 0.262 | −0.123 | ||||||
| Adj R-squared | 0.149 | 0.167 | 0.150 | 0.407 | 0.448 | 0.398 | 0.292 | 0.289 | 0.307 |
| GPT-4 | Claude | Gemini | |||||||
| α | −0.005** | −0.005** | −0.005** | −0.008*** | −0.008*** | −0.008*** | −0.004 | −0.005 | −0.004 |
| Rm-Rf | 0.088 | 0.135** | 0.003 | −0.0002 | 0.065 | −0.077 | 0.167** | 0.218*** | 0.085 |
| SMB | −0.094 | −0.147 | −0.080 | −0.183 | −0.257* | −0.171 | −0.256* | −0.316** | −0.219 |
| HML | −0.523*** | −0.461*** | −0.185 | −0.602*** | −0.516*** | −0.259* | −0.821*** | −0.753*** | −0.559*** |
| WML | 0.192* | 0.267 | 0.212* | ||||||
| RMW | 0.578** | 0.538* | 0.116 | ||||||
| CMA | −0.186 | −0.194 | −0.538** | ||||||
| Adj R-squared | 0.249 | 0.265 | 0.291 | 0.219 | 0.246 | 0.234 | 0.377 | 0.388 | 0.384 |
These results suggest that sentiment-based strategies utilizing GPT-4 and Claude systematically underperform relative to expectations based on common risk factors. In contrast, other sentiment-based methods, such as the Tone Ratio, Tone Score, DeBERTaV2, and Gemini, produce alphas that are not statistically significant, indicating that these portfolios fail to generate abnormal returns after accounting for conventional risk factors. These findings challenge the weak form of the Efficient Market Hypothesis (EMH) by demonstrating that advanced large language models (LLMs) can extract subtle but predictive information from publicly available 10-K reports that is not fully reflected in stock prices at the time of disclosure.
To place our findings within the context of the broader literature, it is useful to compare our results with other studies that use LLMs for return prediction. Our finding of a significant negative alpha (e.g., −5.95% annualized for the GPT-4 portfolio under the FF3 model) presents a notable contrast to some recent work. For example, Lopez-Lira & Tang (2023), as cited in the survey by Nie et al. (2024), found that ChatGPT could forecast stock movements with a positive correlation when analyzing news headlines. This divergence suggests that the source and nature of the text are critical. The formal, backward-looking, and carefully curated language of a 10-K report may be processed by investors as a contrarian signal—where overly positive sentiment suggests overvaluation—whereas the immediate and forward-looking nature of news headlines may serve as a more direct momentum signal. Our results align more closely with the behavioral finance theory of investor overreaction to corporate disclosures, which is then corrected over time.
A key finding of this study is that sentiment scores derived from advanced LLMs have significant power to predict future stock returns, a result that contributes to a rapidly advancing body of research on the application of LLMs in finance. A recent survey by Nie et al. (2024) highlights a study demonstrating that an LLM, when given only anonymized, numerical financial statements, can outperform professional human analysts in predicting the direction of future earnings. The survey notes that the LLM succeeds not from memory, but by generating its own analytical insights from the raw financial data. Our research complements and extends this finding by tackling the challenge from the opposite direction. Whereas some studies highlighted by Nie et al. (2024) deliberately exclude narrative text to isolate the LLM’s numerical reasoning ability, our study focuses specifically on extracting sentiment from the narrative-rich Management Discussion and Analysis (MD&A) section. Their work showed that LLMs can reason effectively from quantitative data alone; our work shows they can extract predictive signals from the qualitative discussion that accompanies it. These parallel findings suggest that advanced LLMs possess a comprehensive capability to generate alpha from both the quantitative and qualitative components of corporate financial disclosures.
This linguistic capability leads to a second key insight rooted in behavioral finance: investor overreaction. When LLMs identify high sentiment, they are effectively flagging firms whose optimistic disclosures are persuasive enough to cause an initial overreaction from investors, driving stock prices above their fundamental value. The subsequent negative abnormal returns, which we document as a statistically significant alpha, can be interpreted as the market’s eventual correction of this initial overpricing. This interpretation finds further support when considered in the context of the well-known “momentum puzzle”. The momentum effect—a globally observed anomaly where stocks with high past returns (“winners”) continue to outperform those with low past returns (“losers”)—has been shown to be notably absent in the Japanese market (Jegadeesh & Titman, 2023). Our long-short portfolio exhibits a positive loading on the momentum factor (WML), indicating that firms with high LLM-derived sentiment tend to be past winners. However, the fact that these portfolios subsequently generate negative alpha suggests a market structure where the overreaction to positive signals leads to a strong reversal, rather than the sustained performance characteristic of momentum. Thus, our findings align with a market environment that does not reward momentum and, in this context, punishes apparent ‘winners’ identified through textual sentiment.
Case study: analysis of portfolio outliers
To provide a more granular analysis of our portfolio-level findings, Table 4 presents a case study of stocks with extreme performance outcomes.
| Fiscal year | Company name | 1-year BHR after 10K release | TOPIX BHR (Matched) | GPT-4 Sentiment rank | Claude sentiment rank |
|---|---|---|---|---|---|
| Panel A | |||||
| Best performers in GPT4 base negative sentiment | |||||
| 2016 | Yamashin filter corp. | 4.169 | 0.296 | 1,058 | 896 |
| 2023 | C&F logistics corp. | 3.544 | 0.221 | 781 | 760 |
| 2014 | Kubotek corp. | 2.330 | 0.323 | 905 | 1,098 |
| Worst performers in GPT4 base positive sentiment | |||||
| 2021 | IR Japan holdings | −0.859 | −0.017 | 44 | 1 |
| 2021 | SRE holdings corp. | −0.708 | −0.038 | 44 | 1 |
| 2021 | RareJob Inc. | −0.698 | −0.054 | 44 | 38 |
| Panel B | |||||
| Best performers in Claude base negative sentiment | |||||
| 2016 | Yamashin filter corp. | 4.169 | 0.296 | 896 | 1,058 |
| 2023 | C&F logistics corp. | 3.544 | 0.221 | 760 | 781 |
| 2016 | m-up holdings Inc. | 2.592 | 0.300 | 896 | 728 |
| Worst performers in Claude base positive sentiment | |||||
| 2021 | IR Japan holdings | −0.859 | −0.017 | 1 | 44 |
| 2021 | SRE holdings corp. | −0.708 | −0.038 | 1 | 44 |
| 2015 | MinebeaMitsumi Inc. | −0.675 | −0.246 | 1 | 1 |
The analysis is divided by the model used for the initial classification: Panel A is based on GPT-4’s sentiment scores, and Panel B is based on Claude’s. For the “Best Performers” in each panel, we first identified all firms that the anchor model classified as having negative sentiment and then selected the top three performers based on their subsequent 1-year buy-and-hold returns (BHR). Conversely, the “Worst Performers” are the three firms with the lowest BHR, selected from the pool of firms classified as having positive sentiment. The table displays each stock’s sentiment rank from both GPT-4 and Claude. Since ranks are based on the sentiment scores generated by the LLMs, multiple firms can share the same rank each year if their underlying scores are identical; for example, all three “Worst Performers” under the GPT-4 classification in 2021 share the same rank of 44. The table reveals a high degree of agreement between the models on these extreme cases. Notably, when a stock’s MD&A was categorized as positive by GPT-4, Claude’s sentiment rank was also strongly positive for the most part. This cross-model consensus on the outlier classifications provides further support for the validity of the extracted sentiment signal. These cases provide concrete examples of the study’s central contrarian finding that a negative sentiment classification can precede exceptionally strong returns, while a positive classification can precede significant underperformance.
Robustness checks
To ensure the validity of our main findings, we conduct several additional tests addressing potential concerns regarding portfolio construction, transaction costs, and sample composition.
Alternative portfolio formation thresholds
Our primary analysis uses the top and bottom 20% of firms to form portfolios. To ensure our conclusions are not sensitive to this specific threshold, we reconstruct the portfolios using both the top/bottom 10% and top/bottom 30% of firms based on sentiment scores. The results, summarized in Table 5, remain consistent with our main analysis, confirming that our findings are robust to the choice of portfolio formation threshold.
| Panel A (Top 30%–Bottom 30%) | |||||||||
|---|---|---|---|---|---|---|---|---|---|
| FF3 | FFC4 | FF5 | FF3 | FFC4 | FF5 | FF3 | FFC4 | FF5 | |
| TONE Ratio | TONE score | DeBERTaV2 | |||||||
| α | 0.001 | 0.000 | 0.001 | −0.001 | −0.001 | −0.001 | −0.001 | −0.001 | −0.002 |
| Rm-Rf | −0.106*** | −0.093** | −0.089** | −0.049 | −0.016 | −0.009 | −0.069* | −0.068 | −0.078* |
| SMB | −0.035 | −0.050 | −0.058 | 0.016 | −0.023 | 0.015 | −0.121 | −0.122 | −0.105 |
| HML | −0.140** | −0.123** | −0.213*** | −0.497*** | −0.452*** | −0.508** | −0.340*** | −0.339*** | −0.207** |
| WML | 0.053 | 0.137** | 0.003 | ||||||
| RMW | −0.259** | 0.308** | |||||||
| CMA | −0.121 | 0.142 | 0.052 | ||||||
| Adj R-Squared | 0.095 | 0.092 | 0.104 | 0.440 | 0.456 | 0.426 | 0.235 | 0.228 | 0.239 |
| GPT-4 | Claude | Gemini | |||||||
| α | −0.003 | −0.004* | −0.004* | −0.006** | −0.006** | −0.006** | −0.003 | −0.003 | −0.003 |
| Rm-Rf | 0.098* | 0.140** | 0.013 | −0.029 | 0.015 | −0.098 | 0.161*** | 0.192** | 0.040 |
| SMB | −0.126 | −0.175 | −0.120 | −0.299** | −0.349** | −0.283** | −0.197* | −0.232* | −0.181* |
| HML | −0.461*** | −0.405*** | −0.162 | −0.505*** | −0.446*** | −0.188 | −0.573*** | −0.532*** | −0.222** |
| WML | 0.174* | 0.180 | 0.126 | ||||||
| RMW | 0.392* | 0.407 | 0.272 | ||||||
| CMA | −0.286* | −0.213 | −0.565*** | ||||||
| Adj R-squared | 0.256 | 0.274 | 0.296 | 0.176 | 0.188 | 0.183 | 0.367 | 0.372 | 0.444 |
| Panel B (Top 10%–Bottom 10%) | |||||||||
|---|---|---|---|---|---|---|---|---|---|
| FF3 | FFC4 | FF5 | FF3 | FFC4 | FF5 | FF3 | FFC4 | FF5 | |
| TONE Ratio | TONE Score | DeBERTaV2 | |||||||
| α | 0.001 | 0.001 | 0.002 | 0.000 | −0.001 | 0.000 | 0.000 | 0.000 | 0.000 |
| Rm-Rf | −0.218*** | −0.144* | −0.115 | −0.059 | −0.034 | 0.010 | −0.049 | −0.056 | −0.088 |
| SMB | −0.009 | −0.094 | −0.079 | 0.064 | 0.056 | 0.091 | −0.104 | −0.096 | −0.070 |
| HML | −0.111 | −0.013 | −0.379*** | −0.654*** | −0.525*** | −0.792*** | −0.651*** | −0.660*** | −0.461*** |
| WML | 0.303** | 0.238** | −0.027 | ||||||
| RMW | −0.447 | −0.113 | 0.281 | ||||||
| CMA | 0.170 | 0.264 | −0.186 | ||||||
| Adj R-squared | 0.069 | 0.114 | 0.069 | 0.370 | 0.410 | 0.384 | 0.368 | 0.363 | 0.368 |
| GPT-4 | Claude | Gemini | |||||||
| α | −0.004 | −0.004 | −0.004 | −0.010** | −0.011*** | −0.012*** | −0.004 | −0.004 | −0.004 |
| Rm-Rf | 0.138** | 0.180** | 0.064 | 0.044 | 0.124 | 0.002 | 0.153** | 0.196** | 0.052 |
| SMB | −0.118 | −0.165 | −0.107 | −0.062 | −0.153 | −0.013 | −0.235 | −0.284 | −0.192 |
| HML | −0.723*** | −0.667*** | −0.368** | −0.605*** | −0.499*** | −0.100 | −0.841*** | −0.784*** | −0.476*** |
| WML | 0.172 | 0.326** | 0.176 | ||||||
| RMW | 0.652** | 1.622*** | 0.409 | ||||||
| CMA | −0.137 | 0.648** | −0.450* | ||||||
| Adj R-squared | 0.314 | 0.319 | 0.314 | 0.139 | 0.162 | 0.139 | 0.318 | 0.322 | 0.318 |
Portfolio weighting scheme
Our main analysis employs value-weighted portfolios to reflect a realistic investment strategy. To test the sensitivity of our findings to this choice, we conduct a robustness check using equal-weighted long-short portfolios, with the results presented in Table 6. When using an equal-weighted scheme on the full sample of firms (Panel A), the alpha for the GPT-4 portfolio becomes statistically insignificant, whereas the Claude portfolio retains weak to moderate statistical significance. This mixed result suggests a complex interaction between the sentiment signals and firm size, motivating a more direct test on large-capitalization stocks.
| Panel A (All stocks) | |||||||||
|---|---|---|---|---|---|---|---|---|---|
| FF3 | FFC4 | FF5 | FF3 | FFC4 | FF5 | FF3 | FFC4 | FF5 | |
| TONE ratio | TONE score | DeBERTaV2 | |||||||
| α | 0.001 | 0.001 | 0.001 | 0.001 | 0.000 | 0.001 | 0.000 | −0.001 | 0.000 |
| Rm-Rf | −0.031*** | −0.029 | −0.006 | 0.037 | 0.083** | 0.028 | 0.043 | 0.059 | 0.010 |
| SMB | −0.236*** | −0.238*** | −0.252*** | −0.033 | −0.086 | −0.051 | 0.022 | 0.004 | 0.026 |
| HML | −0.238** | −0.235*** | −0.229*** | −0.432*** | −0.370*** | −0.410** | −0.095 | −0.074 | −0.055 |
| WML | 0.008 | 0.189 | 0.064 | ||||||
| RMW | −0.038** | −0.090 | −0.084 | ||||||
| CMA | 0.000 | −0.224 | −0.227 | ||||||
| Adj R-squared | 0.324 | 0.318 | 0.342 | 0.448 | 0.500 | 0.452 | 0.095 | 0.109 | 0.150 |
| GPT-4 | Claude | Gemini | |||||||
| α | 0.000 | −0.001 | 0.000 | −0.004* | −0.004** | −0.003 | 0.000 | −0.001 | 0.000 |
| Rm-Rf | 0.156*** | 0.208*** | 0.073* | 0.147*** | 0.203*** | 0.079 | 0.132*** | 0.195*** | 0.031 |
| SMB | −0.097 | −0.157* | −0.098 | −0.199* | −0.264** | −0.179 | −0.139 | −0.210** | −0.136 |
| HML | −0.488*** | −0.419*** | −0.300*** | −0.732*** | −0.657*** | −0.547*** | −0.573*** | −0.490*** | −0.358** |
| WML | 0.214*** | 0.231*** | 0.256*** | ||||||
| RMW | 0.011 | −0.081 | −0.054 | ||||||
| CMA | −0.529*** | −0.574*** | −0.672*** | ||||||
| Adj R-Squared | 0.429 | 0.470 | 0.508 | 0.482 | 0.508 | 0.494 | 0.401 | 0.446 | 0.491 |
| Panel B (TOPIX 100 Composite Stocks) | |||||||||
|---|---|---|---|---|---|---|---|---|---|
| FF3 | FFC4 | FF5 | FF3 | FFC4 | FF5 | FF3 | FFC4 | FF5 | |
| TONE ratio | TONE score | DeBERTaV2 | |||||||
| α | 0.003 | 0.003 | 0.003 | −0.003 | −0.003 | −0.003 | −0.002 | −0.002 | −0.002 |
| Rm-Rf | −0.254*** | −0.226*** | −0.179*** | −0.067 | −0.061 | 0.017 | −0.028 | −0.039 | −0.048 |
| SMB | 0.087 | 0.056 | 0.056 | 0.090 | 0.083 | 0.063 | −0.012 | 0.002 | −0.004 |
| HML | −0.079 | −0.043 | −0.345*** | −0.558*** | −0.550*** | −0.692*** | −0.235*** | −0.250*** | −0.123 |
| WML | 0.113 | 0.025 | −0.047 | ||||||
| RMW | −0.584** | −0.049 | 0.257 | ||||||
| CMA | −0.006 | 0.222 | 0.004 | ||||||
| Adj R-squared | 0.172 | 0.175 | 0.223 | 0.390 | 0.385 | 0.378 | 0.125 | 0.120 | 0.129 |
| GPT-4 | Claude | Gemini | |||||||
| α | −0.006*** | −0.006*** | −0.006*** | −0.003 | −0.003 | −0.004 | −0.005* | −0.005* | −0.005* |
| Rm-Rf | 0.160*** | 0.164*** | 0.129** | 0.0814 | 0.087 | −0.008 | 0.189** | 0.208*** | 0.094 |
| SMB | −0.051 | −0.055 | −0.044 | −0.262* | −0.268* | −0.200 | −0.041 | −0.062 | −0.001 |
| HML | −0.444*** | −0.439*** | −0.291*** | −0.702*** | −0.695*** | −0.307** | −0.518*** | −0.493*** | −0.233 |
| WML | 0.016* | 0.022 | 0.077* | ||||||
| RMW | 0.249 | 0.636** | 0.385 | ||||||
| CMA | −0.109 | −0.218 | −0.338** | ||||||
| Adj R-squared | 0.288 | 0.282 | 0.269 | 0.284 | 0.277 | 0.311 | 0.233 | 0.229 | 0.261 |
We investigate this further by focusing on a subsample of large-cap firms: the constituents of the TOPIX100 index (Panel B). In this test, the results diverge dramatically. The alpha for the GPT-4 portfolio now becomes strongly and consistently significant across all asset pricing models. In contrast, the alpha for the Claude portfolio becomes insignificant. The disappearance of the Claude portfolio’s alpha can be explained by its construction. We find that Claude’s sentiment scores result in a highly concentrated long portfolio, with an average of only 8.6 stocks over 10 years. Gemini and GPT sentiment scores, on the other hand, generate more than double the number of stocks. While its signal is detectable in the larger full sample, this concentration makes the portfolio’s return highly sensitive to firm-specific risk, which likely obscures the alpha signal in the equal-weighted TOPIX100 test. This heterogeneity is a key finding, confirming that the sentiment effect is essentially a phenomenon of large-cap stocks and demonstrating that different LLMs capture signals with distinct characteristics.
Adjustment for transaction costs
To assess the real-world implementability of our strategy, we model an investor seeking to exploit the documented anomaly by shorting top-quintile (high-sentiment) stocks and buying bottom-quintile (low-sentiment) stocks. We account for trading frictions by incorporating a conservative 1.5% round-trip transaction cost, an assumption grounded in the empirical findings of Frazzini, Israel & Moskowitz (2018). To embed this cost, we adjust the transaction prices to reflect a “buy high, sell low” scenario: for long positions, we assume the investor buys at a 0.75% higher price and sells at a 0.75% lower price 1 year later. Conversely, for short positions, the investor sells at a 0.75% lower price and buys back at a 0.75% higher price. Since our primary asset pricing tests (Table 3) showed that the strategies based on Tone Ratio, Tone Score, and DeBERTaV2 did not generate significant alpha, we focus this post-cost analysis exclusively on the three LLM-based strategies. The detailed yearly performance for these strategies, net of costs, is presented in Table 7.
| GPT | Claude | Gemini | ||||||||||
|---|---|---|---|---|---|---|---|---|---|---|---|---|
| Year | Long BHR | Short BHR | L/S BHR | Cum. BHR | Long BHR | Short BHR | L/S BHR | Cum. BHR | Long BHR | Short BHR | L/S BHR | Cum. BHR |
| 2014 | 0.370 | 0.325 | 0.045 | 0.045 | 0.253 | 0.376 | −0.124 | −0.124 | 0.297 | 0.303 | −0.006 | −0.006 |
| 2015 | −0.127 | −0.244 | 0.116 | 0.161 | −0.222 | −0.331 | 0.110 | −0.014 | −0.140 | −0.247 | 0.107 | 0.101 |
| 2016 | 0.384 | 0.195 | 0.189 | 0.350 | 0.347 | 0.193 | 0.153 | 0.139 | 0.376 | 0.216 | 0.160 | 0.261 |
| 2017 | 0.037 | 0.177 | −0.140 | 0.210 | 0.100 | 0.093 | 0.007 | 0.147 | 0.060 | 0.159 | −0.099 | 0.162 |
| 2018 | −0.084 | −0.079 | −0.005 | 0.205 | −0.074 | −0.054 | −0.020 | 0.127 | −0.075 | −0.070 | −0.004 | 0.157 |
| 2019 | 0.012 | 0.111 | −0.098 | 0.107 | 0.022 | 0.055 | −0.033 | 0.093 | −0.065 | 0.203 | −0.268 | −0.111 |
| 2020 | 0.314 | 0.163 | 0.151 | 0.258 | 0.291 | 0.058 | 0.233 | 0.327 | 0.359 | 0.232 | 0.128 | 0.017 |
| 2021 | 0.020 | −0.078 | 0.098 | 0.356 | 0.014 | −0.117 | 0.132 | 0.458 | 0.034 | −0.174 | 0.208 | 0.225 |
| 2022 | 0.158 | 0.261 | −0.103 | 0.253 | 0.199 | 0.208 | −0.009 | 0.449 | 0.123 | 0.276 | −0.153 | 0.073 |
| 2023 | 0.236 | 0.149 | 0.087 | 0.340 | 0.264 | 0.132 | 0.131 | 0.581 | 0.192 | 0.087 | 0.105 | 0.178 |
The table breaks down the annual buy-and-hold returns by long-only, short-only, and combined long-short portfolios for each LLM-based strategy. The results show that even after accounting for significant trading frictions, the strategies based on GPT-4 and Claude sentiment remain profitable over the whole sample period, generating cumulative returns of 34.0% and 58.1%, respectively. This confirms that the predictive power of the advanced LLMs is not only statistically significant but also robust enough to represent a viable trading strategy under realistic cost assumptions.
Exclusion of the 2023 sample
To ensure our results are not driven by the change in the sample universe following the 2022 TSE market reform, we perform an additional robustness check. We re-run our main asset pricing tests on a sample that excludes the 2023 data, using only the consistent TSE First Section sample from 2014–2022. We confirm that all our main findings, including the statistically significant negative alphas for the GPT-4 and Claude portfolios, remain qualitatively unchanged. This indicates that our conclusions are robust and not contingent on the inclusion of the final year’s Prime Market data.
Conclusions
This study set out to examine whether advanced large language models can extract return-predictive information from Japanese 10-K reports, challenging the weak form of the Efficient Market Hypothesis proposed by Fama (1970). By constructing value-weighted long-short portfolios based on sentiment scores extracted through six different methods—including traditional Bag of Words approaches like Tone Ratio, Tone Score and DeBERTaV2, as well as state-of-the-art LLMs such as GPT-4, Claude, and Gemini—we found compelling evidence that sophisticated LLMs can indeed capture sentiment information that predicts future stock returns.
Our results reveal that portfolios based on sentiment scores from GPT-4 and Claude generated significant negative alphas, even after adjusting for common risk factors using the Fama-French three-factor, Carhart four-factor and Fama-French five-factor models. This indicates that these LLMs can extract nuanced information from corporate disclosures that is not fully incorporated into stock prices at the time of reporting. In contrast, traditional sentiment analysis methods did not produce significant alphas, suggesting they are less effective in capturing return-predictive sentiment. These findings have important implications for investors, financial analysts, and the broader understanding of market efficiency. The ability of advanced LLMs to uncover predictive signals from publicly available information suggests that markets may not be as efficient as the EMH posits, at least in the context of the Japanese stock market during our sample period. This challenges traditional asset pricing models and highlights the potential for integrating advanced NLP technologies into investment strategies and risk management practices.
One avenue for future research lies in disentangling the sources of these differences. Although we observe that certain LLMs—most notably GPT-4 and Claude—generate sentiment measures predictive of returns, we do not fully understand the underlying reasons for their superior performance. It remains uncertain whether their advantage stems from the depth and breadth of their training data, the sophistication of their model architectures, or the way in which these models capture and encode language patterns within the MD&A text. Exploring these dimensions is critical for refining our understanding of how textual signals correlate with financial outcomes. Additionally, the heterogeneity in predictive power across different models raises fundamental questions about the nature of the information embedded within corporate disclosures. Future research could also explore alternative models of sentiment. While our study focuses on the polarity model, applying dimensional analysis—which captures finer-grained emotions such as valence and arousal—to financial disclosures is a promising avenue for future work that could yield deeper insights into market psychology.
Furthermore, this study’s findings are subject to specific boundary conditions that open new avenues for research. Our analysis is confined to the Japanese market, which exhibits unique characteristics. A crucial next step would be to test the generalizability of our contrarian finding by applying the same methodology to other international markets, such as the U.S., which may exhibit different investor reactions. Additionally, as the adoption of LLMs in finance becomes ubiquitous, the predictive power of anomalies like the one identified here may decay over time, an issue known as signal decay. Future work could therefore track this strategy’s performance to investigate the dynamics of market efficiency in the age of artificial intelligence. While our study provides evidence that some LLM-based sentiment measures capture return-predictive information in the Japanese market, it also reveals these important gaps in our understanding, paving the way for a rich agenda of future research.
Appendix LLM hyperparameters and prompt details
API settings for large language models
To ensure the reproducibility of our study, this section details the specific models and API hyperparameter settings used for sentiment extraction. It is important to note that our prompt strictly instructs the models to return only two numbers (a positive and a negative score) and to refrain from generating any narrative text. Consequently, hyperparameters that primarily control the creativity and linguistic diversity of generated sentences, such as presence_penalty and frequency_penalty, are largely irrelevant to our specific task. However, we specified parameters like a low temperature and top_p across all models to ensure that the numerical output is as deterministic and consistent as possible, which is crucial for a research context. Table A1 summarizes the settings employed for GPT-4o-mini, Claude 3 Haiku, and Gemini 1.5 Flash.
| Hyperparameter | |||
|---|---|---|---|
| GPT-4o-mini | Claude 3 Haiku | Gemini 1.5 Flash | |
| Model names | gpt-4o-mini-2024-07-18 | claude-3-haiku-20240307 | gemini-1.5-flash |
| Temperature | 0.3 | 0.3 | 0.3 |
| top_p | 0.5 | 0.5 | 0.5 |
| max_tokens | 500 | 500 | 500 |
| presence_penalty | 0.5 | N/A | N/A |
| frequency_penalty | 0.0 | N/A | N/A |
| Notes on hyperparameters: | |||
| • temperature: Controls the randomness of the output. A lower value, such as the 0.3 used here, makes the model’s responses more deterministic and focused. | |||
| • top_p: Controls the nucleus sampling, restricting the model’s word selection to a cumulative probability mass of P. It is often used in conjunction with temperature. | |||
| • max_tokens: Sets the maximum number of tokens (words and punctuation) that the model can generate in its response. | |||
| • presence_penalty (GPT-specific): Penalizes new tokens based on whether they have appeared in the text so far, encouraging the model to introduce new topics. | |||
| • frequency_penalty (GPT-specific): Penalizes new tokens based on their existing frequency in the text, discouraging the model from repeating the exact words or phrases. | |||
| • N/A: Indicates that the parameter is not applicable or was not specified for the given model’s API. | |||
Prompt for LLM sentiment scoring
The same standardized prompt was used for GPT-4o-mini, Claude 3 Haiku, and Gemini 1.5 Flash to generate sentiment scores. The prompt was provided to the models in Japanese to analyze the original Japanese 10-K report texts. The original prompt is presented below, followed by an English translation for clarity.
Original Japanese prompt
あなたは証券アナリストです.以下の企業の開示情報を読み、文脈も考慮して、positive_sentiment_scoreとnegative_sentiment_scoreを合計100になるように算出しなさい˚
ルール)
フォーマットは以下で出力しなさい.positive_score: X (0–100), negative_score: Y (0–100)
positive_scoreとnegative_scoreは、両方合わせて100になるようにスコアを算出しなさい˚
例を参考にして開示情報の内容全体を漏れなく厳密に評価しなさい˚
理由は出力しないで、positive_score: X (0–100), negative_score: Y (0–100)のみを出力してください˚
• positive_scoreが100の開示情報の例
「セグメント利益は、販売数量の増加により、同247百万円増益の178百万円となりました」
「米国では企業業績や個人消費が堅調に推移し、景気は緩やかに回復しました」
「営業利益は、非鉄金属相場や為替相場の変動に伴うたな卸資産の在庫影響(以下「在庫要因」)が好転し、機能材料部門において主要製品の販売量が増加したこと等により、前連結会計年度に比べて273億円(245.3%)増加の384億円となりました」
「期間限定で東京駅一番街にオープンした当社初のアンテナショップ「パティスリーブルボン」では、特別に仕立てたクッキーの限定商品「ラングレイス」や「ルマンドアソート」などに大きな反響をいただきました」
「セグメント利益は、のれん償却費3億 33 百万円を計上したものの、上記要因に伴う営業利益の増加に加え、飲食用資材分野における原材料価格の下落などにより、9億45百万円と前年同期比2億41百万円(34.3%)の増益となりました」
• negative_scoreが100の開示情報の例
「建築用塗料を取扱う塗料部門におきましては、新築向け市場及びリフォーム向け市場とも、工事を伴う施工棟数が前年度に比べ伸び悩んだことなどにより、売上高は減少いたしました」
「この結果、売上高は126億17百万円(同4.8%減)となり、営業利益は7億40百万円(同11.2%減)となりました」
「即席麺部門は、製造ラインの移設に伴う稼働率の低下と受託が低調に推移し、また、3月に製造ラインを増設しましたが、売上の寄与は低く、売上高は7,085百万円と前年同期と比べ659百万円(8.5%)の減収となり、セグメント利益(営業利益)は204百万円と前年同期と比べ219百万円(51.8%)の減益となりました」
「しかしながら、資材費や労務費のコストが高止まりする中で、北海道 ▪ 東北地区の集中豪雨の影響により、公共工事の優先順位が入れ替わり、当初予定されていた工期が先延ばしになるなど、当社を取り巻く経営環境は厳しい状況で推移しました」
「当事業年度におけるわが国経済は、政府による経済政策や金融政策の総動員もあり、緩やかな回復基調となったものの、個人消費や設備投資は力強さを欠き、海外経済の減速と為替、原材料価格の変動リスクを抱え、先行き不透明な状況が続いた」
English translation
You are a securities analyst. Please read the following corporate disclosure and, considering the context, calculate a positive sentiment score and a negative sentiment score so that they sum to 100.
Rules
Output in the following format: positive_score: X (0–100), negative_score: Y (0–100)
Ensure that positive_score and negative_score sum to 100.
Evaluate the entire content of the disclosure information thoroughly and precisely, referencing the examples.
Do not output any reasoning; only output the scores in the format positive_score: X (0–100), negative_score: Y (0–100).
Examples of disclosures with positive_score: 100
“Segment profit increased by 247 million yen over the same period last year to 178 million yen due to an increase in sales volume.”
“In the United States, corporate earnings and personal consumption remained strong, and the economy recovered moderately.”
“Operating income increased by 27.3 billion yen (245.3%) from the previous fiscal year to 38.4 billion yen, due to factors such as a favorable turn in inventory impact from non-ferrous metal and foreign exchange market fluctuations, and an increase in sales volume of major products in the functional materials division.”
“Our first pop-up shop, ‘Pâtisserie Bourbon,’ opened for a limited time at Tokyo Station’s First Avenue, received a great response for its specially crafted limited-edition cookies ‘Langlaze’ and ‘Lumonde Assortment’.”
“Although goodwill amortization of 333 million yen was recorded, segment profit increased by 241-million-yen (34.3%) year-on-year to 945 million yen, due to the increase in operating income from the factors above, as well as a decline in raw material prices in the food and beverage materials sector.”
Examples of disclosures with negative_score: 100.
“In the paint division, which handles architectural coatings, net sales decreased due to sluggish growth in the number of construction projects for both the new construction and renovation markets compared to the previous fiscal year.”
“As a result, net sales decreased to 12,617 million yen (a 4.8% decrease from the same period last year), and operating income decreased to 740 million yen (an 11.2% decrease from the same period last year).”
“The instant noodle division experienced a decrease in revenue of 659 million yen (8.5%) year-on-year to 7,085 million yen, and segment profit (operating income) decreased by 219 million yen (51.8%) to 204 million yen, due to a decline in operating rates from the relocation of production lines and sluggish contract manufacturing. Additionally, a new production line was added in March, but its contribution to sales was low.”
“However, while material and labor costs remained high, the business environment surrounding our company remained challenging, as the priority of public works projects shifted due to the impact of torrential rains in the Hokkaido and Tohoku regions, leading to the postponement of originally scheduled construction periods.”
“During this fiscal year, Japan’s economy showed a moderate recovery trend, partly due to the full mobilization of government economic and financial policies. However, personal consumption and capital investment lacked strength. With the risks of a slowdown in overseas economies and fluctuations in exchange rates and raw material prices, the outlook remained uncertain.”