
A decision support framework for optimizing career path prediction and vocational mobility of college graduates
- Published
- Accepted
- Received
- Academic Editor
- Massimiliano Fasi
- Subject Areas
- Algorithms and Analysis of Algorithms, Artificial Intelligence, Data Mining and Machine Learning, Data Science, Optimization Theory and Computation
- Keywords
- Career path, Decision-making, Interval-valued spherical fuzzy sets, MARCOS method, Vocational mobility
- Copyright
- © 2025 Amin et al.
- Licence
- This is an open access article distributed under the terms of the Creative Commons Attribution License, which permits unrestricted use, distribution, reproduction and adaptation in any medium and for any purpose provided that it is properly attributed. For attribution, the original author(s), title, publication source (PeerJ Computer Science) and either DOI or URL of the article must be cited.
- Cite this article
- 2025. A decision support framework for optimizing career path prediction and vocational mobility of college graduates. PeerJ Computer Science 11:e3345 https://doi.org/10.7717/peerj-cs.3345
Abstract
Vocational mobility (VM) is one of the most definitive and determinative factors in career advancement and flexibility, especially for college graduates starting their careers in competitive job markets. Previous strategies for modelling career paths cannot incorporate uncertainty and variability into decisions and consequently tend to provide imprecise assessments. To address these shortcomings, this article introduces an effective decision support system based on the interval-valued spherical fuzzy MARCOS (IVSF-MARCOS) method, integrated with multi-criteria group decision-making (MCGDM). This will enable the model to systematically combine different and disparate expert judgments, allowing it to deal with imprecise, vague, or incomplete information in complex decisions involving the environment. The judgments of five decision-makers are used to assess fifteen career options based on ten factors, including potential income, employment security, advancement opportunities, and market saturation levels. The proposed model has fewer uncertainties and higher levels of precision and accuracy in handling the findings, unlike traditional models of decision-making. The study’s practical implications are presented in the form of a ranking of career fields relevant to individuals and market needs. With the help of research that utilizes the IVSF-MARCOS method as an integral part of a larger study conducted within an MCGDM framework, this study contributes to the theory of career path prediction and VM by proposing a new decision-support process capable of managing uncertainty and group evaluation.
Introduction
Background
Vocational mobility (VM), which means the freedom of individuals to move easily from one opportunity to another, is an essential factor that enhances personal career development within a volatile job market (Mavlankulovich, 2024). The emergence and continued growth of various industries due to globalization and technological advancements have compounded the need for college graduates to provide reasoned actions while making multi-step career choices. This adaptability enables people to pursue their desired career choices and enhances the global workforce. However, evaluating VM is more complex and involves frameworks that capture objective and perceptual factors on career choices.
Conventional methods of assessing VM sometimes fail to depict the multifaceted systems that characterize career changes adequately. These methods are especially limited by linear models or single evaluation criteria, which are insufficient for complex business environment situations. Furthermore, current tools that use prediction are inadequate in handling situations involving a large amount of ambiguity or missing data in parts. Although more recent studies have contributed to the growth in organizing careers, a common drawback of these studies is their focus on real-world uncertainty and group decision-making. For example, Yamashita et al. (2022) employed a machine learning methodology to predict the careers of individuals, but did not consider MCGDM input. On the same note, Du & Zhao (2025) presented a neutrosophic MCDM approach in vocational assessment; however, it does not provide a thorough modeling of group agreements and struggles with processing incomplete and unclear data. Conversely, the IVSF-MARCOS model, introduced within the MCGDM framework, addresses these gaps and constitutes a combination of MARCOS’s well-established decision-making ability and the model’s capacity to address the ambiguity of the IVSFS, while incorporating the views of multiple experts.
In this context, fuzzy sets (FS) were developed by Zadeh (1965) in 1965 and provide a theoretical foundation for working with fuzziness and uncertainty in decision-making operations. FS allows membership degrees (MD) of components; in this sense, it handles fuzzy, or imprecise, information better than classical sets. Later on, as part of its development, intuitionistic fuzzy sets (IFS), introduced by Atanassov (1986), were enhanced with a non-membership degree (NMD) to assess the degree of uncertainty better. Later, the Pythagorean fuzzy sets (PyFS) (Yager, 2013) and q-rung orthopair fuzzy sets (q-ROFS) (Yager, 2017) gained more flexibility to address the situation when a higher order of uncertainty is required. In the case under consideration, picture fuzzy sets (PFS) (Cuong, 2015) offer the abstinence degree (AD) as a more convenient approach for decisions concerning neutrality or those with some uncertainties. This led to the development of extensions to fuzzy sets, specifically spherical fuzzy sets (SFS) (Mahmood et al., 2019), which find particularly suitable applications in multidimensional settings. A more recent extension of this framework is the introduction of interval-valued spherical fuzzy sets (IVSFS) (Aydoğdu & Gül, 2022), which further expand the scope of this framework by expressing these values as intervals, thereby implying an even higher degree of uncertainty and complexity in decision-making. The use of added complexity is particularly warranted in our study, as it ensures the closer modeling of the vaguely hesitant and fact-opposing judgments provided by various experts assessing VM.
This research employs the developed IVSF-MARCOS approach within an MCGDM environment to measure VM. The proposed model encompasses five decision-makers, fifteen alternatives, and ten criteria, providing a more comprehensive method for assessing vocational mobility and forecasting suitable career patterns. The IVSF-MARCOS approach handles uncertainties more effectively, provides more accurate decisions, and is more adaptable to complex real-world problems than traditional methods. Thus, by analyzing large amounts of data and addressing uncertain situations that frequently arise in decision-making processes, IVSF-MARCOS operates efficiently. Although the suggested framework has not introduced any methods, such as those discussed in social network-based group decision-making approaches (Cao et al., 2025) and trust propagation models (Gai et al., 2025), it could be responsible for overcoming reluctance and conflict by leveraging the expressive power of IVSFS. It enables the decision-makers to present incomplete, ambivalent, or uncertain information and minimizes the intragroup conflict. A clear definition of all abbreviations used in the entire manuscript has been provided in Table 1.
| Abbreviation | Full form |
|---|---|
| VM | Vocational mobility |
| MCGDM | Multi-criteria group decision-making |
| MARCOS | Measurement alternatives and ranking according to the compromise solution |
| FS | Fuzzy set |
| IFS | Intuitionistic fuzzy set |
| PyFS | Pythagorean fuzzy set |
| q-ROFS | q-rung orthopair fuzzy set |
| PFS | Picture fuzzy set |
| SFS | Spherical fuzzy set |
| IVSFS | Interval-valued spherical fuzzy set |
| MD | Membership degree |
| AD | Abstinence degree |
| NMD | Non-membership degree |
| RD | Refusal degree |
| IVSFVs | Interval-valued spherical fuzzy values |
| IVSFWA | Interval-valued spherical fuzzy weighted averaging operator |
| IVSF-MARCOS | Interval-valued spherical fuzzy-MARCOS |
Research gap and motivations
Describing VM as a critical predictor of career success and work adjustment among college graduates, this study seeks to assess how developments such as work, advanced technology, and a changing economy influenced applicants’ scores on both scales in the context of the college-to-work transition. Although the importance of VM in workforce development is continually increasing, the majority of existing studies have examined the subject matter in only slight depth or in an evaluation tool that is already methodically confined, which fail to incorporate multiple evaluative criteria or capture the diversity of stakeholder perspectives. Specifically, these methods are weak when it comes to managing the vagueness, unpredictability, and imprecision that is part of the real-world decision environment.
Based on these research gaps, this study proposes a comprehensive decision-support model for assessing vocational mobility and also considers the benefits of employing IVSFS. By integrating the MARCOS method within an MCGDM framework, the presented approach delivers robust and context-sensitive career choice recommendations. This innovative methodology meets this need and provides graduates, educators, and policymakers with practical solutions to improve VM.
Significance of the study
The significance of this study lies in its ability to address the critical challenges faced by college graduates: ensuring job seekers make sound career decisions within the current and preparing environment, and in a competitive world. Another essential concept is VM, which implies readiness and the possibility of changing from one type of job or career to another; this is important to graduates in search of meaningful and sustainable careers. However, traditional methods of assessing VM and forecasting career development do not always allow for capturing this choice’s multiple and stochastic character. Consequently, this study presents a systematic and comprehensive solution by proposing a decision support model based on the IVSF-MARCOS method within the MCGDM framework. These features enable the consideration of multiple criteria, facilitate the evaluation of decision-makers’ perceptions, account for uncertainty, and deliver accurate and practical results.
Objectives and contributions
The study is informed by the emerging reality that there is a dire need to help college graduates make informed career choices by fixing some uncertainty in VM evaluations. The general purposes of the research are:
To determine how current theoretical models in career path prediction fail to address imprecision and the lack of information, among other limitations.
To suggest a unified decision-making system based on the IVSF-MARCOS approach in an MCGDM context.
To decide on various career options based on the synergy of multiple decision-makers and a wide range of criteria, thereby providing a solid and circumstantial career path application.
To give good, practical, and on-the-ground information to the graduates, teachers, and policymakers by tapping the power of fuzzy logic in dealing with matters of vagueness and ambiguity.
The key contributions of this study are as follows:
Integration of VM and career path prediction: The research fills the gap between VM research and career option forecasting and creates a common framework for holistically assessing career options.
Application of IVSF-MARCOS method: A new development of the IVSF-MARCOS method is proposed due to its effectiveness in dealing with vagueness and fuzziness in decision-making. This enhances the accuracy and reliability of the results, thereby improving the model’s applicability.
MCGDM framework: The model’ also considers decision-makers’ views by involving five decision-makers in assessing fifteen alternatives based on ten criteria.
Actionable insights for stakeholders: This study’s implications can be helpful to graduates, educators, and policymakers in making appropriate decisions if needed and planning for the best operations to enhance VM.
Advancement of decision science methodologies: This study enriches the existing knowledge of decision science by applying IVSFS and the MARCOS method to the domain of VM and concerns for career development.
Through these contributions, this study not only addresses the mentioned drawbacks but also presents a valuable tool to enhance the career choices of college graduates.
Organization of study
The remainder of this article is structured as follows: ‘Literature Review’ presents a literature review that includes VM, career prediction, and the MARCOS method. ‘Preliminaries’ describes the preliminaries of IVSFS, while ‘IVSF-MARCOS Method’ discusses the IVSF-MARCOS methodology. ‘Case Study: Vocational Mobility of College Graduates’ assesses VM with an emphasis on determining the career path and theoretical implications of the study. ‘Comparison Analysis’ presents the comparison findings, performs a sensitivity analysis, and discusses the study’s practical implications, limitations, and advantages. ‘Conclusion’ concludes the article with future research directions.
Literature review
It is essential to review the existing literature to understand the methodologies and frameworks used in analyzing VM, forecasting career paths, and incorporating the MARCOS method into the decision-making process. This section is organized into three subsections: literature involving the use of VM of college graduates, career path prediction literature, and literature using the MARCOS method.
Studies integrating vocational mobility of college graduates
VM has garnered significant attention due to its implications for careers and economic security. Previous studies focused on occupational and spatial mobility, including graduates from college and vocational schools, as well as vocational employment in specific areas. Hence, Oliveira, Moutinho & Afonso (2024) have drawn attention to the differences in employment conditions between college students and graduates of vocational schools, highlighting the impact of supply and demand factors. Mobility programs, as described by Salukvadze & Golubchikov (2016), aimed at widening global opportunities, appear to foster soft skills and employability among vocational college learners. Furthermore, Yakhina et al. (2016) provide practical recommendations on how to build readiness for occupational mobility based on the results of the education received. Yue and her colleagues present the work on postgraduate choices based on student mobility in Huang & Jung (2024). The present work by Schwartz (2016) describes pathways that enhance equity and occupational mobility, noting that vocational education systems play a role in facilitating upward mobility. Last but not least, the spatial mobility of higher education graduates (Venhorst, Van Dijk & Van Wissen, 2011) raises an essential aspect of relocation among college graduates and their connections between residential and occupational spaces.
Studies integrating career path prediction
Career mapping is the art of predicting or envisioning possible career progress for individuals in light of their skills, interests, and the market. The latest developments in career dynamics have incorporated multiple strategies, including artificial intelligence, machine learning, and theory. For instance, Kosaraju et al. (2025) introduce a new strategy of bending career counseling via machine learning to help students gain insight into the proper choice of careers. In the same regard, Kaddoura, Popescu & Hemanth (2022) provide an extensive analysis of machine learning models in career path forecasting, highlighting their significance in enhancing precision and efficiency in decision-making. The latest research in using large language models, including the study by Adhikary (2016), also presents high levels of confidence in forecasting career readiness. Kokkodis & Ipeirotis (2021) design demand-aware career path recommendations from a reinforcement learning perspective, integrating them to accommodate changing labor market demands. Furthermore, Miller (2008) investigate the moderating effect of career decision self-efficacy, which connects emotional intelligence with career adaptability. At a tactical level, Sydler, Haefliger & Pruksa (2014) examine how planning affects the criterion-related validity of the expected career trajectory. In the article by Güler & Emir (2024), educational data mining is explored to develop models of career prediction that include explain ability for better student navigation. Additionally, Fletcher et al. (2014) investigate career pathways and job satisfaction, providing a better understanding of motivation and its predictors.
Studies integrating the MARCOS method
The Measurement Alternatives and Ranking According to the Compromise Solution (MARCOS) method has become one of the most powerful multi-criteria decision-making (MCDM) techniques in applications due to its provisions for assessing alternatives against ideal and anti-ideal solutions. The MARCOS method has been used and extended with fuzzy logic to solve generalized decision-making problems in various fields. Stanković et al. (2020) proposed a fuzzy MARCOS model to analyze the risk of road traffic in uncertain conditions, aiming to enhance the distinctiveness of fuzzy sets. When applied to assess sustainable suppliers, as done by Boral et al. (2020), this approach was described as having high usefulness for supply chain management. Later, Bakır & Atalık (2021) concurrently applied fuzzy MARCOS with AHP to measure service quality in airline companies. Moreover, Büyüközkan, Havle & Feyzioğlu (2021) proposed an integrated SWOT-based fuzzy MARCOS model that may improve trajectories of sustainable transportation planning. In waste management, Ali (2022) has introduced a promising fuzzy MARCOS application for scoring solid waste systems. Failure modes in engineering systems have been analyzed by Boral et al. (2020) by using the fuzzy MARCOS method, whereas Ali (2021) has developed an advanced CRITIC-MARCOS framework with spherical fuzzy sets. Nila, Pamucar & Roy (2024) noted that the MARCOS method can be employed to analyze drone-based city logistics using spherical fuzzy criteria. In the last case, Wang et al. (2024) employed the Pythagorean fuzzy CRITIC-MARCOS method to select sustainable food suppliers, suggesting that this type of approach may be effective in highly uncertain situations. Recent research developments in the MCGDM literature have introduced advanced fuzzy models. Das & Granados (2023) presented the concept of IFP-intuitionistic multi-fuzzy N-soft sets, whereas Das & Granados (2022) presented a concept of fuzzy parameterized intuitionistic fuzzy soft multisets to the group decision-making problem. Das et al. (2025) made use of a fuzzy MCDM model in environmental analysis, whereas previous studies by Mukherjee & Das (2015a, 2015b) made use of interval-valued intuitionistic fuzzy soft sets in a bid to make investment decisions. The mentioned models, however, are conventionally deficient in representing both topic uncertainty and the subjectivity of groups simultaneously. IVSF-MARCOS is the solution we have proposed to address this issue by combining interval-valued spherical fuzzy information with MARCOS, which presents a more helpful solution to complex MCGDM problems, such as VM assessment. To clearly outline the novelty of the proposed study and determine the motivation, Table 2 includes a comparative summary of the literature reviewed and the related research gaps.
| Study area | Key contributions | Identified research gap |
|---|---|---|
| VM of college graduates | Focused on spatial/occupational mobility, readiness for employment, and policy/program impacts (e.g., Oliveira, Moutinho & Afonso, 2024; Yakhina et al., 2016) | Lack of structured decision-making models that quantify and prioritize vocational mobility for career planning. |
| Career path prediction | Utilized AI, ML, and psychological constructs for career forecasting (e.g., Kosaraju et al., 2025; Kaddoura, Popescu & Hemanth, 2022) | Most models lack interpretability, fail to integrate expert-driven criteria, and fail to account for uncertainty. |
| MARCOS method in MCDM | Applied to diverse fields with extensions using fuzzy sets (e.g., Boral et al., 2020; Ali, 2022; Wang et al., 2024) | No prior integration with interval-valued spherical fuzzy sets for career-related decision-making. |
| Advanced fuzzy MCDM models | Developed with soft sets, intuitionistic fuzzy models, etc. (e.g., Das & Granados, 2023; Das et al., 2025; Mukherjee & Das, 2015a) | These models fail to capture group decision uncertainty and interval-valued expert judgments simultaneously. |
Preliminaries
The concept of FS, initially proposed by Zadeh (1965), is one of the mathematical frameworks for handling uncertainty. Conversely, it is ineffective for NMD or ambiguity in ambiguous environments, while it performs well for MD in such circumstances. Atanassov (1986) proposed a novel IFS method to overcome these limitations. The PFS was developed by Cuong (2015) to address more complicated cases involving indeterminacy and abstinence concerns. To fulfill the goals of FS, PFS includes the AD together with the MD, NMD, and refusal degree (RD). Mahmood et al. (2019) introduced the SFS in 2018. For clarity, a complete list of mathematical notations is provided in Table 3.
| Symbol | Description |
|---|---|
| Membership degree | |
| Abstinence degree | |
| Non-membership degree | |
| Fuzzy sets | |
| Universal set | |
| Elements of universal sets | |
| Weights of decision-makers | |
| Closeness coefficient | |
| Distance measure | |
| Utility degree | |
| Utility function | |
| Criteria weights | |
| Alternatives | |
| Criteria | |
| Decision-makers |
Definition 1: (Mahmood et al., 2019) Let be the universe of discourse involves MD , AD , and NMD . SFS is defined as:
where:
with the conditions that:
(1)
Also, the RD is determined by:
Definition 2: (Aydoğdu & Gül, 2022) Let be the universe of discourse involves MD , AD , and NMD . IVSFS is defined as:
where:
with the conditions that:
(2)
Also, the RD is determined by:
Definition 3: (Aydoğdu & Gül, 2022). Let , be two interval-valued spherical fuzzy values (IVSFVs) and , be any scalar number, then it satisfies the following operations:
-
Additionally, the addition and multiplication of IVSFS can be done using the following procedures.
.
IVSF-MARCOS method
This section details the algorithmic aspects of the proposed IVSF-MARCOS algorithm, which integrates IVSFS within the MCGDM-based framework. The IVSF-MARCOS method aims to handle the uncertainty and vagueness that often occur during complex decision-making processes. It provides a balanced comparison of available alternatives against an ideal (best-case) and an anti-ideal (worst-case) solution. In simple terms, the process works as follows: First, several decision-makers rate each option based on different criteria using soft fuzzy scores. These scores reflect not only yes/no preferences but also varying degrees of agreement, disagreement, and indecisiveness. The method then normalizes and aggregates these evaluations and determines each option’s distance from the best and worst outcomes. The result is a preference ranking that reflects group opinion and uncertainty. A key advantage is its ability to more accurately capture the imprecise and complex nature of human judgment by integrating IVSFS, rather than relying on classical or traditional fuzzy sets. Additionally, MARCOS is selected because it offers more robust and interpretable results when evaluating alternatives against these reference points. These reasons make it an ideal tool for assessing college graduates’ VM, especially when multiple factors and viewpoints must be considered, with minimal or no certainty.
An extensive mathematical description of the IVSF-MARCOS method is provided below to illustrate its structure and overall applicability.
Step 1. Experts evaluate the criteria.
In this step, the preference weights of decision-makers are estimated. These preference weights applied in linguistic assessments of the decision-makers are modeled with IVSFVs. Decision-makers offer linguistic values according to their degree of precision, as well as their expertise in the decision problem. These words of language are translated to equivalent IVSFVs according to Table 4. The decision-makers’ weights are determined using Eq. (3) as follows:
(3)
| Expression | IVSFVs |
|---|---|
| Very important (VI) | |
| Important (I) | |
| Medium (M) | |
| Unimportant (UI) | |
| Very unimportant (VU) |
To support and authenticate the expert weighting program, the methodology is consistent with what has been proposed by Du & Zhao (2025) and Das (2018), who have used a fuzzy soft-based framework to obtain weights in the group decision-making process through the use of weighted linguistic analysis.
Step 2. Create a decision matrix for aggregated IVSF.
The linguistic IVSFVs for the alternative evaluation are shown in Table 5. The aggregated IVSF decision matrix is shown as
(4) where .
| Expression | IVSFVs |
|---|---|
| Extremely good (EG) | ([0.85, 0.95], [0.00, 0.05], [0.05, 0.10]) |
| Very very good (VVG) | ([0.75, 0.85], [0.05, 0.10], [0.10, 0.15]) |
| Very good (VG) | ([0.65, 0.75], [0.10, 0.15], [0.15, 0.20]) |
| Good (G) | ([0.55, 0.65], [0.15, 0.20], [0.20, 0.25]) |
| Medium good (MG) | ([0.45, 0.55], [0.20, 0.25], [0.25, 0.30]) |
| Fair (F) | ([0.35, 0.45], [0.25, 0.30], [0.30, 0.35]) |
| Medium bad (MB) | ([0.25, 0.35], [0.30, 0.35], [0.35, 0.40]) |
| Bad (B) | ([0.15, 0.25], [0.35, 0.40], [0.40, 0.45]) |
| Very bad (VB) | ([0.05, 0.15], [0.40, 0.45], [0.45, 0.50]) |
| Very very bad (VVB) | ([0.00, 0.05], [0.45, 0.50], [0.50, 0.55]) |
Step 3. Determine the best alternatives for IVSF.
is the most significant alternative for the IVSF positive ideal solution (IVSFPIS), whereas is the best alternative for the IVSF negative ideal solution (IVSFNIS).
Step 4. Determine the distance measurements.
The following formulas use and to represent positive and negative distance measures, respectively.
(5)
(6)
Step 5. Calculate the values of the closeness coefficient (CC).
(7)
Step 6. Determine the criteria’s and alternatives’ weights.
After completing steps 5 and 6, we are left with a decision matrix .
Step 7. Make an expanded decision matrix for IVSF.
An extended decision matrix is created by identifying the ideal δI and anti-ideal solutions.
(8)
(I) is the best alternative, and (δI) is the worst. Depending on the kind of criterion, δAI and δI are defined using Eqs. (9) and (10):
(9)
(10)
In terms of criteria, belongs to the minimization group while belongs to the maximizing group.
Step 8. Assemble the normalized IVSF decision matrix.
Equation (11) is used to normalize the previous matrix .
(11)
Step 9. Finding the IVSF weighted matrix using Eq. (12).
(12)
Step 10. By using Eq. (13), the values of the matrix is determined.
(13)
Step 11. Utilizing Eqs. (14) and (15) to determine the utility degrees of various options.
(14)
(15)
Step 12. Using Eq. (16) to determine the utility function of the alternatives, .
(16) where represents the utility function with regard to ( AI), and represents the utility function with respect to ( I). Utility functions regarding the solutions for ( I) and ( AI) have been computed using Eqs. (17) and (18).
(17)
(18)
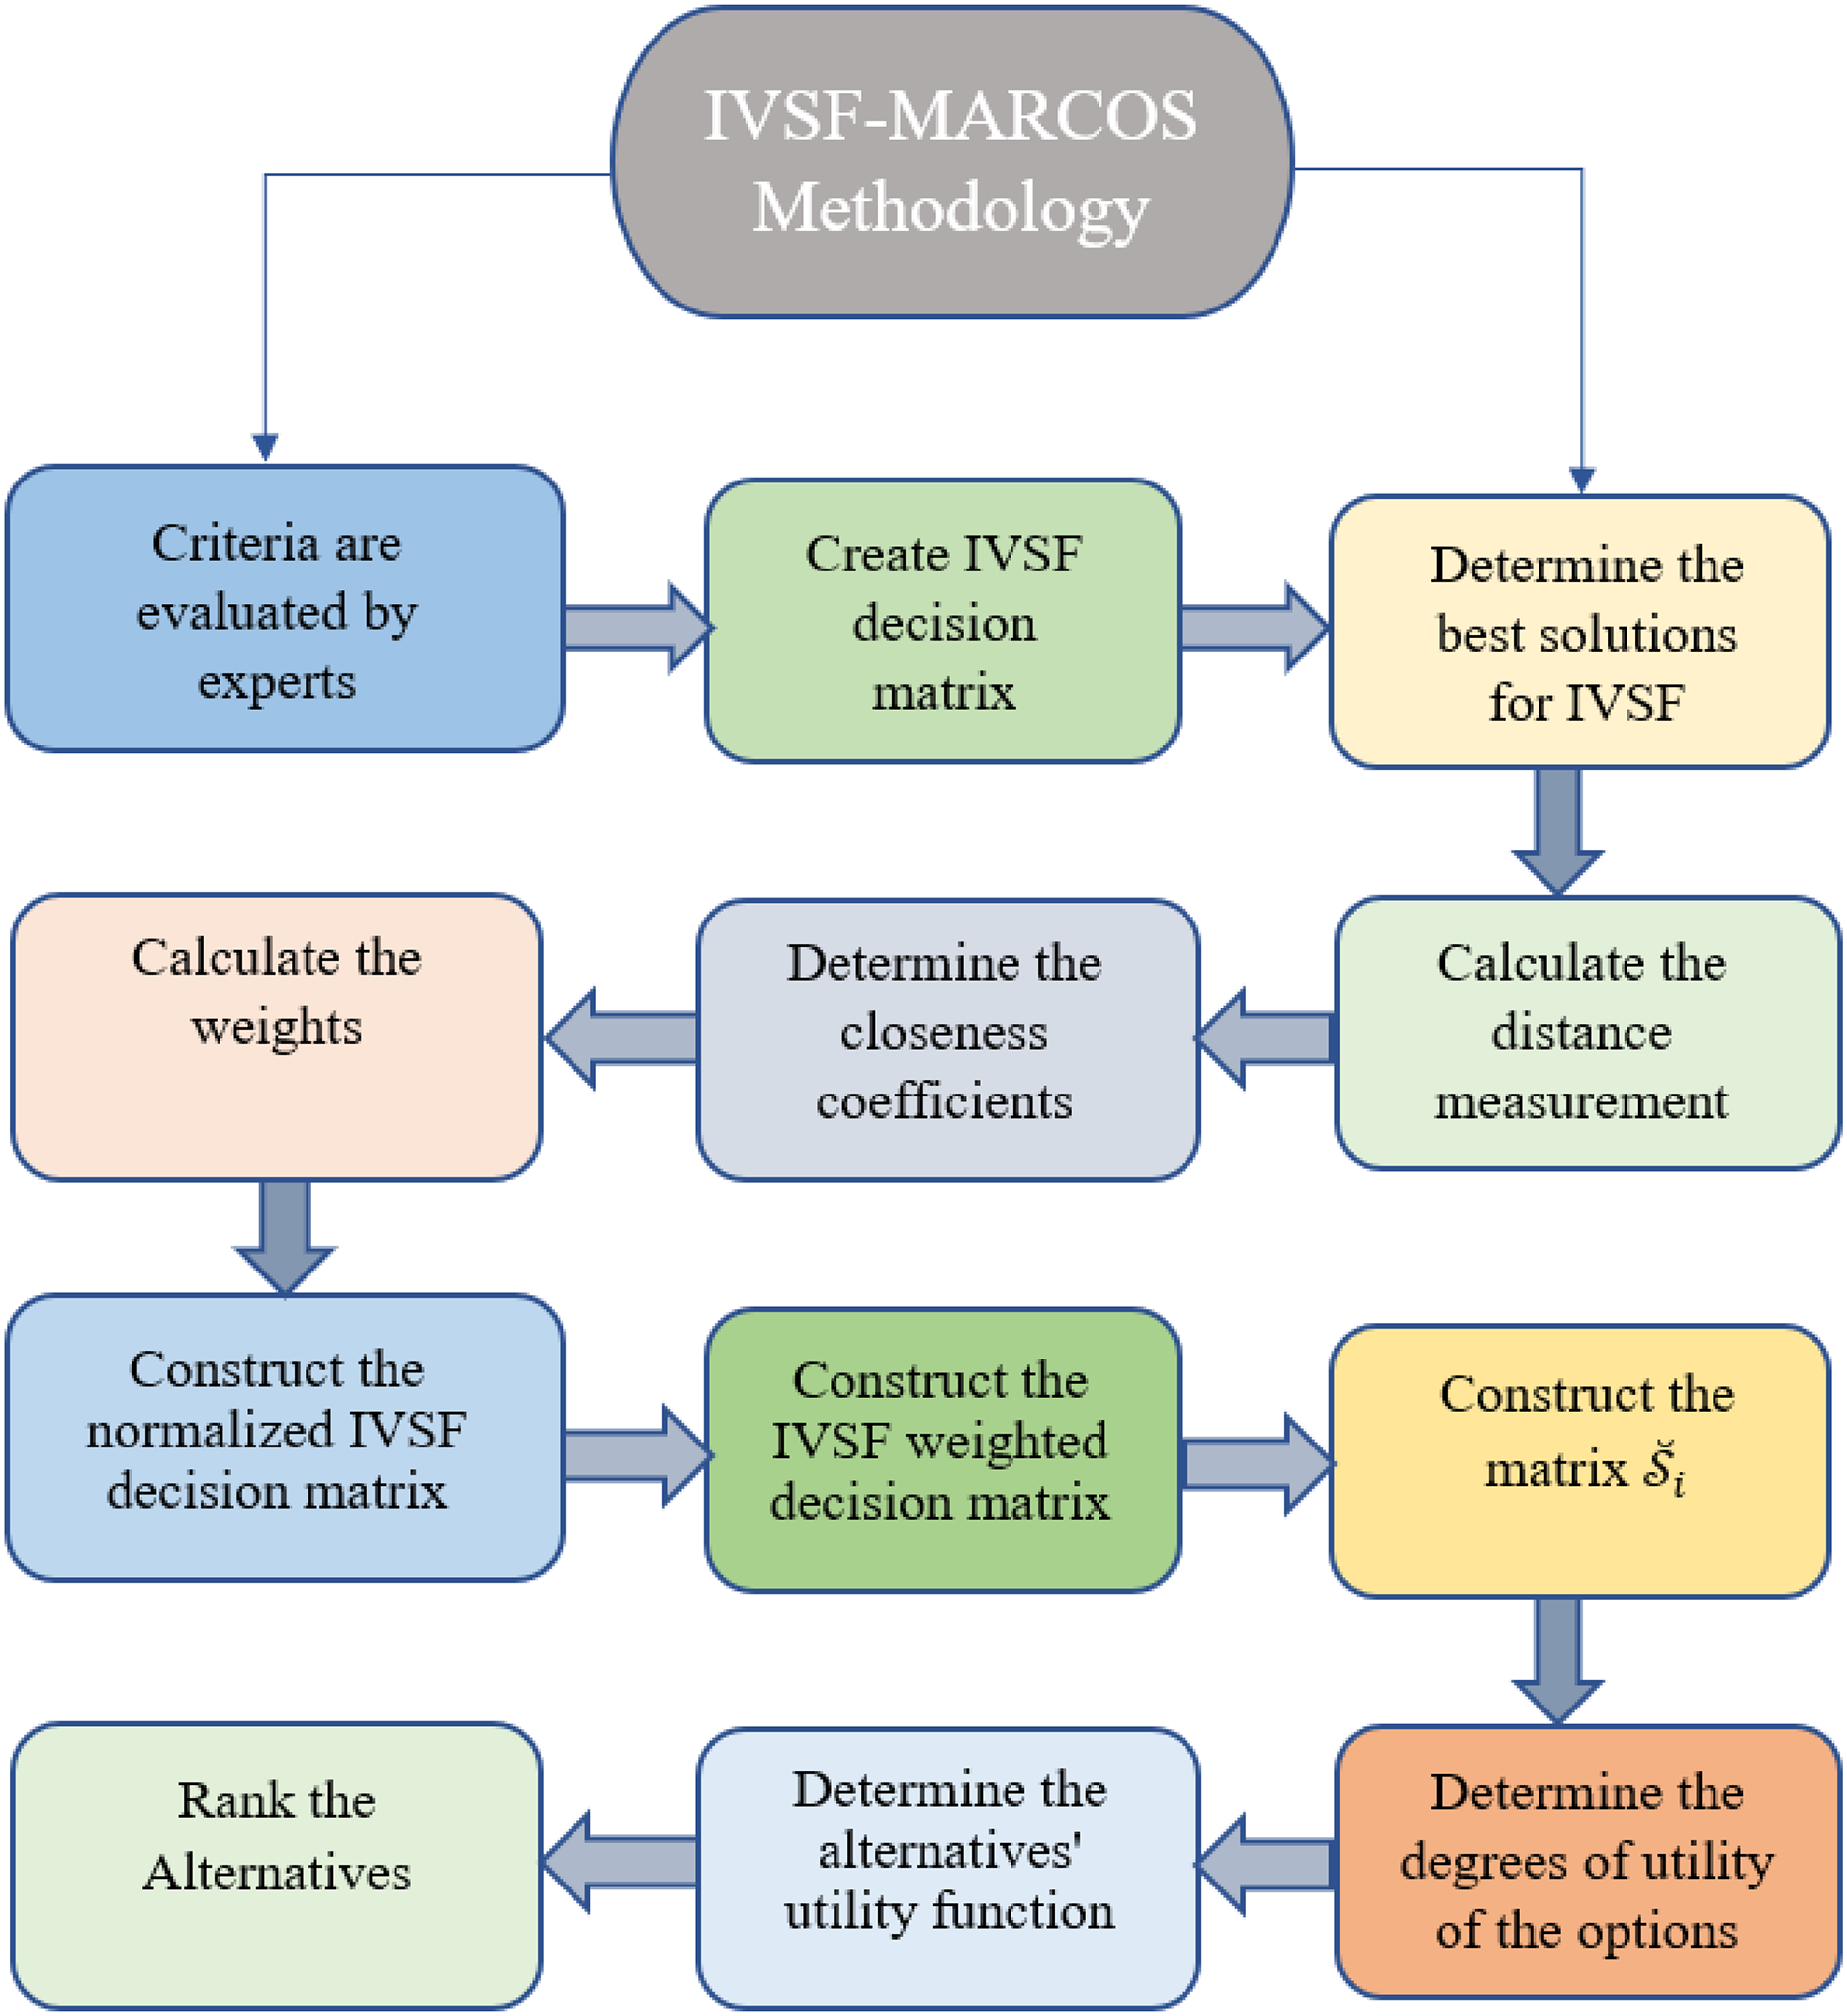
Step 13. Ranking the alternatives. Also, Fig. 1 shows the detailed flowchart of the IVSF-MARCOS methodology.
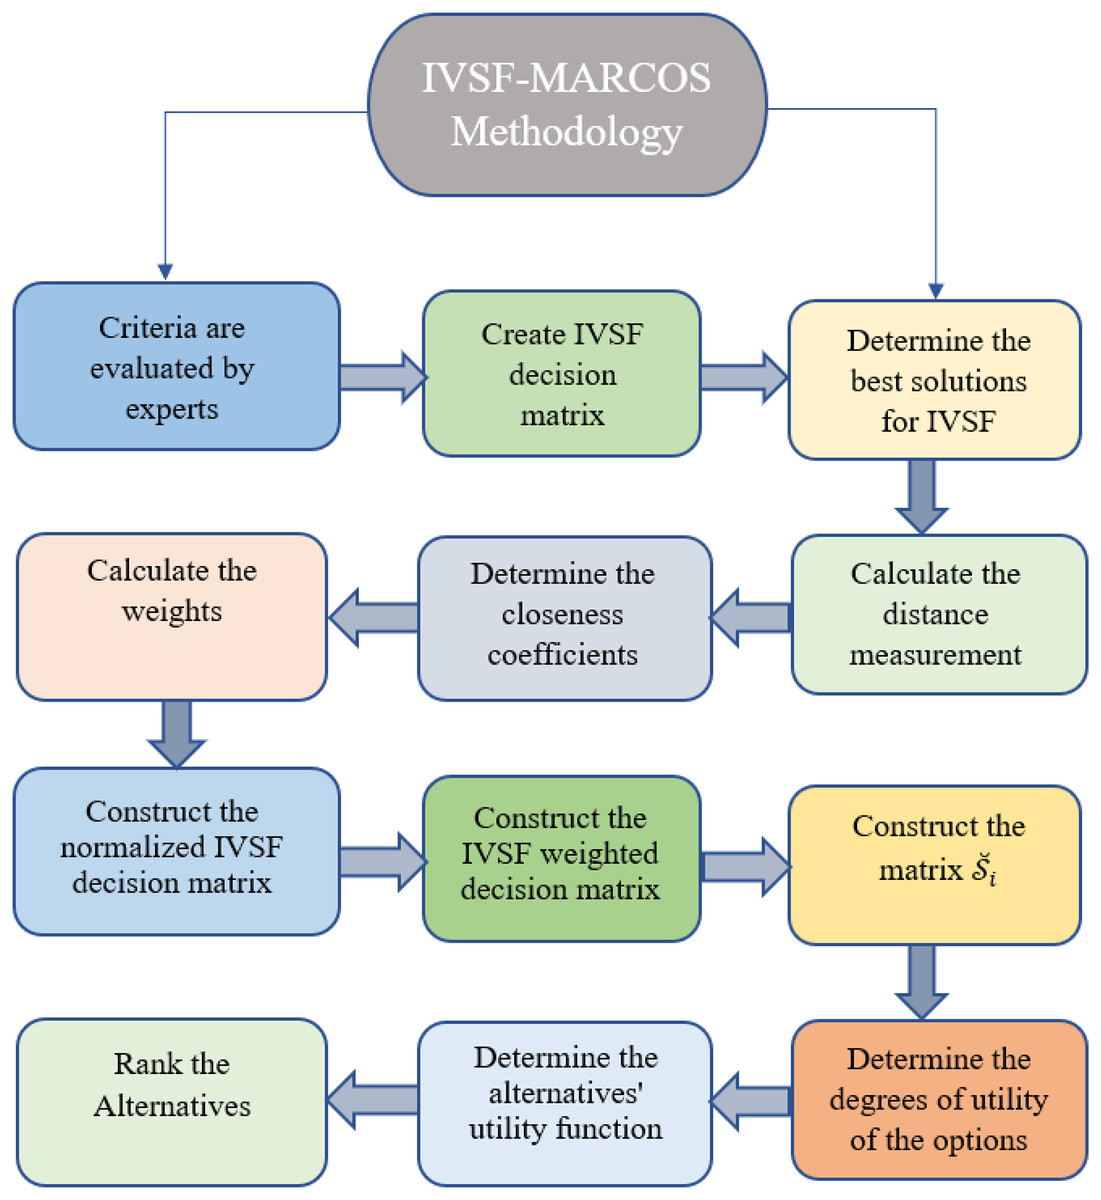
Figure 1: IVSF-MARCOS methodology.
Case study: vocational mobility of college graduates
VM is the flexibility with which people can switch from one path to another, such as job positions and even occupations, based on their competencies, education, or the demands of a fluid market. The importance of VM for college graduates is significant in terms of competition, as it helps convey their ability to secure a job in liquid markets and demonstrate their potential for further romotion. In other words, assessing VM entails evaluating a range of parameters, including the stability of the particular job and the potential for corresponding advancement.
When it comes to MCGDM, VM is defined by the ability to analyze various possibilities (e.g., selecting college graduates’ fields of work), compare these options to important benchmarks, and consider the opinions of multiple decision-makers. This approach minimizes the chances of overlooking key aspects of the decision-making process and highlights details typically involved in a career change. This section applies the IVSF-MARCOS method to evaluate five decision-makers’ assessments of fifteen alternatives (career paths) based on ten criteria. The model aims to provide accurate career advancement forecasts to enhance the VM status of college graduates.
Career path prediction
Career path prediction in VM is a systematic process of identifying suitable career options for graduates in relation to existing choices. To achieve this, five participants with expertise in career counseling, human resources, or education management were included. The diverse perspectives from these decision-makers enhanced the depth of the evaluation methodology.
Decision-makers’ role
The five decision-makers have been carefully selected based on their diverse expertise in fields such as career counseling, higher education, industry recruitment, and labor market analysis. These individuals were chosen thoughtfully to ensure a comprehensive understanding of both the theoretical and practical aspects of vocational mobility. They were primarily called upon to guarantee that the given career paths are evaluated objectively against established criteria, leveraging their positions and insights into current and emerging trends in the job market. This approach ensures that individuals with unique perspectives are included in the evaluation process, strengthening the overall reliability and validity of the findings in a MCGDM setting.
Alternatives (career paths)
These 15 alternatives represent diverse career paths available to college graduates. These include fields such as:
: Engineering and Technology
: Healthcare and Medicine
: Education and Academia
: Business and Entrepreneurship
: Arts and Humanities
: Information Technology
: Public Administration
: Legal Services
: Environmental Sciences
: Media and Communication
: Social Services
: Sports and Recreation
: Financial Services
: Research and Development
: Manufacturing and Industry
Criteria for evaluation
The evaluation process involves 10 critical criteria that are essential for determining the VM of college graduates:
Salary potential ( ): Cash incentives related to the profession or the industry as a whole.
Job stability ( ): Employment security and tenure security.
Growth opportunities ( ): Opportunity to grow in one’s career.
Skill utilization ( ): Use of skills acquired by graduates.
Work-life balance ( ): Relationship between work and family.
Location flexibility ( ): Location flexibility of the career.
Industry demand ( ): Present and future trends with respect to demand for jobs.
Educational alignment ( ): Suitability of academic attainment in relation to the line of work.
Networking opportunities ( ): Opportunity to establish business-professional contacts.
Job satisfaction ( ): Satisfaction corresponding to the job description.
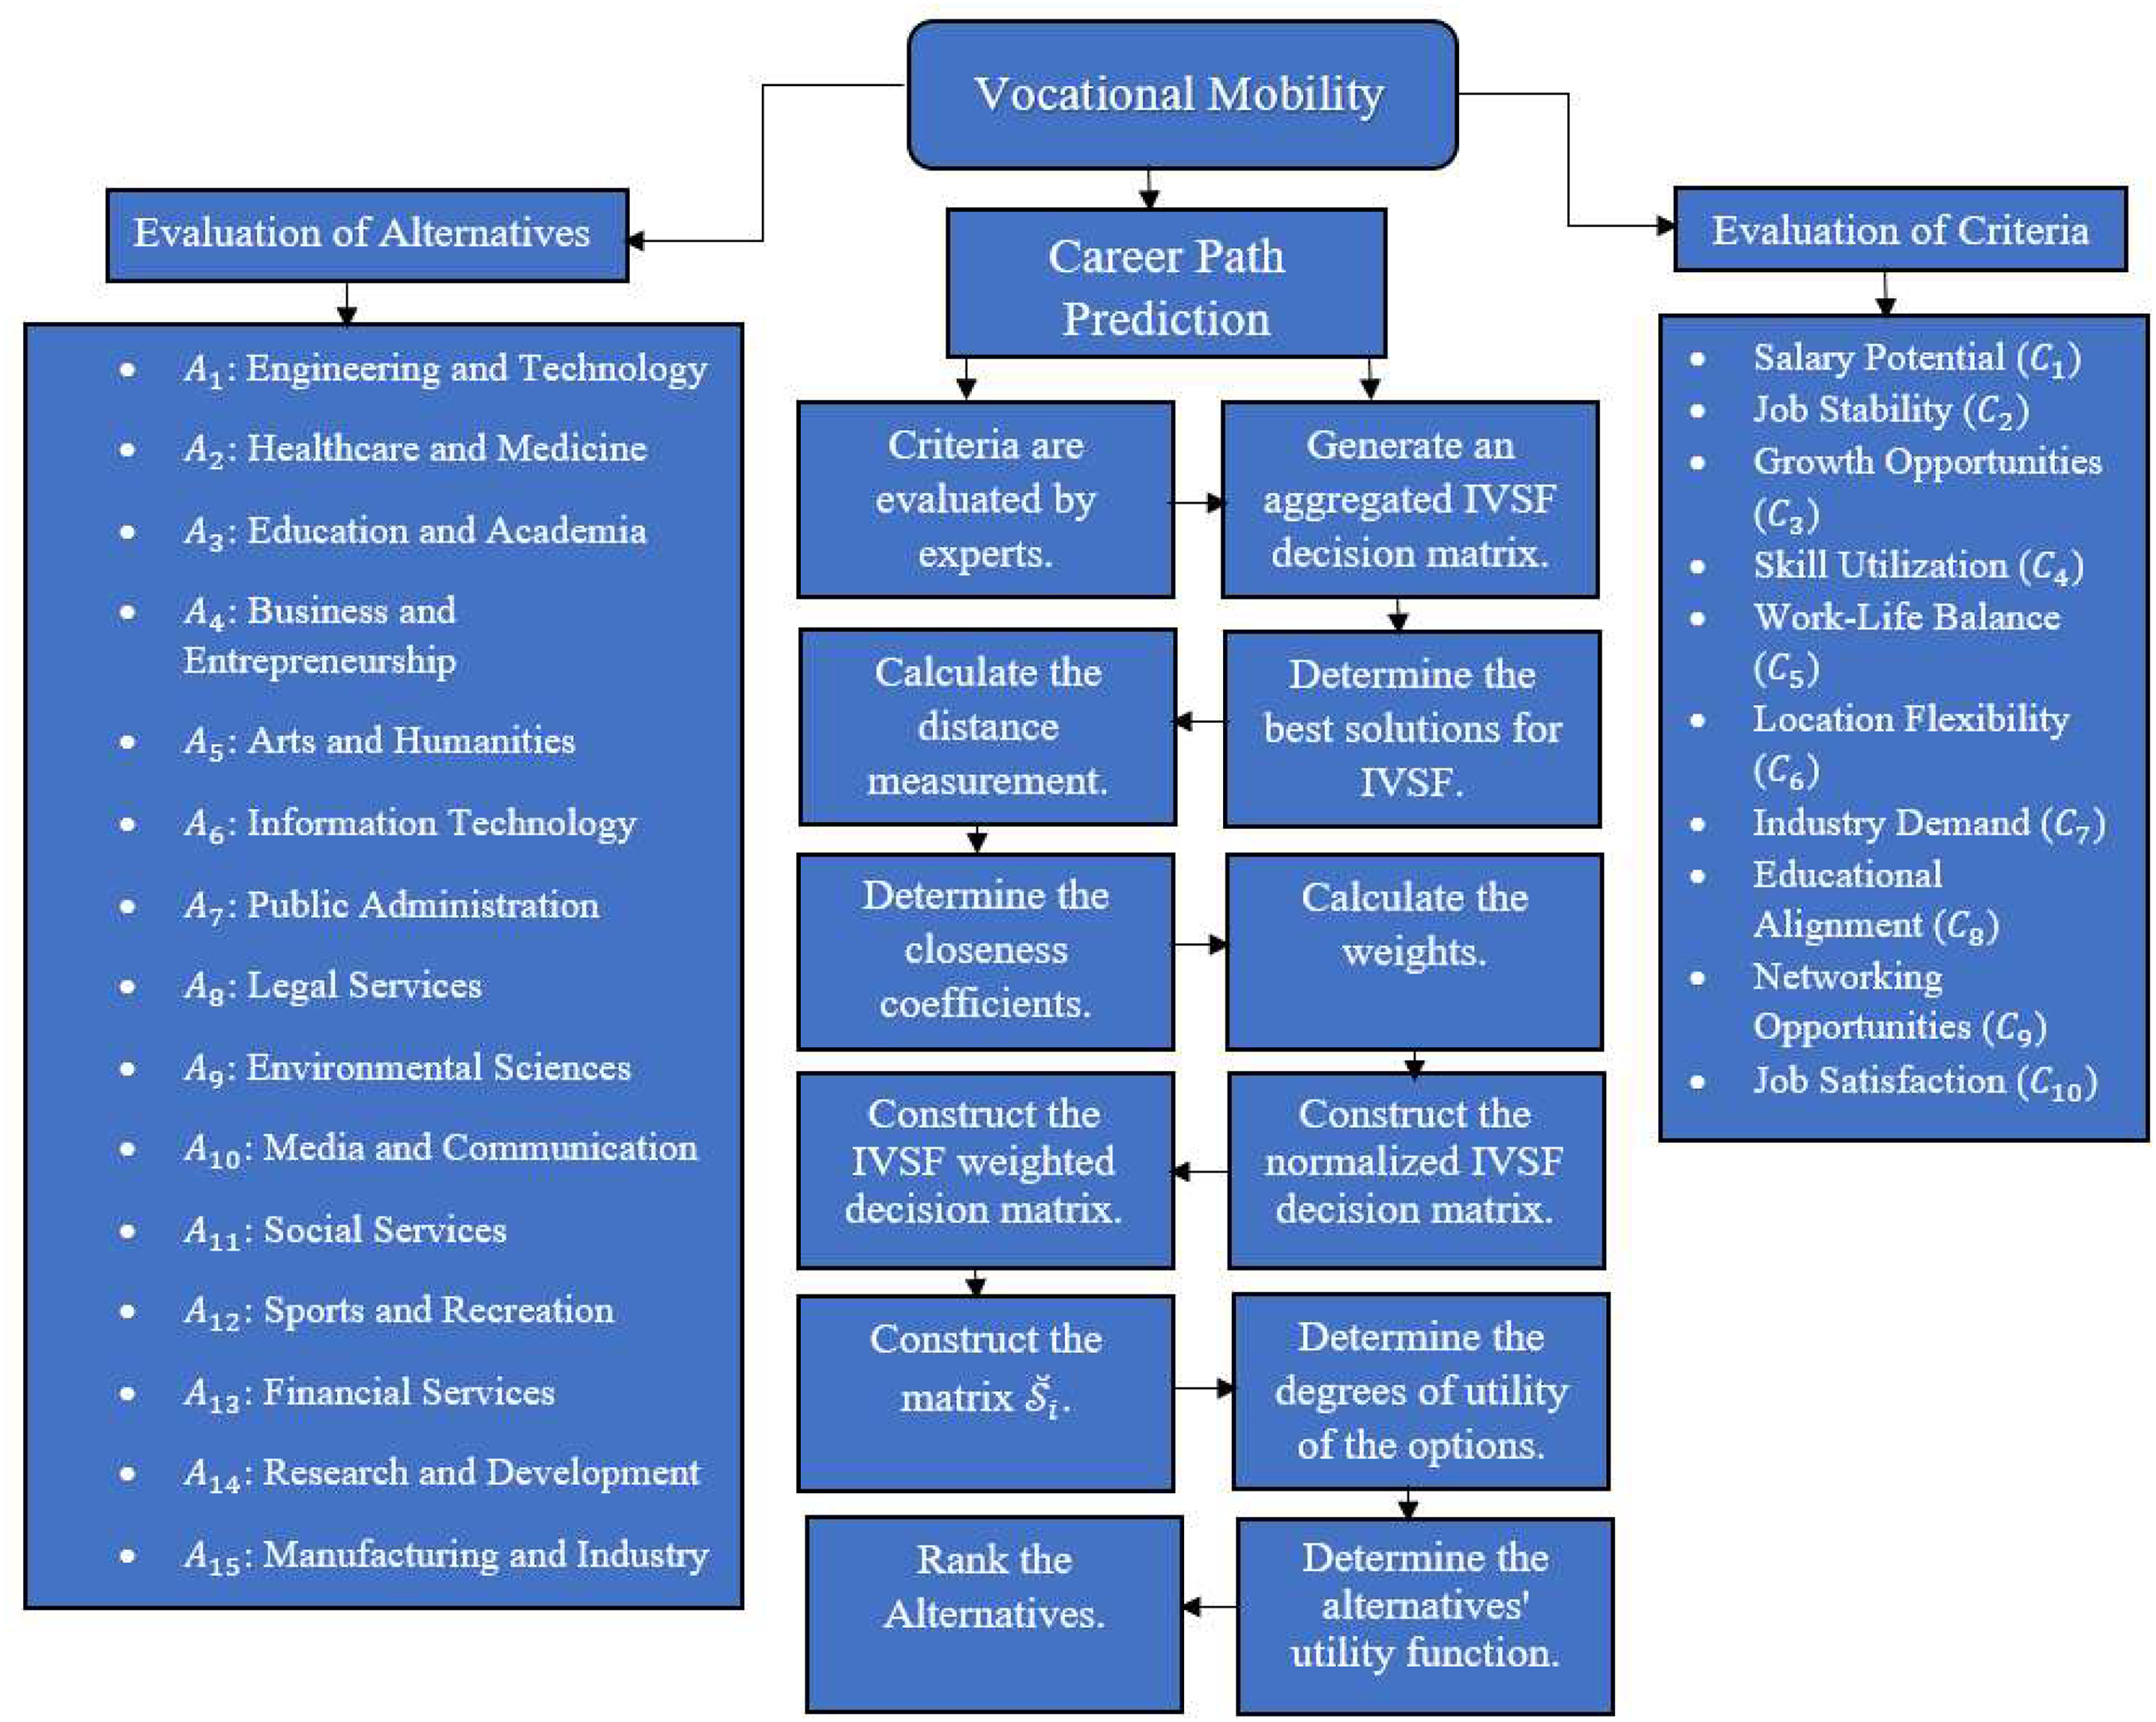
Figure 2 illustrates the detailed flowchart for evaluating alternatives and criteria in vocational mobility career path prediction.
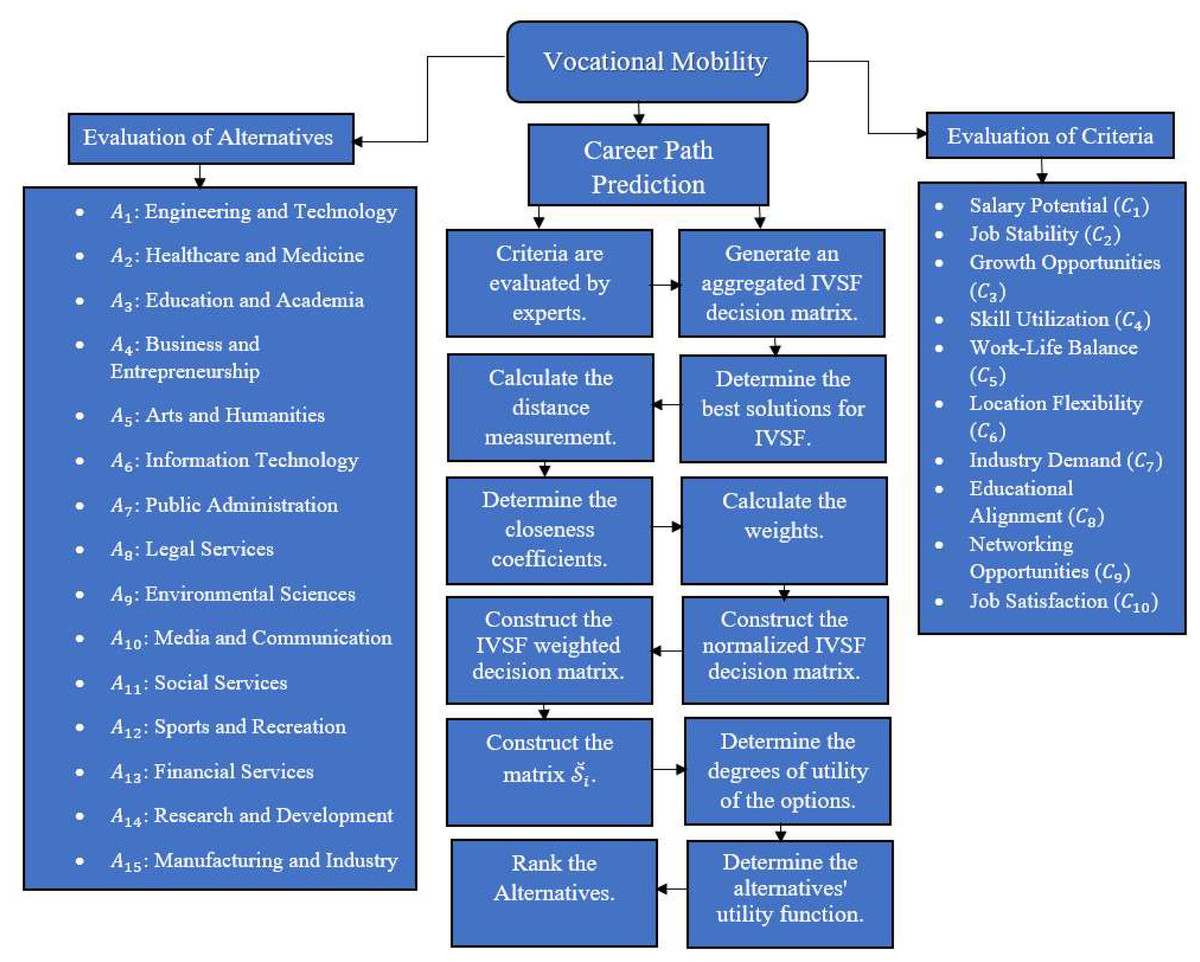
Figure 2: Flowchart of the vocational mobility.
The decision-makers’ evaluations are combined using the IVSF-MARCOS method, which leverages the advantages of IVSFS for handling uncertainties and vagueness in decisions, as shown in Fig. 2. In this method, variations in expert opinions can be captured and integrated to accurately rank the alternatives. This assessment provides information on the desirability ranking of careers in relation to optimizing the VM of college graduates. The approach ensures an accurate, comprehensive, and reliable evaluation, making the IVSF-MARCOS method dependable. This model serves as a strategic tool in career management, offering valuable information to help graduates make necessary career decisions. Tables 6 and 7 below display the linguistic evaluation of criteria and alternatives based on the decision-makers’ judgments.
| D1 | D2 | D3 | D4 | D5 | |
|---|---|---|---|---|---|
| C1 | M | I | VI | M | VI |
| C2 | M | I | VI | M | VI |
| C3 | I | I | M | I | VI |
| C4 | I | VU | M | I | M |
| C5 | I | VU | M | I | M |
| C6 | UI | VI | VI | VU | M |
| C7 | UI | VI | VU | VU | I |
| C8 | UI | VI | VU | VU | I |
| C9 | M | M | M | I | I |
| C10 | M | M | M | I | UI |
| Alternatives | Experts | Criteria | |||||||||
|---|---|---|---|---|---|---|---|---|---|---|---|
| C1 | C2 | C3 | C4 | C5 | C6 | C7 | C8 | C9 | C10 | ||
| A1 | D1 | F | G | VG | F | MG | B | G | EG | MB | MG |
| D2 | VVG | MB | MG | F | EG | B | G | B | G | VVG | |
| D3 | VVG | MB | MG | F | EG | B | G | B | G | F | |
| D4 | VVG | MB | G | B | EG | B | G | B | G | F | |
| D5 | MG | MB | EG | VVG | MB | B | G | B | B | B | |
| A2 | D1 | MB | B | MB | EG | MG | EG | VVB | B | VVG | VB |
| D2 | MB | B | MB | G | MB | G | F | B | EG | VB | |
| D3 | MB | B | MB | G | MB | G | F | B | EG | VB | |
| D4 | MB | B | MB | G | MB | G | F | B | EG | VB | |
| D5 | MG | MB | EG | VVG | MB | B | G | B | B | B | |
| A3 | D1 | VB | MG | G | VVG | G | MB | VG | MB | MG | MG |
| D2 | VB | MG | G | VG | G | MB | MG | VVB | F | MB | |
| D3 | VB | MG | G | VG | G | MB | MG | VVB | F | MB | |
| D4 | VB | MG | G | VG | G | MB | MG | VVB | F | MB | |
| D5 | MG | MB | EG | VVG | MB | B | G | B | B | B | |
| A4 | D1 | MG | MB | EG | VVG | MB | B | G | B | B | B |
| D2 | MG | MB | VG | VVG | MB | B | G | EG | MB | MG | |
| D3 | MG | MB | VG | VVG | MB | B | G | EG | MB | MG | |
| D4 | F | MB | VG | VVG | MB | B | G | EG | MB | MG | |
| D5 | F | G | VG | F | MG | B | G | EG | MB | MG | |
| A5 | D1 | VVG | MB | MG | F | EG | B | VG | B | G | VVG |
| D2 | VVG | MB | MG | F | EG | B | G | B | G | VVG | |
| D3 | VVG | MB | MG | F | EG | B | G | B | G | F | |
| D4 | VVG | MB | G | B | EG | B | G | B | G | F | |
| D5 | MG | MG | G | B | G | VVB | G | VB | VVB | F | |
| A6 | D1 | MB | B | MB | EG | MG | EG | VVB | B | VVG | VB |
| D2 | MB | B | MB | G | MB | G | F | B | EG | VB | |
| D3 | MB | B | MB | G | MB | G | F | B | EG | VB | |
| D4 | MB | B | MB | G | MB | G | F | B | EG | VB | |
| D5 | G | G | G | G | MB | G | F | G | EG | G | |
| A7 | D1 | VB | MG | G | VVG | G | MB | VG | MB | MG | MG |
| D2 | VB | MG | G | VG | G | MB | MG | VVB | F | MB | |
| D3 | VB | MG | G | VG | G | MB | MG | VVB | F | MB | |
| D4 | VB | MG | G | VG | G | MB | MG | VVB | F | MB | |
| D5 | B | F | MG | VG | MG | B | MG | VVB | G | B | |
| A8 | D1 | F | G | VG | F | MG | B | G | EG | MB | MG |
| D2 | MG | MB | VG | VVG | MB | B | G | EG | MB | MG | |
| D3 | MG | MB | VG | VVG | MB | B | G | EG | MB | MG | |
| D4 | F | MB | VG | VVG | MB | B | G | EG | MB | MG | |
| D5 | F | G | VG | F | MG | B | G | EG | MB | MG | |
| A9 | D1 | VVG | MB | MG | F | EG | B | VG | B | G | VVG |
| D2 | VVG | MB | MG | F | EG | B | G | B | G | VVG | |
| D3 | VVG | MB | MG | F | EG | B | G | B | G | F | |
| D4 | VVG | MB | G | B | EG | B | G | B | G | F | |
| D5 | MG | MB | EG | VVG | MB | B | G | B | B | B | |
| A10 | D1 | MB | B | MB | EG | MG | EG | VVB | B | VVG | VB |
| D2 | MB | B | MB | G | MB | G | F | B | EG | VB | |
| D3 | MB | B | MB | G | MB | G | F | B | EG | VB | |
| D4 | MB | B | MB | G | MB | G | F | B | EG | VB | |
| D5 | MG | MB | EG | VVG | MB | B | G | B | B | B | |
| A11 | D1 | VVG | MB | G | B | EG | B | G | B | G | F |
| D2 | MB | B | MB | G | MB | G | F | B | EG | VB | |
| D3 | MB | B | MB | G | MB | G | F | B | EG | VB | |
| D4 | MB | B | MB | G | MB | G | F | B | EG | VB | |
| D5 | G | G | G | G | MB | G | F | G | EG | G | |
| A12 | D1 | VVG | MB | G | B | EG | B | G | B | G | F |
| D2 | VB | MG | G | VG | G | MB | MG | VVB | F | MB | |
| D3 | VB | MG | G | VG | G | MB | MG | VVB | F | MB | |
| D4 | VB | MG | G | VG | G | MB | MG | VVB | F | MB | |
| D5 | B | F | MG | VG | MG | B | MG | VVB | G | B | |
| A13 | D1 | VVG | MB | G | B | EG | B | G | B | G | F |
| D2 | MG | MB | VG | VVG | MB | B | G | EG | MB | MG | |
| D3 | MG | MB | VG | VVG | MB | B | G | EG | MB | MG | |
| D4 | F | MB | VG | VVG | MB | B | G | EG | MB | MG | |
| D5 | F | G | VG | F | MG | B | G | EG | MB | MG | |
| A14 | D1 | VVG | MB | G | B | EG | B | G | B | G | F |
| D2 | VVG | MB | MG | F | EG | B | G | B | G | VVG | |
| D3 | VVG | MB | MG | F | EG | B | G | B | G | F | |
| D4 | VVG | MB | G | B | EG | B | G | B | G | F | |
| D5 | MG | MB | EG | VVG | MB | B | G | B | B | B | |
| A15 | D1 | VVG | MB | G | B | EG | B | G | B | G | F |
| D2 | MB | B | MB | G | MB | G | F | B | EG | VB | |
| D3 | MB | B | MB | G | MB | G | F | B | EG | VB | |
| D4 | MB | B | MB | G | MB | G | F | B | EG | VB | |
| D5 | MG | MB | EG | VVG | MB | B | G | B | B | B | |
Table 8 presents the weights assigned to the decision-makers. Applying the interval-valued spherical fuzzy weighted averaging (IVSFWA) operator yields the results presented in Table 9.
| D1 | D2 | D3 | D4 | D5 | |
|---|---|---|---|---|---|
| Linguistic variables | I | I | VI | M | M |
| Weight (L) | 0.211 | 0.211 | 0.225 | 0.177 | 0.177 |
| Weight (U) | 0.209 | 0.209 | 0.223 | 0.179 | 0.179 |
| C1 | 0.760 | 0.877 | 0.142 | 0.194 | 0.108 | 0.167 |
| C2 | 0.760 | 0.877 | 0.142 | 0.194 | 0.108 | 0.167 |
| C3 | 0.748 | 0.858 | 0.149 | 0.200 | 0.109 | 0.163 |
| C4 | 0.634 | 0.741 | 0.207 | 0.259 | 0.198 | 0.255 |
| C5 | 0.634 | 0.741 | 0.207 | 0.259 | 0.198 | 0.255 |
| C6 | 0.704 | 0.838 | 0.182 | 0.239 | 0.148 | 0.217 |
| C7 | 0.617 | 0.751 | 0.236 | 0.293 | 0.206 | 0.275 |
| C8 | 0.617 | 0.751 | 0.236 | 0.293 | 0.206 | 0.275 |
| C9 | 0.664 | 0.768 | 0.181 | 0.231 | 0.181 | 0.234 |
| C10 | 0.610 | 0.714 | 0.204 | 0.255 | 0.226 | 0.279 |
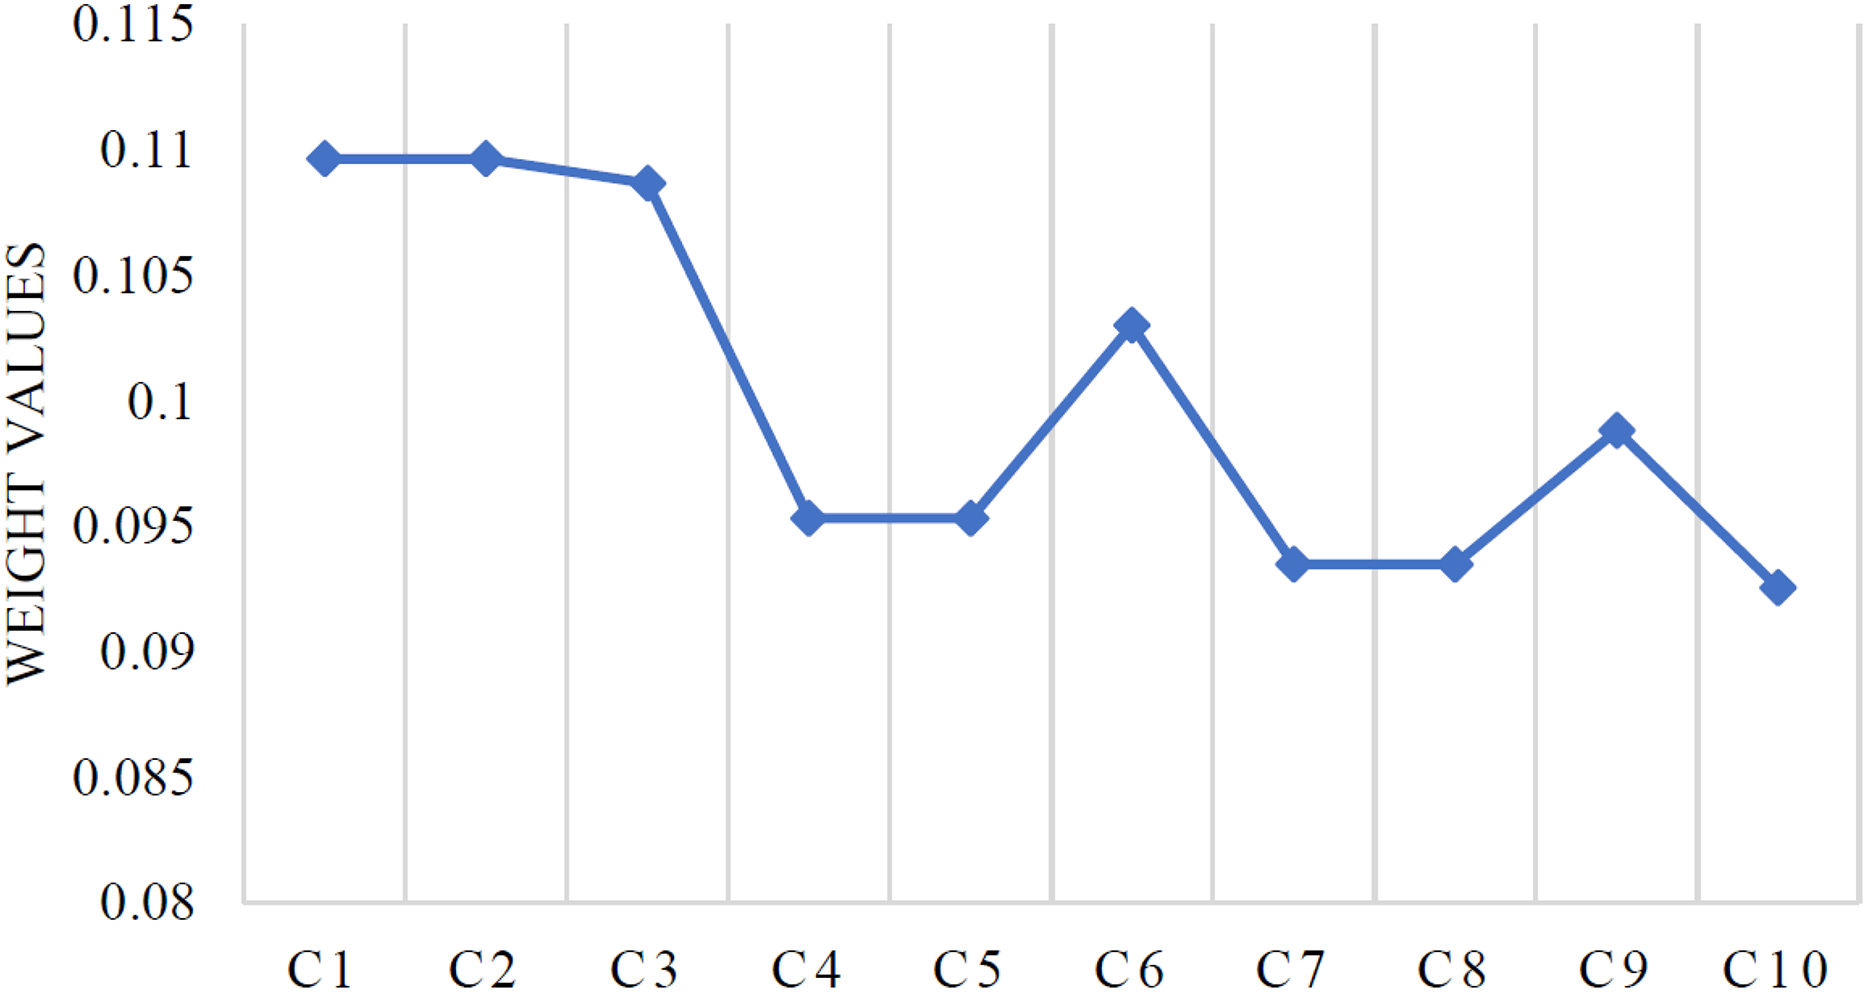
After applying Eqs. (5)–(7), we get Table 10. Also, Fig. 3 shows the criteria weights.
| CC | Normalized weights | |||||
|---|---|---|---|---|---|---|
| C1 | 0.299 | 0.284 | 1.181 | 1.225 | 0.805 | 0.110 |
| C2 | 0.299 | 0.284 | 1.181 | 1.225 | 0.805 | 0.110 |
| C3 | 0.312 | 0.294 | 1.173 | 1.216 | 0.798 | 0.109 |
| C4 | 0.465 | 0.446 | 1.043 | 1.082 | 0.700 | 0.095 |
| C5 | 0.465 | 0.446 | 1.043 | 1.082 | 0.700 | 0.095 |
| C6 | 0.377 | 0.362 | 1.121 | 1.171 | 0.756 | 0.103 |
| C7 | 0.495 | 0.473 | 1.033 | 1.085 | 0.686 | 0.093 |
| C8 | 0.495 | 0.473 | 1.033 | 1.085 | 0.686 | 0.093 |
| C9 | 0.422 | 0.402 | 1.070 | 1.109 | 0.725 | 0.099 |
| C10 | 0.495 | 0.474 | 1.007 | 1.046 | 0.679 | 0.093 |
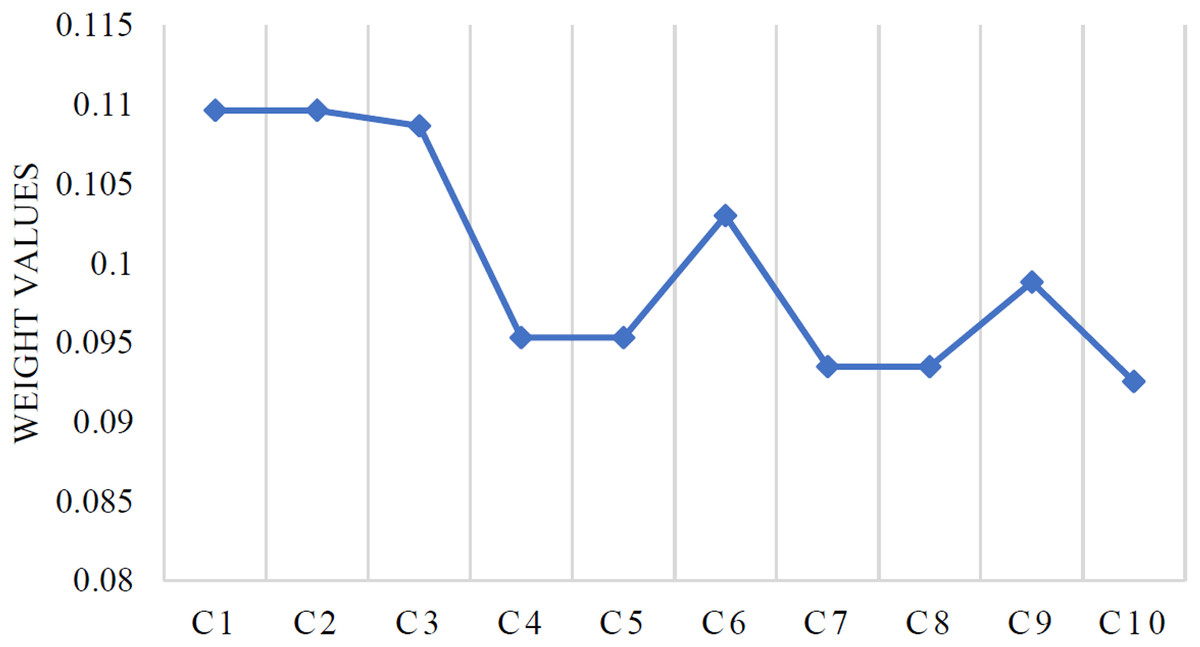
Figure 3: Weights of the criteria.
The following Tables 11A and 11B show the aggregated IVSF decision matrix for alternatives.
| A. Decision matrix for alternatives based on aggregated IVSFVs. | ||||||||||||||||||
|---|---|---|---|---|---|---|---|---|---|---|---|---|---|---|---|---|---|---|
| C1 | C2 | C3 | ||||||||||||||||
| A1 | 0.66 | 0.77 | 0.09 | 0.15 | 0.15 | 0.20 | 0.35 | 0.44 | 0.26 | 0.31 | 0.31 | 0.36 | 0.63 | 0.76 | 0.00 | 0.16 | 0.16 | 0.22 |
| A2 | 0.30 | 0.40 | 0.28 | 0.33 | 0.33 | 0.38 | 0.17 | 0.27 | 0.34 | 0.39 | 0.39 | 0.44 | 0.49 | 0.64 | 0.00 | 0.25 | 0.25 | 0.31 |
| A3 | 0.20 | 0.28 | 0.35 | 0.40 | 0.41 | 0.46 | 0.42 | 0.52 | 0.21 | 0.27 | 0.27 | 0.32 | 0.64 | 0.76 | 0.00 | 0.16 | 0.16 | 0.21 |
| A4 | 0.42 | 0.52 | 0.22 | 0.27 | 0.27 | 0.32 | 0.33 | 0.43 | 0.27 | 0.32 | 0.32 | 0.37 | 0.71 | 0.82 | 0.00 | 0.12 | 0.12 | 0.17 |
| A5 | 0.72 | 0.82 | 0.06 | 0.12 | 0.12 | 0.17 | 0.30 | 0.40 | 0.28 | 0.33 | 0.33 | 0.38 | 0.49 | 0.59 | 0.18 | 0.23 | 0.23 | 0.28 |
| A6 | 0.33 | 0.43 | 0.27 | 0.32 | 0.32 | 0.37 | 0.28 | 0.37 | 0.30 | 0.35 | 0.35 | 0.40 | 0.33 | 0.43 | 0.27 | 0.32 | 0.32 | 0.37 |
| A7 | 0.08 | 0.17 | 0.39 | 0.44 | 0.44 | 0.49 | 0.43 | 0.53 | 0.21 | 0.26 | 0.26 | 0.31 | 0.53 | 0.63 | 0.16 | 0.21 | 0.21 | 0.26 |
| A8 | 0.40 | 0.50 | 0.23 | 0.28 | 0.28 | 0.33 | 0.40 | 0.50 | 0.23 | 0.28 | 0.28 | 0.33 | 0.65 | 0.75 | 0.10 | 0.15 | 0.15 | 0.20 |
| A9 | 0.72 | 0.82 | 0.06 | 0.12 | 0.12 | 0.17 | 0.25 | 0.35 | 0.30 | 0.35 | 0.35 | 0.40 | 0.59 | 0.73 | 0.00 | 0.18 | 0.18 | 0.24 |
| A10 | 0.30 | 0.40 | 0.28 | 0.33 | 0.33 | 0.38 | 0.17 | 0.27 | 0.34 | 0.39 | 0.39 | 0.44 | 0.49 | 0.64 | 0.00 | 0.25 | 0.25 | 0.31 |
| A11 | 0.49 | 0.60 | 0.18 | 0.24 | 0.24 | 0.30 | 0.30 | 0.39 | 0.29 | 0.34 | 0.34 | 0.40 | 0.40 | 0.50 | 0.23 | 0.28 | 0.28 | 0.33 |
| A12 | 0.41 | 0.50 | 0.25 | 0.32 | 0.32 | 0.38 | 0.40 | 0.50 | 0.23 | 0.28 | 0.28 | 0.33 | 0.53 | 0.63 | 0.16 | 0.21 | 0.21 | 0.26 |
| A13 | 0.52 | 0.63 | 0.16 | 0.22 | 0.22 | 0.27 | 0.33 | 0.43 | 0.27 | 0.32 | 0.32 | 0.37 | 0.63 | 0.73 | 0.11 | 0.16 | 0.16 | 0.21 |
| A14 | 0.72 | 0.82 | 0.06 | 0.12 | 0.12 | 0.17 | 0.25 | 0.35 | 0.30 | 0.35 | 0.35 | 0.40 | 0.61 | 0.74 | 0.00 | 0.17 | 0.17 | 0.23 |
| A15 | 0.47 | 0.58 | 0.19 | 0.25 | 0.25 | 0.31 | 0.20 | 0.29 | 0.33 | 0.38 | 0.38 | 0.43 | 0.54 | 0.68 | 0.00 | 0.22 | 0.22 | 0.28 |
| C4 | C5 | |||||||||||||||||
| A1 | 0.46 | 0.57 | 0.20 | 0.39 | 0.26 | 0.31 | 0.76 | 0.88 | 0.00 | 0.10 | 0.10 | 0.16 | ||||||
| A2 | 0.69 | 0.81 | 0.00 | 0.20 | 0.13 | 0.19 | 0.31 | 0.40 | 0.28 | 0.33 | 0.33 | 0.38 | ||||||
| A3 | 0.69 | 0.80 | 0.08 | 0.19 | 0.13 | 0.18 | 0.51 | 0.61 | 0.17 | 0.22 | 0.22 | 0.27 | ||||||
| A4 | 0.71 | 0.82 | 0.07 | 0.15 | 0.12 | 0.17 | 0.30 | 0.40 | 0.28 | 0.33 | 0.33 | 0.38 | ||||||
| A5 | 0.30 | 0.39 | 0.28 | 0.39 | 0.33 | 0.38 | 0.82 | 0.93 | 0.00 | 0.06 | 0.06 | 0.12 | ||||||
| A6 | 0.65 | 0.78 | 0.00 | 0.20 | 0.15 | 0.21 | 0.31 | 0.40 | 0.28 | 0.33 | 0.33 | 0.38 | ||||||
| A7 | 0.67 | 0.78 | 0.09 | 0.19 | 0.14 | 0.19 | 0.53 | 0.63 | 0.16 | 0.21 | 0.21 | 0.26 | ||||||
| A8 | 0.65 | 0.76 | 0.09 | 0.19 | 0.15 | 0.21 | 0.35 | 0.44 | 0.26 | 0.31 | 0.31 | 0.36 | ||||||
| A9 | 0.46 | 0.57 | 0.20 | 0.39 | 0.26 | 0.31 | 0.81 | 0.92 | 0.00 | 0.07 | 0.07 | 0.13 | ||||||
| A10 | 0.69 | 0.81 | 0.00 | 0.20 | 0.13 | 0.19 | 0.31 | 0.40 | 0.28 | 0.33 | 0.33 | 0.38 | ||||||
| A11 | 0.50 | 0.60 | 0.18 | 0.31 | 0.23 | 0.28 | 0.52 | 0.67 | 0.00 | 0.23 | 0.23 | 0.30 | ||||||
| A12 | 0.60 | 0.70 | 0.13 | 0.26 | 0.18 | 0.24 | 0.64 | 0.77 | 0.00 | 0.16 | 0.16 | 0.21 | ||||||
| A13 | 0.64 | 0.75 | 0.10 | 0.20 | 0.16 | 0.22 | 0.54 | 0.68 | 0.00 | 0.22 | 0.22 | 0.28 | ||||||
| A14 | 0.44 | 0.55 | 0.21 | 0.42 | 0.28 | 0.33 | 0.81 | 0.92 | 0.00 | 0.07 | 0.07 | 0.13 | ||||||
| A15 | 0.56 | 0.66 | 0.15 | 0.31 | 0.20 | 0.26 | 0.52 | 0.67 | 0.00 | 0.23 | 0.23 | 0.30 | ||||||
| B. Continued decision matrix for alternatives based on aggregated IVSFVs. | ||||||||||||||||||
|---|---|---|---|---|---|---|---|---|---|---|---|---|---|---|---|---|---|---|
| C6 | C7 | C8 | ||||||||||||||||
| A1 | 0.15 | 0.25 | 0.35 | 0.40 | 0.40 | 0.45 | 0.55 | 0.65 | 0.15 | 0.20 | 0.20 | 0.25 | 0.50 | 0.65 | 0.00 | 0.26 | 0.26 | 0.33 |
| A2 | 0.62 | 0.75 | 0.00 | 0.17 | 0.17 | 0.23 | 0.37 | 0.46 | 0.26 | 0.31 | 0.31 | 0.36 | 0.15 | 0.25 | 0.35 | 0.40 | 0.40 | 0.45 |
| A3 | 0.24 | 0.33 | 0.31 | 0.36 | 0.36 | 0.41 | 0.52 | 0.62 | 0.16 | 0.22 | 0.22 | 0.27 | 0.13 | 0.20 | 0.17 | 0.45 | 0.45 | 0.50 |
| A4 | 0.15 | 0.25 | 0.35 | 0.40 | 0.40 | 0.45 | 0.55 | 0.65 | 0.15 | 0.20 | 0.20 | 0.25 | 0.80 | 0.92 | 0.00 | 0.08 | 0.08 | 0.14 |
| A5 | 0.14 | 0.23 | 0.37 | 0.42 | 0.42 | 0.47 | 0.57 | 0.67 | 0.14 | 0.19 | 0.19 | 0.24 | 0.14 | 0.24 | 0.30 | 0.41 | 0.41 | 0.46 |
| A6 | 0.65 | 0.78 | 0.00 | 0.15 | 0.15 | 0.21 | 0.31 | 0.41 | 0.28 | 0.33 | 0.33 | 0.38 | 0.28 | 0.37 | 0.31 | 0.35 | 0.35 | 0.40 |
| A7 | 0.24 | 0.33 | 0.31 | 0.36 | 0.36 | 0.41 | 0.50 | 0.61 | 0.17 | 0.22 | 0.22 | 0.28 | 0.12 | 0.17 | 0.17 | 0.46 | 0.46 | 0.51 |
| A8 | 0.15 | 0.25 | 0.35 | 0.40 | 0.40 | 0.45 | 0.55 | 0.65 | 0.15 | 0.20 | 0.20 | 0.25 | 0.85 | 0.95 | 0.00 | 0.05 | 0.05 | 0.10 |
| A9 | 0.15 | 0.25 | 0.35 | 0.40 | 0.40 | 0.45 | 0.57 | 0.67 | 0.14 | 0.19 | 0.19 | 0.24 | 0.15 | 0.25 | 0.34 | 0.40 | 0.40 | 0.45 |
| A10 | 0.62 | 0.75 | 0.00 | 0.17 | 0.17 | 0.23 | 0.37 | 0.46 | 0.26 | 0.31 | 0.31 | 0.36 | 0.15 | 0.25 | 0.29 | 0.40 | 0.40 | 0.45 |
| A11 | 0.50 | 0.60 | 0.18 | 0.23 | 0.23 | 0.28 | 0.40 | 0.50 | 0.22 | 0.28 | 0.28 | 0.33 | 0.28 | 0.37 | 0.33 | 0.35 | 0.35 | 0.40 |
| A12 | 0.22 | 0.32 | 0.32 | 0.37 | 0.37 | 0.42 | 0.47 | 0.57 | 0.19 | 0.24 | 0.24 | 0.29 | 0.07 | 0.12 | 0.20 | 0.48 | 0.48 | 0.53 |
| A13 | 0.15 | 0.25 | 0.35 | 0.40 | 0.40 | 0.45 | 0.55 | 0.65 | 0.15 | 0.20 | 0.20 | 0.25 | 0.80 | 0.92 | 0.00 | 0.08 | 0.08 | 0.14 |
| A14 | 0.15 | 0.25 | 0.35 | 0.40 | 0.40 | 0.45 | 0.55 | 0.65 | 0.15 | 0.20 | 0.20 | 0.25 | 0.15 | 0.25 | 0.34 | 0.40 | 0.40 | 0.45 |
| A15 | 0.45 | 0.55 | 0.21 | 0.26 | 0.26 | 0.31 | 0.44 | 0.54 | 0.21 | 0.26 | 0.26 | 0.31 | 0.15 | 0.25 | 0.30 | 0.40 | 0.40 | 0.45 |
| C9 | C10 | |||||||||||||||||
| A1 | 0.46 | 0.56 | 0.20 | 0.25 | 0.25 | 0.31 | 0.49 | 0.60 | 0.18 | 0.24 | 0.24 | 0.30 | ||||||
| A2 | 0.79 | 0.90 | 0.00 | 0.08 | 0.08 | 0.14 | 0.08 | 0.17 | 0.39 | 0.44 | 0.44 | 0.49 | ||||||
| A3 | 0.35 | 0.45 | 0.25 | 0.30 | 0.30 | 0.35 | 0.30 | 0.39 | 0.28 | 0.33 | 0.33 | 0.38 | ||||||
| A4 | 0.23 | 0.33 | 0.31 | 0.36 | 0.36 | 0.41 | 0.41 | 0.51 | 0.23 | 0.28 | 0.28 | 0.33 | ||||||
| A5 | 0.51 | 0.60 | 0.18 | 0.24 | 0.24 | 0.29 | 0.59 | 0.70 | 0.13 | 0.19 | 0.19 | 0.25 | ||||||
| A6 | 0.83 | 0.94 | 0.00 | 0.06 | 0.06 | 0.11 | 0.25 | 0.33 | 0.34 | 0.39 | 0.39 | 0.44 | ||||||
| A7 | 0.37 | 0.47 | 0.24 | 0.29 | 0.29 | 0.34 | 0.30 | 0.39 | 0.28 | 0.33 | 0.33 | 0.38 | ||||||
| A8 | 0.25 | 0.35 | 0.30 | 0.35 | 0.35 | 0.40 | 0.45 | 0.55 | 0.20 | 0.25 | 0.25 | 0.30 | ||||||
| A9 | 0.51 | 0.61 | 0.17 | 0.23 | 0.23 | 0.28 | 0.58 | 0.69 | 0.13 | 0.20 | 0.20 | 0.26 | ||||||
| A10 | 0.79 | 0.90 | 0.00 | 0.08 | 0.08 | 0.14 | 0.08 | 0.17 | 0.39 | 0.44 | 0.44 | 0.49 | ||||||
| A11 | 0.81 | 0.93 | 0.00 | 0.07 | 0.07 | 0.12 | 0.30 | 0.38 | 0.30 | 0.36 | 0.36 | 0.41 | ||||||
| A12 | 0.40 | 0.50 | 0.22 | 0.28 | 0.28 | 0.33 | 0.26 | 0.36 | 0.30 | 0.35 | 0.35 | 0.40 | ||||||
| A13 | 0.35 | 0.44 | 0.26 | 0.31 | 0.31 | 0.36 | 0.43 | 0.53 | 0.21 | 0.26 | 0.26 | 0.31 | ||||||
| A14 | 0.51 | 0.61 | 0.17 | 0.23 | 0.23 | 0.28 | 0.48 | 0.58 | 0.19 | 0.25 | 0.25 | 0.31 | ||||||
| A15 | 0.76 | 0.89 | 0.00 | 0.10 | 0.10 | 0.16 | 0.18 | 0.27 | 0.35 | 0.40 | 0.40 | 0.46 | ||||||
The following Tables 12A and 12B display the distance measure of alternatives for IVSFPIS and IVSFNIS. Table 13 shows the closeness coefficient of other options.
| A. Closeness coefficient of alternatives. | |||||||||||||||
|---|---|---|---|---|---|---|---|---|---|---|---|---|---|---|---|
| C1 | C2 | C3 | |||||||||||||
| A1 | 0.38 | 0.34 | 1.08 | 1.12 | 0.75 | 0.77 | 0.73 | 0.81 | 0.84 | 0.52 | 0.40 | 0.37 | 1.05 | 1.10 | 0.74 |
| A2 | 0.82 | 0.78 | 0.78 | 0.81 | 0.50 | 0.98 | 0.94 | 0.72 | 0.73 | 0.43 | 0.56 | 0.54 | 0.90 | 0.97 | 0.63 |
| A3 | 0.96 | 0.94 | 0.72 | 0.73 | 0.43 | 0.67 | 0.63 | 0.87 | 0.90 | 0.58 | 0.39 | 0.36 | 1.06 | 1.11 | 0.74 |
| A4 | 0.68 | 0.64 | 0.87 | 0.90 | 0.57 | 0.79 | 0.75 | 0.80 | 0.83 | 0.52 | 0.31 | 0.27 | 1.13 | 1.17 | 0.80 |
| A5 | 0.31 | 0.27 | 1.14 | 1.17 | 0.80 | 0.82 | 0.78 | 0.78 | 0.81 | 0.50 | 0.59 | 0.55 | 0.93 | 0.96 | 0.62 |
| A6 | 0.79 | 0.75 | 0.80 | 0.83 | 0.52 | 0.86 | 0.82 | 0.77 | 0.79 | 0.48 | 0.79 | 0.75 | 0.80 | 0.83 | 0.52 |
| A7 | 1.09 | 1.06 | 0.69 | 0.70 | 0.39 | 0.66 | 0.62 | 0.88 | 0.91 | 0.59 | 0.53 | 0.49 | 0.97 | 1.00 | 0.66 |
| A8 | 0.70 | 0.66 | 0.86 | 0.88 | 0.56 | 0.70 | 0.66 | 0.86 | 0.88 | 0.56 | 0.39 | 0.35 | 1.07 | 1.11 | 0.74 |
| A9 | 0.31 | 0.27 | 1.14 | 1.17 | 0.80 | 0.88 | 0.84 | 0.76 | 0.78 | 0.47 | 0.44 | 0.41 | 1.01 | 1.07 | 0.71 |
| A10 | 0.82 | 0.78 | 0.78 | 0.81 | 0.50 | 0.98 | 0.94 | 0.72 | 0.73 | 0.43 | 0.56 | 0.54 | 0.90 | 0.97 | 0.63 |
| A11 | 0.59 | 0.56 | 0.92 | 0.95 | 0.62 | 0.84 | 0.80 | 0.78 | 0.80 | 0.49 | 0.70 | 0.66 | 0.86 | 0.88 | 0.56 |
| A12 | 0.72 | 0.70 | 0.83 | 0.86 | 0.54 | 0.70 | 0.66 | 0.86 | 0.88 | 0.56 | 0.53 | 0.49 | 0.97 | 1.00 | 0.66 |
| A13 | 0.55 | 0.51 | 0.95 | 0.99 | 0.65 | 0.79 | 0.75 | 0.80 | 0.83 | 0.52 | 0.42 | 0.38 | 1.06 | 1.09 | 0.73 |
| A14 | 0.31 | 0.27 | 1.14 | 1.17 | 0.80 | 0.88 | 0.84 | 0.76 | 0.78 | 0.47 | 0.43 | 0.39 | 1.03 | 1.08 | 0.72 |
| A15 | 0.62 | 0.58 | 0.90 | 0.94 | 0.61 | 0.95 | 0.91 | 0.73 | 0.75 | 0.44 | 0.51 | 0.48 | 0.95 | 1.01 | 0.66 |
| C4 | C5 | ||||||||||||||
| A1 | 0.63 | 0.66 | 0.89 | 0.97 | 0.59 | 0.26 | 0.22 | 1.18 | 1.22 | 0.83 | |||||
| A2 | 0.34 | 0.34 | 1.11 | 1.16 | 0.77 | 0.81 | 0.78 | 0.79 | 0.81 | 0.50 | |||||
| A3 | 0.34 | 0.33 | 1.12 | 1.16 | 0.77 | 0.56 | 0.52 | 0.95 | 0.98 | 0.64 | |||||
| A4 | 0.32 | 0.30 | 1.13 | 1.17 | 0.79 | 0.82 | 0.78 | 0.78 | 0.81 | 0.50 | |||||
| A5 | 0.83 | 0.82 | 0.78 | 0.83 | 0.50 | 0.19 | 0.15 | 1.24 | 1.28 | 0.88 | |||||
| A6 | 0.38 | 0.36 | 1.07 | 1.13 | 0.75 | 0.81 | 0.78 | 0.79 | 0.81 | 0.50 | |||||
| A7 | 0.36 | 0.35 | 1.10 | 1.14 | 0.76 | 0.53 | 0.49 | 0.97 | 1.00 | 0.66 | |||||
| A8 | 0.39 | 0.37 | 1.07 | 1.12 | 0.74 | 0.77 | 0.73 | 0.82 | 0.84 | 0.53 | |||||
| A9 | 0.63 | 0.66 | 0.89 | 0.97 | 0.59 | 0.20 | 0.16 | 1.23 | 1.27 | 0.87 | |||||
| A10 | 0.34 | 0.34 | 1.11 | 1.16 | 0.77 | 0.81 | 0.78 | 0.79 | 0.81 | 0.50 | |||||
| A11 | 0.58 | 0.58 | 0.93 | 0.99 | 0.62 | 0.53 | 0.50 | 0.93 | 1.00 | 0.65 | |||||
| A12 | 0.46 | 0.46 | 1.02 | 1.07 | 0.69 | 0.39 | 0.35 | 1.06 | 1.11 | 0.75 | |||||
| A13 | 0.40 | 0.39 | 1.06 | 1.10 | 0.73 | 0.51 | 0.48 | 0.95 | 1.01 | 0.67 | |||||
| A14 | 0.66 | 0.70 | 0.87 | 0.96 | 0.57 | 0.20 | 0.16 | 1.23 | 1.27 | 0.87 | |||||
| A15 | 0.51 | 0.52 | 0.98 | 1.04 | 0.66 | 0.53 | 0.50 | 0.93 | 1.00 | 0.65 | |||||
| B. Continued closeness coefficient of alternatives. | |||||||||||||||
|---|---|---|---|---|---|---|---|---|---|---|---|---|---|---|---|
| C6 | C7 | C8 | |||||||||||||
| A1 | 1.00 | 0.96 | 0.71 | 0.72 | 0.42 | 0.51 | 0.47 | 0.98 | 1.01 | 0.67 | 0.56 | 0.55 | 0.89 | 0.97 | 0.63 |
| A2 | 0.41 | 0.38 | 1.04 | 1.09 | 0.73 | 0.75 | 0.72 | 0.82 | 0.85 | 0.53 | 1.00 | 0.96 | 0.71 | 0.72 | 0.42 |
| A3 | 0.90 | 0.86 | 0.75 | 0.77 | 0.46 | 0.55 | 0.51 | 0.96 | 0.99 | 0.65 | 0.99 | 1.04 | 0.59 | 0.70 | 0.39 |
| A4 | 1.00 | 0.96 | 0.71 | 0.72 | 0.42 | 0.51 | 0.47 | 0.98 | 1.01 | 0.67 | 0.22 | 0.18 | 1.22 | 1.26 | 0.86 |
| A5 | 1.03 | 0.99 | 0.70 | 0.71 | 0.41 | 0.49 | 0.45 | 1.00 | 1.03 | 0.69 | 1.00 | 0.98 | 0.68 | 0.72 | 0.41 |
| A6 | 0.38 | 0.34 | 1.07 | 1.12 | 0.75 | 0.81 | 0.78 | 0.79 | 0.81 | 0.50 | 0.86 | 0.82 | 0.77 | 0.79 | 0.48 |
| A7 | 0.90 | 0.86 | 0.75 | 0.77 | 0.46 | 0.57 | 0.53 | 0.94 | 0.97 | 0.63 | 1.01 | 1.08 | 0.57 | 0.69 | 0.38 |
| A8 | 1.00 | 0.96 | 0.71 | 0.72 | 0.42 | 0.51 | 0.47 | 0.98 | 1.01 | 0.67 | 0.16 | 0.12 | 1.27 | 1.31 | 0.90 |
| A9 | 1.00 | 0.96 | 0.71 | 0.72 | 0.42 | 0.49 | 0.45 | 1.00 | 1.03 | 0.69 | 1.00 | 0.96 | 0.70 | 0.72 | 0.42 |
| A10 | 0.41 | 0.38 | 1.04 | 1.09 | 0.73 | 0.75 | 0.72 | 0.82 | 0.85 | 0.53 | 0.98 | 0.96 | 0.69 | 0.72 | 0.42 |
| A11 | 0.58 | 0.54 | 0.93 | 0.96 | 0.63 | 0.69 | 0.65 | 0.86 | 0.89 | 0.56 | 0.87 | 0.82 | 0.78 | 0.79 | 0.48 |
| A12 | 0.92 | 0.88 | 0.74 | 0.76 | 0.45 | 0.61 | 0.57 | 0.92 | 0.94 | 0.61 | 1.07 | 1.13 | 0.57 | 0.68 | 0.36 |
| A13 | 1.00 | 0.96 | 0.71 | 0.72 | 0.42 | 0.51 | 0.47 | 0.98 | 1.01 | 0.67 | 0.22 | 0.18 | 1.22 | 1.26 | 0.86 |
| A14 | 1.00 | 0.96 | 0.71 | 0.72 | 0.42 | 0.51 | 0.47 | 0.98 | 1.01 | 0.67 | 1.00 | 0.96 | 0.70 | 0.72 | 0.42 |
| A15 | 0.64 | 0.61 | 0.89 | 0.92 | 0.59 | 0.65 | 0.61 | 0.89 | 0.92 | 0.59 | 0.99 | 0.96 | 0.69 | 0.72 | 0.42 |
| C9 | C10 | ||||||||||||||
| A1 | 0.63 | 0.59 | 0.90 | 0.93 | 0.60 | 0.59 | 0.55 | 0.92 | 0.96 | 0.62 | |||||
| A2 | 0.23 | 0.19 | 1.21 | 1.25 | 0.85 | 1.09 | 1.06 | 0.69 | 0.70 | 0.39 | |||||
| A3 | 0.76 | 0.72 | 0.82 | 0.84 | 0.53 | 0.83 | 0.79 | 0.78 | 0.80 | 0.49 | |||||
| A4 | 0.90 | 0.86 | 0.75 | 0.77 | 0.46 | 0.69 | 0.65 | 0.86 | 0.89 | 0.57 | |||||
| A5 | 0.58 | 0.54 | 0.94 | 0.96 | 0.63 | 0.47 | 0.43 | 1.01 | 1.05 | 0.69 | |||||
| A6 | 0.18 | 0.14 | 1.26 | 1.29 | 0.89 | 0.91 | 0.89 | 0.74 | 0.76 | 0.45 | |||||
| A7 | 0.73 | 0.69 | 0.84 | 0.86 | 0.55 | 0.83 | 0.79 | 0.78 | 0.80 | 0.49 | |||||
| A8 | 0.88 | 0.84 | 0.76 | 0.78 | 0.47 | 0.64 | 0.60 | 0.90 | 0.92 | 0.60 | |||||
| A9 | 0.57 | 0.53 | 0.94 | 0.97 | 0.64 | 0.49 | 0.45 | 1.00 | 1.03 | 0.68 | |||||
| A10 | 0.23 | 0.19 | 1.21 | 1.25 | 0.85 | 1.09 | 1.06 | 0.69 | 0.70 | 0.39 | |||||
| A11 | 0.20 | 0.16 | 1.24 | 1.28 | 0.88 | 0.85 | 0.82 | 0.77 | 0.79 | 0.48 | |||||
| A12 | 0.69 | 0.65 | 0.86 | 0.89 | 0.56 | 0.87 | 0.83 | 0.76 | 0.78 | 0.48 | |||||
| A13 | 0.77 | 0.73 | 0.81 | 0.84 | 0.52 | 0.66 | 0.62 | 0.88 | 0.91 | 0.58 | |||||
| A14 | 0.57 | 0.53 | 0.94 | 0.97 | 0.64 | 0.61 | 0.57 | 0.91 | 0.94 | 0.61 | |||||
| A15 | 0.26 | 0.22 | 1.18 | 1.23 | 0.84 | 0.98 | 0.95 | 0.72 | 0.73 | 0.43 | |||||
| C1 | C2 | C3 | C4 | C5 | C6 | C7 | C8 | C9 | C10 | |
|---|---|---|---|---|---|---|---|---|---|---|
| A1 | 0.75 | 0.52 | 0.74 | 0.59 | 0.83 | 0.42 | 0.67 | 0.63 | 0.60 | 0.62 |
| A2 | 0.50 | 0.43 | 0.63 | 0.77 | 0.50 | 0.73 | 0.53 | 0.42 | 0.85 | 0.39 |
| A3 | 0.43 | 0.58 | 0.74 | 0.77 | 0.64 | 0.46 | 0.65 | 0.39 | 0.53 | 0.49 |
| A4 | 0.57 | 0.52 | 0.80 | 0.79 | 0.50 | 0.42 | 0.67 | 0.86 | 0.46 | 0.57 |
| A5 | 0.80 | 0.50 | 0.62 | 0.50 | 0.88 | 0.41 | 0.69 | 0.41 | 0.63 | 0.69 |
| A6 | 0.52 | 0.48 | 0.52 | 0.75 | 0.50 | 0.75 | 0.50 | 0.48 | 0.89 | 0.45 |
| A7 | 0.39 | 0.59 | 0.66 | 0.76 | 0.66 | 0.46 | 0.63 | 0.38 | 0.55 | 0.49 |
| A8 | 0.56 | 0.56 | 0.74 | 0.74 | 0.53 | 0.42 | 0.67 | 0.90 | 0.47 | 0.60 |
| A9 | 0.80 | 0.47 | 0.71 | 0.59 | 0.87 | 0.42 | 0.69 | 0.42 | 0.64 | 0.68 |
| A10 | 0.50 | 0.43 | 0.63 | 0.77 | 0.50 | 0.73 | 0.53 | 0.42 | 0.85 | 0.39 |
| A11 | 0.62 | 0.49 | 0.56 | 0.62 | 0.65 | 0.63 | 0.56 | 0.48 | 0.88 | 0.48 |
| A12 | 0.54 | 0.56 | 0.66 | 0.69 | 0.75 | 0.45 | 0.61 | 0.36 | 0.56 | 0.48 |
| A13 | 0.65 | 0.52 | 0.73 | 0.73 | 0.67 | 0.42 | 0.67 | 0.86 | 0.52 | 0.58 |
| A14 | 0.80 | 0.47 | 0.72 | 0.57 | 0.87 | 0.42 | 0.67 | 0.42 | 0.64 | 0.61 |
| A15 | 0.61 | 0.44 | 0.66 | 0.66 | 0.65 | 0.59 | 0.59 | 0.42 | 0.84 | 0.43 |
| I | 0.80 | 0.59 | 0.80 | 0.79 | 0.88 | 0.75 | 0.69 | 0.36 | 0.46 | 0.39 |
| AI | 0.39 | 0.43 | 0.52 | 0.50 | 0.50 | 0.41 | 0.50 | 0.90 | 0.89 | 0.69 |
Tables 14 and 15 display the normalized IVSF decision matrix and the weighted normalized IVSF decision matrix, respectively.
| C1 | C2 | C3 | C4 | C5 | C6 | C7 | C8 | C9 | C10 | |
|---|---|---|---|---|---|---|---|---|---|---|
| A1 | 0.944 | 0.893 | 0.923 | 0.747 | 0.944 | 0.560 | 0.974 | 1.027 | 0.579 | 0.772 |
| A2 | 0.624 | 0.737 | 0.790 | 0.977 | 0.569 | 0.969 | 0.773 | 1.293 | 0.859 | 0.541 |
| A3 | 0.543 | 0.986 | 0.932 | 0.978 | 0.727 | 0.615 | 0.943 | 1.061 | 0.932 | 0.874 |
| A4 | 0.720 | 0.881 | 1.000 | 1.000 | 0.564 | 0.560 | 0.974 | 1.027 | 0.420 | 1.000 |
| A5 | 1.000 | 0.849 | 0.783 | 0.628 | 1.000 | 0.547 | 1.000 | 1.000 | 0.877 | 0.735 |
| A6 | 0.647 | 0.820 | 0.647 | 0.948 | 0.569 | 1.000 | 0.728 | 1.373 | 0.755 | 0.519 |
| A7 | 0.490 | 1.000 | 0.824 | 0.961 | 0.746 | 0.615 | 0.924 | 1.082 | 0.962 | 0.847 |
| A8 | 0.703 | 0.959 | 0.934 | 0.941 | 0.596 | 0.560 | 0.974 | 1.027 | 0.402 | 0.979 |
| A9 | 1.000 | 0.806 | 0.891 | 0.747 | 0.990 | 0.560 | 1.000 | 1.000 | 0.860 | 0.727 |
| A10 | 0.624 | 0.737 | 0.790 | 0.977 | 0.569 | 0.969 | 0.773 | 1.293 | 0.863 | 0.541 |
| A11 | 0.778 | 0.836 | 0.704 | 0.791 | 0.738 | 0.835 | 0.822 | 1.216 | 0.754 | 0.527 |
| A12 | 0.681 | 0.960 | 0.824 | 0.878 | 0.846 | 0.602 | 0.893 | 1.120 | 1.000 | 0.818 |
| A13 | 0.811 | 0.881 | 0.916 | 0.928 | 0.756 | 0.560 | 0.974 | 1.027 | 0.420 | 0.883 |
| A14 | 1.000 | 0.806 | 0.905 | 0.727 | 0.990 | 0.560 | 0.974 | 1.027 | 0.860 | 0.727 |
| A15 | 0.761 | 0.755 | 0.832 | 0.839 | 0.738 | 0.785 | 0.861 | 1.162 | 0.863 | 0.553 |
| I | 1.000 | 1.000 | 1.000 | 1.000 | 1.000 | 1.000 | 1.000 | 1.000 | 1.000 | 1.000 |
| AI | 0.490 | 0.737 | 0.647 | 0.628 | 0.564 | 0.547 | 0.728 | 1.373 | 0.402 | 0.519 |
| C1 | C2 | C3 | C4 | C5 | C6 | C7 | C8 | C9 | C10 | |
|---|---|---|---|---|---|---|---|---|---|---|
| A1 | 0.104 | 0.098 | 0.100 | 0.071 | 0.090 | 0.058 | 0.091 | 0.096 | 0.057 | 0.071 |
| A2 | 0.068 | 0.081 | 0.086 | 0.093 | 0.054 | 0.100 | 0.072 | 0.121 | 0.085 | 0.050 |
| A3 | 0.060 | 0.108 | 0.101 | 0.093 | 0.069 | 0.063 | 0.088 | 0.099 | 0.092 | 0.081 |
| A4 | 0.079 | 0.097 | 0.109 | 0.095 | 0.054 | 0.058 | 0.091 | 0.096 | 0.042 | 0.093 |
| A5 | 0.110 | 0.093 | 0.085 | 0.060 | 0.095 | 0.056 | 0.093 | 0.093 | 0.087 | 0.068 |
| A6 | 0.071 | 0.090 | 0.070 | 0.090 | 0.054 | 0.103 | 0.068 | 0.128 | 0.075 | 0.048 |
| A7 | 0.054 | 0.110 | 0.090 | 0.092 | 0.071 | 0.063 | 0.086 | 0.101 | 0.095 | 0.078 |
| A8 | 0.077 | 0.105 | 0.102 | 0.090 | 0.057 | 0.058 | 0.091 | 0.096 | 0.040 | 0.091 |
| A9 | 0.110 | 0.088 | 0.097 | 0.071 | 0.094 | 0.058 | 0.093 | 0.093 | 0.085 | 0.067 |
| A10 | 0.068 | 0.081 | 0.086 | 0.093 | 0.054 | 0.100 | 0.072 | 0.121 | 0.085 | 0.050 |
| A11 | 0.085 | 0.092 | 0.077 | 0.075 | 0.070 | 0.086 | 0.077 | 0.114 | 0.075 | 0.049 |
| A12 | 0.075 | 0.105 | 0.090 | 0.084 | 0.081 | 0.062 | 0.083 | 0.105 | 0.099 | 0.076 |
| A13 | 0.089 | 0.097 | 0.100 | 0.088 | 0.072 | 0.058 | 0.091 | 0.096 | 0.042 | 0.082 |
| A14 | 0.110 | 0.088 | 0.098 | 0.069 | 0.094 | 0.058 | 0.091 | 0.096 | 0.085 | 0.067 |
| A15 | 0.083 | 0.083 | 0.090 | 0.080 | 0.070 | 0.081 | 0.080 | 0.109 | 0.085 | 0.051 |
| I | 0.110 | 0.110 | 0.109 | 0.095 | 0.095 | 0.103 | 0.093 | 0.093 | 0.099 | 0.093 |
| AI | 0.054 | 0.081 | 0.070 | 0.060 | 0.054 | 0.056 | 0.068 | 0.128 | 0.040 | 0.048 |
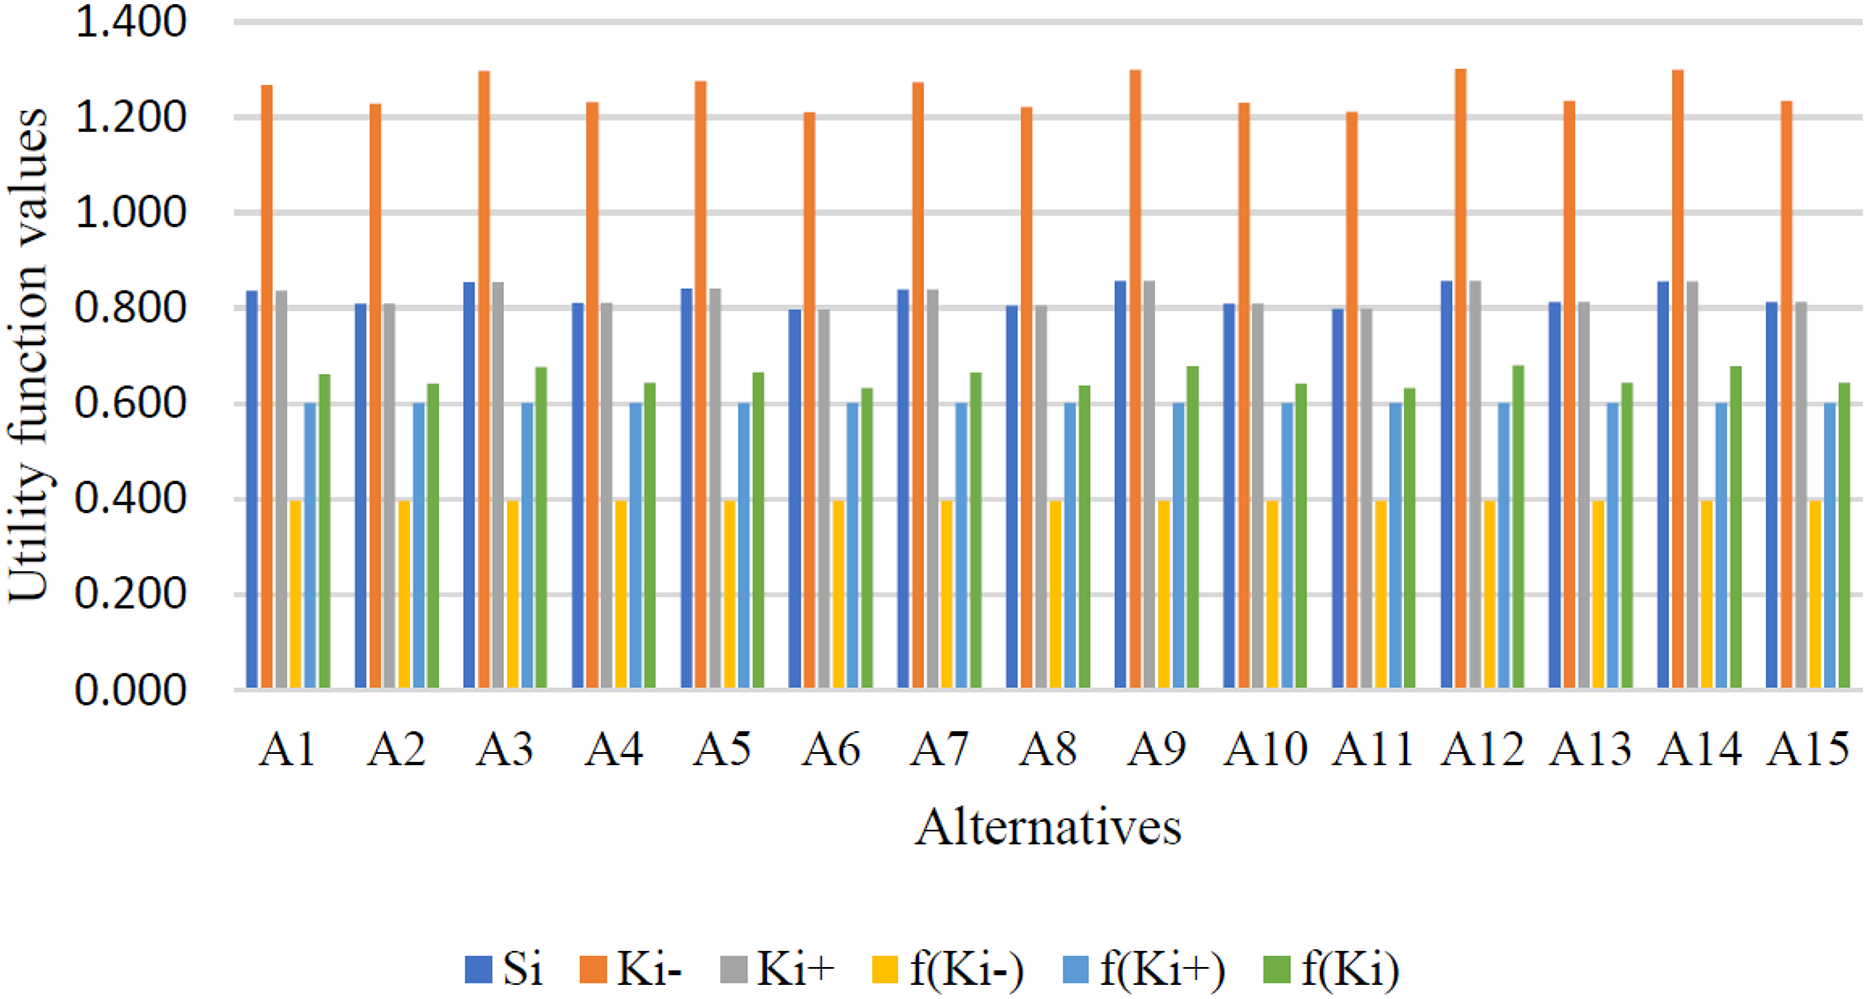
Table 16 shows the utility degree and utility function of alternatives. Additionally, Fig. 4 presents a graphical representation of the other options.
| A1 | 0.836 | 1.269 | 0.836 | 0.397 | 0.603 | 0.6628 | 7 |
| A2 | 0.810 | 1.229 | 0.810 | 0.397 | 0.603 | 0.6421 | 12 |
| A3 | 0.855 | 1.297 | 0.855 | 0.397 | 0.603 | 0.6776 | 4 |
| A4 | 0.812 | 1.232 | 0.812 | 0.397 | 0.603 | 0.6436 | 10 |
| A5 | 0.841 | 1.276 | 0.841 | 0.397 | 0.603 | 0.6665 | 5 |
| A6 | 0.798 | 1.210 | 0.798 | 0.397 | 0.603 | 0.6323 | 15 |
| A7 | 0.840 | 1.274 | 0.840 | 0.397 | 0.603 | 0.6657 | 6 |
| A8 | 0.805 | 1.222 | 0.805 | 0.397 | 0.603 | 0.6383 | 13 |
| A9 | 0.857 | 1.301 | 0.857 | 0.397 | 0.603 | 0.6795 | 2 |
| A10 | 0.811 | 1.230 | 0.811 | 0.397 | 0.603 | 0.6425 | 11 |
| A11 | 0.799 | 1.213 | 0.799 | 0.397 | 0.603 | 0.6334 | 14 |
| A12 | 0.858 | 1.302 | 0.858 | 0.397 | 0.603 | 0.6803 | 1 |
| A13 | 0.814 | 1.234 | 0.814 | 0.397 | 0.603 | 0.6448 | 8 |
| A14 | 0.857 | 1.300 | 0.857 | 0.397 | 0.603 | 0.6792 | 3 |
| A15 | 0.813 | 1.234 | 0.813 | 0.397 | 0.603 | 0.6447 | 9 |
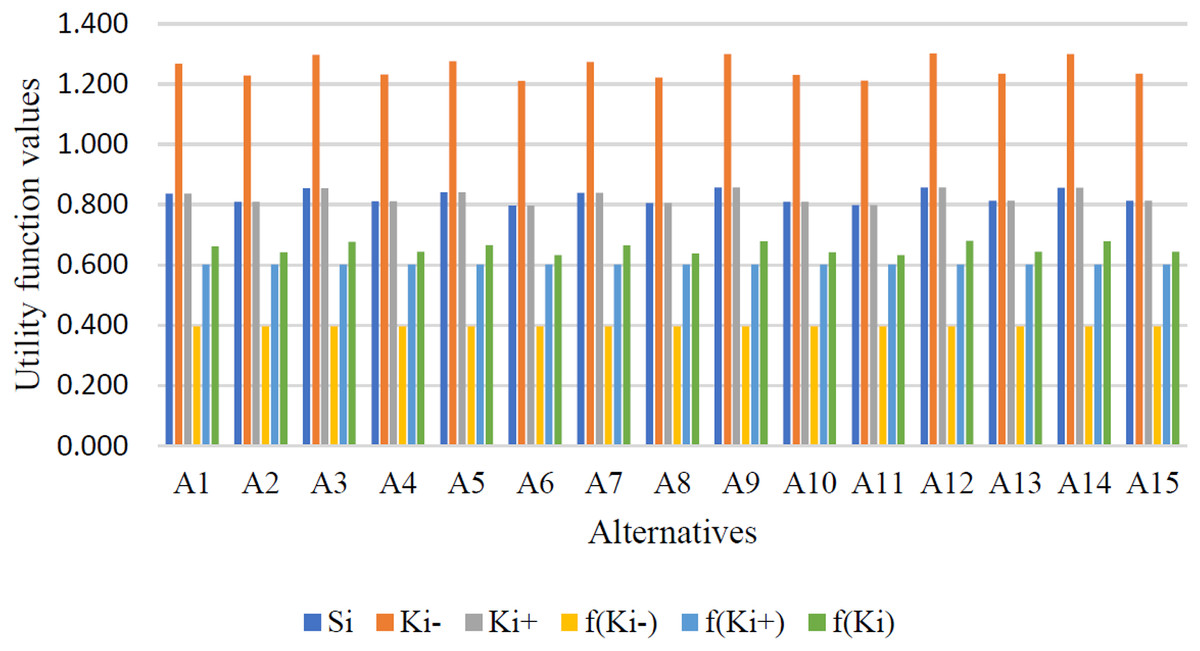
Figure 4: Ranking of alternatives based on utility function.
Result discussion
The study confirmed the use of the IVSF-MARCOS approach in determining the VM of a graduate in college, which covered fifteen alternatives by five decision-makers, with ten criteria in the process. In line with this, (Sports and Recreation) stood as the most positive career choice to be made by the focus target group. The resulting ranking can be explained in terms of the combined individual assessment of a wide range of decision-makers, and here was repeatedly evaluated on particularly high utility concerning critical aspects such as job satisfaction, work-life balance, and alignment with personal interests, which in the given context of group decision-making possessed relatively higher weights. On the other hand, the worst ranking was achieved by (Information Technology) Due to various reasons, decision-makers encountered high entry barriers, skill mismatches, job burnout risks, and oversaturation in the job market. Such views were also manifested in the language assessments, which, translated into IVSFVs, resulted in lower normalized scores according to some of the most important criteria. Although such an outcome might seem to contradict common sense regarding global demand for IT professionals, it represents the subjective ideas and regional employment trends reviewed by the assessors within the context of this work. Therefore, the outcome does not indicate that IT as a career choice is undesirable at all, but rather that it is viewed as less desirable at present by the chosen panel within the given contextual constraints. was followed by , and , which were attributed to their conformance with the evaluation criteria, which was relatively high. On the other hand, , , and performed worse, which is an indicator of future training, a higher degree of alignment between graduate ability and job skills, or curriculum upscaled to meet those needs.
The IVSF-MARCOS approach enabled comprehensive and robust evaluations by gathering a variety of expert opinions and addressing uncertainty and subjectivity within the method. The ability to incorporate criterion weights and multi-perspective proposals makes the methodology closely resemble real-world decision-making, especially when forecasting career paths. The results not only highlight strong areas but also identify weaker points that require intervention. This allows institutions and policymakers to implement more effective systems to support graduates, helping them better integrate into the labor market and increase their vocational mobility.
Theoretical implications
By applying the IVSF-MARCOS method to the assessment of VM, this study advances the theoretical understanding of MCGDM in predicting career progression. In this regard, it enhances the use of the IVSFS in analyzing uncertainty, ambiguity, and complexity underlying VM evaluations informed by fuzzy set theory. First, incorporating IVSFS into the matrix expanded the strength of the MARCOS approach in handling both qualitative and quantitative aspects effectively. Unlike other FS methods, IVSFS provides a better representation of weak preferences and decision-maker hesitations by implementing interval values for MD, AD, and NMD. This extension is essential to accommodate the needs of various decision-makers with different levels of proficiency. Second, this study addresses a major gap in VM literature by proposing a reliable decision support system. Using ten criteria, fifteen alternatives, and five decision-makers further demonstrates the generalizability of the IVSF-MARCOS method in real-world situations. The criteria for ranking options and forecasting future careers form the foundation of decision science theories, especially regarding the learning process and human capital development. Additionally, the findings enrich existing literature on applying MCGDM techniques to complex decision-making issues. Based on these results, the integration of improved fuzzy extensions, including IVSFS, should be recommended for fields characterized by uncertainty and multidimensionality. Consequently, this work not only complements existing research but also provides a conceptual foundation for future MCGDM studies, focusing on practical applications of these techniques.
Comparison analysis
The comparison analysis in Table 17 provides an overall comparison of the IVSF-MARCOS methodology in contrast to other MCDM methods, including VIKOR (Ali & Naeem, 2023), TOPSIS (Hussain et al., 2024), WASPAS (Jaleel, 2022), DEMATEL (Naz, Saeed & Butt, 2024), EDAS (Ali, Ashraf & Hayat, 2024), and COCOSO (Wang, Mahmood & Ullah, 2023). Among the evaluated properties, the presented IVSF-MARCOS method has the highest effectiveness in working with uncertainty for MCDM, providing higher (resulting in fewer deviations in the results) robustness compared to most methods: VIKOR and EDAS, etc. Although it falls in the medium range on the complexity scale, it strikes a versatile balance between sophistication and ease of use, making it suitable for a wide range of decision-making processes. The primary advantage of the methodology is that it can be easily adapted to incorporate other criteria and consultants’ opinions, which is not easy with the use of VIKOR or TOPSIS. Moreover, IVSF-MARCOS provides a specific sensitivity analysis to ensure stability in the decision-making result and is crucial in the event of any changes in the input data. Compared to TOPSIS or WASPAS methods, it may be less efficient computationally. Still, it serves its purpose well, offering highly accurate results for applications such as vocational mobility prediction, where high levels of uncertainty and multiple decision-makers are present.
| MCDM methods | IVSF-MARCOS | VIKOR | TOPSIS | WASPAS | DEMATEL | EDAS | COCOSO |
|---|---|---|---|---|---|---|---|
| Handling uncertainty | High | Medium | Medium | Medium | Medium | Medium | Medium |
| Robustness of results | High | High | Medium | Medium | Medium | High | Medium |
| Flexibility in criteria | High | Medium | Medium | Medium | High | Medium | Medium |
| Ease of implementation | High | Medium | High | High | Low | Medium | Medium |
| Sensitivity analysis | High | Medium | Medium | Medium | High | High | Medium |
| Application versatility | High | Medium | Medium | Medium | Medium | Medium | Medium |
| Adaptability to multiple experts | High | Medium | Medium | Medium | High | Medium | Medium |
It is based on the discussion of the VM case study provided and is seen as a qualitative comparison of different MCDMs, drawing on literature about the qualities of specific decision-making properties. This is not meant to highlight the methodological advantages and limitations of IVSF-MARCOS but to outline general methodological strengths and weaknesses. The study has not conducted an empirical analysis of applying various MCDM techniques to the same data in detail. Such an empirical assessment is suggested as a future research direction, where the results of different approaches will be compared and differences discussed in terms of robustness, accuracy, and ability to handle uncertainty. Overall, the IVSF-MARCOS method can be viewed as a resilient, flexible, and integrated decision-making framework that is practical for real-world MCGDM issues.
Sensitivity analysis
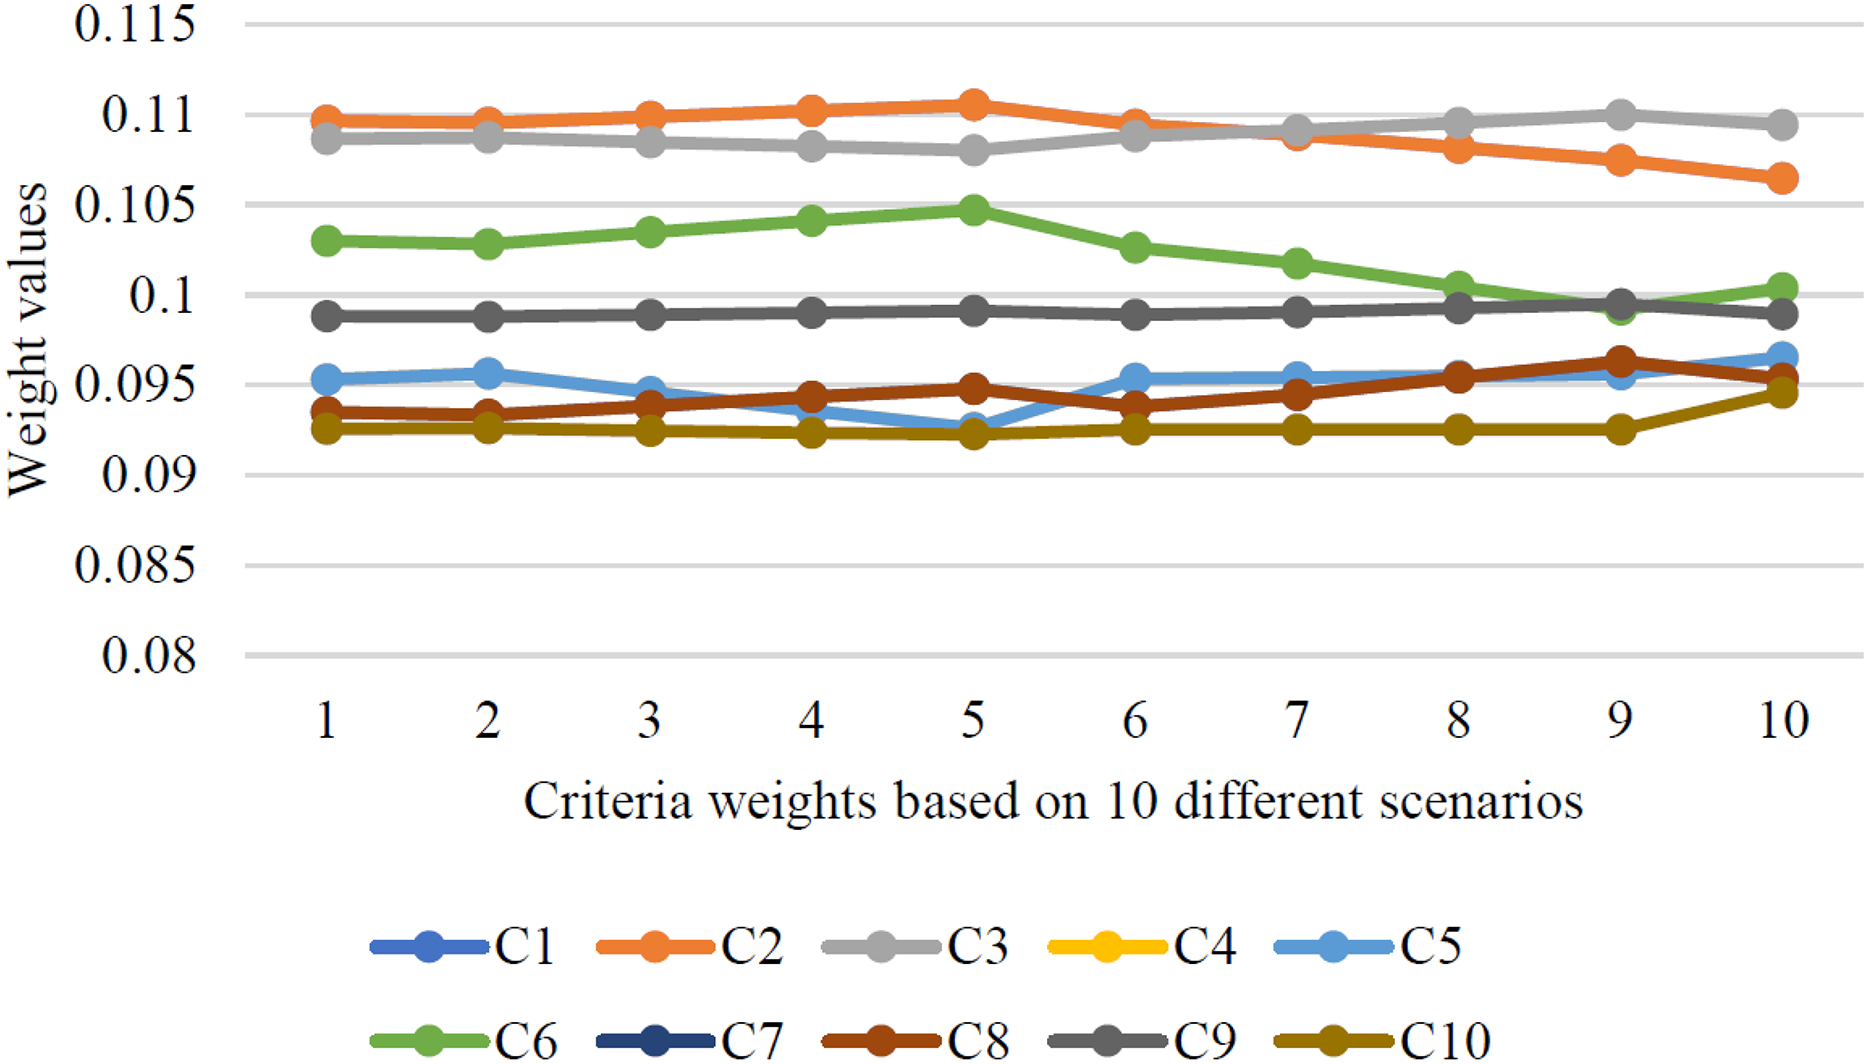
Sensitivity analysis assesses how changes in the weights of criteria coefficients influence the decision-making process, as shown in Fig. 5. The responses from decision-makers are converted into IVSFVs, and artificial adjustments are made to these IVSFVs to examine how such modifications impact the results. These changes subsequently alter the weights assigned by decision-makers, affecting the overall criteria weights and, ultimately, the ranking of alternatives. The graph also displays an analysis of weights across 10 scenarios, where small variations highlight the impact of embedded features on criteria importance and their effect on outcomes. This article aims to demonstrate that despite fluctuations in the assigned weights, this methodology remains quite stable, confirming the effectiveness of the IVSF-MARCOS approach in identifying priorities among alternatives related to career path prediction.
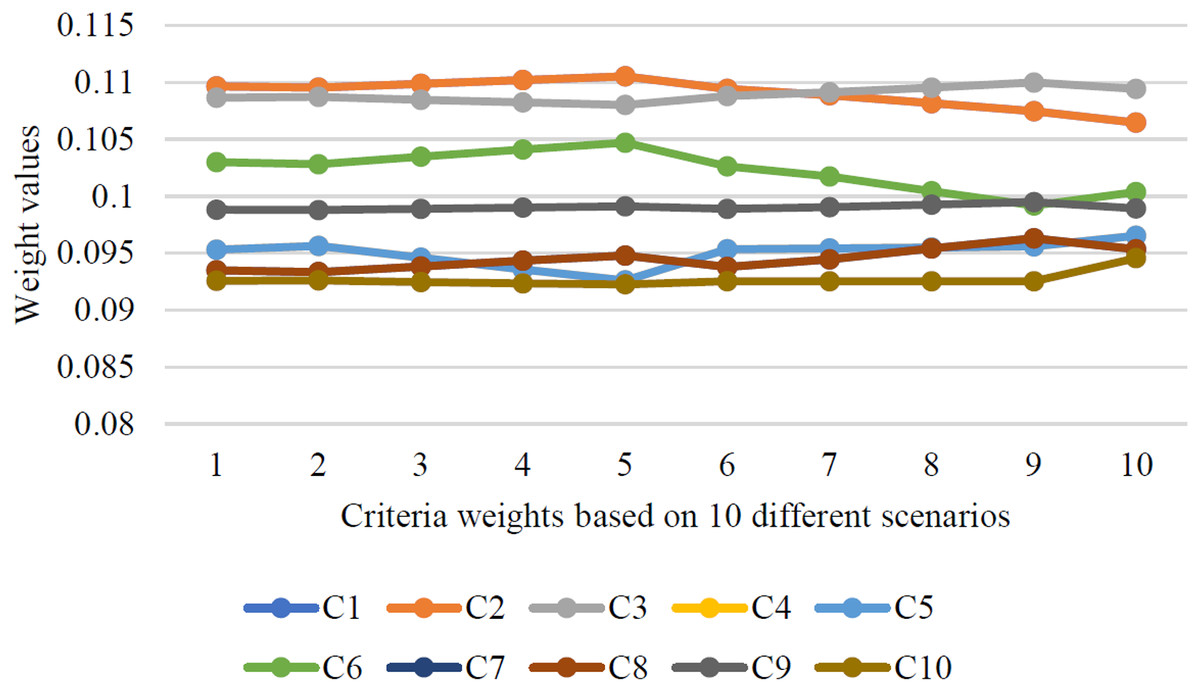
Figure 5: Criteria weights based on ten different scenarios.
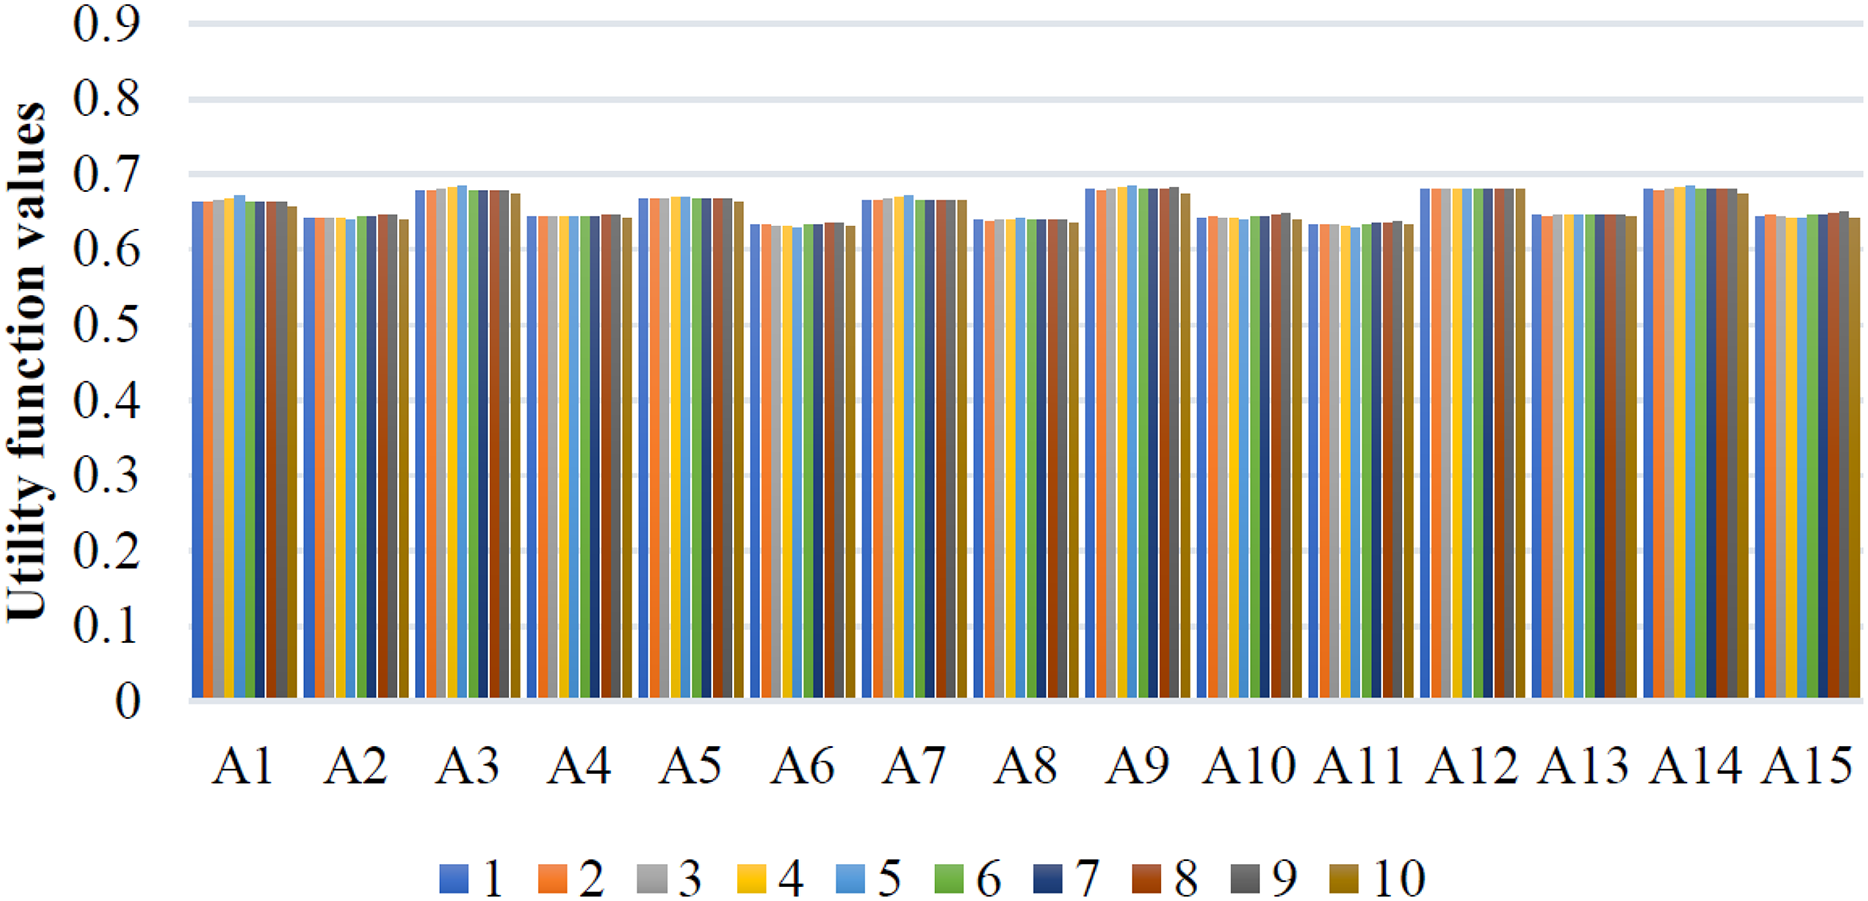
The sensitivity analysis of the case with different rankings under the weight coefficients is shown in Fig. 6. The utility functions of the alternatives are estimated for each of the 15 options across the 10 scenarios to establish consistency in the rankings. The weight variation ranges are indirectly derived from changes in linguistic assessments (e.g., from “very high” to “high”) that reflect plausible real-world uncertainty in expert judgment. The outcomes also demonstrate that the ranking of alternatives remains constant, while the changes in utility values are marginal across different scenarios. This shows the stability of the proposed IVSF-MARCOS approach suggesting reliable rankings of alternatives for vocational mobility and career progression when decision-makers have modified the weight of criteria. Such more consistent results reflect the fact that the method in question can withstand dynamic decision-making environments efficiently.
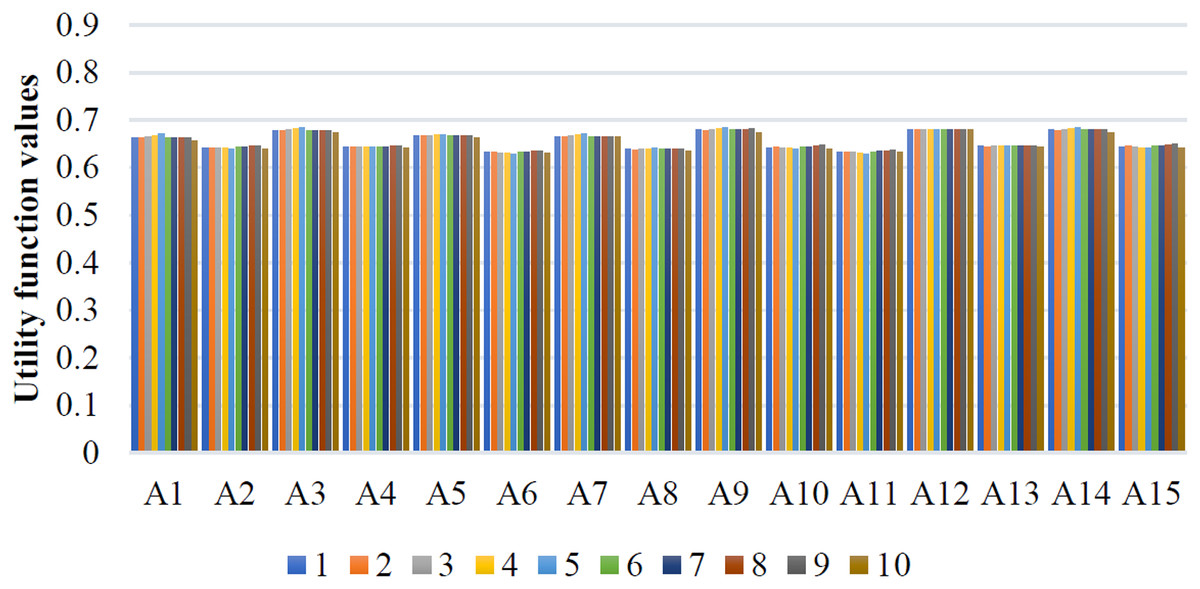
Figure 6: Ranking of alternatives based on ten different scenarios.
Practical implications
As such, this research’s practical utility can be applied to educational planning, career information, and workforce training and development to improve stakeholders’ VM and career trajectory.
Guidance for educational institutions: The IVSF-MARCOS methodology proposed in this article provides educational institutions with a comprehensive method to assess and align their academic offerings with the labor market’s requirements. VM can be used to evaluate graduates’ abilities to meet industry needs so that curricula can be developed to improve employment opportunities for graduates.
Support for career counselors: Career counselors can then use the rankings and findings of this method to support their findings for the graduate. By determining and matching ideal career fields to the graduates’ skills and career interests, counselors can thereby direct our graduates to better and more secure careers.
Policy development: It suggests the employment gaps that need to be filled and provides ideas for policies that will improve workers’ readiness for the workplace. For instance, determining sectoral skills deficits or occupations in high demand facilitates the formulation of policies that can enhance programs to train relevant skills or encourage emerging sectors.
Corporate talent management: The proposed framework can be used by employers and human resource professionals to evaluate applicant fitness for certain positions, considering multiple factors and criteria of their competencies and preferences. This approach is helpful in recruitment and talent management, where one can match the organization’s needs with the employee’s skills and talents.
Scalability to other domains: Despite being centered on VM, the presented approach can be adjusted for other multidimensional decision-making problems, including project selection, healthcare resources, or supply chain management. Therefore, the versatility is evident since the IVSF-MARCOS method may be used in various disciplines.
Enhancing graduate employability: The framework thus enables graduates to predict their career paths systematically, enhancing their career choice decisions.
Limitations
While the proposed IVSF-MARCOS methodology provides a robust framework for assessing VM and career path prediction, several limitations must be acknowledged:
Subjectivity in criteria weighting: In a way, the determining of criteria importance involves the opinions of the experts, which are rather subjective. While the employment of IVSFS remarkably reduces uncertainty, decision-making might still be distorted by the biases or preferences of the decision-makers involved.
Possibility of expert bias: Although expert decision-makers were carefully selected based on their knowledge and experience, subjective judgments may still introduce bias, potentially influencing the final evaluation.
Dependency on data quality: The results obtained can be as accurate or inaccurate, as reliable or unreliable as the input data entered in the model. Any discrepancy, data gap, or error could be found in the evaluation process, leading to further distortions of rankings and conclusions.
Case-specific application: The authors investigate principally one particular case concerning the VM evaluation for college graduates, which might make it difficult to generalize the conclusions. It is necessary to study the applicability of the given methodology beyond the industrial context and other educational systems.
Assumption of decision-maker consensus: The methodology implies that decision-makers share a significant level of consensus regarding the assessment criteria and potential rankings. However, there are circumstances where distinctly opposing ideals are deemed valid, and thus, efforts to reach comprehensible results might become more complicated.
Focus on static scenarios: The current implementation deals with static decision-making problems. Nonetheless, VM occasionally results from other temporal factors, such as the state of the economy, technological changes or society’s quest for additional value, which are not contained in this research.
Advantages of the study
The proposed study offers numerous advantages, demonstrating its value as a robust decision-making framework for evaluating VM and predicting career paths. Key advantages include:
Enhanced decision-making precision: By incorporating IVSFS into the MARCOS method, the study improves the accuracy of the methods in addressing the uncertainty and vagueness characteristic of most decision-making processes.
Comprehensive multi-criteria framework: Since the IVSF-MARCOS method involves a set of criteria, we can evaluate all the aspects of the VM at once. This holistic model responds to the variability of factors relevant to determining career trajectory choices, including skills, demand in the marketplace, and interests.
Flexibility and adaptability: The proposed method can, hence, be used in decision-making settings other than VM, such as project evaluation, policy formulation, and resource allocation.
Systematic career path prediction: The article presents a taxonomy to facilitate career trajectory prediction, increasing graduates’ probability of successful occupational choice. The systematic approach enables the transition between educational achievements and the demands of the labor market.
Support for stakeholders: This research methodology is applicable to educational institutions, career counselors, policymakers, and employers. This article provides practical insights into curriculum content, career direction, and workforce supply management.
Improved graduate employability: The framework improves the connection between vocational training and career guidance and employment, hence improving the quality of career achievements and subsequently boosting productivity for society.
Validation through multi-decision-maker input: Gathering and combining the opinions of multiple decision-makers leads to multiple focused and balanced points of view, thus increasing the reliability and credibility of the results.
Innovative methodology: The proposed combination of IVSFS with the MARCOS method is a new addition to the literature on decision-making and provides a modern tool with which researchers and practitioners can tackle challenging issues.
Scalable and reproducible approach: Therefore, the above-proposed framework is also extendable to many datasets and applicable to other industries or regions to meet the requirements of various decision-making situations.
Validation of results
Subsequently, its results must be validated to determine the accuracy and generalizability of the proposed IVSF-MARCOS approach for evaluating vocational mobility and forecasting career progression. To achieve this, various validation measures were implemented as follows. Five decision-makers from different professions provided comprehensive results with minimal biases, as they all analyzed the criteria and options. Consistency checks were performed to verify the homogeneity of the decision-making process regarding the assigned weights and the ranking of alternatives. An additional, extensive sensitivity analysis was conducted to ensure that the assessment results remain stable under different weighting scenarios, clearly demonstrating that the proposed approach is robust. Furthermore, the framework, based on conventional MCDM techniques, revealed that the IVSF-MARCOS methodology handles uncertainty and vagueness more effectively. The real data involved examining fifteen alternatives and ten criterion values representing key factors influencing career choices. The subjects’ assessments aligned with rational business estimates, confirming the framework’s applicability at the organizational level. Lastly, the theoretical foundation for using IVSF and MARCOS was supported by a literature review highlighting these techniques’ relevance in solving complex decision problems. All these validation efforts collectively contribute to establishing the legitimacy and accuracy of the proposed framework, paving the way for its practical application and encouraging further rigorous validation in future research.
Conclusion
This study explored the enhancement of VM to predict the career paths of college graduates using the IVSF-MARCOS framework. The research effectively evaluated fifteen alternatives across ten different criteria, with inputs from five decision-makers, offering a practical approach to managing the complexities of MCGDM. As a key factor in career advancement, vocational mobility was assessed based on the alignment of graduates’ competencies with market needs. The methodology developed enabled the identification of the best options and allowed for the formulation of measures to improve lower-ranked alternatives, thereby supporting stakeholders in decision-making. The integration of IVSFS and MARCOS improved assessment accuracy by capturing the inherent uncertainty in decision-making cases. Ultimately, achieving more comprehensive and accurate career path predictions for college graduates became a primary goal of VM, indicating that targeted measures are necessary to accomplish this objective.
Further research can be conducted from here, including dynamic vocational assessments that predict career choices based on current job market information. Expanding these to others, such as social mobility, digital competencies, and lifelong learning, can enhance the richness of assessment. Further, incorporating the IVSF-MARCOS methodology in domains like supply chain management (Kousar et al., 2024), decision-making under spherical fuzzy sets (Garg & Ur Rehman, 2024), interval-valued t-spherical fuzzy sets (Nazeer, Ullah & Hussain, 2023; Ullah et al., 2021), complex picture fuzzy sets (Nazeer et al., 2024), and neutrosophic fuzzy sets (Anwar et al., 2024) can also show the applicability of this method.