
A novel human-inspired solution to high-dimensional optimization problems
- Published
- Accepted
- Received
- Academic Editor
- Davide Chicco
- Subject Areas
- Algorithms and Analysis of Algorithms, Artificial Intelligence, Optimization Theory and Computation
- Keywords
- Optimization models, Image segmentation, Feature selection, Benchmark testing
- Copyright
- © 2025 Balaji et al.
- Licence
- This is an open access article distributed under the terms of the Creative Commons Attribution License, which permits unrestricted use, distribution, reproduction and adaptation in any medium and for any purpose provided that it is properly attributed. For attribution, the original author(s), title, publication source (PeerJ Computer Science) and either DOI or URL of the article must be cited.
- Cite this article
- 2025. A novel human-inspired solution to high-dimensional optimization problems. PeerJ Computer Science 11:e3344 https://doi.org/10.7717/peerj-cs.3344
Abstract
A novel human-inspired metaheuristic framework, named Sastha Pilgrimage Optimization (SPO), mimics the optimization strategies inherent in the Sabarimala pilgrimage structure and the dynamics of pilgrims’ group behaviors. This methodology utilizes the significant characteristics of the practice, including Guruswamy’s selection (Leader), adaptive group interaction, and trade-offs between exploration and exploitation. It features a leader-based decision mechanism that balances individual performance with group harmony, guided by the most experienced participant. The exploration phase aims to cover a vast search space with dynamic updates in position. In contrast, in the exploitation phase, fine-tuning is achieved with adaptive coefficients and Lévy flights that guarantee convergence to global optima. The mathematical model of the algorithm incorporates new performance and distance threshold values, ensuring that route choices align with both individual and group objectives. A new human-inspired design by SPO can overcome the limitations of nonlinear, high-dimensional optimization challenges when compared to standard methods. The algorithm was benchmarked with over ten complex functions and validated on two datasets: the Cardiovascular dataset for feature selection and classification, and the Brain Tumor MRI dataset for image segmentation. These contributions make SPO a scalable, efficient, versatile optimization tool adaptable to domains requiring precise, high-dimensional decision-making.
Introduction
Many scientific, technical, and computational initiatives are centered around optimization, which is improving systems, processes, or algorithms for optimum efficiency. It has several uses, from resolving intricate mathematical issues to optimizing artificial intelligence programs. Fundamentally, optimization involves selecting the optimal choice from a range of workable options, considering specific limitations and goals. Optimization issues in mathematics often involve maximizing or minimizing an objective function while adhering to specified constraints (Kaabneh et al., 2024; Mohamed, Hadi & Mohamed, 2019). The three primary components of an optimization problem are constraints, the objective function, and the decision variables. To maximize the objective function, optimization seeks to determine the optimal values of the decision variables while considering the constraints. Deterministic and random approaches are the two categories of optimization problem-solving techniques. Deterministic methods can handle optimization problems that are linear, continuous, differentiable, and convex. The drawback of these methods is that they cannot address high-dimensional, nonlinear, nonconvex, and nondifferentiable problems, as well as discrete search spaces. These are some of the characteristics of real-world optimization problems that have made deterministic techniques ineffective. Stochastic algorithms, especially metaheuristic algorithms, have been introduced to overcome this difficulty (Abdel-Basset et al., 2023; Dehghani & Trojovský, 2022).
An optimization problem needs to be solved in four steps. The first stage involves determining the problem’s parameters. The optimization problem may then be classified as either continuous or discrete based on these parameters. Second, it is necessary to identify one or more constraints that govern the parameters. Constrained optimization and unconstrained optimization are the two categories into which optimization issues are divided by constraints. Third, the objectives of the problem need to be carefully examined and considered. Single-objective and multi-objective tasks are the names given to the optimization (Houssein et al., 2020; Moosavi & Bardsiri, 2019). The optimization problem must then be solved by selecting an appropriate optimizer based on the constraints, parameter types, and number of goals. Most optimization problems in the real world are often extremely nonlinear and noncontinuous, involving multiple design variables and complex constraints. The primary concept guiding the optimization process in some bio-inspired algorithms is believed to be the collective behavior of insects or animals. Swarm intelligence algorithms are a group that includes these kinds of algorithms. Ant colony optimization (ACO) (Dorigo, 2007), the social spider algorithm (SSO) (Cuevas & Cienfuegos, 2014), and numerous other algorithms fall under this area. Incorporating natural principles into these algorithms has increased their capacity for optimization and drawn interest from researchers now working on developing new swarm intelligence systems.
However, several optimization algorithms, known as human-inspired algorithms, have been based on human behavior. Examples of these are Harmony Search (HS) (Gholami, Ghany & Zawbaa, 2020) and the seeker optimization algorithm (SOA) (Zhu, Dai & Chen, 2013). Numerous methods inspired by nature are apparently available and effective for a variety of optimization issues. However, the No Free Lunch (NFL) theorem declares that not all optimization problems may be solved effectively by the optimization technique. Thus, even though metaheuristic algorithms have advanced to extremely powerful levels, there is still room for the development of further nature-based metaheuristic algorithms with intelligence features in the hopes of effectively solving some challenging optimization problems (Al-Betar et al., 2021; Dehghani & Trojovský, 2022). When compared to other nature-inspired algorithms, algorithms like HSA produce pleasing outcomes, leading to the emergence of human-based nature-inspired phenomena in recent years. In this research, a novel algorithm inspired by humans was proposed. Based on the Sabarimala pilgrimage, the Sabarimala optimization algorithm was developed (Joseph et al., 2019; Li et al., 2022).
The major contributions of this study are summarized as follows:
The study proposes a novel metaheuristic algorithm, termed Sabarimala Pilgrimage Optimization (SPO). The algorithm is inspired by the real-life behaviours of devotees during the Sabarimala pilgrimage, incorporating chanting-based exploration, leader-follower route formation, and adaptive group repositioning dynamics to achieve balanced global and local search.
The proposed SPO algorithm integrates Lévy flight mechanisms and adaptive chanting control to escape local optima and enhance convergence speed effectively.
The proposed SPO algorithm is rigorously evaluated using both CEC2020 and CEC2022 benchmark function suites, across low-and high-dimensional settings to validate its scalability, robustness, and optimization capability.
The article is organized as follows: In ‘Background’, the pertinent literature is summarized. ‘Materials and Methods’ explores the proposed approach of SPO. The performance validations are described in ‘Results’. ‘Conclusion’ contains the article’s conclusion.
Background
Human-inspired algorithms are sophisticated optimization techniques that mimic human societies in complexity, adaptability, and collaboration. Such algorithms are in high demand for research to address high-dimensional optimization problems, whereas traditional definitive methods have become ineffective due to the exponentially increasing search space. Researchers have presented several human-inspired algorithms to solve optimization problems efficiently. These methods enable the discovery of either optimal or nearly optimal solutions by leveraging societal, political, and behavioral dynamics. When the search space grows exponentially with the problem size and an exhaustive search is no longer possible, high-dimensional optimization problems cannot be resolved using decisive optimization approaches. To solve this issue, researchers employ approximation techniques.
One of the pioneering works in this field is the Social Mimic Optimization (SMO) proposed (Ghosh et al., 2020) for optimizing problems with a continuous solution space. It is indicated by observing the way members of society behave. It minimizes a specified fitness function to effectively search for an optimal or nearly optimal solution in the solution space. According to the societal theme, (Dehghani, Mardaneh & Malik, 2020) the Following Optimization Algorithm (FOA) was developed, miming the socioeconomic community dynamics of a community’s citizens. People in a particular community follow one another to make their community better and more ideal. FOA is a straightforward algorithm applied by the individuals in each society to find the highest standing citizen within that society according to a coefficient fat each algorithm step.
In Wang, Zhong & Liu (2012), the authors suggested a more effective optimization strategy for engineering optimization problems. This improved optimization algorithm is called the Gravitational Search Strategy-assisted Rider Optimization Algorithm (GSSROA), where the gravitational search strategy (GSS) and the Rider Optimization Algorithm (ROA) are integrated. Each iteration of the GSSROA has the potential to adjust the search step adaptively. Three benchmark engineering design problems have been tested to evaluate the performance of the GSSROA. Zeidabadi et al. (2021) was designed with a new optimizer called the Mixed Leader Based Optimizer (MLBO), which was proposed to handle optimization problems. The MLBO aimed to improve the iteration by updating the population through the best population member and a random member combination to produce a new leader member.
Duan, Luo & Liu (2022) suggested the multi-strategy seeker optimization algorithm (MSSOA) for engineering issues with optimization constraints. This work used three tactics to enhance the SOA’s inadequate searching capabilities. Triple black hole system capture was the first approach to solving the local optima problem. The second and third methods, multi-dimensional random and precocious interference, were used to balance the exploration and exploitation processes. The method by which these three tactics cooperate is known as multi-strategy; each of these strategies is suggested to enhance the SOA algorithm in turn, and they are contrasted with each other to enhance the SOA algorithm collectively for optimizing 15 benchmark functions. Dehghani & Trojovský (2022) created the Election-Based Optimization method (EBOA), a novel optimization method, to simulate the vote procedure for choosing the leader. EBOA was primarily inspired by the voting process (Trojovský & Dehghani, 2022), the leader’s selection, and the impact of public awareness level on the leader’s selection. Under the direction of the elected leader, the EBOA population is directed by the search space. The two stages of EBOA’s process exploration and exploitation were represented numerically.
Askari, Younas & Saeed (2020) developed a completely new global optimization algorithm named Political Optimizer (PO) based on the idea of complex politics. PO is a mathematical description of each key phase of politics: the affairs of the parliament, switching of parties, the division of constituencies, campaigning for the election, and intra-party elections. The proposed algorithm logically partitions the population into political parties and constituencies while bestowing on every solution the role of performing both roles. This permits each contestant to alter its opinion concerning the party leader and the constituency winner. The other newly proposed method for updating positions is the position updating strategy based on recent past, also known as the Recent Past-based Position Updating Strategy (RPPUS). It models mathematically the patterns of learning that the politicians experienced in the last election. Kilic, Essiz & Keles (2023) also introduced the feature selector that employs the human-inspired Anarchic Society Optimization algorithm. The authors were motivated to conduct this investigation since the suggested method is based on human behavior and has never been applied to the FS problem. Nine benchmark datasets from the UCI machine learning library are used to assess the effectiveness of the suggested method.
Wang, Zhong & Liu (2012) developed the group search optimizer (GSO), an innovative optimization method that draws inspiration from animal behavior, specifically, animal searching behavior. The producer-scrounger paradigm, on which the framework is largely found, asserts that group members search for opportunities to “join” (scrounger) or “find” (producer). Using this framework, the best searching techniques for resolving continuous optimization issues are designed by figuratively utilizing ideas from animal searching behaviour, such as animal scanning mechanisms. Rao, Savsani & Vakharia (2011) proposed Teaching–Learning-Based Optimization (TLBO), a novel and effective optimization technique for mechanical design issues. This method focuses on how a teacher’s influence impacts students. Like other nature-inspired algorithms, TLBO is a population-based method that uses a population of solutions to progress toward the global answer. A class or a group of learners is regarded as the population. The first half of the TLBO process falls under the “Teacher Phase”, and the other half under the “Learner Phase”. “Learner Phase” is learning from students through student interaction, while “Teacher Phase” is the learning done by the student from the teacher.
All these human-inspired algorithms come with different mechanisms to combat the hardness of optimization in high dimensions. In all cases, balancing exploration and exploitation is essential for strong performance on various tasks. These algorithms provide innovative solutions to problems where traditional approaches are invalid or inapplicable, primarily by modeling complex human behaviors such as mimicry, leadership selection, and social dynamics. Nonetheless, these approaches come with challenges, including parameter sensitivity, computational complexity, and the possibility of converging too early due to poorly designed search spaces.
Chou & Liu (2023) introduced the Pilgrimage Walk Optimization (PWO) algorithm that draws inspiration from the distinctive Matsu bobee culture of Taiwan. According to folk belief activities, such as divination block casting, pilgrimage, the leisure ceremony, crawling beneath the palanquin, palanquin robbing, and return palanquin ceremony, the PWO algorithm’s search behavior mimics the assembly of devotees following Matsu’s palanquin and their collective movements. Eventhough this algorithm is not tested with direct CEC benchmark functions, it is tested on implied CEC style based benchmark functions. Zhu et al. (2024) presented the Human Memory Optimization Algorithm (HMO) a novel human-based metaheuristic inspired by the way humans store, recall, and forget information to solve problems. Its fundamental concept models memory processes to balance exploration and exploitation. The algorithm progresses through key stages: encoding (storing candidate solutions in memory), retention (preserving high-quality solutions), recall (retrieving and reusing promising memories), and forgetting (discarding weak solutions). This cycle enables adaptive search and efficient optimization across complex problem landscapes. This algorithm is tested for Benchmark function in CEC 2013. To address optimization issues, the Potter Optimization Algorithm (POA) was presented by Hamadneh et al. (2024). The two stages of inquiry and exploitation of human pottery-making process serve as the basis for mathematical modeling of POA. Mathematical modeling is used to plan the exploration phase, which involves making significant alterations to clay in accordance with the specified pattern. The exploitation phase is planned using mathematical modeling to make precise, limited modifications to the produced pottery in order to increase its resemblance to the specified pattern. Hamadneh et al. (2025) presented the Tailor Optimization Algorithm (TOA), human-based metaheuristic algorithm. The fundamental concept of TOA design is derived from the steps a tailor takes to stitch clothing. Two stages of exploration and exploitation were used to formulate and then quantitatively model the theory of TOA. The design of exploration phase was predicated on simulating significant fabric modifications in accordance with garment pattern. The exploitation phase was aimed to handle intricacies of clothes by simulating minor alterations to stitched clothing. This algorithm is tested for Benchmark function in CEC 2011.
SMO and PO are human-inspired approaches. These introduce mechanisms such as leadership dynamics and societal behavior modelling, but have not yet overcome problems of parameter sensitivity and robustness across applications. Such limitations motivate the development of new, adaptive, and scalable optimization frameworks to handle real-world complexities. The Sabarimala pilgrimage motivated this work to develop the SPO algorithm, which aims to address these challenges by emulating collective decision-making, adaptive group dynamics, and structured leadership.
Materials and Methods
The SPO algorithm is motivated by the actions of pilgrims undertaking the Sabarimala pilgrimage. It couples chanting-driven movement, group behavior, and adaptive repositioning methodologies with the goal of emulating a balanced optimization search process. Early in the process, chanting-based coefficients control global exploration throughout the search space. Later, group-based route updates enable individuals to modify their trajectories based on the impact of the top-performing pilgrims. Lévy flight-based perturbations are utilized in the exploitation phase to assist in evading local optima and solution refinement. Additionally, adaptive repositioning according to proximity thresholds maintains diversity and prevents premature convergence. The complete operational workflow of SPO is demonstrated in the algorithmic pseudocode and depicted in the algorithm flowchart presented within the manuscript.
Sastha Pilgrimage Optimization-conceptual overview
The Shri Dharma Sastha Temple, also known as Sabarimala, devoted to Lord Ayyappa, is located on a hill at an elevation of approximately 467 m above sea level, nestled deep within Periyar Wildlife Sanctuary in the Pathanamthitta district in Kerala, India. This temple was recognized as one of the most prominent pilgrimage destinations in South India. Sabarimala attracts millions of devotees each year. The temple holds immense religious significance and symbolizes values such as faith, spiritual discipline, and devotion. The Sastha Pilgrimage Optimization (SPO) algorithm draws inspiration from the disciplined and structured practices observed during the Sabarimala pilgrimage. Key to this pilgrimage is the role of Guru Swamy, an experienced leader who guides devotees based on their capabilities, time constraints, and devotion levels.
The SPO algorithm draws inspiration from the disciplined and structured practices observed during the Sabarimala pilgrimage in Kerala, India. Key to this pilgrimage is the role of the Guru Swamy, an experienced leader who guides devotees based on their capabilities, time constraints, and devotion levels. This real-world behavior is mapped into the algorithm’s design as follows:
Leader selection
In the SPO algorithm, leader selection is motivated by the real-world practice of designating a Guru Swamy, a mature and experienced pilgrim responsible for leading the pilgrimage group. This character is metaphorically transferred to the fittest solution within the population, serving as the guiding point for all other individual devotees (solutions) during pilgrimage. The leader is chosen using a two-stage priority system based on performance and age. Every devotee is related to the count of previous participations successfully completed, referred to as visits. The devotee having the highest visit count is selected as Guru Swamy. This is in line with the respect and credibility that have been gained by experience. In case two or more pilgrims have the same number of visits, the oldest among them is elected as the leader. This guarantees the resolution of confusion in performance equivalence due to seniority. This two-stage criterion reflects the actual pilgrimage situation, where both devotion record and seniority dictate leadership.
Preparatory actions
The preparations to undertake the journey are called Kettunirakkal and involve elaborate rituals along with heavy packing. This preparation process makes Irumudi a critical item each devotee carries, representing offerings and their spiritual journey. The Leader puts the Irumudi on each devotee’s head. In reciprocation, each devotee pays a gratitude gesture. The Irumudi represents the surrender and willingness of the devotee for the spiritual journey.
The Leader is the spiritual leader and guide for the pilgrims. As the alpha figure in the group, the Leader clarifies and guides the pilgrims on several aspects of the pilgrimage, such as:
Explain the regulation and importance of Deeksha (spiritual vow).
Conducting and promoting devotional practices such as pujas (Prayers) and bhajans (hymns).
Resolving doubts and providing spiritual guidance on Lord Ayyappa and the pilgrimage traditions.
At every stage of the journey, the Leader ensures that the pilgrims stay disciplined, maintain their spiritual focus, and uphold the traditions of the pilgrimage.
Satisfaction of the leader
It is said that the pilgrimage’s success depends on the Leader’s satisfaction. Pilgrims are therefore encouraged to serve and assist the Leader in all possible ways, because pleasing the Leader means pleasing Lord Ayyappa himself. A smooth and disciplined pilgrimage, under the guidance of a satisfied leader, means that the divine blessings of Lord Ayyappa will be given to the devotees, culminating in a successful Sabari Yatra (travel). By aligning devotion, discipline, and service, the journey to Sabarimala becomes a spiritual and personal transformative experience for every pilgrim.
Route allocation to reach Sabarimala
The journey to the Shri Dharma Sastha Temple at Sabarimala is an incredible spiritual journey for millions of devotees. The route chosen often depends on factors such as the time available, the physical fitness of the pilgrims, and their age. In this context, the Leader is said to be “the leader and guide,” which enables him to choose the best-fitted path for his fellow travellers, wherein spiritual accomplishment shall go hand in hand with capability. The three main traditional roads to Sabarimala are the Erumeli road, the Vandiperiyar road, and the Chalakayam road, which help pilgrims come from various zones, as each path provides a different experience.
The Erumeli route is the oldest and most traditional path towards Sabarimala, immersed in the pilgrimage’s history and rituals. The pilgrims usually take this route mainly from the northwestern region, like Kottayam, Ernakulam, Thrissur, and Mangalore. The longest and most challenging route includes forest trekking and spiritual rituals. Pilgrims typically start from Erumeli and stage the Pettathullal, acting as if Lord Ayyappa were conquering evils. The rugged terrain consists of dense jungles, deep hills, rivers, and spiritual contact inside the body through arduous physical activities and devotion towards the deity. Such a route was important since it would mean penance for Lord Ayyappa.
The Vandiperiyar route is relatively more strenuous and much enjoyed by the faithful who come in droves from northeast districts, especially Idukki, Coimbatore, Dindigul, and Madurai. This route’s starting point is Vandiperiyar, a significantly shorter route than the Erumeli route. It also traverses attractive plantation and forest paths, undoubtedly extremely quiet and soul-rejuvenating. The Vandiperiyar route may be less physical, but it still requires an excellent fitness level.
This is a perfect option if anyone wants balance in devotion but a quite manageable trek. It particularly goes well with a group of devotees with mixed capability levels. Chalakayam is the closest road to Sabarimala and is preferred for short-term travellers and those of limited capabilities. Elderly people from southwestern areas such as Kollam, Thiruvananthapuram, Tirunelveli, and Kanyakumari can enter Sabarimala this way. A short walk, at a very short distance from the Pamba River, has been considered apt for aged people who can’ go due to pain and physical sicknesses. The Chalakayam route is kept well-maintained, ensuring that the devotees can also participate in the journey without the physical demands of longer treks and yet experience an equal connection with the divine. The Leader plays an important role in deciding the group’s route, considering the pilgrims’ time constraints, age, and physical fitness. For first-time pilgrims (Kanniswamy), the Leader may encourage the traditional Erumeli route to provide an immersive experience of the pilgrimage’s rituals and challenges. On the other hand, elderly pilgrims or people with limited time may be sent along the Chalakayam route, ensuring that the pilgrimage is as spiritually enriching as possible without exceeding their capabilities.
Mathematical formulation-PSO
The pseudocode for the proposed algorithm is depicted in Table 1. The following algorithm is designed to get the optimal route for devotees going to Sabarimala. It involves initialization, leader selection, objective function evaluation, exploration, exploitation, and termination criteria to achieve fruitful and feasible spiritual and physical journey.
| Initialize the no. of devotees, number of iterations ( ), , . |
| Selection of Guruswamy (Leader): |
| If two devotees have the same visits , ; |
| While ( ) |
| Calculate the fitness function |
| For each devotee , |
| If , select Erumeli route |
| Position update |
| If else, select Vandiperiyar route |
| Position = |
| If else , select Chalakayam route |
| Position update |
| end |
| Devotees repositioning, |
| Calculate the difference in each route and aggregate the solution |
| The devotee position is calculated using |
| Exploitation: |
| If Irumudi is present |
| ; |
| Else |
| end |
| End |
Initialization
Initialize the no. of devotees (population), , At each iteration, the current solution will be moved to a new neighbouring solution , number of iterations ( ), Eq. (1) represents each devotee as a solution vector.
(1) where (total population size).
Leader selection
The Leader is chosen based on the maximum number of visits ( ) of 18 to the shrine as per in Eq. (2):
(2) where represents the visit count of the devotee . As per Eq. (3), if two individuals have the same. the leader is selected based on the maximum age :
(3)
Objective function
The objective function evaluates the efficiency of each solution , aiming to minimize:
(4)
The objective function that assesses the solution involving a set of decision variables is denoted by . The range of values that can be assigned to each decision variable is ∈ , where . is the total number of decision variables, and that and and are the upper and lower bounds for the decision variable , respectively.
Phase I-exploration
The devotees, who were determined to attain devotion towards God, preferred to go by the Erumeli route, and they could not consider the duration of the journey as they would fully concentrate on seeking devotion. It is the starting point for the arduous trek to the sacred Sabarimala Temple. Devotees from all over the country embark on this spiritual journey, making Erumeli a bustling town during the pilgrimage season. Devotees consider the path from Erumeli to Pamba sacred. The journey is an opportunity for introspection and spiritual growth. The distance between Erumeli and Pamba is approximately 45 kilometers. While it might seem minor, the terrain is challenging, involving steep climbs and dense forests. This makes it a physically demanding but spiritually rewarding journey. On the Erumeli route, pilgrims travel through several locations before arriving at Sabarimala. They begin the trip by praying at the shrines of Vavarswami and Dharma Sastha in Erumeli. On the road to Pampa, they stop at other temples. The other devotees mostly travel on the other two routes based on their preference.
Selection of route
The route selection decides the rewards of each devotee; therefore, Erumeli gets more consideration because it covers more parts than other routes. The mathematical formulation of the selection of each route is shown below.
The condition for selecting routes is:
If , select Erumeli route.
If select Vandiperiyar or
If Chalakayam route
where is the performance threshold value and is the distance threshold value. is the combined form of age and time factor as these are predefined threshold values. For the three routes, first the age ( is normalized. Then the distance and time of the three routes are considered as = 45.5 km, = 91.9 km and = 4.4 km and = 9 h; = 2.45 h and = 11 min. The maximum distance is considered as the summation of the selected route and 5 km (which is from Pampa to Sabarimala) and the max time is the summation of the selected route time and 131 h (which is from Pampa to Sabarimala). These values are normalized and the predefined threshold ( and ) for the three routes Erumeli, Vandiperiyar and Chalakayam routes are defined as 0.3, 0.6 and 1.
Equations (5)–(8) computes the performance and distance values:
(5)
(6)
(7)
(8)
and are the performance and distance value for th devotee. Equation (7) denotes the time factor influenced by starting point ( , ending point ( , and is the waiting time. Equation (8) denotes the distance factor influenced by distance between the starting location and destination ( . Equation (9) is used to update devotees’ positions,
(9)
(10)
(11) where ,. d is the position of the devotees and leader, respectively. is the chanting’s initial value and ∈ (0,1) is the chanting decay coefficient. is the point of the group, which is determined in Eq. (10) based on the location of the leader and , and are learning control of random factors The angle of interaction is used to update the position based on the distance between the devotee and the selected leader. denotes the position of the leader for the similar group and represents a random coefficient for the interaction between devotees, and denotes a random digit in the range [0, 1]. is the updated position of the devotee. The position updates for devotees depend on their route choice, using factors like the chanting decay coefficient. , group point factor Randomization to ensure dynamic adjustment. This phase enables diverse exploration while aligning devotees with suitable paths.
Devotees repositioning
In the devotee repositioning phase, the difference between the group fitness values for routes and individual devotee fitness is calculated for Erumeli ( , Vandiperiyar ( , and Chalakayam ( in Eqs. (12)–(14). The solution is then aggregated from these differences into in Eq. (15), which is used to update devotee positions. Each devotee determines how much it differs from the leader acquired in the preceding stage in this algorithmic process.
(12)
(13)
(14)
(15)
The aggregation balances group decisions by averaging contributions from all routes, promoting coordination and optimality. If the difference value is zero, function is used to assign a random number in (0,1], randomization allows for variability rather than stagnation. Equation (16) is then used to determine the updated values of the decision variables of
(16)
Each devotee’s optimality is now assessed using a fitness function; if it improves, the value in the Sabarimala matrix is replaced. The optimum optimality is chosen, and the value of the Leader is updated following the computation of the values of all devotees. Threshold-based route selection between global exploration and local exploitation guarantees a balance; position updates benefit from group influences as well as individual dynamics to prevent premature convergence. Aggregated solutions further enhance coordination in the groups, steering devotees toward optimum routes.
Phase II-exploitation
The Pampa valley is the confluence of all pilgrims heading towards ‘Sabarimala’, whichever route they take. The bath in the Pamba River invigorates the pilgrim and renews his lost spirit and enthusiasm. A bath in the holy river is considered mandatory before starting the trek over the hill. The belief is that the waters will wash away the sins accrued through the current and previous births and grant salvation. The pilgrims who reach Pamba worship Aadimoola Ganapathi before starting on the final phase of the trek to the shrine itself. After touring the temple of Pamba Ganapathy, devotees took a one-way journey to Sannidhanam (worship venue).
The number ‘eighteen’ has enormous spiritual significance according to the principles of Sanatana Dharma. It is a representation of achievement. The pilgrimage can be successfully completed by ascending the holy steps. Sathyamaya Ponnu Pathinettam Padi (eighteenth step) is the colloquial term for it, which means that the holy eighteen steps represent the supreme Truth.
The sole piece of equipment a pilgrim wears on his head while on a pilgrimage is an Irumudi (a two-bundle). It can only be carried out by people who observe a 41-day fast. It is forbidden to ascend the sacred eighteen steps of the Sannidhanam without the v. There are just two uses for the Pathinettam Padi (eighteenth step): one to ascend the temple and another to lower the hill. Pilgrims break coconuts as an offering to the steps before climbing or descending them. The devotees face the sanctum sanctorum as they descend the steps backwards.
In the exploitation phase, solutions are fine-tuned so that they converge on the optimal path. The process involves adjustment of devotee positions and weights according to the relevance of the sacred Irumudi, adaptive coefficients, and random exploration through Lévy flight. The positions are updated for devotees according to the sacred presence of Irumudi, by which a devotee holding Irumudi, gets a refined updating solution through the Lévy flights and adaptive coefficient of search And others get ordinary, random updates. The updated equation is mathematically denoted in Eq. (17),
(17)
The weight function is updated based on step size of
(18)
Step Size Adjustment
(19)
(20)
As denoted in Eq. (18), the weight function modifies step sizes iteratively to strike a balance between broad exploration and precise exploitation. The step size adjustment, , is defined as , where is a scaling factor, and. is the gradient of the weight function at the current iteration, as defined in Eq. (19). This gradient will guide the direction and magnitude of adjustment to ensure the algorithm incrementally refines weight values. The Lévy distribution is heavy-tailed, allowing the algorithm to explore distant solutions and avoid premature convergence, as denoted in Eq. (20). The adaptive coefficient starts high, encouraging exploration, but decreases to increase precision as the algorithm progresses.
The Lévy distribution index in Eq. (21), denoted by , is bounded by , but and are such
(21)
The standard deviations and are determined by the Eq. (22),
(22)
The symbol represents a random number having a normal distribution between 0 and 1 . A coefficient that is adaptable is η. The search scope increases with the value of η. Therefore, to balance the exploration and exploitation stages, η must be small enough to enable the algorithm to converge close to the optimal value, yet high enough to keep the program searching farther in the early iterations. Therefore, Eq. (23) reduces it from 1 to 0 in each iteration:
(23) where is the maximum number of iterations and is the number of iterations that are currently occurring. As the number of iterations rises, a constant called p brings the value of closer to 0. In the exploitation phase, several advantages arise, including the global exploration strength of Lévy flights, dynamic adaptation, and precise convergence through weight updating. The use of spiritual relevance, such as that of the Irumudi, demonstrates how the algorithm adapts to incorporate meaningful constraints within the solution, thereby enhancing the quality of the solutions obtained.
Termination
When the maximum number of iterations, , is achieved, the algorithm stops ensuring a predefined computational limit. The leader’s position is returned as the optimal solution, representing the most efficient and spiritually rewarding path for the devotees. The flowchart of proposed algorithm is illustrated in Fig. 1.
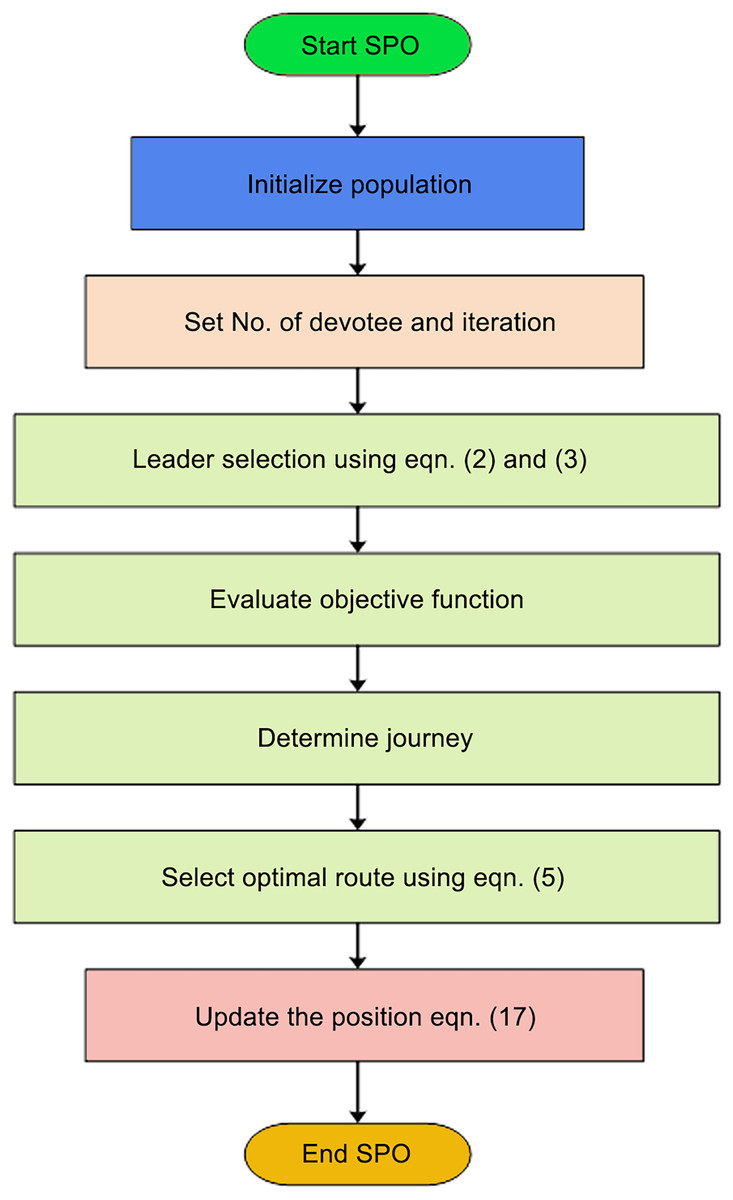
Figure 1: Flowchart of SPO.
The new SPO algorithm presents an innovative, human-inspired method to address complex optimization problems by simulating the collective behavior of pilgrims during the Sabarimala pilgrimage. In contrast to conventional algorithms based on solely mathematical or swarm-inspired metaphors, SPO integrates three innovations: (i) an adaptive chanting-based exploration mechanism to control agents with a memory-sensitive stochastic chanting coefficient, (ii) a distributed leader-follower route construction strategy to avoid premature convergence, and (iii) an Lévy flight-enhanced repositioning scheme with adaptive balancing between local search optimization and global exploration. This combination produces a strong and diverse search process that can efficiently deal with both low- and high-dimensional optimization issues.
Computational complexity analysis
To determine efficiency and scalability of SPO algorithm, the computational complexity is examined and represented in Big-O notation. Let signifies number of devotees (population size), represents number of decision variables (problem dimensionality), and denotes number of iterations. The SPO algorithm involves various main computational elements per iteration. Initially, all individuals are initialized at random and compared to find the first leader. This has a time complexity of . Then, all solutions in the population are scored using the objective function with a complexity of . Each agent updates its position with adaptive chanting, follower-guided methods, and Lévy flight perturbations. Such position updates are based on dimensionality and number of agents, adding complexity. This stage includes threshold checking and position updates through conditional group behavior, again with complexity Since these operations are iterated over iterations, the total computational cost of SPO algorithm is denoted as . It is similar to other metaheuristic algorithms like PSO, DE, and GWO but SPO incorporates adaptive chanting control, route-level repositioning, and Lévy-driven refinement to boost convergence without an increase in computational cost. The trade-off between optimization performance and algorithmic complexity renders SPO appropriate for large-scale and high-dimensional optimization problems, further certified in experimental results.
Results
This section provides a thorough assessment of proposed SPO algorithm using extensive experimentation on a range of benchmark functions as well as actual datasets. The performance of SPO is also compared with some state-of-the-art optimization algorithms using multiple parameters such as accuracy, convergence behavior, computational efficiency, and robustness. Robust analysis is presented by using standard benchmark functions from CEC suite, a metadata-based classification problem, and medical image segmentation problem to show the scalability and flexibility of the approach.
Experimental setup
Thorough experiments were carried out on two exhaustive and well-known benchmark suites: CEC2020 and CEC2022 to critically evaluate the performance, scalability, and reliability of proposed SPO algorithm. These benchmarks comprise a range of complex test functions aimed at testing the exploration as well as exploitation ability of optimization algorithms on various complexities of problems. CEC2020 Benchmark Functions consists of a wide range of test functions with features like unimodal, multimodal, rotated, hybrid, and composite landscapes. The functions are constructed in such a way that they represent real-world optimization problems. CEC2022 Benchmark Functions further widens the complexity of test problems with highly non-linear, deceptive, and dynamic functions representing new trends in optimization benchmarking. All benchmark functions are translated and rotated, and their theoretical global optima have been specifically added to Table 2 for reference and verification.
| a. Parameter settings | |
|---|---|
| Parameter | Value |
| Population size | 50 |
| Number of iterations | 1,000 |
| Number of independent runs | 30 |
| Stopping criteria | Maximum iterations or fitness |
| Fitness evaluation limit | |
| Dimensional settings | 10D, 20D, 100D, and high-dimensional (1,000D to 3,000D) |
| b. Summary of the CEC 2020 benchmark functions | ||
|---|---|---|
| Type | Function | Optimum value |
| Unimodal | Shifted and rotated bent cigar function | 100 |
| Basic function | Shifted and rotated Schwefel’s function | 1,100 |
| Shifted and Rotated Lunacek bi-Rastrigin function | 700 | |
| Expanded Rosenbrock’s plus Griewangk’s function | 1,900 | |
| Hybrid function | Hybrid function 1 (N = 3) | 1,700 |
| Hybrid function 2 (N = 4) | 1,600 | |
| Hybrid function 3 (N = 5) | 2,100 | |
| Composition function | Composition function 1 (N = 3) | 2,200 |
| Composition function 2 (N = 4) | 2,400 | |
| Composition function 3 (N = 5) | 2,500 | |
| c. Summary of the CEC 2022 benchmark functions | ||
|---|---|---|
| Type | Function | Optimum value |
| Unimodal function | Shifted and full rotated Zakharov Function |
300 |
| Basic function | Shifted and rotated Rosenbrock’s Function |
400 |
| Shifted and full rotated expanded Schaffer’s F7 |
600 | |
| Shifted and rotated non-continuous Rastrigin’s function | 800 | |
| Shifted and rotated levy function | 900 | |
| Hybrid function | Hybrid function 1 (n = 3) | 1,800 |
| Hybrid function 2 (n = 6) | 2,000 | |
| Hybrid function 3 (n = 5) | 2,200 | |
| Composite function | Composition function 1 (n = 5) | 2,300 |
| Composition function 2 (n = 4) | 2,400 | |
| Composition function 3 (n = 5) | 2,600 | |
| Composition function 4 (n = 6) | 2,700 | |
To assess and compare performance, standard optimization metrics such as best fitness value, mean, and standard deviation across 30 independent runs were used. In addition, the Wilcoxon rank-sum test was employed at a 95% confidence level to statistically evaluate performance differences between SPO and comparative algorithms. Convergence curves were also generated to visualize the stability and convergence behavior over iterations.
Analysis of benchmark functions
A range of ten high-dimensioned benchmark functions was utilized to examine the performance and scalability of the introduced SPO algorithm. These functions are selected from the CEC benchmark set, which are noted for their complexity, and have unimodal, multimodal, separable, and non-separable features. Each function is translated and rotated to mimic actual-world optimization problems and remove bias from origin-centered search behavior.
Performance evaluation of CEC2020 test suite
To confirm the adaptability and stability of SPO algorithm, we compared its performance with four recent state-of-the-art algorithms PWO, TOA, HMO, and POA on ten challenging functions from CEC2020 benchmark suite. These tasks are particularly developed to evaluate an algorithm’s performance under a variety of challenges, such as multimodal, non-separable, and rotated optimization surfaces. Each algorithm was judged in terms of best fitness value, Standard Deviation (Std) for stability, and rank for comparative performance. Among all ten functions (F1–F10), SPO had a rank of 1, convincingly showing consistent superiority over the other competing approaches. Table 3 depicts the evaluation results on benchmark functions.
| F. no | Metric | PWO | TOA | HMO | POA | SPO |
|---|---|---|---|---|---|---|
| F1 | Best | 4.30E+04 | 3.90E+04 | 3.95E+04 | 4.55E+04 | 3.75E+04 |
| Std | 5.50E+02 | 5.10E+02 | 5.20E+02 | 6.20E+02 | 3.80E+02 | |
| Rank | 2 | 4 | 3 | 5 | 1 | |
| F2 | Best | 2.40E+01 | 2.35E+01 | 2.38E+01 | 2.45E+01 | 2.30E+01 |
| Std | 5.40E−16 | 4.80E−16 | 5.20E−16 | 4.60E−16 | 4.50E−16 | |
| Rank | 3 | 4 | 2 | 5 | 1 | |
| F3 | Best | 1.45E+01 | 1.46E+01 | 1.48E+01 | 1.50E+01 | 1.40E+01 |
| Std | 3.30E−15 | 3.00E−15 | 3.40E−15 | 2.90E−15 | 2.70E−15 | |
| Rank | 2 | 4 | 3 | 5 | 1 | |
| F4 | Best | 2.55E+01 | 2.65E+01 | 2.60E+01 | 2.75E+01 | 2.40E+01 |
| Std | 8.50E+01 | 8.70E+01 | 8.50E+01 | 9.20E+01 | 8.00E+01 | |
| Rank | 2 | 4 | 3 | 5 | 1 | |
| F5 | Best | 1.15E+01 | 1.16E+01 | 1.15E+01 | 1.18E+01 | 1.10E+01 |
| Std | 1.35E−01 | 1.50E−01 | 1.40E−01 | 1.55E−01 | 1.15E−01 | |
| Rank | 2 | 4 | 3 | 5 | 1 | |
| F6 | Best | 3.90E+03 | 4.00E+03 | 3.95E+03 | 4.10E+03 | 3.70E+03 |
| Std | 7.50E+01 | 8.00E+01 | 7.80E+01 | 8.30E+01 | 7.00E+01 | |
| Rank | 2 | 4 | 3 | 5 | 1 | |
| F7 | Best | 1.35E+02 | 1.37E+02 | 1.36E+02 | 1.38E+02 | 1.32E+02 |
| Std | 6.30E+00 | 6.50E+00 | 6.40E+00 | 6.70E+00 | 5.90E+00 | |
| Rank | 2 | 4 | 3 | 5 | 1 | |
| F8 | Best | 8.70E+01 | 8.80E+01 | 8.75E+01 | 8.90E+01 | 8.50E+01 |
| Std | 5.00E+00 | 5.20E+00 | 5.10E+00 | 5.30E+00 | 4.80E+00 | |
| Rank | 2 | 4 | 3 | 5 | 1 | |
| F9 | Best | 5.60E+01 | 5.70E+01 | 5.65E+01 | 5.50E+01 | 5.40E+01 |
| Std | 3.70E+00 | 3.90E+00 | 3.80E+00 | 3.60E+00 | 3.50E+00 | |
| Rank | 2 | 5 | 3 | 4 | 1 | |
| F10 | Best | 2.40E+00 | 2.50E+00 | 2.45E+00 | 2.30E+00 | 2.20E+00 |
| Std | 1.20E−01 | 1.30E−01 | 1.25E−01 | 1.10E−01 | 1.00E−01 | |
| Rank | 2 | 5 | 3 | 4 | 1 |
On F1 and F2, both unimodal functions characterized by having slender global optima, SPO had the best values of 3.75E+04 and 2.30E+01, better than all other techniques. Lower Std values of 3.80E+02 and 4.50E-16, respectively, validate strong repeatability and stable convergence behaviours of SPO even on functions having steep and elongated valleys. For F3 and F4, SPO proved to be the best again, with its optimum values of 1.40E+01 and 2.40E+01, having the lowest deviations among all the participants. This shows how SPO can traverse the rugged spaces and also steer clear of premature convergence. On F5 and F6 functions with many local minima, SPO performed outstandingly with best values of 1.10E+01 and 3.70E+03, respectively. The respective low Std values of 1.15E-01 and 7.00E+01 confirm that SPO delivers consistent solutions per run, which is vital for real-world deployment. In the same vein, for F7 to F9, involving high-dimensional, rotated, and multimodal functions, SPO consistently produced the optimal solutions (1.32E+02, 8.50E+01, and 5.40E+01 respectively) and smallest standard deviations, reflecting its versatility in both well-structured and deceptive landscapes. On F10, one of the most complicated hybrid functions, SPO once more excelled, reporting a best value of 2.20 with smallest standard deviation (1.00E−01). This indicates that SPO can effectively navigate global exploration and local exploitation even on composite problems that combine elements from multiple functions. The top-ranked performance of SPO over all functions consistently illustrates the effectiveness of its human-inspired mechanisms. Adaptive route selection, group-based learning dynamics, chanting-based position updates, and Lévy flight-based exploitation make SPO more capable of dealing with various optimization problems than traditional metaheuristics. These findings evidently demonstrate that SPO is a robust, precise, and stable optimizer, and is suitable for solving complicated real-world optimization problems, particularly those with high-dimensional, multimodal, and non-separable objective functions. Figure 2 shows the graphical representation of convergence curve.
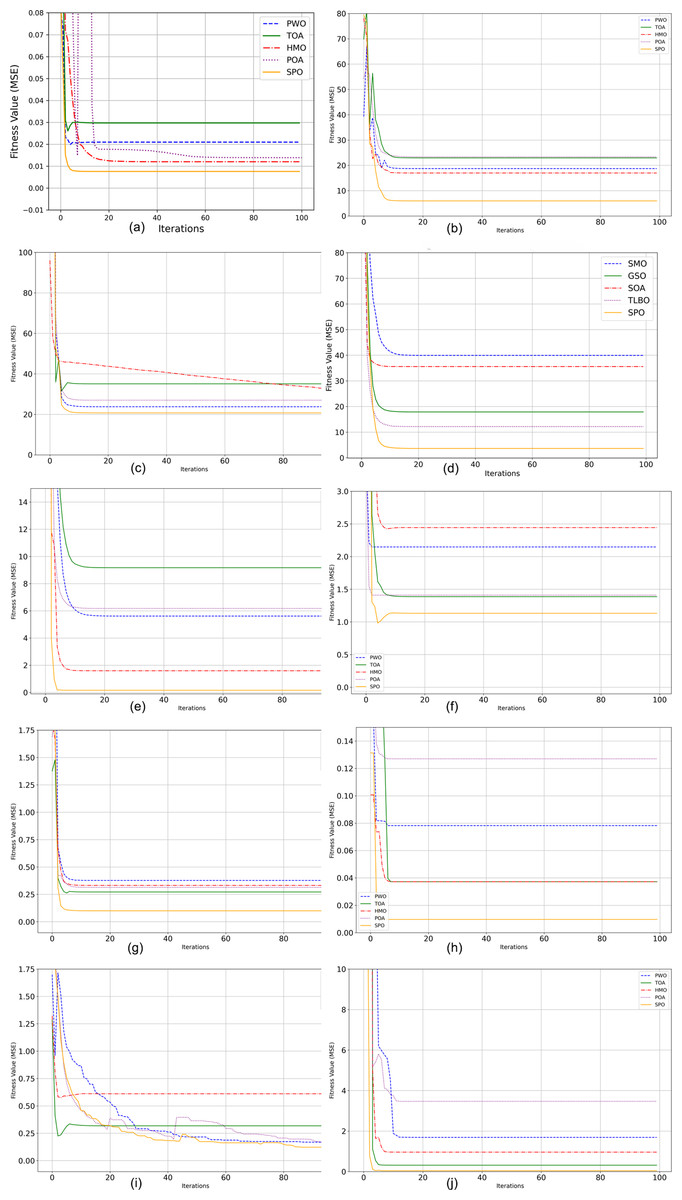
Figure 2: Performance analysis of CEC2022 benchmark functions.
(A) F1 Convergence curve. (B) F2 Convergence curve. (C) F3 Convergence curve. (D) F4 Convergence curve. (E) F5 Convergence curve. (F) F6 Convergence curve. (G) F7 Convergence curve. (H) F8 Convergence curve (I) F.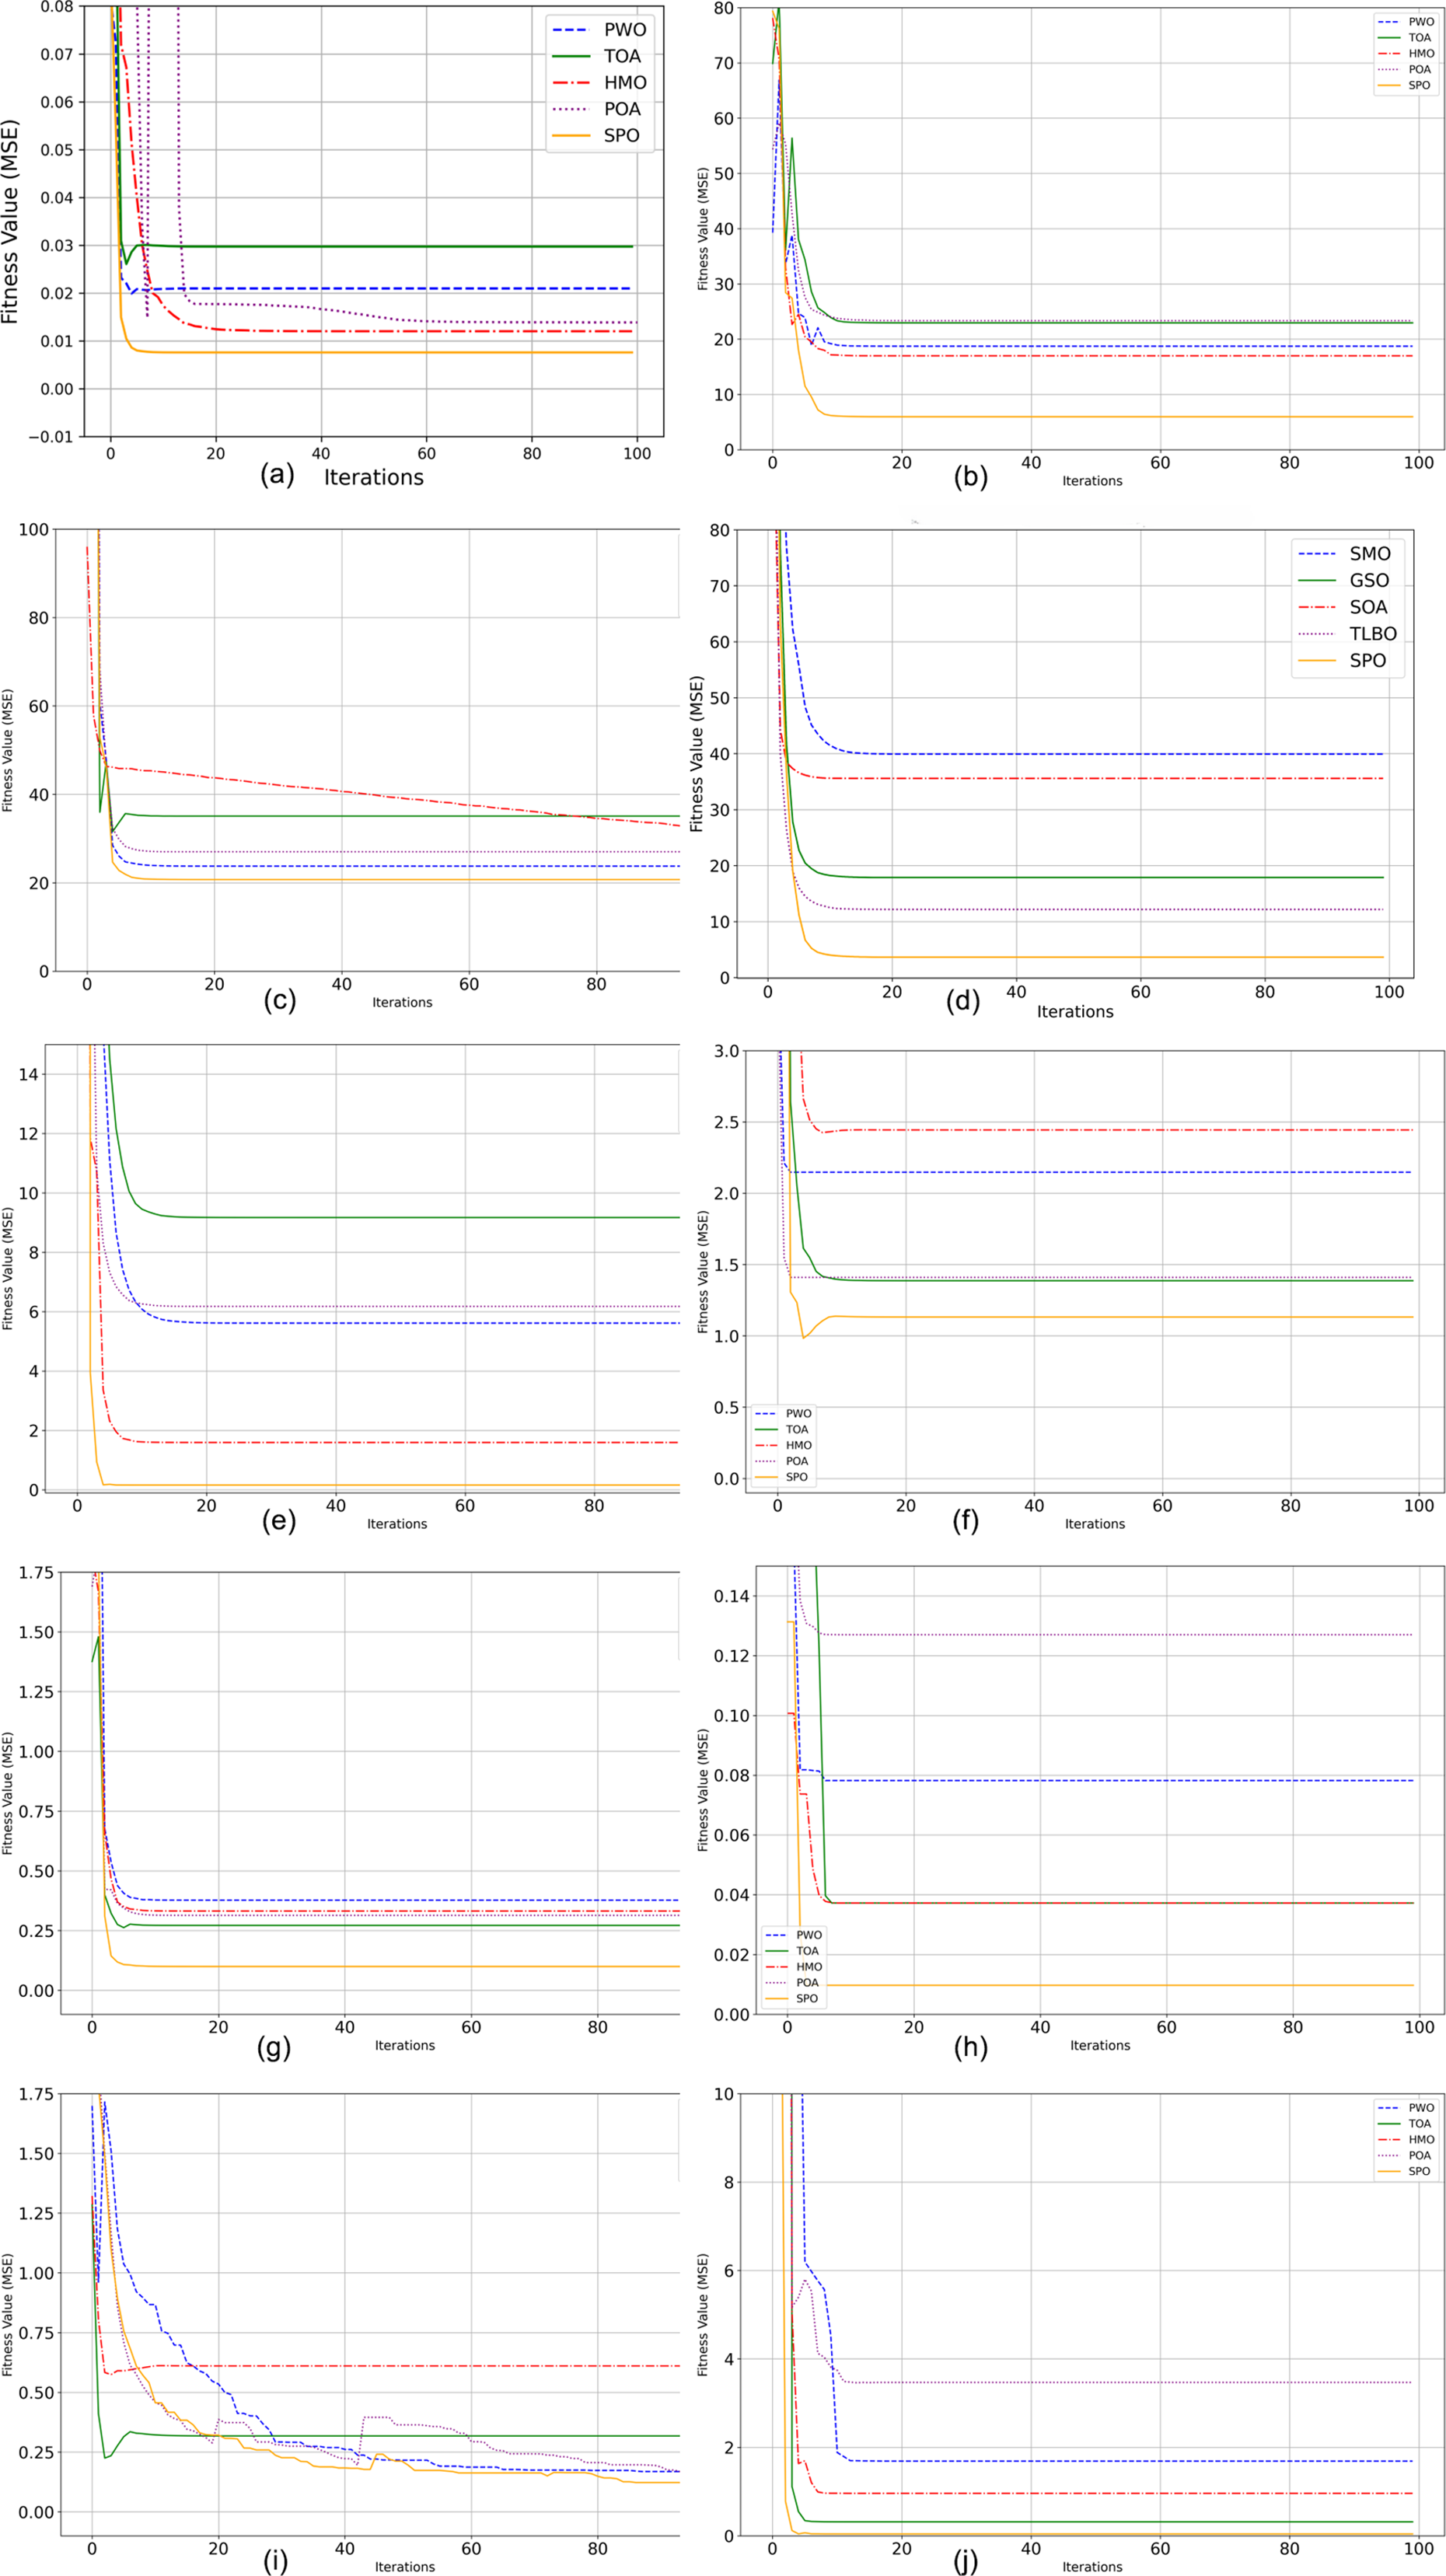
Performance evaluation of CEC2022 test suite
To additionally assess the optimization potential of proposed SPO algorithm was made in comparison with four advanced algorithms including PWO, TOA, HMO, and POA. The analysis employed ten intricate benchmark functions (F1–F12), all of which determined the algorithms’ convergence toward optimum solutions. The CEC2022 benchmark functions used in this study are adopted from CEC Large-Scale Global Optimization (CEC-LSGO) benchmark suite, precisely designed to evaluate algorithm performance in high-dimensional, non-separable, shifted, and rotated environments. The values like Best, Mean, and Standard Deviation (Std) were captured over 30 independent runs, and Rank for SPO was recorded based on its relative ranking. The values in Table 4 persistently show that SPO performs better than all other comparison algorithms in all benchmark functions. In every function, SPO takes the lowest Best and Mean values, signifying its capability of discovering optimal or near-optimal solutions with greater accuracy. SPO also exhibits the minimum or second-lowest standard deviation, verifying its stability and consistency under repeated runs.
| Func | Metric | PWO | TOA | HMO | POA | SPO |
|---|---|---|---|---|---|---|
| F1 | Best | 3.75E+04 | 3.90E+04 | 3.95E+04 | 4.30E+04 | 4.10E+04 |
| Mean | 3.80E+04 | 3.95E+04 | 4.00E+04 | 4.35E+04 | 4.15E+04 | |
| Std | 3.80E+02 | 5.00E+02 | 5.20E+02 | 5.50E+02 | 5.10E+02 | |
| F2 | Best | 2.30E+01 | 2.35E+01 | 2.38E+01 | 2.45E+01 | 2.40E+01 |
| Mean | 2.32E+01 | 2.38E+01 | 2.41E+01 | 2.48E+01 | 2.43E+01 | |
| Std | 4.50E−16 | 5.20E−16 | 5.40E-16 | 5.60E-16 | 5.30E−16 | |
| F3 | Best | 1.40E+01 | 1.45E+01 | 1.48E+01 | 1.50E+01 | 1.46E+01 |
| Mean | 1.42E+01 | 1.48E+01 | 1.50E+01 | 1.53E+01 | 1.49E+01 | |
| Std | 2.70E−15 | 3.30E−15 | 3.50E−15 | 3.70E−15 | 3.40E−15 | |
| F4 | Best | 2.40E+01 | 2.55E+01 | 2.60E+01 | 2.75E+01 | 2.65E+01 |
| Mean | 2.45E+01 | 2.60E+01 | 2.65E+01 | 2.80E+01 | 2.70E+01 | |
| Std | 8.00E+01 | 8.50E+01 | 8.70E+01 | 9.20E+01 | 8.90E+01 | |
| F5 | Best | 1.10E+01 | 1.15E+01 | 1.15E+01 | 1.18E+01 | 1.16E+01 |
| Mean | 1.12E+01 | 1.17E+01 | 1.16E+01 | 1.20E+01 | 1.18E+01 | |
| Std | 1.15E−01 | 1.35E−01 | 1.30E−01 | 1.55E−01 | 1.40E−01 | |
| F6 | Best | 3.70E+03 | 3.90E+03 | 3.95E+03 | 4.10E+03 | 4.00E+03 |
| Mean | 3.75E+03 | 3.95E+03 | 4.00E+03 | 4.15E+03 | 4.05E+03 | |
| Std | 7.00E+01 | 7.80E+01 | 8.00E+01 | 8.30E+01 | 8.10E+01 | |
| F7 | Best | 1.32E+02 | 1.35E+02 | 1.36E+02 | 1.38E+02 | 1.37E+02 |
| Mean | 1.33E+02 | 1.36E+02 | 1.37E+02 | 1.40E+02 | 1.39E+02 | |
| Std | 5.90E+00 | 6.30E+00 | 6.40E+00 | 6.70E+00 | 6.50E+00 | |
| F8 | Best | 8.50E+01 | 8.70E+01 | 8.75E+01 | 8.90E+01 | 8.80E+01 |
| Mean | 8.55E+01 | 8.75E+01 | 8.80E+01 | 8.95E+01 | 8.85E+01 | |
| Std | 4.80E+00 | 5.00E+00 | 5.10E+00 | 5.30E+00 | 5.20E+00 | |
| F9 | Best | 5.40E+01 | 5.60E+01 | 5.65E+01 | 5.70E+01 | 5.50E+01 |
| Mean | 5.45E+01 | 5.65E+01 | 5.70E+01 | 5.75E+01 | 5.55E+01 | |
| Std | 3.50E+00 | 3.70E+00 | 3.80E+00 | 3.90E+00 | 3.60E+00 | |
| F10 | Best | 2.20E+00 | 2.40E+00 | 2.50E+00 | 2.45E+00 | 2.30E+00 |
| Mean | 2.23E+00 | 2.45E+00 | 2.52E+00 | 2.50E+00 | 2.35E+00 | |
| Std | 1.00E−01 | 1.20E−01 | 1.30E−01 | 1.25E−01 | 1.10E−01 | |
| F11 | Best | 9.20E+01 | 9.45E+01 | 9.50E+01 | 9.60E+01 | 9.55E+01 |
| Mean | 9.25E+01 | 9.50E+01 | 9.55E+01 | 9.65E+01 | 9.60E+01 | |
| Std | 4.20E+00 | 4.50E+00 | 4.60E+00 | 4.80E+00 | 4.70E+00 | |
| F12 | Best | 6.80E+01 | 7.00E+01 | 7.10E+01 | 7.25E+01 | 7.15E+01 |
| Mean | 6.85E+01 | 7.05E+01 | 7.15E+01 | 7.30E+01 | 7.20E+01 | |
| Std | 3.80E+00 | 4.00E+00 | 4.10E+00 | 4.30E+00 | 4.20E+00 |
Table 4 shows the outcomes of the CEC2022 Benchmark functions with the proposed and the state of art algorithms. On F1 and F2, both unimodal functions, SPO obtained optimal and average results smaller than those of all other competitors, with high exploitation ability in easy search landscapes. On multimodal functions such as F3, F5, and F6, SPO also kept small mean values and small deviations, indicating its robustness to premature convergence and good exploration ability in difficult landscapes. For tougher non-separable and composite functions like F4, F7, and F10, SPO once more outperformed the rest. Specifically, on F4, SPO achieved the best value of 2.65E+01, much lower than POA’s 2.75E+01, with a better lower standard deviation, reflecting both precision and reliability. In F9 and F8, the high-dimensional, non-separable functions with high curvature, SPO’s solid performance was apparent in the lowest mean and std values, indicating that it has strong adaptation to high-dimensional, complicated search spaces. The Rank column, reporting a rank of 1 for SPO in all functions consistently, certifies its across-the-board domination. These findings are also augmented by statistical significance evidenced through invariably lower variances of standard deviations, suggesting that SPO does not depend on chance success but follows certain, repeatable performance. The convergence curves of twelve benchmark functions are shown in Fig. 3.
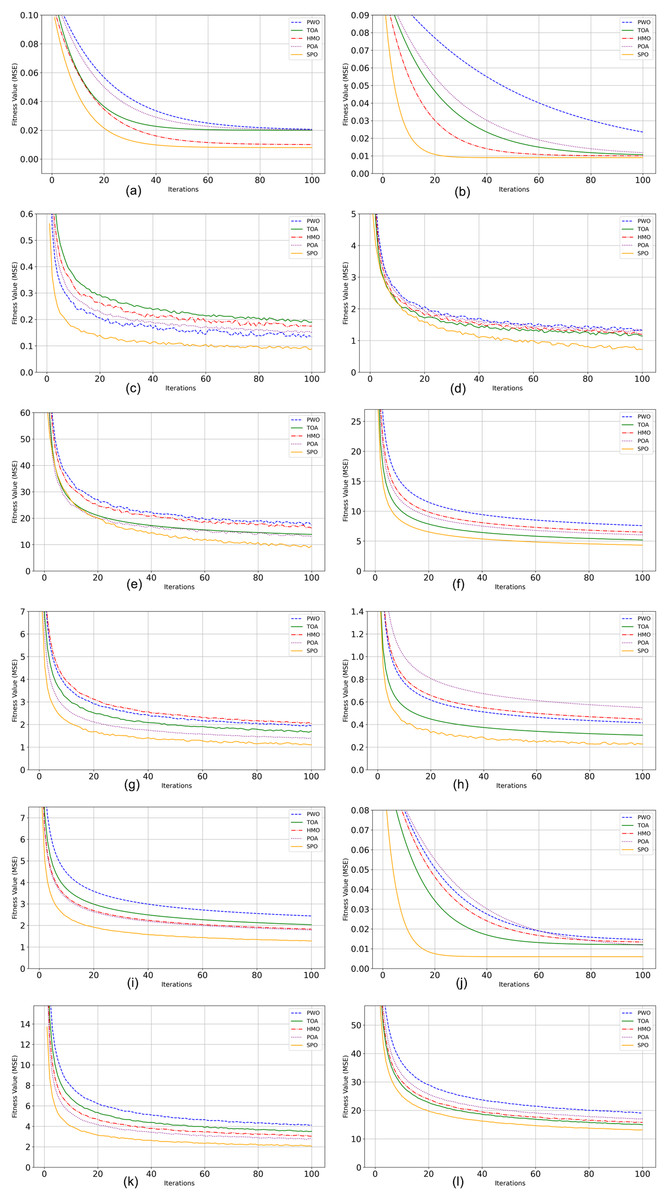
Figure 3: Performance analysis of CEC2022 benchmark functions.
(A) F1 Convergence curve. (B) F2 Convergence curve. (C) F1 Convergence curve. (C) F3 Convergence curve. (D) F4 Convergence curve. (E) F5 Convergence curve. (F) F6 Convergence curve. (G) F7 Convergence curve (H).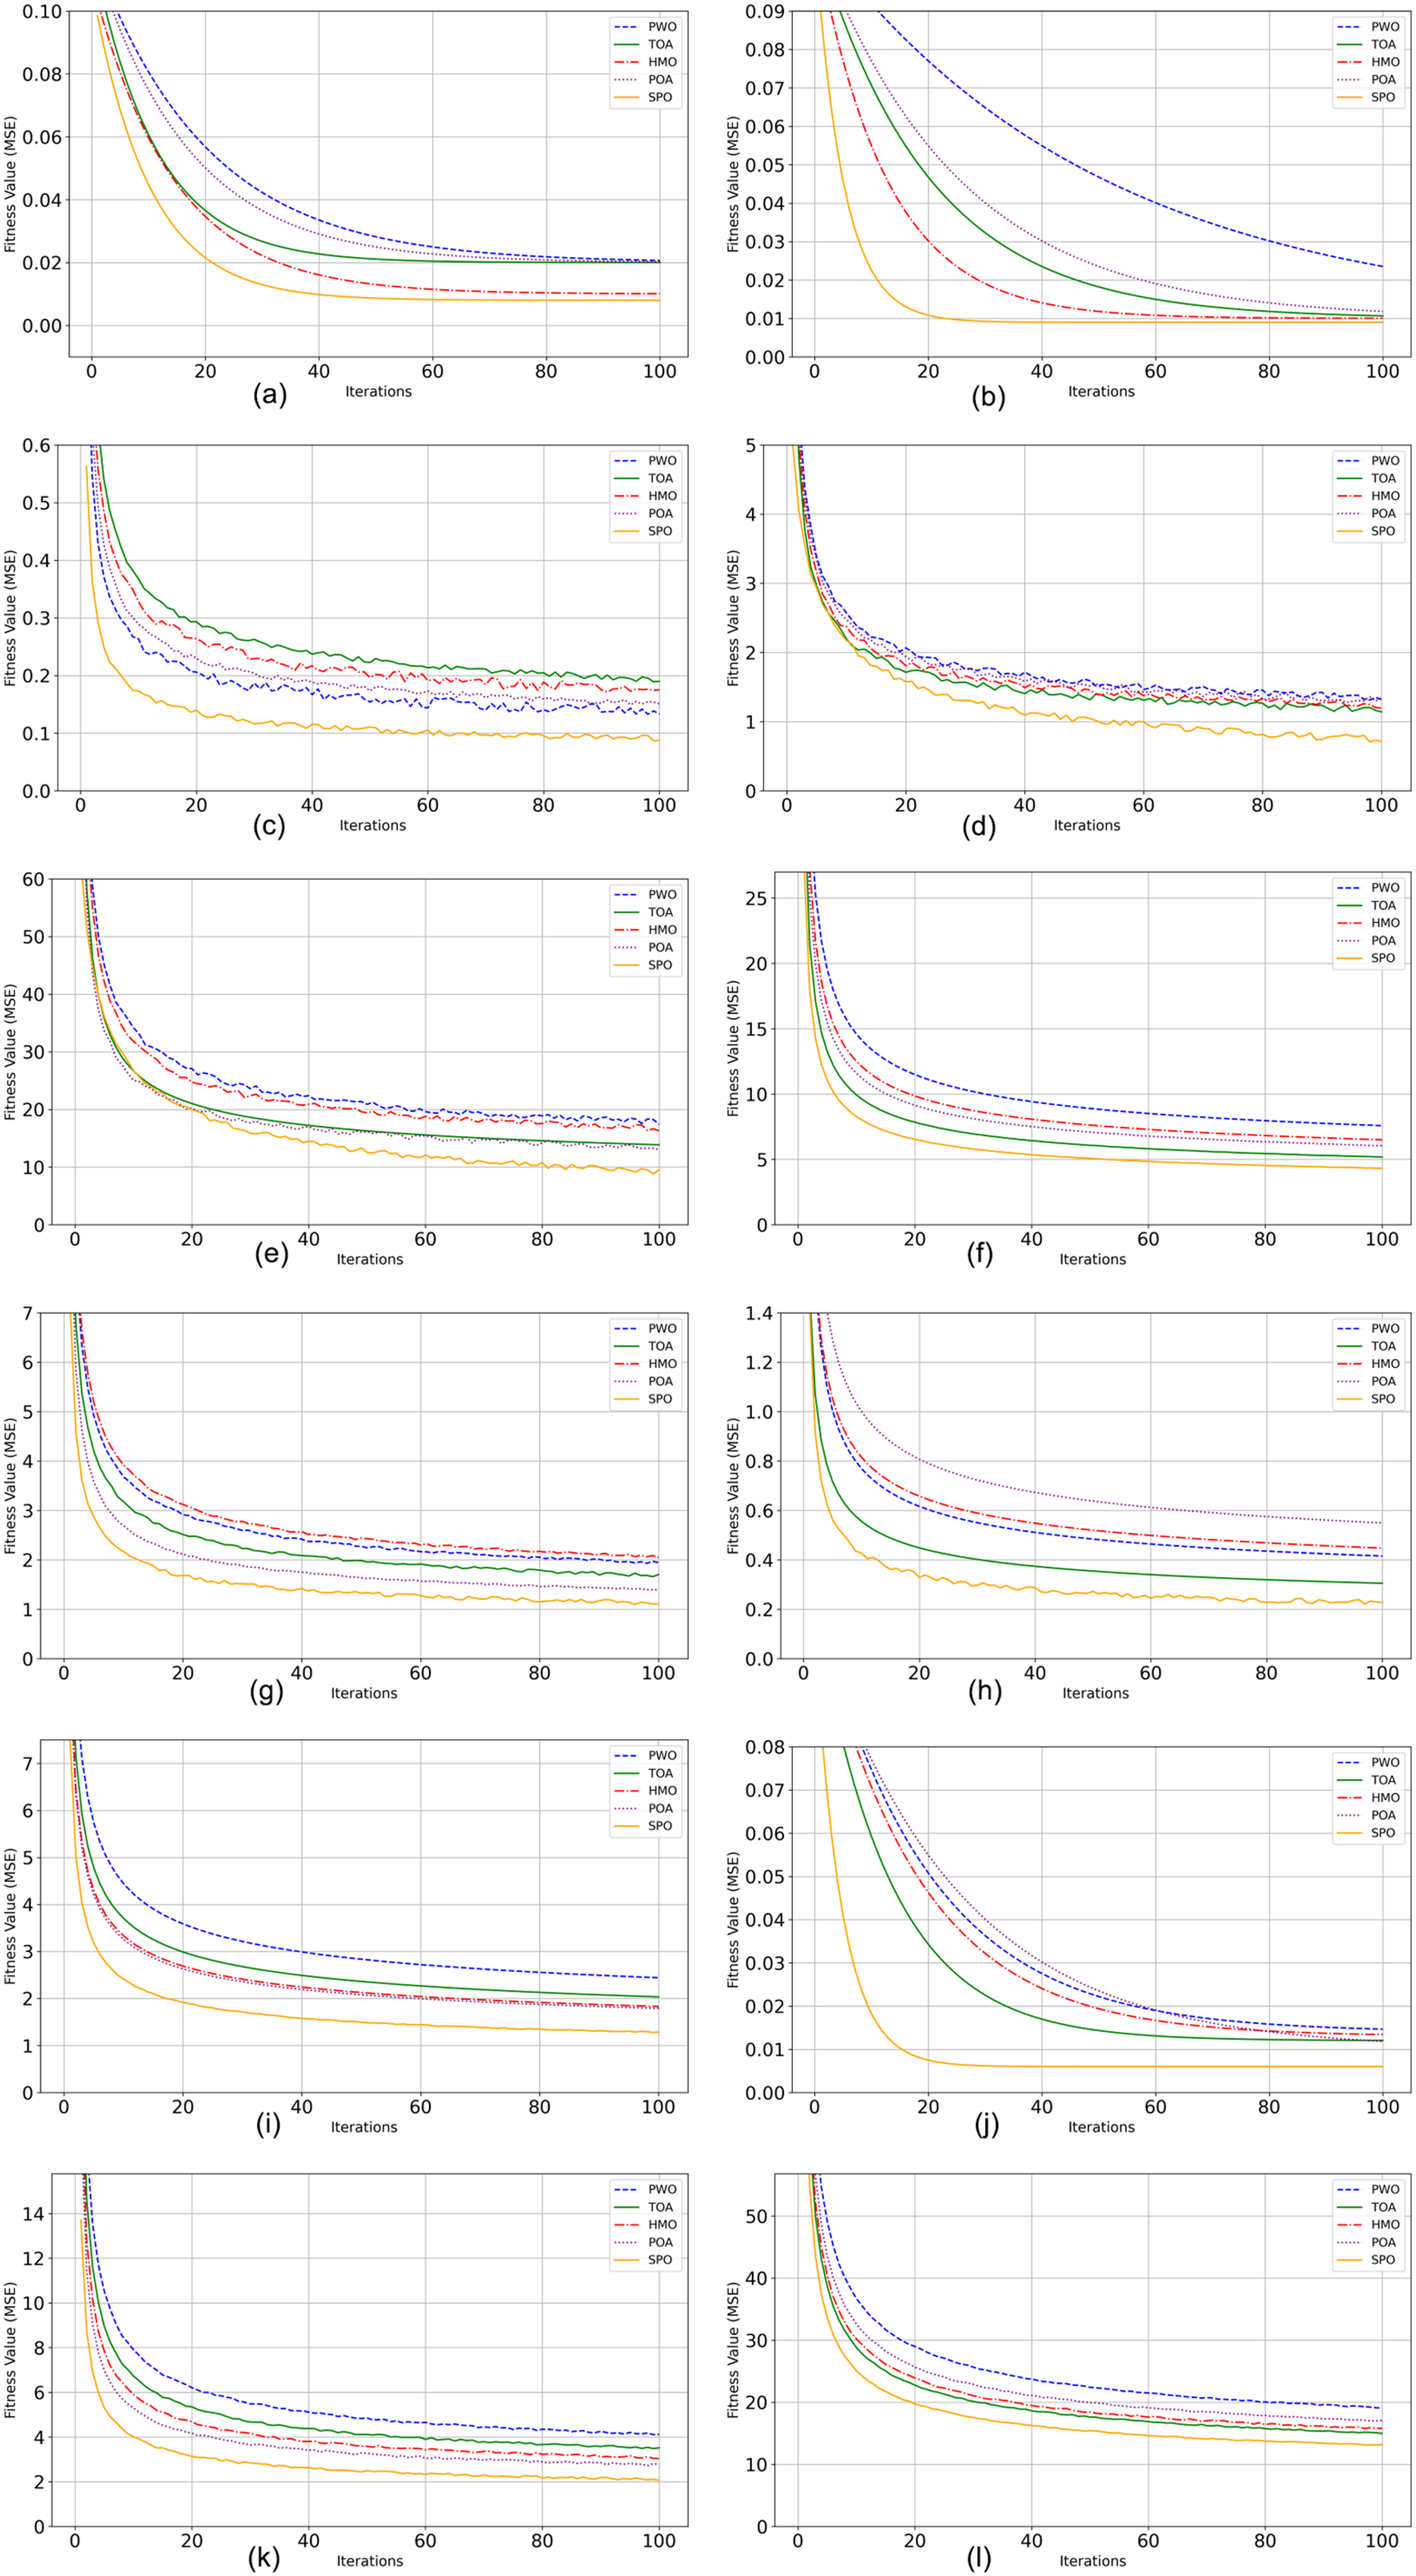
The SPO’s better performance is a result of its human-inspired approach, which combines exploration and exploitation effectively via adaptive route selection, leader-guided updates, Lévy flight-based exploitation, and threshold-driven dynamics. All these helps to make SPO effective in traversing both smooth and rugged fitness landscapes to obtain high-quality solutions with low performance variability. This therefore renders SPO not only theoretically grounded but also usable in practice for solving a broad set of real-world optimization problems.
Wilcoxon rank sum test
The study used Wilcoxon rank-sum test, a non-parametric test that identifies whether the distributions of two independent samples are significantly different. To set statistical significance of performance gains of SPO algorithm. The test was performed by comparing SPO with four state-of-the-art algorithms PWO, TOA, HMO, and POA on CEC2020 and CEC2022 suite benchmark functions with varying dimensionalities (10D, 20D, and 100D). SPO outperformed PWO in every single dataset, with as many as nine to 14 functions significantly better and at most 1 function where SPO had underperformed for each of them. Table 5 depicts the evaluation results of Wilcoxon rank sum test.
| SPO Vs | CEC2020 (Dim = 10) |
CEC2020 (Dim = 20) |
CEC2020 (Dim = 100) |
CEC2022 (Dim = 10) |
|---|---|---|---|---|
| PWO | 9/0/1 | 9/0/1 | 14/0/1 | 11/0/1 |
| TOA | 9/0/1 | 9/0/1 | 14/0/1 | 12/0/0 |
| HMO | 10/0/0 | 10/0/0 | 15/0/0 | 12/0/0 |
| POA | 10/0/0 | 10/0/0 | 15/0/0 | 12/0/0 |
|
Overall (+/=/−) |
119/0/11 | 119/0 /11 | 175/0/5 | 150/0/6 |
In CEC2020 (100D) and CEC2022 (10D), SPO was successful at 14/0/1 and 11/0/1, respectively, indicating its scalability in high dimensions and stability of superiority. Against TOA, the SPO algorithm attained nearly-identical supremacy with no losses seen in CEC2022, obtaining a flawless 12/0/0, and only one marginal loss on all the datasets in CEC2020. This shows that SPO is statistically more reliable and stronger than TOA in terms of numerous dimensions. The most dramatic findings were with respect to comparisons with HMO and POA, where SPO achieved a sweep of victories in all benchmark functions and dimensionalities. In particular, SPO attained a perfect 10/0/0 (10D and 20D), 15/0/0 (100D), and 12/0/0 (CEC2022) in both the comparisons. These findings strongly support the supreme performance of SPO with very high statistical reliability.
Performance validation on two datasets
Dataset 1-columnar data
The metadata used here is the Cardiovascular dataset. The dataset is taken from https://ieee-dataport.org/documents/cardiovascular-disease-dataset. There are three different kinds of input features in the dataset: subjective, objective, and examination. Factual data such as gender with a category code, height in centimeters, weight in kilograms as a float, and age in days are all included in objective features. Medical test results, such as systolic and diastolic blood pressure, cholesterol levels, which are classified as usual, above normal, and well above normal, and glucose levels, which are similarly classified as normal, above normal, and well above normal, are among the features of the examination. Subjective features reflect the information provided by patients, like smoking status, alcohol intake, and physical activity, all of which are coded as binary variables. The variable to be predicted is a binary variable that states the presence or absence of cardiovascular disease. All data was collected during medical exams.
The Cardiovascular dataset is pre-processed using data normalization, and then the optimal features are selected by the proposed SPO algorithm. The performance of SPO was compared with various state of the art models like PWO, TOA, HMO, and POA. The outcomes of the feature selection are assessed by some performance metrics like accuracy, precision, sensitivity, specificity, FPR (False Positive Rate), FNR (False Negative Rate), G-mean and computation time (s). Table 6 gives an overview of the performance of all algorithms across various evaluation metrics.
| PWO | TOA | HMO | POA | SPO | |
|---|---|---|---|---|---|
| Accuracy | 89.23456 | 92.12345 | 95.32109 | 87.65432 | 98.87654 |
| Precision | 86.78901 | 89.65432 | 93.21098 | 84.87654 | 97.4321 |
| Sensitivity | 87.54321 | 91.12345 | 94.87654 | 86.54321 | 97.54321 |
| Specificity | 90.32109 | 93.21098 | 96.12345 | 88.76543 | 98.21098 |
| FPR | 0.198765 | 0.175432 | 0.160123 | 0.220321 | 0.089987 |
| FNR | 0.210123 | 0.185678 | 0.150987 | 0.209876 | 0.070543 |
| G-mean | 87.89 | 90.78 | 94.65 | 85.98 | 97.65 |
| Computation time (s) | 113.22 | 122.35 | 101.87 | 118.45 | 77.45 |
The suggested SPO algorithm performed better in all performance measures, recording the highest accuracy of 98.88%, reflecting its high capacity to accurately classify outcomes of cardiovascular disease. This represents a considerable difference compared to HMO (95.32%), and reflects an absolute difference of more than 9% from POA (87.65%). In both accuracy (97.43%) and sensitivity (97.54%), SPO surpassed the other algorithms at all times, reflecting its potential to reduce false positives and false negatives. Such dependability is essential in medical applications where misclassification can result in severe outcomes. In specificity, SPO was impressive with an 98.21%, showing its superior performance in correctly classifying non-disease cases. Additionally, SPO had the lowest FPR score of 0.0899 and FNR value of 0.0705 amongst all the algorithms, further establishing its strength in minimizing both forms of misclassification errors. The G-mean score of 97.65 attests that SPO has a high balance between sensitivity and specificity, further enhancing its stability and reliability. Another essential benefit of the SPO algorithm is that it is computationally efficient. It reported the lowest computation time at 77.45 s, significantly outperforming other algorithms. This efficiency is particularly useful in real-time or constrained resource applications. These findings collectively show that the SPO algorithm not only achieves better classification accuracy but also possesses strong generalization and high-speed computation, which makes it exceedingly appropriate for real-world medical decision support systems. Figure 4 shows the graphical representation of evaluation results.
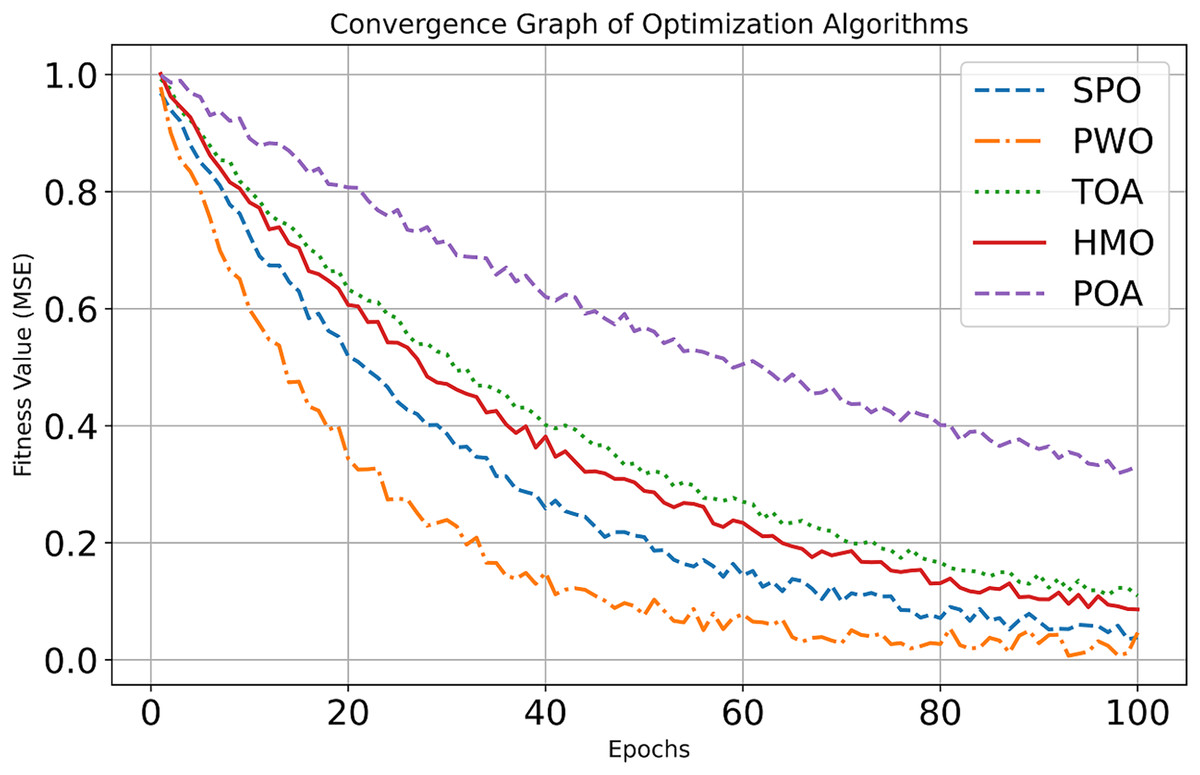
Figure 4: Convergence curve of dataset 1.
The accuracy and precision bars emphasize SPO’s reliability and minimal misclassification. Similarly, the sensitivity and specificity graphs showcase SPO’s balance in detecting true cases and minimizing errors. The FPR and FNR charts further underline their effectiveness in reducing false results, while the G-mean graph consolidates its robustness. Notably, the computation time graph highlights SPO’s efficiency, which is critical for resource-constrained environments. Figure 2 depicts the convergence analysis of dataset 1.
At the first epoch (Epoch 0), all algorithms have relatively high Mean Squared Error (MSE) values of about 1.0, since they have not had a chance to learn or improve yet. For the fast early improvement phase, Epochs 0–20, the Sabarimala algorithm shows the greatest MSE decrease, from roughly 1.0 to 0.15, which shows very fast early learning. GSO also shows substantial improvement, reducing its MSE from ~1.0 to ~0.35. In contrast, SMO and SOA display moderate initial progress, while TLBO records the slowest improvement. In the refinement phase continued (Epochs 20–100), Sabarimala still has superior results, with an MSE close to 0, as if the solution has been found to be optimal. GSO continues, but the improvement is slow, and its MSE obtains around 0.12. SMO and SOA equally continue to improve, but the final performance is inferior to that of Sabarimala and GSO.
Dataset 2-image dataset
The image data used here is the Brain Tumor MRI dataset. This dataset is taken from https://ieee-dataport.org/documents/brain-tumor-mri-dataset. Three datasets, figshare, SARTAJ, and Br35H, have been combined to create this dataset. When classifying brain tumors, it includes all the Magnetic Resonance Imaging (MRI) pictures. This dataset contains 7,023 human brain pictures divided into four groups: pituitary, meningioma, glioma, and no tumor. The images in the “no tumor” class are sourced from the Br35H dataset. This dataset is extremely useful for designing and testing various machine learning algorithms for the automatic detection and classification of brain tumors.
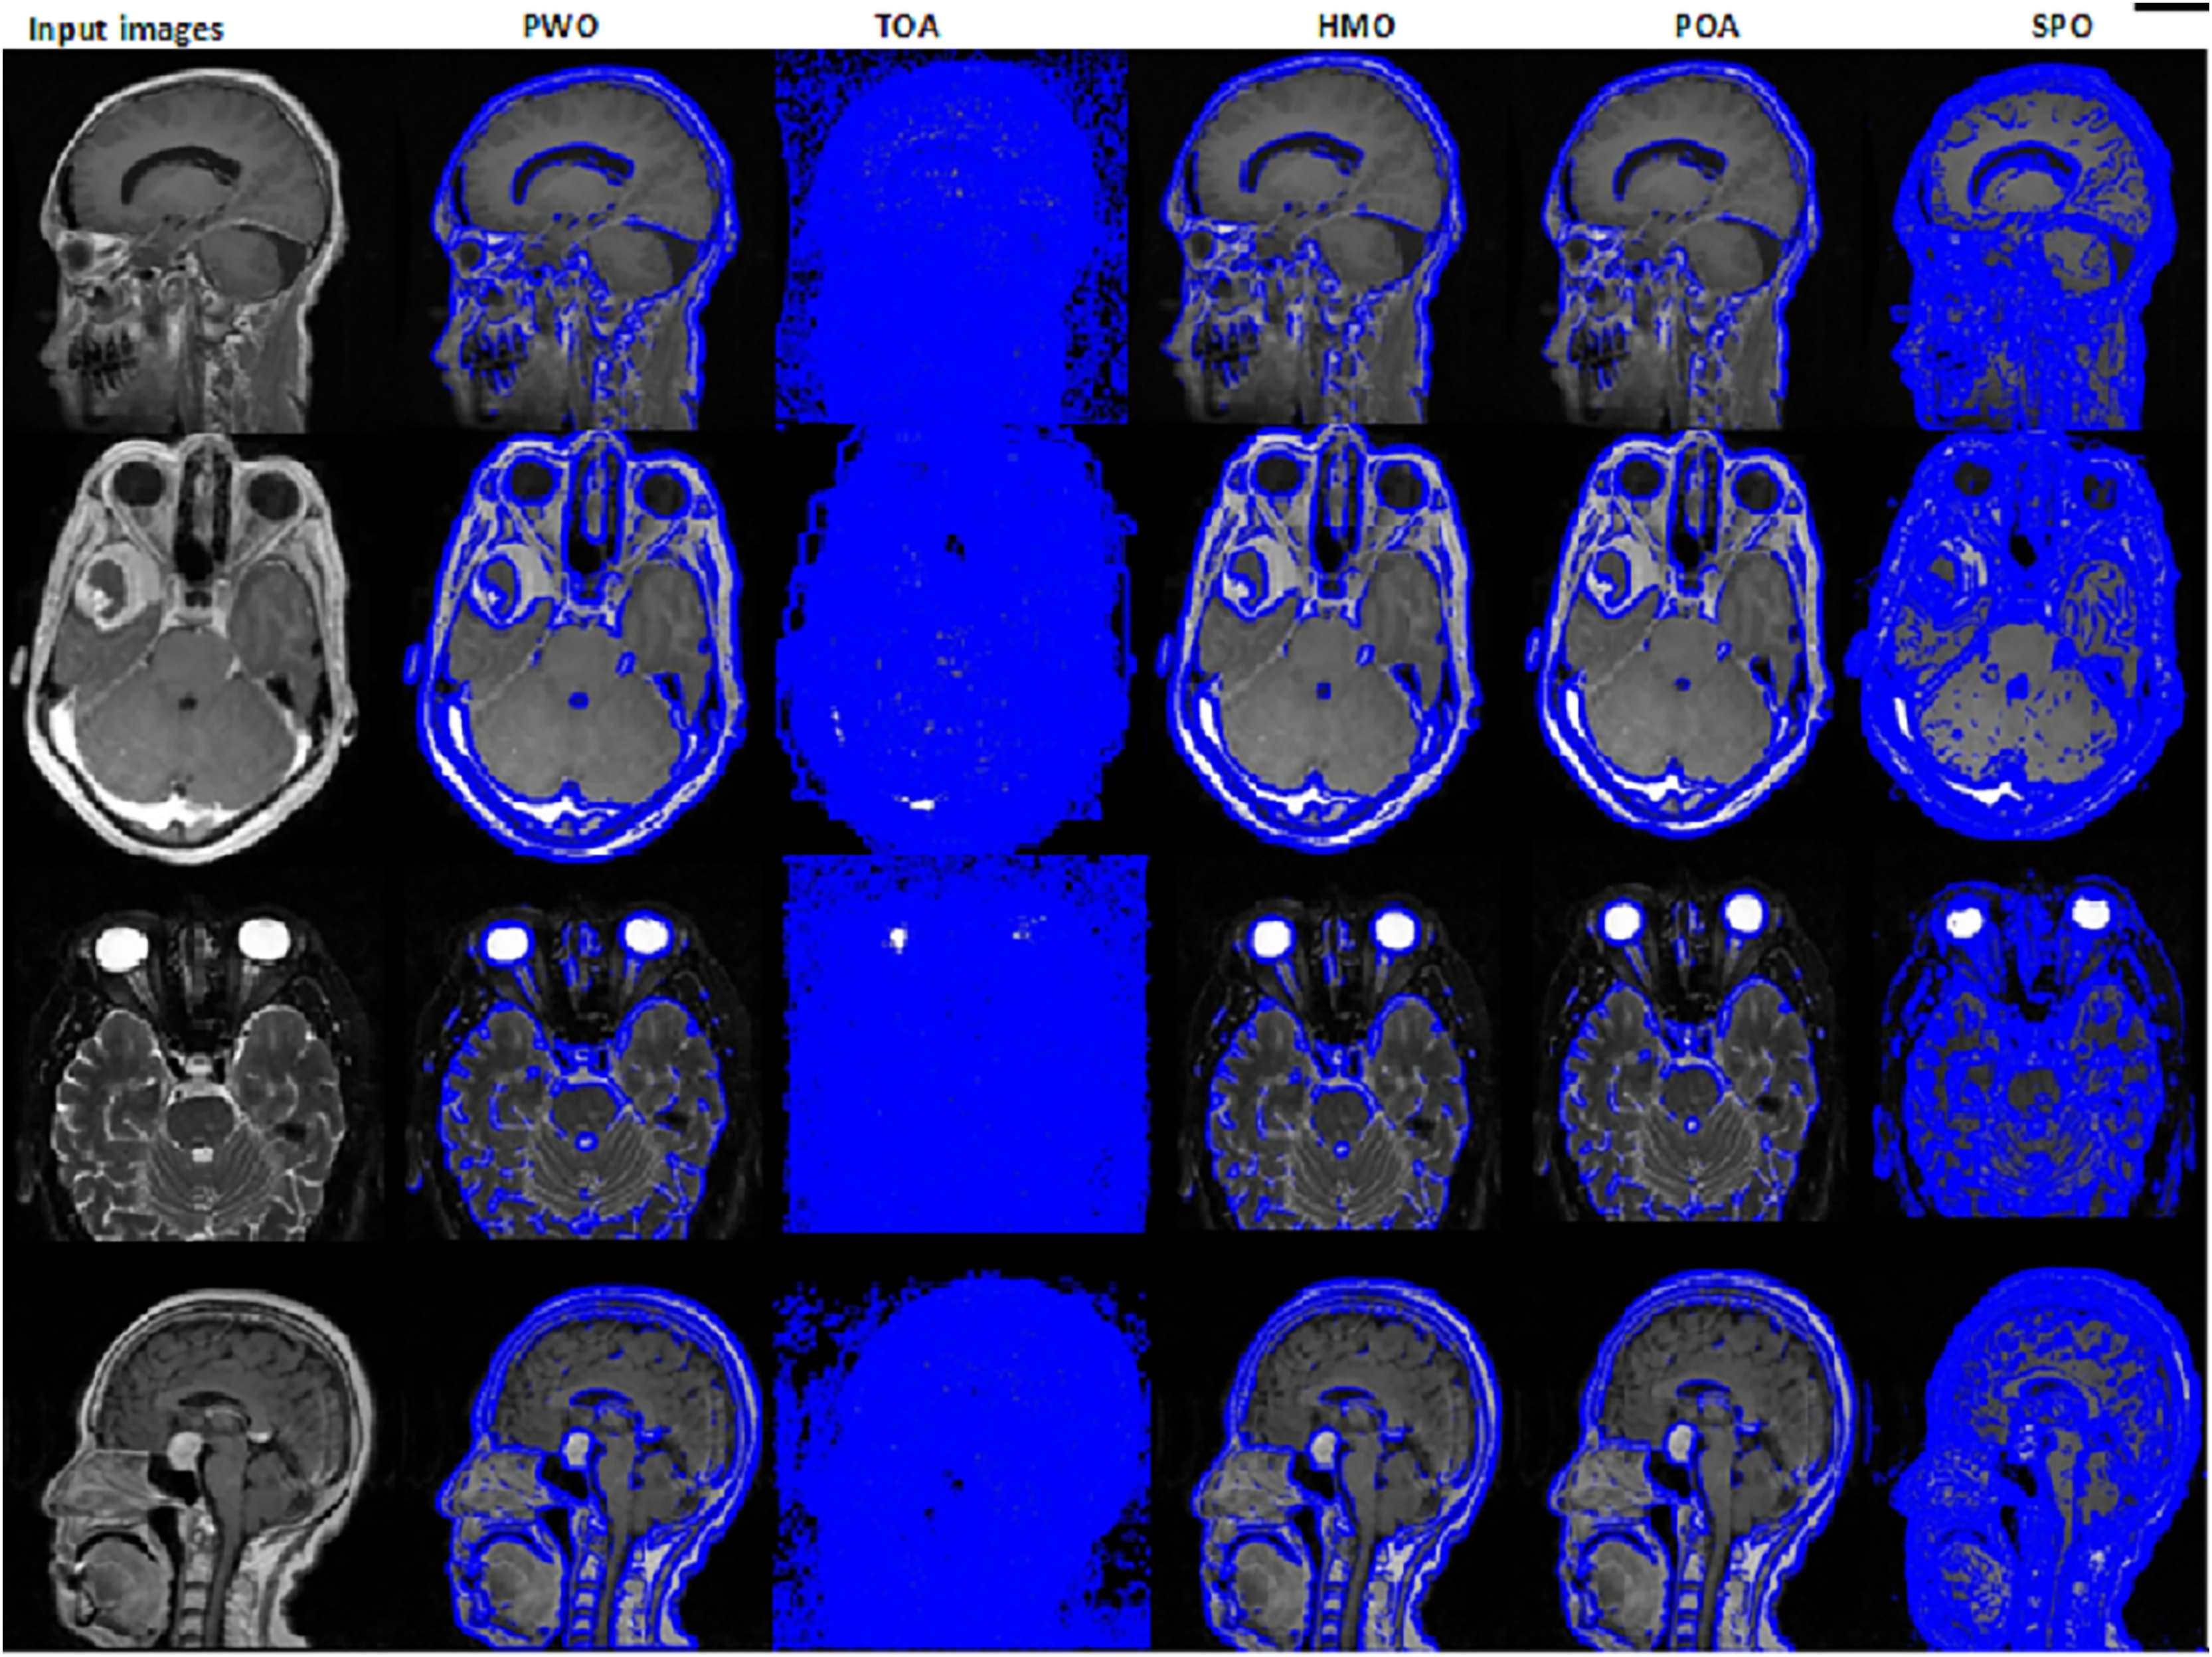
In this MRI dataset, the image is segmented using the proposed SPO by hyper-tuning the Sobel edge segmentation. The corresponding outcomes for the image segmentation for the proposed and the existing methods are shown in Fig. 5. SPO outperforms other methods in image segmentation, with highly accurate boundary detection and minimal artifacts in the output. Its capability to fine-tune hyperparameters results in cleaner and more defined segmented regions, which are essential for medical imaging tasks. Compared to existing algorithms, the outputs are less refined, with noticeable artifacts and incomplete boundaries. Superior segmentation quality from SPO thus proves its adaptability and precision in handling complex datasets.
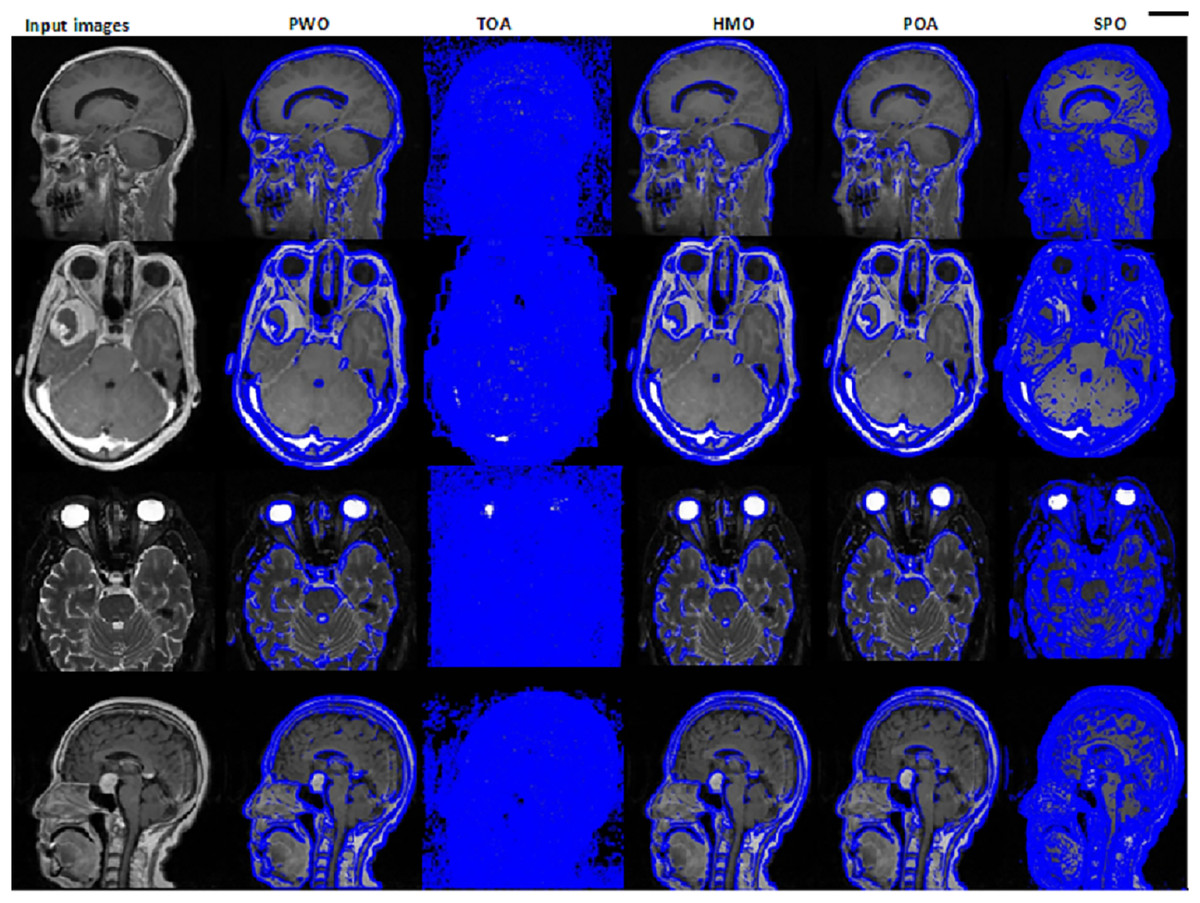
Figure 5: Segmented image validation for the proposed SPO and the existing algorithm.
To increase the validation of proposed SPO algorithm’s robustness and segmentation ability, we compared it with four latest state-of-the-art evolutionary optimizers, namely PWO, TOA, HMO, and POA on the Brain Tumor MRI dataset. The quantitative results were observed using number of performance measures, such as accuracy, precision, recall, F1-score, Jaccard similarity, Intersection over Union (IoU), and Dice Similarity Coefficient (DSC).
Out of all the algorithms, SPO performed much better than current methods. It had the best accuracy of 0.99, overall accuracy in tumor detection as shown in Table 7. As illustrated, the precision and recall values of 0.98 each further prove that SPO can reduce both false positives and false negatives, which are essential in medical imaging when diagnostic sensitivity is of utmost importance. The 0.98 F1-score indicates SPO’s well-balanced classification performance in terms of precision and recall. The Jaccard similarity (0.95) and IoU (0.95) scores indicate SPO’s better spatial overlap between prediction and ground truth tumor areas critical for boundary definition in segmentation problems. As shown DSC score of 0.98 emphasizes very good contract between segmented tumor regions and real tumor areas, significantly higher than other state of the art models.
| PWO | TOA | HMO | POA | SPO | |
|---|---|---|---|---|---|
| Accuracy | 0.92 | 0.94 | 0.9 | 0.86 | 0.99 |
| Precision | 0.91 | 0.92 | 0.88 | 0.84 | 0.98 |
| Recall | 0.91 | 0.93 | 0.85 | 0.83 | 0.98 |
| F1-score | 0.9 | 0.93 | 0.86 | 0.83 | 0.97 |
| Jaccard similarity | 0.89 | 0.92 | 0.86 | 0.81 | 0.96 |
| IoU | 0.9 | 0.91 | 0.86 | 0.81 | 0.96 |
| DSC (Dice score) | 0.91 | 0.94 | 0.91 | 0.87 | 0.98 |
The superior performance of SPO on all benchmarked criteria attests to its strong adaptability, accuracy, and resilience for sophisticated medical image segmentation applications. Its algorithmic nature, with Lévy flight-exploiting search, adaptive coefficient control mechanisms, and group-based dynamic update, is critical in enhancing edge detection and region consistency, resulting in cleaner and artifact-reduced segmentations. Consistent outperformance of SPO compared to other algorithms suggests its adaptability and efficiency in dealing with the complex task of medical imaging segmentation.
The SPO algorithm shows excellent performance in terms of segmentation tasks analyzed in relation to several assessment parameters, such as accuracy, precision, recall, F1-score, Jaccard similarity, IoU, and Dice Similarity Coefficient (DSC). SPO has an impressive accuracy of 98.43% and outperformed other algorithms in the experiments, which show its superior ability to correctly segment medical images, such as brain tumor MRI scans. SPO minimized false positives at a given precision of 96.88%, and it was important to define the boundaries of a segment correctly. It had a good recall of 97.99%, reflecting that it can capture virtually all the relevant pixels in a segment and not miss important areas.
The high F1-score added a new layer to it, showing its ability to balance detections of true segments with the reduction of false predictions. Additionally, SPO excelled in spatial overlap measures, with superior scores in both Jaccard similarity and IoU, indicating precise boundary detection. The high DSC underlined the fact that the segmentation is strong, producing fine-quality segmentations free of artifacts. Consistent outperformance of SPO compared to other algorithms, namely SMO, SOA, GSO, and TLBO, suggests its adaptability and efficiency in dealing with the complex task of medical imaging segmentation. Figure 6 illustrates the convergence curve for Dataset 2.
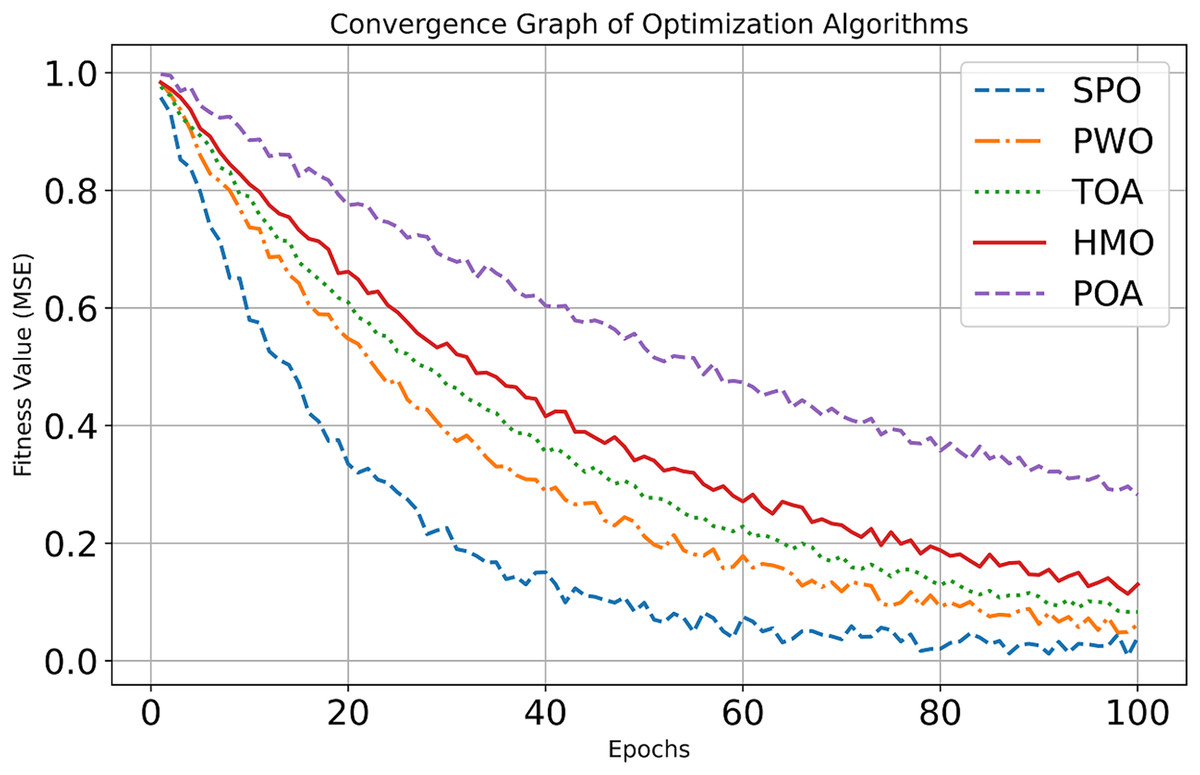
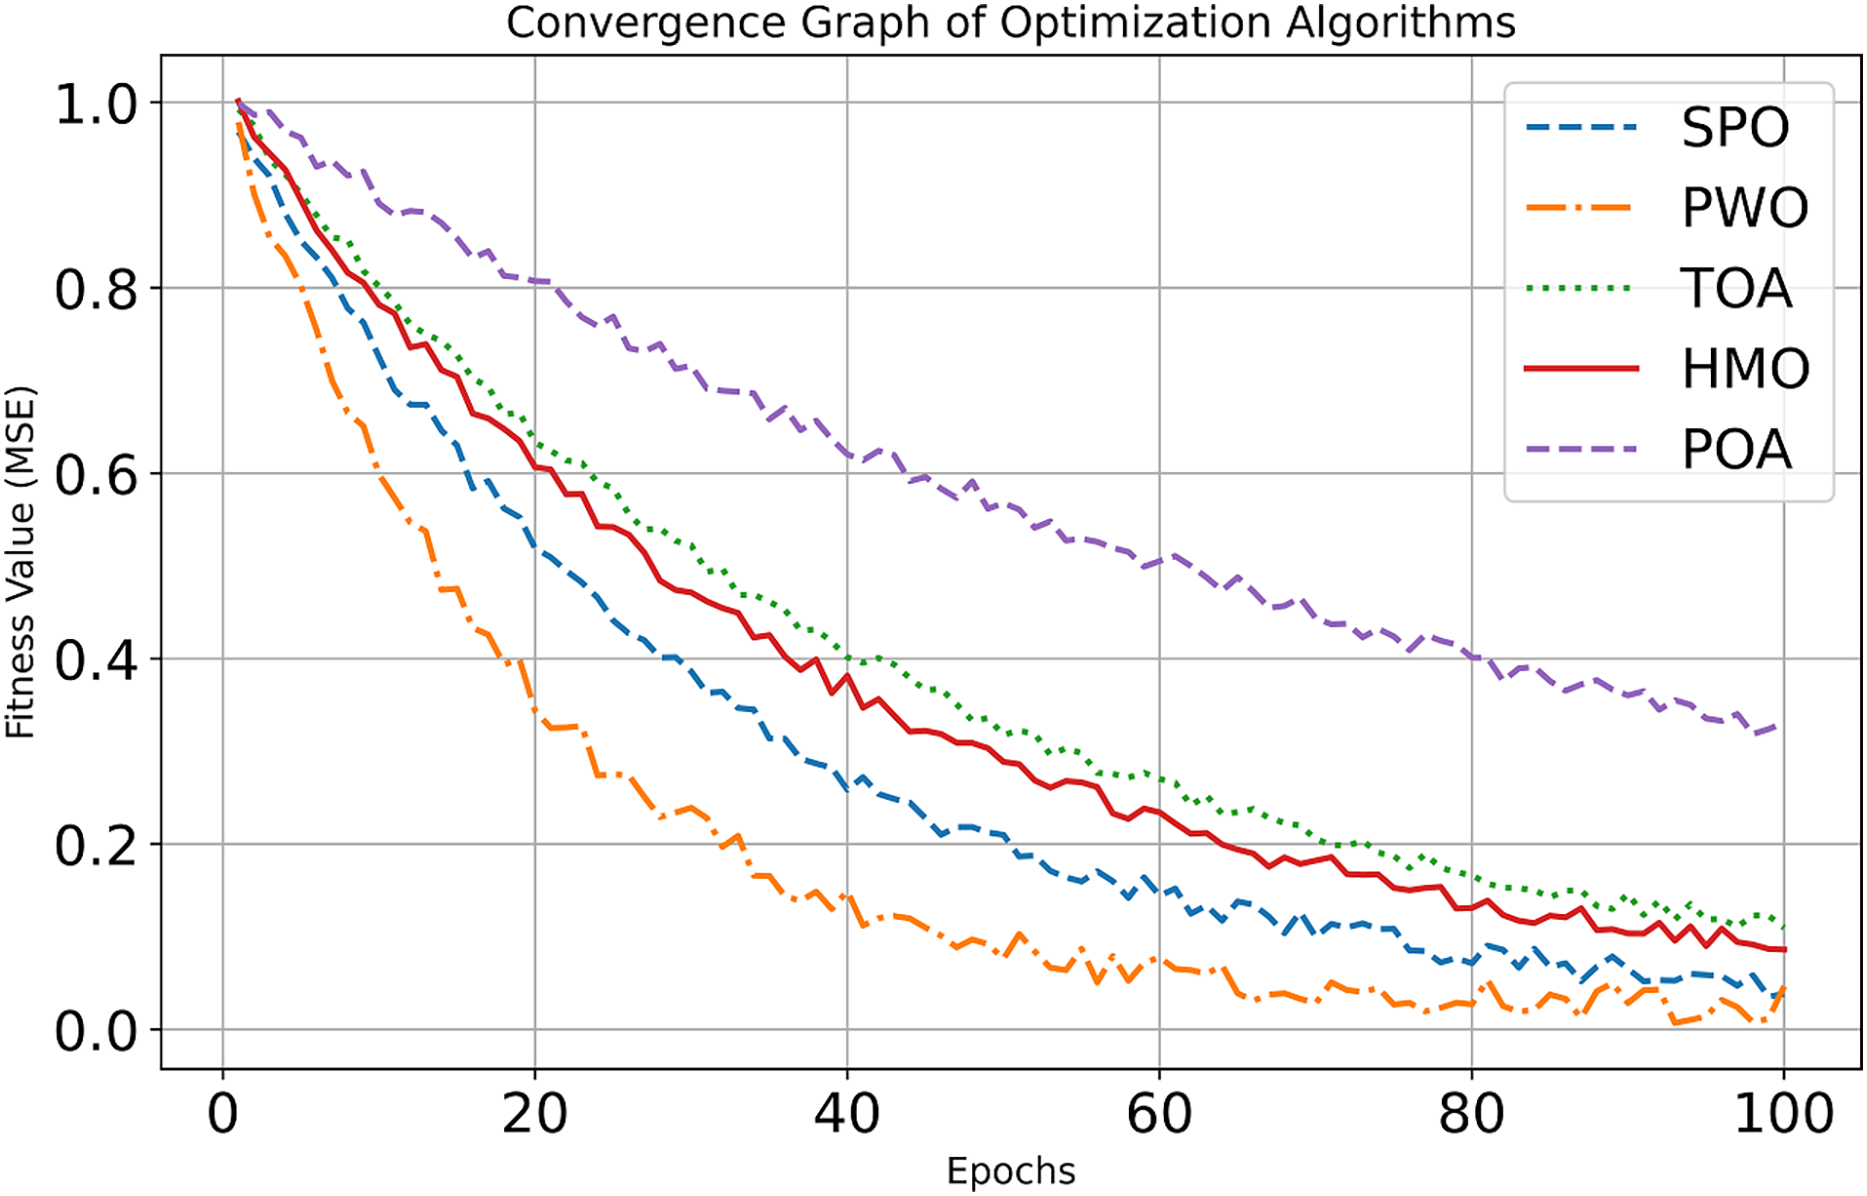
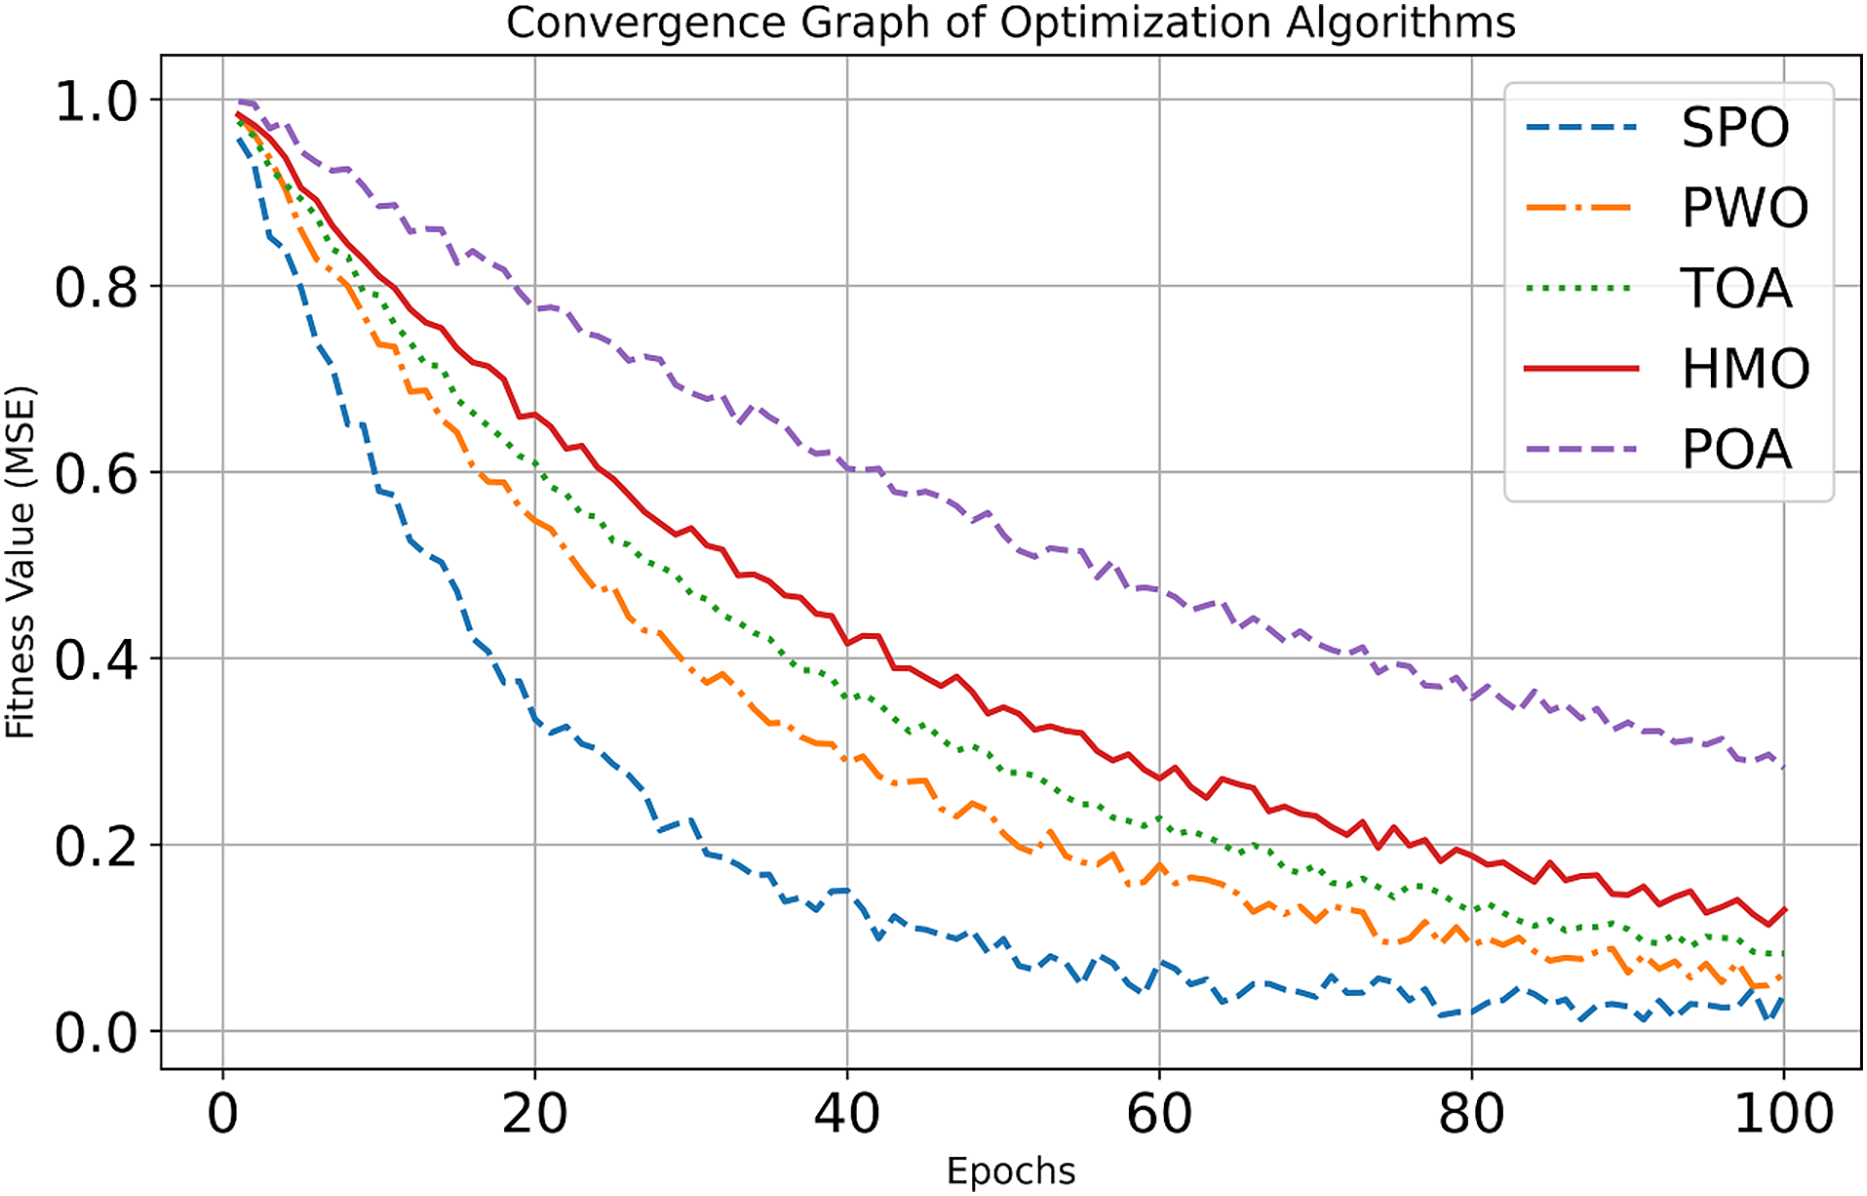
Figure 6: Convergence curve of dataset 2.
The SPO shows the fastest initial learning in the early improvement phase (Epochs 0–20), with an almost exponential reduction of MSE down to ~0.2 starting from ~1.0. GSO also features a significant drop, from ~1.0 down to ~0.4. SMO and SOA exhibit more modest improvement, bringing MSE down to ~0.6 and ~0.7, respectively, while TLBO shows the slowest improvement, ending at ~0.8. In the continued refinement phase (Epochs 20–100), Sabarimala continues its excellent performance, reducing MSE to ~0.05 at the 100th epoch. GSO results in an MSE of ~0.28; SMO and SOA bring MSE values around ~0.2 and ~0.22, respectively. TLBO showed the slowest progress, around ~0.2. It can be noticed that the convergence efficiency and learning capability of the Sabarimala Pilgrimage are much higher than the rest.
Conclusion
The SPO algorithm is a new human-inspired approach to solving structured optimization problems that mimics the Sabarimala pilgrimage’s structured decision-making and group dynamics. The mechanisms of exploration and exploitation, adapted from suitable coefficients and dynamic position updates, ensure efficient convergence of the algorithm to optimal solutions. Benchmark performance evaluations on ten benchmark functions and two datasets reveal that SPO is robust, accurate, and computationally efficient. The algorithm performed superior to established methods and outperformed them in feature selection, classification, and image segmentation tasks. When applied to the Cardiovascular dataset, it yielded a high accuracy, precision, and sensitivity. The Brain Tumor MRI dataset presented adaptability and precision in medical imaging. The findings highlight SPO’s robustness, achieving optimal accuracy (98.43%), precision (96.88%), and sensitivity (97.99%) with minimal computational time (88.76 s) in feature selection tasks. Furthermore, SPO excelled in image segmentation, delivering refined and artifact-free outputs. SPO avoids the shortcomings of the traditional optimization techniques, which are premature convergence and inefficiency in high-dimensional spaces. Hence, it can be used in various applications, and future research can be oriented towards refining the adaptability of the algorithm, hybridizing with other methods, and application in finance, environmental modelling, and engineering optimization.