
GeoDFNet: a point-of-interest classification algorithm with dual fusion of geospatial local neighborhood features
- Published
- Accepted
- Received
- Academic Editor
- Gang Mei
- Subject Areas
- Algorithms and Analysis of Algorithms, Artificial Intelligence, Data Mining and Machine Learning, Spatial and Geographic Information Systems, Neural Networks
- Keywords
- Point-of-interest classification, Deep learning, Graph neural networks, Transformer, Multimodal fusion
- Copyright
- © 2025 Wang et al.
- Licence
- This is an open access article distributed under the terms of the Creative Commons Attribution License, which permits unrestricted use, distribution, reproduction and adaptation in any medium and for any purpose provided that it is properly attributed. For attribution, the original author(s), title, publication source (PeerJ Computer Science) and either DOI or URL of the article must be cited.
- Cite this article
- 2025. GeoDFNet: a point-of-interest classification algorithm with dual fusion of geospatial local neighborhood features. PeerJ Computer Science 11:e3323 https://doi.org/10.7717/peerj-cs.3323
Abstract
Current Point of Interest (POI) classification models predominantly depend on textual data for feature modeling, often failing to resolve ambiguities in POI naming conventions. To overcome this limitation, we propose a Geospatial local neighborhood Dual Fusion Network (GeoDFNet), which synergizes multimodal features through a hierarchical fusion framework. By leveraging geographic similarity principles, GeoDFNet first constructs POI-centric local neighborhoods by encoding spatial relationships and aggregating surrounding geographic features via graph attention networks (GAT). In parallel, a Transformer encoder extracts latent semantic representations from textual metadata. The model employs a multi-head attention mechanism coupled with a dual-phase fusion strategy to dynamically calibrate the contributions of text and geospatial features. Experimental results on three real-world datasets (Shanghai POI, Beijing AutoNavi, and Guangdong OpenStreetMap) demonstrate that GeoDFNet achieves significantly higher classification accuracy compared to baseline models. Notably, on the Shanghai dataset, GeoDFNet attained an overall accuracy of 98.60%, substantially outperforming all textual baselines (e.g., Text Convolutional Neural Networks (TextCNN): 91.13%, Text Recurrent Neural Networks (TextRNN): 83.54%, Transformer: 86.64%).These experimental results confirm that the proposed model achieves robust performance and effectively mitigates the ambiguity issue in POI names.
Introduction
With the rapid advancement of Internet technology and artificial intelligence, location-based services (LBS) have witnessed a significant proliferation of applications, encompassing path navigation and location recommendation systems (Zhao, Ma & Zhang, 2018; Zheng et al., 2021; Yang & Dong, 2022). Point of interest (POI), defined as geographic entities of public interest that can be abstractly represented as point features, refers to facilities such as parks, community centers, and bookstores, among others (Psyllidis et al., 2022). The availability of time-sensitive and high-precision POI data, particularly categorical information, serves as the foundational dataset for delivering high-quality LBS and constitutes a critical source for urban planning research. Examples include urban functional regions identification (Jing et al., 2022; Yan et al., 2023), trajectory prediction (Zeng et al., 2022; Li et al., 2024; Feng et al., 2025), and user-centric location recommendation systems (Halder et al., 2022; Liu et al., 2023; Alatiyyah, 2025). However, the manual handling of massive POI data updates frequently results in missing attributes, including categorical information, due to the sheer data volume. Consequently, the development of automated, efficient, and real-time POI classification methods has become critical to ensuring data quality and maintaining the integrity of POI databases.
The name attribute serves as a critical semantic attribute and fundamental basis for POI automatic classification. Current research approaches largely concentrate on extracting and analyzing textual features from POI names, subsequently computing semantic similarity (Tan et al., 2013, 2023) between POI names and predefined category labels (Luo et al., 2012). With the advancement of machine learning techniques, advanced models including Word2Vec and bidirectional encoder representations from transformers (BERT) have been employed to generate vector representations of POI names. These representations are subsequently integrated into traditional machine learning classifiers (e.g., support vector machines and random forests) or advanced deep learning architectures (e.g., region-based convolutional neural networks (R-CNN), TextCNN, and enhanced sequential inference model (ESIM)) to enable automated POI classification (Li, 2022; Li et al., 2022b; Luo, Yan & Luo, 2022; Li et al., 2022a). Beyond relying solely on name attributes, recent studies have expanded the classification framework by incorporating heterogeneous data sources, including social media data (Wan & Wang, 2018), address information (Jiahao, 2020), large-scale internet data (Zhou et al., 2020) and behavioral trajectory data (Liu et al., 2024a). The integration of large language models (LLMs) has further improved classification performance by leveraging their robust reasoning and contextual comprehension capabilities (Liu et al., 2024a). Additionally, POI tag features (Zhang et al., 2024) have been utilized to augment semantic representations, thereby enhancing classification accuracy. Existing POI classification methods predominantly rely on textual information and achieve satisfactory performance for conventional POI names. However, text-based approaches are constrained by inherent semantic ambiguities in POI names. Existing POI classification methods predominantly rely on textual information and achieve satisfactory performance for conventional POI names. However, they exhibit significant limitations when handling ambiguous POI names due to the semantic vagueness inherent in text-based approaches. To quantify the prevalence of this issue, we conducted a manual validation on a random sample of 1,500 instances drawn from a large-scale dataset of over 200,000 entries. The results indicate that approximately 14.27% of POI names exhibit semantic ambiguities leading to misclassification. For instance, establishments such as “Centennial Dragon Robe”, “Akang Story”, and “Hi Meow” are frequently misclassified into shopping or life service categories, despite their actual classification under catering services. Similarly, locations like “Eden”, “South Park”, “Bansong Garden”, and “Canal Bay” are often erroneously categorized as scenic spots rather than commercial-residential complexes. These frequent misclassifications underscore the substantive gap in current textual methods regarding contextual and semantic disambiguation.
In POI datasets, beyond explicit textual attributes (e.g., names, addresses), geospatial relationships constitute critical implicit features within localized neighborhoods. The Third Law of Geography—empirically formalized as the more similar geographic configurations of two points (areas), the more similar the values (processes) of the target variable at these two points (areas) (Zhu et al., 2018)—manifests through observable patterns as evidenced by the common presence of snack bars and stationery stores in the vicinity of schools across diverse locations.
This principle establishes that topologically analogous environments engender congruent entity characteristics. Harnessing neighborhood relationships thus overcomes limitations of text-reliant methods by encoding contextual knowledge unobtainable from lexical features alone. The fusion of textual-semantic and geospatial features has been widely adopted in interdisciplinary research. For instance, researchers have leveraged NLP and spatial analysis techniques to extract and analyze disaster-related content from social media (Sit, Koylu & Demir, 2019; Gulnerman & Karaman, 2020; Scheele, Yu & Huang, 2021). Others have integrated text mining and spatial accessibility models to optimize travel route planning (Zhou et al., 2024) and elucidate the spatiotemporal dynamics of residents’ daily activities (Liu et al., 2021). Additionally, spatial-textual analytics have been applied to crime prediction (Saraiva et al., 2022), urban functional zone recognition (Almatar et al., 2020; Zhang et al., 2021), and POI recommendation systems (Wang et al., 2023).
However, within POI classification specifically, the synergistic fusion of textual semantics and geospatial context remains underexplored. While existing studies successfully integrate text and spatial data, they predominantly address broader scales (e.g., urban zones, disaster areas) or divergent objectives (e.g., route optimization, recommendation systems, event detection). Crucially, these approaches typically fail to explicitly leverage the fine-grained discriminative capacity inherent in a target POI’s immediate geospatial neighborhood for resolving textual ambiguities. Most methodologies either treat spatial context as coarse-grained statistical aggregations (Zheng et al., 2014) or employ it in isolation (Qin et al., 2023), rather than deeply embedding localized neighborhood semantics to directly interpret and disambiguate the target POI’s attributes within a unified modeling framework. Addressing this gap, in this study, spatial proximity is utilized to construct a semantically rich local geospatial neighborhood by aggregating spatially proximate clusters around target POIs. This neighborhood feature is then embedded into the classification framework to augment inference accuracy by providing contextual synergy. For example, during the classification of the establishment “Centennial Dragon Robe”, its local geospatial neighborhood exhibits high similarity to POIs in the catering service category, thereby providing crucial discriminative evidence—beyond what its ambiguous name alone offers—for its correct categorization as a restaurant. This methodology underscores the efficacy of deeply integrating localized geospatial neighborhood context specifically for resolving POI classification ambiguities.
We propose an automatic POI classification method that integrates geospatial neighborhood embeddings and textual semantic features through a multimodal fusion framework. We introduce the Geo-neighborhood Dual Fusion Network (GeoDFNet), a hybrid model combining text classification, graph neural networks, and cross-modal fusion. The proposed framework follows a multistage computational pipeline: First, geospatial neighborhoods are derived through spatial proximity modeling, where neighborhood signals are propagated from spatially adjacent nodes via graph attention networks (GAT) (Velikovi et al., 2017). Second, hierarchical semantic extraction is performed on POI name texts using the Transformer encoder architecture (Vaswani et al., 2017). Finally, the model performs classification via a cross-modal fusion module that dynamically aligns geospatial and textual representations. To validate the methodology, experiments are conducted on large-scale POI datasets from Beijing, Guangdong, and Shanghai. Empirical evaluations demonstrate that GeoDFNet surpasses baseline models across accuracy, F1-score, and robustness metrics. The results highlight that geospatial neighborhood integration substantially enhances classification performance, offering a generalizable solution to mitigate semantic ambiguity in real-world POI applications.
To summarize, the contributions of our work are listed as follows:
-
(1)
Leveraging the Third Law of Geography, we establish a knowledge framework for spatial topological relationships among geographic entities, enabling the construction of geospatial local neighborhoods. These localized spatial representations are effectively incorporated into the model training process through graph-structured data and GNNs, achieving enhanced capture of local spatial patterns within POI datasets.
-
(2)
We propose GeoDFNet, a novel dual-fusion network for POI classification that integrates both feature-level and decision-level fusion, unlike conventional single-strategy approaches. The T-G Feature Fusion (T-GFF) module merges textual and geospatial features, while the Enhanced Geospatial Neighborhood (EGN) module incorporates spatial topology at the decision level. Ablation studies confirm the necessity of both modules: removing T-GFF or EGN significantly reduces F1-score (to 97.04% and 96.81%, respectively) and increases performance instability, compared to the full model (97.65% F1). This synergistic dual-fusion mechanism captures fine-grained feature interactions and high-level spatial context, yielding more accurate and robust predictions.
-
(3)
We conducted extensive validation using real-world geospatial datasets across multiple regions and heterogeneous data sources. The experimental results demonstrate both the effectiveness and robustness of our proposed model, with comprehensive testing in cross-regional scenarios confirming its superior performance in geographical information processing tasks.
Related work
The third law of geography
Geospatial similarity, manifested through the widely recognized Third Law of Geography (Zhu et al., 2018), establishes that ‘geographic entities in analogous spatial environments exhibit congruent characteristics’, with universality and generalizability empirically confirmed (Zhu et al., 2020). This implies consistent attribute manifestation among entities within homogeneous geospatial neighborhoods, regardless of location. We operationalize this principle through categorical neighborhood congruence: By quantifying adjacent POI similarity as a neighborhood proxy, cross-location analogy emerges when proximate entities show categorical alignment. This defines analogous neighborhoods implying intrinsic anchor POI similarity, transforming geographical principles into computable features for neighborhood topology integration in POI classification.
Graph neural networks
The inherent graph structure of geospatial data—where POIs constitute nodes and spatial relationships (e.g., proximity, adjacency) form edges—establishes graph neural networks (GNNs) as a natural paradigm for modeling POI dependencies. Foundational architectures including graph convolutional networks (GCN) (Kipf & Welling, 2016), GraphSAGE (Hamilton, Ying & Leskovec, 2017), and GAT enable direct operation on irregular spatial topologies, adaptively capturing neighborhood dependencies essential for resolving POI ambiguities (e.g., classifying stationery stores adjacent to schools vs. commercial zones, or distinguishing medical facilities proximate to pharmacies from retail clusters). This capability originates from core GNN principles: The message-passing mechanism models neighborhood influence dynamics wherein POI semantics are contextually refined by local environments, while permutation invariance guarantees robustness to irregular geospatial point patterns—fulfilling fundamental requirements for geographic knowledge discovery.
Multimodal fusion
Multimodal fusion entails joint modeling of complementary attributes across heterogeneous data streams. While current research predominantly integrates vision-language modalities (e.g., images, text) (Zhou et al., 2023; Xu et al., 2023), this study pioneers geospatial-textual fusion to bridge neighborhood topology and POI name semantics. Inspired by cross-modal reinforcement paradigms—demonstrated in Liu et al.’s (2024b) fusion of remote sensing and trajectory data for road-aware POI identification—we develop a dual-stream framework: Geospatial embeddings encode Neighborhood attributes through spatial aggregation while textual embeddings capture lexical patterns. By dynamically harmonizing spatial neighborhood and textual semantics, the model capitalizes on their discriminative synergies, enabling spatial clusters to resolve textual ambiguities (e.g., ‘Dragon’ in restaurant vs. apparel contexts) and lexical cues to interpret spatial anomalies, significantly enhancing classification robustness across urban morphologies.
Methods
Overall architecture
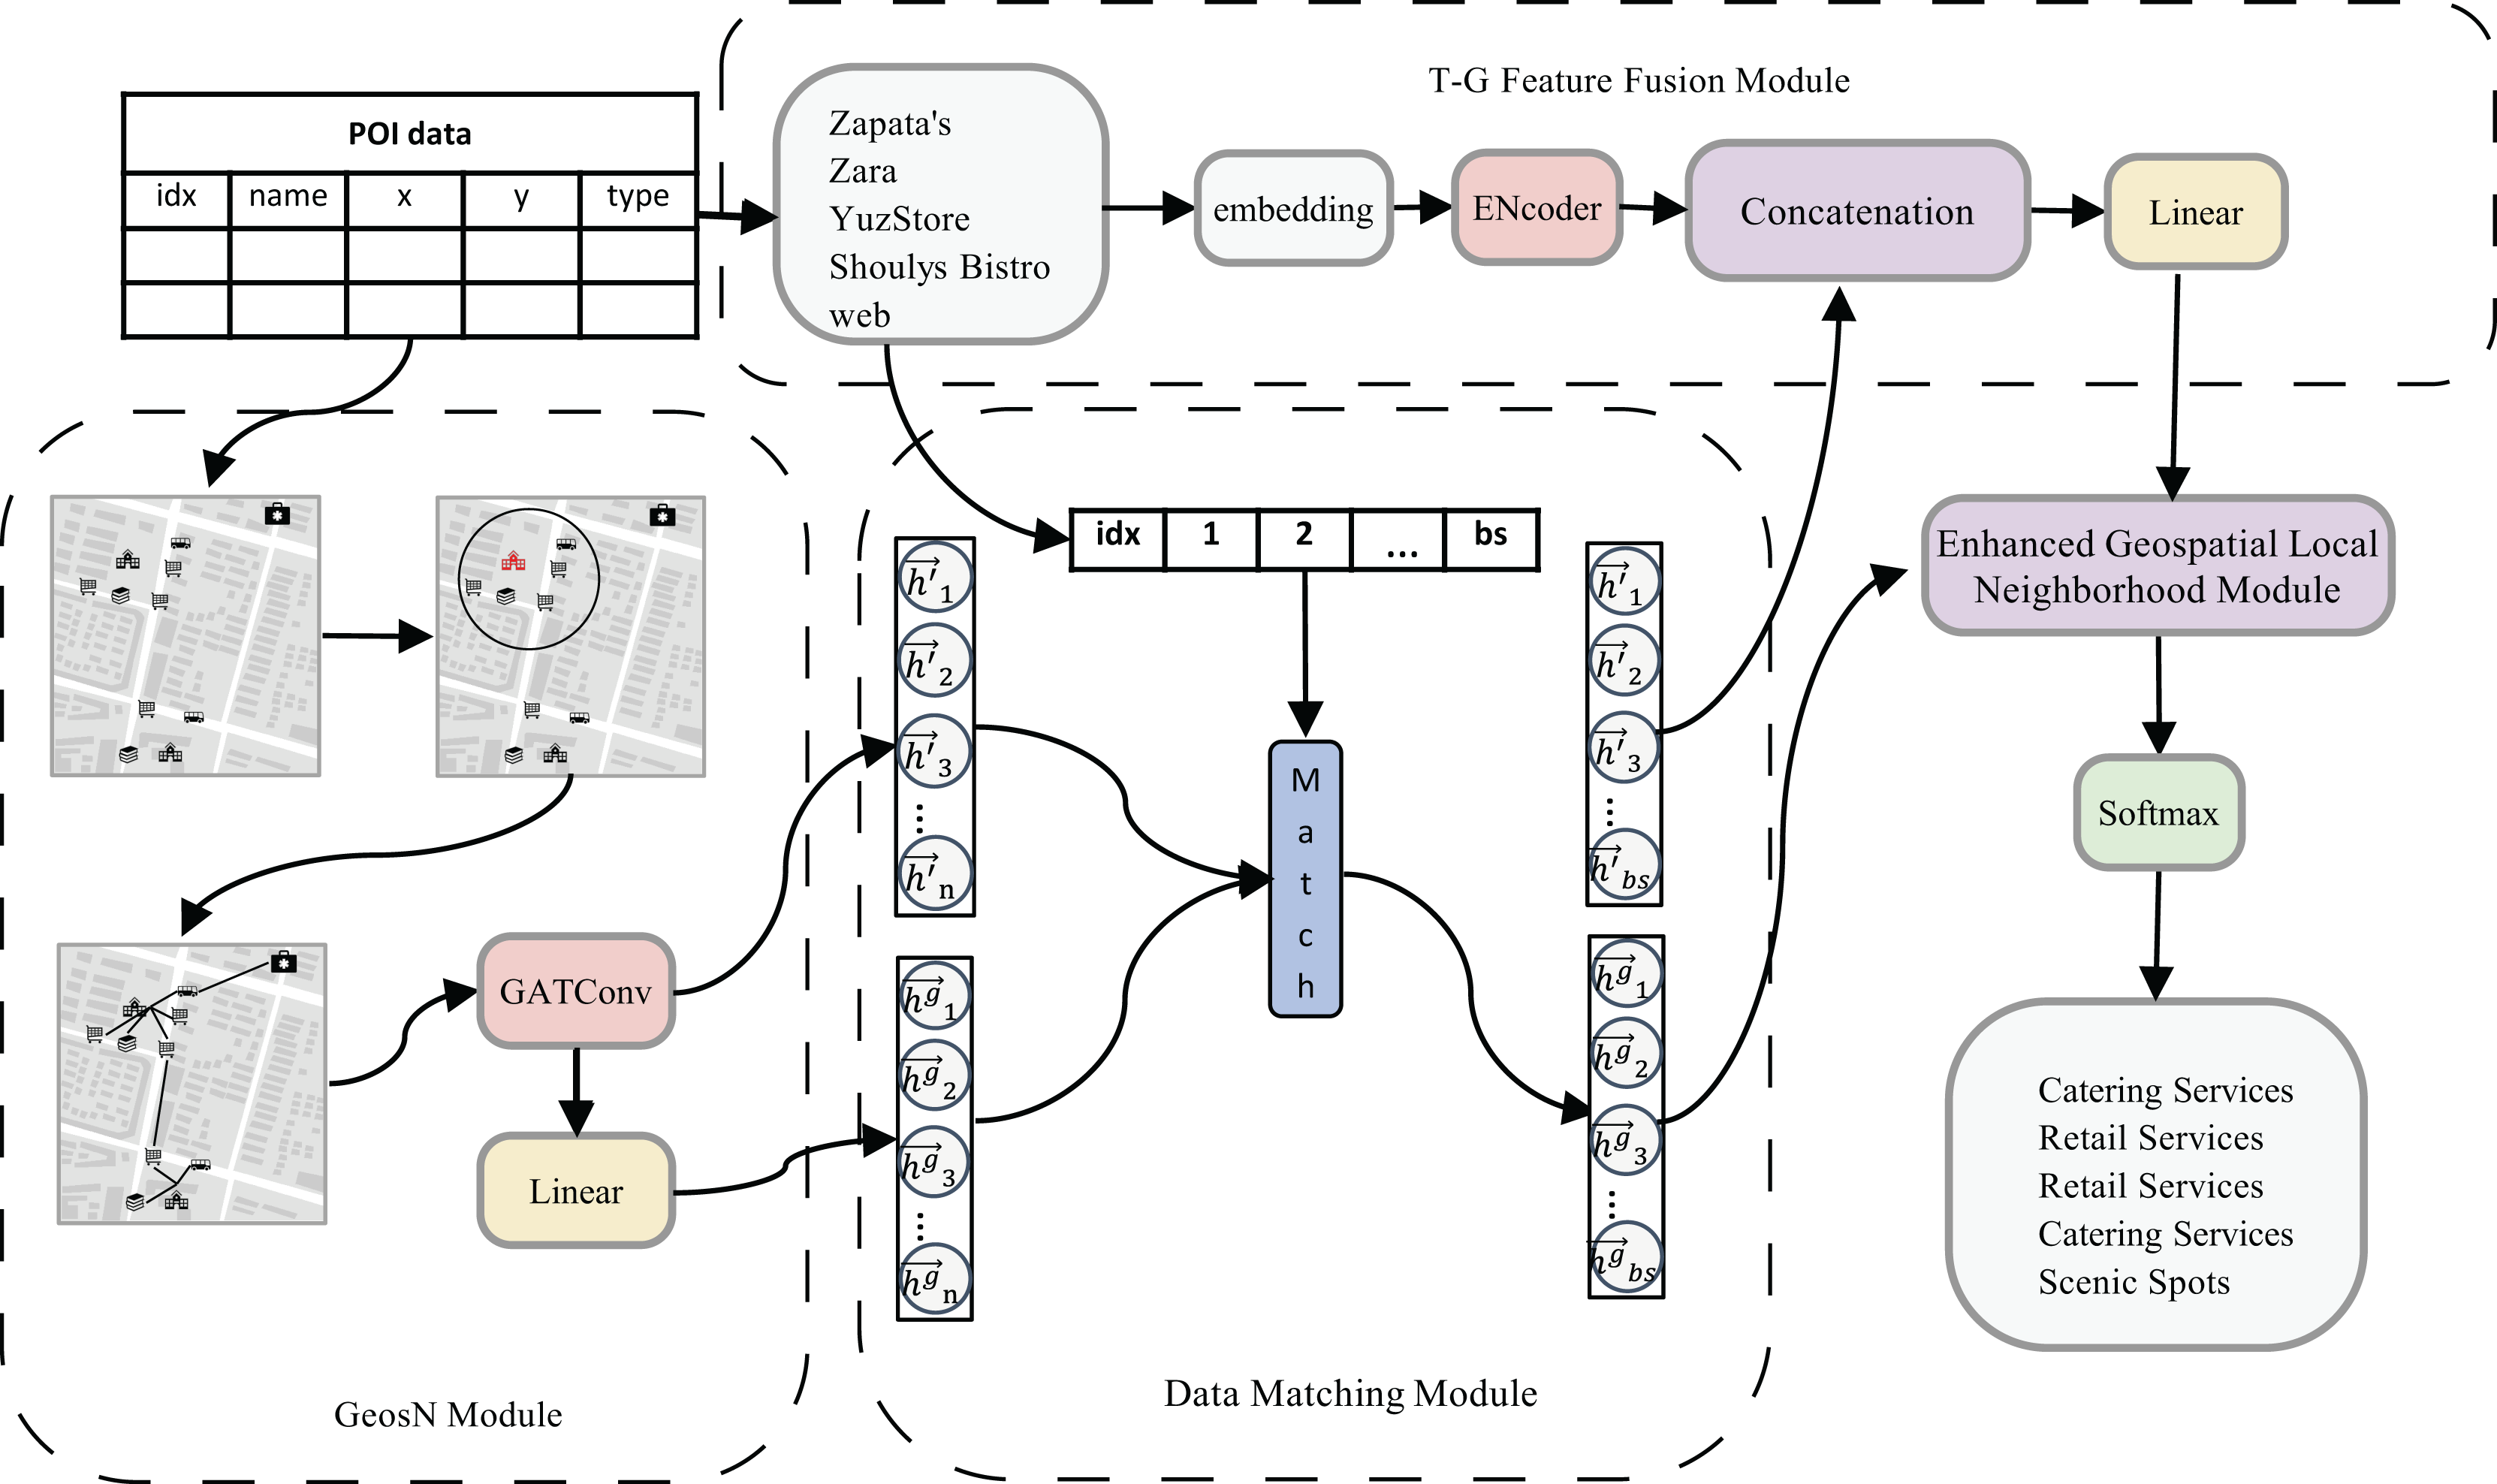
The architecture of the proposed GeoDFNet model is illustrated in Fig. 1, which consists of four principal components: the Geospatial Neighborhood (GeosN) module, Data Matching module, Textual-Geographical Feature Fusion (T-G Feature Fusion) module, and Enhanced Geospatial Local Neighborhood module. This hierarchical design integrates geospatial neighborhood understanding with cross-modal feature interaction, followed by localized neighborhood refinement to enhance geographical representation learning.
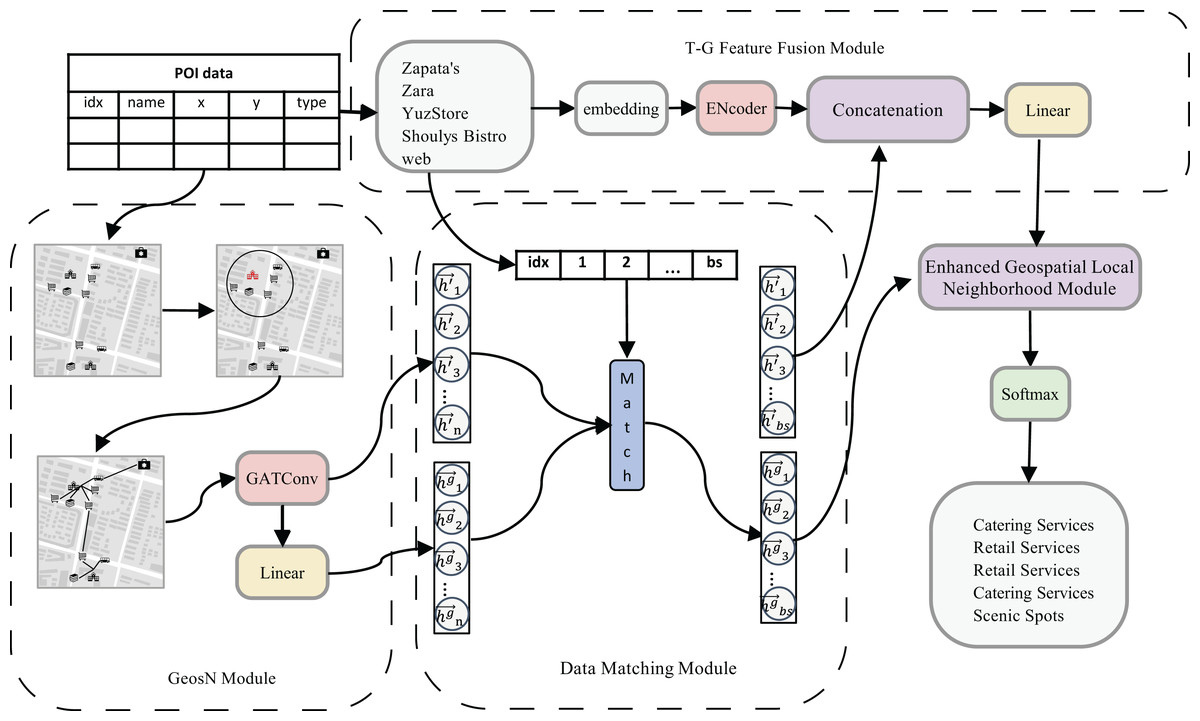
Figure 1: Overall framework diagram.
GeosN module: This module harnesses the message propagation and neighborhood aggregation paradigm of graph neural networks. Specifically, it incorporates a first-layer of GAT with disabled self-loop connections to mitigate feature contamination from the target POI. By excluding the target node’s ego features during aggregation, the module ensures that geospatial representations are exclusively neighbor by spatially adjacent nodes. A multi-head attention mechanism is employed to adaptively recalibrate attention weights across neighbors, thereby capturing the comprehensive local geospatial neighborhood features. Finally, a linear transformation layer projects these features into a latent space, producing refined local geospatial neighborhood embeddings for downstream classification.
Data Matching Module: The GeosN module generates embeddings for all nodes; however, computational constraints necessitate batch-wise processing of textual features during training iterations, as handling the full dataset exceeds hardware capacity. This batch partitioning creates a mismatch between the quantity of textual features and geospatial local neighborhood features within individual batches. To address this discrepancy, the Data Matching module selectively aligns the geospatial local neighborhood features of corresponding POI nodes with their textual counterparts in the current batch. Specifically, this module matches both the complete and compressed geospatial local neighborhood features of geographic entities present in the batch, ensuring cross-modal consistency. The implementation employs a dual-indexing mechanism and feature similarity thresholds to dynamically establish correspondences, thereby mitigating computational overhead while preserving critical spatial-textual relationships for downstream fusion processes.
T-G Feature Fusion module: This module synthesizes spatial-semantic representations by integrating textual semantic embeddings and geospatial neighborhood embeddings. The Transformer encoder processes textual information from POI names to generate semantic embeddings, while the Data Matching Module provides task-aligned geospatial neighborhood features. By orchestrating cross-modal fusion between these modalities, the module leverages their discriminative synergies to construct a joint latent representation. This fusion mechanism enables joint modeling of semantic and spatial dependencies, significantly improving classification accuracy through enriched neighborhood.
Enhanced Geospatial Local Neighborhood module: In the text-geospatial local neighborhood features generated by the T-G Feature Fusion module, the contribution of text features significantly outweighs that of geospatial local neighborhood features. To address this imbalance, the Geospatial Local Neighborhood Enhancement module utilizes the compressed geospatial local neighborhood features from the GeosN module, which are filtered and aligned by the Data Matching module. These external features are then integrated through a decision fusion approach, effectively enhancing the representation of geospatial neighborhood. This process ensures a more balanced and robust feature set, strengthening the model’s ability to leverage spatial information for improved classification performance.
Finally, the fusion matrix, enriched with enhanced features, serves as the input to the Softmax layer. The subsequent section provides a detailed description of the model architecture and its components.
GeosN module
The geospatial local neighborhood module, based on graph neural networks, constructs a graph representation where real geographic entities serve as nodes, and the adjacency relationships between these entities form the edges of the graph. This module maps the geospatial neighborhood of the target POI into a high-dimensional vector space. By leveraging the message-passing and aggregation mechanism of graph neural networks, it effectively captures the geographic environment in accordance with the principle of geographical similarity. This process results in the formation of comprehensive local neighborhood features that encapsulate the spatial neighborhood of the target POI.
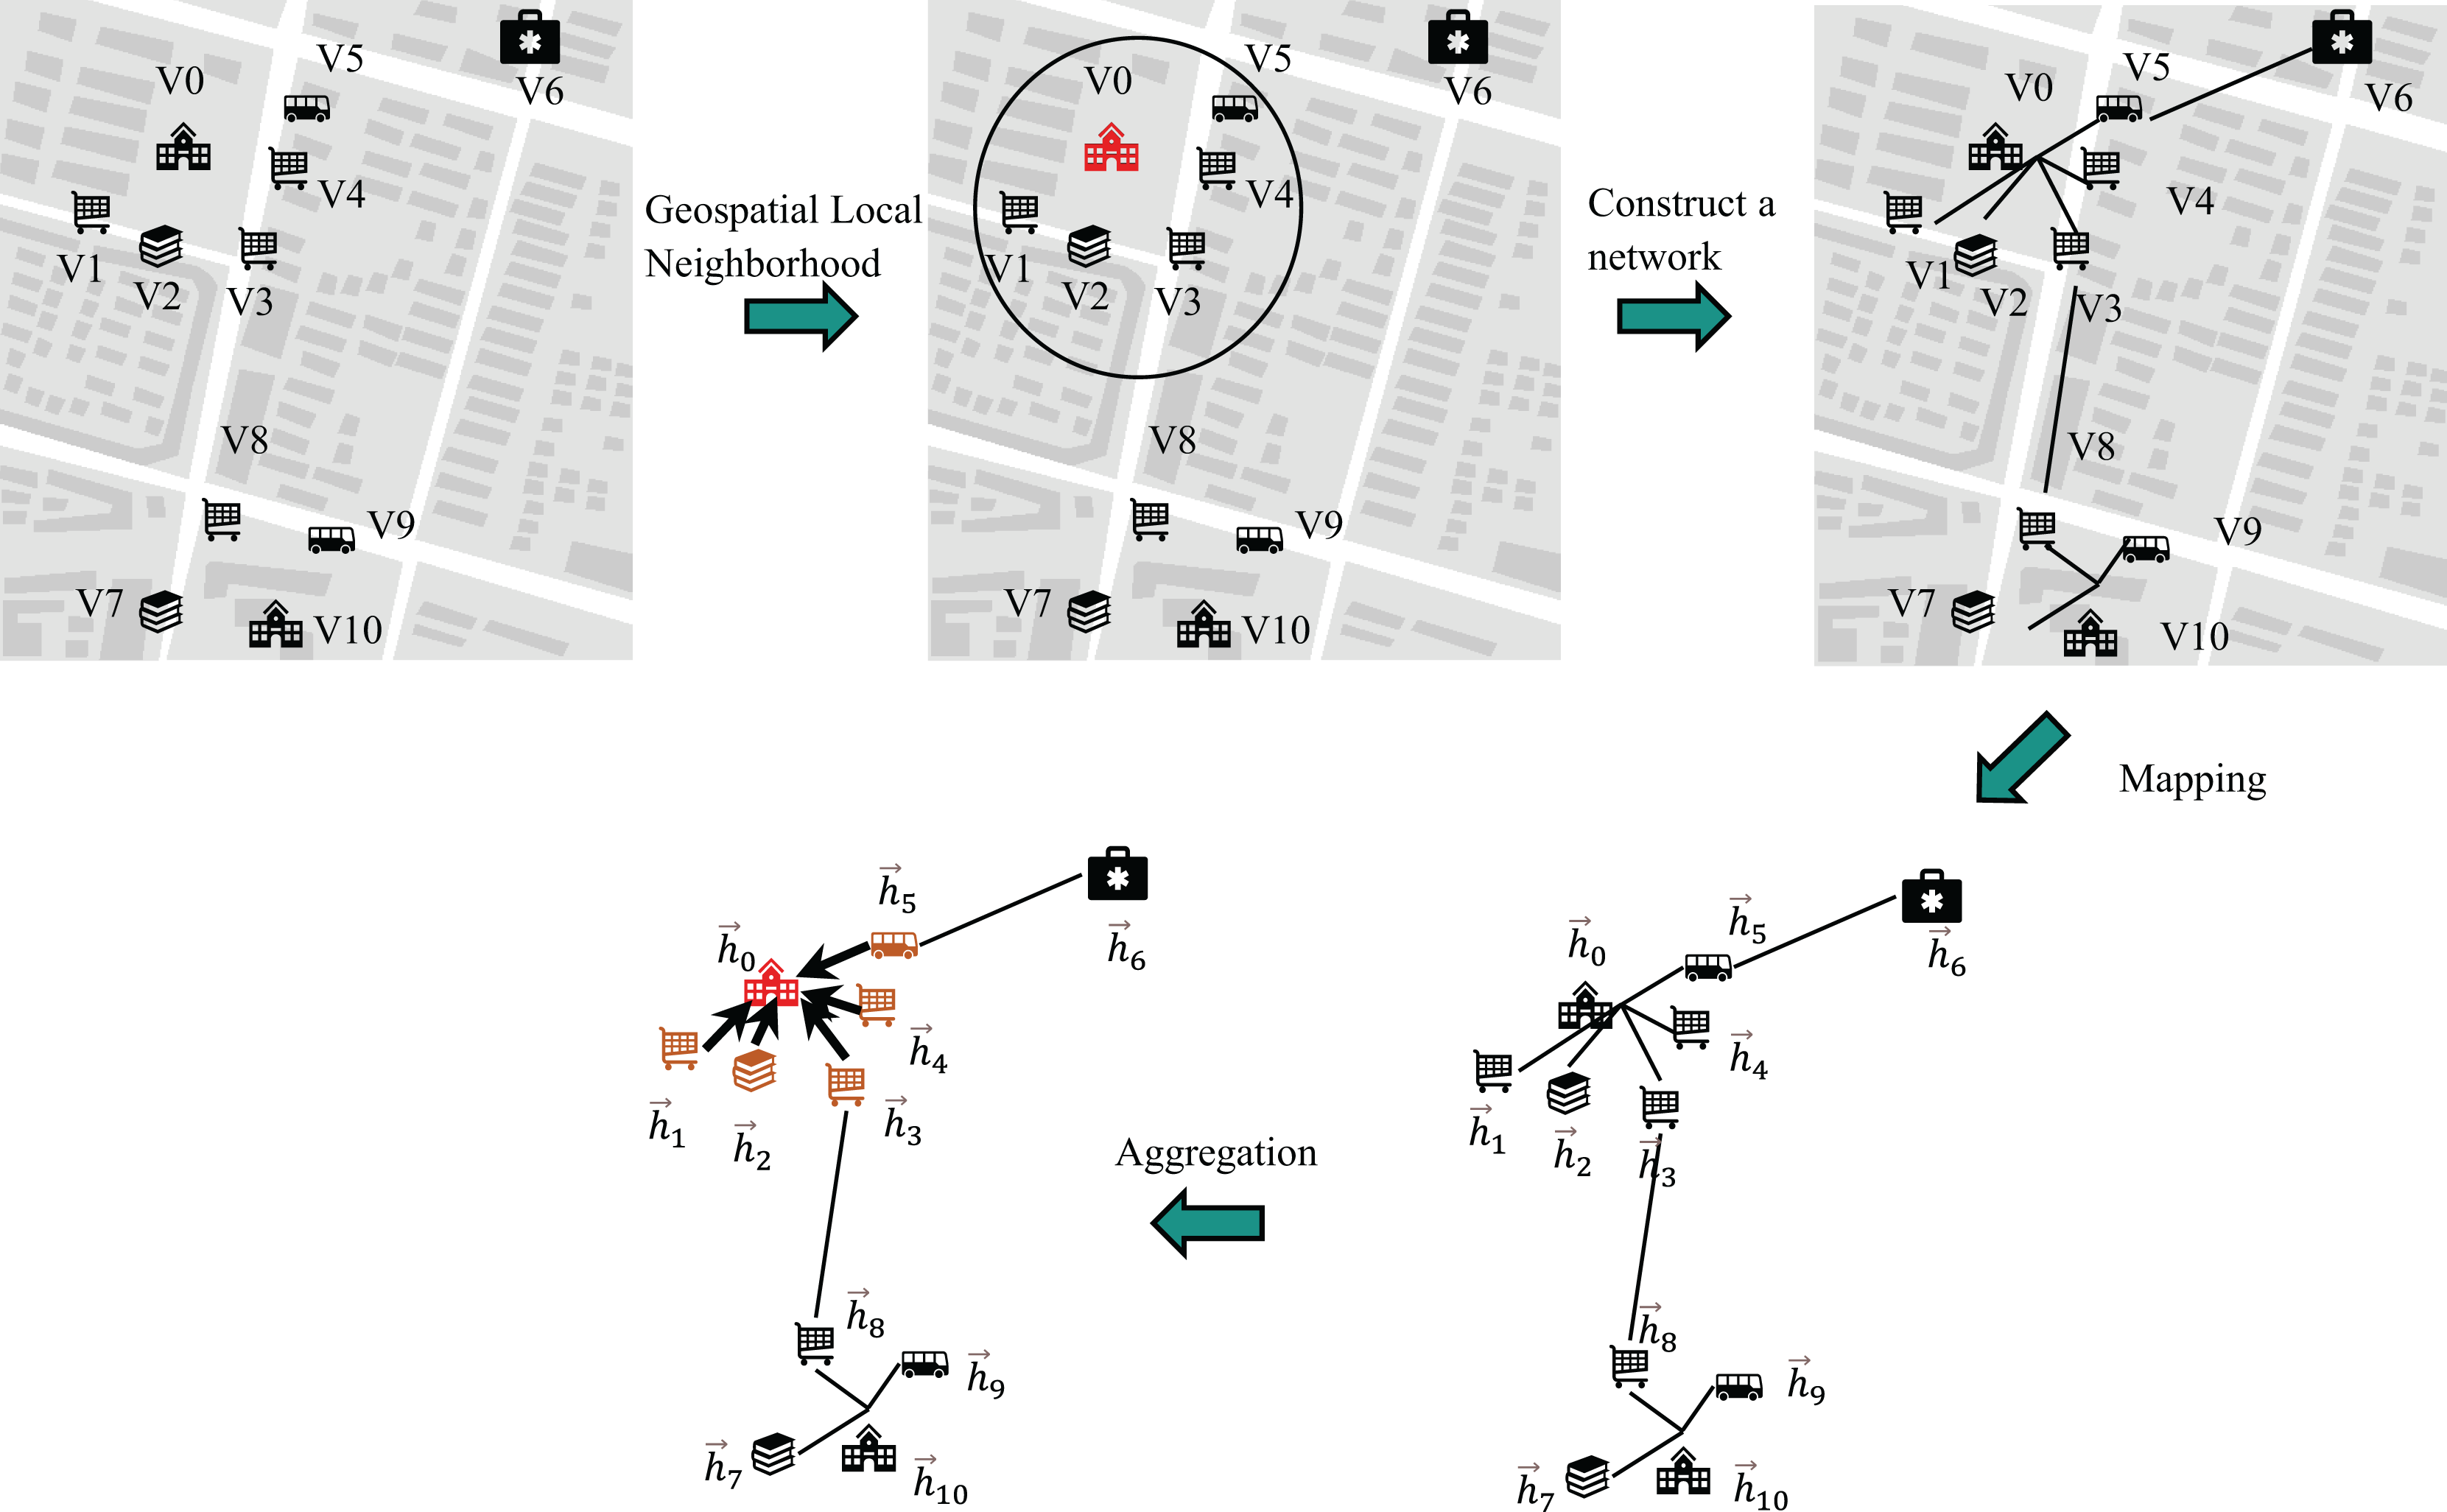
In this module, the GAT framework is employed to derive the geospatial local neighborhood feature vector representation. The aggregated features within its spatial domain are illustrated in Fig. 2.
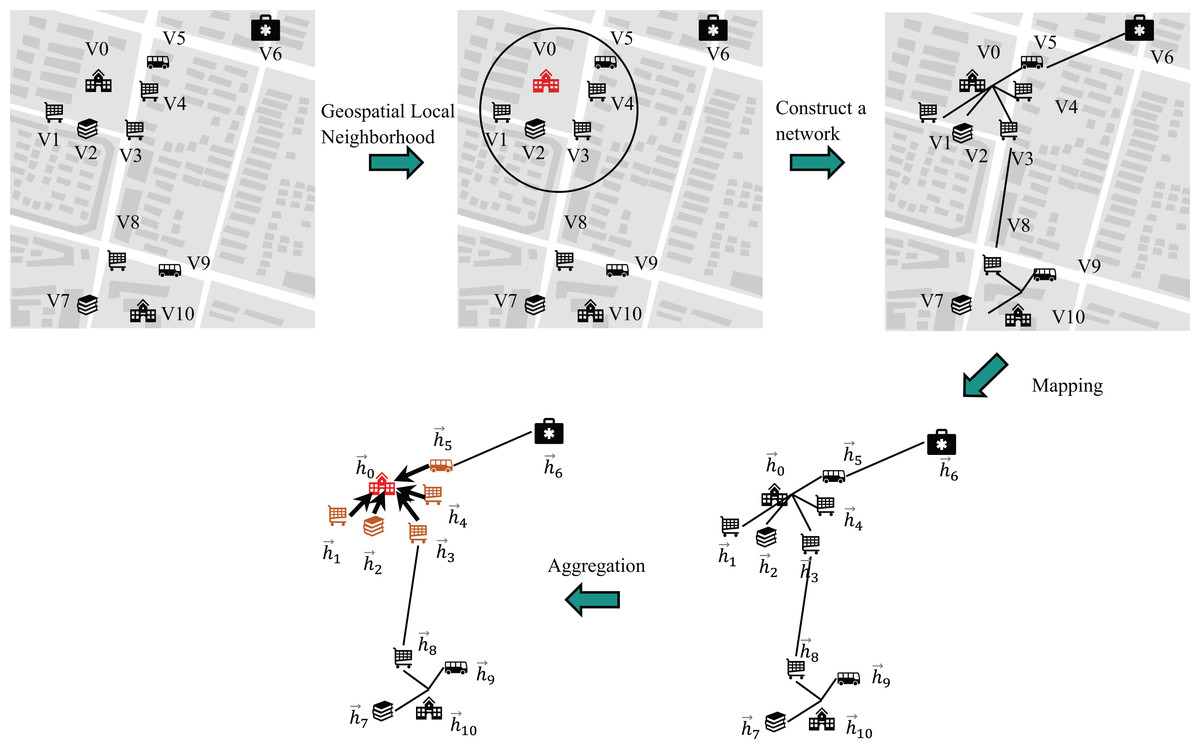
Figure 2: Messaging vs. aggregation.
In Fig. 2, the nodes V0, V1, V2, V3, V4 and V5 represent specific geographic entities, including a school, snack bars, a bookstore, and a bus station, respectively. Meanwhile, the nodes V6, V7, V8, V9 and V10 correspond to other geographic elements within the local spatial neighborhood.
The input to the GAT can be formally expressed as Eq. (1):
(1) In Eq. (1), denotes the number of nodes in the graph, which corresponds to the number of POIs, while represents the initial feature dimension of each node.
A multi-head graph attention layer implemented without self-loops (as visualized in Fig. 3) aggregates contextual features from each node’s neighborhood. This process transforms the initial input features into higher-order knowledge representations , designated as the complete geospatial local neighborhood features. This design intentionally omits self-loop operations, distinguishing it from conventional GAT implementations.
(2)
(3) In Eqs. (2) and (3), denotes the graph attention operation excluding self-loops, represents the complete geospatial local neighborhood feature for node .
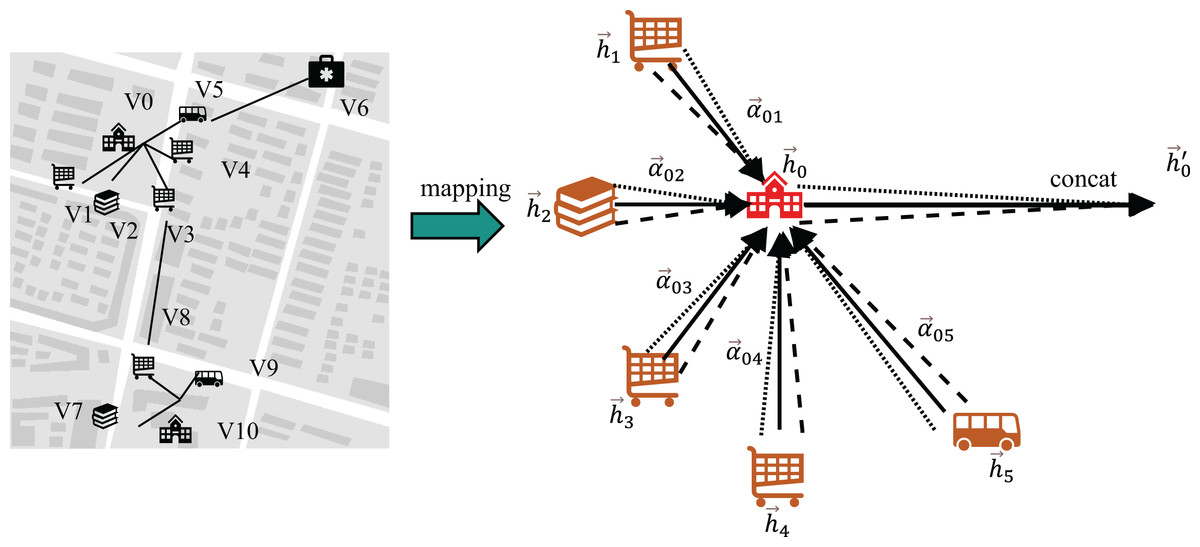
Figure 3: Multiple attention and no self-loop.
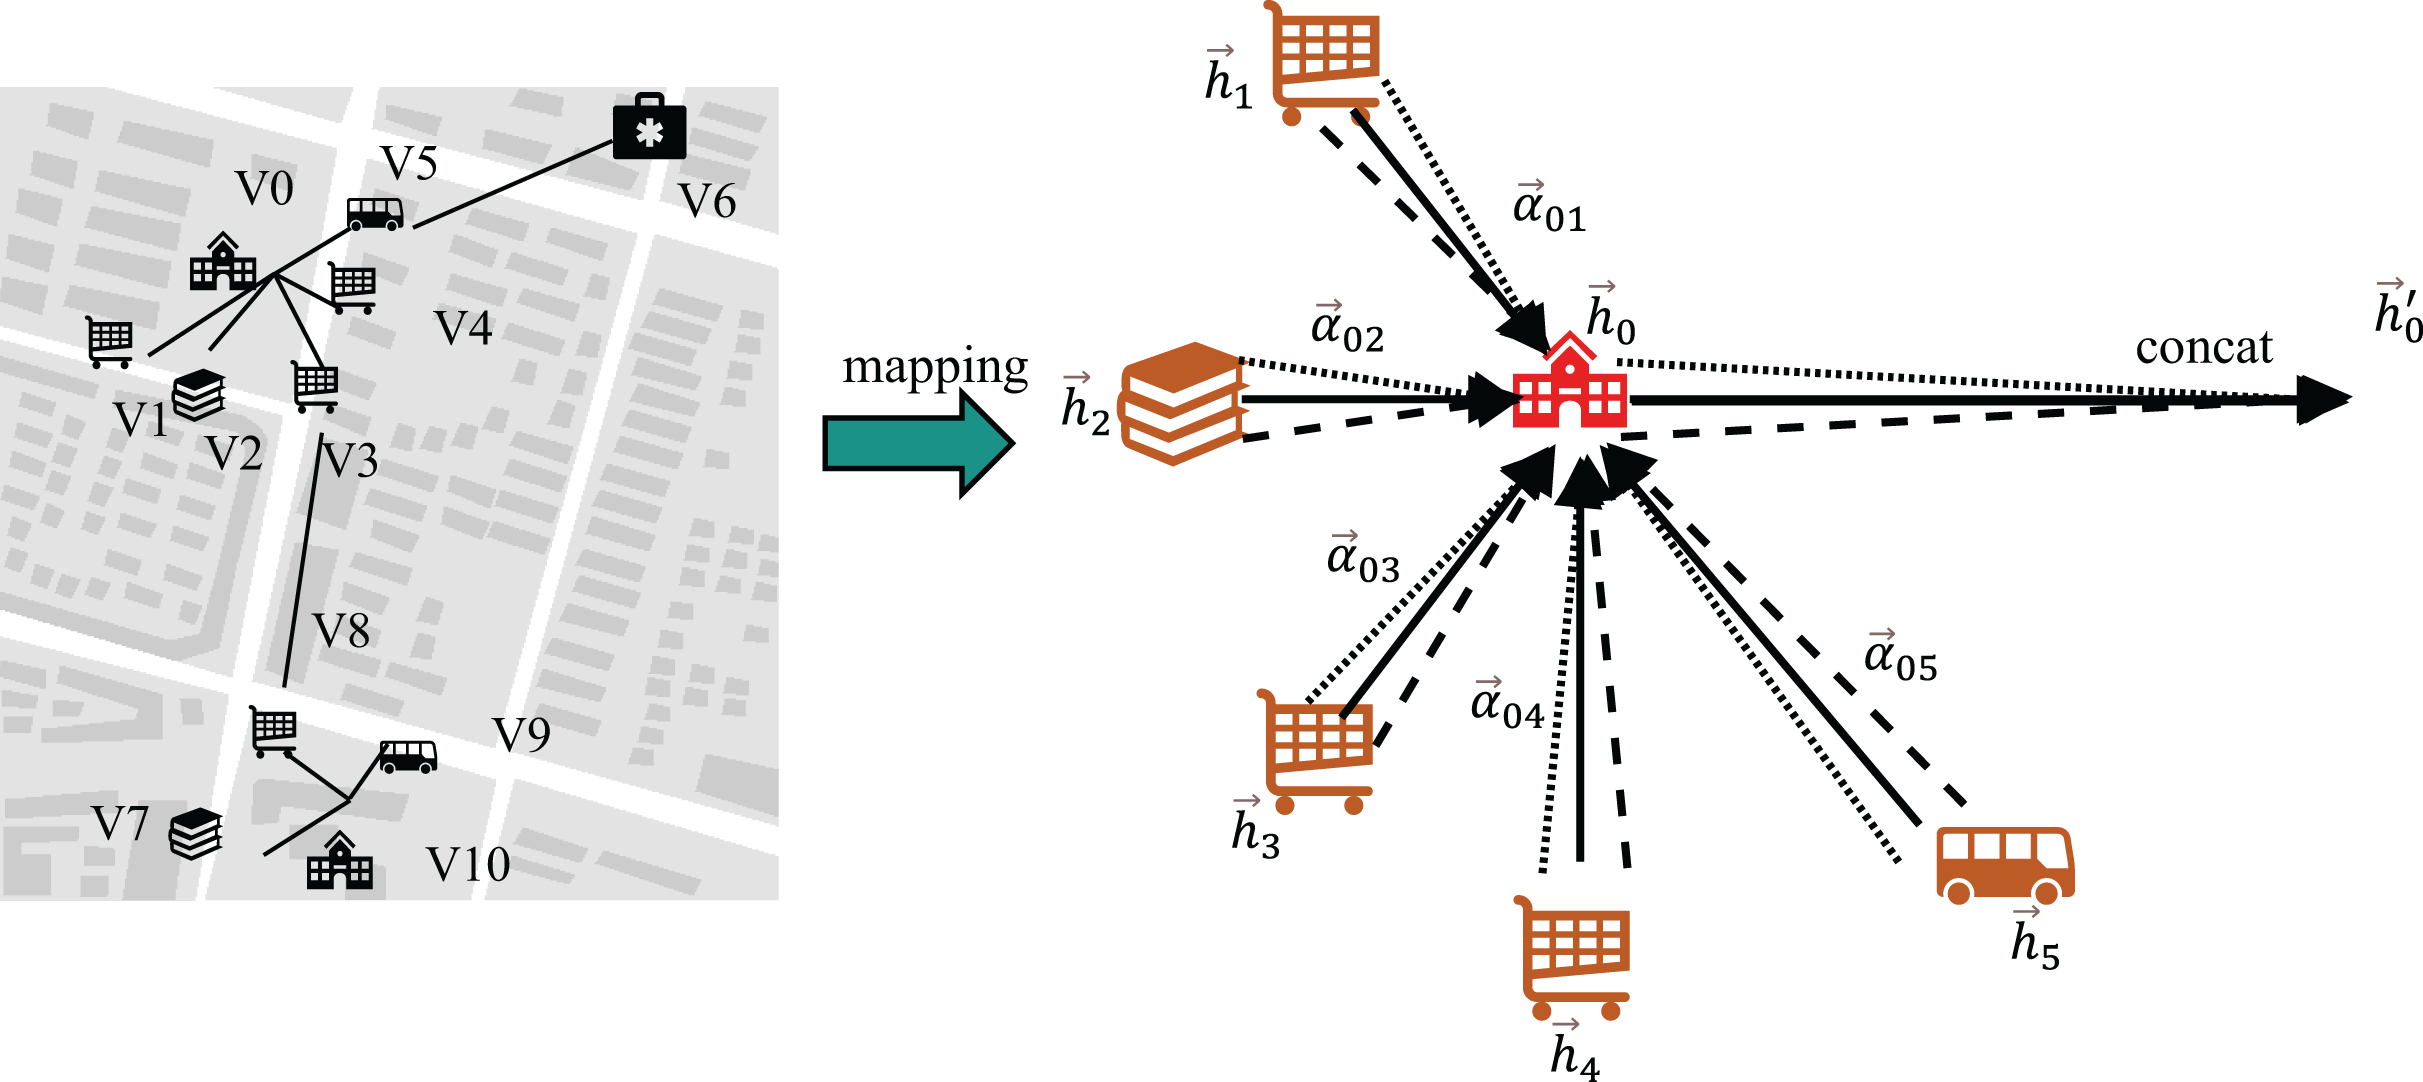
Finally, the aggregated local neighborhood features of all geospatial regions are compressed to the same dimension as the number of classifications through linear layers, and the probability distribution of geospatial local neighborhood features is obtained, that is, to compress the local neighborhood features of the geospatial space.
(4)
Data matching module
During the construction of textual and graph datasets for POIs, each POI entity is assigned a unique identifier to synchronize its textual descriptors and graph node representations. For a training batch with textual inputs where denotes the batch size, the module first extracts the unique POI identifiers within the current batch. These identifiers are then cross-referenced with the node indices in the geospatial embeddings and generated by the GeosN module. The aligned features are aggregated using a tensor stacking operation, yielding the batch-specific complete geospatial local neighborhood features and compressed counterparts , These aligned features serve as inputs to the T-G Fusion module and Enhanced Geospatial Local Neighborhood module, enabling joint optimization of cross-modal interactions as defined in Eqs. (5)–(7).
(5)
(6)
(7) Here, the operation selects the identifier of the target sample within the current mini-batch, while the operation retrieves the corresponding encoded tensors from the heterogeneous feature spaces and , ensuring cross-modal alignment.
T-G feature fusion module
In this research, the Transformer Encoder architecture is employed to process text embeddings and positional encoding through stacked self-attention layers and feedforward neural networks. A multi-head attention mechanism is utilized to integrate the extracted feature vectors for text classification tasks. However, this approach fails to account for spatial dependencies in POI classification, resulting in incomplete feature representation. To mitigate this limitation, we propose a hybrid framework that synergistically combines textual features with local geospatial neighborhood features. This integration significantly enhances the semantic characterization of POIs, with the detailed architectural design illustrated in Fig. 4.
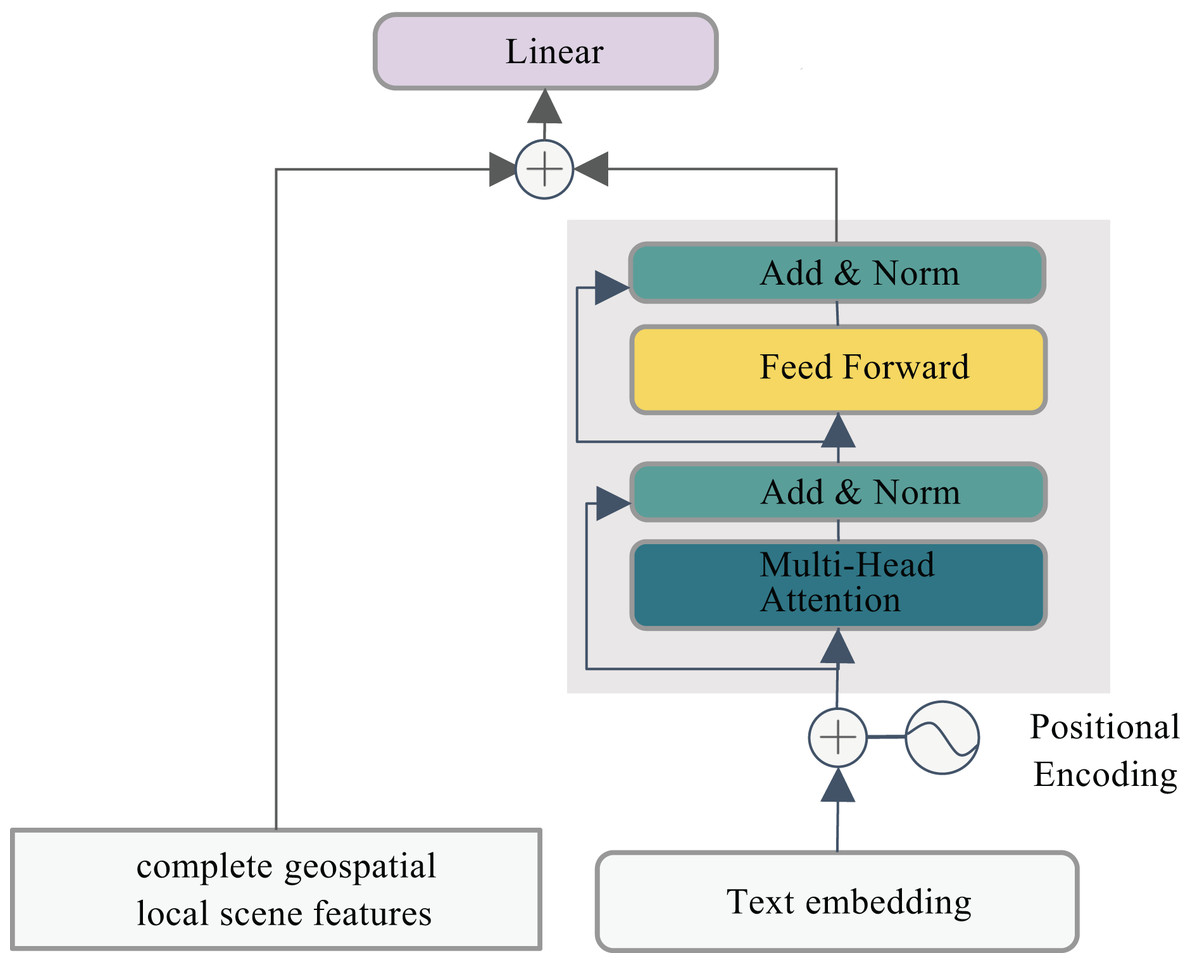
Figure 4: Synergistic text-geo integration.
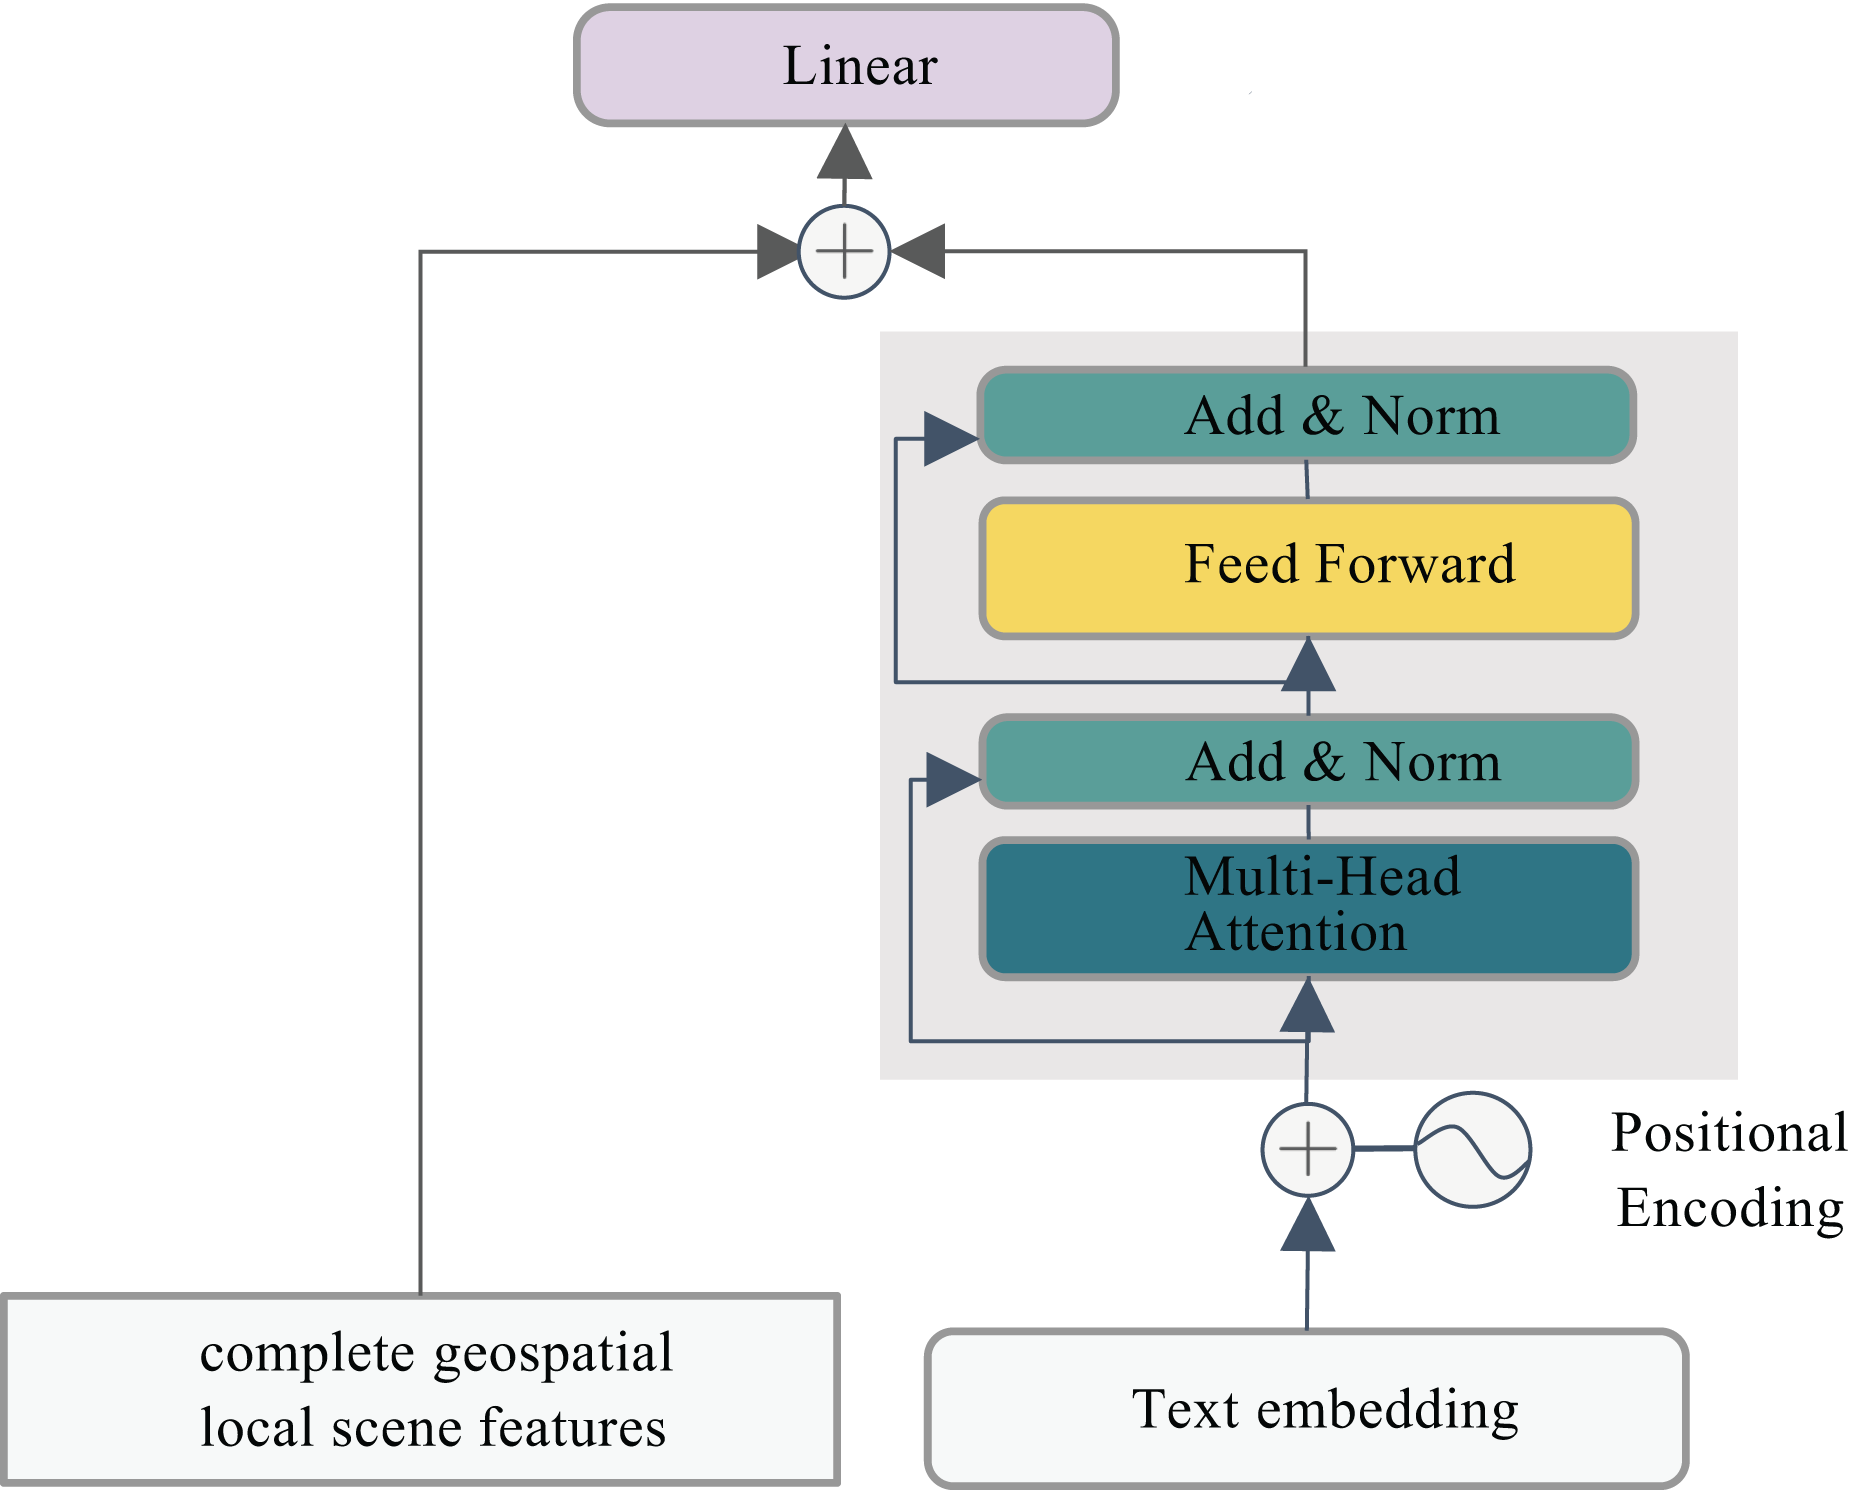
For the T-G Feature Fusion module, the textual input batch processed in each training iteration is mathematically formulated as:
(8) The local neighborhood features, aggregated through graph convolutional operations to encapsulate integrated geospatial neighborhood information, are mathematically formulated as:
(9) The resultant fused feature embeddings, generated through the Transformer Encoder’s multi-head attention mechanisms and subsequent multi-modal feature fusion layers, are formally expressed as:
(10) For a textual sample with sequence length , each token is encoded into a vector via word embedding and positional encoding, forming the tokenized matrix . Generate by passing through the Transformer Encoder.
(11) Cross-modal feature fusion:
(12) Here, denotes the geospatial local neighborhood feature of the -th POI. By concatenating the POI name text feature with its corresponding geospatial local neighborhood feature along the feature dimension, all modalities are projected into a shared latent space to ensure cross-modal compatibility and meaningful interaction, while preserving modality-specific characteristics and preventing critical unimodal information loss. A linear layer then compresses the concatenated features to match the dimensionality of the classification task, generating the fused text- neighborhood joint representation .
Enhanced geospatial local neighborhood module
To reinforce the geospatial local neighborhood, the outputs of the T-G Fusion module ( ) and the GeosN module ( ) are integrated via a decision fusion strategy. The fused features are then fed into a Softmax layer for final classification.
For a batch of size bs, the textual-geospatial features are aggregated:
(13) And the complete geospatial local neighborhood features are represented:
(14) The element-wise summation in the decision fusion strategy is adopted to fuse multimodal features, generating the input for the classification layer. This approach preserves the raw modality-specific information, and , while enabling effective cross-modal relational learning. The linear combination ensures compatibility between heterogeneous representations and retains critical unimodal characteristics, thereby enhancing the discriminative power of the fused feature .
(15) Here, the summation is performed element-wise to amplify geospatial neighborhood salience. The fused feature is normalized via a Softmax layer to generate the final POI classification probabilities:
(16) where and are the classification head’s weight matrix and bias term, respectively.
Experiment
Experimental setup
All experiments were conducted on a Windows 10 workstation equipped with an Intel Core i7-9750H CPU, 16 GB DDR4 RAM, and an NVIDIA GeForce RTX 2080 GPU (8 GB GDDR6 VRAM). The implementation utilizes Python 3.9.19 with PyTorch 2.2.2 (CUDA 12.1 acceleration) for deep learning operations.
Experimental parameters are categorized into two groups: primary model hyperparameters and model training parameters. The primary hyperparameter configurations are detailed in Tables 1 and 2, while the training parameters are specified in Table 3. To ensure reliability, each experiment was repeated 10 times using different random seeds. The mean and standard deviation of the results from these repeated experiments are reported.
| Parameter | Parameter size |
|---|---|
| GAT network layer | in_channels=300, out_channels=16, heads=4, add_self_loops=False |
| Linear layer | in_channels=64, out_channels=14 |
| Activate the function | relu |
| Parameter | Parameter size |
|---|---|
| Transformer network layer | QKV_size=32, heads=4, Number of layers =2, pad_size=32, dim_model=300, hidden=512, last_hidden=256 |
| Linear layer | in_channels=9664, out_channels=14 |
| Activate the function | relu |
| Parameter | Parameter size |
|---|---|
| Training rounds | 5 |
| Batch size | 2,048 |
| Optimizer | Adam |
| Learning rate | 0.001 |
Dataset
To comprehensively validate the feasibility and superiority of the proposed method, we constructed three heterogeneous POI datasets derived from distinct data sources and geographical regions:
Shanghai POI dataset: The dataset is derived from the Shanghai subset of the POI data for key Chinese cities, available on the Geographic Data Sharing Infrastructure, global resources data cloud (http://www.gis5g.com/). It encompasses selected administrative districts under Shanghai’s jurisdiction, covering a total of 14 distinct categories. The dataset comprises 218,022 POIs, with detailed category distributions provided in Table 4.
| Category | Number | Category | Number |
|---|---|---|---|
| Catering services | 26,749 | Science, education and cultural services | 18,349 |
| Scenic spots | 1,512 | Business residences | 18,889 |
| Public utilities | 2,113 | Daily life services | 15,530 |
| Corporate entities | 61,050 | Sports and leisure services | 10,145 |
| Retail services | 2,313 | Healthcare services | 7,405 |
| Transportation facilities | 25,623 | Government Institutions and social organizations | 13,616 |
| Financial and insurance services | 8,774 | Accommodation services | 5,954 |
AutoNavi Beijing POI dataset: The dataset originates from the Peking University Open Research Data Platform (opendata.pku.edu.cn), specifically comprising POI data for Beijing. It includes a total of 22 categories and 12,397 POIs, providing a comprehensive representation of geographic entities within the region.
OSM Guangdong POI dataset: The dataset is sourced from the OpenStreetMap website (www.openstreetmap.org), specifically focusing on Guangdong Province. After data selection and filtering, it comprises 93 categories and 29,265 POIs, offering a diverse and extensive representation of geographic entities within the region.
For the three datasets, the POI latitude and longitude information, category information, and name information are utilized for data processing.
Graph dataset construction: we uniformly use the WGS 84 (EPSG:4326) geographic coordinate system. Using the latitude and longitude information, each node is connected to its five nearest neighbors (k = 5) to form the graph dataset. In this representation, nodes correspond to POI points, node features represent POI categories, and edges denote the adjacency relationships between POIs.
Text dataset construction: POI names constitute the textual classification dataset, with each entry assigned a category label. Unique identifiers maintain cross-modal consistency between graph data and text records. Text preprocessing involves character-level tokenization that preserves original casing and punctuation, followed by vocabulary control limiting tokens to 10,000 maximum frequencies (infrequent characters mapped to <UNK>). Sequences are normalized to fixed lengths through <PAD> padding and truncation, with randomly initialized embeddings fine-tuned during training. This pipeline ensures identifier alignment while transforming raw names into standardized character sequences for joint text-graph modeling.
Dataset splitting: A shared mask partitions both graph and text datasets into training (50%), validation (30%), and test (20%) sets. To address class imbalance, we implement dynamic resampling via quartile analysis: class stratification is performed using Q1, median, and Q3 distribution thresholds; minority classes below Q1 are oversampled to match the median size, while majority classes exceeding Q3 are undersampled to the Q3 level. Comprehensive dataset statistics are detailed in Table 5.
| Shanghai POI dataset | AutoNavi Beijing POI dataset | OSM Guangdong POI dataset | |
|---|---|---|---|
| Dataset volume | 218,022 | 12,397 | 29,265 |
| Graph node population | 218,022 | 12,397 | 29,265 |
| Graph edge population | 1,090,110 | 61,985 | 146,325 |
| Textual Corpus count | 218,022 | 12,397 | 29,265 |
| Dataset volume | 218,022 | 12,397 | 29,265 |
| Training set | |||
| Original partition size | 109,011 | 6,198 | 14,632 |
| Enhanced size | 98,129 | 5,948 | 7,007 |
| Training set partition size | 65,406 | 3,719 | 8,780 |
| Validation set partition size | 43,605 | 2,480 | 5,853 |
Evaluation metrics
To assess model performance, we employ four standard metrics: precision (P), accuracy, recall (R), and the F1-score, defined as follows:
(17)
(18)
(19)
(20) where TP (True Positives) denotes correctly predicted positive samples, FN (False Negatives) positive samples misclassified as negative, FP (False Positives) negative samples misclassified as positive, and TN (True Negatives) correctly predicted negative samples.
The proposed GeoDFNet model employs a weighted cross-entropy loss function during training, utilizing class-specific weights to mitigate class imbalance effects. This loss function measures the discrepancy between predicted class probabilities and ground-truth labels, with heightened penalties for misclassifying rare classes. The mathematical formulation of this weighted loss is given in Eq. (21):
(21) where denotes the number of classes, represents the ground-truth indicator for class and is the predicted probability for class .
Result
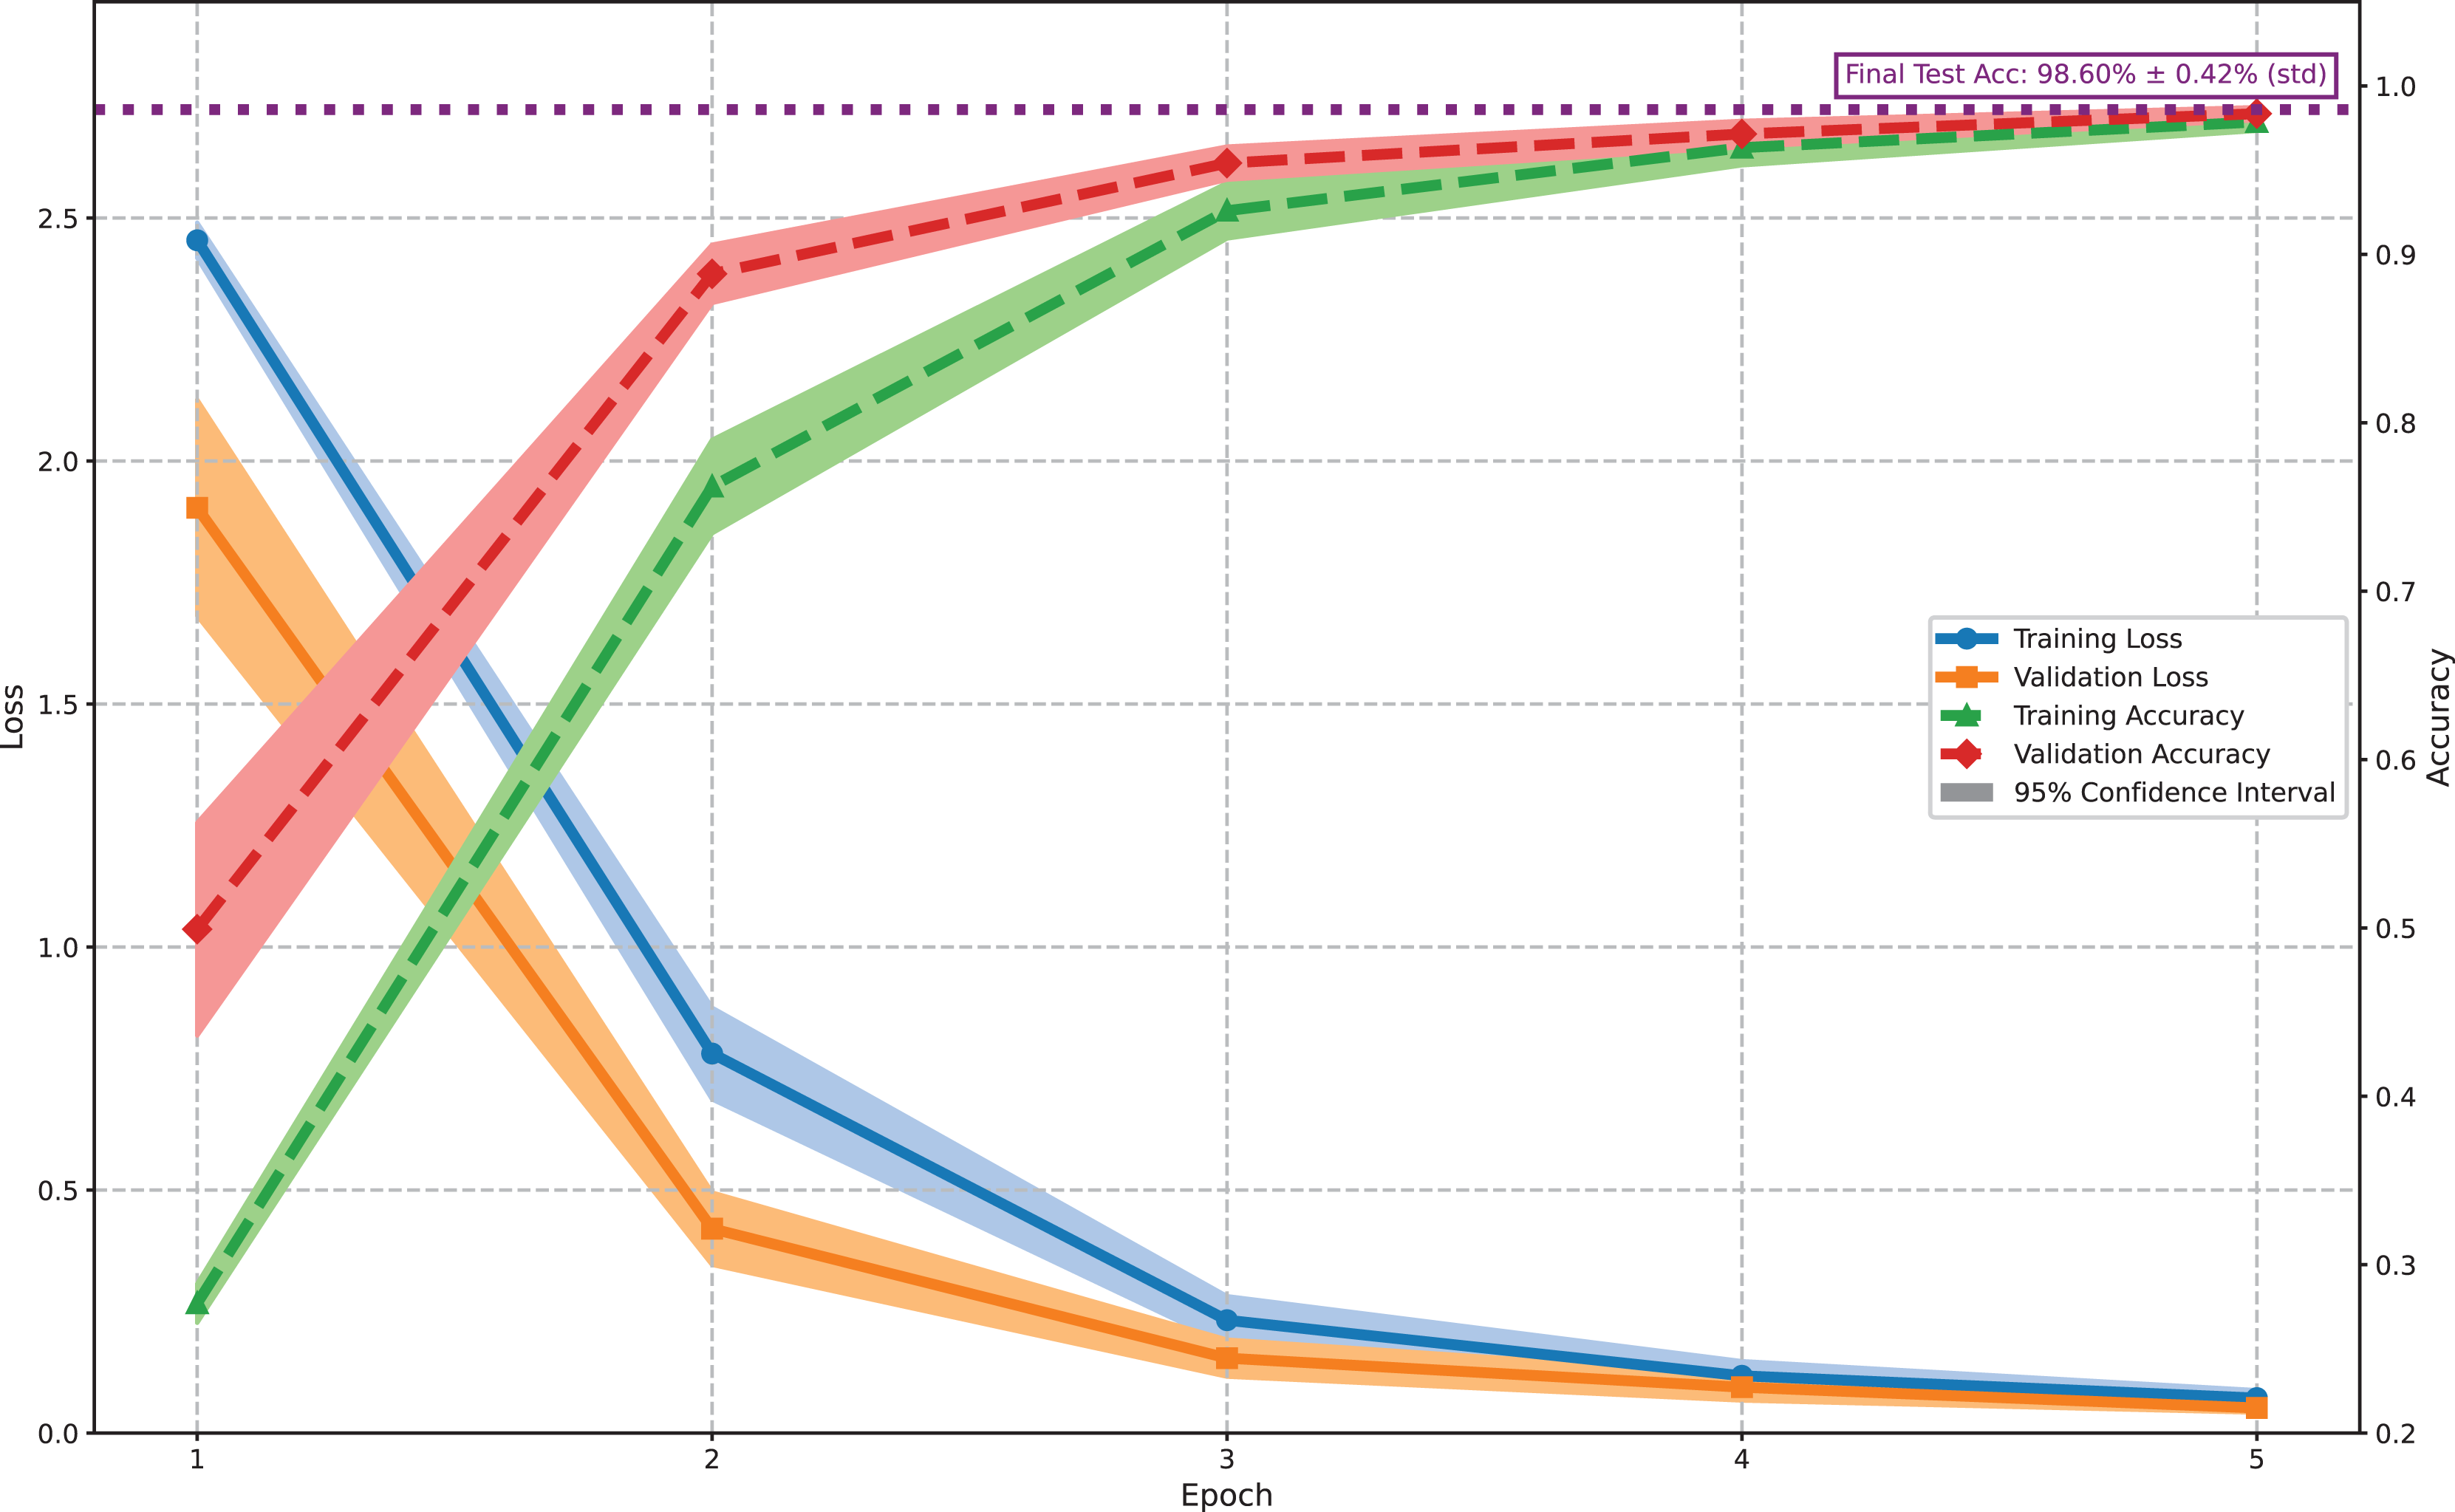
Figure 5 illustrates the training and validation performance of the proposed model on the Shanghai POI dataset. Solid lines represent mean values from 10 independent runs, with shaded areas indicating 95% confidence intervals. Notably, training loss exceeds validation loss and training accuracy remains lower than validation accuracy throughout the process—a phenomenon attributed to the data-level resampling and algorithm-level weighting strategies employed to enhance generalization. These techniques deliberately increase training difficulty, leading to more robust feature learning. The narrow confidence intervals (e.g., validation accuracy: 98.31% [97.98%, 98.64%]; test accuracy: 98.60% [98.32%, 98.88%]) indicate stable and consistent learning across runs. The model achieves a final validation accuracy of 98.31% and test accuracy of 98.60%, demonstrating its effectiveness and robustness for Shanghai POI classification.
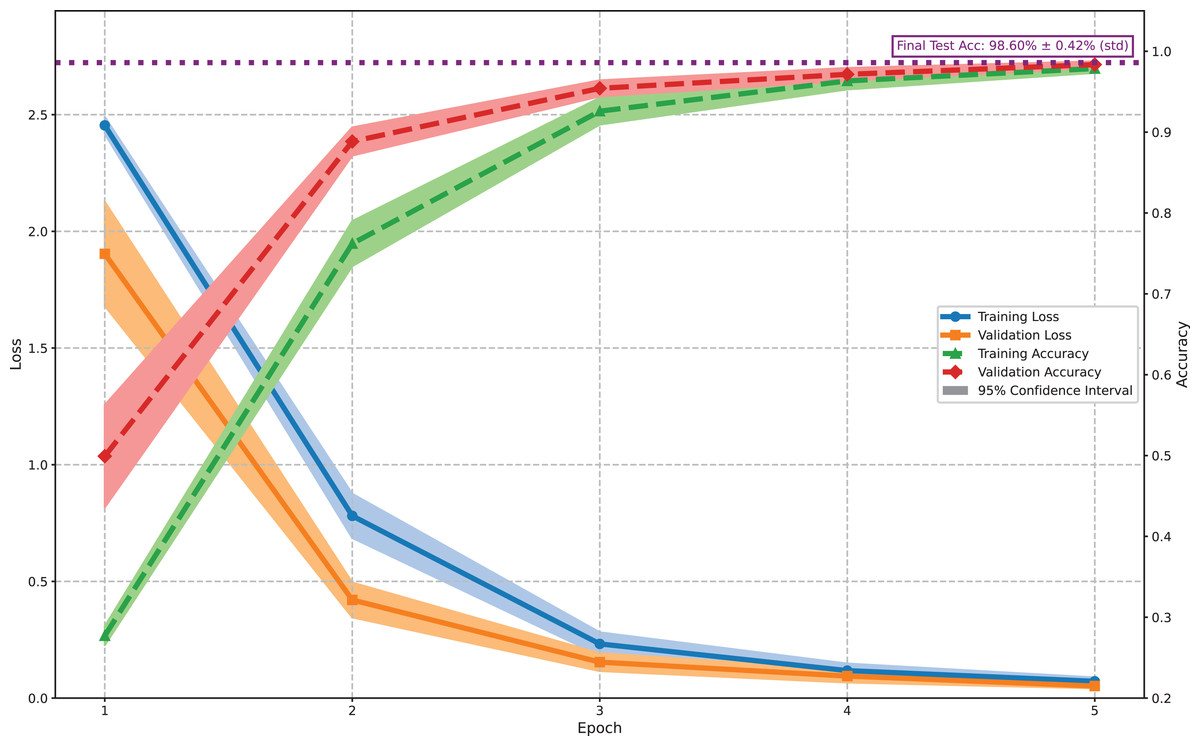
Figure 5: Model training and validation performance (mean of 10 runs ± 95% CI).
Experimental results demonstrate that the model achieved an overall classification accuracy of 98.60 ± 0.45% in POI categorization using multimodal data. Strong performance was observed across most categories, with macro-average precision, recall, and F1-scores of 97.14 ± 1.10%, 98.30 ± 0.66%, and 97.65 ± 0.85% respectively. As detailed in Table 6, the model excels in common POI types (e.g., Transportation Facilities: 99.63 ± 0.13% F1; Corporate Entities: 98.94 ± 0.80% F1), but exhibits higher variability in rare categories such as Scenic Spots (91.10 ± 9.08% F1). These results validate the model’s ability to leverage cross-modal features while highlighting opportunities to improve robustness for underrepresented classes.
| Tategory | P (%) | R (%) | F1 (%) | Sample of the test set |
|---|---|---|---|---|
| Catering services | 99.50 ± 0.39 | 99.34 ± 0.71 | 99.42 ± 0.53 | 5,200 |
| Scenic spots | 88.42 ± 14.37 | 95.03 ± 4.46 | 91.10 ± 9.08 | 310 |
| Public utilities | 94.58 ± 3.22 | 99.25 ± 0.36 | 96.83 ± 1.61 | 441 |
| Corporate entities | 99.63 ± 0.34 | 98.28 ± 1.50 | 98.94 ± 0.80 | 12,244 |
| Retail services | 97.59 ± 2.56 | 97.04 ± 2.32 | 97.30 ± 2.06 | 449 |
| Transportation facilities | 99.54 ± 0.24 | 99.71 ± 0.10 | 99.63 ± 0.13 | 5,135 |
| Financial and insurance services | 97.86 ± 1.39 | 98.89 ± 0.46 | 98.37 ± 0.86 | 1,798 |
| Science, education and cultural services | 98.24 ± 1.57 | 98.23 ± 1.45 | 98.23 ± 1.19 | 3,763 |
| Business residences | 99.43 ± 0.55 | 97.61 ± 1.34 | 98.51 ± 0.93 | 3,786 |
| Daily life services | 98.88 ± 1.02 | 99.03 ± 0.83 | 98.95 ± 0.80 | 3,086 |
| Sports and leisure services | 94.31 ± 6.80 | 97.33 ± 2.11 | 95.67 ± 3.73 | 2,108 |
| Healthcare services | 97.88 ± 2.68 | 98.44 ± 1.13 | 98.15 ± 1.83 | 1,471 |
| Government institutions and social organizations | 98.03 ± 1.51 | 99.47 ± 0.33 | 98.74 ± 0.82 | 2,604 |
| Accommodation services | 96.01 ± 2.25 | 98.52 ± 1.19 | 97.23 ± 1.21 | 1,210 |
| Accuracy | 98.60 ± 0.45 | 43,605 | ||
| Macro-average | 97.14 ± 1.10 | 98.30 ± 0.66 | 97.65 ± 0.85 | 43,605 |
Comparative experiments
We compare our GeoDFNet with the following baselines:
TextCNN (Kim, 2014): This model leverages a convolutional neural network (CNN) architecture, employing multiple convolutional layers with varying kernel sizes to capture key information at different granularities within the text. By extracting local features of varying lengths, TextCNN effectively encodes textual semantics for downstream tasks.
TextRNN (Liu, Qiu & Huang, 2016): This model is built on a recurrent neural network (RNN) architecture, which captures sequential information in text by incorporating recurrent connections. These connections enable the network to retain and process contextual information across sequences, making it effective for modeling dependencies in textual data.
TextDPCNN (Johnson & Zhang, 2017): This model is based on convolutional neural networks (CNNs) and enhances the extraction of long-range dependencies in text through the use of downsampling, isometric convolutions, and network deepening. These techniques enable the model to effectively capture both local and global textual patterns, improving its ability to process and understand complex textual structures.
TextRCNN (Lai et al., 2015): This model combines a recurrent convolutional neural network architecture with bidirectional RNNs and pooling layers to effectively capture contextual information and represent textual semantics with greater accuracy. By integrating recurrent and convolutional mechanisms, TextRCNN leverages both sequential and local features, enhancing its ability to model complex textual relationships.
TextRNN_ATTENTION (Zhou et al., 2016): This model employs a bidirectional LSTM network enhanced with an attention mechanism to identify and emphasize the most critical semantic information within sentences for relational classification tasks. By leveraging attention, the model dynamically focuses on the most relevant parts of the input, improving its ability to capture contextual dependencies and semantic nuances.
Transformer: This model utilizes a self-attention mechanism to process the entire input sequence simultaneously, enabling it to capture global dependencies and relationships within the data. By focusing on the interactions between all elements of the sequence, the Transformer effectively performs classification tasks while maintaining a high level of contextual understanding.
Comprehensive evaluation on the Shanghai POI dataset in Table 7 confirms GeoDFNet’s consistent superiority over six text-based baselines, with pronounced performance disparities in semantically ambiguous categories. While low-ambiguity categories like Public Utilities—where explicit lexical cues (e.g., ‘public toilet’) enable near-perfect baseline accuracy (TextCNN F1 = 99.68% ± 0.12)—high-ambiguity categories reveal critical gaps: GeoDFNet achieved 99.42% ± 0.53 in Catering Services (vs. best baseline 92.86% ± 0.21), 91.10% ± 8.59 in Scenic Spots (vs. 61.49% ± 0.92), and 97.20% ± 2.02 in Retail Services (vs. 63.78% ± 2.12). This divergence stems from GeoDFNet’s operationalization of geospatial similarity principles, where lexically unclassifiable names (e.g., ‘Centennial Dragon Robe’) are accurately categorized through spatial neighborhood integration.
| Model | Category | Metric (%) | |||
|---|---|---|---|---|---|
| P | R | Accuracy | |||
| TextCNN | Catering services | 94.37 ± 1.21 | 91.42 ± 1.00 | 92.86 ± 0.21 | 91.13 ± 0.17 |
| Scenic spots | 53.39 ± 1.42 | 72.55 ± 1.09 | 61.49 ± 0.92 | ||
| Public utilities | 99.37 ± 0.23 | 100.00 ± 0.00 | 99.68 ± 0.12 | ||
| Corporate entities | 97.54 ± 0.17 | 88.34 ± 0.40 | 92.71 ± 0.17 | ||
| Retail services | 54.62 ± 3.41 | 76.84 ± 0.87 | 63.78 ± 2.12 | ||
| Transportation facilities | 99.56 ± 0.08 | 99.68 ± 0.03 | 99.62 ± 0.04 | ||
| Financial and insurance services | 85.62 ± 0.64 | 97.39 ± 0.28 | 91.12 ± 0.26 | ||
| Science, education and cultural services | 89.39 ± 0.76 | 89.81 ± 0.70 | 89.59 ± 0.21 | ||
| Business residences | 88.13 ± 1.43 | 89.11 ± 1.01 | 88.60 ± 0.30 | ||
| Daily life services | 87.71 ± 1.31 | 89.25 ± 0.86 | 88.46 ± 0.36 | ||
| Sports and leisure services | 77.47 ± 2.55 | 88.38 ± 0.96 | 82.53 ± 1.05 | ||
| Healthcare services | 83.87 ± 2.21 | 90.60 ± 0.90 | 87.08 ± 0.81 | ||
| Government institutions and social organizations | 88.92 ± 0.78 | 94.56 ± 0.43 | 91.65 ± 0.24 | ||
| Accommodation services | 88.31 ± 1.19 | 92.74 ± 0.91 | 90.46 ± 0.36 | ||
| TextRNN | Catering services | 93.10 ± 5.09 | 79.18 ± 4.21 | 85.52 ± 3.93 | 83.54 ± 3.10 |
| Scenic spots | 31.47 ± 12.68 | 61.81 ± 3.28 | 40.14 ± 11.34 | ||
| Public utilities | 97.73 ± 2.49 | 98.87 ± 3.27 | 98.29 ± 2.73 | ||
| Corporate entities | 96.32 ± 0.91 | 82.29 ± 3.49 | 88.71 ± 1.94 | ||
| Retail services | 30.29 ± 8.18 | 67.08 ± 5.39 | 41.00 ± 6.95 | ||
| Transportation facilities | 99.34 ± 0.66 | 99.18 ± 0.28 | 99.26 ± 0.35 | ||
| Financial and insurance services | 79.77 ± 3.77 | 95.70 ± 1.17 | 86.95 ± 1.97 | ||
| Science, education and cultural services | 82.25 ± 5.40 | 81.47 ± 3.69 | 81.79 ± 3.93 | ||
| Business residences | 82.88 ± 5.25 | 77.86 ± 7.30 | 79.89 ± 3.01 | ||
| Daily life services | 75.22 ± 7.06 | 79.30 ± 5.69 | 77.01 ± 5.29 | ||
| Sports and leisure services | 61.88 ± 8.91 | 72.63 ± 10.04 | 66.46 ± 7.86 | ||
| Healthcare services | 65.80 ± 12.79 | 80.35 ± 10.32 | 72.21 ± 12.05 | ||
| Government institutions and social organizations | 82.63 ± 5.32 | 89.18 ± 2.70 | 85.65 ± 2.80 | ||
| Accommodation services | 70.19 ± 14.65 | 82.28 ± 18.70 | 75.23 ± 15.81 | ||
| TextDPCNN | Catering services | 93.79 ± 1.23 | 91.08 ± 1.15 | 92.40 ± 0.31 | 90.69 ± 0.23 |
| Scenic spots | 61.71 ± 8.89 | 64.90 ± 4.56 | 62.62 ± 2.80 | ||
| Public utilities | 99.75 ± 0.29 | 99.84 ± 0.19 | 99.80 ± 0.13 | ||
| Corporate entities | 96.28 ± 0.50 | 89.17 ± 0.66 | 92.58 ± 0.21 | ||
| Retail services | 58.24 ± 5.54 | 73.92 ± 1.56 | 64.96 ± 2.78 | ||
| Transportation facilities | 99.64 ± 0.10 | 99.65 ± 0.07 | 99.65 ± 0.04 | ||
| Financial and insurance services | 86.95 ± 2.75 | 95.39 ± 1.65 | 90.93 ± 0.90 | ||
| Science, education and cultural services | 89.36 ± 1.76 | 88.48 ± 1.87 | 88.88 ± 0.37 | ||
| Business residences | 87.84 ± 2.35 | 88.31 ± 1.70 | 88.03 ± 0.47 | ||
| Daily life services | 84.39 ± 4.69 | 89.03 ± 2.07 | 86.53 ± 1.68 | ||
| Sports and leisure services | 79.17 ± 3.47 | 85.90 ± 1.69 | 82.32 ± 1.30 | ||
| Healthcare services | 80.00 ± 4.86 | 90.08 ± 2.60 | 84.59 ± 1.71 | ||
| Government institutions and social organizations | 89.51 ± 1.58 | 93.30 ± 1.01 | 91.35 ± 0.47 | ||
| Accommodation services | 86.97 ± 3.17 | 91.06 ± 1.88 | 88.90 ± 1.08 | ||
| TextRCNN | Catering services | 94.23 ± 1.58 | 89.63 ± 1.48 | 91.85 ± 0.20 | 90.12 ± 0.16 |
| Scenic spots | 45.70 ± 4.45 | 69.16 ± 2.45 | 54.83 ± 2.51 | ||
| Public utilities | 99.12 ± 0.33 | 99.55 ± 0.21 | 99.34 ± 0.19 | ||
| Corporate entities | 96.65 ± 0.60 | 88.28 ± 0.77 | 92.27 ± 0.19 | ||
| Retail services | 51.87 ± 8.88 | 73.79 ± 2.72 | 60.35 ± 5.49 | ||
| Transportation facilities | 99.57 ± 0.07 | 99.67 ± 0.05 | 99.62 ± 0.04 | ||
| Financial and insurance services | 86.07 ± 1.68 | 95.87 ± 1.13 | 90.69 ± 0.51 | ||
| Science, education and cultural services | 88.64 ± 1.64 | 88.31 ± 1.27 | 88.45 ± 0.33 | ||
| Business residences | 87.29 ± 2.21 | 86.81 ± 2.06 | 87.00 ± 0.35 | ||
| Daily life services | 86.05 ± 2.85 | 88.02 ± 1.73 | 86.97 ± 0.68 | ||
| Sports and leisure services | 75.73 ± 2.82 | 86.91 ± 1.51 | 80.88 ± 1.15 | ||
| Healthcare services | 80.58 ± 2.39 | 89.72 ± 0.99 | 84.88 ± 0.99 | ||
| Government institutions and social organizations | 90.22 ± 1.82 | 92.69 ± 1.38 | 91.41 ± 0.48 | ||
| Accommodation services | 83.91 ± 4.36 | 91.79 ± 1.84 | 87.57 ± 1.63 | ||
| TextRNN_ ATTENTION |
Catering services | 94.95 ± 0.88 | 85.14 ± 2.05 | 89.76 ± 0.81 | 87.53 ± 0.70 |
| Scenic spots | 38.79 ± 3.31 | 66.39 ± 3.71 | 48.83 ± 2.48 | ||
| Public utilities | 98.36 ± 1.52 | 99.37 ± 0.35 | 98.85 ± 0.68 | ||
| Corporate entities | 97.14 ± 0.50 | 84.75 ± 0.83 | 90.52 ± 0.29 | ||
| Retail services | 36.09 ± 6.11 | 74.63 ± 1.58 | 48.33 ± 5.44 | ||
| Transportation facilities | 99.56 ± 0.14 | 99.18 ± 0.20 | 99.37 ± 0.09 | ||
| Financial and insurance services | 80.22 ± 2.30 | 96.42 ± 0.68 | 87.55 ± 1.16 | ||
| Science, education and cultural services | 85.60 ± 2.72 | 85.85 ± 2.21 | 85.67 ± 0.98 | ||
| Business Residences | 86.34 ± 2.36 | 82.79 ± 2.13 | 84.49 ± 0.97 | ||
| Daily life services | 83.72 ± 3.19 | 84.26 ± 2.91 | 83.91 ± 1.43 | ||
| Sports and leisure services | 69.15 ± 5.40 | 85.10 ± 2.53 | 76.14 ± 3.07 | ||
| Healthcare Services | 79.65 ± 3.10 | 86.99 ± 1.59 | 83.11 ± 1.44 | ||
| Government Institutions and social organizations | 84.75 ± 2.41 | 92.45 ± 0.66 | 88.42 ± 1.09 | ||
| Accommodation services | 76.64 ± 2.32 | 91.81 ± 1.08 | 83.52 ± 1.35 | ||
| Transformer | Catering services | 88.83 ± 3.95 | 88.46 ± 2.01 | 88.55 ± 1.10 | 86.64 ± 0.53 |
| Scenic spots | 44.60 ± 10.00 | 65.23 ± 5.92 | 51.88 ± 5.57 | ||
| Public utilities | 92.93 ± 4.65 | 98.84 ± 0.31 | 95.74 ± 2.46 | ||
| Corporate entities | 96.13 ± 0.92 | 83.76 ± 1.49 | 89.51 ± 0.55 | ||
| Retail services | 46.60 ± 11.11 | 70.11 ± 4.25 | 54.93 ± 6.67 | ||
| Transportation facilities | 98.87 ± 0.32 | 99.00 ± 0.33 | 98.93 ± 0.15 | ||
| Financial and insurance services | 79.03 ± 3.45 | 95.29 ± 1.43 | 86.34 ± 1.55 | ||
| Science, education and cultural services | 82.76 ± 2.12 | 85.26 ± 1.33 | 83.96 ± 0.72 | ||
| Business residences | 88.45 ± 3.38 | 80.26 ± 4.20 | 84.01 ± 1.13 | ||
| Daily life services | 81.32 ± 3.78 | 83.24 ± 2.69 | 82.16 ± 1.02 | ||
| Sports and leisure services | 73.59 ± 5.65 | 78.10 ± 4.34 | 75.48 ± 1.25 | ||
| Healthcare services | 76.55 ± 5.35 | 84.19 ± 2.87 | 80.00 ± 1.78 | ||
| Government institutions and social organizations | 82.25 ± 3.74 | 90.74 ± 2.07 | 86.20 ± 1.21 | ||
| Accommodation services | 74.99 ± 4.83 | 91.94 ± 1.28 | 82.49 ± 2.56 | ||
| GeoDFNet | Catering services | 99.50 ± 0.39 | 99.34 ± 0.71 | 99.42 ± 0.53 | 98.60 ± 0.45 |
| Scenic spots | 88.42 ± 14.37 | 95.03 ± 4.46 | 91.10 ± 9.08 | ||
| Public utilities | 94.58 ± 3.22 | 99.25 ± 0.36 | 96.83 ± 1.61 | ||
| Corporate entities | 99.63 ± 0.34 | 98.28 ± 1.50 | 98.94 ± 0.80 | ||
| Retail services | 97.59 ± 2.56 | 97.04 ± 2.32 | 97.30 ± 2.06 | ||
| Transportation facilities | 99.54 ± 0.24 | 99.71 ± 0.10 | 99.63 ± 0.13 | ||
| Financial and insurance services | 97.86 ± 1.39 | 98.89 ± 0.46 | 98.37 ± 0.86 | ||
| Science, education and cultural services | 98.24 ± 1.57 | 98.23 ± 1.45 | 98.23 ± 1.19 | ||
| Business residences | 99.43 ± 0.55 | 97.61 ± 1.34 | 98.51 ± 0.93 | ||
| Daily life services | 98.88 ± 1.02 | 99.03 ± 0.83 | 98.95 ± 0.80 | ||
| Sports and leisure services | 94.31 ± 6.80 | 97.33 ± 2.11 | 95.67 ± 3.73 | ||
| Healthcare services | 97.88 ± 2.68 | 98.44 ± 1.13 | 98.15 ± 1.83 | ||
| Government institutions and social organizations | 98.03 ± 1.51 | 99.47 ± 0.33 | 98.74 ± 0.82 | ||
| Accommodation services | 96.01 ± 2.25 | 98.52 ± 1.19 | 97.23 ± 1.21 | ||
Critically, GeoDFNet outperformed all baselines in every run (10/10). Wilcoxon signed-rank tests on the accuracy data in Table 8 confirmed statistically significant superiority (p = 0.001953 for all comparisons), with consistently higher terminal -scores and training accuracy. These results robustly validate the method’s efficacy in advancing POI classification.
| GeoDFnet | Transformer | TextDPCNN | TextRNN | TextRCNN | TextCNN | TextRNN_ATTENTION | |
|---|---|---|---|---|---|---|---|
| GeoDFnet | – | – | – | – | – | – | – |
| Transformer | 1.95E−03 | – | – | – | – | – | – |
| TextDPCNN | 1.95E−03 | 1.95E−03 | – | – | – | – | – |
| TextRNN | 1.95E−03 | 3.91E−03 | 1.95E−03 | – | – | – | – |
| TextRCNN | 1.95E−03 | 1.95E−03 | 3.91E−03 | 1.95E−03 | – | – | – |
| TextCNN | 1.95E−03 | 1.95E−03 | 1.95E−03 | 1.95E−03 | 1.95E−03 | – | – |
| TextRNN_ATTENTION | 1.95E−03 | 5.86E−03 | 1.95E−03 | 1.95E−03 | 1.95E−03 | 1.95E−03 | – |
Ablation experiments
To validate the contributions of the T-GFF and EGN modules in GeoDFNet, we conducted rigorous ablation studies by systematically isolating components. The T-GFF module performs multimodal feature-level fusion integrating textual and geospatial representations, while the EGN module executes decision-level fusion incorporating spatial neighborhood topology. Through sequential removal of these modules (Table 9), we precisely quantify their individual impacts on POI classification performance, establishing causal relationships between architectural components and model efficacy.
| Model | Metric (%) | |||
|---|---|---|---|---|
| P | R | Accuracy | ||
| GeoDFNet (w/o T-GFF) (decision-level fusion) |
96.44 ± 2.02 | 97.74 ± 1.27 | 97.04 ± 1.69 | 98.01 ± 1.08 |
| GeoDFNet (w/o EGN) (feature-level fusion) |
96.19 ± 2.50 | 97.63 ± 1.20 | 96.81 ± 1.93 | 98.12 ± 1.24 |
| GeoDFNet | 97.14 ± 1.10 | 98.30 ± 0.66 | 97.65 ± 0.85 | 98.60 ± 0.45 |
T-G feature fusion module evaluation
To isolate the contribution of the T-GFF module, we compared the full GeoDFNet model against a variant where the T-GFF module was removed (denoted as GeoDFNet w/o T-GFF, which retains only decision-level fusion). The results demonstrate that removing this feature-level fusion causes a significant performance drop: the -score decreases to 97.04% (±1.69) and accuracy falls to 98.01% (±1.08) from the full model’s 97.65% (±0.85) and 98.60% (±0.45) accuracy. This decline confirms the critical role of T-GFF in effectively integrating spatial-textual features at the feature level, which is essential for the model’s understanding of POI characteristics.
Enhanced geospatial local neighborhood module evaluation
To examine the contribution of the EGN module, we compared the full model against a variant where the EGN module was removed (denoted as GeoDFNet w/o EGN, which retains only feature-level fusion). Removing this decision-level fusion module also leads to a substantial performance degradation: the -score drops to 96.81% (±1.93) and accuracy reduces to 98.12% (±1.24). This result clearly demonstrates the effectiveness of the EGN module in leveraging spatial topology, which is vital for capturing the influence of spatial neighborhood features on category characteristics.
Synergistic effect
The significant performance decline observed in both ablated models—not only in overall accuracy and but also in P and R—underscores that the T-GFF and EGN modules are both indispensable components of GeoDFNet. The full model’s superior and more stable performance (as evidenced by lower standard deviations) arises from the synergistic effect of these complementary fusion strategies: T-GFF’s feature-level integration working in concert with EGN’s decision-level refinement.
k-value sensitivity analysis
We conducted a parametric sensitivity analysis to evaluate the impact of the number of neighboring points, k, used in constructing the geographic dataset. As summarized in the Table 10, model performance is sensitive to the choice of k, with optimal results achieved at k = 5 across all metrics: precision (97.14 ± 1.10%), recall (98.30 ± 0.66%), -score (97.65 ± 0.85%), and accuracy (98.60 ± 0.45%). This configuration also exhibited the smallest standard deviations, indicating superior stability and robustness.
| k-value | Metric (%) | |||
|---|---|---|---|---|
| P | R | Accuracy | ||
| 2 | 97.52 ± 1.36 | 98.50 ± 0.71 | 97.97 ± 1.05 | 98.69 ± 0.82 |
| 3 | 96.36 ± 1.79 | 97.80 ± 0.75 | 96.99 ± 1.33 | 98.19 ± 1.03 |
| 4 | 96.72 ± 2.04 | 97.80 ± 1.47 | 97.19 ± 1.80 | 98.21 ± 1.33 |
| 5 | 97.14 ± 1.10 | 98.30 ± 0.66 | 97.65 ± 0.85 | 98.60 ± 0.45 |
| 6 | 97.15 ± 2.31 | 98.37 ± 1.08 | 97.70 ± 1.75 | 98.45 ± 1.20 |
| 7 | 96.44 ± 1.83 | 97.80 ± 0.79 | 97.03 ± 1.35 | 98.06 ± 0.93 |
| 8 | 96.54 ± 1.76 | 97.89 ± 1.07 | 97.16 ± 1.44 | 98.33 ± 0.94 |
| 9 | 96.61 ± 1.55 | 97.95 ± 1.00 | 97.22 ± 1.28 | 98.38 ± 0.81 |
| 10 | 97.21 ± 1.12 | 98.08 ± 0.70 | 97.60 ± 0.90 | 98.40 ± 0.79 |
Performance improved as k increased from 2 to 5, suggesting that incorporating more spatial context enhances feature representation and contextual understanding. However, beyond k = 5, all metrics gradually declined, implying that excessively large neighborhoods may introduce noise or redundant information, thereby reducing model efficacy. These results highlight the critical role of selecting an appropriate spatial scale to balance contextual information and discriminative power.
Generalization experiments
To comprehensively evaluate the generalization capability of the GeoDFNet model and validate its applicability across different regions and datasets, a series of experiments were conducted to assess its adaptability and robustness in handling diverse semantic structures and regional characteristics. Additional POI public datasets, including the AutoNavi Beijing POI dataset and the OSM Guangdong POI dataset, were introduced to perform generalization performance experiments.
During model training, each dataset was partitioned into training, validation, and test sets at a ratio of 5:3:2 to ensure consistency in model training and evaluation. Given the varying sizes of the datasets, an appropriate number of training epochs was selected for each dataset, while other hyperparameters remained consistent with the experimental settings described earlier to ensure comparability of results. The model’s classification performance was evaluated using two key metrics: accuracy and F1-score.
The classification performance of each model on datasets from different regions and sources is summarized in Table 11. The results demonstrate that the proposed GeoDFNet model achieves strong performance across diverse datasets, highlighting its generalization ability and robustness. The reason why the AutoNavi Beijing POI dataset t results are higher than the OSM Guangdong POI Dataset results is that the OSM Guangdong POI dataset has relatively fewer samples and more labels.
| Model | AutoNavi Beijing POI dataset | OSM Guangdong POI dataset | ||||||
|---|---|---|---|---|---|---|---|---|
| (%) | (%) | (%) | Accuracy (%) | (%) | (%) | (%) | Accuracy (%) | |
| TextCNN | 78.25 ± 0.46 | 80.62 ± 0.47 | 78.91 ± 0.42 | 81.54 ± 0.36 | 50.75 ± 1.16 | 60.18 ± 0.68 | 52.99 ± 0.86 | 61.12 ± 0.72 |
| TextRNN | 46.92 ± 2.52 | 48.84 ± 3.28 | 45.19 ± 2.90 | 45.48 ± 2.86 | 31.86 ± 0.59 | 41.11 ± 0.95 | 33.03 ± 0.61 | 45.03 ± 1.22 |
| TextDPCNN | 72.62 ± 1.82 | 72.21 ± 0.83 | 71.09 ± 1.58 | 72.85 ± 2.25 | 40.83 ± 1.57 | 44.78 ± 1.26 | 38.69 ± 1.21 | 49.13 ± 1.78 |
| TextRCNN | 73.55 ± 1.27 | 75.69 ± 1.03 | 74.05 ± 1.04 | 76.31 ± 0.61 | 44.88 ± 1.01 | 54.64 ± 0.72 | 46.79 ± 0.70 | 56.39 ± 0.42 |
| TextRNN_ ATTENTION |
62.34 ± 2.62 | 63.89 ± 3.66 | 61.64 ± 3.27 | 63.36 ± 3.52 | 31.71 ± 2.68 | 40.86 ± 3.59 | 32.39 ± 2.82 | 42.83 ± 2.76 |
| Transformer | 70.69 ± 0.81 | 73.21 ± 0.68 | 71.17 ± 0.72 | 73.58 ± 0.75 | 37.30 ± 1.29 | 45.77 ± 2.01 | 37.97 ± 1.79 | 49.77 ± 2.10 |
| GeoDFNet | 93.47 ± 1.59 | 93.77 ± 1.15 | 92.99 ± 1.60 | 95.70 ± 2.25 | 69.22 ± 8.64 | 74.34 ± 6.54 | 69.71 ± 7.79 | 82.76 ± 6.41 |
Discussion
The proposed GeoDFNet effectively addresses POI semantic ambiguity through a novel dual-fusion architecture, achieving state-of-the-art performance with a test accuracy of 98.60 ± 0.45% and a macro F1-score of 97.65 ± 0.85% on the Shanghai POI dataset. The model demonstrates particular strength in resolving lexically ambiguous cases—exemplified by its accurate classification of “Centennial Dragon Robe” as a catering service rather than a clothing store or tea shop—where conventional text-based models exhibit significant limitations. This capability is realized through the operationalization of geographic similarity principles via two specialized modules: T-GFF and EGN. The T-GFF module enables robust multimodal feature-level fusion by integrating textual representations with geospatial neighborhood information, while the EGN module performs decision-level fusion through spatial neighborhood aggregation. Ablation studies confirm that both modules contribute critically and synergistically to overall performance, with removal of either component resulting in statistically significant performance degradation ( -score declining to 97.04 ± 1.69% without T-GFF and 96.81 ± 1.93% without EGN).
Nevertheless, the model’s performance remains constrained by several limitations. It exhibits sensitivity to class imbalance, as evidenced by higher performance variance for infrequent categories (e.g., Scenic Spots with an -score of 91.10 ± 9.08%). Moreover, performance depends on selecting an optimal spatial neighborhood scale (k = 5); expanding beyond this scale leads to degradation. Additionally, the model does not fully leverage other available multimodal data, such as imagery and temporal dynamics.
These limitations delineate clear pathways for future improvement. Incorporating advanced techniques such as contrastive learning could enhance representation learning for rare categories, while reinforcement learning might dynamically optimize sampling strategies or reward correct classification of infrequent classes. Furthermore, developing adaptive mechanisms to automatically determine suitable spatial context scales across diverse urban environments would improve robustness and generalizability. Ultimately, extending the model into a fully multimodal framework—integrating visual, textual, and temporal cues—could enable a more comprehensive understanding of POI characteristics and support finer-grained urban semantic analysis.
Conclusions
To address the challenge of insufficient utilization of POI features in POI classification tasks, proposes a dual fusion network model that integrates geospatial local neighborhood features to enhance the accuracy of POI classification. The main conclusions are as follows:
-
(1)
The geographic similarity theory can be effectively represented using graph neural networks, enabling the formation of local neighborhood features and the construction of a geospatial local neighborhood knowledge graph. The proposed model successfully captures and interprets relevant geospatial local neighborhood knowledge, significantly improving classification performance through the use of this knowledge graph.
-
(2)
By incorporating a dual fusion operation of geospatial local neighborhood features into the Transformer network, the model provides relevant geospatial neighborhood for each POI name. This approach facilitates the comprehensive utilization and learning of POI feature information, enhancing the model’s ability to uncover intrinsic characteristics within POI data.
-
(3)
Extensive experiments on multiple real-world public datasets demonstrate that the GeoDFNet model achieves state-of-the-art performance in both classification accuracy and -score across POI datasets from diverse regions and structures. The model exhibits high learning efficiency and strong generalization capabilities, validating its effectiveness and robustness.
Given that the dataset employed in this study originates from real-world observations and utilizes coarse-grained categorical features, significant class imbalance emerges when analyzing fine-grained subcategories, thereby limiting the potential for granular urban studies. Furthermore, the POI dataset contains multimodal information including user reviews, visual documentation, and temporal check-in patterns that remain underutilized in our current framework. To address these limitations, future research directions will focus on three key aspects:
-
(1)
developing integrated datasets with balanced hierarchical categorization.
-
(2)
implementing multi-modal fusion architectures that synthesize textual, visual, and temporal signals.
-
(3)
optimizing computational frameworks through architectural innovations and parallelization strategies.
These enhancements will enable more sophisticated analysis of POI characteristics across multiple dimensions, supporting finer-grained urban computing applications while maintaining computational efficiency in large-scale spatial analyses.