
Disease diagnosis in banana leaves: a review on AI powered techniques
- Published
- Accepted
- Received
- Academic Editor
- Hazrat Ali
- Subject Areas
- Algorithms and Analysis of Algorithms, Artificial Intelligence, Computer Vision, Data Mining and Machine Learning, Neural Networks
- Keywords
- Disease classification, Machine learning, Deep learning, Image processing, Transfer learning, Banana leaf disease
- Copyright
- © 2025 R and A
- Licence
- This is an open access article distributed under the terms of the Creative Commons Attribution License, which permits unrestricted use, distribution, reproduction and adaptation in any medium and for any purpose provided that it is properly attributed. For attribution, the original author(s), title, publication source (PeerJ Computer Science) and either DOI or URL of the article must be cited.
- Cite this article
- 2025. Disease diagnosis in banana leaves: a review on AI powered techniques. PeerJ Computer Science 11:e3310 https://doi.org/10.7717/peerj-cs.3310
Abstract
Banana leaf diseases pose a significant global threat to agricultural productivity and economic stability, substantially reducing the quality and quantity of yield. Given the critical role of banana leaves in the overall growth and development of banana plants, their susceptibility to a wide range of diseases represents a pressing concern. This review systematically explores recent advancements in diagnosing and classifying banana leaf diseases through Artificial Intelligence (AI)-based techniques. Key methodologies reviewed include image preprocessing, machine learning, deep learning, and transfer learning. Particular emphasis is placed on lightweight deep learning architectures, which offer the advantages of high diagnostic accuracy, rapid processing, and minimal computational requirements, making them suitable for deployment in resource-constrained environments. The presence of numerous banana cultivars, each exhibiting subtle variations in leaf morphology and pigmentation, further complicates the detection process, underscoring the need for adaptable and robust AI models. The review also highlights data acquisition, preprocessing strategies, and dataset weaknesses, along with evaluation metrics used to assess model performance. Finally, it identifies existing challenges and research gaps in current approaches with the brief case study by synthesizing these insights. The review provides a comprehensive understanding of AI-powered solutions for the effective detection and classification of banana leaf diseases and their potential practical applications in precision agriculture.
Introduction
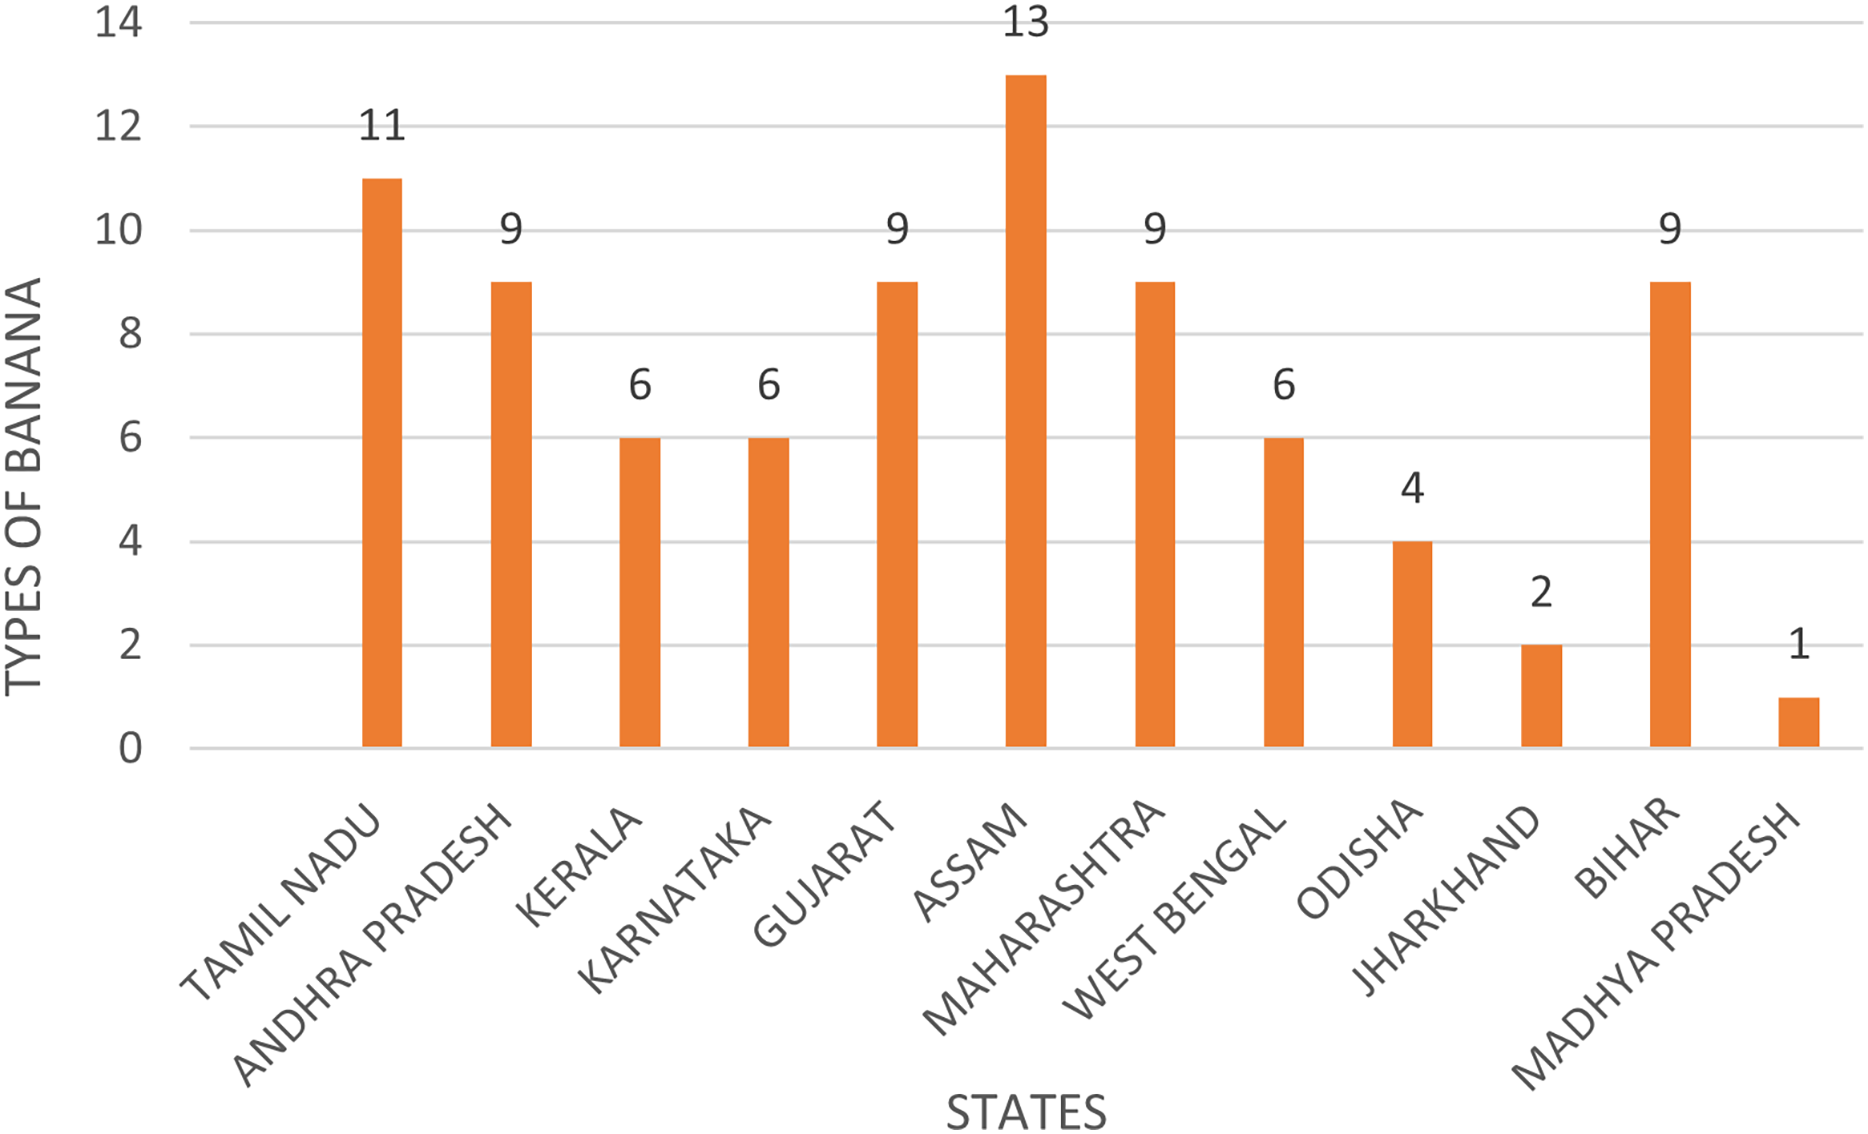
Banana, also called Musa paradisiaca (family Musaceae) (Satyagopal et al., 2014), is the second most cultivated crop in India. It has high export value and is in enormous demand due to its availability throughout the year, affordability, variety, flavor, nutritional value, and health benefits (National Horticulture Board 2015). Banana leaves have various applications, as they are large in size, flexible in nature, waterproof, and decorative. These materials are utilized for various purposes (Nace, 2019) including cooking, wrapping, and serving delicious dishes across diverse cuisines found in tropical and subtropical regions. Not only do they enhance the presentation of food, but they also boast remarkable antibacterial properties, ensuring both safety and freshness in every meal (Prevention Web, 2019). The leaves of bananas vary in size, from 70 cm wide to more than 91 cm in width and from 170 to 261 cm in length. Banana plants can produce approximately 40 leaves in their growing cycle (Docken, 2013). The surface of the leaf may vary, giving different amounts of wax, and being glossy or matte in texture. Both symmetrical and asymmetrical leaf bases and their attachments to the petiole are present. Some banana varieties have a midrib that may be visible red-purple or pink-purple, while others have a green or yellow midrib. The banana leaves have a severely wrinkled, mildly striped, or unridged surface. The world’s top exporters are Ecuador, Colombia, Costa Rica, and the Philippines, while the top importers are the United States, Belgium, Germany, and the United Kingdom (National Horticulture Board 2015). India is estimated to have the largest area under banana cultivation in the world, according to estimates from the Food and Agriculture Organization of the United Nations (FAO). India is the leading exporter, with around 29,558 tons being exported in 2022, worth $12.6 million (Mazumder et al., 2024). Vietnam and Thailand are also the other major exporters. The United Arab Emirates, Qatar, and Saudi Arabia are the major importers of banana leaves. The Harmonized System (HS) Code that is generally used for banana leaves is 07099990. Figure 1 illustrates the varieties of banana plants cultivated throughout India. India accounts for 11 percent of the total global area under bananas. India is at the top in the world production of bananas, with a contribution of around 23% to the world pool of banana production. The majority of banana leaf illnesses are detected manually, usually by farmers who use their wealth of knowledge to assess the condition (Rajalakshmi et al., 2025). Although this is effective, it comes with several shortcomings, especially when it comes to large banana plantations.
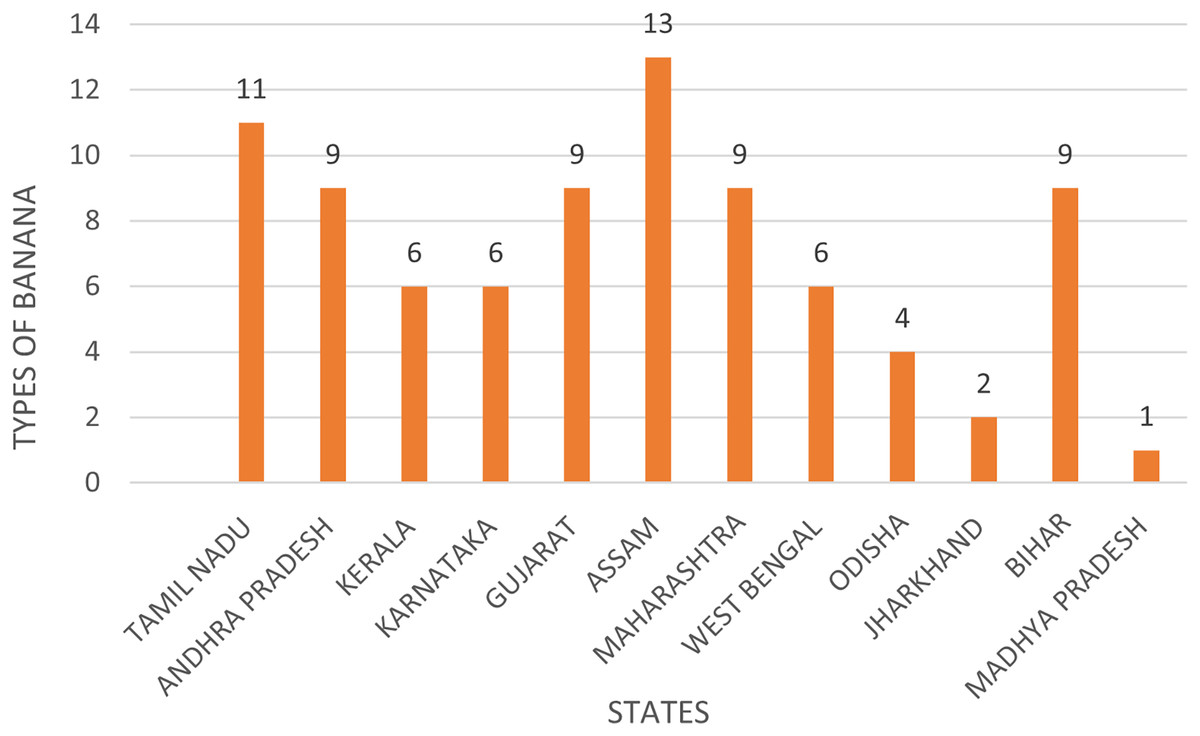
Figure 1: Banana varieties grown in India.
Tracking and monitoring a disease over large banana forests is extremely time-consuming to the point of being impractical. Consequently, the disease goes artificially unnoticed during the critical part of its development, resulting in rampant, unchecked infections. Instead, a substantial area of banana leaves is being afflicted, and by that time, there is very little that can be done to save the yield. This exhibits the requirement for additional effective and reliable measures in the automated classification and detection of overt diseases. Table 1 provides information on various banana diseases, including their symptoms and the regions they affect. Managing the disease increases production costs, reduces global market competition, leads to economic losses from lower crop prices, and requires labour-intensive management practices.
| S. No | Disease name | Image | Symptoms | Region |
|---|---|---|---|---|
| 1 | Panama wilt (Indonesia Trade Data, 2025) | 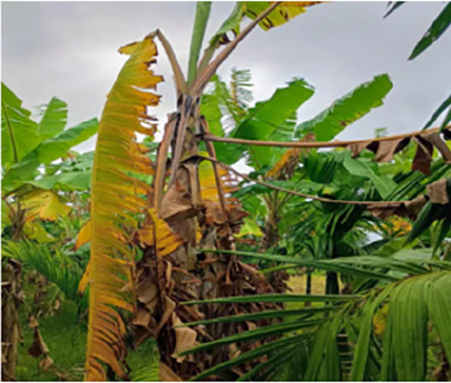 |
Yellowing of lower leaves, including petioles and leaf blades, is one of the first signs | Southeast Asia, Australia, Middle East and South Asia, China, Taiwan |
| 2 | Yellow sigatoka (Satyagopal et al., 2014) | 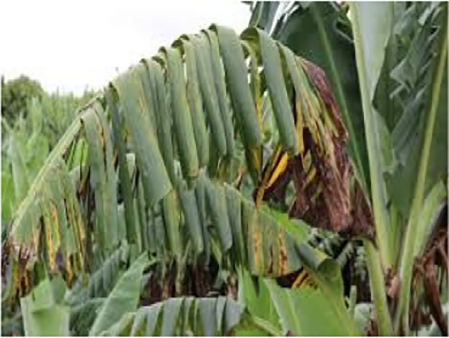 |
Pale yellow streaks that merge into dark spots with yellow halos, leading to defoliation | Latin America & the Caribbean, Africa, Asia, Australia |
| 3 | Black sigatoka (Marín et al., 2003) | 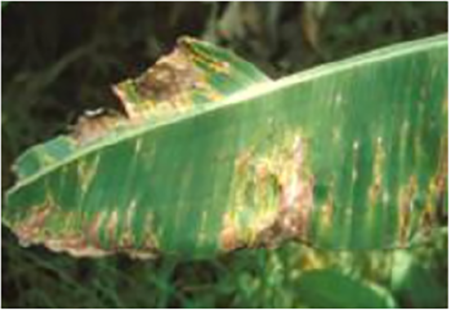 |
Black spots and streaks on banana leaves | Asia, Africa, the Pacific, and the Americas |
| 4 | Anthracnose (TNAU, 2015) | 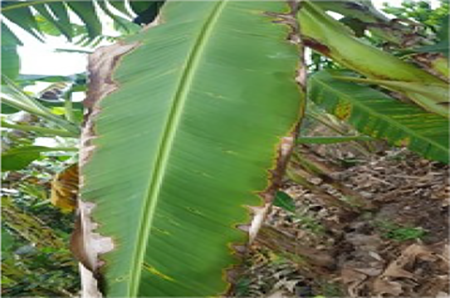 |
Large brown areas covered in a red fungal growth | Asia, Africa, South America, Central America, Oceania |
| 5 | Moko disease/bacterial wilt (Boudazin et al., 2004) | 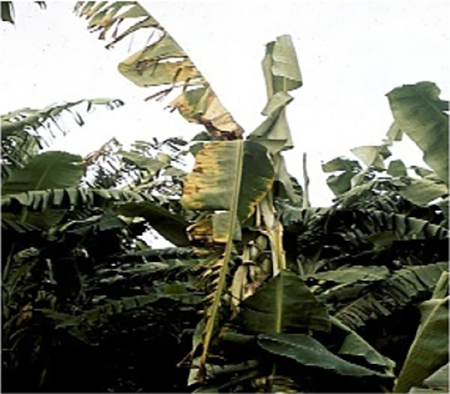 |
Yellowish discoloration of the inner leaf. The suckers’ delicate leaves become necrotic and yellow | Americas Southeast Asia |
| 6 | Bunchy top virus (National Horticulture Board, 2015) | 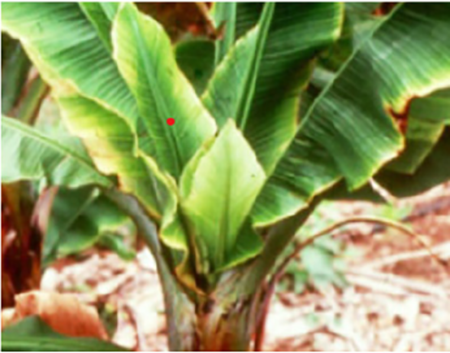 |
Produce thin, chlorotic leaves with mosaic-like characteristics | Asia, Africa, America, Oceania |
| 7 | Banana streak disease (BSV) (Wikipedia, 2021) | 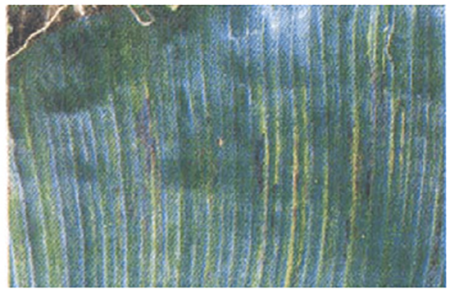 |
Yellow streaking on the leaves | Africa, South America, Asia |
| 8 | Cordana leaf spot (ProMusa, 2020) | 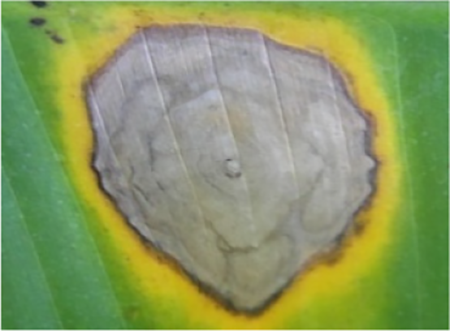 |
Diamond shape with a yellow border | Oceania, America, Africa, America, Asia |
| 9 | Eumusea leaf (NSW, 2018) | 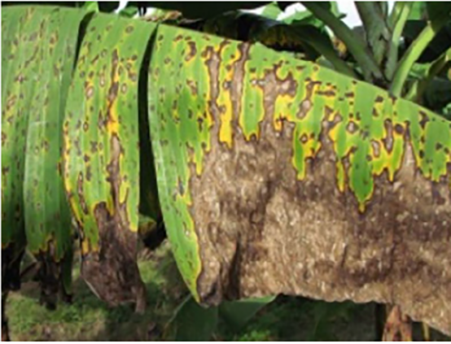 |
Small, linear, light brown streaks and expand into oval spots with dark brown borders and grey-white centers | Asia, Africa |
| 10 | Xanthonomas (Docken, 2013) | 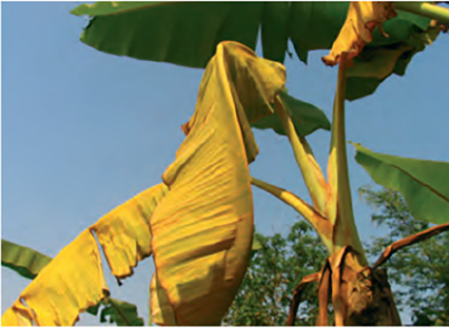 |
Exhibiting yellowing and collapse of leaves | Africa |
| 11 | Freckle leaf spot (Nace, 2019) | 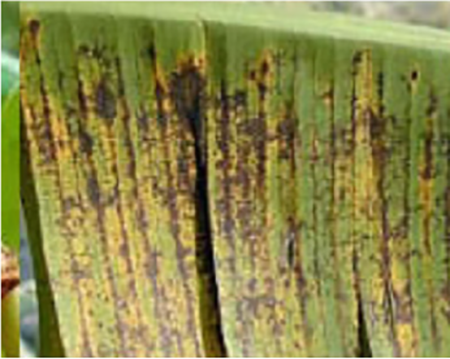 |
Small brown spots on the leaves | Southeast Asia, Australia, Pacific Islands, South Asia, Africa, Latin America. |
| 12 | Infection chlorosis mosaic disease (National Horticulture Board, 2015) | 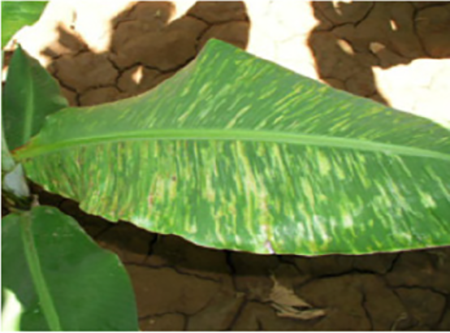 |
Mosaic streaking, chlorotic bands, narrow twisted leaves, and rigid, erect new growth | Tropical and Subtropical Regions |
For smallholder farmers, these diseases threaten food security and livelihoods, especially in regions where bananas are a primary food source and income. Control measures are expensive and often ineffective without proper resources. There is a growing demand for banana leaf products, both domestically and internationally (Indonesia Trade Data, 2025). AI-powered tools are rapidly becoming more accessible, offering smallholder farmers the opportunity to leverage these advanced technologies for improved agricultural practices. Many nations have already adopted AI-based solutions and integrated them into farm-level operations for a wide range of applications (Piddubna, 2024). These include agricultural health monitoring, smart irrigation systems, disease detection and analysis, precision positioning of farm equipment, animal health monitoring, automated weed control, drone-assisted aerial surveillance, supply chain optimization, predictive analytics for crop yield estimation (Prevention Web, 2019), market demand forecasting, and the precise distribution of fertilizers and chemicals.
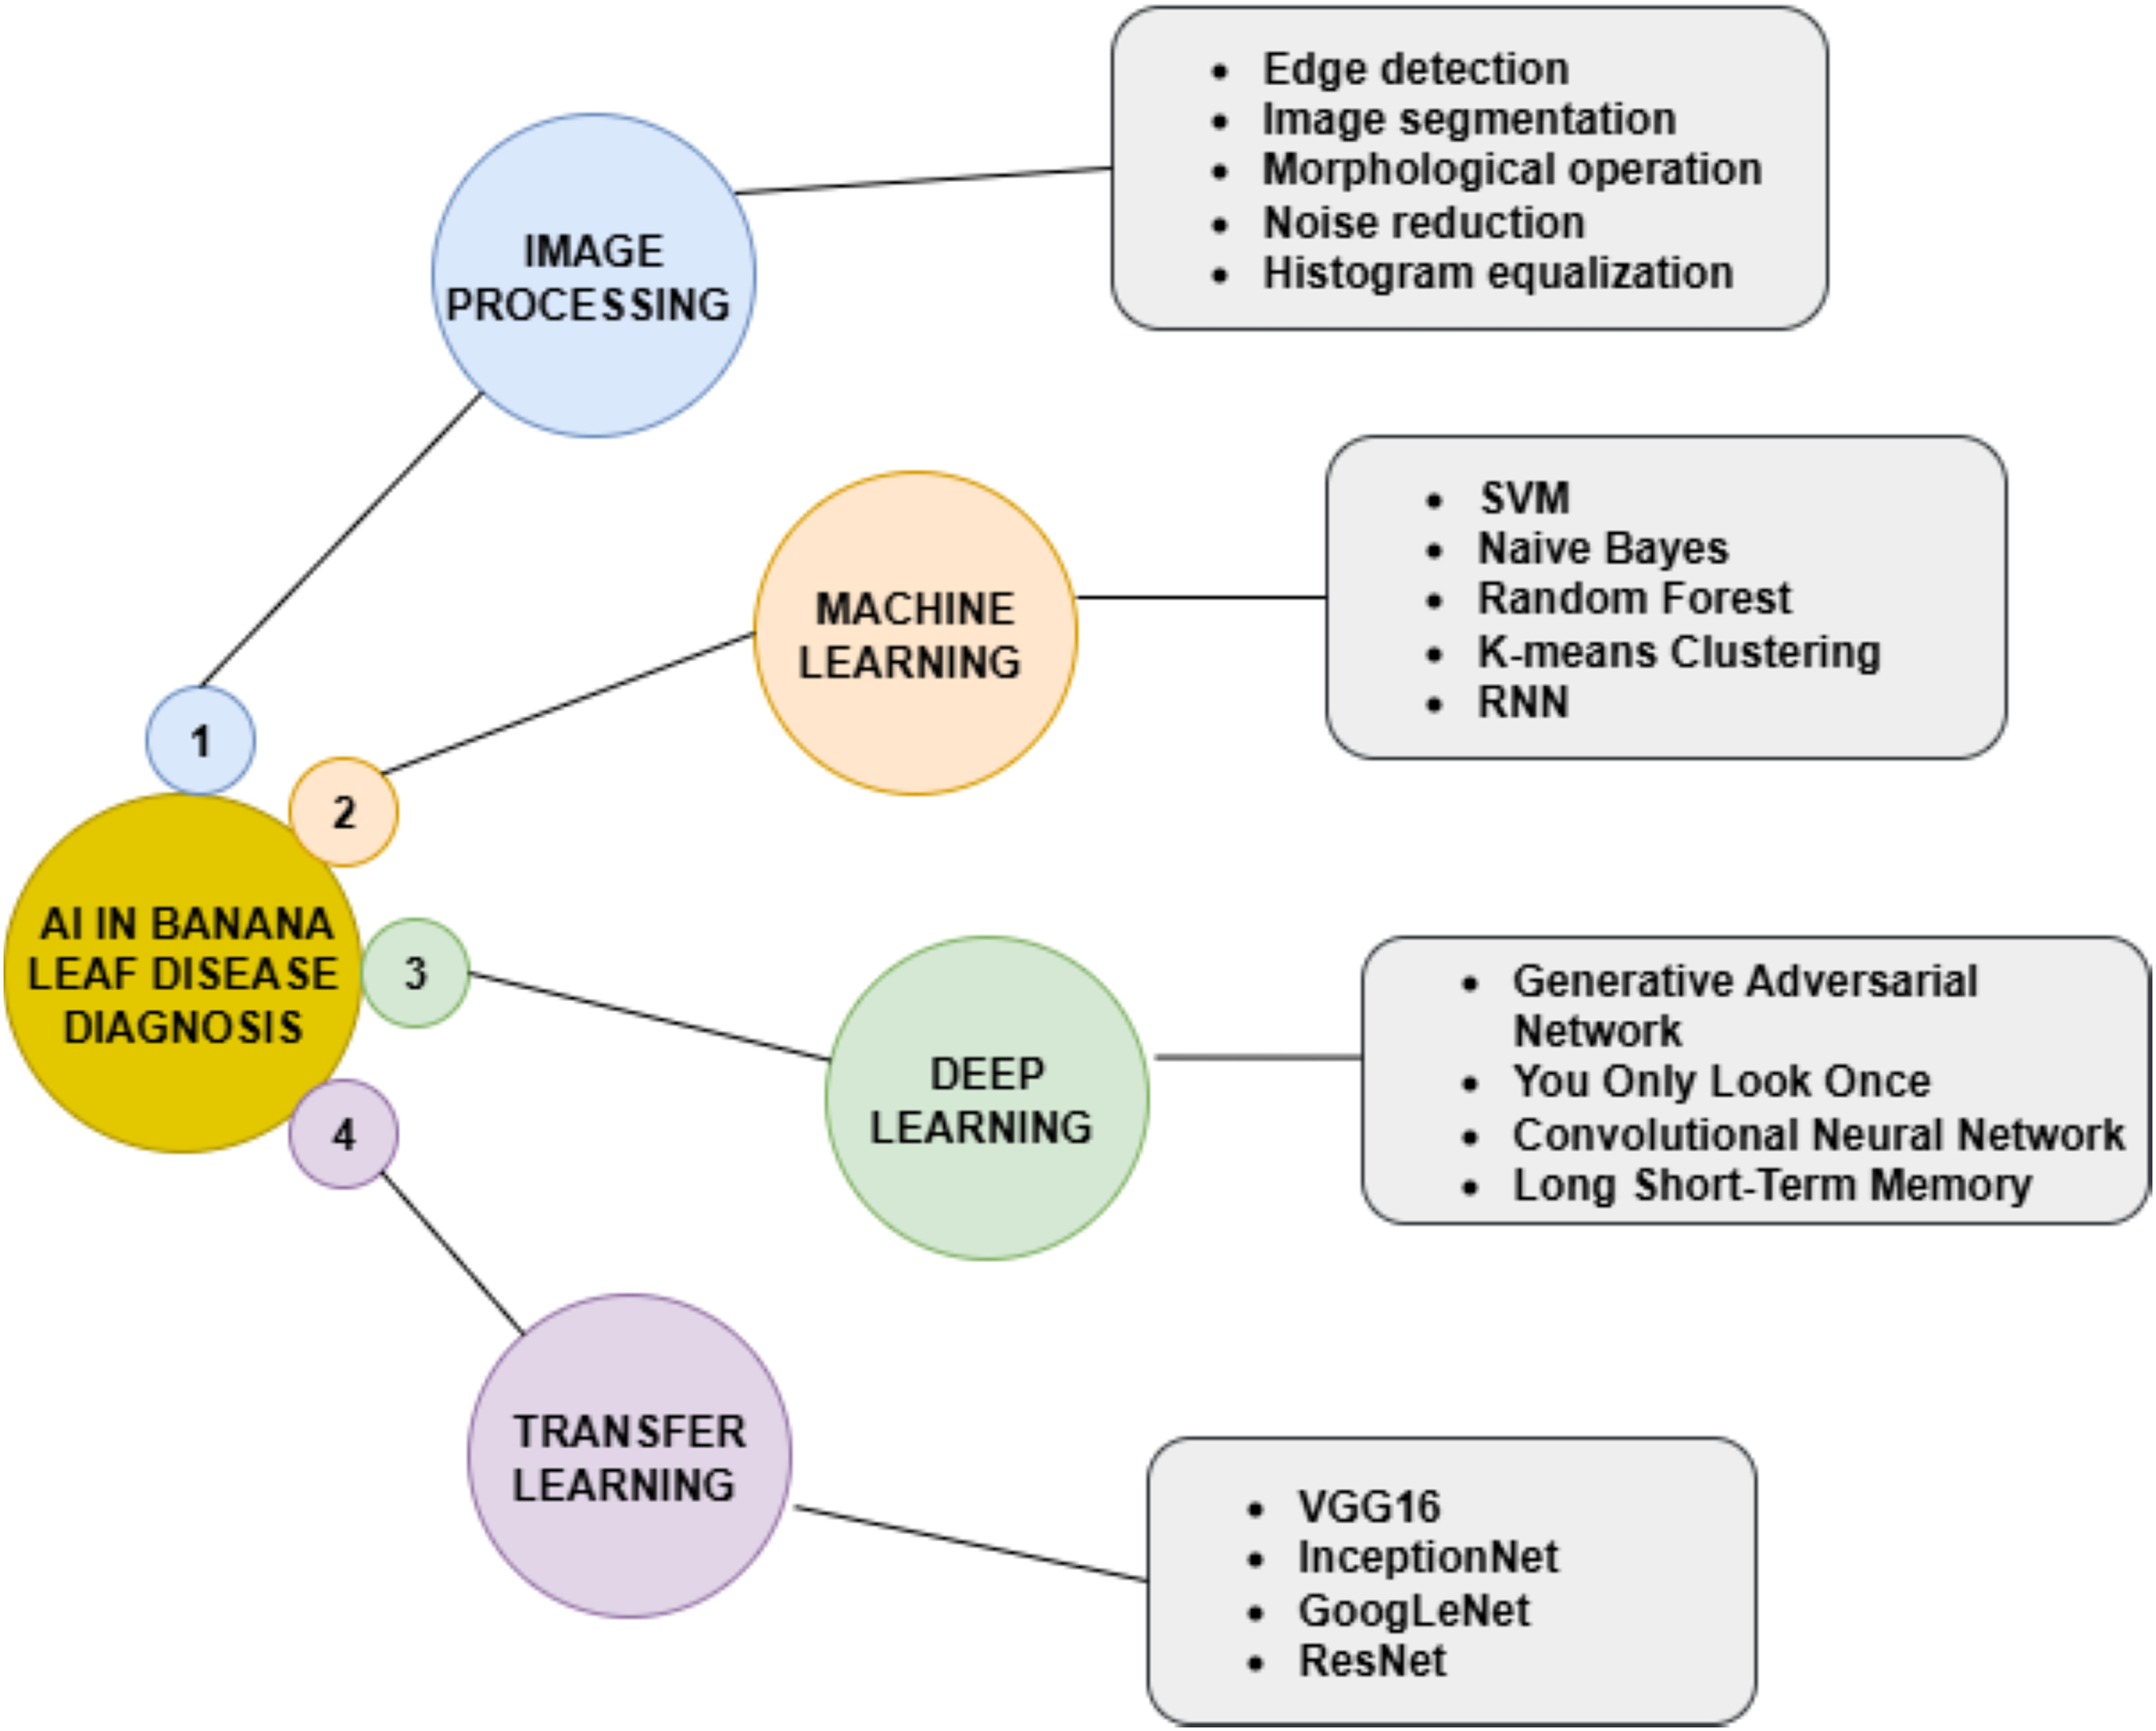
Early detection and classification of banana leaves can reduce the number of dangerous pesticides used for plant protection and growth (National Horticulture Board 2015). For instance, early illness detection and classification may benefit from applying AI techniques, including Deep Learning (DL), Machine Learning (ML), Image Processing (IP), and Transfer Learning (TL).
The following section in the systematic review is presented in the manner outlined below: ‘Review Management’ describes the review management process, including the search approach, the identification and extraction of relevant articles, and the formulation of research questions. ‘Review Reporting’ is the review reporting, which presents the answers to the research questions. ‘Challenges’ describes the primary research challenges and gaps in the existing literature. ‘Case Study: Real World Deployment of Banana Leaf Disease Diagnosis System’ presents the case study on the real-world deployment of the banana leaf disease diagnosis system with a brief discussion. ‘Conclusion and Future Work’ summarizes the conclusions and suggests areas for further research.
Survey methodology
Review management
The study discusses various methodologies used with the aid of an Artificial Intelligence (AI) system to detect and classify diseases in banana plant leaves. Additionally, the study elaborates on the systematic review that was carried out.
The objective of this study is to provide an overview of the detection and classification processes for banana leaf disease. The following are the main key contributions of this review:
This survey focuses on detecting and classifying diseases in banana leaves using IP, ML, DL, and TL techniques, including the model limitations and failure studies
Data gathering processes, data preprocessing methods, and dataset weaknesses are examined.
The performance metrics used for the detection and classification of banana leaf diseases are detailed. The challenges and research gaps in detecting and classifying the banana leaf disease are outlined.
The case study on the real-world deployment of banana leaf disease diagnosis systems is explained.
Searching approach
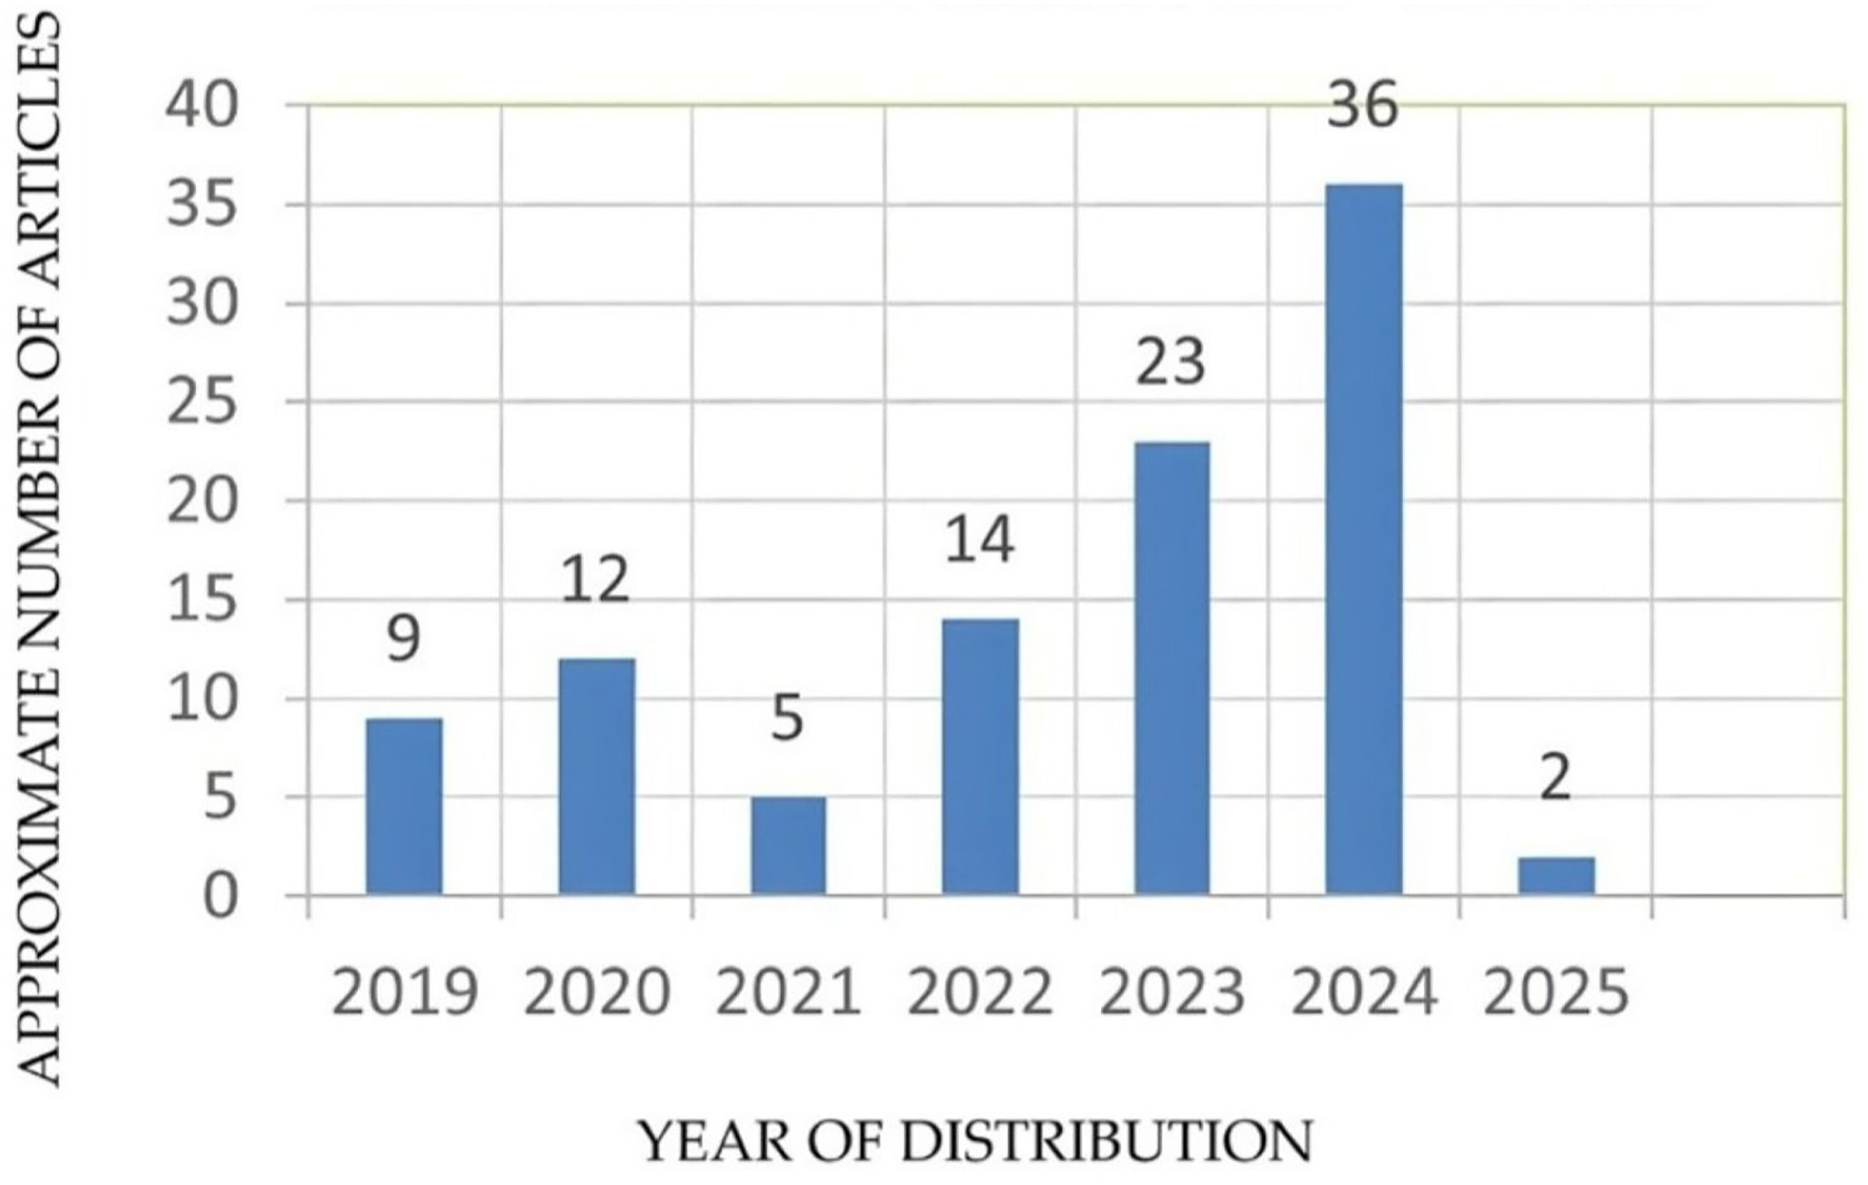
The research articles collected for this work were done under various search queries, such as “Detection of disease from banana leaves based on image processing”, “Early detection of banana leaf diseases using transfer learning”, “Banana leaf disease detection using deep learning”, “Banana crop health monitoring”, “Banana leaf disease classification using AI-based techniques”, “Banana leaf disease diagnosis”, “Disease severity in banana leaf.” “ML-based banana leaf disease diagnosis”, “AI in disease diagnosis”. Additionally, the articles were also sourced from the references cited in the study. Figure 2 illustrates the approximate number of articles collected year-wise.
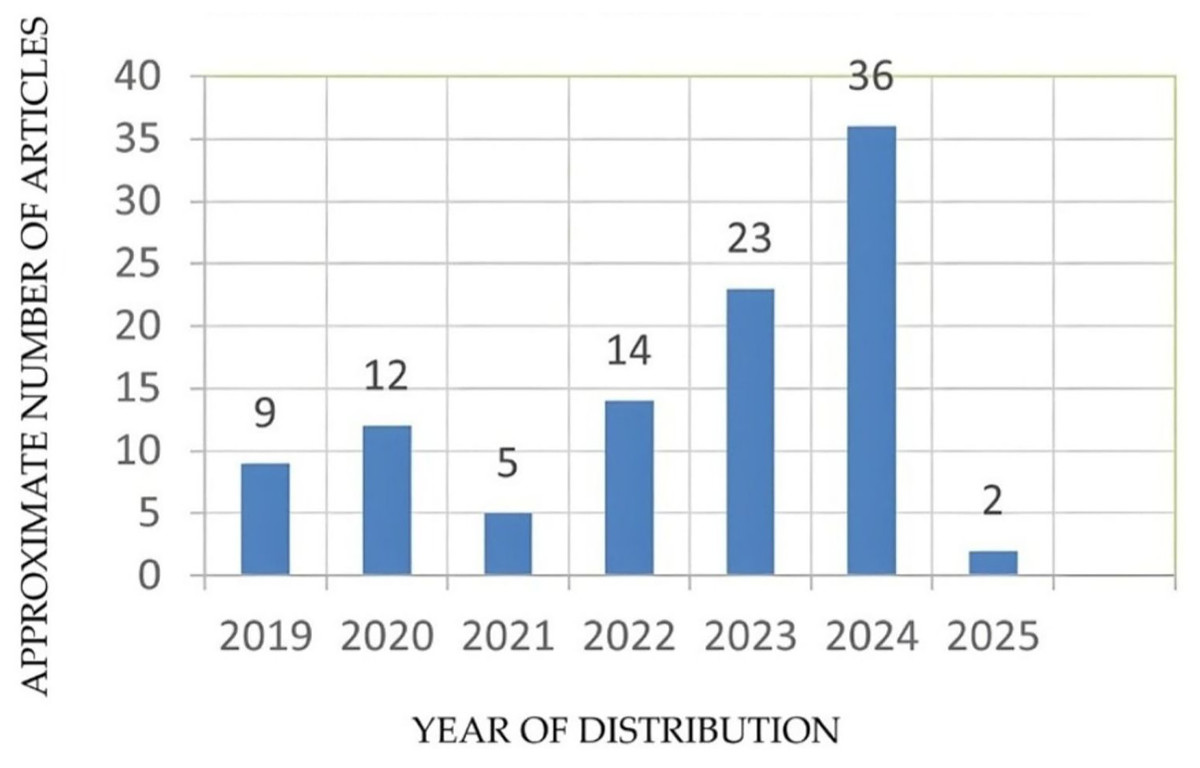
Figure 2: Year-wise distribution of research articles.
Extraction of articles
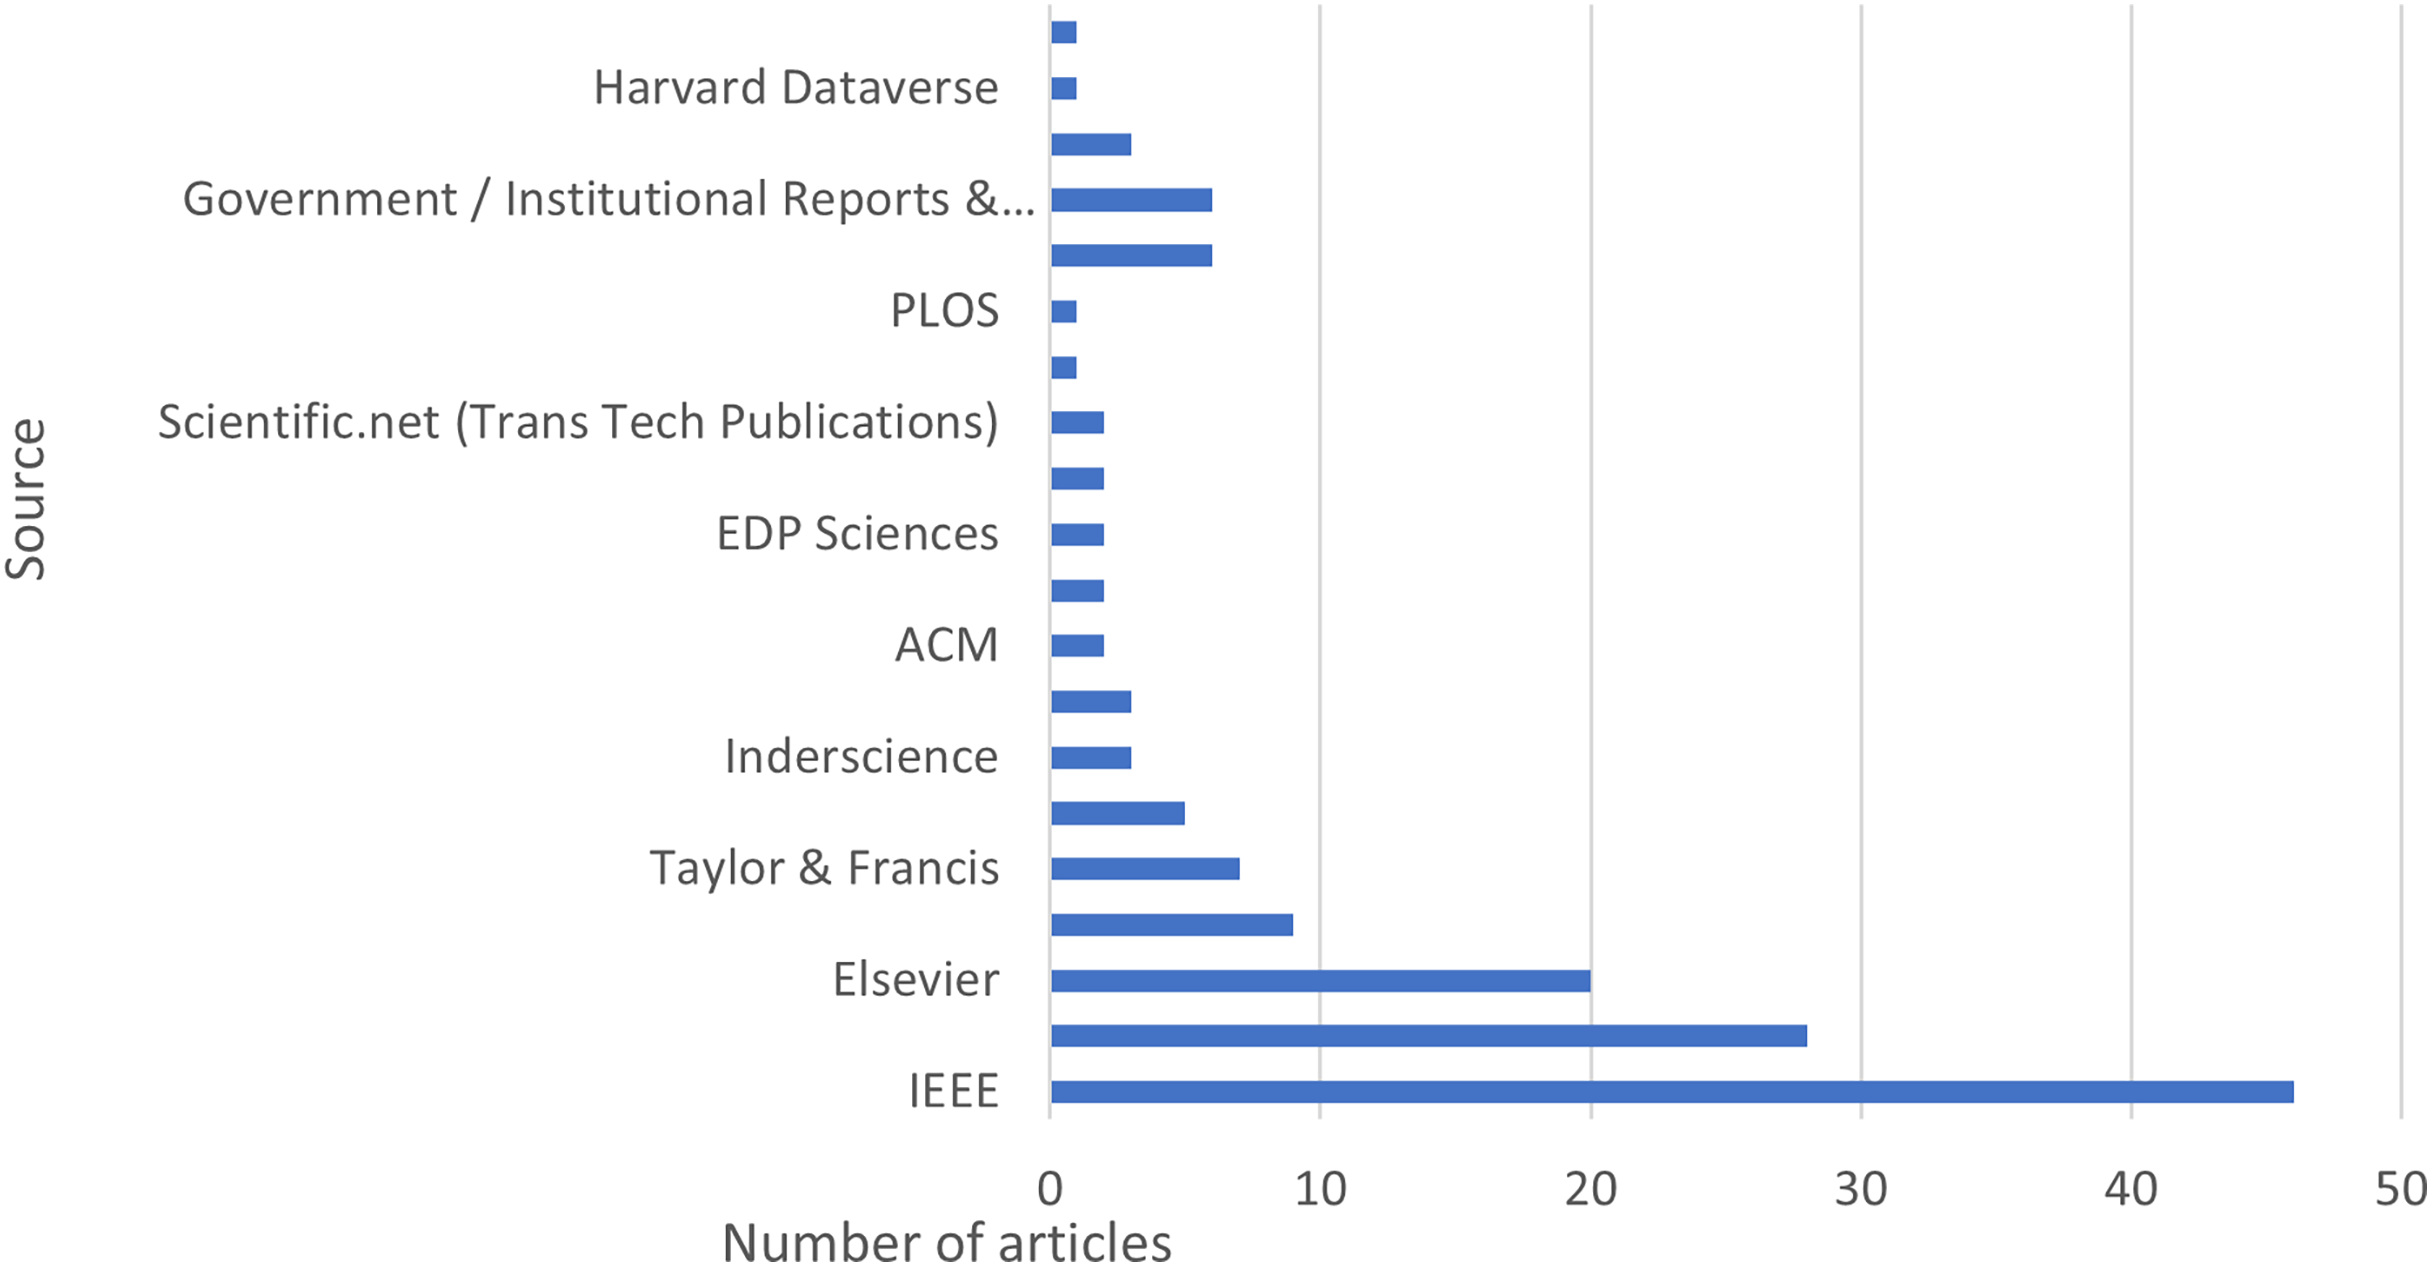
Articles from the scientific repository, including Scopus, Google Scholar, Web of Science, Science Direct, and IEEE from 2019 to 2025, are explored. Figure 3 illustrates the distribution of articles and datasets across different sources.
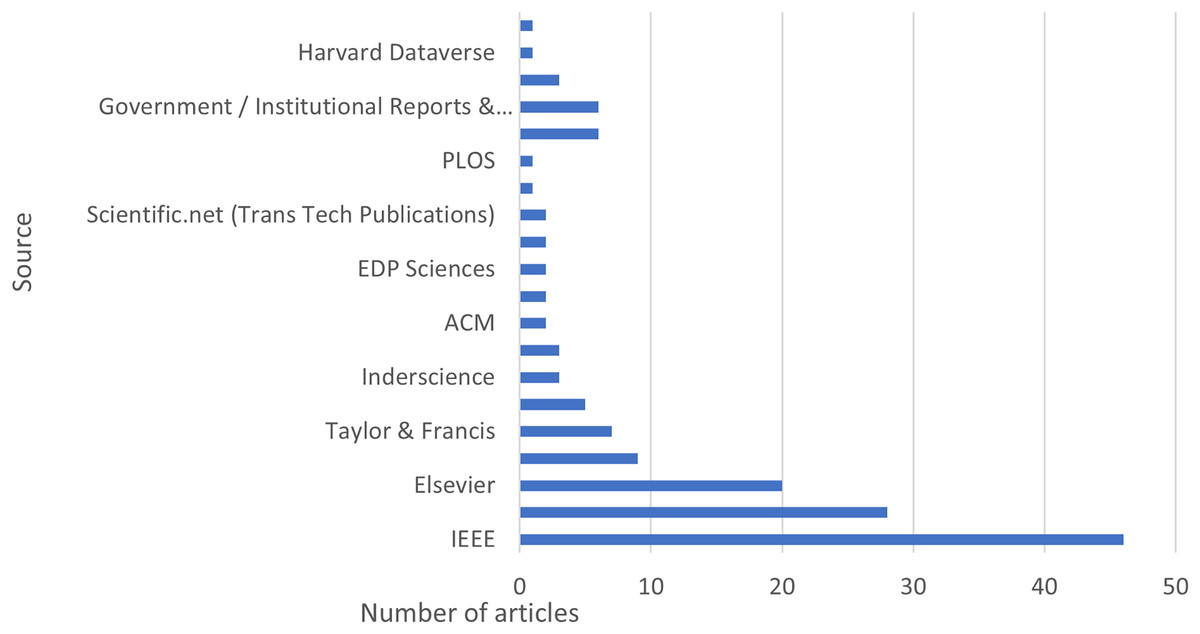
Figure 3: Distribution of articles and datasets across different sources.
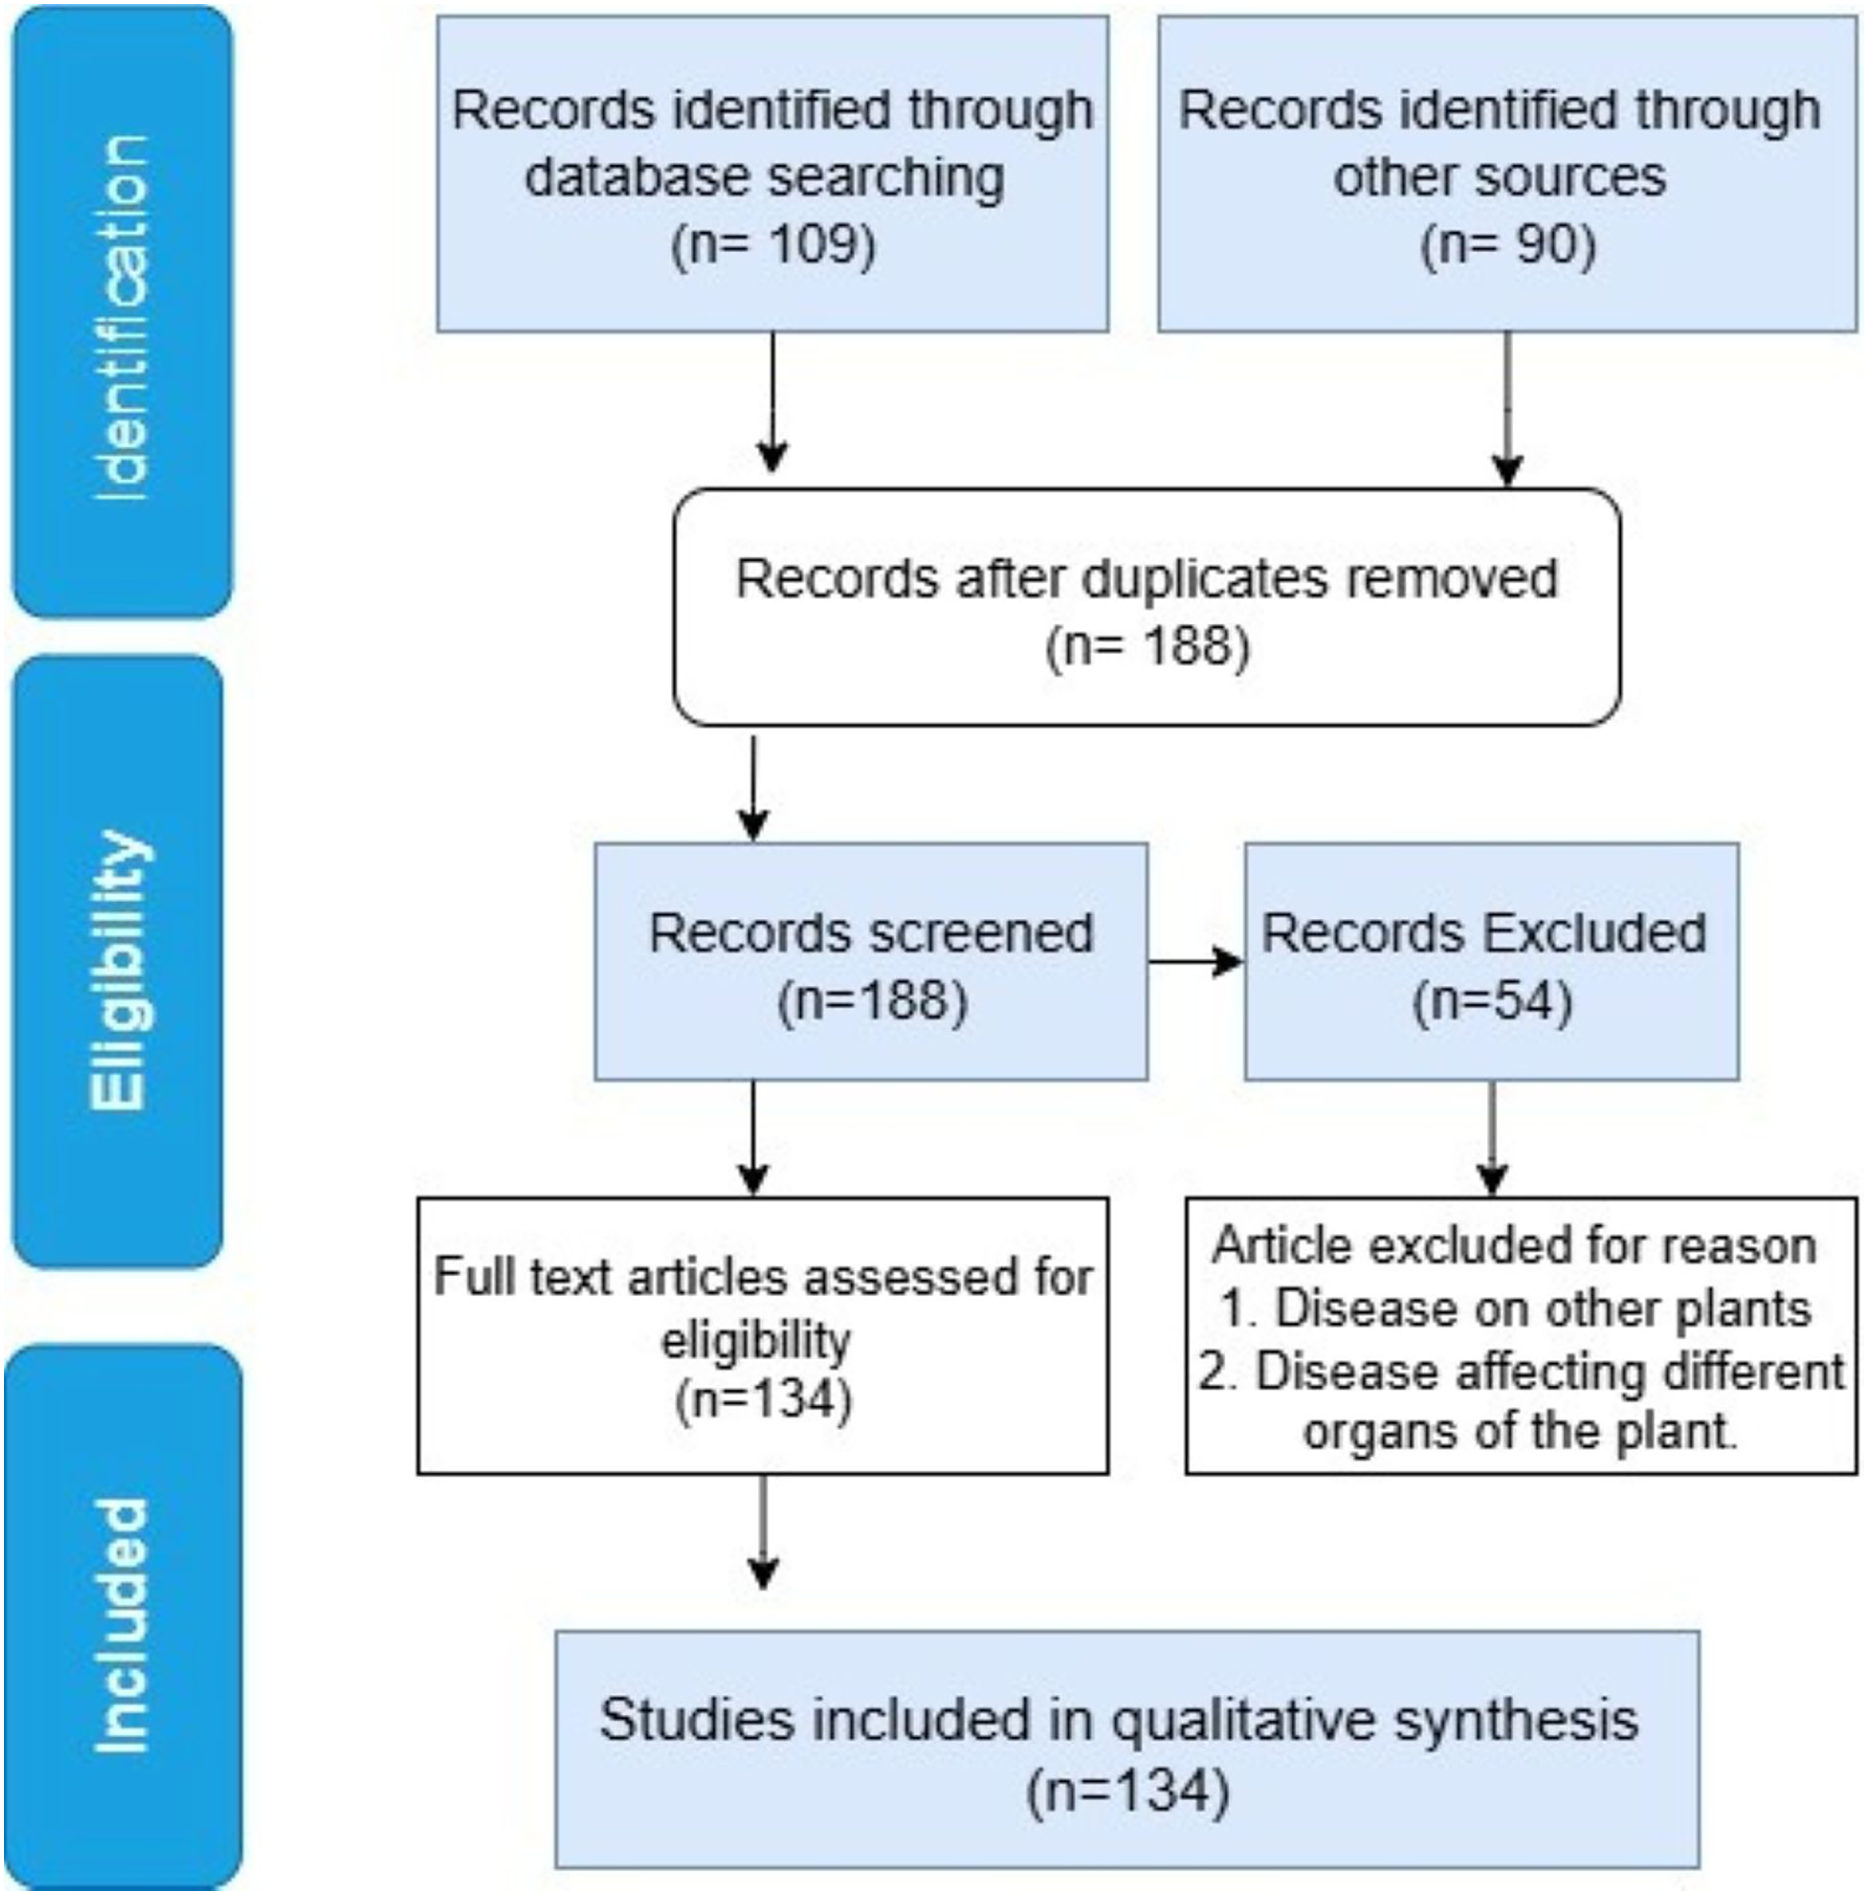
The study selection procedure is depicted in the PRISMA flow diagram in Fig. 4. A total of 90 records were found from other sources, and 109 were found through database searches. Duplicate articles were removed utilizing reference management software (Mendeley/Zotero), along with a manual check. After duplicates removal, 188 records were left for screening. Among those, 54 irrelevant articles were disqualified due to the following reasons: unavailability of a full-text, focus on illnesses that affect different banana plant organs, and other plants. Those articles were removed through a two-stage screening procedure using pre-specified inclusion and exclusion criteria. This process involved title and abstract screening to eliminate irrelevant research, along with a full article review. The qualitative synthesis comprised the remaining 134 full-text articles that met the eligibility requirements.
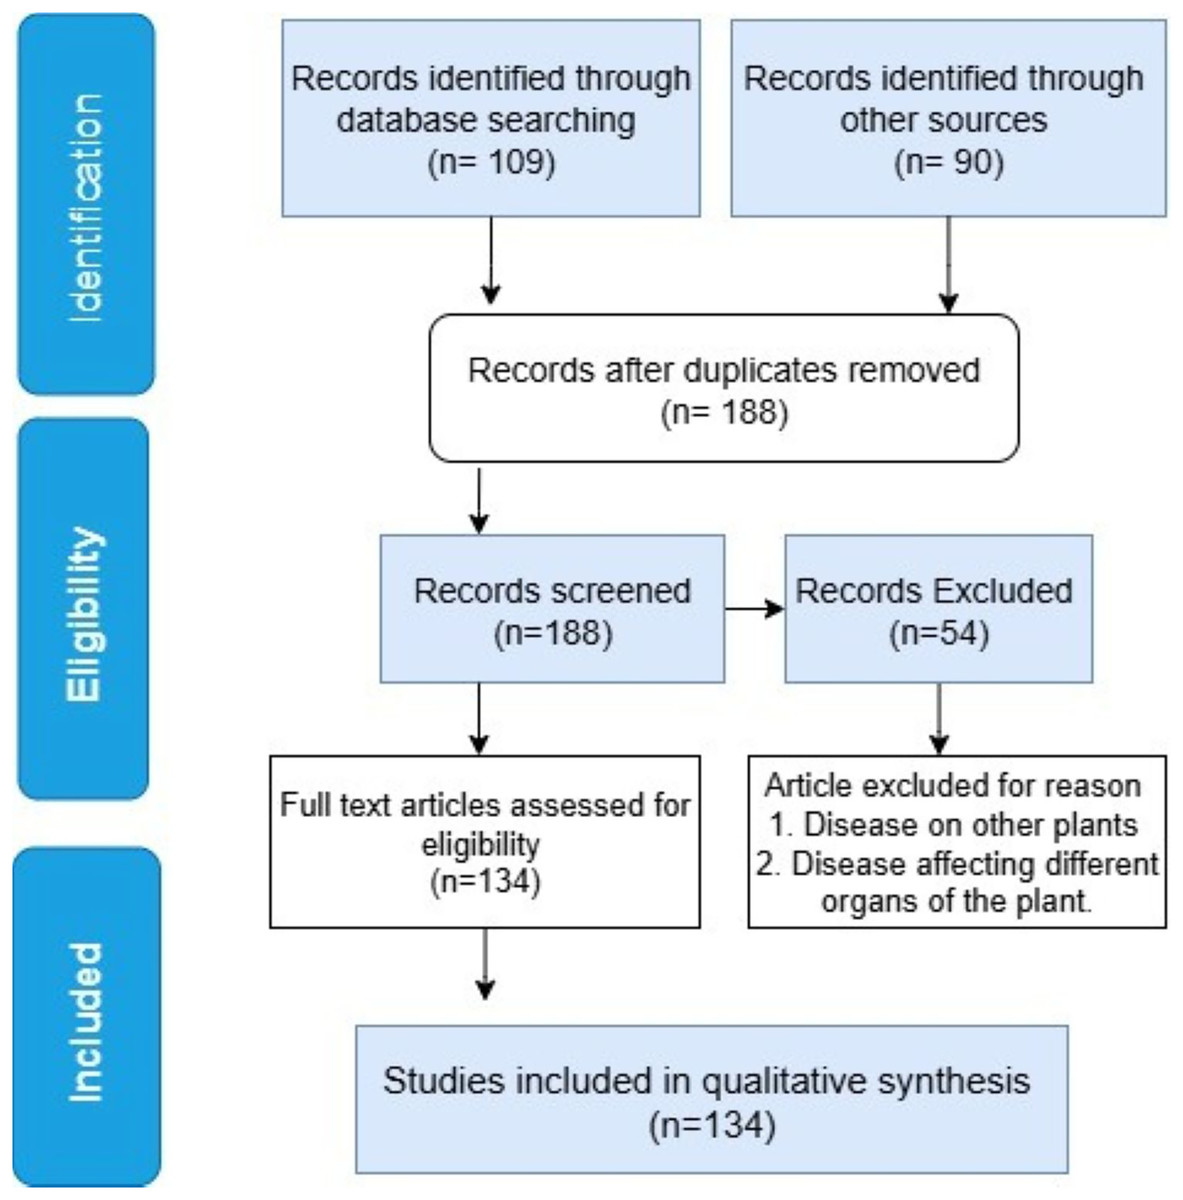
Figure 4: A PRISMA flow chart of study selection.
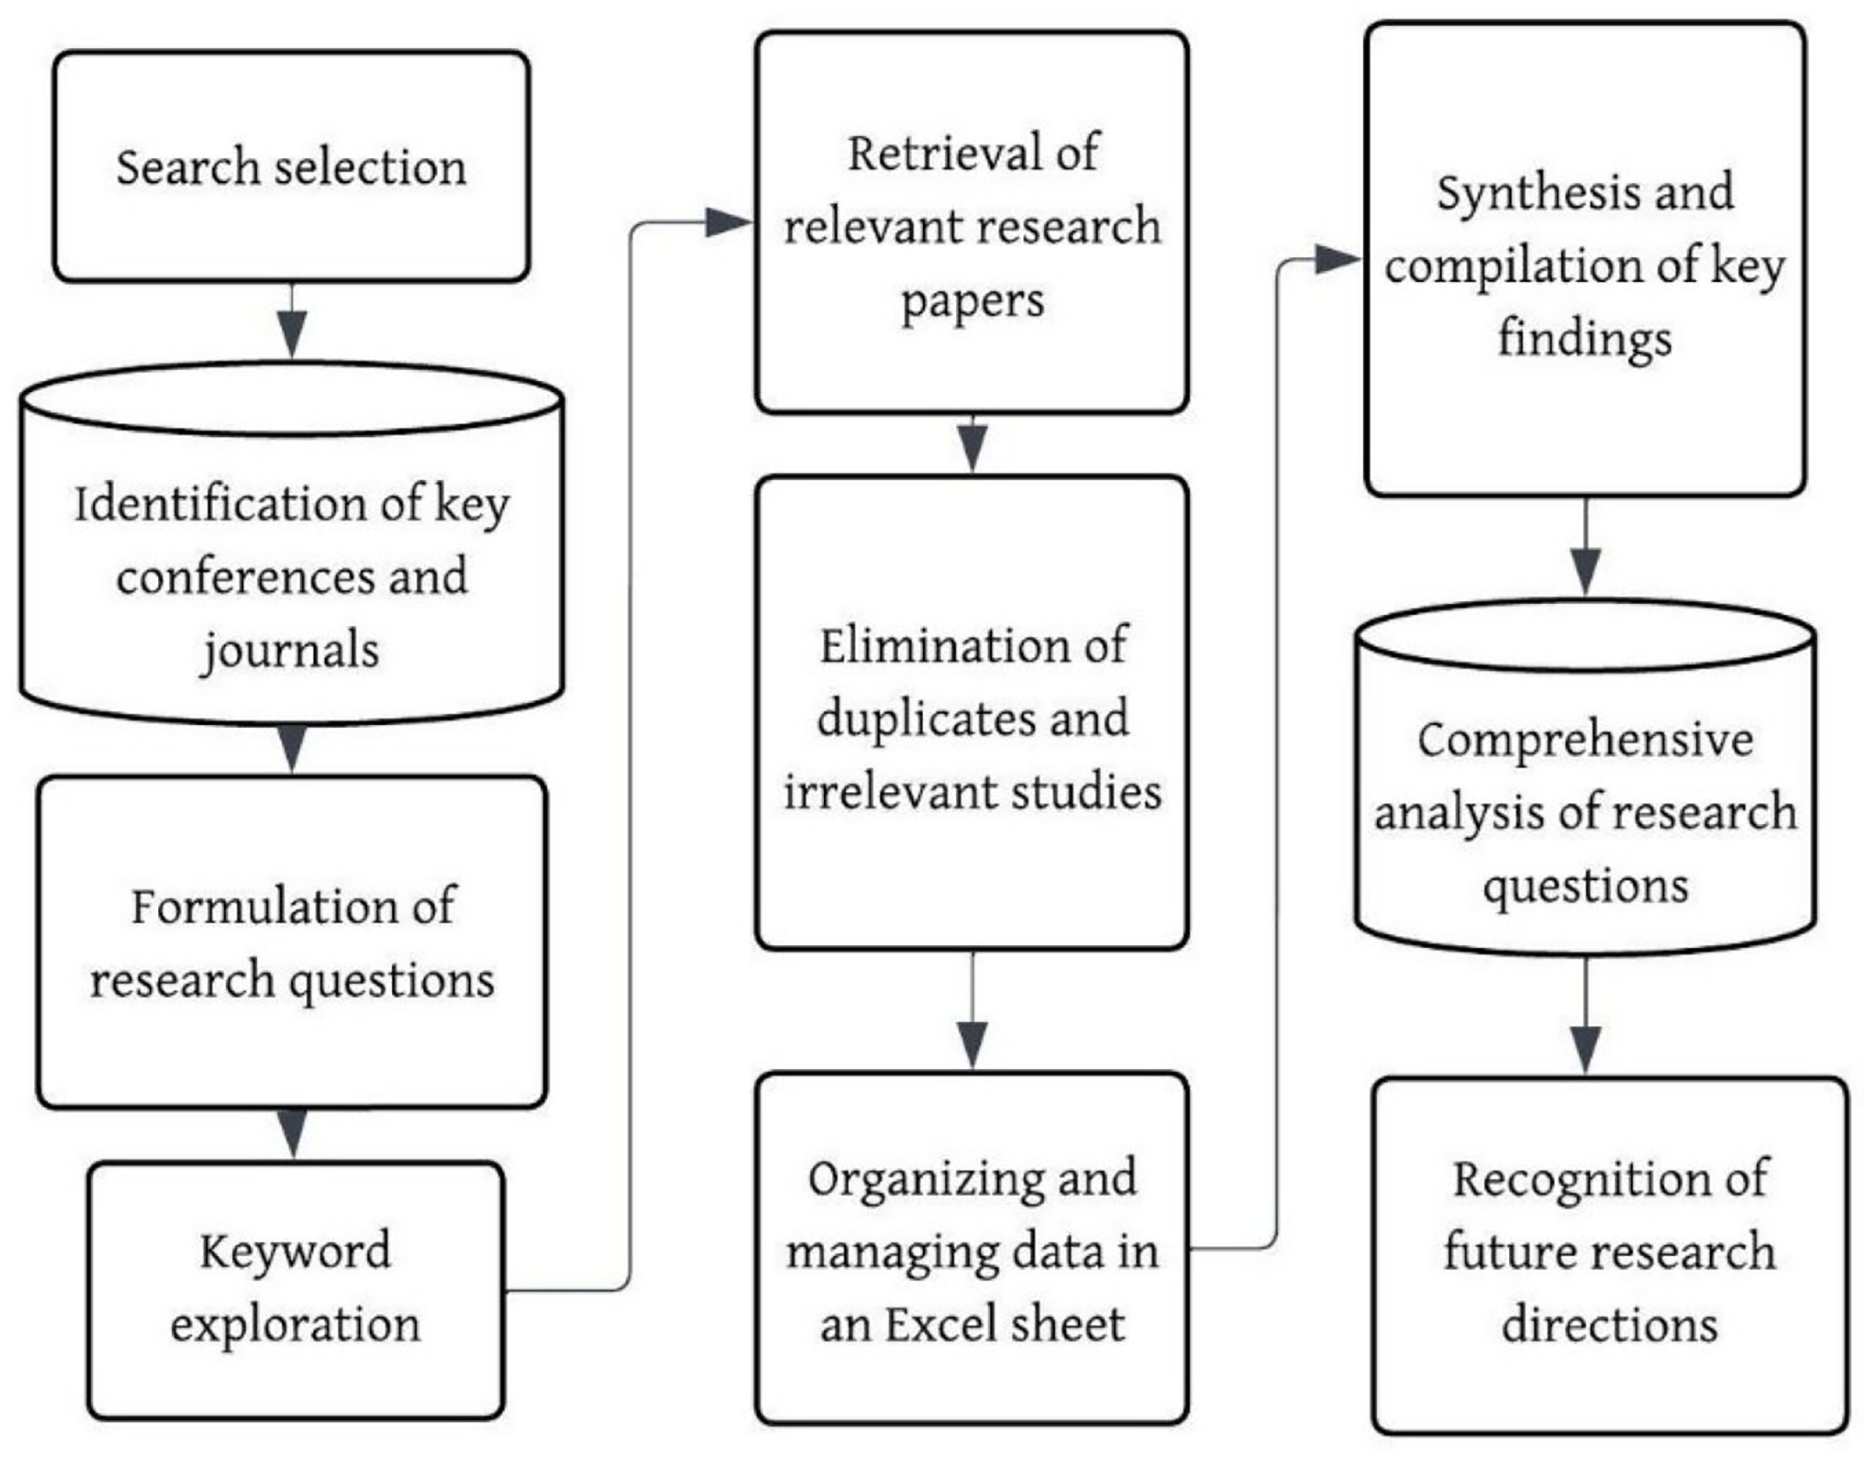
During the selection process, relevant search terms were utilized, and results were filtered based on their peer-reviewed status, relevance, and publication year. The retrieved articles provide various perspectives that contribute to a comprehensive understanding of the topic. Figure 5 illustrates the outline presented in this systematic literature review using a simple flowchart.
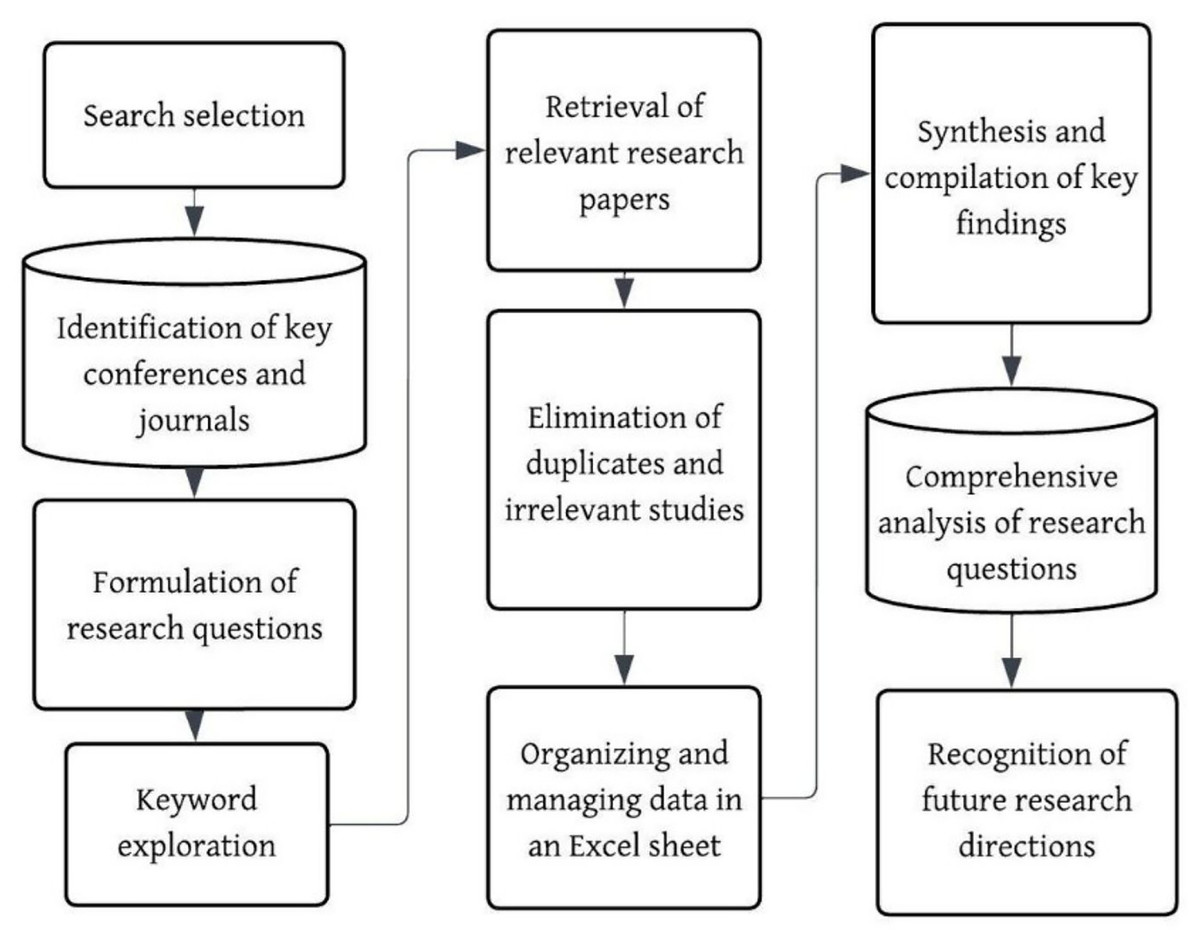
Figure 5: Systematic literature review flowchart.
Research questions
In this review, each section was structured to address key research questions related to banana leaf disease detection and classification.
RQ: 1. How can AI-driven techniques empower farmers with actionable insights to mitigate the spread of banana leaf disease before it escalates?
A. How effective is IP in detecting and classifying diseases in banana leaves?
B. How does the practice of using ML models enhance the process of banana leaf disease diagnosis?
C. In what ways does DL add to the complexity of identifying and classifying banana leaf diseases?
D. What kind of impact does TL have on the process of detecting and classifying banana leaf diseases?
E. Discuss the model limitations and failure cases.
RQ: 2. What type of data preprocessing techniques are applied in detecting and classifying banana leaf disease?
RQ: 3. What are the private and public datasets available? Highlight the public dataset’s weakness?
RQ: 4. What are the devices used for collecting datasets?
RQ: 5. What are the performance evaluation metrics used for evaluating the models?
Review reporting
Here, there is an answer to all the research questions above by making data-based evaluations and summaries of the contributions made by each of the authors of the studies.
RQ: 1 How can AI-driven techniques empower farmers with actionable insights to mitigate the spread of banana leaf disease before it escalates?
The use of AI in agriculture facilitates early diagnosis, classification, predictive analytics, and targeted management of banana leaf disease. Computer vision and DL algorithms can be used to identify diseases with high accuracy from images of leaves taken with a drone or mobile device (Sanga et al., 2020). By combining satellite imagery and ML models, Decision Support System (DSS) tools produce accurate maps of disease risks, which assist farmers in the correct timing of applying pesticides and practicing optimal farming (Selvaraj et al., 2019). Through improving the containment of diseases while enhancing crop yield, these AI-centered platforms minimize the overuse of chemicals.
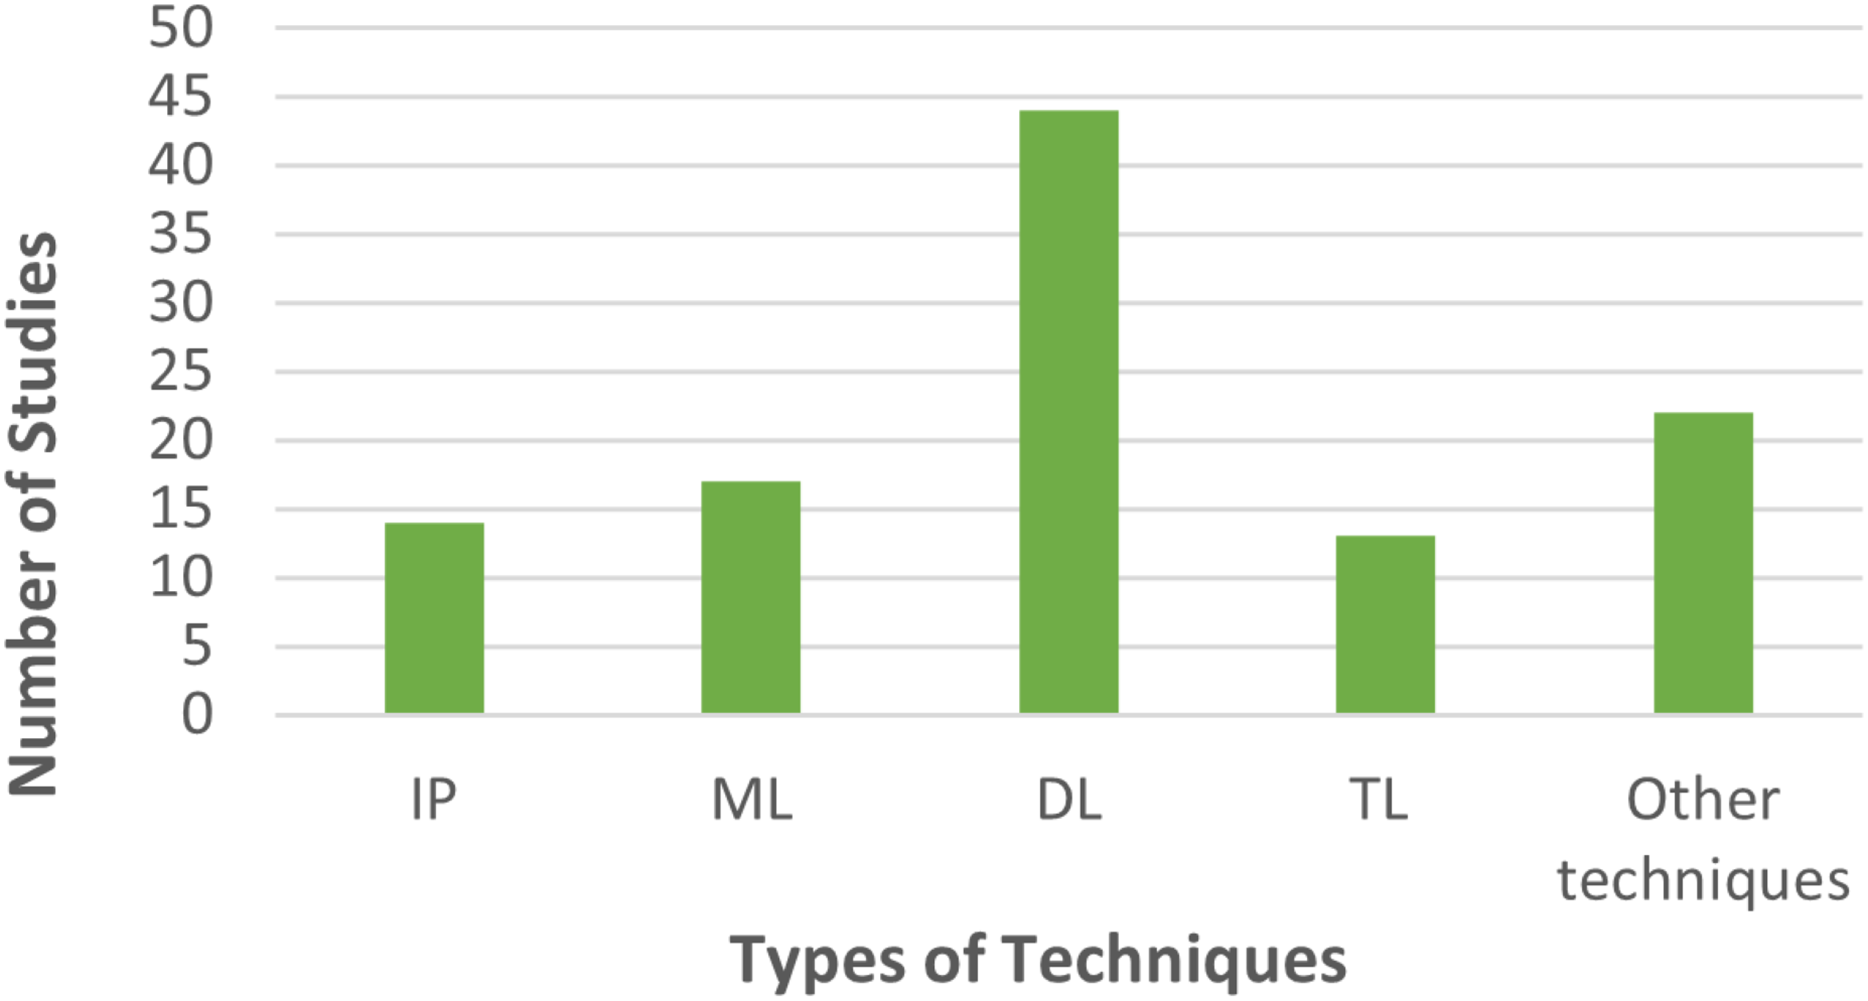
AI promotes sustainable practices by providing suggestions or optimization solutions. Systematically tested designs (Sanga et al., 2020) like ResNet50, InceptionV2, and MobileNet1 for disease detection training have also been suggested. Other studies (Rajagopal & Murugan, 2023) highlighted the success of AI models that comprise ML that automate the detection of four disease categories from a dataset of 1,290 images with an impressive detection accuracy of 80 percent for banana leaf diseases. All this novel research allows farmers to limit losses and improve productivity while adopting environmentally friendly methods. Figure 6 illustrates the breakdown of articles in terms of techniques employed. A robust variant of the modified generative adversarial network (MGAN)-modified faster region convolutional neural network with fuzzy (MGAN-MFRCNN) is proposed (Raja & Rajendran, 2023) for the detection of banana leaf diseases.
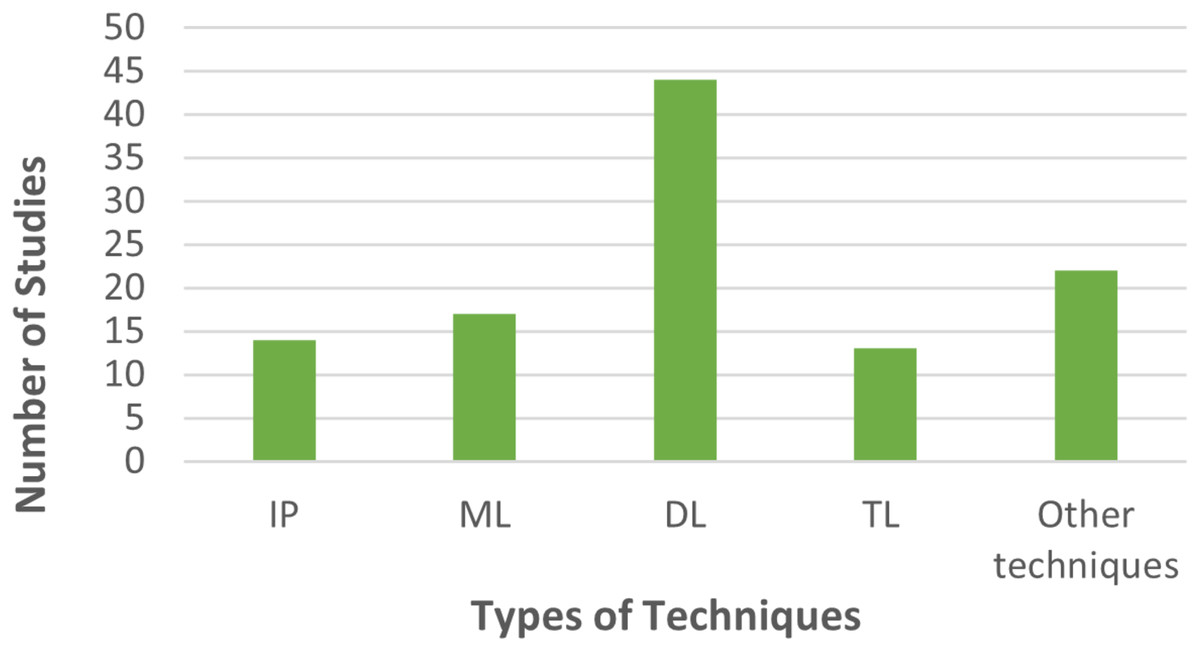
Figure 6: Analytical breakdown of studies by approach.
The dataset was collected from southern nations, consisting of 1288 images over three classes: healthy, xanthomonas, and sigatoka. The model attains accuracy, precision, F1-score, specificity, and sensitivity of 98%, 97%, 96%, 98%, and 98%.
The study by Aasha Nandhini et al. (2023) focused on banana leaf disease diagnosis, like bunchy top virus and sigatoka, by taking real-time images, captured from the southern regions of Tamil Nadu along with the ICAR NRCB in Tiruchirappalli, for a dataset of 5,500 images. Foreground-Based Segmentation (FBS) with the combination of oriented FAST and rotated BRIEF feature detection method is proposed for accurate classification of diseases. The proposed device is validated with the help of a temperature sensor, a humidity sensor, a soil moisture sensor, a pH sensor, a camera, and a Raspberry Pi. A mobile application has also been developed to identify the disease category. The accuracy attained for the detection and classification of the banana leaf disease is 96.75% and 97.33%. The author (Ashoka et al., 2024) introduced a novel Explainable AI (XAI) framework designed for disease diagnosis in banana leaves: pestalotiopsis, sigatoka, and fusarium wilt. A convolutional neural network (CNN) is applied to detect diseases utilizing its true color images. The Banana Dataset Tanzania (BDT) consists of images of banana leaves and stems infected with sigatoka and fusarium wilt, as well as healthy samples, also the BLSD dataset comprises images of banana leaves. To obtain high-level features, the EfficientNetB0 model is used. The pre-trained EfficientNetB0 technique was estimated on both datasets. In the BLSD dataset, the performance attained 99.22% accuracy. Furthermore, the model demonstrated improved performance on the BDT dataset, reaching 99.63% accuracy. Using a hybrid method to automatically diagnose diseases in the banana leaves, Thomas & David (2023) combines Ant Colony Optimization to determine feature selection along with CNN to classify the diseased leaf images. The total number of images is 2,825; the data used is already pre-processed through the use of Ant Colony Optimization algorithm. This approach achieves 98.64% accuracy, 98.53% precision, 98.24% recall, and an F1-score of 98.15%. Morphological analysis was applied (Liao et al., 2019) to describe conditions in banana leaf diseases using close-range hyperspectral remote sensing images. Hyperspectral imaging captures detailed spectral information across multiple wavelengths, enabling the detection of nanosecond differences in plant physiology caused by various conditions. This employs morphological IP to examine features such as texture, shape, and spectral characteristics associated with both healthy and diseased banana leaf. Additionally, this research investigates the severity of black sigatoka banana leaf disease. It utilizes climate data and disease incidence records to determine the relationship between changing climate conditions and the spread of the disease. The findings indicate that changes brought about by global warming, particularly elevated temperatures and moisture levels, create an ideal environment for the pathogen involved, thereby increasing the severity of the disease. This in turn, suggests enhanced losses for banana growers. This highlights urgent, time-sensitive issues regarding climate-resilient agricultural practices aimed at mitigating some impacts of climate change on banana farming. In another study (Cárdenas-Rodríguez et al., 2023) computer vision-based systems were designed for automatic detection of black sigatoka disease in banana leaves by combining ML with computer vision techniques for the design of a web and mobile application. The image of banana leaves is captured and recognized, also the treatments are advised. However, for the web application, regular monitoring is maintained. The method was tested in Milagro, Ecuador, with 87% effectiveness in black sigatoka detection at different stages of the disease. Figure 7 represents the AI techniques used in this study. The development of a stochastic model (Varghese et al., 2020) that simulates the spread of banana bunchy top virus in banana plantations is proposed. This model incorporates the randomness of the transmission process of the disease. This study estimates the model parameters without exact likelihood functions, providing a better representation of banana bunchy top virus dynamics. Data collection combines field observations, surveys for monitoring the spread of the disease, and environmental data using temperature and humidity. Here, the author (Ye et al., 2020) developed a method for diagnosing fusarium wilt-infested regions of banana using drone-based multispectral imaging. Two trials were conducted, surveying a total of 120 samples from China, for model fitting and validation. A DJI Phantom 4 quadcopter drone and a multispectral camera like MicaSense, RedEdge MTM were utilized. After analyzing eight vegetation indices (VI), red-edge indices like Chlorophyll Index Red Edge (CIRE) and Normalized Difference Red Edge (NDRE). It demonstrated a high degree of disease diagnosis accuracy. With imaging resolutions greater than 2 m, the highest accuracy was attained, proving the usefulness of drone-based remote sensing for timely plant management and disease monitoring. The study (Zhang et al., 2022) focus on multispectral image-based detection of banana fusarium wilt from an infected banana plantation in July and August 2020. The data was captured by a drone mounted with a camera. Infected canopies had distinctive spectral features: higher reflectance and lower reflectance in the Near Infrared (NIR) range and the visible range. Four supervised methods were used, and two unsupervised methods were used. Random Forest (RF) using five data points from multispectral bands has shown its highest effectiveness for early-stage detection with an accuracy of 97.28%, whereas Hotspot Analysis (HA), based on VIs, showed its effectiveness for late-stage detection. Utilizing VIs from uncrewed aerial vehicle (UAV) imagery, including bands such as Near-Infrared, RGB, and Red-Edge (Choosumrong et al., 2023), the growth of banana plants at 67 sampling points in China. Key indices, specifically TVI, NDRE, and NDVI, demonstrated high accuracy, with a Kappa coefficient of 0.85 for TVI. This analysis offers reliable and timely insights into crop health and management. Hyperspectral imaging is employed in combination with a (PLS–PLR) model for the early detection of black Sigatoka on banana leaves (Ugarte Fajardo et al., 2020). A total of 100 plants, grown for 3–4 months in the greenhouse, were taken to Ecuador for inoculation with the black sigatoka fungus, after which hyperspectral data covering the wavelengths ranging from 386 to 1,019 nanometers were measured. The Partial Least Squares–Partial Logistic Regression (PLS-PLR) model achieved an accuracy of 98%. The primary wavelengths for classification fell within the ranges of 577 to 651 nm and 700 to 1,019 nm defines a federated learning framework using CNN to detect five diseases, namely black sigatoka, yellow sigatoka, fusarium wilt, banana bunchy top virus, and moko disease of banana leaf. It ensures privacy in the federated averaging-based approach to building an effective global model. Its accuracy is remarkable at 96–97%. Tight results are obtained on precision, recall, and F1-score.
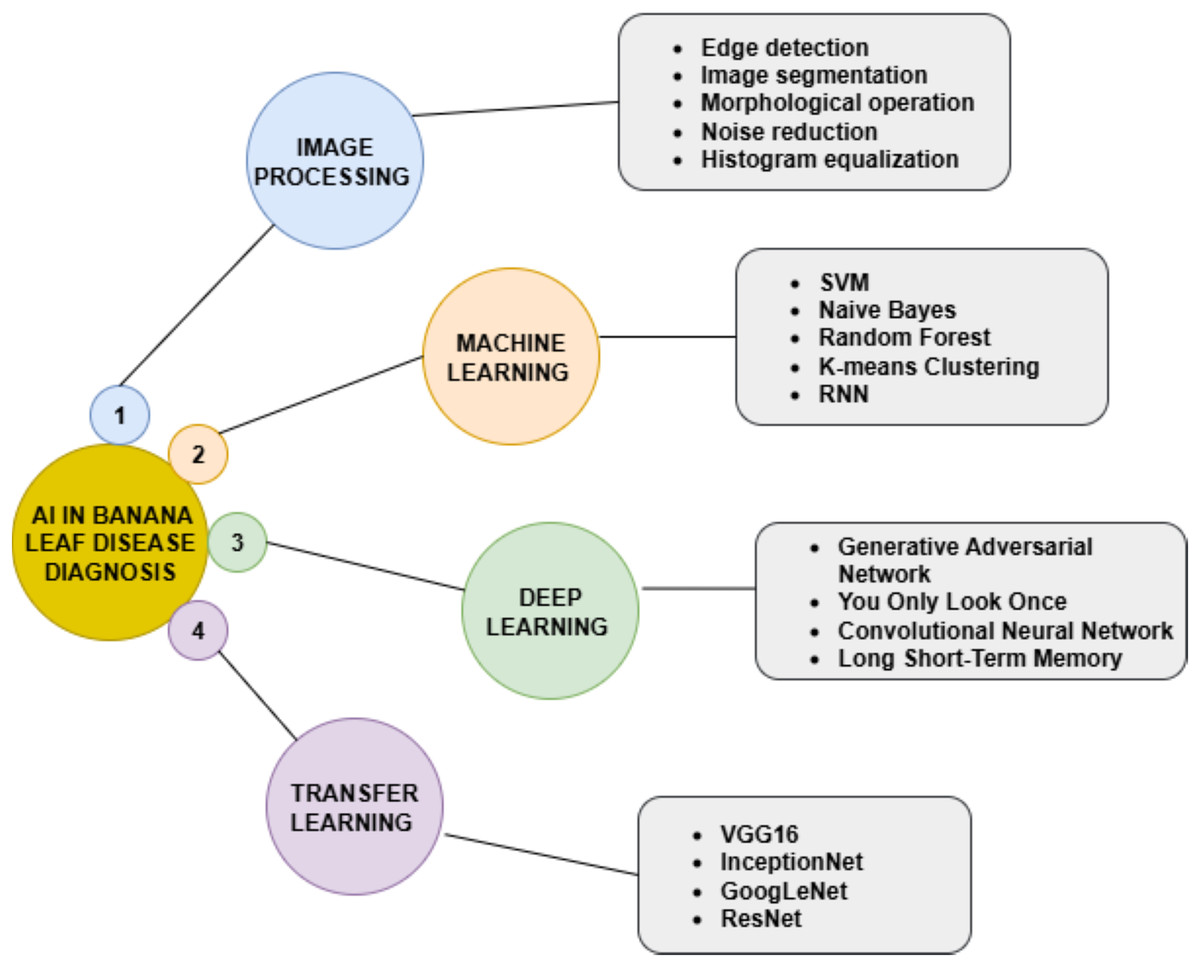
Figure 7: AI techniques for banana leaf disease diagnosis.
Federated Learning with CNN for disease detection in banana leaves belonging to different agro-climatic regions is explored by Sharma et al. (2023). The system classified diseases into four types based on severity, using the CNN model. The model provides high performance with accuracy ranging from 84.59% to 94.87%, recall ranging from 84.87% to94.84%, and F1-scores ranging between 84.66% and 94.86%. It indicates that the scalability support values are robust, hence an overall accuracy ranging between 92% and 97%. The federated averaging method gives macro-average, weighted average, and micro-average performance metrics, all of which range between 84.71% and 94.86%. Federated Learning allowed all clients to achieve high levels of precision, recall, and accuracy in disease classification (Suryavanshi et al., 2024). The model’s performance showed strong consistency across various averaging methods, with a macro average reaching 92.04%. By employing federated averaging to transform local data into a global model, this study illustrates the potential of federated learning in agriculture. Shukla et al. (2024) describes a three-class leaf disease classification technique using the architecture of CNN within federated learning to classify into four severity classes. Four data centers as stakeholders participated in collaborative learning, and results showed efficacy in several agricultural domains. The model has excellent accuracy for disease classification, with accuracy ranging from 92.74% to 96.22%. The author (Fajardo et al., 2022) examines the application of distributed edge intelligence for the early detection of black sigatoka disease using hyperspectral imaging. ML models, including support vector machine (SVM), Multi-Layer Perceptron (MLP), neural networks, N-way partial least square–discriminant analysis (NPLS-DA), and PLS-PLR, were trained on hyperspectral images of infected banana leaves. The images were captured from the ImSpector V10E hyperspectral scanner. Evaluation metrics showed that PLS-PLR, SVM, and MLP achieved high accuracy. The research (Bebber, 2019) examines how fast climate change affects the infection risk of black sigatoka, a major banana disease, in Latin America and the Caribbean. Using a mechanistic modeling approach, the authors developed infection risk models based on experimental data, hourly climate records from the Japanese 55-year Reanalysis (JRA55), and banana distribution data from the Spatial Production Allocation Model (SPAM), and simulations involving temperature and leaf wetness from 1958 to 2017. Increases in temperature raised the infection risk by 44.2% in areas like Ecuador and Brazil. The study aims to differentiate climate impacts from trade and host spread. Limitations include sparse observational data and biases in climate data. Infection risk varied spatially and temporally, decreasing in regions like Guatemala and Honduras due to drying trends, and also examining the black sigatoka disease, caused by Mycosphaerella fijiensis, which can reduce banana yields by up to 50%. It highlights the rapid fungicide resistance, particularly to propiconazole, and the absence of resistant cultivars like Cavendish. Control efforts account for 27% of production costs, with current methods proving largely ineffective.
The study (Escudero, Calvo & Bejarano, 2022) presents a LeNet-based CNN with a Decision Tree (DT) for detecting black sigatoka disease in banana leaves. Using a custom dataset with 96 × 96 image segments, the model achieved 90.03% accuracy, outperforming SVM and Inception-v3 despite challenges like limited data and class overlap. A mobile application that assists in the classification of images was developed by Escudero et al. (2021). The authors created a system using Ensemble Boosted Trees to classify black sigatoka disease in Plantain crops, achieving 82.02% accuracy in field tests. An easy-to-use Android app was developed for farmers in Colombia. Mora et al. (2025) examined ML techniques for early detection of black sigatoka disease in banana plants using hyperspectral imaging. A dataset of 16 plants was analyzed using various models, achieving high accuracy with SVM and MLP. Challenges included data dimensionality and class imbalance, but the results showed effective non-invasive detection.
The review (Soares et al., 2021) on banana genetic improvement for black igatoka resistance highlighted 24 studies (2010–2020) focusing on resistant genotypes like Calcutta 4 and cultivars such as Brazilian cultivar developed by Embrapa (BRS Maravilha) and Hybrid cultivar developed by FHIA in Honduras (FHIA-02). Key research areas included gene expression, enzyme activity, and transgenic development. Resistance was linked to jasmonic acid and antioxidant pathways. Challenges include incomplete gene validation and the complexity of breeding. The study emphasizes the importance of Clustered Regularly Interspaced Short Palindromic Repeats (CRISPR)/ CRISPR-associated protein 9, an endonuclease enzyme that cuts DNA at a targeted location (Cas9) and integrated breeding for effective management. In other study (Elinisa et al., 2025) develops a U-Net DL framework for detecting fusarium wilt and black sigatoka in banana plants. Utilizing 18,240 annotated images from Tanzania, the model was trained using data augmentation and achieved a dice score of 96.45% and an IoU of 93.23%. The findings indicate effective segmentation of diseased areas, supporting early disease management in banana farming.
How effective is IP in detecting and classifying diseases in banana leaves?
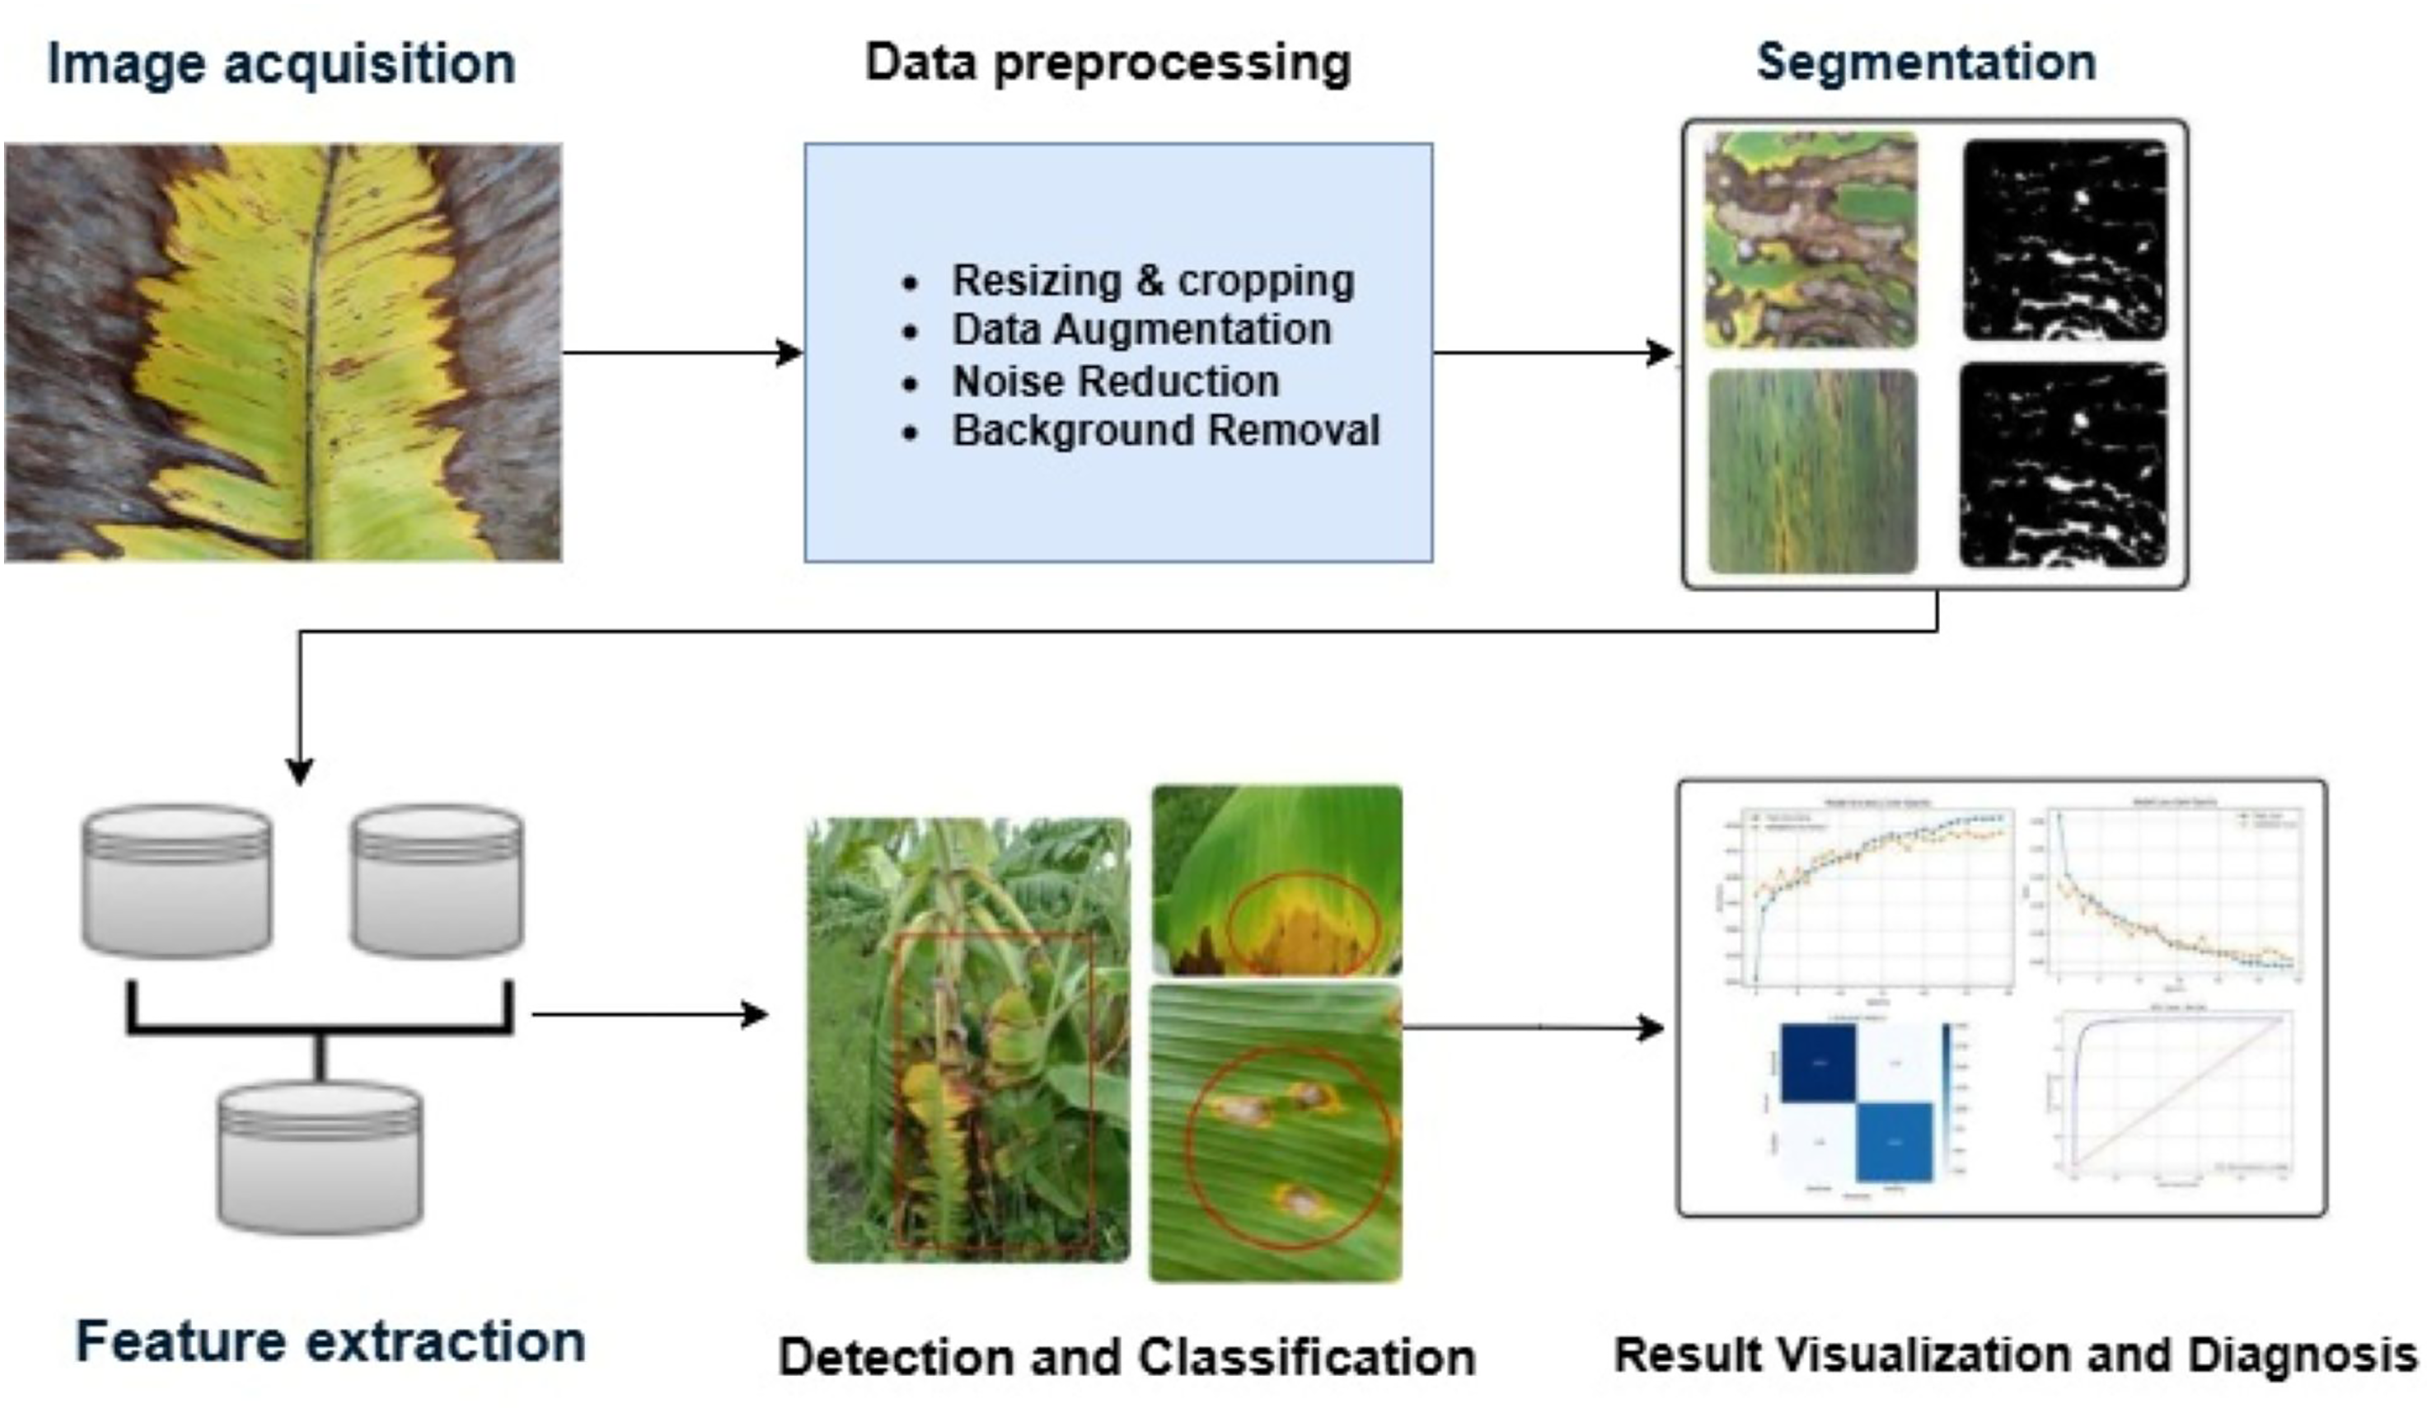
In Jianqing et al. (2022a) an image processing technique was demonstrated to identify sigatoka and banana gray leaf spot. The technique retrieved color features using color segmentation, YUV conversion (Y-Luminance, U-Blue chrominance, V-Red chrominance), and Otsu thresholding. Using a Euclidean distance classifier, it obtained 90% accuracy for sigatoka and 91.7% accuracy for gray leaf spot. Jianqing et al. (2022a) proposed a method for segmenting images that combines an area threshold approach, Otsu segmentation, and color segmentation. This approach processes the RGB images that comprise the U component using an “AND” operation. With a private image dataset of banana leaf disease, the method achieved a 2.3% error rate and 97% segmentation accuracy. Correa et al. (2021) utilized an IP method for diagnosing the diseases in banana leaves. The images of both infected and non-infected leaves with conditions like bacterial wilt and black sigatoka were taken from a public source. The research covers the areas of segmentation, the Otsu method, histogram equalization, masking, and classification. The model achieved a recognition rate of 96.26% using the techniques. Deenan, Janakiraman & Nagachandrabose (2020) used various image segmentation algorithms, including grayscale conversion, image smoothing, local gradient operator, and edge localization. The outcomes of these algorithms were also computed based on Mean squared Error (MSE), Peak Signal-to-Noise Ratio (PSNR), and Structural Similarity Index (SSIM). The diseases found are the pseudostem borer, panama disease, yellow sigatoka, rhizome rot, banana bract mosaic virus, and banana bunchy top virus. Figure 8 determines the workflow of IP techniques.
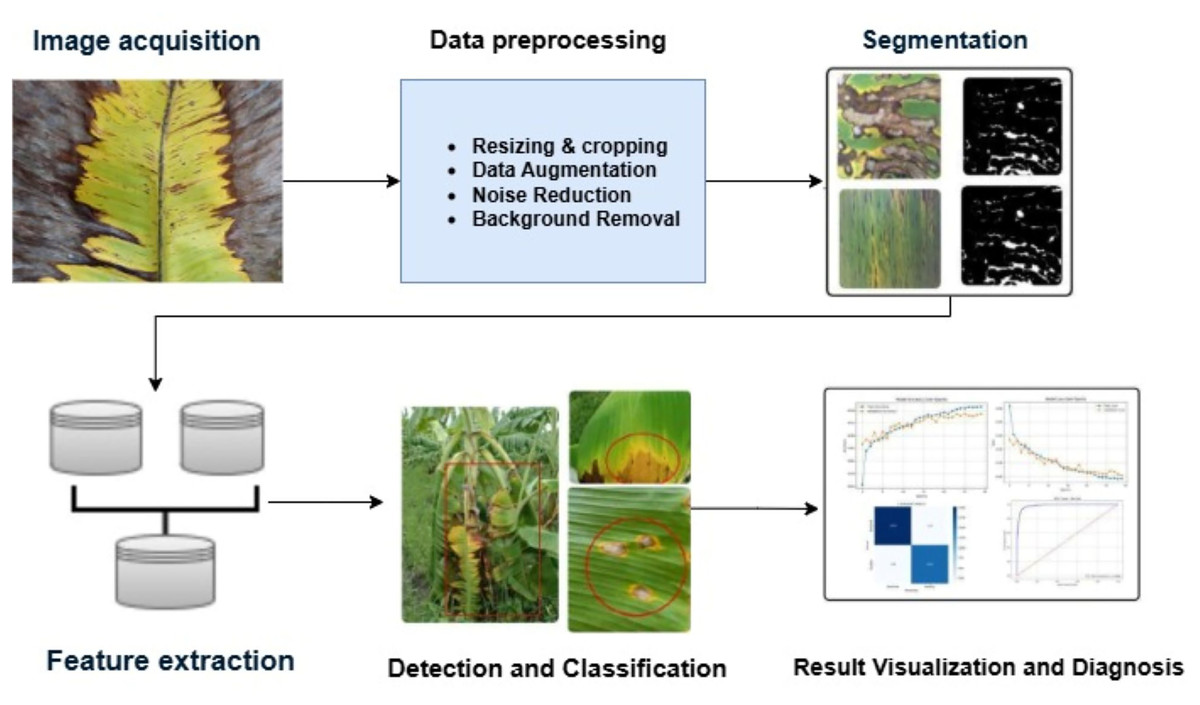
Figure 8: Workflow of banana leaf disease detection and classification using IP.
The study (Prabhakar & Sudha, 2024) proposes a filtering algorithm for disease detection in banana plant leaves. This involves many pre-processing methods, various segmentation techniques, and different feature extraction methods. The filtering algorithms used on the images are the Canny filtering algorithm, the Prewitt filtering algorithm, and the Roberts filtering algorithm. Other IP tools applied to the study are MATLAB and Python. The diseases focused are cordana, sigatoka, and pestalotiopsis.
Bhamare & Kulkarni (2013) concentrated on identifying the black sigatoka disease in banana trees through IP methods. The captured images underwent processing using Laplacian, median filtering, Gaussian, and linear. Image pre-processing involves operations like resizing, filtering, segmentation, and morphological transformations. Furthermore, for object extraction, techniques such as background subtraction, filtering, and segmentation were utilized. The study compared (Abisha & Bharathi, 2023) several models for image segmentation, including morphological transformation, contour detection, sobel filtering, k-means clustering, edge detection, canny edge detection, and thresholding, to determine the best technique. A collection of 1,600 images, such as those from the Plant Village dataset, was used for this analysis. Additionally, Gaussian blur was employed as a technique in IP. The results achieved were an RMSE value of 0.0013, a PSNR value of 57.41, and an SSIM value of 0.9982. Research by Patil et al. (2024) introduced an image-processing method for identifying the leaves of banana plants. Diseased leaves like xanthomonas, fusarium, and sigatoka were gathered. Features were extracted using multiple layers of CNN. Additionally, an Android app was also developed to help the farmers. The study referenced in Ibarra, Rivera & Manlises (2023a) examines the proportion of leaf degeneration in banana leaves affected by Panama disease. It utilizes color space transformations and OpenCV tools to segment and analyze images of the leaves. Through image processing, this method quantifies the extent of degradation by calculating the percentage of diseased areas. The researcher (Lin et al., 2021) introduces EM-ERNet, a new neural network specifically designed for banana disease recognition. The network is built on the ResNet backbone and uses dilated and multi-scale convolutions to enhance feature extraction. Innovations include batch normalization and a fusion mechanism powered by an optimized Extreme Learning Machine (ELM) algorithm. The method achieved high accuracy rates of up to 96.39% for the different banana diseases, and with faster processing times than in traditional models such as ResNet50. Non-Subsampled Dual-Tree Quaternion Wavelet Transform (NDQWT) in tandem with an Neighborhood Threshold Pattern (NTP) to classify banana leaf diseases is applied (Mathew, Kumar & Cherian, 2023a). In NDQWT, features were extracted while retaining direction and spatial form after local textures were recorded via NTP. The suggestion is that this technique will improve the accuracy of diagnosing different neglects of banana leaves. The study by Elinisa et al. (2025) address diseases like fusarium wilt and black sigatoka by utilizing 18,240 photographs of banana leaves and stalks taken by mobile phone cameras (Elinisa et al., 2025). The model uses the CNN architecture for the U-Net to segment images of banana plants to mark infected regions for early diagnosis. The U-Net model achieved a dice coefficient of 96.45% and IoU of 93.23%. The study by Mahendran & Seetharaman (2022) used Gray-Level Co-occurrence Matrix (GLCM) for texture feature extraction and classification utilizing Deep CNN. The dataset consists of 10 samples collected from a prehistoric cultivation field. Table 2 provides an overview of IP.
| Ref | Methodology | Dataset | Diseases | Performance matrix | ||
|---|---|---|---|---|---|---|
| Jianqing et al. (2022b) | Otsu segmentation, | 100 images, Hainan University’s Danzhou campus, China. | Gray leaf spot. sigatoka leaf spot. | Accuracy Sigatoka: 90.0% Grey leaf spot: 91.7% |
||
| Jianqing et al. (2022a) | Otsu segmentation, threshold method, | 100 images, Hainan University’s Danzhou campus, China. | Gray leaf spot disease and sigatoka leaf spot disease | Accuracy: 97% error rates: 2.3%, |
||
| Deenan, Janakiraman & Nagachandrabose (2020) | Edge localization, local gradient operator, image smoothing, and grayscale conversion. | 150 images from Sirumugai village, Coimbatore District | Pseudostem borer, Panama disease, yellow sigatoka, rhizome rot, banana brack mosaic virus, and bunchy top virus. | MSE: 6,610, PSNR: 6,608 |
||
| Patil et al. (2024) | LeNet architecture | 3 image classes of diseased leaves were gathered in different lighting conditions. | Xanthomonas, Fusarium, and Sigatoka | Precision score: 93% Recall score: 93% F1 value: 93% |
||
| Abisha & Bharathi (2023) | Thresholding, Morphological Transformation, Canny edge detection, Contour detection, Sobel | 1,600 banana leaf images from kaggle combined with banana leaf disease dataset (Medhi & Deb, 2022) | The diseases are only segmented not classified. | RMSE value 0.0013, PSNR value 57.41, SSIM value 0.9982 |
||
| Correa et al. (2021) | Otsu method, histogram equalization, masking, and classification. | GitHub repository, with 623 images. | Bacterial wilt, black sigatoka, | Accuracy: 96.26% | ||
| Elinisa et al. (2025) | U-Net semantic segmentation | 18,240 banana leaves using Samsung SMA715F/DS phone cameras | Fusarium Wilt and Black Sigatoka | Dice Coefficient of 96.45% and an Intersection over Union of 93.23%. | ||
| Prabhakar & Sudha (2024) | Canny filtering, Prewitt filtering, and Roberts filtering algorithms. | Prehistoric data were collected from which 10 samples were utilized. | Cordana, Sigatoka, and Pestalotiopsis | Sigatoka | ||
| Canny | 82.8 | 28.9 | ||||
| Robert | 97.5 | 28.2 | ||||
| Prewitt | 98.3 | 28.2 | ||||
| Pestalotiopsis | ||||||
| Canny | 81.3 | 29.05 | ||||
| Robert | 98.5 | 29.05 | ||||
| Prewitt | 98.2 | 28.2 | ||||
| Cordana | ||||||
| Canny | 86.3 | 28.8 | ||||
| Robert | 98.8 | 28.2 | ||||
| Prewitt | 96.8 | 28.3 | ||||
| Lin et al. (2021) | ELM algorithm, multi-scale convolutions, ResNet | Both private and public datasets. | Black Sigatoka, Yellow Sigatoka, and Pestalotiopsis | Accuracy: 96.39% | ||
| Liao et al. (2019) | Morphological image processing (MIP). | Hyperspectral remote sensing images. | Disease is not classified. | Accuracy: >80% | ||
How does the practice of using ML models enhance the process of banana leaf disease diagnosis?
In 2020 Selvaraj et al. (2020), used UAV and multispectral satellite imagery for banana classification based on pixels. Using the MicaSense RedEdge multi-spectral camera and the Pix4Dcapture app, UAV-RGB (Red Green, Blue) photos were obtained for the localization of bananas and disease diagnosis. DL models such as RetinaNet and ResNet are used to locate and identify banana plants. The accuracy of the performance metric was 97%, while the recall results were 0.99, 0.95, 0.92, and 0.90. Three distinct models for diagnosing illnesses in banana leaves are shown by Vidhya & Priya (2022) utilizing both DL techniques, Alexnet, and ML techniques, K-Nearest Neighbors (KNN) and SVM. In particular, sigatoka and leafspot is manily focused on this study. A total of 12,544 images using basic photography equipment, photographs of banana leaves were taken from different banana fields in Kerala, India. These include augmentation methods, including clipping, zooming, and rotation. It yields an accuracy level of 96.73% with AlexNet, 84.86% with SVM, and 76.49% with KNN. Figure 9 explains the workflow of banana leaf diagnosis using ML.
Figure 9: Workflow of banana leaf disease diagnosis using ML.
The study by Chaudhari & Patil (2020) exhibited the design of a SVM classifier to identify banana leaf diseases by visualizing the symptoms, especially focusing on sigatoka, cucumber mosaic virus, bacterial wilt, and panama diseases. A digital camera has been utilized for capturing images. Preprocessing techniques for denoise removal was utilized. K-means clustering is used during the segmentation process in identifying the diseased regions while feature extraction, colors, shapes, texture features are extracted to classify the type of disease and those texture features are evaluated by the GLCM. It is shown the classification of the four classes of diseases is correct in 85% of cases. The author (Freire et al., 2023) targeted detection of sigatoka disease on the banana foliage and proposed a method integrating CNNs with Shapley values for developing an explainable diagnostic system for banana leaf sigatoka disease. The dataset contains 155 images of healthy plants, 320 images infected with sigatoka, and 814 images infected with xanthomonas. The SHapley Additive exPlanations (SHAP) SHAP VGG 16 model was found to be working better than other models. The study by Saranya et al. (2020) presented a system that utilizes image processing techniques to detect illnesses early, along with an artificial neural network (ANN) algorithm for classification. The process begins with pre-processing techniques, such as scaling and filtering, including both high-pass and low-pass filters. Ten fruit and leaf samples are used for disease detection. Segmentation methods, such as fuzzy c-means clustering and thresholding, are employed. The diseases targeted in this study include black Sigatoka, freckle-affected leaves, and anthracnose-affected fruits. Yathurshan et al. (2023) introduces “Leaf Guard” a Smartphone application designed especially for the agricultural environment in Sri Lanka, aimed at detecting diseases in the banana crop and treating the same. In this, field visits, agricultural journal records, and expert talks were used to collect 6,000 pictures of leaves of banana plant. Pictures were resized before processing the images using Histogram-based feature extraction methods. In this application, Xanthomonas and Sigatoka- related issues are dealt. It provides a cure percentage analysis along with a chemical suggestion system. More than 95% accuracy was achieved in total. The article reviews (Raja & Rajendran, 2022) banana leaf disease detection methods, highlighting that traditional ML models like SVM, KNN, and ANN achieve around 89–98% accuracy but rely on manual feature extraction and struggle with complex images. In contrast, DL models (CNN, DCNN, MobileNet, LeNet) automatically learn features and perform better, reaching up to 99% accuracy even under variations in lighting, scale, and background. The study emphasizes that DL is the most reliable approach for early, automated, and real-time detection, though challenges remain in terms of limited datasets, detection of tiny symptoms, and lack of severity estimation.
Thiagarajan et al. (2024) analyzed banana plant health using image capturing and preprocessing. It employed k-means clustering for segmentation and used SVM and CNN for classification, focusing on diseases like panama wilt and black sigatoka. A filtering method is proposed by Prabhakar & Sudha (2024) for the detection of illnesses in the leaves of banana plants. Numerous preprocessing approaches, multiple segmentation strategies, and numerous feature extraction strategies are all used. Three different filtering algorithms were applied to the images: the Roberts, Prewitt, and Canny filters. MATLAB and Python are two other image-processing tools used in the study. This article discusses three diseases: pestalotiopsis, sigatoka, and cordana. However Pai, Naik & BR (2020) introduced a method of detecting banana leaf diseases with a combination of a CNN algorithm with an ML model. There are four disease types with 1,200 images used here. The web interface allows users to upload an image, and the application will identify the type of disease present. In this study, a method for detecting sigatoka disease in banana leaves was proposed (Tuazon, Duran & Villaverde, 2021). A total of fifty banana leaves affected by the disease were collected, and each leaf was photographed twice and subsequently stitched together. To eliminate the background, Otsu’s thresholding technique was applied. A confusion matrix was then utilized to analyze the gathered data, resulting in an accuracy of 96.15%. Aruraj et al. (2019) introduces a method to identify and classify diseases on banana plants using texture patterns. The uses two steps approach such as texture feature extraction with Local Binary Patterns (LBP) and disease classification with SVM and KNN. The technique was tested on the public dataset, which included two cases: healthy and black sigatoka and healthy and cordana leaf spot. In total, 123 images were collected. The SVM classifier had an accuracy of 89.1% and 90.9%.
A method of disease recognition for banana leaves by using LBP along with GLCM was presented for extracting features (Chaudhari, Dawoodi & Patil, 2022). These methods contrast with color-based feature extraction techniques and use SVM and K-NN classifiers. They diagnose diseases such as banana yellow sigatoka, bunchy top, and cucumber mosaic virus. Digital cameras, as well as smartphones, were used for capturing images in a natural agricultural environment. Here Mary, Singh & Athisayamani (2021) automatically classifying banana leaf diseases through Gabor feature descriptors technique is proposed. It uses Gabor filters to extract texture features from images of diseased banana leaves, which will then be analyzed and classified by ML algorithms.
The Compared ShuffleNet V2 CNN model was compared with SVM and KNN for image classification of the black Sigatoka infection in banana leaves is proposed (Yumang et al., 2023). Gathering samples from 30 healthy leaves and 30 black sigatoka-infected leaves. This CNN model gave 95% accuracy in classifying raw and augmented images obtaining 96.67% sensitivity rate and 93.33% specificity rate. The model was deployed on a Raspberry Pi prototype for testing, and its performance was tested against SVM and KNN; it proved to be effective in anomaly detection in agriculture.
In Syihad et al. (2023) CNNs and ML are used to classify banana plant illnesses based on images of the leaves. The VGG-19 and ResNet50 models are utilized, with the former achieving 91% accuracy, 88% precision, 91% recall, and 89% F1-score. The dataset comprises 936 photos. Banana leaves are classified into four groups: pestalotiopsis, sigatoka, cordana, and healthy. This dataset was sourced from the Kaggle website.
The proposed system (Chaudhari & Patil, 2023) uses ML to detect diseases in banana leaves, which involves image acquisition, preprocessing (contrast stretching and filtering), and picture segmentation using a genetic algorithm. Features are extracted using LBP. The technique utilizes the strength of several classifiers by combining their outputs using an ensemble method and applying a genetic algorithm for segmentation in a new way. The images were taken with 48 MP cameras on mobile phones. The image is 640 × 480 pixels in size. The ensemble model outperformed single classifiers like SVM, Naïve Bayes, and others with an accuracy of over 92%.
In Nayak et al. (2024) the RF-XG-ResNet50 ensemble DL classifier is introduced to automate banana leaf disease classification with a hybrid architecture, where an ensemble multi-architecture is combined to enhance the accuracy. Data augmentation has been used for better training and generalization. It has been tested with an accuracy of 95% against DT and SVM. The Kaggle public dataset is used for training. Table 3 explains the overview of ML-based techniques.
| Ref | Methodology | Dataset | Diseases | Performance matrix |
|---|---|---|---|---|
| Selvaraj et al. (2020) | RetinaNet, ResNet, CNN model |
UAV-MS images, captured using a MicaSense RedEdge multispectral camera with, Pix4Dcapture app. |
Xanthomonas Wilt and Bunchy Top Disease | Accuracy: 97% Recall: 92% Precision: 99 % |
| Saranya et al. (2020) | ANN algorithm, fuzzy c means clustering, thresholding method. | Private dataset of 60 images captured using digital camaras. | Black sigatoka, freckle and anthracnose | Accuracy: 96–97% |
| Tuazon, Duran & Villaverde (2021) | k-means clustering thresholding, HOG, SIFT |
Gathered diseased images by field survey. | Panama wilt, Bract Mosaic, Black Sigatoka, Bunchy virus, Banana bunchy top virus, Banana Streak, and Infectious Chlorosis. | Accuracy: 95% |
| Yathurshan et al. (2023) | Histogram based feature extraction techniques | 6,000 images, filed surveys. | Sigatoka and xanthomonas | Accuracy: 95% |
| Vidhya & Priya (2022) | KNN, SVM, Alexnet, K-KNN, SVM | 12,544 images using camera, Krishibhavan, Kazhakuttam, Trivandrum, Kerala, India. | Leafspot and Sigatoka | Accuracy: 76.49% |
| Chaudhari & Patil (2020) | SVM, K-means clustering, GLCM. | Field dataset using digital camera. | Bacterial wilt, Panama, sigatoka, cucumber mosaic virus | Accuracy: 85% |
| Yumang et al. (2023) | ShuffleNet V2 CNN, SVM, KNN |
Thirty samples of healthy and infected with Black Sigatoka. | Black Sigatoka | Accuracy: 95%, sensitivity: 96.67%, specificity: 93.33% |
| Raja & Rajendran (2022) | KNN, SVM, ANFI, and ANN | Private dataset, Images were captured using digital cameras. | Panama wilt, black sigatoka, bunchy top virus,streak disease, and Bacterial Wilt | Precision: 90% |
| Syihad et al. (2023) | ML with CNNs, ResNet50 and VGG-19 | Public dataset Kaggle website | Cordana, Sigatoka, and Pestalotiopsis | ResNet50 Accuracy: 94% recall: 91%precision: 88% VGG-19 accuracy: 91% F1-score: 89%, |
| Nayak et al. (2024) | RF-XG-ResNet50 ensemble DL, (DT) and SVM | Kaggle public dataset | Disease not classified | Accuracy: 95%. |
| Chaudhari & Patil (2023) | ML technique, genetic algorithm, local binary pattern, SVM, Naïve Bayes | Mobile phone camera with 48 MP resolution using 640 × 480 image size. | Streak virus, black and yellow sigatoks, cucumber mosaic virus, bunchy top virus, pitting | Accuracy: 92% |
In what ways does DL add to the complexity of identifying and classifying banana leaf diseases?
This method employs image segmentation to automatically detect diseases in banana plant leaves. It utilizes a collection of 9,000 images from the International Center for Tropical Agriculture (CIAT) banana image library to identify Black Sigatoka, Yellow Sigatoka, banana bacterial wilt, and healthy plants through the integration of hybrid fuzzy C-means clustering. For the preprocessing stage, median filtering and image resizing were applied. The Total Generalized Variation Fuzzy C-means clustering (TGVFCM) technique merges fuzzy C-means with Total Generalized Variation for effective segmentation. The TGVFCM, combined with a CNN, achieved an accuracy of 93.45%, specificity of 96.38%, and sensitivity of 89.04% is addressed (Gokula Krishnan et al., 2022). The study by Narayanan et al. (2022) used a hybrid CNN to identify illnesses in banana plant leaves. The dataset, collected from Tamil Nadu and the Tamil Nadu-Kerala border, comprised 3,500 images of healthy and damaged banana plants. Pre-processing techniques included median, low-pass, and high-pass filtering. SVM served as the classifier, while CNN was used for feature extraction.
The study (Ridhovan, Suharso & Rozikin, 2022) used 936 images of healthy and disease-infected banana leaves from the Kaggle website, collected by the remote sensing lab using a smartphone camera. Data preprocessing involved under-sampling, over-sampling, and data augmentation. DenseNet and Inception techniques were applied, achieving an F1-score of 84.62%, a recall of 84.73%, an accuracy of 84.73%, and a precision of 84.80%. Seetharaman & Mahendran (2022) developed an image-processing method for diagnosing diseases in banana leaves using 1,875 images from online and Indian farms. Pre-processed images were segmented, and features were extracted using Gabor-based patterns and a convolutional recurrent neural network (CRNN). The CRNN-RCNN model achieved a 98% accuracy, outperforming DCNN (88.9%), SVM (92.63%), KNN (79.56%), and CNN (87.6%).
Unveiled a novel agro-DL model (Sangeetha et al., 2023) aimed at recognizing the panama wilt disease. Utilized a set of 1,000 JPEG images. Pre-processing included rescaling and transforming the image. For segmentation, max pooling was implemented, for augmentation process cropping, flipping, rotating, and zooming the images was used. The proposed method attained a recall of 88.56%, an accuracy of 91.56%, a precision of 91.61%, and an F1-score of 81.56%. CNN architecture was presented (Bhuiyan et al., 2023) that has been improved using Bayesian optimization called BananaSqueezeNet. This architecture can identify three types of diseases in banana leaves. Moreover, the model can diagnose diseases affecting banana plants. A smartphone application was also developed for the identification of diseases. Data was collected from the experimental field as well as from various banana fields in Bangladesh. The 937 pictures have four categories: cordana, sigatoka, pestalotiopsis leaf blight disease, and healthy leaves. Augmentation techniques, including the Gaussian blur, horizontal flipping, image cropping, linear contrast modification, shearing, translation, and rotation, were used to address the problem of unbalanced data. CNN was used in the classification process. There were two different types of layers in the CNN: feature extraction layers and classification layers. The neural networks that use Bayesian optimization like SqueezeNet, MobileNets, EfficientNets, and ResNet, are used for image classification and object detection tasks. With a recall of 96.25%, precision of 96.53%, F1-score of 96.17%, specificity of 98.75%, and MCC of 95.13%, the model attains an overall accuracy of 96.25%.
The Ghost ResNeSt-Attention RReLU-Swish Net, based on ResNet50, Deng et al. (2024) uses a dataset of 13,021 banana leaf images to detect diseases. It achieved high detection rates: 96.42% for Sigatoka, 97.54% for cordana, and 95.58% for pestalotiopsis, with an overall accuracy of 98.38%. An application for smartphones for the identification of diseases in banana leaves, like fusarium wilt and black sigatoka, is outlined by Elinisa & Mduma (2024a). The 27,360 pictures were divided into three groups: black sigatoka, fusarium wilt, and healthy banana leaves. Mobile cameras were used to gather this image dataset from Tanzania. The programs VisiPics and Duplicate Photo Finder were utilized to identify and eliminate duplicate photos. In a matter of seconds, the suggested program could accurately detect duplicate images with 90% accuracy.
The study by Mathew, Kumar & Cherian (2023b) developed an automated approach by DL for classifying three major banana leaf spots: sigatoka, cordana, and deightonella. A Canon EOS 750D camera captures photography at the farms at Kerala Agricultural University (KAU). The third author, being a plant pathologist, supervised the data collection and labeling processes. The accuracy attained for DenseNet 121 was 91.7%.
This study (Banerjee et al., 2023) combined a mixture of CNN and SVM to help in disease diagnosis on banana fruit leaves. Using the photographs from both primary and secondary sources, the authors created a dataset of 1,100 images, which fall into four groups. The preprocessing steps come denoising and feature extraction using CNN, followed by disease classification of the leaves in SVM. This hybrid approach of CNN and SVM achieves performance accuracy of 94%. Authors in Tanwar, Sharma & Aanand (2023) used CNN and SVM techniques in network technology for the purpose of banana fruit leaf disease detection. It has utilized a big real-world data set of 1,100 images gathered from farms and online repositories. It targeted three types of banana disease: black sigatoka, cordana, and speckle disease. These types of disease classification were achieved by using SVM. The implemented methodology reached an accuracy across four different experimental scenarios of 90%, 95%, 89%, and 88%
An eight convolutional layered DCNN was proposed (Devi et al., 2022) to predict banana leaf disease. The public dataset Kaggle ML repository was utilized, consisting of 937 photos from the cordana, healthy, pestalotiopsis, and sigatoka disease categories. The training dataset was used by eight convolutional layered DCNNs. The same dataset was tested on models including MobileNetV2, DenseNet201, VGG19Net, InceptionV3Net, ResNet152, and NASNet. Large to determine performance metrics. 98.75% accuracy, 98.75% recall, 96.42% precision, and a 97.57% F1-score were attained.
In Singh, Guleria & Sharma (2024) was developed and deployed a CNN model that will identify and locate the banana leaves in images accurately. The images of bananas were collected from the online Kaggle repository. Preprocessing techniques like scaling, normalization, and augmentation were utillzed, and the model has convolutional layers to extract the features accurately and classify them. This method accurately determines diseases in banana leaves correctly for a success rate of 98.24% for 20 epochs.
The study by Bharathi Raja & Rajendran (2023) discusses a TL approach that incorporates a Faster R-CNN to support detection. The method uses all three different architectures: ResNet 50, InceptionV2, and MobileNet1. Haq et al. (2024) proposed a hybrid DL architecture named DenseMobilenetV2 that integrates the strong and reliable architecture of DenseNet121 with the efficient and accurate MobilenetV2. Data were gathered from Bangladesh, which consist of JPG images of 937 bananas, including samples of those infected by sigatoka, cordana, pestalotiopsis, and healthy samples. Color inversion, along with the data augmentation technique, has been used in pre-processing. The method adopted for using an outlier has been the IQR. And, the precision accuracy score generated was 100% on the model. F1-scores, along with recall accuracy, scored 0.9987 and 0.9974, respectively; those have been considered the optimum scores.
Faster RCNN, accompanied by Mohanraj et al. (2023) region proposal network in the detection of diseases for banana leaves. CNN has been used to extract feature extraction. The dataset for the research was sourced online through the website Kaggle.com. It contained both publicly available images and real-life photos. The diseases present are bacterial wilt, sigatoka, and pestalotiopsis. In addition, techniques involving image scaling and augmentation, like flipping, rotation, cropping, as well as scaling, are used. The accuracy reached was 0.9463.
The study by Sanga et al. (2020) developed a mobile application that uses five DL architecture models: Resnet18, Resnet152, Vgg16, Resnet50, and InceptionV3 are intended to detect illnesses in banana leaves. To implement the mobile version of this study, InceptionV3 was used in the mobile deployment. FUSI (Fusarium Sigatoka) Scanner is the name of the developed application. The models’ performances are as follows: InceptionV3 performed at 95.4%, Resnet18 attained 98.8%, Resnet50 likewise attained 98.8%, Resnet152 recorded 99.2%, and VGG16 attained 98.4% (Mora et al., 2024). A RedEdge MS camera, drone, and UAV imagery were used to photograph landscapes in Eastern Congo, facing challenges like low altitude and tall trees. Techniques for image augmentation addressed data imbalance, and DL algorithms like Yolo-V8 and Faster R-CNN detected banana stems infected with banana xanthonomas wilt. Sujithra & Ukrit (2022) published comparing the performance of banana and sugarcane leaf disease. Images were taken from the farm Acharapakkam of Chengalpattu District, Tamil Nadu. The camera used here is a Canon EOS 3000D, with a resolution of (512 * 512). This article used CNN, Feed Forward Neural Network (FFNN), and Radial Basis Neural Network (RBNN) for analysis. In addition, preprocessing techniques and classification models, which include CNN, were employed. The obtained performance metrics for banana and sugarcane were 97% accuracy, 89%, and 90% in sensitivity and specificity at 98%, 87%, 91%, 96%, 86%, and 92%, respectively. For the same data, accuracy was obtained at 95%, 88%, and 91% in sensitivity and specificity at 94%, 86%, 92% and 96%, 87%, and 94%, respectively. A lightweight CNN for fruit crop leaf disease detection was proposed (Hari & Singh, 2023) in, focusing on banana, guava, and mango leaves. With a dataset of 8,010 images, it achieved accuracies of 98.82%, 99.71%, and 97.41%. Also, the other study (Aliff et al., 2024) focused on the utilization of DL methods and aerial photography to detect banana plant diseases. Preprocessing, segmentation, feature extraction, classification, and picture acquisition are also included in this. 80.36% and 79.24% accuracy were achieved by the CNN. Figure 10 estimates the workflow of DL.
Figure 10: Workflow of banana leaf disease detection using DL technique.
DL technique Heap Auto Encoders (HAEs) (Mary, Robert Singh & Athisayamani, 2020) proposed, K-means algorithm used for segmenting the banana leaf, the Expectation-Maximization (EM) algorithm is also used. The two HAE functions utilized the dropout method and the ReLU activation function, utilizing the publicly available dataset. The diseases focused on are bunchy top, bacterial bright spot, and banana bacterial wilt. The accuracy achieved is 99.35% for real data. The study (Criollo et al., 2020) proposed a CNN to detect the diseases concerning banana leaves. The data had 623 images, which were stored in three classes which were black sigatoka, bacterial wilt, and healthy, in an online repository. The architecture started with AlexNet, which includes convolutional, max pooling, and dense layers.
The dataset is around 8,000 to 9,000 images, gathered from the repositories Mendeley and Kaggle (Vinta et al., 2025). There were three classes of images included Kaggle dataset sigatoka, xanthomonas, and green leaf. Panama diseases, including black and yellow Panama, are also mentioned in the Mendeley.
A multitude of modifications—crop rotation, reflection, scale, crop, color saturation, and noise—were performed. In this work, the You only look once (YOLO) algorithm is used to diagnose illnesses. With 900 gathered image samples, Jain et al. (2024) classified banana plant diseases into five severity levels using a technique based on ML. In this work, the CNN and DT were combined for training and evaluation purposes. Levels 0 through 5 also represented the non-symptomatic to highly affected stages of the disease’s severity. The overall performance reached an accuracy of 96.04%.
Here, a collection of 18,000 field images was gathered (Selvaraj et al., 2019) through a network of banana experts from Tamil Nadu Agricultural University (TNAU) in Southern India and Africa. The proposed system experimented with architectures such as ResNet50, InceptionV2, and MobileNetV1. These models were trained to identify various types of diseases and pests affecting banana plants. The research achieved an impressive classification accuracy ranging from 70% to 99%.
A DL method (Neupane, Horanont & Hung, 2019) identified and counted banana plants from UAV RGB images, achieving 99% recall despite challenges like lighting and overlapping leaves. Techniques used included the Triangular Greenness Index. Saleem, Potgieter & Arif (2019) analyzes the use of DL models, specifically CNN, for disease diagnosis. The model utilizes a dataset from Plant Village for training. The workflow comprises data collection, data cleansing, and CNN architecture model training, followed by the evaluation phase that gauges the model’s performance. The findings show that DL approaches perform better than conventional approaches.
The study (Baguisi, Buenaventura & Yumang, 2024) works with the CNN algorithm to detect black sigatoka infections in the banana leaf using IP. This analysis was done using the raw dataset for augmentation. The performance attained accuracy of 95%, specificity of 93.33%, and a sensitivity of 96.67% (Elinisa & Mduma, 2024b). Implemented the Mask R-CNN DL technique to handle disease detection and segmentation on banana plants. This method utilizes the model’s capability of instance segmentation, whereby the pixel level of the area that is afflicted with disease is accurately pinpointed. This is a way to mitigate the accurate and efficient automated methods of disease detection, which tend to be labor-intensive. The proposed technique attained a mean precision of 0.04529 while utilizing an image dataset of 6,000 stalks and banana leaves obtained from the field, and was able to achieve segmentation on the afflicted regions proficiently.
On the other hand, Altabaji et al. (2023) proposed a disease diagnosis method for banana leaf diseases—cordana, pestalotiopsis, and sigatoka using CNN through a set of images of 2,000 banana leaves. The best CNN architectures for feature excitation and disease identification are chosen based on the performance of three models namely MobileNet, Xception, and InceptionV3. The proposed method produced results that should be further explored, as it showed a validation accuracy rate of 96.24%, making it very plausible for exact and effective disease classification and detection of banana leaves. Sigatoka and xanthomonas are the banana leaf diseases that are classified using DL models, namely the ResNet-18 and ResNet-34 architectures (Anushya & Shiwani, 2024). Images of healthy and sick banana leaves with xanthomonas and sigatoka infections. The images were gathered from various fields of agriculture. ResNet-34 achieved 98.32% accuracy. This work (Nieto et al., 2024) compares two methods: combination of the Green Leaf Index, K-means clustering, and YOLOv5m DL model. The YOLOv5m model performed precision of 86% and recall of 90%. In the task of coverage estimation, U-Net architecture was used, which had an IoU of 52.3%.
The study (Jadhaw & Bhandari, 2024) employed DL models to detect banana leaf diseases early, using 1,000 images from Madhya Pradesh and Maharashtra. It focused on diseases like banana bacterial wilt and sigatoka disease. The YOLOv4 algorithm (Ibarra, Rivera & Manlises, 2023b) has been applied for detecting panama disease in banana leaves. Besides, the annotated dataset of 500 images of banana was collected from the Real-world plantations. It identifies the disease and locates with high accuracy and precision using the YOLOv4 DL model. The focused disease is panama disease. The primary algorithm (Rajalakshmi et al., 2025) using CNN, trained to recognize images of banana crops with or without disease was applied. Rectified Linear Unit (ReLU) activation functions are applied in all CNN layers. Cross-entropy loss and optimization algorithms by applied during the training process. The best performance of the model delivers 88.32% accuracy. The GLCM for feature extraction from texture and classification by using DCNN (Mahendran & Seetharaman, 2022) was applied.
The ResNext50 DL model to create an automated framework for the classification of the severity of sigatoka disease in banana leaves with 10,000 annotated images in the dataset Singh et al. (2024) was used. This has been done at 95.53 accuracy with rigorous preprocessing and fine-tuning. It has been validated using recall and F1-score metrics. The confusion matrix and graphical comparisons explain the model’s effective performance, forming a foundation for precision agriculture and sustainable crop management through automated disease evaluation.
A hybrid model Kumar & Kumar (2024) that predicts the severity of banana leaf wilt using CNN and SVMs: Using DL techniques, which are effective in providing an accurate diagnosis of the condition, the model is created using 10,000 image-labeled sets of banana leaves; data augmentation improves the feature with CNN that has already been trained. It was able to provide a thorough assessment of the disease’s severity with an accuracy of 94.77% using precision, recall, and F1-score metrics. When compared to other top models and current techniques, it fared better. The lightweight DL algorithms to identify banana leaf diseases from images collected in Arusha, Northern Tanzania, with a smartphone, producing 16,092 images (Nassor, Mushthofa & Priandana, 2024) was used. Out of the models experimented: MobileNetv2, MobileNetv3-small, ShuffleNetv2, and SqueezeNet, SqueezeNet gave the better performance by recording 97.12% accuracy, precision, recall, and F1-score. MobileNetv3-small has a faster training time; MobileNetv2 was the lightest of the algorithms.
Senthilraj & Parameswari (2022) using CNN and VGG16 models, create a DL model to recognize and categorize the stages of black sigatoka disease in banana leaves. The CNN model showed better results than VGG16. Table 4 give the DL method used. CNN and M-SVM are used by Yan, Shisher & Sun (2023) to diagnose banana diseases in one category, specifically xanthonomas, fusarium wilt, bunchy top virus, black sigatoka. A total of 3,500 leaf photos taken with cell phones equipped with VGA cameras from various locations in South India, particularly Tamil Nadu and the Kerala border, made up the dataset. During preprocessing, median filtering was used, and the system achieved 99% accuracy, outperforming comparable techniques in disease prognosis.
| Ref | Methodology | Dataset | Diseases | Performance matrix |
|---|---|---|---|---|
| Seetharaman & Mahendran (2022) | Histogram pixel localization, Gabor-based binary patterns, convolutional recurrent neural network, KNN, SVM | 1,875 photographs from farms and online repositories. | Disease not classified. | Accuracy: 98%, |
| Mathew, Kumar & Cherian (2023b) | Xception, MobileNet V2, Inception V3, and DenseNet 121, | Using the Canon EOS 750D camera, the dataset was collected from Kerala Agricultural university. | Sigatoka, Cordana, and Deightonella. | Accuracy: 91.7%. |
| Bhuiyan et al. (2023) | Bayesian Optimization-SqueezeNet, MobileNets, EfficientNets, and ResNet, CNN | 937 field images Bangladesh. | Pestalotiopsis leaf blight, Sigatoka, and Cordana | Accuracy: 96.25% Precision: 96.53% Recall: 96.25% Specificity: 98.75% F1-score: 96.17% MCC: 95.13%. |
| Banerjee et al. (2023) | CNN, SVM | 1,100 images from primary and secondary sources | Disease not classified | Accuracy: 94% |
| Mary, Robert Singh & Athisayamani (2020) | HAEs, K-means algorithm, the Expectation- Maximization (EM) algorithm |
Public datasets-Scotnelson, Godliver, Plant village project, and real datasets. | Bunchy Top, Bacterial Bright Spot, BBW | Accuracy: 99.35% |
| Mohanraj et al. (2023) | CNN FFNN RBNN |
Images from Acharapakkam farms in Tamil Nadu, captured by Canon EOS 3000D | Banana: Black Sigatoka, and Yellow Sigatoka. | Accuracy: 97% |
| Altabaji et al. (2023) | CNN architectures, including MobileNet, Xception, and InceptionV3, | 2,000 images from various fields. | Cordana, Pestalotiopsis, and Sigatoka | Accuracy: 96.24%, |
| Criollo et al. (2020) | CNN | online repository, 623 photos | black sigatoka, bacterial wilt, and healthy | Accuracy: 80–90% |
| Tanwar, Sharma & Aanand (2023) | CNN. SVM | 1,100 images from primary and secondary sources. | Black sigatoka, cordana, and speckle disease | Accuracy: 90% |
| Hari & Singh (2023) | VGG16, VGG19, InceptionResNetV2, Xception, DenseNet121, MobileNetV2, ConvNeXtBase ConvNeXtLarge, DenseNet169, DenseNet201, ResNet50, ResNet50V2, ResNet152, ResNet152V2, InceptionV3, |
Kaggle and Mendeley- public dataset | banana Cordana, healthy, Pestalotiopsis, Sigatoka, guava diseased, healthy, mango diseased, and healthy | Accuracy: Banana—98.82% Guava—99.71% Mango—97.41%. |
| Aliff et al. (2024) | CNN | 6,700 images from Malaysia and public dataset like github. using basic cameras and a DJI Tello drone. | Black/yellow Sigatoka, bacterial soft rot, Panama disease, aphid, stem weevil, | Accuracy of 80.36% and 79.24%. |
| Jain et al. (2024) | CNN and Decision Trees, K-fold cross-validation process | 900 image samples | Diseases not classified. | Accuracy: 96.04% |
| Selvaraj et al. (2019) | ResNet50, InceptionV2 and MobileNetV1 | 18,000 images from Bioversity International in Africa and Tamil Nadu Agricultural University. | Diseases not classified. | Accuracy: 70% and 99% |
| Baguisi, Buenaventura & Yumang (2024) | Image processing paired with Shufflenet V2 CNN Algorithm | Raw dataset collected from the agricultural fields. | Black Sigatoka | Accuracy of 95%, specificity of 93.33% and sensitivity of 96.67%. |
| Nassor, Mushthofa & Priandana (2024) | DL algorithms, MobileNetv2, MobileNetv3-small, ShuffleNetv2, and SqueezeNet. | Arusha, Northern Tanzania, with a Galaxy 01 smartphone, producing 16,092 images | Disease not classified | Accuracy: 97.12% |
| Neupane, Horanont & Hung (2019) | Triangular Greenness Index, Synthetic Color Transform, and Linear Contrast Stretch, DL model. | RGB photos taken by UAVs | Diseases not classified. | Accuracy: 99% |
| Elinisa & Mduma (2024b) | R-CNN DL model | 6,000 banana leaves and stalks collected from the field | Black Sigatoka, Panama Disease, Banana Bunchy Top Virus, and Anthracnose | Average precision (mAP) of 0.04529 |
| Elinisa & Mduma (2024a) | CNN model | Mobile cameras from farms located in Tanzania. Duplicate Photo Finder and VisiPics applications | Black sigatoka, fusarium wilt diseases | Accuracy: 90% |
| Anushya & Shiwani (2024) | DL models, ResNet-18, ResNet-34 | Capturing both healthy and diseased leaves sourced from various agricultural fields. | Sigatoka and Xanthomonas | ResNet-34 accuracy of 98.32% |
| Mora et al. (2024) | Yolo-V8 and Faster R-CNN | RedEdge MS camera, DJI Phantom 4 Pro UAV, a DJI-FC6310 RGB camera, and UAV (Unmanned Aerial Vehicle) imagery to capture landscapes in Eastern Congo. | Banana Xanthomonas wilt | Accuracy: 98%, |
| Kumar & Kumar (2024) | CNN, SVM | 10,000 labeled banana leaf, | Disease not classified. | Accuracy: 94.77% |
| Singh et al. (2024) | ResNext50 DL model, | 10,000 annotated images | Sigatoka disease | Accuracy: 95.53% |
| Ridhovan, Suharso & Rozikin (2022) | DenseNet, Inception methods |
GIS & Remote Sensing Lab Agricultural University in Bangladesh, by smartphone camera | Cordana, Sigatoka, and Pestalotiopsis | Accuracy: 84.73%, precision: 84.80%, recall: 84.73%, F1score: 84.62%. |
| Jadhaw & Bhandari (2024) | CNN and DL models AlexNet, ResNet-50, and VGG-16, region-based segmentation, optimal thresholding | 1,000 images were captured using mobile and VGA cameras and digital cameras in Madhya Pradesh and Maharashtra. | Banana Bacterial Wilt, Sigatoka Disease, Panama Disease, Leaf Spot Diseases, Nutrient Deficiencies | Accuracy: 99% |
| Gokula Krishnan et al. (2022) | CNN integrated hybrid fuzzy C-means clustering. | 9,000 images from International Centre for Tropical Agriculture (CIAT) banana image library. | Black Sigatoka, Yellow Sigatoka, BBW | Accuracy: 93.45%. Specificity: 96.38%, Sensitivity: 89.04% |
| Narayanan et al. (2022) | Hybrid CNN, SVM, median filtering |
3,500 field images across Tamil Nadu, VGA cameras in mobile devices, digital cameras, and DSLRs | Disease not classified. | Accuracy: 99% |
| Deng et al. (2024) | Ghost ResNeSt-Attention RReLU-Swish Net (GR-ARNet) | 13,021 leaf images on Kaggle website, including 983 images of banana leaves from Jieyang City, Guangdong Province, China, taken with a Sony ILCE-5100L camera. | Sigatoka, Cordana, and Pestalotiopsis diseases | Accuracy: 98.38%. |
| Bharathi Raja & Rajendran (2023) | CNN and VGG16 models | 16,092 banana leaf and stem images from farms across Tanzania, Arusha, Dar es Salaam, Kagera, Kilimanjaro, and Mbeya, collected | Black Sigatoka disease | Accuracy: 80.36% and 79.24%. |
| Yan, Shisher & Sun (2023) | CNN and Multivariate Support Vector Machine | 3,500 plant leaf images captured with VGA camera-equipped mobile phones, was collected from Tamil Nadu and Kerala border | Xanthomonas Wilt, Fusarium Wilt, Bunchy Top Virus, Bacterial Wilt | Accuracy: 98%, |
What kind of impact does TL have on the process of detecting and classifying banana leaf diseases?
Deep CNN combined with TL to detect the fusarium wilt of banana plants (Derafi, Razak & Sayeed, 2024) was proposed. In this regard, ResNet-50 was used, and a TL is applied in it to enhance its precision as well as efficiency. A total of 500 test images consisting of healthy and diseased parts were used. The accuracy is recorded at 0.98 and the F1-score is at 0.98.
Salehin, Islam & Alam (2024) applied TL for the disease identification of the banana leaf. Besides that, pre-trained models, EfficientNet, AlexNet, VGG, and ResNet, were also tested with the diseases. The dataset is obtained from the Plant Village, Nelson Mandela dataset, with 17,068 images of banana plants, and the PSDF- Musa. A total of 54,303 images of 14 types of crops were used. Among them, the data preprocessing techniques involve methods such as torchvision. transforms.resize for resizing and e-transforms. ToTensor() for normalization of pixel values, with transforms. Normalize normalizing data. The accuracy and the F1-score are also more than 90% and 0.90%.
TL-based (Genet et al., 2024) is proposed to automatically identify banana diseases. A dataset of 17,068 labeled images was compiled using the AdSurv mobile application on Samsung phones for taking pictures of banana leaves and stems. Researchers from the African Institution collaborated with the Tanzania Agricultural Research Institute. This comparison study on the performances of such models as VGG19, NasNetLarge, Inception ResNet V2, and Xception found that the model Xception is the best since it achieved a classification accuracy of 98.062%. A robust disease detection model is developed (Priya et al., 2024) using CNN algorithms to classify and identify diseases in banana plants. The dataset comprises 1,982 photos, all of which have been affected by banana diseases. The images are categorized into three groups: healthy, xanthomonas wilt infected, and sigatoka leaf spot infected. Using data augmentation and TL techniques that are high-end, the architecture of models was fine-tuned using MobileNet, EfficientNet, VGG16, VGG19, and InceptionV3. Amongst them, the VGG16 model performed excellently well and successfully withstood independent test datasets with 81.53% accuracy. A DenseNet201Plus model was created (Mazumder et al., 2024) to identify banana leaf diseases, achieving 0.9012 accuracy and precision, 0.9012 recall, and 0.9716 AUC. It was trained on healthy, sigatoka, and xanthomonas leaf classes, using data from Mendeley Data and enhanced through rotation, flipping, and scaling.
A fused nine pre-trained CNNs (Shafik et al., 2024), including ResNet, DenseNet, and EfficientNet, with deep feature extraction to build Plant Disease Detection Network—AutoEncoder (Early Fusion (PDDNet-AE)) and Plant Disease Detection Network—Lead Voting Ensemble (PDDNet-LVE) models. The experiments on the PlantVillage dataset, containing 54,305 images organized in 15 categories, validated their claims of superior performance. PDDNet-AE reached an accuracy of 96.74%, and PDDNet-LVE outperformed it at 97.79%, surpassing other CNN models.
The author (Huang et al., 2024) uses DL to enhance the detection of banana leaf diseases to improve agricultural productivity and banana quality. It employs a multi-layer self-attention mechanism on top of the VGG16 model, which acts as the base architecture. The dataset image was captured using a smartphone camera at Bangabandhu Sheikh Mujibur Rahman Agricultural University and surrounding banana farms. Which contains images of both diseased and healthy banana leaves, along with three prominent leaf spot diseases: cortana, pestalotiopsis, and sigatoka, all annotated by plant pathologists with 400 images added to each class for comprehensive analysis. By adding the self-attention mechanism layer, the model accuracy was increased from 89% to 92%. A CNN was used (Arifin, 2025) to classify banana leaf diseases, healthy, fusarium wilt, sigatoka from 1,289 images. Data augmentation techniques improved generalization. GoogleNet achieved accuracies of 90.59% for Healthy Leaves, 90.30% for Fusarium Wilt, and 90.49% for Sigatoka.
Nasra & Gupta (2024) uses a CNN model based on ResNet50 to identify banana leaf diseases, achieving 96% accuracy across 937 images. The model effectively classifies cordana, healthy, pestalotiopsis, and sigatoka, with strong performance metrics for each category. Tiwari (2024), suggested the ViT techniques, such as ViT-b16 and ViT-l16, for classifying banana leaf diseases. These models were trained and tested with 408 banana leaf images which were categorized into seven classes of diseases which included: healthy leaf, black sigatoka, bract mosaic virus disease, insect pest diseases, panama disease, moko disease, and yellow sigatoka. Also, the accuracy obtained 96.88% arose from ViT-b16 outperforming all other deep architectures including GCN, EfficientNet-B3, MobileNet-V2, and ResNet-cut.
In Saini (2024) image classification settles on the Vision Transformer (ViT) model to classify various diseases afflicting the banana leaf and achieves an astounding accuracy of 96.88% at epoch 100 is noted. The dataset was collected through Kaggle and comprised of 408 images from farmers’ fields, which was later expanded to 2,856 images using flip, zoom and brightness increase techniques. The model accurately identified the damages done due to mosaic virus, black sigatoka, moko disease, panama disease and yellow sigatoka with very few instances of misclassification.
In this study, Sharma & Vishwakarma (2024) suggests a ViT-based approach to classify the leaves of banana plants diseases. Unlike traditional plant monitoring methods, which are laborious and human-dependent, computer vision techniques provide an efficient solution. Vision transformers tend to perform better on real-world crop field images by looking at global patterns rather than only local regions. The proposed model achieved 90% accuracy on a dataset from Maland University, Karnataka, India, which comprises over 7,000 images of banana plant leaves affected by deficiencies in eight unique nutrients. The Convolutional Swin Transformer (CST) model, proposed in Guo, Lan & Chen (2022) 2022 for detecting plant diseases, achieved high accuracy (up to 0.982) even in noisy conditions. It used a dataset of 1,288 banana leaf images and employed data augmentation to prevent overfitting, outperforming other models in real-life agricultural scenarios. Table 5 illustrates the TL-based approaches.
| Ref | Methodology | Dataset | Diseases | Performance matrix |
|---|---|---|---|---|
| Nasra & Gupta (2024) | ResNet50 architecture | 937 images with three disease classes, from Kaggle public repository. | Cordana, Pestalotiopsis, and Sigatoka | Precision: 100%, 96%, 97%, 95% Recall: 95%, 98%, 97% F1-score: 97%, 96%, 96% For all the four disease classes |
| Shafik et al. (2024) | PDDNet-AE (early fusion) and PDDNet-LVE (lead voting ensemble) models fused with pre-trained CNNs, including ResNet, DenseNet, and EfficientNet, with deep feature extraction to | 54,305 images, the PlantVillage dataset is organized in 15 categories. | Disease name not mentioned. | Accuracy of 96.74% |
| Huang et al. (2024) | VGG16 model | Three diseases class with 400 images gathered from (Bangabandhu Sheikh Mujibur Rahman Agricultural University) and surrounding banana farms. | Cortana, Pestalotiopsis and Sigatoka | Accuracy: 92% |
| Arifin (2025) | GoogleNet | The dataset contains 1,289 images categorized into three disease classes: healthy leaves, fusarium wilt, and sigatoka. | Fusarium wilt, sigatoka disease | Accuracy: Healthy leaf: 90.59%, Fusarium Wilt: 90.30%, Sigatoka: 90.49%. |
| Tiwari (2024) | ViT models, such as ViT-b16 and ViT-l16 | 408 banana leaves images with Seven diseases: Healthy Leaf, Black Sigatoka, Bract Mosaic Virus Insect Pest, Panama, Moko, and Yellow Sigatoka. | Leaf, Black Sigatoka, Bract Mosaic Virus, Insect Pest Diseases, Panama, Moko, and Yellow Sigatoka. | Accuracy: 96.88% |
| Saini (2024) | Vision Transformer (ViT) model | 408 images sourced from Kaggle online repository. | Mosaic Virus, Black Sigatoka, Moko Disease, Panama Disease and Yellow Sigatoka | Accuracy: 96.88% |
| Sharma & Vishwakarma (2024) | Vision Transformer (ViT) model | 7,000 images were collected from Maland University, Karnataka. | Disease name not mentioned. | Accuracy: 90% |
| Guo, Lan & Chen (2022) | Convolutional Swin Transformer (CST) | The 1,288 images of three disease classes of healthy, xanthomonas and sigatoka. | xanthomonas and sigatoka. | Accuracy: 90.9–92.2% |
| Salehin, Islam & Alam (2024) | TL model, EfficientNet, AlexNet, VGG, ResNet |
Plant Village, the dataset from Nelson Mandela (African Institution of Science and Technology, with 17,068 images of banana plants, and the PSDF- Musa. 54,303 images leave of 14 types of crops | Black Sigatoka and Fusarium Wilt Race 1 | Accuracy: 90% F1-score 90%. |
| Genet et al. (2024) | VGG19, NasNetLarge, Inception ResNet V2, Xception. |
17,068 labeled images were taken AdSurv mobile application on Samsung phones to photograph banana leaves and stems | Black Sigatoka and Fusarium Wilt Race 1. | Accuracy: 98.062%. |
Discuss the model limitations and failure cases?
To identify banana black sigatoka disease, the study (Kayanja et al., 2024) developed a CNN-based approach by applying techniques such as saliency maps, SHAP, and Gradient-weighted Class Activation Mapping (Grad-CAM). The decision-making model can be employed to clarify the results observed. This methodology leverages the ResNet-18 model along with a unique CNN-based model, which surpasses existing techniques and promotes responsible AI in disease detection.
Bharath, Hemalatha & Sreekumar (2025) uses Global Average Pooling (GAP)-based CNN model on the Banana LSD dataset for the identification of diseases in banana leaves. The model achieved a test accuracy of 74.71%. XAI strategies such as Grad-CAM and SoftMax confidence analysis have revealed important aspects of model explainability. As observed in the Grad-CAM heatmaps, CNNs tend to fixate on biologically meaningful spots and dark patches associated with the disease, which reveals a degree of misclassification. Moreover, SoftMax outputs showed a lack of confidence between classes such as Healthy and Pestalotiopsis, which are visually analogous to each other.
Ünal (2024) introduces the Banana Leaf Spot Diseases (BananaLSD) Dataset as a response to the growing concern of banana leaf spot diseases and its consequences on food security, a systematically assembled dataset that consists of 1,600 augmented and annotated images of the most common three banana leaf spot diseases—sigatoka, cordana, and pestalotiopsis—along with healthy banana leaves and focuses on DL. The classification accuracy of DL models DenseNet-201, EfficientNet-b0, and VGG16 was evaluated through accuracy, precision, recall, F1-score, and confusion matrix calculations. The performance attained by DenseNet-201 is 98.12% accuracy, followed by 97.81% VGG16, and then EfficientNet-b0 with 87.81% accuracy. The use of Grad-CAM visualizations is used to validate model predictions and highlights the diseased regions on the images.
Model interpretability and explainability are essential for creating trustworthy and actionable AI solutions in agriculture, although minimal research has focused on these aspects concerning banana leaf disease detection. The transparency of model decision-making has been somewhat neglected in academic discussions, especially when compared to the focus on improving DL architectures and increasing classification accuracy. To illustrate feature significance and identify disease-impacted regions on banana leaves, several key advancements have utilized XAI methods such as Grad-CAM, saliency maps, SHAP, and Local Interpretable Model-agnostic Explanations (LIME). Although they are currently uncommon, these initiatives are essential for enhancing the transparency, reliability, and effectiveness of AI-based diagnostics for banana plant leaf diseases. These studies provide a valuable understanding for building user trust and aiding informed decision-making in precision agriculture by emphasizing interpretability alongside performance metrics. The study by (Jiménez et al., 2025) analyzed EfficientNetB0, ResNet50, and VGG19 on the classification of diseases in banana leaves; here, the DL models had recurrent miscalculation of the images as black sigatoka, cordana, and healthy leaves. ResNet50, for example, miscalculated 16 of 60 images processed as black sigatoka leaves. Despite the models achieving above 88% accuracy, there was severe miscalculation, especially between Cordana and Black Sigatoka. MobileNet and AlexNet were other models attempted, but because of overfitting, they only achieved 33% accuracy and were discarded. The researcher (Helmawati & Utami, 2025) trained MobileNetV2 on classifying four classes of banana leaf diseases, achieving 90.62% accuracy. The dataset imbalance leads to low learning in (45.26% accuracy at epoch 1), performance on images taken in different lighting. Due to the absence of the confusion matrix, class-wise evaluation, and class accuracy evaluation, results, the dataset was deemed unreliable for application in multiclass situations. The dataset used in the research (Escudero, Calvo & Bejarano, 2022) contained 937 images, which were imbalanced because they contained mostly images of sigatoka, leading to poor accuracy in less represented classes such as cordana and healthy. The model accuracy attained 90.62%, but no other metrics, such as precision, recall, or F1-score, were used, which makes the performance interpretation limited. The model is built on MobileNetV2 alone, which is a sharp contrast to other DL models like ResNet or even traditional models.
The accuracy of the study (Sholehah & Siti, 2021) is constrained by a very small dataset consisting of just 48 images, which heightens the model’s risk of overfitting and restricts its ability to generalize. The model’s accuracy is also likely overestimated due to the absence of external validation and dependence solely on cross-validation, which ultimately limits the model’s real-world applicability.
The accuracy of classification achieved by the proposed (Deng et al., 2024) method is quite high. The model incorrectly classifies many banana leaf diseases, including Sigatoka, Cordana, and Pestalotiopsis. This is primarily because the yellow halos and certain shaped lesions associated with these diseases are quite common. The model suffers from a lack of real-world robustness to occlusion, motion blur, and low lighting conditions, which is not well-covered in the training data. Reliance on augmented data from within the training set creates a scenario in which the model performs well in a limited set of conditions, but generalizes poorly to episodic field and outdoor unpredictability. Moreover, the model does not automate the delineation of the regions of interest within the leaf, further hampering relevant application to the integrated diseased tissue management. Genet et al. (2024) suffers from two primary issues. The key problems stem from the restricted geographical and spatial range of the dataset, which consists of 1,982 images from specific areas in Ethiopia. This limitation increases overfitting in the model due to insufficient diversity in the training set and affects the model’s ability to generalize. Additionally, the model does not incorporate XAI methods, leading to a lack of clarity in its predictions, which diminishes the reliability of the findings for practical agricultural applications.
Helmawati & Utami (2025) was limited in size and imbalanced, consisting of merely 937 images. This severely restricted the model’s ability to generalize and heightened the chance of bias favoring the dominant classes. Additionally, the model’s practical credibility is empirically compromised by the lack of real-world or external validation. Testing solely with one Kaggle dataset does not suffice; the model’s dependability cannot be asserted across a diverse range of field conditions.
In the study, Chong et al. (2025), two notable failure cases were reported. In the first case, SqueezeNet showed signs of overfitting with high training accuracy but poor validation consistency. This is likely the result of underwhelming available training data combined with overfitting and a lack of model flexibility. In the second case, all three models exhibited low F1-scores in classifying Fusarium wilt. This, most likely, stems from the disease’s high rates of incorrect identification due to a lack of prominent visual features. Alanazi (2025) suffers from class imbalance, where the overrepresented class, potassium deficiency, dominates the dataset, which deteriorates precision and recall for the underrepresented classes, like Panama disease and healthy leaves. Moreover, some diseases with high visual resemblance, for example, black sigatoka and potassium deficiency, tend to be misclassified heavily. Other notable restrictions include the absence of dataset diversity grounded in real-world environments, no comparative analysis with other object detection systems, and the lack of a clearly defined practical field-use deployment plan. Derafi, Razak & Sayeed (2024) described two key limitations. First, all the pre-trained models underwent training for only ten epochs. Moreover, all the models had a constant learning rate of 0.1, which is highly likely to hinder convergence, particularly for more complex models. Additionally, limited tuning of weak hyperparameters stifled the possibility of further optimization. Lastly, models achieving high accuracy in offline tests is not ideal in the absence of evaluation or deployment to real-time platforms such as mobile or edge devices. This practical absence, means the model is not useful in agricultural situations that require immediate action. Numerous limitations have been identified in the reviewed studies.
RQ: 2. What type of data preprocessing techniques are applied in detecting and classifying banana leaf disease?
The approaches used for image analysis preprocessing differ in the manner of data quality improvement and feature extraction efficiency. Data augmentation approaches such as histogram equalization and median filtering (Yan, Shisher & Sun, 2023; Narayanan et al., 2022; Raja & Rajendran, 2023; Chaudhari & Patil, 2023; Saranya et al., 2020; Tanwar, Sharma & Aanand, 2023; Hari & Singh, 2023), improve image quality through noise reduction, contrast enhancement, and analysis-appropriate adjustments. Figure 11 illustrates the overview of preprocessing techniques. More advanced techniques like Gabor feature descriptor (Elinisa et al., 2025) and SIFT (Thiagarajan et al., 2024) increase model predictions by identifying relevant patterns and features of the image. It is also noted that image enhancement is very crucial. Other techniques that help enhance the image include improving contrast in low-contrast areas using Contrast Limited Adaptive Histogram Equalization (CLAHE) (Abisha & Bharathi, 2023). The need to ensure all images are of the same size for model training is therefore achieved using resizing (Mary, Singh & Athisayamani, 2021; Mathew, Kumar & Cherian, 2023a; Tuazon, Duran & Villaverde, 2021; Mary, Robert Singh & Athisayamani, 2020; Raja & Rajendran, 2023; Jianqing et al., 2022a). Background removal (Lin et al., 2021; Bhuiyan et al., 2023) and image conversion from RGB to (Y-Luma, Cb-Chroma blue-difference, Cr-Chroma red-difference) YCbCr color space (Deenan, Janakiraman & Nagachandrabose, 2020; Thiagarajan et al., 2024) shifts focus from irrelevant features and details. For dataset management purposes, Pix4DMapper (Thomas & David, 2023) aids in mapping and data processing while VisiPics and Duplicate Photo Finder take care of duplicate images, cropping, along with image renaming, helps prepare the dataset for analysis. Table 6 explains the preprocessing techniques. These preprocessing techniques ensure that the models can be trained with precise analyses and images.
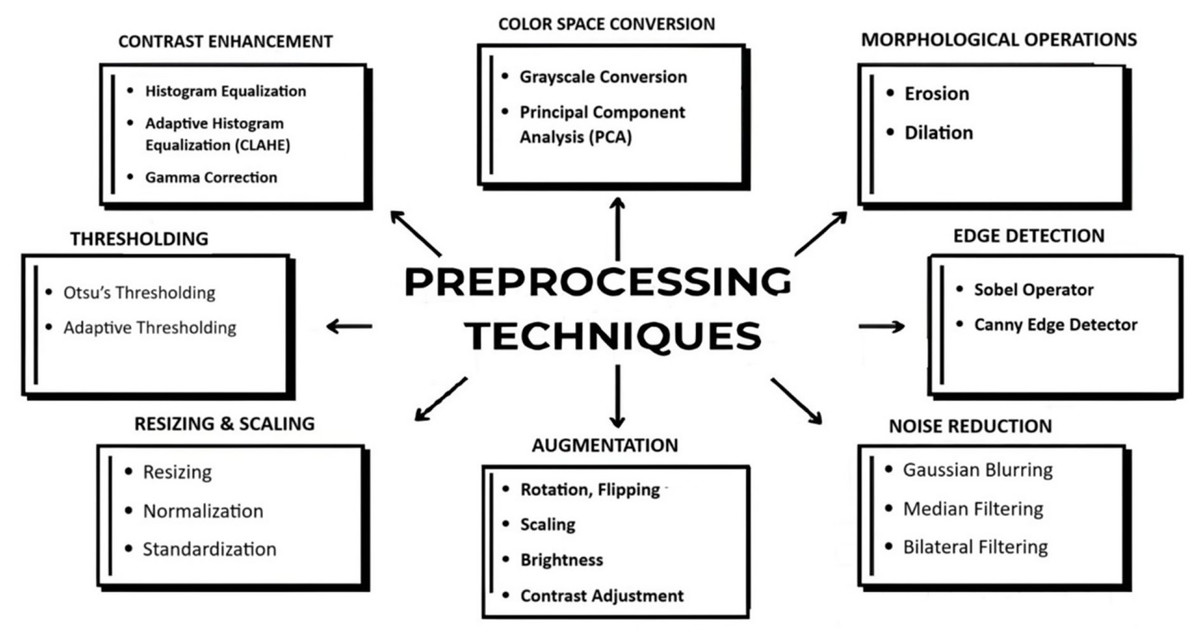
Figure 11: Overview of preprocessing techniques.
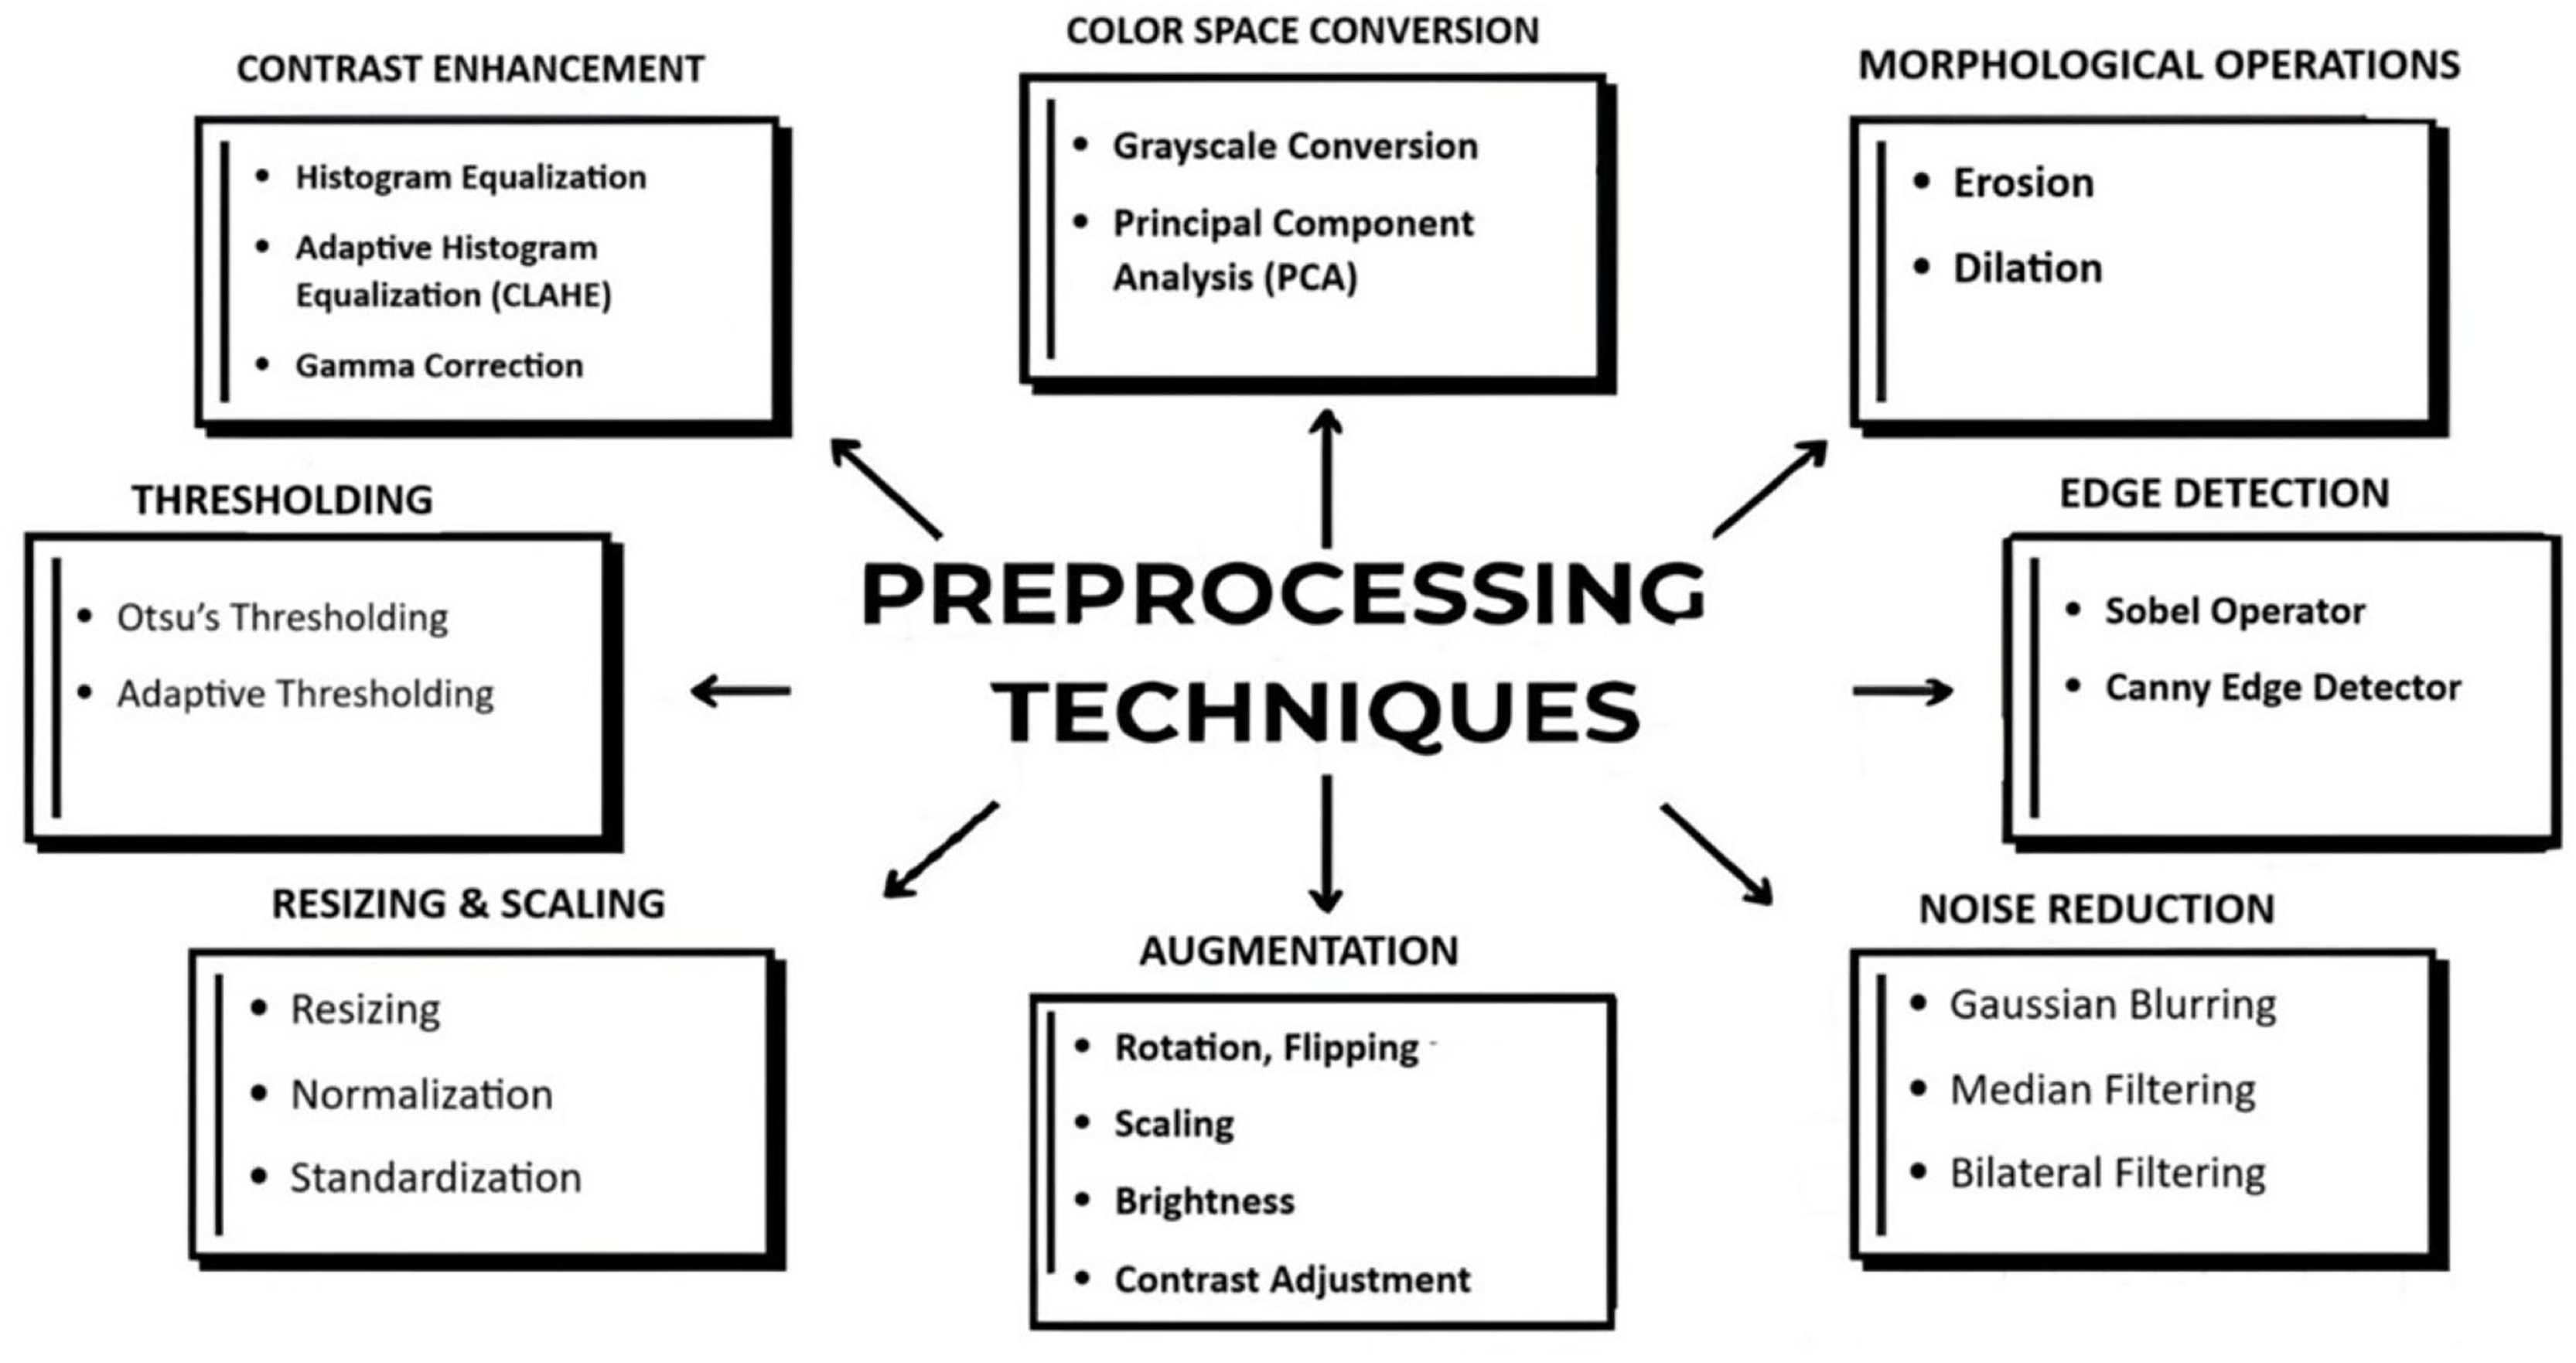
RQ: 3. What are the private and public datasets available? Highlight the public dataset’s weakness?
The absence of in-field datasets is one of the main obstacles. Even though there are not many datasets in these databases, certain datasets have recently been made public by scientific researchers. Here is a summary of the key challenges and possible directions for future research. The dataset includes detecting and classifying banana diseases from various private and public sources across multiple countries. Agricultural institutions, fieldwork, and university surveys in India, China, Taiwan, Bangladesh, and Africa have private compilations that capture diseases of black sigatoka, fusarium wilt, xanthomonas wilt, bunchy top virus, alongside various bacterial infections. Numerous public sites, such as PlantVillage and GitHub, have extensive collections of images, especially from Africa and Malaysia. Some datasets cited also combine both private and public sources for greater comprehensiveness. Data is collected with mobile phones, DSLRs, VGA Cameras, and lab equipment in order to analyze disease thoroughly across a variety of settings. Tables 7 and 8 give the information about the dataset.
| Ref | Total. no. of. image | Disease | Disease classes | Location |
|---|---|---|---|---|
| Selvaraj et al. (2020) | 2,753 | Banana Xanthomonas Wilt, bunchy top virus |
Four classes of healthy plants (599), healthy banana clusters (705), Banana Xanthomonas Wilt infected (922), and bunchy top virus (583) | Democratic Republic of Congo, Republic of Benin, Africa |
| Gokula Krishnan et al. (2022) | 9,000 | Black Sigatoka, Yellow Sigatoka, bacterial wilt | Five classes of diseases like Black Sigatoka, bacterial wilt, Yellow Sigatoka, Dry old leaves, Healthy plant with 700 images. | International Centre for Tropical Agriculture (CIAT) banana image library, America |
| Huang et al. (2024) | 400 | Cordana Pestalotiopsis and sigatoka | Three disease classes: healthy leaves, Cordana Pestalotiopsis and sigatoka | Bangabandhu Sheikh Mujibur Rahman Agricultural University and surrounding banana farms. |
| Aasha Nandhini et al. (2023) | 5,500 | Bunchy top, sigatoka leaf spot |
Disease classes not mentioned. | ICAR NRCB in TiruchirapalliThadiyankudisai, KC Patti, Muthalapuram, Suruli Patti, and Kambam, India |
| Bhuiyan et al. (2023) | 973 | Pestalotiopsis leaf, BS, Cordana | Four classes of Pestalotiopsis (133), sigatoka (433), cordana (122). | Bangabandhu Sheikh Mujibur Rahman Agricultural University (BSMRAU), Bangladesh |
| Ye et al. (2020) | 120 | Banana Fusarium wilt | Healthy leaves (57), infected leaves (63) | Guangxi site is located in Long’an County, Guangxi Province, and Hainan site is located in Chengmai County, Hainan Province, China |
| Elinisa & Mduma (2024a) | 27,360 | Black sigatoka, fusarium wilt | Three classes of healthy leaves, black sigatoka, and fusarium wilt. | Arusha, Kagera, Kilimanjaro, Mbeya, and Dar es Salaam in Tanzania, East Africa |
| Narayanan et al. (2022) | 3,500 | Healthy and infected leaves | Two classes of healthy and infected leaves. | Madurai, Dindigul, Virudhunagar, Tirunelveli, Tuticorin, Nagercoil, Kanyakumari in Tamil Nadu and Kerala border, India |
| Ridhovan, Suharso & Rozikin (2022) | – | Cordana, Sigatoka, Pestalotiopsis |
Four classes of healthy, Cordana, Sigatoka, Pestalotiopsis affected leaves. |
GIS & Remote Sensing Lab at Sheikh Mujibur Rahman Bangabandhu Agricultural University, Bangladesh |
| Mora et al. (2024) | – | BXW | Disease class not mentioned. | Landscapes in Eastern Congo, Africa |
| Thirumeninathan, Vijayalakshmi & Palathara (2024) | 3,500 | Banana fusarium wilt, Yellow Sigatoka, and Black Sigatoka | Disease class not mentioned | Southern regions of Tamil Nadu, India |
| Haq et al. (2024) | 937 | Sigatoka, Cordana, Pestalotiopsis | Disease class not mentioned. | Bangabandhu Sheikh Mujibur Rahman Agricultural University, Bangladesh |
| Ashoka et al. (2024) | – | Cordana, Black Sigatoka, Pestalotiopsis, and Fusarium wilt | Disease class not mentioned | Banana Dataset Tanzania (BDT), East Africa |
| Priya et al. (2024) | 1,982 | Xanthomonas Wilt infected, and Sigatoka leaf spot infected | Disease class not mentioned | Arbaminch Zuria Woreda (Lante and Chano kebele) and Gamugofa zone (Mierab Abaya Woreda, Omolante kebele), Ethiopia |
| Nandhini et al. (2021) | 632 | Banana Bacterial Wilt, Black Sigatoka healthy leaves | Banana Bacterial Wilt (360), Black Sigatoka (43), Healthy leaves (360) | Tamil Nadu, India |
| Jianqing et al. (2022b) | 100 | Grey leaf spot disease and BS leaf spot disease | Disease class not mentioned. | Hainan University’s Danzhou campus, China |
| Jadhaw & Bhandari (2024) | 1,000 | Banana Bacterial Wilt,Black Sigatoka, Panama Disease, Leaf Spot, Nutrient Deficiencies. | Disease class not mentioned. | Madhya Pradesh and Maharashtra, India |
| Nassor, Mushthofa & Priandana (2024) | 16,092 | Disease name not mentioned | Disease class not mentioned | Arusha, Northern Tanzania, Tanzania |
| Vidhya & Priya (2022) | 12,544 | Leafspot, Sigatoka | Disease class not mentioned | Krishibhavan, Kazhakuttam, Trivandrum, Kerala, India |
| Choosumrong et al. (2023) | 67 | Disease name not mentioned | Disease class not mentioned | Regions of Bang Krathum district, Phitsanulok Province, China |
| Mathew, Kumar & Cherian (2023b) | – | Black Sigatoka, Cordana, and Deightonella. | Disease class not mentioned | Kerala Agricultural University (KAU), India |
| Ugarte Fajardo et al. (2020) | – | Black Sigatoka | Disease class not mentioned | 100 plants, grown for 3–4 months in a greenhouse, were transported to the Centro de Investigaciones Biotecnológicas del, Ecuador. |
| Senthilraj & Parameswari (2022) | 16,092 | Black sigatoka | Disease class not mentioned | Farms across Tanzania’s regions of Arusha, Dar es Salaam, Kagera, Kilimanjaro, and Mbeya, Tanzania |
| Dat, Hai & Thinh (2019) | 900 | Disease name not mentioned | Disease class not mentioned | Taiwan |
| Yathurshan et al. (2023) | 8,000 | Sigatoka and zanthomonas | Disease class not mentioned. | Filed surveys, agricultural records and expects consultations |
| Aliff et al. (2024) | 6,700 | Black Sigatoka, banana stem weevil, bacterial soft rot, Panama disease, yellow Sigatoka, banana aphid, | PRIVATE DATASET: Healthy leaves (200), leafspot (250), sigatoka (200). Public dataset: Healthy leaves (45), leafspot (200), sigotoka (320) |
Banana plantations Malaysia and public datasets like GitHub, Malaysia |
| Yan, Shisher & Sun (2023) | 3,500 | Xanthomonas, Fusarium Wilt, Bunchy Top Virus, Bacterial Wilt | Disease class not mentioned | Tamil Nadu and Kerala border, India |
| Jianqing et al. (2022a) | 100 | Grey leaf spot disease and BS, leaf spot disease | Disease class not mentioned. | Hainan University’s Danzhou campus, China |
| Selvaraj et al. (2019) | 18,000 | Banana Xanthomonas wilt, Bacterial Fusarium Wilt, Black Sigatoka, Yellow Sigatoka, bunchy top virus | Healthy leaves (2,583), Banana Xanthomonas wilt (842), Black Sigatoka(980), Yellow Sigatoka (1,066), Bacterial Fusarium Wilt (967), Dry and Old Leaves (2,562), | Bioversity International (Africa) and Tamil Nadu Agricultural University (TNAU, Southern India), India |
| Ref | Total. no. of. image |
Disease | Disease classes | Location |
|---|---|---|---|---|
| Mazumder et al. (2024) | – | Sigatoka diseased leaves, and Xanthomonas diseased | Three classes: healthy plants, Sigatoka diseased leaves, and Xanthomonas diseased leaves | Public repository: Mendeley Data. |
| Shafik et al. (2024) | 54,305 images, | Disease name not mentioned. | 15 types of plant leaves. | Public repository: PlantVillage dataset. |
| Arifin (2025) | 1,289 | Three disease classes, Healthy (155 images), Fusarium wilt (814), and Sigatoka (320 images | Fusarium wilt and sigatoka disease | Public repository: Mendeley Data. |
| Salehin, Islam & Alam (2024) | 17,068, 54,303 |
Black Sigatoka and Fusarium Wilt | Healthy leaves (5,883), black sigatoka (6,147), Fusarium Wilt (5,038) | Plant Village, the Nelson Mandela dataset (African Institution of Science and Technology, and PSDF-Musa, Africa |
| Arman et al. (2023) | 700 | Fusarium wilt, Moko, Bunchy top | Disease class not mentioned. | BananaVision-doi: PlantVillage dataset-private dataset gathered from the field banana farms, Philippines |
A number of available datasets on the diseases of banana have images of the various parts of the banana plant, like the leaves, stems, the fruits. In this study, only the images of the diseased banana leaves were addressed. A prominent restriction noticed is that no single dataset has all the various classes of diseased leaf images, and a number of classes have very few images, rendering a balanced representation impossible. This fragmentation illustrates the pressing need for an all-inclusive dataset that would have a wide variety of banana leaf diseases and sufficient image samples in every class. The Banana LSD dataset (Bhuiyan et al., 2023; Arman et al., 2023) and the banana leaf disease images datasets have a very few disease classes, typically between two and three. While these datasets serve specific purposes, they lack agriculturally important but rarer diseases. The narrow class diversity hampers the model’s ability to adapt and generalize to a broader set of real-world contexts. Datasets like BananaLSD (Bhuiyan et al., 2023; Arman et al., 2023) and the Banana and Banana Leaf Dataset showcase significant class imbalance or an inadequate number of images per class. Such an imbalance skews learning, since models tend to accurately predict the dominant classes while neglecting most of the minority categories, which adversely impacts classification accuracy and generalization. Exclusion of Rare or Emerging Diseases. Within the reviewed datasets, rare or emergent banana diseases seem to be largely excluded. The consistent lack of incorporation of diseases other than the black sigatoka and the Panama, which are the more thoroughly documented classes, restricts the potential of the algorithms for developing comprehensive models for disease detection and could delay proactive intervention in underdiagnosed scenarios. The total number of images in the dataset is given in Table 9; the non-availability of the images and other organ diseases are given as a cross symbol.
| Dataset name | Healthy | Black sigatoka |
Yellow sigatoka | Cordana | Pestalotiopsis | Xanthomonas | Fusarium wilt | Moko disease | Panama disease | Anthracnose | Ref. no |
|---|---|---|---|---|---|---|---|---|---|---|---|
| Kaggle 1 | 529 | 873 | ✗ | 562 | 573 | ✗ | ✗ | ✗ | ✗ | ✗ | Bhuiyan et al. (2023), Gomez Selvaraj et al. (2020 |
| Mendeley dataset—A | 155 | 320 | ✗ | ✗ | ✗ | 814 | ✗ | ✗ | ✗ | ✗ | Hailu (2021) |
| Mendeley dataset—B | 688 | 536 | 184 | ✗ | ✗ | ✗ | ✗ | 440 | 328 | ✗ | Mduma et al. (2022) |
| Mendeley dataset—C | 1,057 | 126 | ✗ | ✗ | ✗ | ✗ | ✗ | 54 | 839 | Mafi et al. (2023) | |
| Mendeley dataset—D | ✗ | 474 | 264 | ✗ | ✗ | ✗ | ✗ | ✗ | 102 | ✗ | Das, Azam & Abdullah Al Kafi (2025) |
| Harvard Dataverse | 5,628 | 5,767 | ✗ | ✗ | ✗ | ✗ | 6,212 | ✗ | ✗ | ✗ | Mduma & Elinisa (2025) |
| Tanzania dataset | 3,344 | 3,502 | ✗ | ✗ | ✗ | ✗ | ✗ | ✗ | ✗ | ✗ | Medhi & Deb (2022) |
RQ: 4. What are the devices used for collecting datasets?
Devices contribute profoundly to the collection of data concerning the detection of banana leaf diseases since they are the most important means of obtaining quality images for subsequent analysis. Different types of devices have been used in various countries, ranging from mobile phones to sophisticated cameras and drones, to gather data in different environmental settings. For example, the MicaSense RedEdge camera and UAVs are common in Africa (Selvaraj et al., 2020; Narayanan et al., 2022; Elinisa & Mduma, 2024a), since they can capture multispectral images critical in detecting early-stage signs of disease. In India, digital cameras such as the Canon EOS 750D and smartphones are used frequently (Mathew, Kumar & Cherian, 2023b, 2023a) as they are low-budget-friendly tools for researchers. In the same manner, the use of smartphones and cameras is also popular in Bangladesh (Vidhya & Priya, 2022; Chaudhari & Patil, 2020; Haq et al., 2024), which focuses on affordability. Advanced drones with multispectral cameras, like the DJI Phantom 4 Pro, in China and Malaysia, are better for faster and relatively cheaper large-scale data collection in areas that are not easily accessible. The difference in devices, for example, now ranging from hyperspectral sensors to mobile phones, illustrates the fashion through which data collection can be modified depending on the available resources and the demands of the research. Table 10 Summarize the devices utilized in various studies.
| Ref | Device | Country |
|---|---|---|
| Selvaraj et al. (2020) | MicaSense RedEdge camera | Africa |
| Narayanan et al. (2022), Elinisa & Mduma (2024a), Cárdenas-Rodríguez et al. (2023), Elinisa et al. (2025) | Mobile and digital camera | India, East Africa |
| Ridhovan, Suharso & Rozikin (2022) | Smartphone camera | Bangladesh |
| Bhuiyan et al. (2023), Dat, Hai & Thinh (2019) | Camera | Bangladesh |
| Deng et al. (2024) | Sony ILCE-5100L camera. | China |
| Mathew, Kumar & Cherian (2023b), Mathew, Kumar & Cherian (2023a) | Canon EOS 750D camera. | India |
| Vidhya & Priya (2022), Chaudhari & Patil (2020), Haq et al. (2024) | Camera | India, Bangladesh, Taiwan |
| Mora et al. (2024), Zhang et al. (2022) | DJI-FC6310 RGB camera, RedEdge MS camera, DJI Phantom 4 Pro (P4P) drone and UAV | Africa |
| Nandhini et al. (2021) | Canon EOS 3000D | India |
| Aliff et al. (2024) | Cameras and a DJI Tello drone. | Malaysia |
| Liao et al. (2019) | Hyperspectral remote sensing images. | – |
| Chaudhari, Dawoodi & Patil (2022) | Smart camera and digital camera | – |
| Jadhaw & Bhandari (2024), Yan, Shisher & Sun (2023) | Mobile and VGA camera and digital camera | India |
| Arman et al. (2023) | D435i cameras. | Philippines |
| Ye et al. (2020) | DJI Phantom 4 quadcopter drone, and five-band multispectral camera MicaSense RedEdge MTM | China |
| Genet et al. (2024) | AdSurv mobile application on Samsung phones | – |
| Nassor, Mushthofa & Priandana (2024) | Galaxy 01 smartphone | Tanzania |
| Senthilraj & Parameswari (2022) | Mobile phones. | Tanzania |
| Medhi & Deb (2022) | Mobile phones, DSLR cameras, digital cameras, and VGA cameras | India |
| Elinisa et al. (2025) | Samsung SMA715F/DS phone cameras | Tanzania |
RQ: 5. What are the performance evaluation metrics used for evaluating the models?
Various studies exhibit different ways of evaluating model effectiveness in detecting and classifying diseases in bananas. The most cited metric is “Accuracy,” which provides classification rates that measure the correct classification of the sample set (Mary, Singh & Athisayamani, 2021). The model’s ability to differentiate between diseased and healthy samples is evaluated using sensitivity and specificity (Jianqing et al., 2022a). Measurement of the degree of false conviction and deception is aided by precision, recall, and F1-score, thus ensuring dependable disease diagnosis (Correa et al., 2021; Devi et al., 2022). Matthew’s correlation coefficient (MCC) computes a general performance level that is particularly effective in classification problems, especially when comparing two categories (Deenan, Janakiraman & Nagachandrabose, 2020). Detection precision evaluation applies mAP in the determination of detection accuracy satisfaction under varying confidence intervals (Ridhovan, Suharso & Rozikin, 2022). MSE and PSNR are foremost in determining the imaging and reconstruction quality (Sanga et al., 2020). Root Mean Square Error (RMSE) serves as a measure in quantifying the deviation of prediction values and thus aids in the refinement of the performance measure of the model (Boudazin et al., 2004). All these metrics set forth provisions that can help enhance the classification models of banana diseases. Table 11 provides an overview of the performance metrics used.
Evaluation metrics are quantitative indicators that assist in evaluating the quality and effectiveness of a system or model. These indicators have been formulated with the core functionality of distinguishing how effective a system is in carrying out its designated purpose. There are different metrics regarding the activity and the outcome to be achieved. Commonly used performance metrics include accuracy, F1-score, precision, AUC-ROC, and recall.
Confusion matrix
To evaluate a model’s performance in classification tasks, a confusion matrix is used to estimate how closely the simulation predictions align original results. The confusion matrix comprises four distinct elements. Figure 12 illustrates the confusion matrix model.
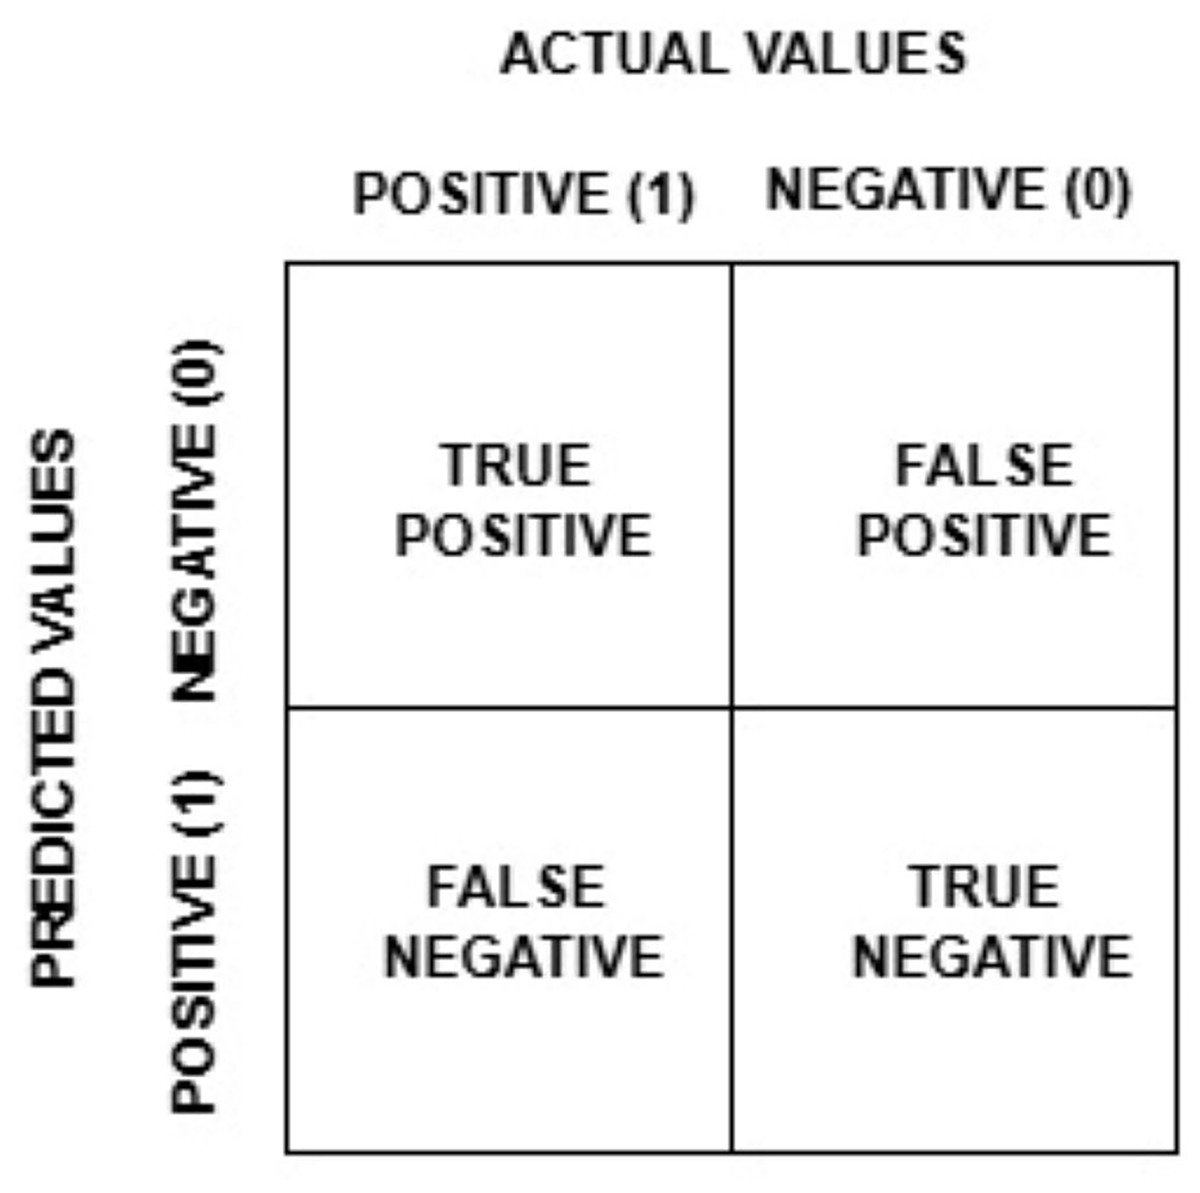
Figure 12: Confusion matrix.
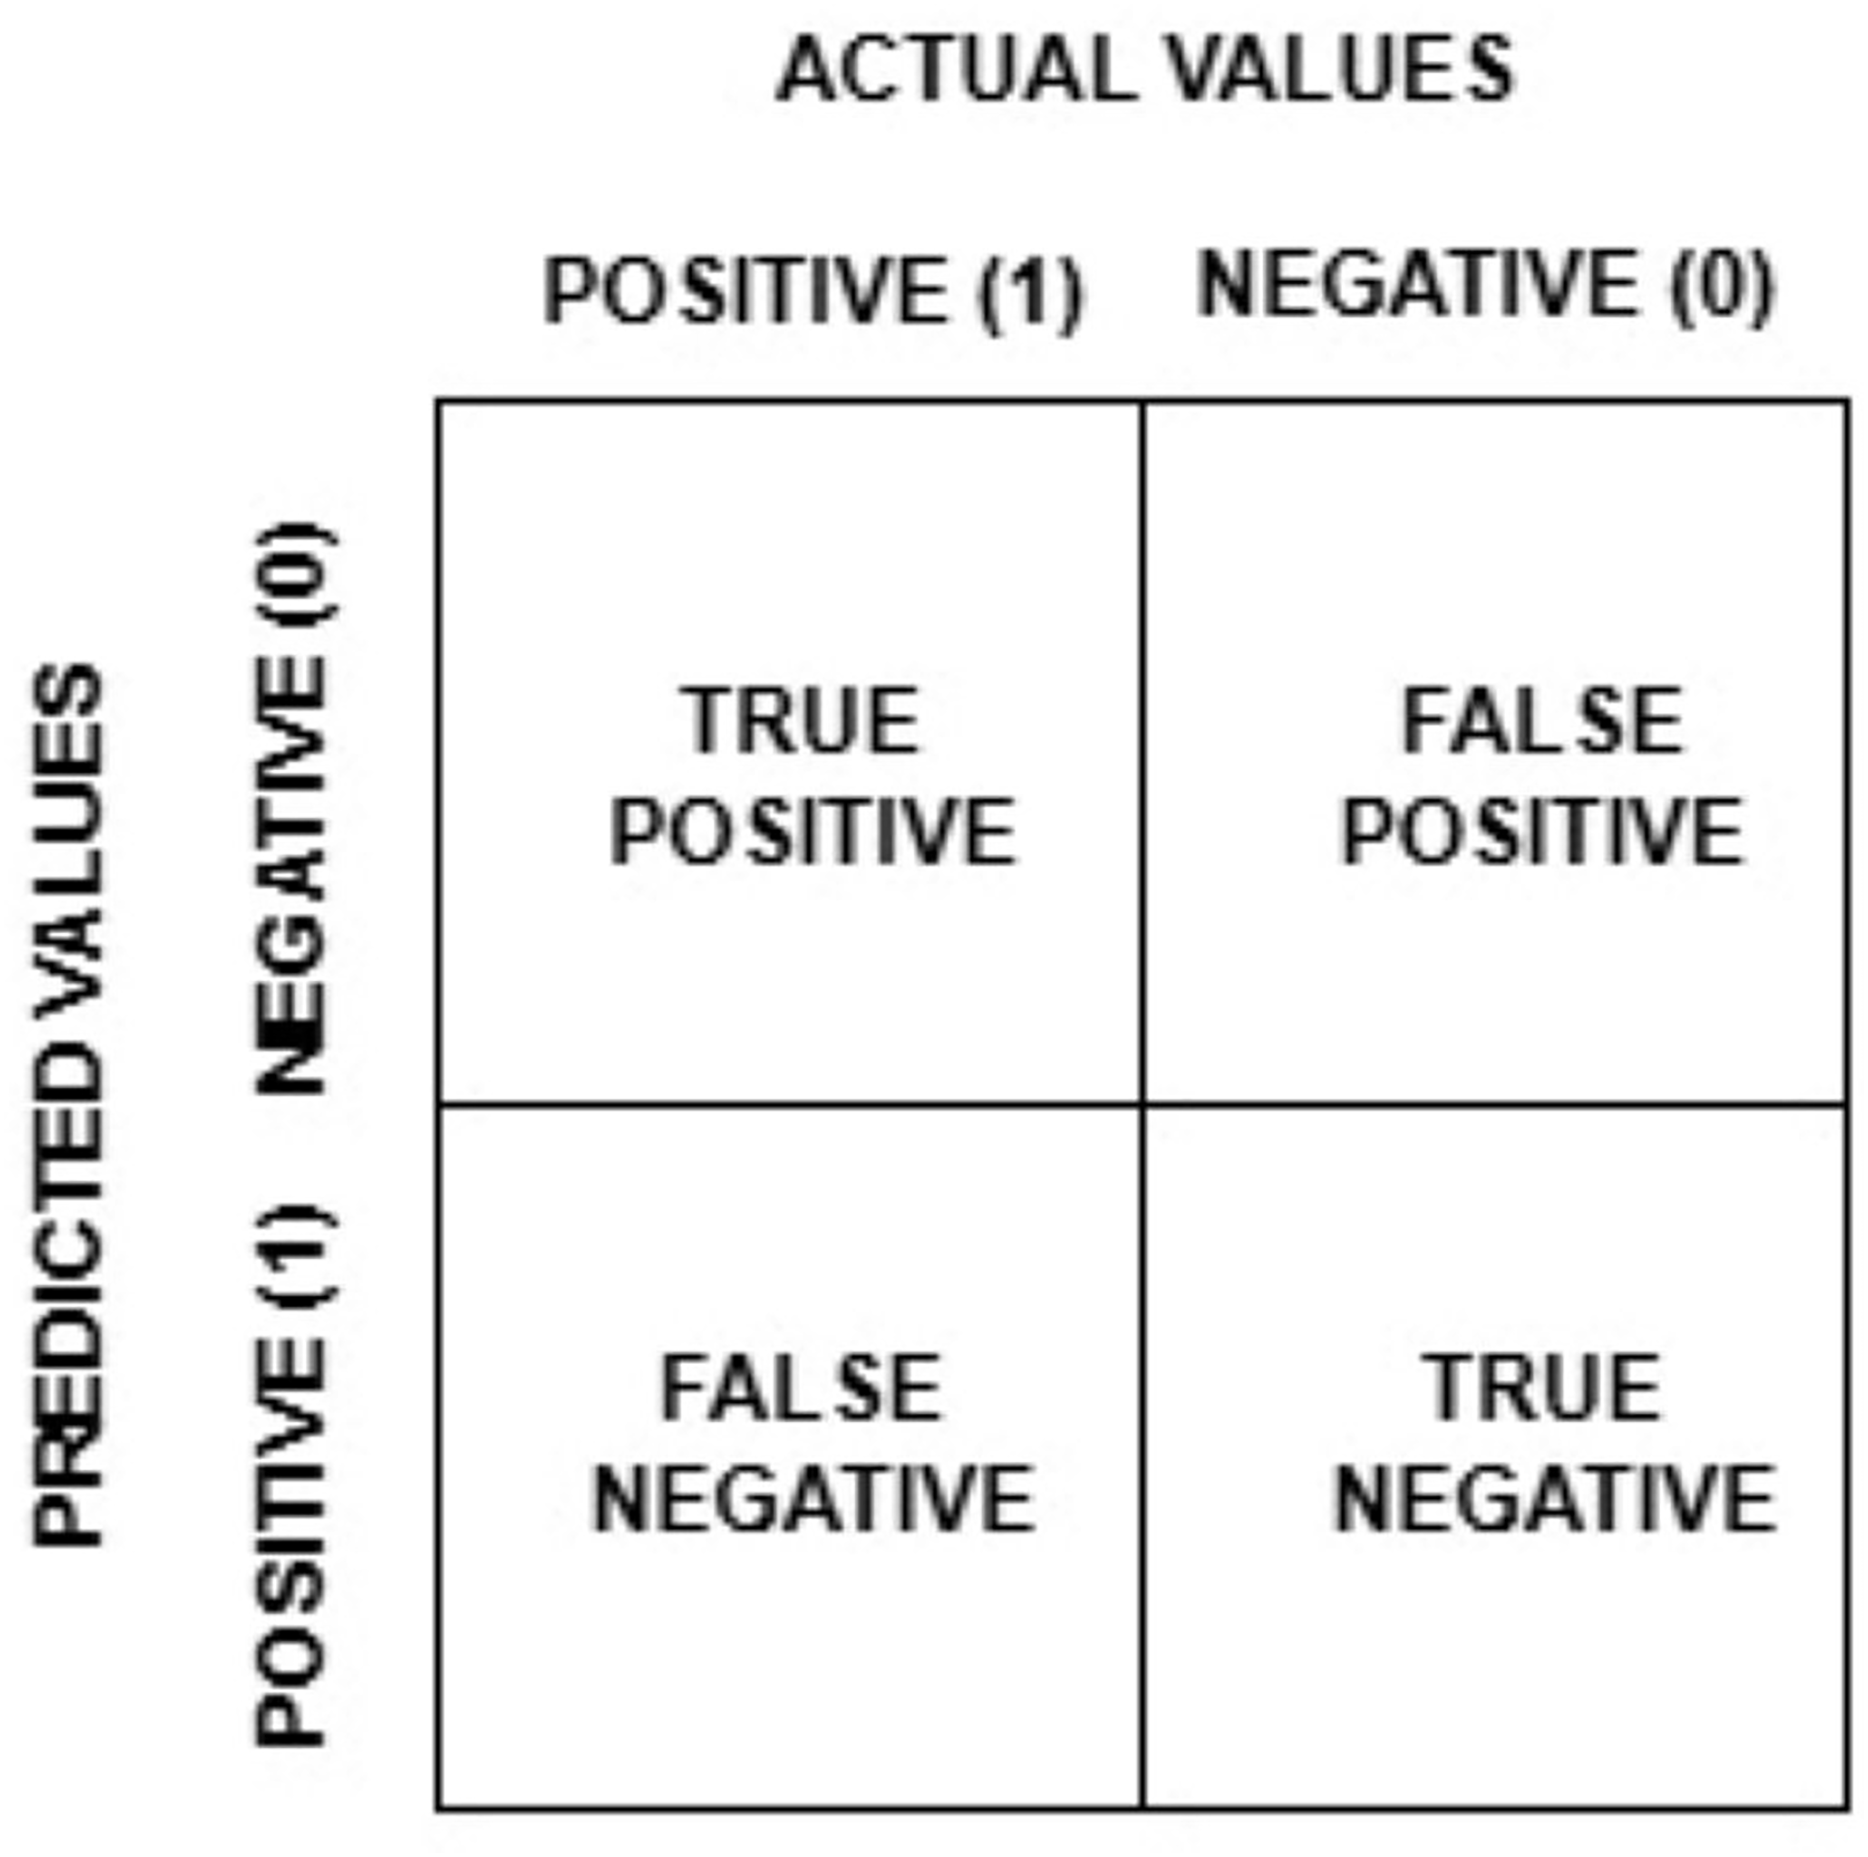
True positive (TP): Model correctly predicted the positive class.
True negative (TN): Model correctly predicted the negative class.
False positive (FP): Model incorrectly predicted positive when it was actually negative (Type I error).
False negative (FN): Model incorrectly predicted negative when it was actually positive (Type II error).
Accuracy
Accuracy is another metric of performance that is mostly employed in ML, more so in classification problems. This calculates the ratio of the model’s total correct predictions (Narayanan et al., 2022). Equation (1) is the formula used to calculate accuracy.
(1)
Recall (Or) Sensitivity
Recall, or Sensitivity, is a special metric used to determine how effectively a model finds all relevant positive cases in the data. The main objective of applying such a measure is to reduce the false negatives to maximize the detection of positive cases (Narayanan et al., 2022). The given Eq. (2) is used to calculate the performance of recall, also known as sensitivity.
(2)
F1-score
It is a performance measure that is more useful than the accuracy score in cases when classes are imbalanced. It is computed in such a way that it ensures that both precision and recall are captured with the single measure that it returns. This score normally applies where the need to recall all relevant items outweighs the risk of including too many irrelevant items (Ridhovan, Suharso & Rozikin, 2022). The F1-measure is useful in situations where a model’s precision, which refers to the number of selected items that are relevant to the tasks, or recall, which signifies the percentage of relevant items that are selected, has to be optimized. The following Eq. (3) is used for calculating the F1-score performance
(3)
Selectivity
Selectivity is a measure used primarily for binary classification problems, assessing the probability of a true negative instance being accurately classified as such. This relates to sensitivity, which is often misestimated as the fraction of TP out of the total number of positives. Selectivity, however, is narrower in scope and is broader than specificity as it concentrates on the expected outcome of no positive diagnosis, resulting in avoidance of false positive predictions, making it of value in the context where the problem of false positive diagnosis is significant. Equation (4) is used for calculating the selectivity
(4)
Precision
Precision is especially important in classification tasks where the FP cost is high, as it is considered a performance metric (Narayanan et al., 2022). It represents TP’s ratio to the total instances that the model predicted as positive. Precision measures the accuracy of a model’s positive predictions. Equation (5) provides the formula for calculating precision performance.
(5)
RMSE
This measures regression models’ accuracy by averaging the absolute errors over predicted and actual values. To find the value, calculate the square root of the mean of the squared differences between the two values. Larger errors and outliers are more prevalent, so RMSE is very sensitive to them. Better model accuracy is implied through lower RMSE scores. When predicting the severity of diseases in bananas, the RMSE measures the model accuracy for continuous output predictions (Manavalan, 2020). The equation provided below (Eq. (6)) is the formula for calculating the performance metric known as RMSE.
(6)
yi = actual value (true value)
= predicted value
n = number of data points.
SSIM
The SSIM is a complex performance metric that evaluates image quality through image structure comparison. It considers perceived quality based on luminance, contrast, and structure instead of pixel-wise differences, making it very useful for image-related tasks. SSIM is from −1 to 1, where −1 indicates the lowest similarity, while values closer to 1 signify higher similarity.
(7)
a and b = Two images being compared
= Mean intensities of images a, b
= Variances of images a and b
= Covariance between a and b
C1, Small constants to stabilize the formula and avoid division by zero.
PSNR
The PSNR compares reconstructed or compressed images to the original ones. It measures the maximum possible signal power to the power of noise, with higher PSNR values indicating images of finer quality (Manavalan, 2020). The Eq. (8) provided is the formula used to calculate PSNR.
(8)
MAX: Maximum feasible pixel value of the image
MSE: Mean squared error.
MSE
The MSE is an error-based metric that is very popular in regression and ML-based tasks. The MSE shows the proximity of the regression line to a set of sample data points. A good mean squared error is 0, which means predictions are closer to the true values. Equation (9) is used to demonstrate the performance of MSE
(9)
n: aggregate number of data points
yi: Actual value (ground truth) of the iii-th data point
= Predicted value for the iii-th data point
= Squared difference between the actual and predicted values.
AUC-ROC curve
The performance of a classification model over various threshold values is shown graphically by the AUC-ROC Curve. It is frequently used to assess models in problems involving binary classification (Manavalan, 2020). The equation provided in Eqs. (10), (11) is used to calculate performance.
(10)
(11)
False positive rate
True positive rate.
Challenges
Evaluating a disease diagnosis in its preliminary stage through visual means is significantly challenging (Bhuiyan et al., 2023). There are a lack of data sets necessary for training DL models aimed at the early detection of Panama wilt disease. Developing DL algorithms requires a better understanding of the genetic structure of the disease (Sangeetha et al., 2023). Additionally, obtaining high-grade, high-resolution images is essential for accurately diagnosing and classifying banana leaf diseases.
The monitoring range, coverage, and positioning of monitoring devices also need enhancement (Aasha Nandhini et al., 2023). Most existing methods focus on IP and heavily rely on image segmentation, which is a repetitive and labor-intensive task. Many disease symptoms do not have clear edges, causing them to blend with the healthy parts of the leaves; this blending can complicate detection using current techniques. Furthermore, lesions on banana plants often appear at various locations, yet most research has predominantly concentrated on the leaves (Narayanan et al., 2022). There is a shortage of public data sets for the classification of banana diseases, which poses a significant gap in this field (Mary, Robert Singh & Athisayamani, 2020). Access to labeled images is particularly lacking (Vidhya & Priya, 2022). The study referenced relied on small data sets, which can limit the effectiveness of the research (Banerjee et al., 2023). Plant diseases, especially those affecting banana crops, lead to decreased agricultural productivity (Abisha & Bharathi, 2023). Additional challenges occur due to the irregular shapes of banana plants, the effects of shadows, and the angle of light as it reflects onto the camera. Factors like the sun’s azimuth, light reflectance angle, and UAV camera height complicate monitoring (Neupane, Horanont & Hung, 2019).
Research gaps
a. Allocation of resources is not easy: There is insufficient attention and funds directed toward the construction and analysis of relevant datasets, as well as the real-world condition complexity, and disease staging multi-versions.
b. Training sets: Annotated limits are many, and very few datasets are constructed that cover all the possible stages and manifestations of the diseases.
c. Limitations of other models: These models are often too focused on stages with visible symptoms, ignoring other preliminary stages dominated by infectious and biochemical processes.
d. Symptomless DL: No research or model attempt has been structured that uses DL to find biochemical symptoms with no associated physical changes to the leaves.
e. Constraints of current models: The ease and low-cost acquisition of hyperspectral and multispectral images greatly limitthe speed at which the disease can be identified.
f. Improvement in disease recognition models: There should be an added capability to models that attempt to locate and identify disease types, especially in their ability to assimilate time series learning data concerning disease progression.
g. Advanced image integration: Accuracy of the models for the illumination and shadowing, as well as weather and variability from different fields, needs refinement.
h. Importance of domain adaptation: To be realistic, models must incorporate domain adaptation functions to ensure effective performance.
i. Addressing heterogeneous optimum faults or weaknesses: The optimum may disguise itself by modifying several approaches, such as enhancing other factors or changing the learning approaches that are more flexible in terms of the size of alteration sets.
j. Benchmarking: Multiple DL models have not been benchmarked compared to others, which can result in unfair performance evaluations.
k. Cost-efficient monitoring: Existing models display gaps in adequately monitoring large-scale diseases within a reasonable cost range.
l. Lightweight models: There is no available research on lightweight models that are intended for mobile and edge devices, meant for real-time detection of disease.
m. Ensemble models: Very few studies have concentrated on the performance of ensemble models compared to single DL models. There is also the need to sort out the classifications of the strategies that are known to worsen the classification performance, like stacking, bagging, and boosting.
n. Computational complexity: The computational complexity involved in merging several different models is of utmost importance.
Case study: real world deployment of banana leaf disease diagnosis system
Recent studies highlight that AI techniques are increasingly being implemented in practical agricultural environments, moving beyond controlled experimental trials. The study (Elinisa & Mduma, 2024a) developed a mobile application for a CNN-based banana disease detection model that is accessible to farmers in Tanzania. The application functions offline after installation and is compatible with inexpensive Android smartphones. It can analyze images of banana leaves or stalks in less than 5 s. Moreover, the application supports English and Kiswahili, expanding its accessibility. In real farm conditions, the application achieved over 90% classification confidence in healthy plants, fusarium wilt, and black sigatoka, and offered tailored disease management advice, proving its utility as a proactive intervention tool in the field. Also, the other study (Sanga, Machuve & Jomanga, 2020) used a DL model, which was integrated into an Android mobile application to aid smallholder banana farmers in real-time. The application operates offline, enabling farmers to take or upload field pictures and receive instant diagnoses and management recommendations for pests or diseases. This was validated in field trials conducted in Uganda, which confirmed over 90% accuracy in recognition in real farm settings. Another study (Jiménez et al., 2025) incorporated an EfficientNetB0-based banana leaf disease detection model into a mobile application in Latin American banana farms for banana disease diagnosis. The application processes images of the leaves taken by the farmers through smartphones, which provide instant feedback. The initial focus was on streamlining disease management, while model accuracy improvement and broader application to additional crop diseases were considered for the future. As highlighted in the case study (Aasha Nandhini et al., 2023), the mobile app for banana leaf disease detection represents a viable solution to real-world disease management issues. Capturing the banana leaf images by farmers through smartphones is facilitated by the app. The trained DL model processes the images on the farmer’s device or through cloud servers and issues an instantaneous disease diagnosis alongside management strategies. It underwent testing on banana farms for durability against diverse illumination, angular, and weather conditions to help the farmers make laboratory-free and timely decisions. Gomez Selvaraj et al. (2020), active banana plantations in the Democratic Republic of Congo and Benin were flown over for high-resolution RGB imaging with the DJI Phantom 4 drones and for natural field capturing. Agricultural specialists later outlined banana plants in the images they acquired in order to generate ground truth masks, which were employed to train and validate a DeepLabv3+ segmentation model. Subsequently, the model’s detection outputs were compared to the expert annotations, enabling evaluation of the model’s performance in a real-world farming context rather than only in a lab setting.
Discussions
The analysed case studies (Elinisa & Mduma, 2024a; Sanga, Machuve & Jomanga, 2020; Jiménez et al., 2025; Aasha Nandhini et al., 2023; Gomez Selvaraj et al., 2020) clearly demonstrate that AI-driven systems are viable for efficient disease management in banana farming. Specifically, mobile and cloud-based applications enable farmers to identify issues immediately, representing a significant advancement in the division between research and practical application. However, despite these promising developments, a large portion of AI models released in the literature remains confined to benchmark datasets and experimental conditions. Despite often showing high accuracy rates, these models are utilized in real farming contexts, which restricts their practical application. One of the primary challenges is the interpretability of AI models. Due to the nature of many current technologies functioning as “black boxes,” farmers struggle to understand or trust the outcomes. Farmers often require straightforward feedback rather than theoretical accuracy metrics, like visual clarifications. The absence of clear frameworks complicates the ability of developers and policymakers to scale and sustain these systems. Many studies relied on extremely small dataset sizes, which limits generalization (Freire et al., 2023; Tanwar, Sharma & Aanand, 2023; Jadhaw & Bhandari, 2024; Nasra & Gupta, 2024; Criollo et al., 2020). Most did not use XAI techniques in Bhuiyan et al. (2023), Tanwar, Sharma & Aanand (2023), Aliff et al. (2024), Jadhaw & Bhandari (2024), Gokula Krishnan et al. (2022), which limited the results’ interpretability. Domain relevance was decreased by a number of articles that were not especially focused on banana foliar diseases (Aliff et al., 2024; Jadhaw & Bhandari, 2024; Arifin, 2025; Prabhakar & Sudha, 2024; Saranya et al., 2020). Additionally, none of the research addressed a prevalent real-world problem: multi-disease identification on the same leaf. These gaps draw attention to limitations in practical applicability, despite the fact that performance was frequently described as high (Freire et al., 2023; Bhuiyan et al., 2023; Aliff et al., 2024). In this case, a tick (✓) signifies that a feature is present, whereas a cross (✗) shows that it is not. Table 12 illustrates the comparison of study characteristics and limitations.
| Ref. no | Very low dataset size | Study on banana foliar diseases | Multi-disease identification on the same leaf | XAI method used | Performance |
|---|---|---|---|---|---|
| Freire et al. (2023) | ✗ | ✓ | ✗ | ✓ | ✓ |
| Bhuiyan et al. (2023) | ✓ | ✓ | ✗ | ✗ | ✓ |
| Tanwar, Sharma & Aanand (2023) | ✓ | ✓ | ✗ | ✗ | ✗ |
| Aliff et al. (2024) | ✗ | ✗ | ✗ | ✗ | ✗ |
| Jadhaw & Bhandari (2024) | ✓ | ✗ | ✗ | ✗ | ✓ |
| Gokula Krishnan et al. (2022) | ✗ | ✓ | ✗ | ✗ | ✓ |
| Nasra & Gupta (2024) | ✓ | ✓ | ✗ | ✗ | ✓ |
| Arifin (2025) | ✓ | ✗ | ✗ | ✗ | ✓ |
| Prabhakar & Sudha (2024) | ✓ | ✓ | ✗ | ✗ | ✓ |
| Saranya et al. (2020) | ✓ | ✗ | ✗ | ✗ | ✓ |
| Criollo et al. (2020) | ✓ | ✗ | ✗ | ✗ | ✗ |
| Elinisa & Mduma (2024b) | ✗ | ✗ | ✗ | ✗ | ✗ |
| Kumar & Kumar (2024) | ✗ | ✓ | ✗ | ✗ | ✓ |
| Banerjee et al. (2023) | ✗ | ✓ | ✗ | ✗ | ✓ |
| Narayanan et al. (2022) | ✗ | ✗ | ✗ | ✗ | ✓ |
| Vidhya & Priya (2022) | ✗ | ✓ | ✗ | ✗ | ✗ |
| Salehin, Islam & Alam (2024) | ✗ | ✓ | ✗ | ✗ | ✓ |
| Genet et al. (2024) | ✗ | ✓ | ✗ | ✗ | ✓ |
| Huang et al. (2024) | ✓ | ✓ | ✗ | ✗ | ✓ |
| Bharath, Hemalatha & Sreekumar (2025) | ✓ | ✓ | ✗ | ✗ | ✗ |
The incorporation of VGG16 and SVM hybrid frames enhanced the CNN’s architecture. The majority of the distinctions between DL approaches and traditional automated learning techniques are caused by variations in data size, picture quality, and algorithmic complexity. Table 13 compares CNN, SVM, and hybrid DL techniques for identifying diseases. In particular, CNN-based models excel in extracting and developing objects. The efficiency of SVMs decreases as the size and complexity of the dataset increase. Hybrid models and CNN, which provide a more dependable and trustworthy way of detecting actual diseases, are examples of the advanced learning methodologies that this data displays.
| Ref. No | Model used | Dataset size | Performance metrics | Limitations |
|---|---|---|---|---|
| Bhuiyan et al. (2023) | CNN | 937 | Accuracy: 96.25% Precision: 96.53% Recall: 96.25% Specificity: 98.75% F1score: 96.17% MCC: 95.13%. |
A smaller number of dataset images. |
| Aliff et al. (2024) | CNN | 6,700 | Accuracy of 80.36% and 79.24%. | Moderate performance |
| Elinisa & Mduma (2024b) | R-CNN | 6,000 | Average precision (mAP) of 0.04529 | Extremely low performance |
| Gokula Krishnan et al. (2022) | CNN integrated hybrid fuzzy C-means clustering. | 9000 | Accuracy: 93.45%. Specificity: 96.38%, Sensitivity: 89.04% |
Lack of explainability methods. |
| Tanwar, Sharma & Aanand (2023) | CNN. SVM | 1,100 | Accuracy: 90% | Limited dataset images |
| Banerjee et al. (2023) | CNN, SVM | 1,100 | Accuracy: 94% | No dataset collection. |
| Narayanan et al. (2022) | CNN, SVM | 3,500 | Accuracy: 99% | Lack of major banana leaf diseases like black sigatoka and yellow sigatoka |
| Vidhya & Priya (2022) | SVM | 12,544 | Accuracy: 76.49% | Major misclassification of diseases among various models |
| Jadhaw & Bhandari (2024) | CNN, VGG16 | 1,000 | Accuracy: 99% | Limited dataset images |
| Salehin, Islam & Alam (2024) | VGG | 17,068, 54,303 | Accuracy: 90% F1-score: 90%. |
Lack of field-level deployment |
| Genet et al. (2024) | VGG19 | 17,068 | Accuracy: 98.062%. | No other performance evaluation metrics are used. |
| Huang et al. (2024) | VGG16 | 400 | Accuracy: 92% | Low dataset images |
| Bharath, Hemalatha & Sreekumar (2025) | GAP-based CNN with XAI (Grad-CAM, SoftMax Confidence Analysis) | 937 | Test accuracy: 74.71% | There is a major misclassification of Disease in Cordana and Pestalotiopsis. |
| Freire et al. (2023) | SHAP VGG 16 | 1,289 | MobileNetV2: Precision: 89.5, Recall: 98.0, F1-score: 93.0, Accuracy: 96.0 ResNet50V2: Precision: 82.5, Recall: 94.5, F1-Score: 87.0, Accuracy: 93.0 VGG16: Precision: 81.5, Recall: 94.5, F1-Score: 86.0, Accuracy: 92.0 |
All models perform well for diseased leaf detection but show weaker precision and F1-scores for healthy leaves, limiting overall reliability. |
| Nasra & Gupta (2024) | ResNet50 | 936 | Accuracy: 96% | No external validation testing was conducted. |
| Arifin (2025) | GoogleNet | 1,289 | Accuracies Healthy: 90.59%, Fusarium Wilt 90.30%, Sigatoka: 90.49% |
With 155 healthy, 814 Fusarium Wilt, and 320 Sigatoka images, the model is biased toward the dominant class, which reduces fairness and reliability. |
| Prabhakar & Sudha (2024) | Filtering algorithm | – | Cordana MSE: Canny = 86.3, Robert = 98.5, Prewitt = 96.8 PSNR: Canny = 28.8, Robert = 28.2, Prewitt = 28.3 Sigatoka MSE: Canny = 82.85, Robert = 97.9, Prewitt = 98.3 PSNR: Canny = 28.98, Robert = 28.25, Prewitt = 28.24 Pestalotiopsis MSE: Canny = 81.38, Robert = 98.5, Prewitt = 98.2 PSNR: Canny = 29.05, Robert = 28.23, Prewitt = 28.24 |
The study is constrained by testing only three diseases with classical filters, using limited evaluation metrics (MSE, PSNR) without classification performance measures, and lacking dataset clarity or modern AI comparisons. |
| Criollo et al. (2020) | AlexNet-inspired CNN | 623 | Accuracy: 87.5% | No real-world deployment |
| Saranya et al. (2020) | Artificial neural network | 30 | Black Sigatoka: Mean 0.324, Std. Dev. 0.026, Variance 0.00005, Skewness –0.6659, Kurtosis 4.948. Freckle: Mean 0.328, Std. Dev. 0.064, Variance 0.0026, Skewness –0.0769, Kurtosis 18.93. Healthy: Mean 0.325, Std. Dev. 0.179, Variance 0.0091, Skewness 3.2404, Kurtosis 67.32. |
Only 30 images are used for the study which is very small. |
| Kumar & Kumar (2024) | MobileNetV2 MobileNetV3 ShuffleNetV2 SqueezeNet |
16,092 | MobileNetV2: 73.00% accuracy, 75.00% precision, 73.00% recall, and 71.00% F1-score. MobileNetV3 small: 93.59% accuracy, 93.94% precision, 93.59% recall, and 93.59% F1-score. ShuffleNetV2 96.39% accuracy, 96.42% precision, 96.39% recall, and 96.40% F1-score. SqueezeNet 97.12% accuracy, 97.14% precision, 97.10% recall, and 97.12% F1-score. |
Limitations include misclassification of similar diseases, region-specific data, lightweight model constraints, and poor MobileNetV2 performance. |
Conclusion and future work
This review discusses the application of AI techniques, including IP, ML, DL, and TL, for the automated detection and classification of diseases affecting banana leaves. Given the economic and agricultural significance of banana crops, prompt and accurate disease diagnosis is critical for farmers to maintain sustainable and profitable farming practices. The inquiry examines major banana leaf diseases such as fusarium wilt, moko disease, yellow sigatoka, black sigatoka, and anthracnose bacterial streak disease. It also addresses the class imbalance problem that is prevalent in many datasets, as well as the impact of preprocessing on model accuracy. Utilizing data gathered from privately held farms and publicly accessible sources, this study strongly advocates for the use of more sensitive, specific, accurate, precise, and evaluative metrics, such as F1-scores, to assess model effectiveness. Additionally, the study emphasizes existing banana leaf disease detection and classification methods, failure cases, limitations, dataset weaknesses, a case study on real-world deployment process, research gaps, and challenges related to agricultural productivity and sustainable farming practices that require further investigation.