
A wheat spike image segmentation method based on improved U-Net
- Published
- Accepted
- Received
- Academic Editor
- Álvar Arnaiz-González
- Subject Areas
- Algorithms and Analysis of Algorithms, Artificial Intelligence, Computer Vision, Data Mining and Machine Learning, Neural Networks
- Keywords
- Wheat spike image segmentation, U-Net, Attention mechanism, Stripe pooling, Multi-scale dilated convolution
- Copyright
- © 2025 Wang et al.
- Licence
- This is an open access article distributed under the terms of the Creative Commons Attribution License, which permits unrestricted use, distribution, reproduction and adaptation in any medium and for any purpose provided that it is properly attributed. For attribution, the original author(s), title, publication source (PeerJ Computer Science) and either DOI or URL of the article must be cited.
- Cite this article
- 2025. A wheat spike image segmentation method based on improved U-Net. PeerJ Computer Science 11:e3297 https://doi.org/10.7717/peerj-cs.3297
Abstract
The segmentation of wheat spike images is a prerequisite for conducting research on wheat spike diseases and yield estimation. To address issues such as small color differences in the background of wheat spike images in the field and low segmentation accuracy, this article proposes a wheat spike segmentation method called SAU-Net (Striped Pooling and Attention Mechanism optimized U-Net). Firstly, based on the U-Net model, residual network 50 (ResNet50) is selected as the backbone network of U-Net to reduce feature loss. Then, the stripe pooling block (SPB) and multi-scale dilated convolution (MSDC) are used to obtain local and global features, enhancing the accuracy of wheat spike feature extraction. Meanwhile, the convolutional block attention module (CBAM) is adopted to capture the dependency between channels and space, strengthen the focus on important features, and reduce the influence of background on segmentation results. Finally, a joint loss function is employed to further optimize the network performance. The results show that the average Intersection over Union (IoU) of the improved SAU-Net model is 88.57%, which is 5.29 percentage points higher than the improved U-Net model before. Compared with Pyramid Scene Parsing Network (PSPNet), Deep Convolutional Lab v3 (DeepLabv3), fully convolutional network (FCN), and Lite Residual Atrous Spatial Pyramid Pooling (Lraspp) network models, the SAU-Net model has the best segmentation accuracy. This study achieves wheat spike segmentation under complex backgrounds, providing technical support for wheat spike disease diagnosis and crop phenotype analysis.
Introduction
Wheat is an important food crop with the largest trade volume in the world, accounting for 28% of the total global food production. It provides rations for more than 30% of the world’s population (Chen & Cheng, 2023). The yield and quality of wheat have a very important impact on global food security and the evolution of the food industry. The growth and development status of wheat is mainly shown by the appearance traits, among which the appearance phenotypic parameters such as spike length, spike width and grain number are particularly important, which are closely related to the yield of wheat (Xie et al., 2019). Traditional wheat spike phenotypic parameters need to be measured manually, which is labor-intensive, subjective and error prone, which largely limits the progress of wheat spike phenotypic research. In recent years, the vigorous development of computer vision technology and artificial intelligence technology provides a new way to solve this problem (Sun, Wang & He, 2010). By using digital image processing technology, the phenotypic parameters of wheat spikes can be obtained through the analysis of Wheat Images in the field, and the premise to complete this work is the accurate pixel level segmentation of wheat spikes and grain surfaces (Wang et al., 2018). Therefore, the research and implementation of accurate segmentation of wheat spike image is of great significance for the follow-up research of wheat yield evaluation, growth monitoring and disease recognition.
With the rapid development of artificial intelligence technology, more and more researchers analyze wheat images based on artificial intelligence technology to carry out the research on wheat spike segmentation. In the early research, traditional machine learning methods are mostly used, such as Chen et al. (2013) based on Sobel operator edge detection method to complete the segmentation of wheat spike image and background, and the effect is good; Du et al. (2019) completed the segmentation of wheat spike image by simple linear iterative clustering superpixel segmentation algorithm; Du et al. (2018) used the parabola fitting algorithm to complete the segmentation of spikelets on the front of wheat spikes, and realized the counting of wheat grains on wheat spikes. Since 2020, the deep learning technology represented by convolutional neural network has been widely used in image recognition and segmentation, natural language processing and other fields with its excellent feature extraction ability. Many researchers began to use deep learning technology to solve various problems in wheat production. For example, Xu et al. (2024a) designed the HRnet model based on the freezing thawing mechanism, which can better complete the segmentation of wheat spike image, and the segmentation accuracy is 95%, The Mean Intersection over Union (MIoU) was 91.2%, and the Mean Pixel Accuracy (MPA) was 94.2%. Xu et al. (2024b) used the yolov8m-seg model to complete the segmentation of wheat spikes, and MIoU of segmentation reached 83.6%; Wang et al. (2024) established a wheat spike glume segmentation model based on the improved Mask region-based convolutional neural networks (R-CNN) network. The model used residual network (ResNet) and Feature Pyramid Network (FPN) as feature extraction networks and introduced coordinate attention (CA) module, aggregation module and semi-convolution module to realize the accurate positioning and segmentation of glume in wheat spike image, with Average Precision (AP) of 94.13% (Wang et al., 2024). Zhao et al. (2022) used tensorflow to build the yolov4 network model, adjusted and improved it for transfer learning, and completed the accurate segmentation of wheat image. The class Mean Average Precision (MAP) of the algorithm reached 93.7% (Zhao et al., 2022). Pan et al. (2023) used ImCascade R-CNN to complete the segmentation of wheat spike grain image, with AP of 90.2% (Pan et al., 2023). Although the above research on wheat spike image segmentation methods has made some progress, there is still room to improve the segmentation accuracy of the model. In addition, the actual production environment in the field is complex, and the image background is easily affected by natural conditions such as light, resulting in image noise (Shrestha, Steward & Birrell, 2004). The fine structure of wheat spike fluff (awn) may also lead to the local texture complexity of wheat spike image, and the boundary is difficult to accurately define (Zhou, Wang & Shao, 2013). All the above factors may affect the segmentation effect, resulting in weak robustness of the model.
To address the aforementioned challenges, this study proposes SAU-Net—an enhanced architecture based on U-Net framework. The model comprises five encoder blocks (Feat1–Feat5) and five decoder blocks (UP1–UP5), with both pathways incorporating residual units, batch normalization, ReLU activation functions, and convolutional layers. During the encoding phase, Given the elongated morphology of wheat spikes, we implement stripe pooling blocks (SPB) with rectangular pooling windows in encoder modules to strengthen feature extraction capabilities for slender targets. At Feat4 and Feat5 encoder stages, multi-scale dilated convolution modules with varying dilation rates are integrated to expand receptive fields and preserve fine edge details of spikes. Through five-stage encoding, input feature maps are progressively downsampled from 512 512 to 16 16 resolution while expanding channel depth to 2,048. In the decoding phase, convolutional block attention modules (CBAM) are embedded in decoder blocks to amplify critical feature sensitivity and mitigate background interference during upsampling. Upsampled features are systematically concatenated with corresponding encoder outputs through skip-connections, followed by convolutional refinement at each decoder level. This integrated architecture ultimately reconstructs high-resolution segmentation maps through five successive decoding operations. Experimental validations demonstrate SAU-Net’s robust capabilities in achieving pixel-accurate wheat spike segmentation under complex field conditions, thereby paves the technological foundation for subsequent yield estimation and spike disease identification systems.
Materials and Methods
Data acquisition
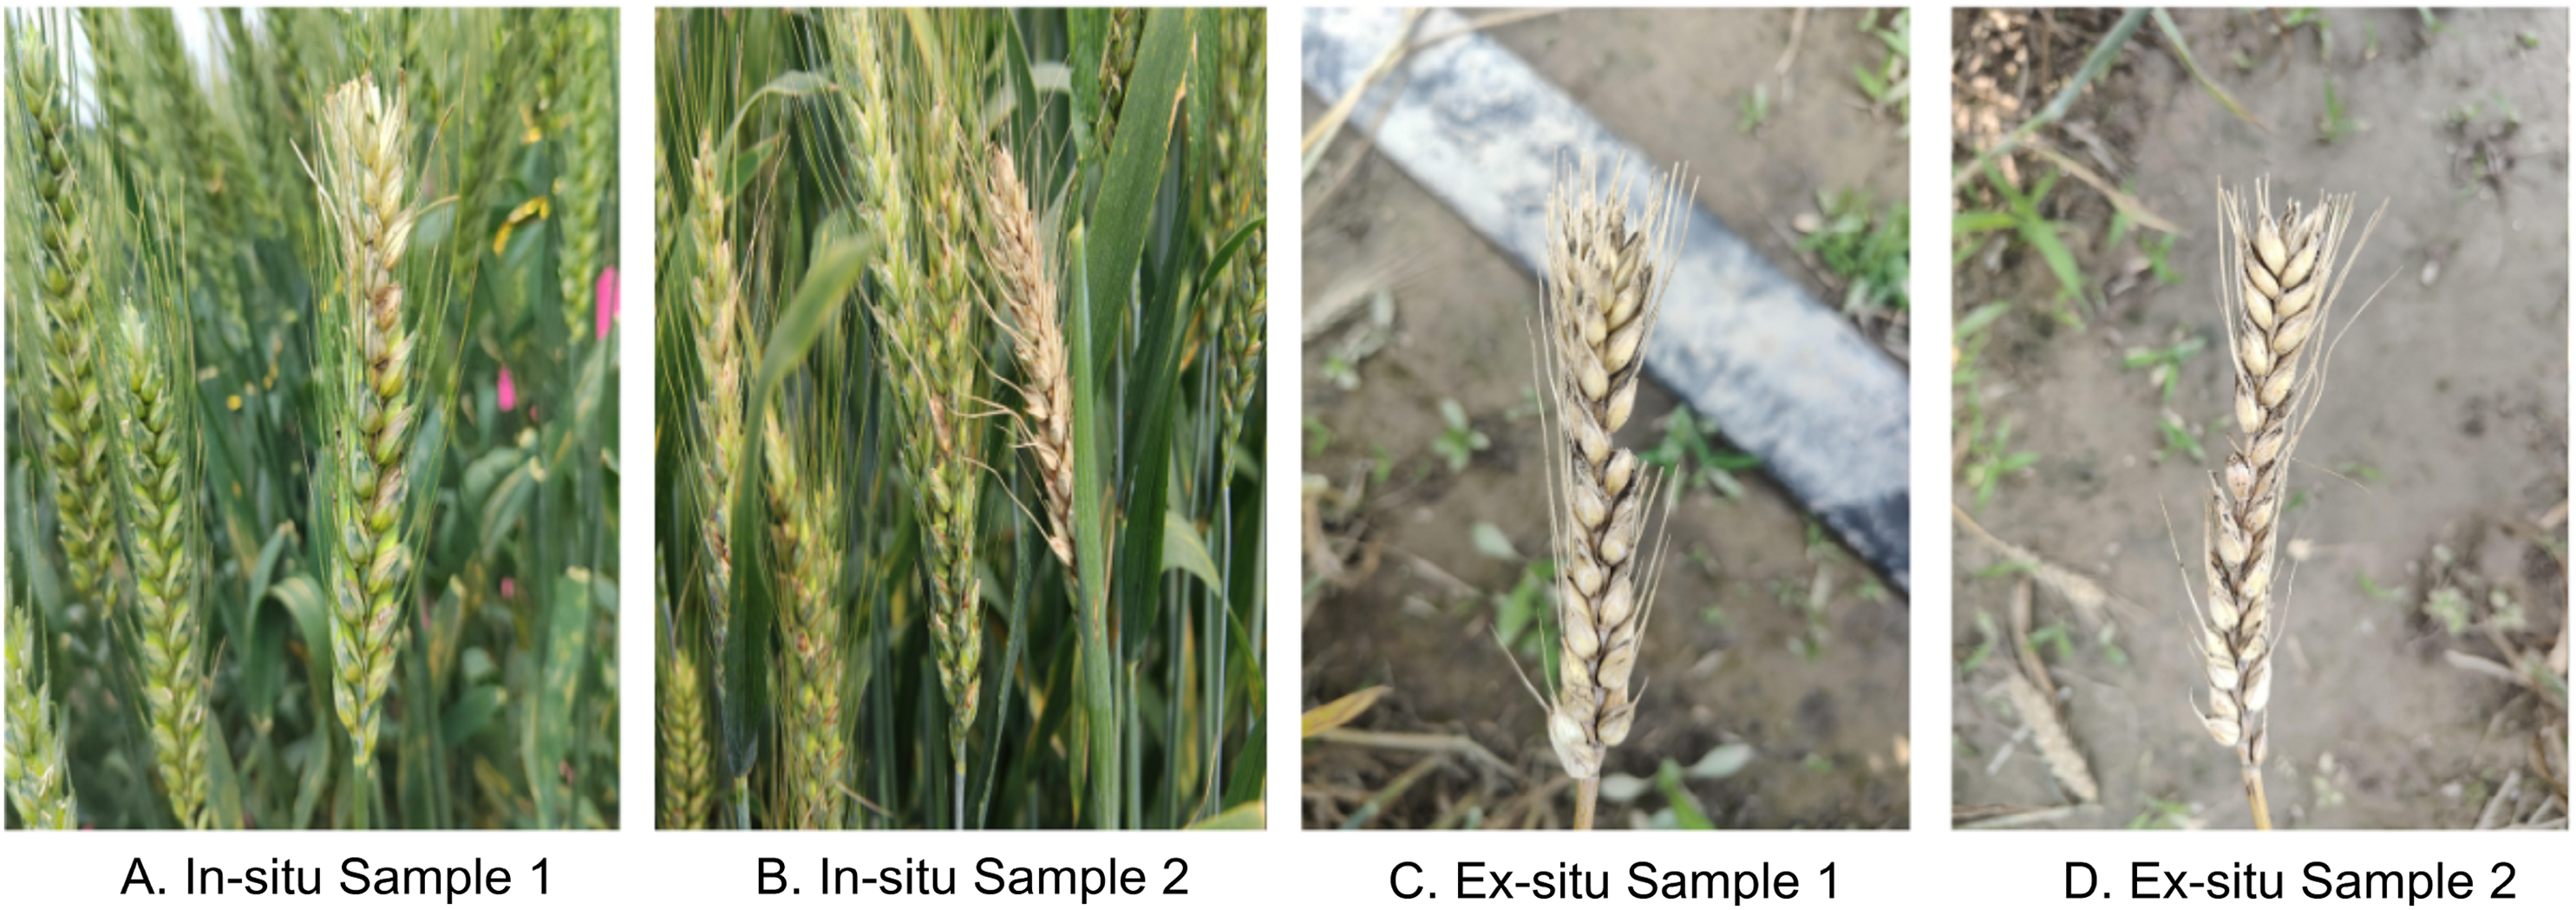
The experimental data were collected from the Yuanyang Science and Education Experimental Station of Henan Agricultural University (35∘01′N, 113∘40′E). The field trial consisted of multiple cultivation zones planted with four wheat cultivars: Ningmai 9, Yangmai 158, Sumai 3, and Zhoumai 18. Image acquisition was conducted from April 26 to May 19, 2023 (09:30–17:30 daily), encompassing critical growth stages from flowering to grain-filling phases. A Honor 50 Pro smartphone equipped with a 12-megapixel (12 MP) primary camera (f/1.9 aperture) and an 8-megapixel (8 MP) ultra-wide lens was utilized, featuring integrated electronic image stabilization (EIS), optical image stabilization (OIS), and phase-detection autofocus (PDAF), demonstrating excellent imaging performance. All images were captured at 3,904 2,928 pixel resolution (JPG format) with a 90-degree shooting angle focused on lateral views of wheat spikes. To enhance the diversity and complexity of the dataset for improved model generalizability, dual acquisition protocols were implemented: (1) in-situ sampling involving spike imaging under natural field conditions, (2) ex-situ sampling of detached spikes imaged under controlled laboratory conditions.
During the experimental period, 700 raw images were acquired. In order to ensure the quality of the images used for analysis, image samples were strictly screened:
-
(1)
Image quality and definition: first, opencv is used to calculate the tenangrad gradient value of each image as the definition index. Images with gradient values below the empirical threshold of 100 are initially marked as blurred. All images were visually examined by two researchers independently to confirm and eliminate all images with serious blur, defocus or significant noise interference.
-
(2)
Content redundancy and representativeness: for continuous images taken in the same area, this article calculates the structural similarity index (SSIM) between adjacent image pairs. Image pairs with SSIM value greater than 0.98 are considered highly similar, and only the one with higher tenengrad gradient value (i.e., clearer) is retained. In addition, the researchers removed the atypical images with obvious abnormal contents (such as the key areas of wheat ears that were significantly occluded). The screening process was completed by two people independently.
Finally, this article obtained 500 high-quality, non-redundant and representative wheat spike image data sets for subsequent quantitative analysis. These samples includes 347 in-situ samples (collected under natural field conditions) and 153 ex-situ samples (detached spikes imaged in controlled laboratory settings). Representative examples of the image dataset, demonstrating morphological diversity and acquisition conditions, are illustrated in Fig. 1.
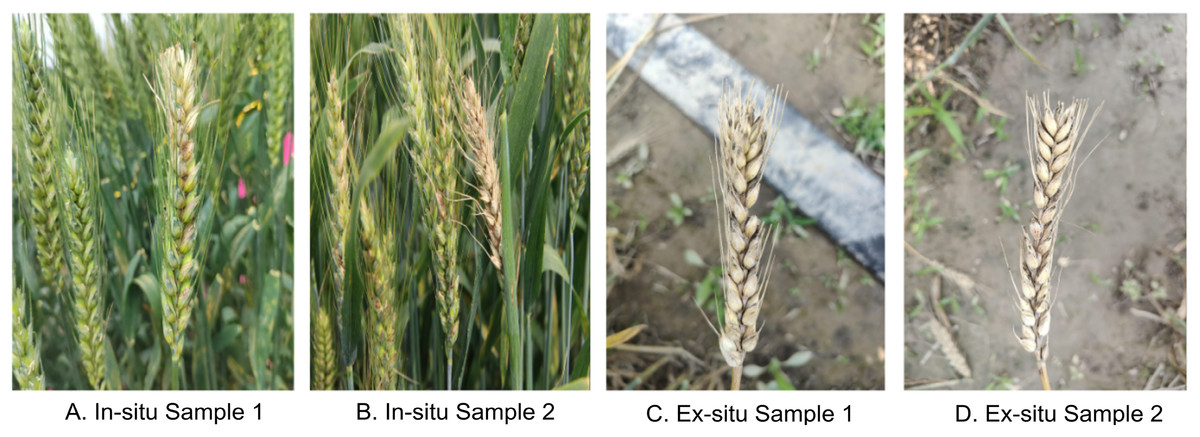
Figure 1: (A–D) Images of wheat spikes.
Data annotation and data augmentation
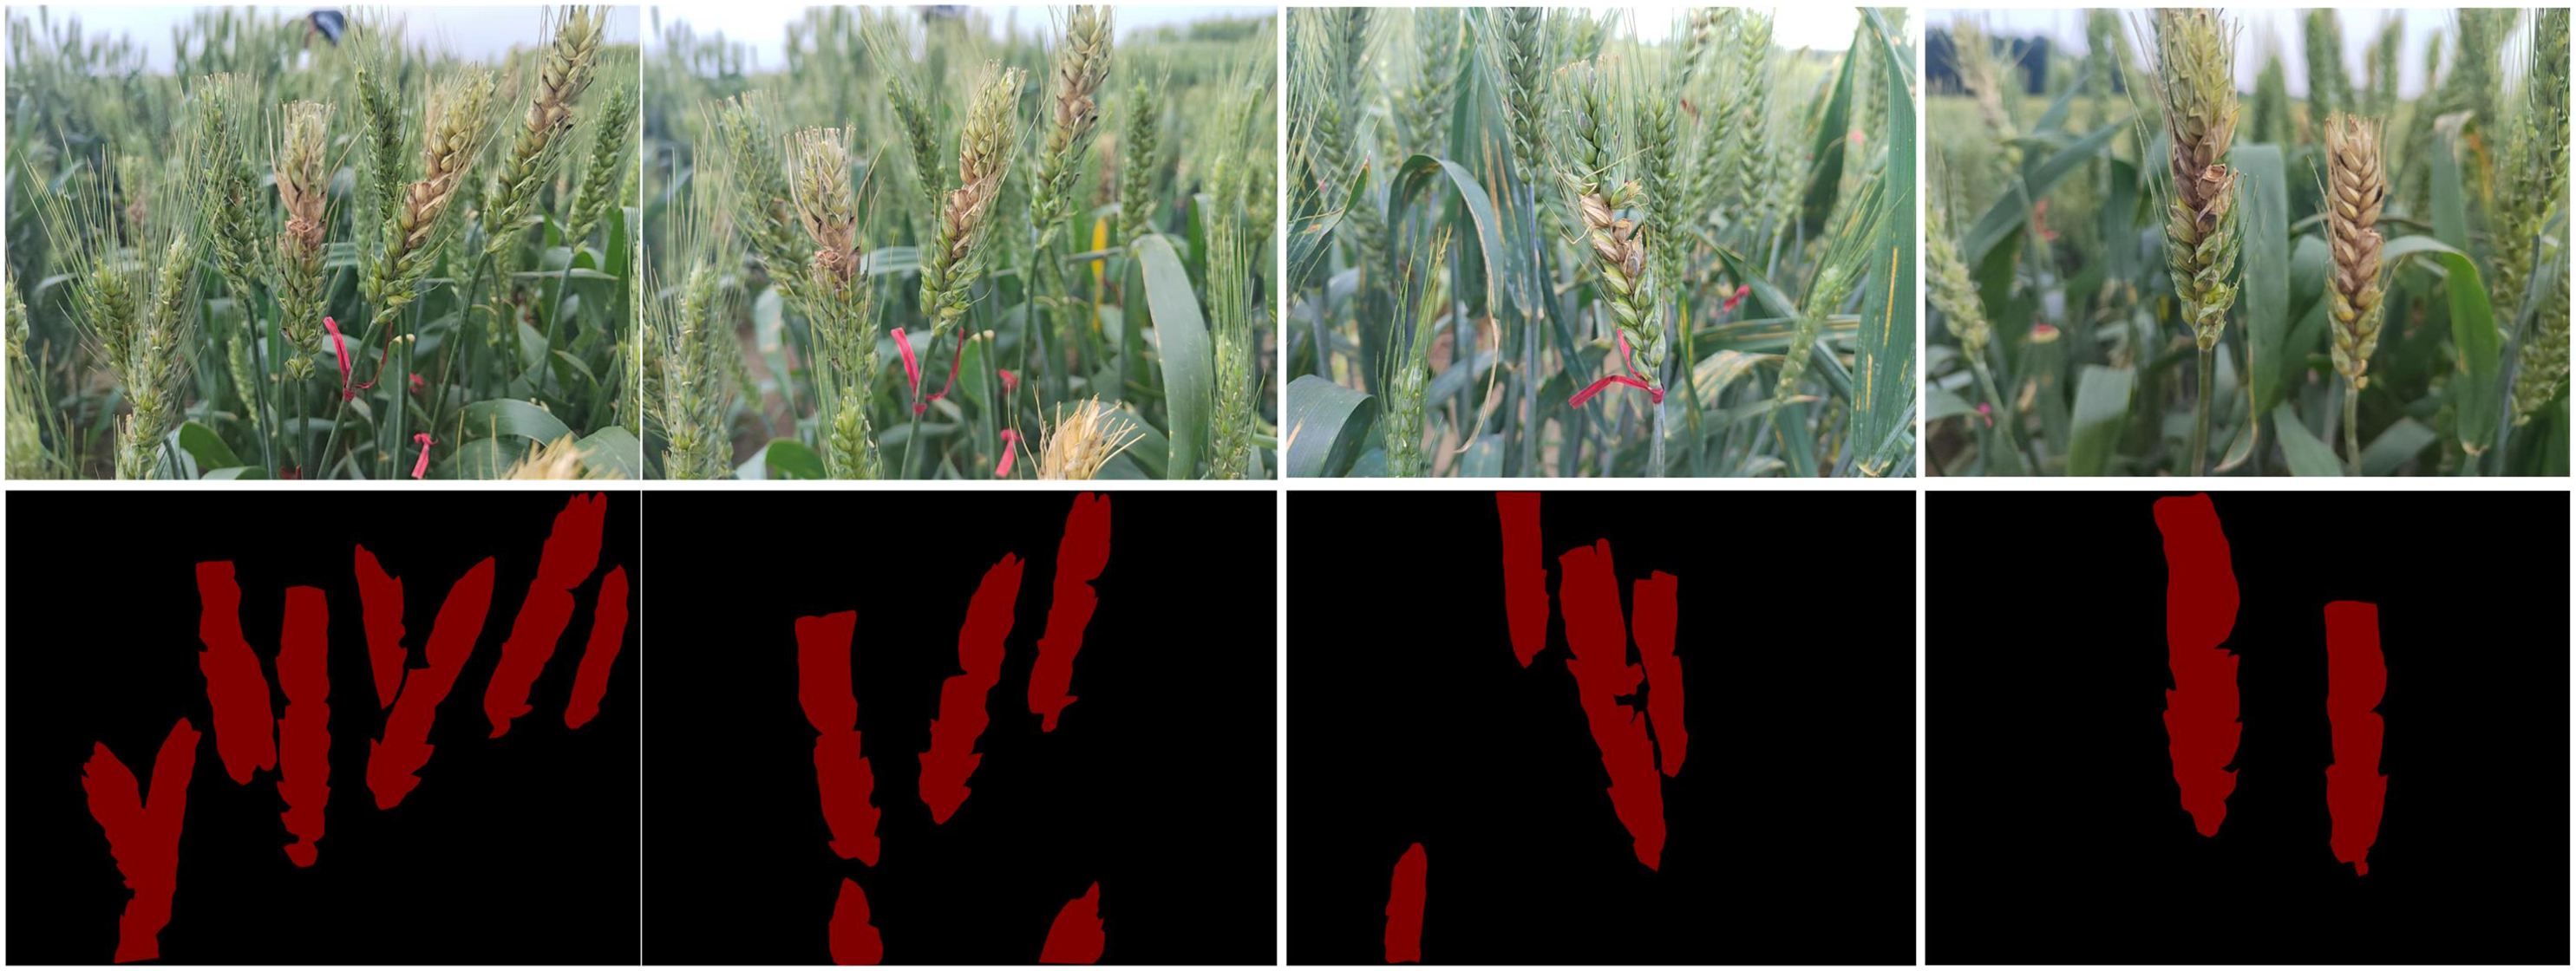
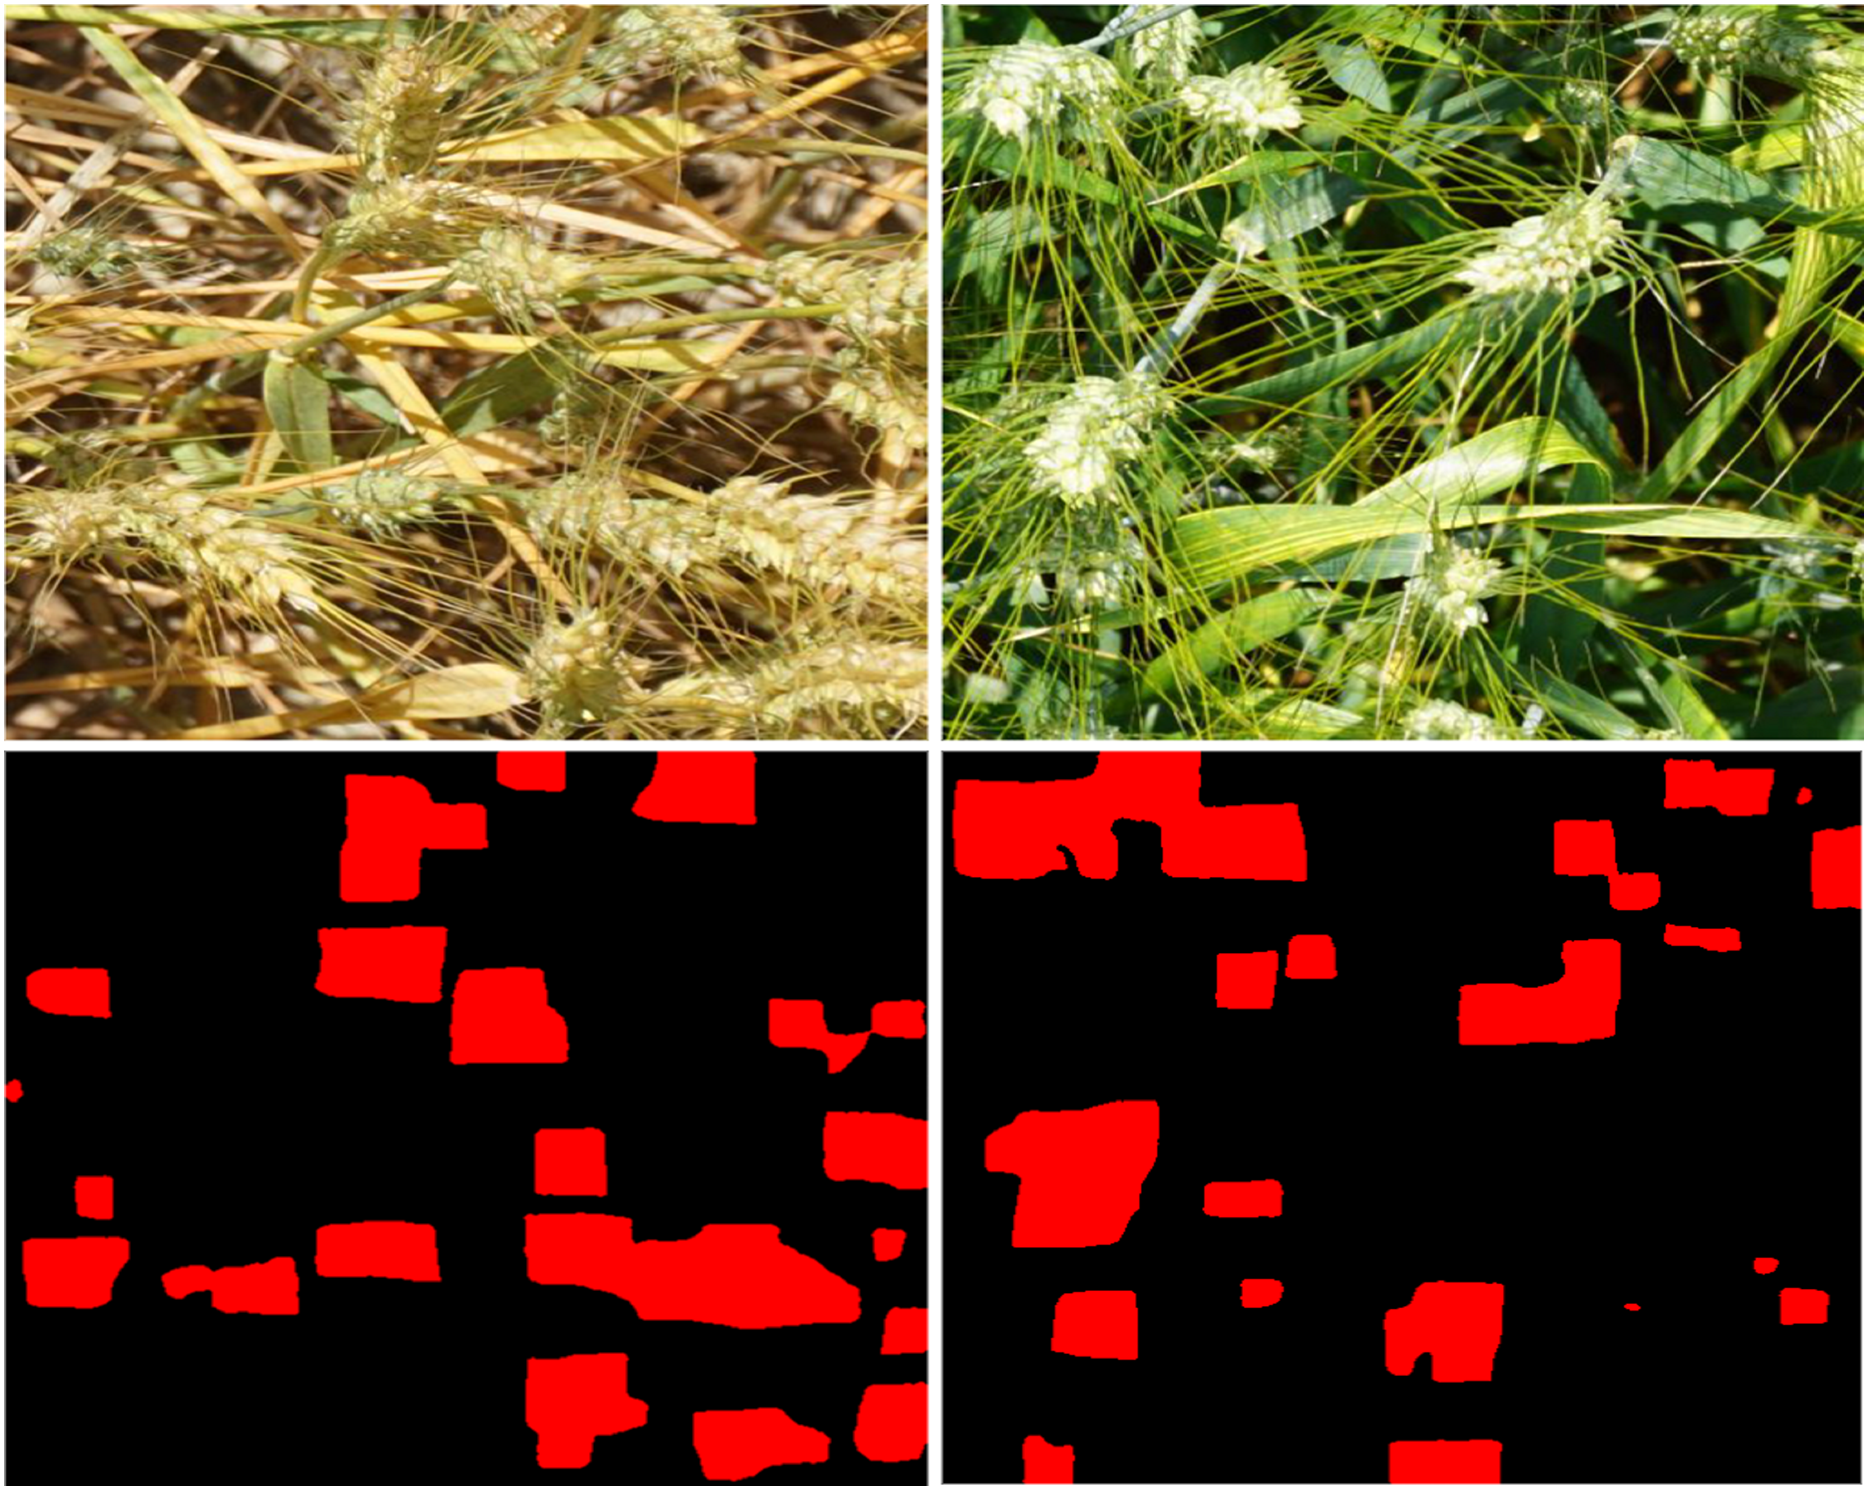
LabelMe software was used for manual image annotation, using the Polygon format (Howard, Sandler & Chu, 2019), with the results saved as JSON files. The JSON files were then converted to eight-bit grayscale images as data labels. The annotated data are classified into two categories: background and wheat spikes. A sample of the data is shown in Fig. 2. During training, the images were resized to 512 512 pixels. To enhance the training dataset and improve the model’s generalization capability, data augmentation techniques were applied, including size transformation, flipping, color space transformation, and noise addition. These data augmentation methods were used to ensure that the training dataset was diverse enough to avoid overfitting and increase the robustness of the model in real-world scenarios. After data enhancement, the data set was expanded to 820 images, including 574 images in the training set, 123 images in the validation set and 123 images in the test set.
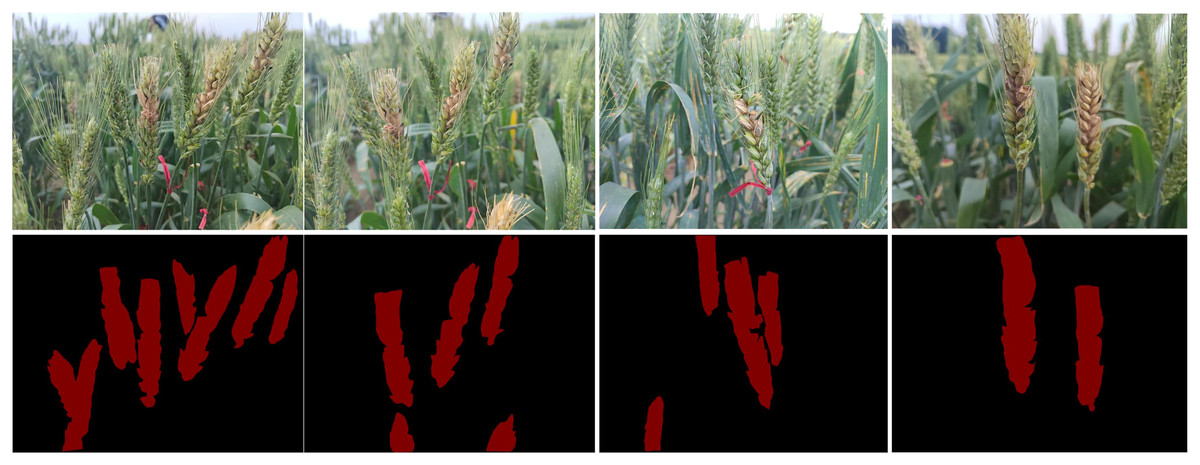
Figure 2: Segmentation mask of wheat.
The overall architecture of SAU-Net
The architecture of the SAU-Net segmentation network is based on the deep residual U-Net (ResU-Net) (He, Zhang & Ren, 2016), which combines the strengths of deep residual modules and U-Net. U-Net has a symmetrical encoder-decoder structure that captures multi-scale feature information and enhances image details through skip connections (Ronneberger, Fischer & Brox, 2015). The residual blocks from ResNet50 facilitate information transfer between layers, address network degradation issues, and improve channel interdependencies (Chen, Papandreou & Schroff, 2017).
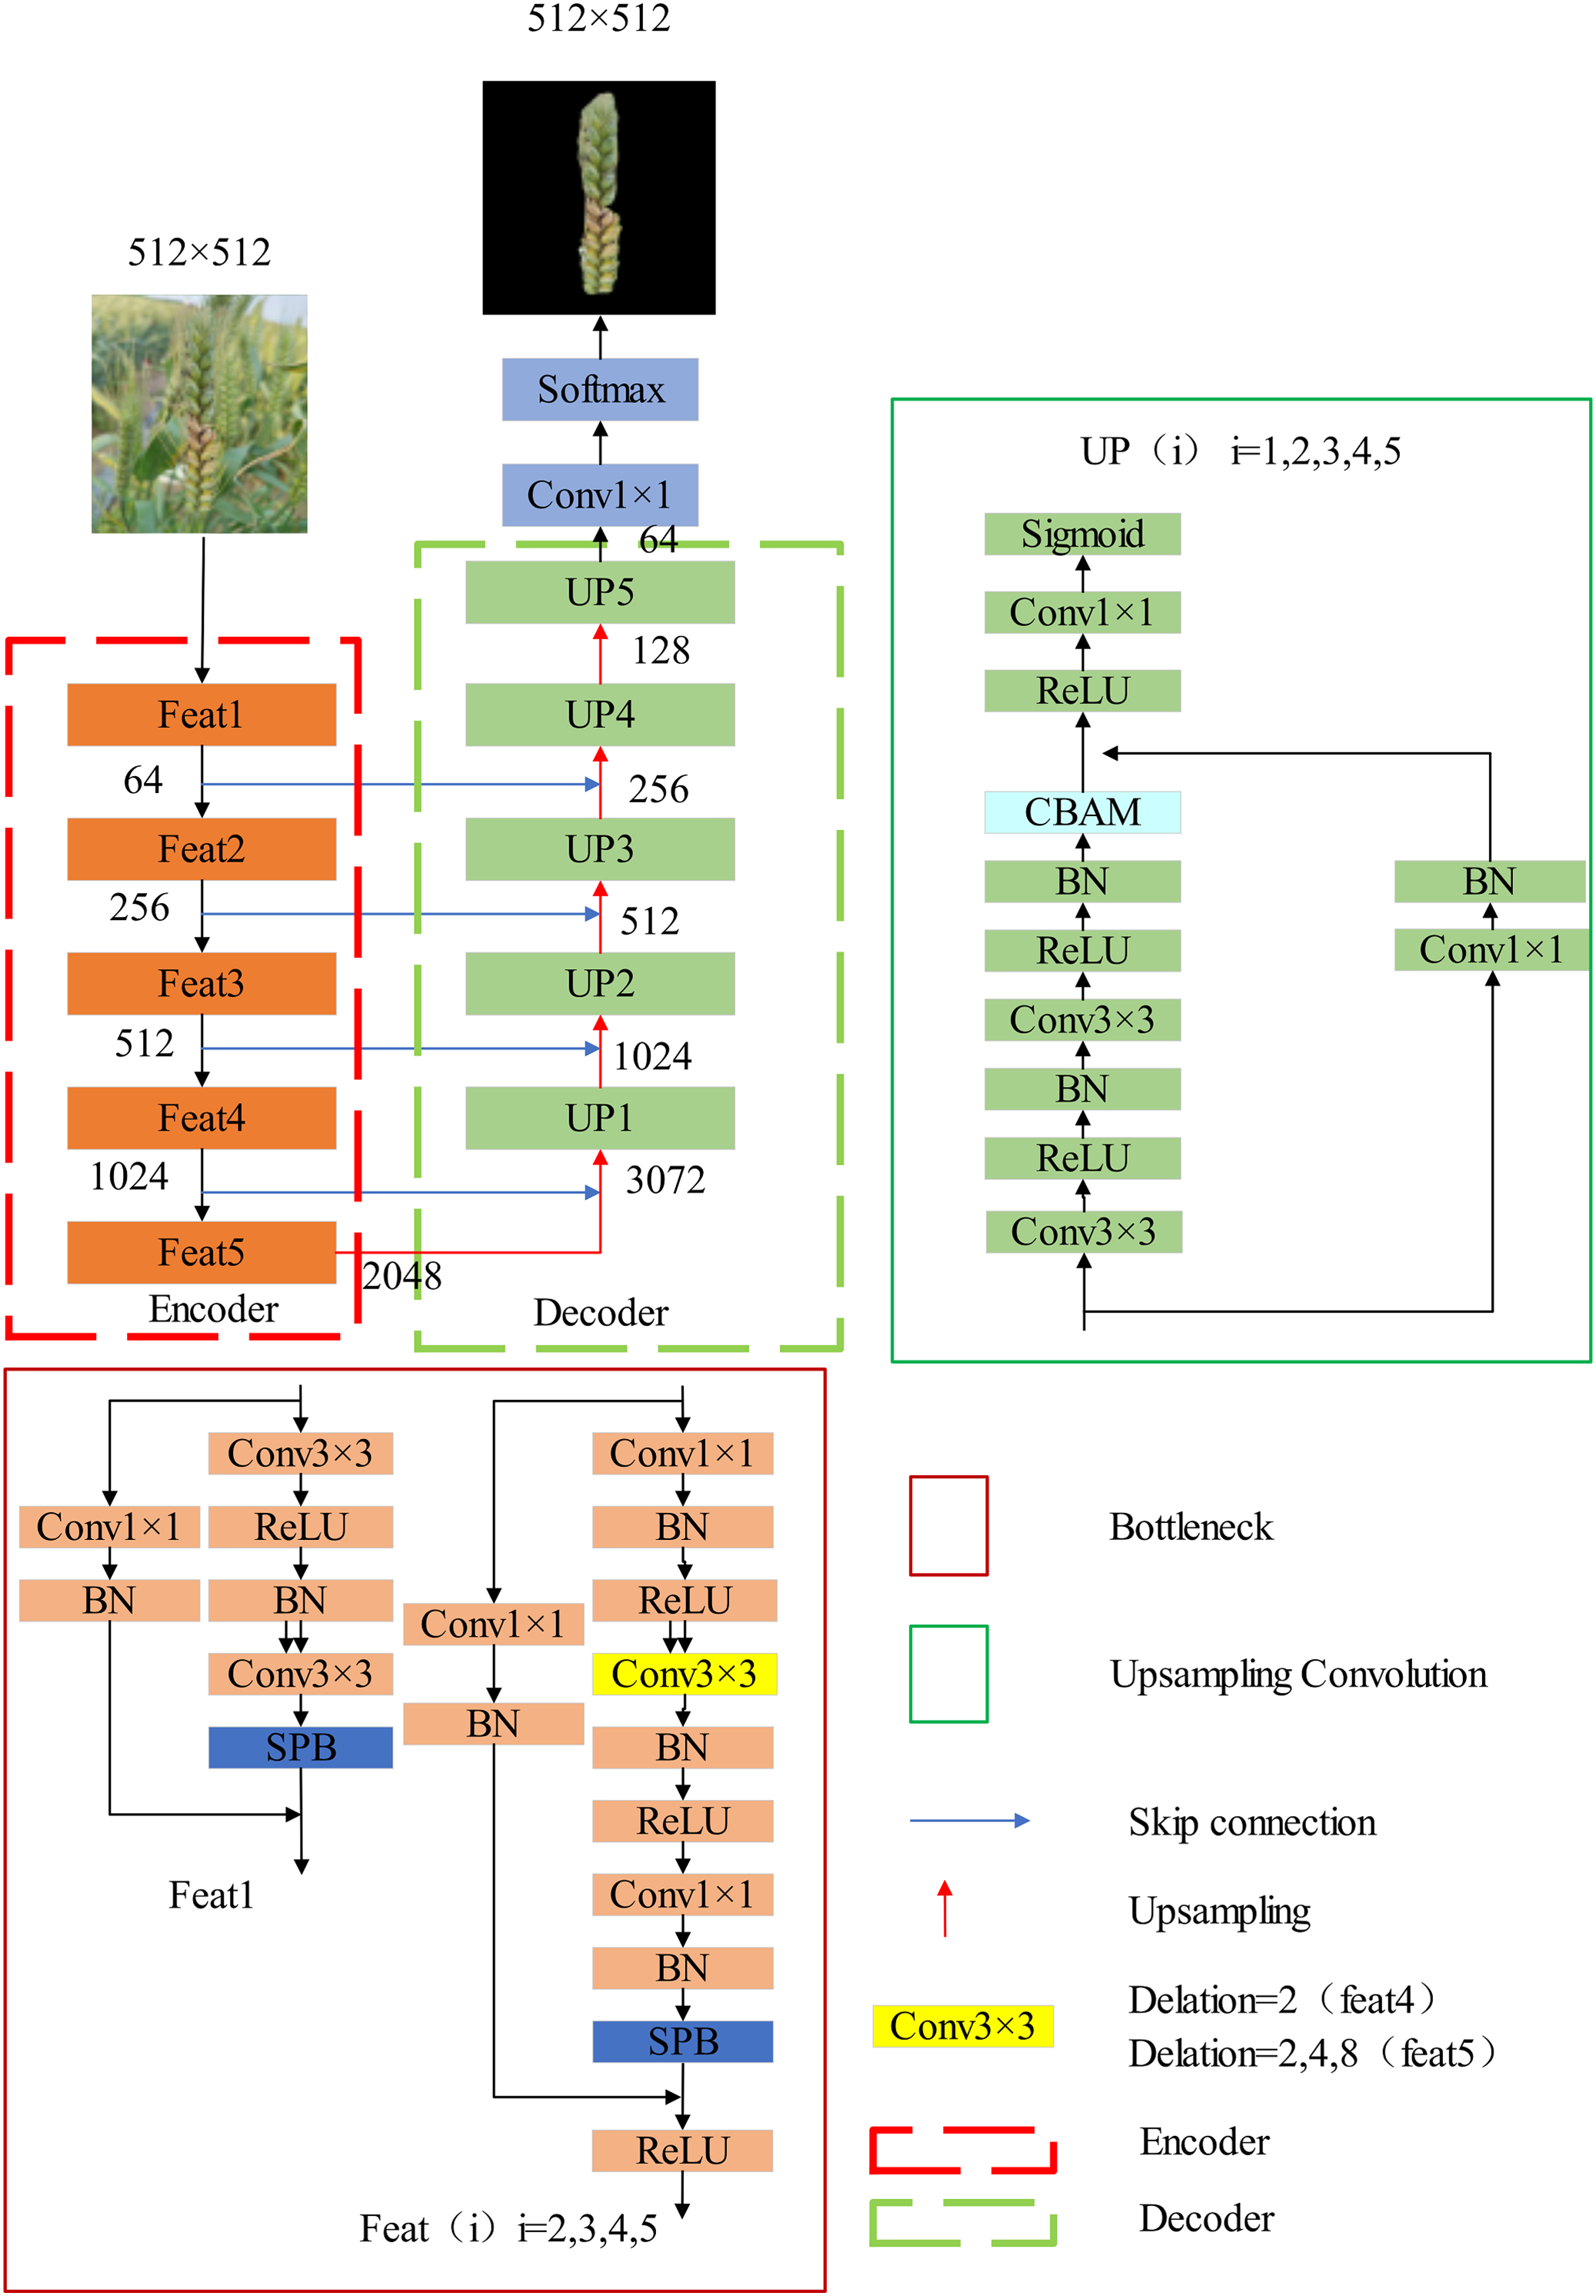
As shown in Fig. 3, the SAU-Net model includes five encoder layers (Feat) and five decoder layers (UP). Both the encoder and decoder employ residual units, with a combination of batch normalization, rectified linear unit (ReLU) activation functions, and convolutional layers. The encoder down-samples the input feature maps, reducing their size from 512 512 to 16 16 with 2,048 channels by the fifth encoder layer (Feat5). Following this, the output feature map from Feat5 undergoes up-sampling, resulting in a 32 32 feature map. This up-sampled feature map is then concatenated with the output from Feat4, and through convolutional operations within the UP layers, the output of UP1 is obtained. This cycle is repeated until the final output map is achieved.
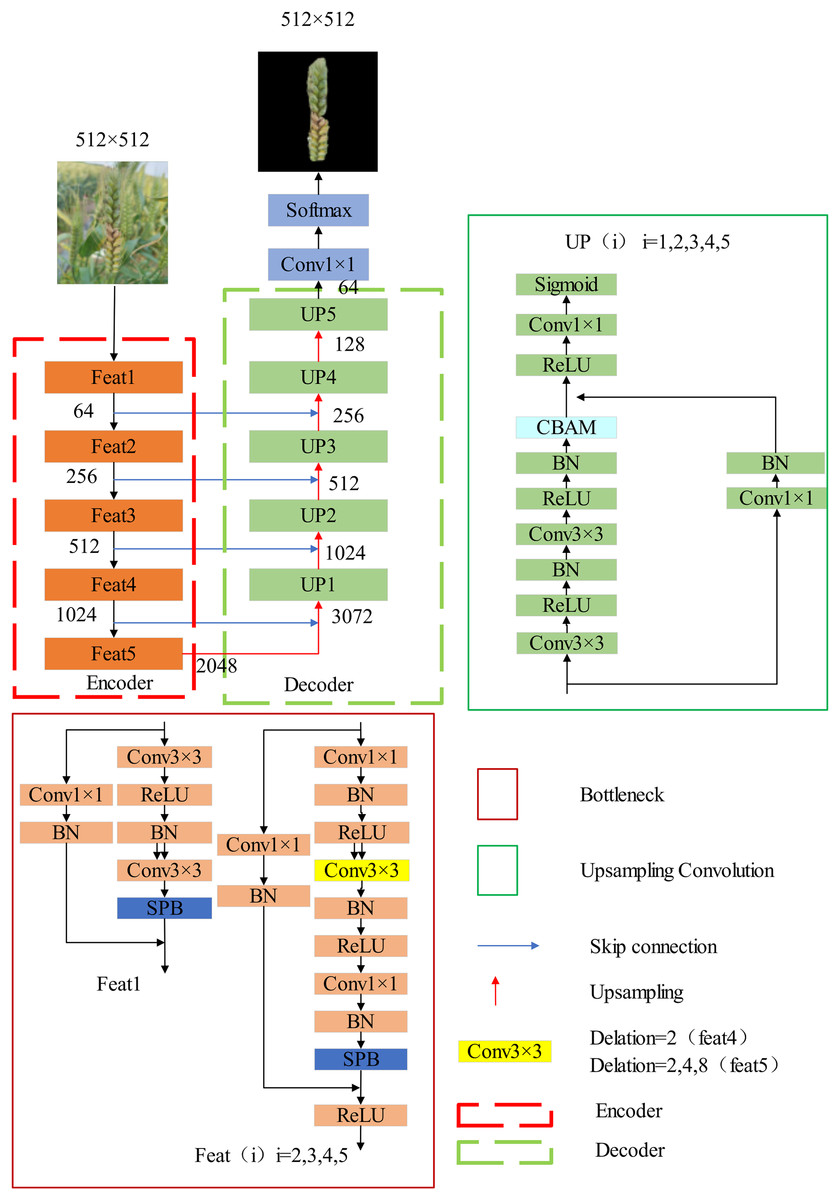
Figure 3: SAU-net network architecture.
In wheat spike segmentation tasks, where the structure often appears rectangular, SPB modules are introduced into the encoder module to avoid standard square convolutions capturing irrelevant regions, enabling more characteristic feature extraction. To expand the receptive field and capture a broader range of contextual information, dilation convolution blocks with varying dilation rates are incorporated into the encoder layers Feat4 and Feat5 (Hu, Liu & Ji, 2022). The decoder also utilizes residual units, where low-level feature maps are first up-sampled and then concatenated with corresponding encoder feature maps. To enhance the validity of the feature maps and optimize their spatial and positional information, CBAM attention modules are included in each unit. A combined loss function is used to enhance feature discrimination and improve overall network performance.
Stripe pooling block
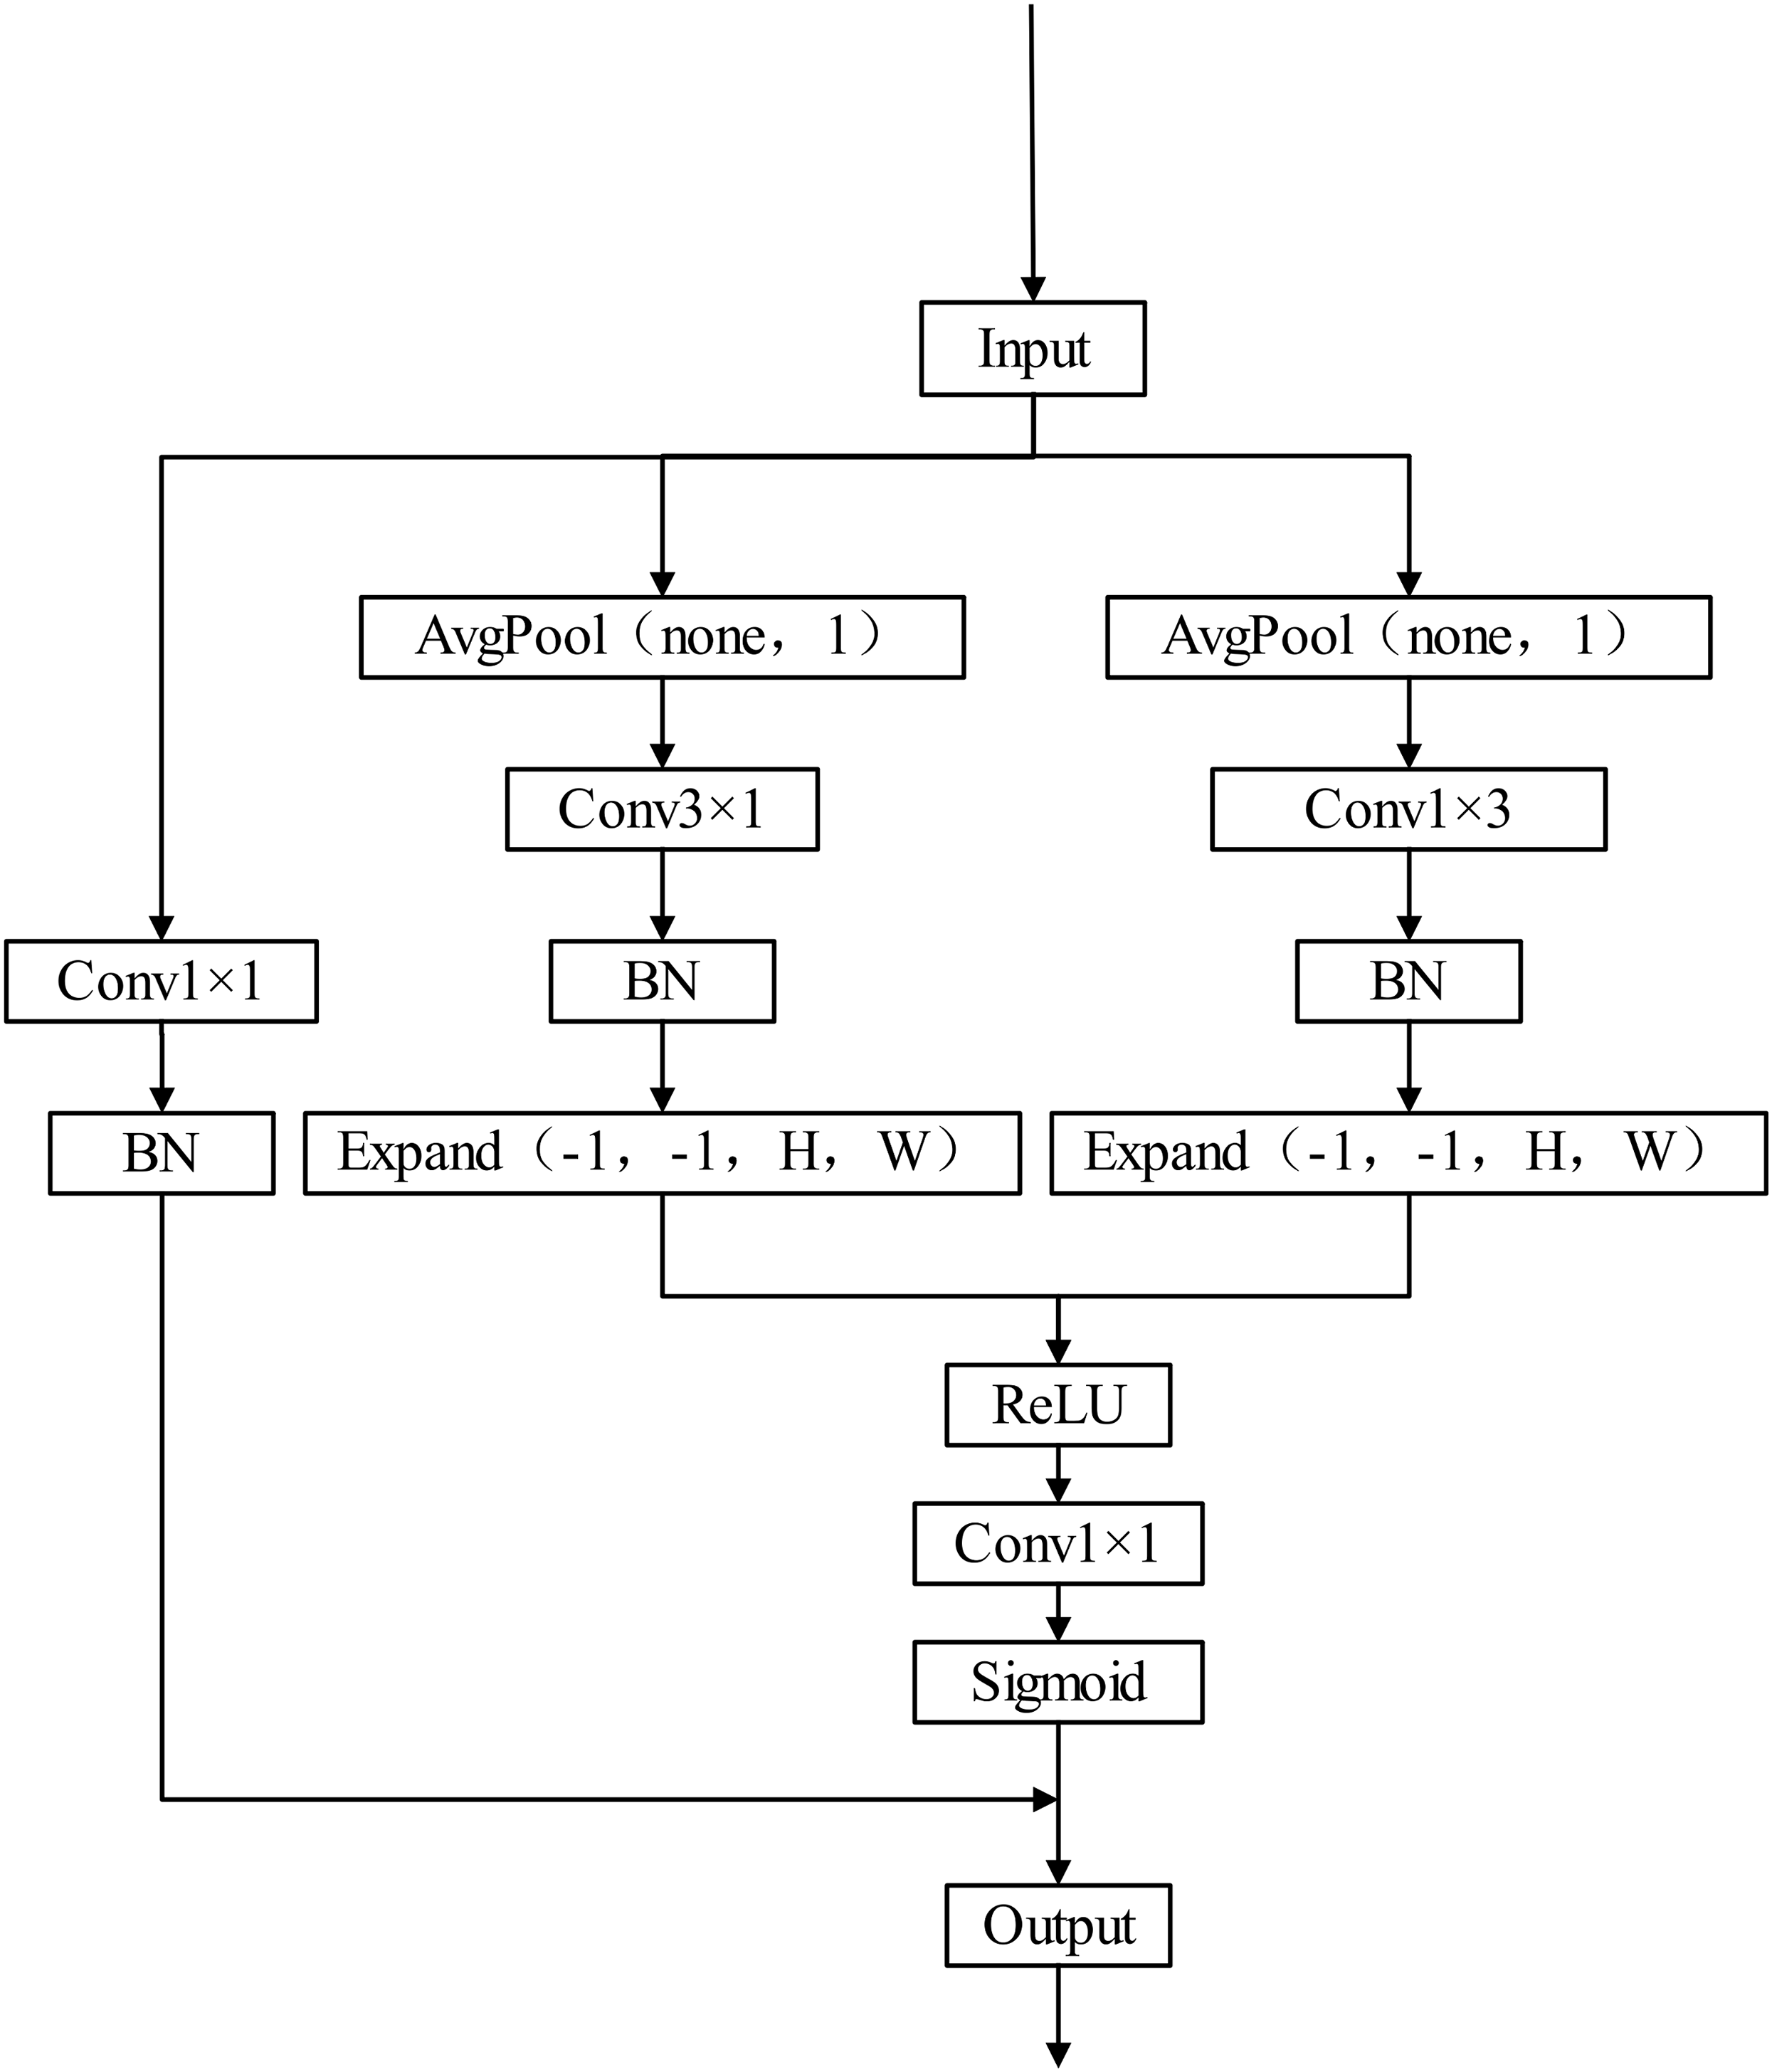
The core concept of stripe pooling block (SPB) is to capture texture features in different directions, as illustrated in Fig. 4. The process begins with two adaptive average pooling layers, pooling the input tensor in both the vertical and horizontal directions, reducing the image’s height or width to 1 while retaining the number of channels. The pooled results are then subjected to two different convolution operations. In the horizontal direction, a 1 n pooling operation is applied to convert the feature map into an n 1 representation (the input feature map is n n), followed by rescaling the feature map back to n n through nearest-neighbor interpolation. Similarly, in the vertical direction, n 1 pooling is used to transform the feature map to 1 n, eventually yielding an n n feature map. These two feature maps are merged through a superposition operation and then passed through a 1 1 convolution layer with a Sigmoid function to create a weight matrix. The resulting feature map is obtained by multiplying this weight matrix with the original feature map. The SPB pooling mechanism effectively captures stripe and texture information from the image, providing the model with richer contextual information. Unlike dilated convolutions, which are constrained to local regions, SPB can consider long-range pixel dependencies. Additionally, its low parameter count and computational overhead make it a more efficient method for capturing global contextual information. In wheat spike segmentation tasks, the use of SPB (Tian, Wang & Ding, 2019) has proven critical for improving segmentation accuracy.
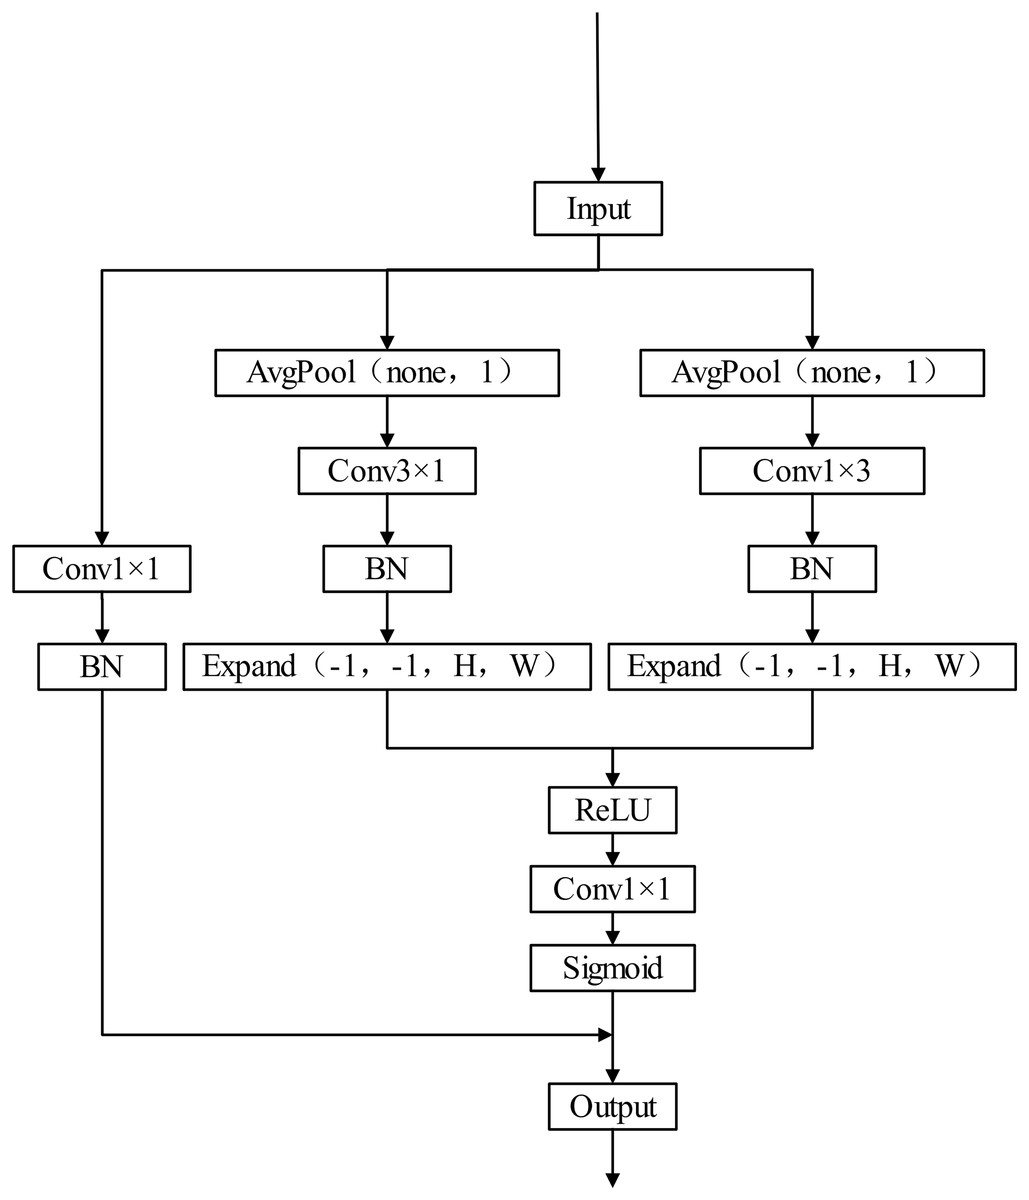
Figure 4: Structure of SPB.
Multi-scale dilated convolution
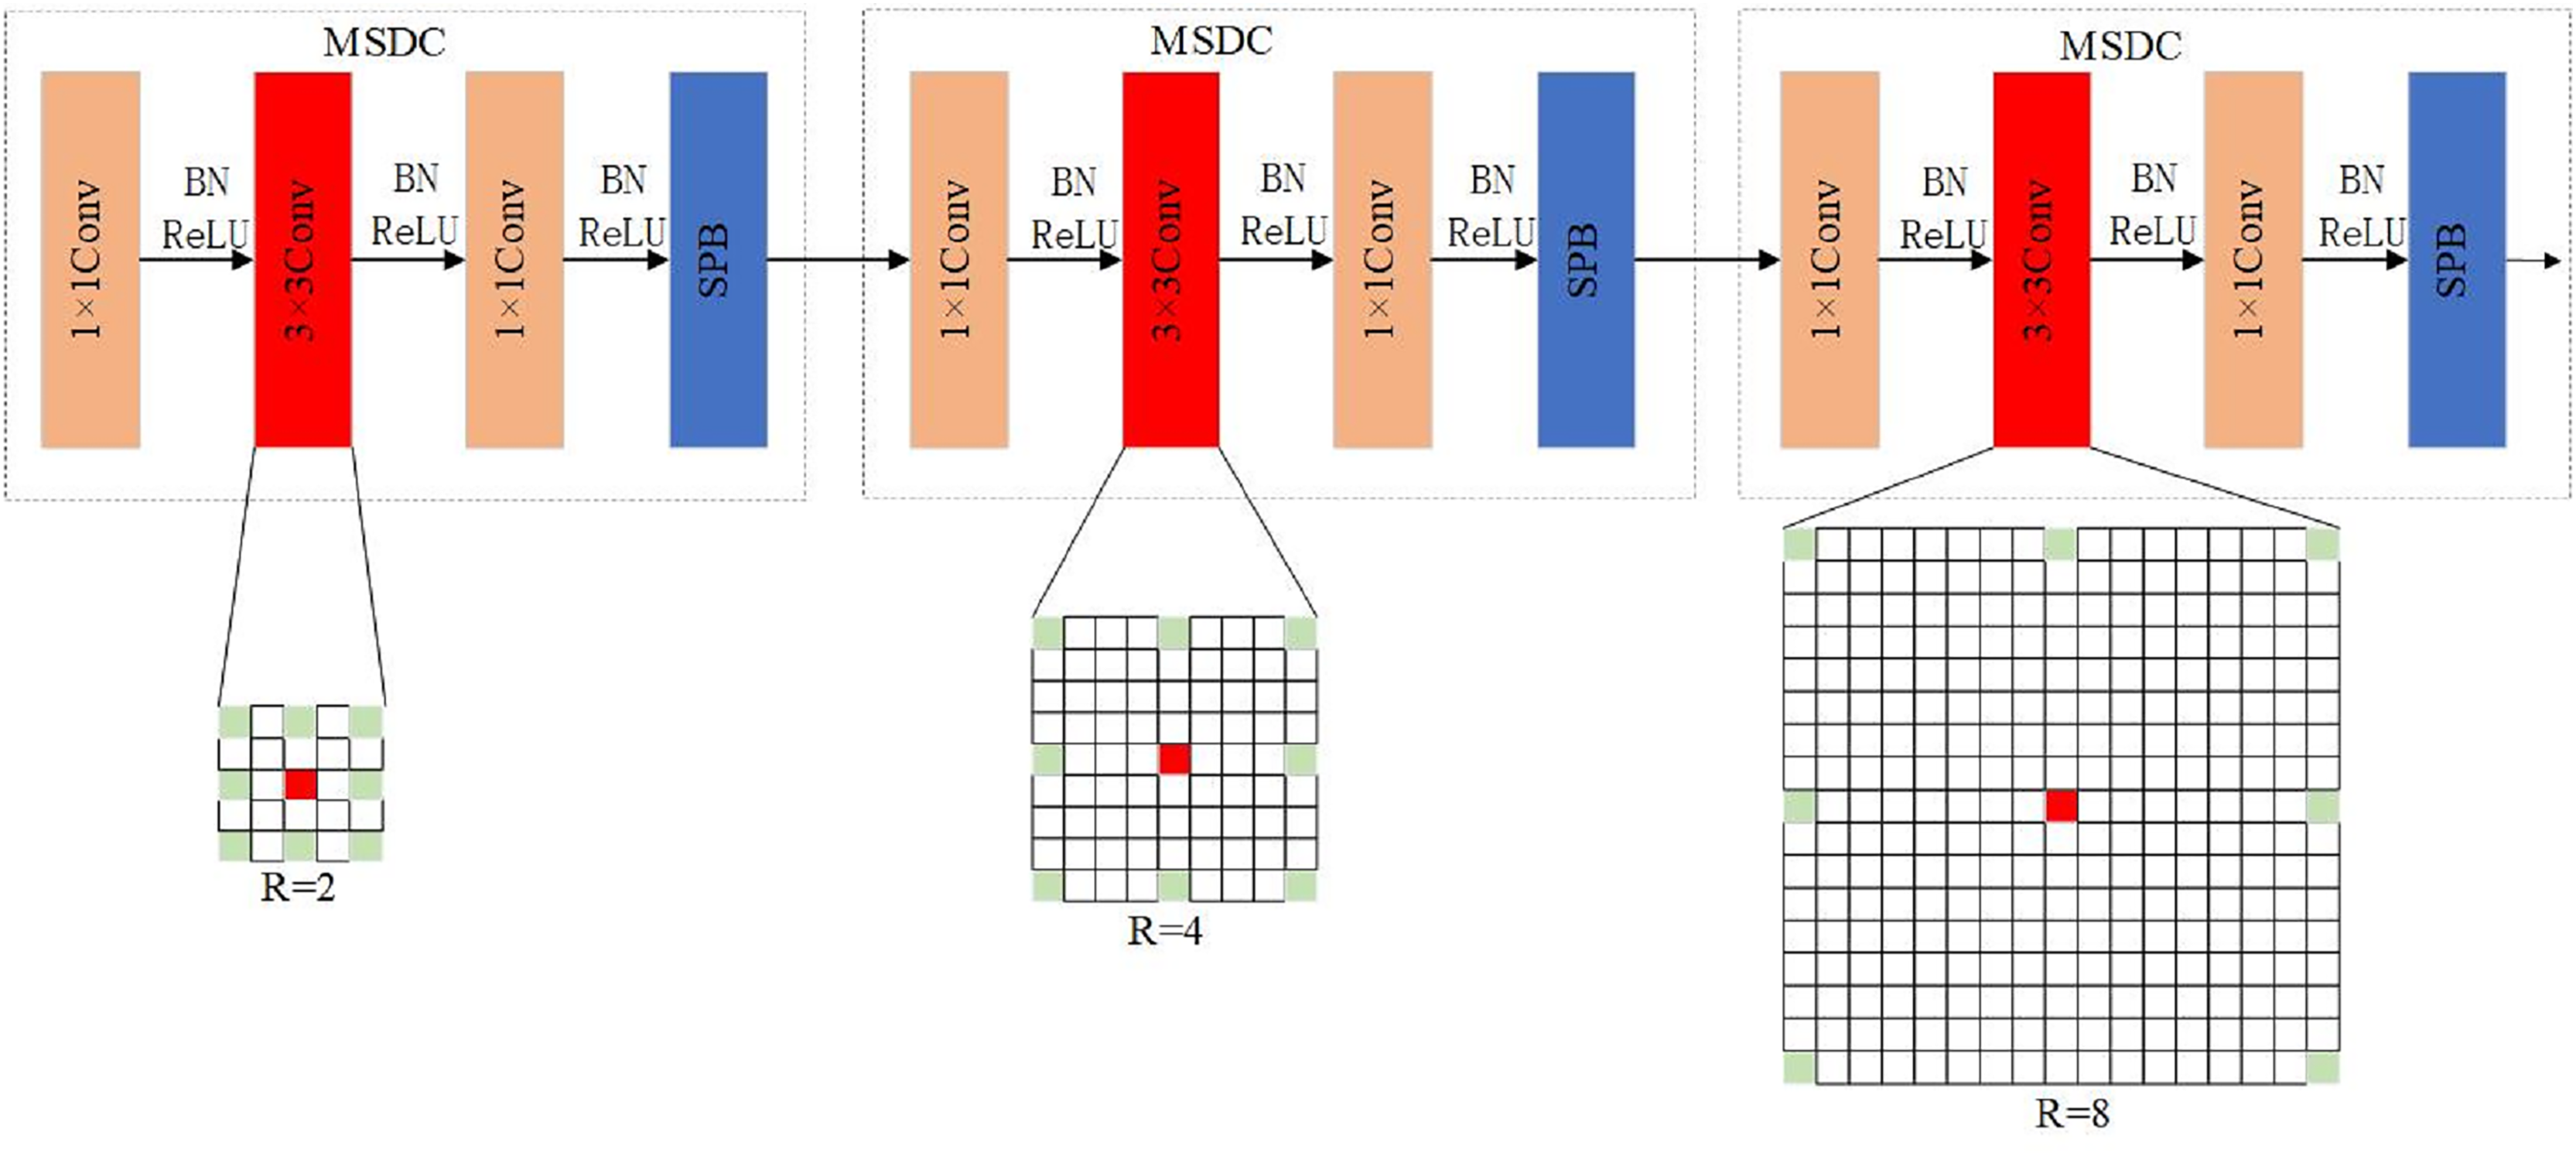
Edge details and contextual information are crucial for accurately segmenting wheat spike edges. To address this, the article introduces MSDC to replace the last two layers of the encoder, enabling the retention of spatial features from wheat spike images without losing key information. As depicted in Fig. 5, the MSDC structure (Deng, Xu & Zhou, 2021) modifies the final two convolution blocks of the encoder, replacing the 3 3 convolution in the Feat4 layer’s Bottleneck block with a dilated convolution with a dilation factor of 2. In Feat5’s Bottleneck block, the 3 3 convolution is replaced with dilated convolutions with dilation rates of 2, 4, and 8, respectively, allowing the extraction of global features at different levels. The exponential expansion rate (r = 2, 4, 8) can ensure that the receptive field grows geometrically, forming a continuous coverage from local details to the global context, r = 2. The receptive field was expanded to 5 5 to capture local fine features such as awn and spike grain (such as awn tip texture); r = 4. The receptive field was expanded to 9 9 to extract the medium-range context (such as the complete morphology of a single spike of wheat); r = 8. The receptive field was expanded to 17 17 to model the global distribution law (such as the population arrangement pattern of dense wheat spikes). This receptive field expansion adapts to the biological characteristics of wheat spikes. The length width ratio of wheat spikes is usually 3:1 to 5:1, which is in a slender shape. It needs a large receptive field to capture its extension direction, and with a dilation rate of 8 can cover the long axis direction; the wheat spike density in the field can reach 200 to 300 spikes per square meter, and the distribution is dense. The medium range receptive field with r = 4 can distinguish the adjacent spikes; the color of wheat spikes and leaf edges is similar. Through the expansion convolution with r = 2, the local features are strengthened and the segmentation effect is improved.
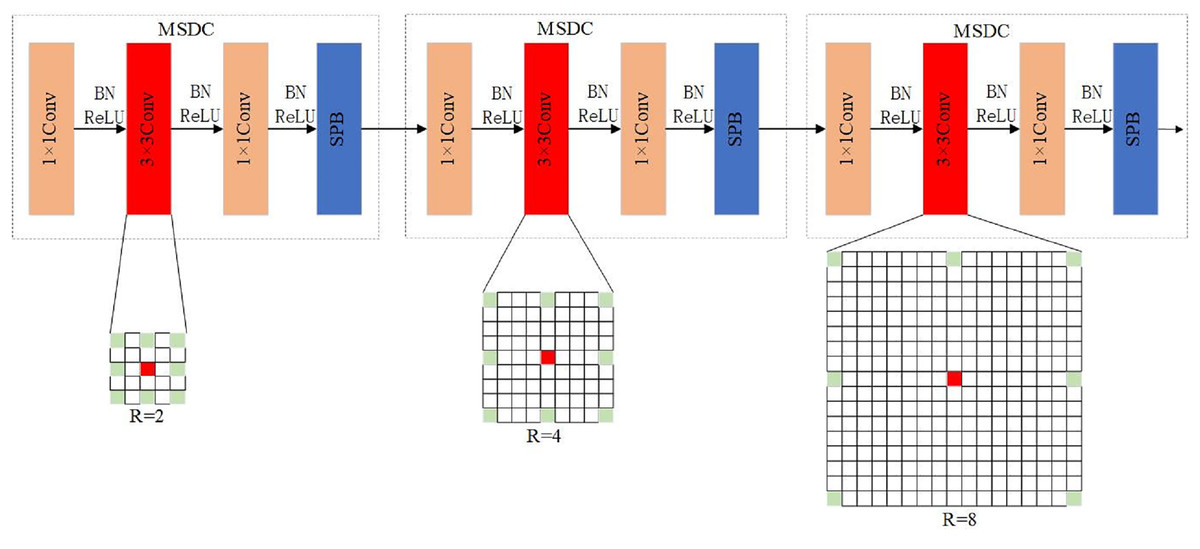
Figure 5: Multi-scale dilated convolution structure.
In the U-Net architecture, the shallower feature maps are used for pixel localization, while the deeper feature maps have larger receptive fields, aiding in a better understanding of the overall image structure and semantic information. MSDC, used in the last two convolution layers of the encoder, allows the network to receive feature maps after multiple down-sampling operations and perceive features at different scales without reducing resolution. This structure enables the decoder to use features with varying receptive fields, aiding in the better capture of contextual information. Edge details and contextual information are crucial for wheat spike segmentation tasks, and this approach is key to accurately segmenting wheat spikes.
Convolutional block attention module
CBAM demonstrates superior capability in precisely localizing and identifying target regions of interest. In contrast to the channel-only SE attention module (Li, Li & Zhao, 2024), CBAM employs convolutional operations to achieve hybrid channel-spatial feature extraction by integrating both channel and spatial information. Through the coordinated operation of its channel attention module (adaptively adjusting channel-wise feature weights) and spatial attention module (modulating spatial feature weights), CBAM enables automatic feature recalibration. This mechanism selectively emphasizes informative features while suppressing non-essential ones through learned global contextual information, with experimental validation confirming higher MIoU than baseline SE in dense wheat spike occlusion scenarios.
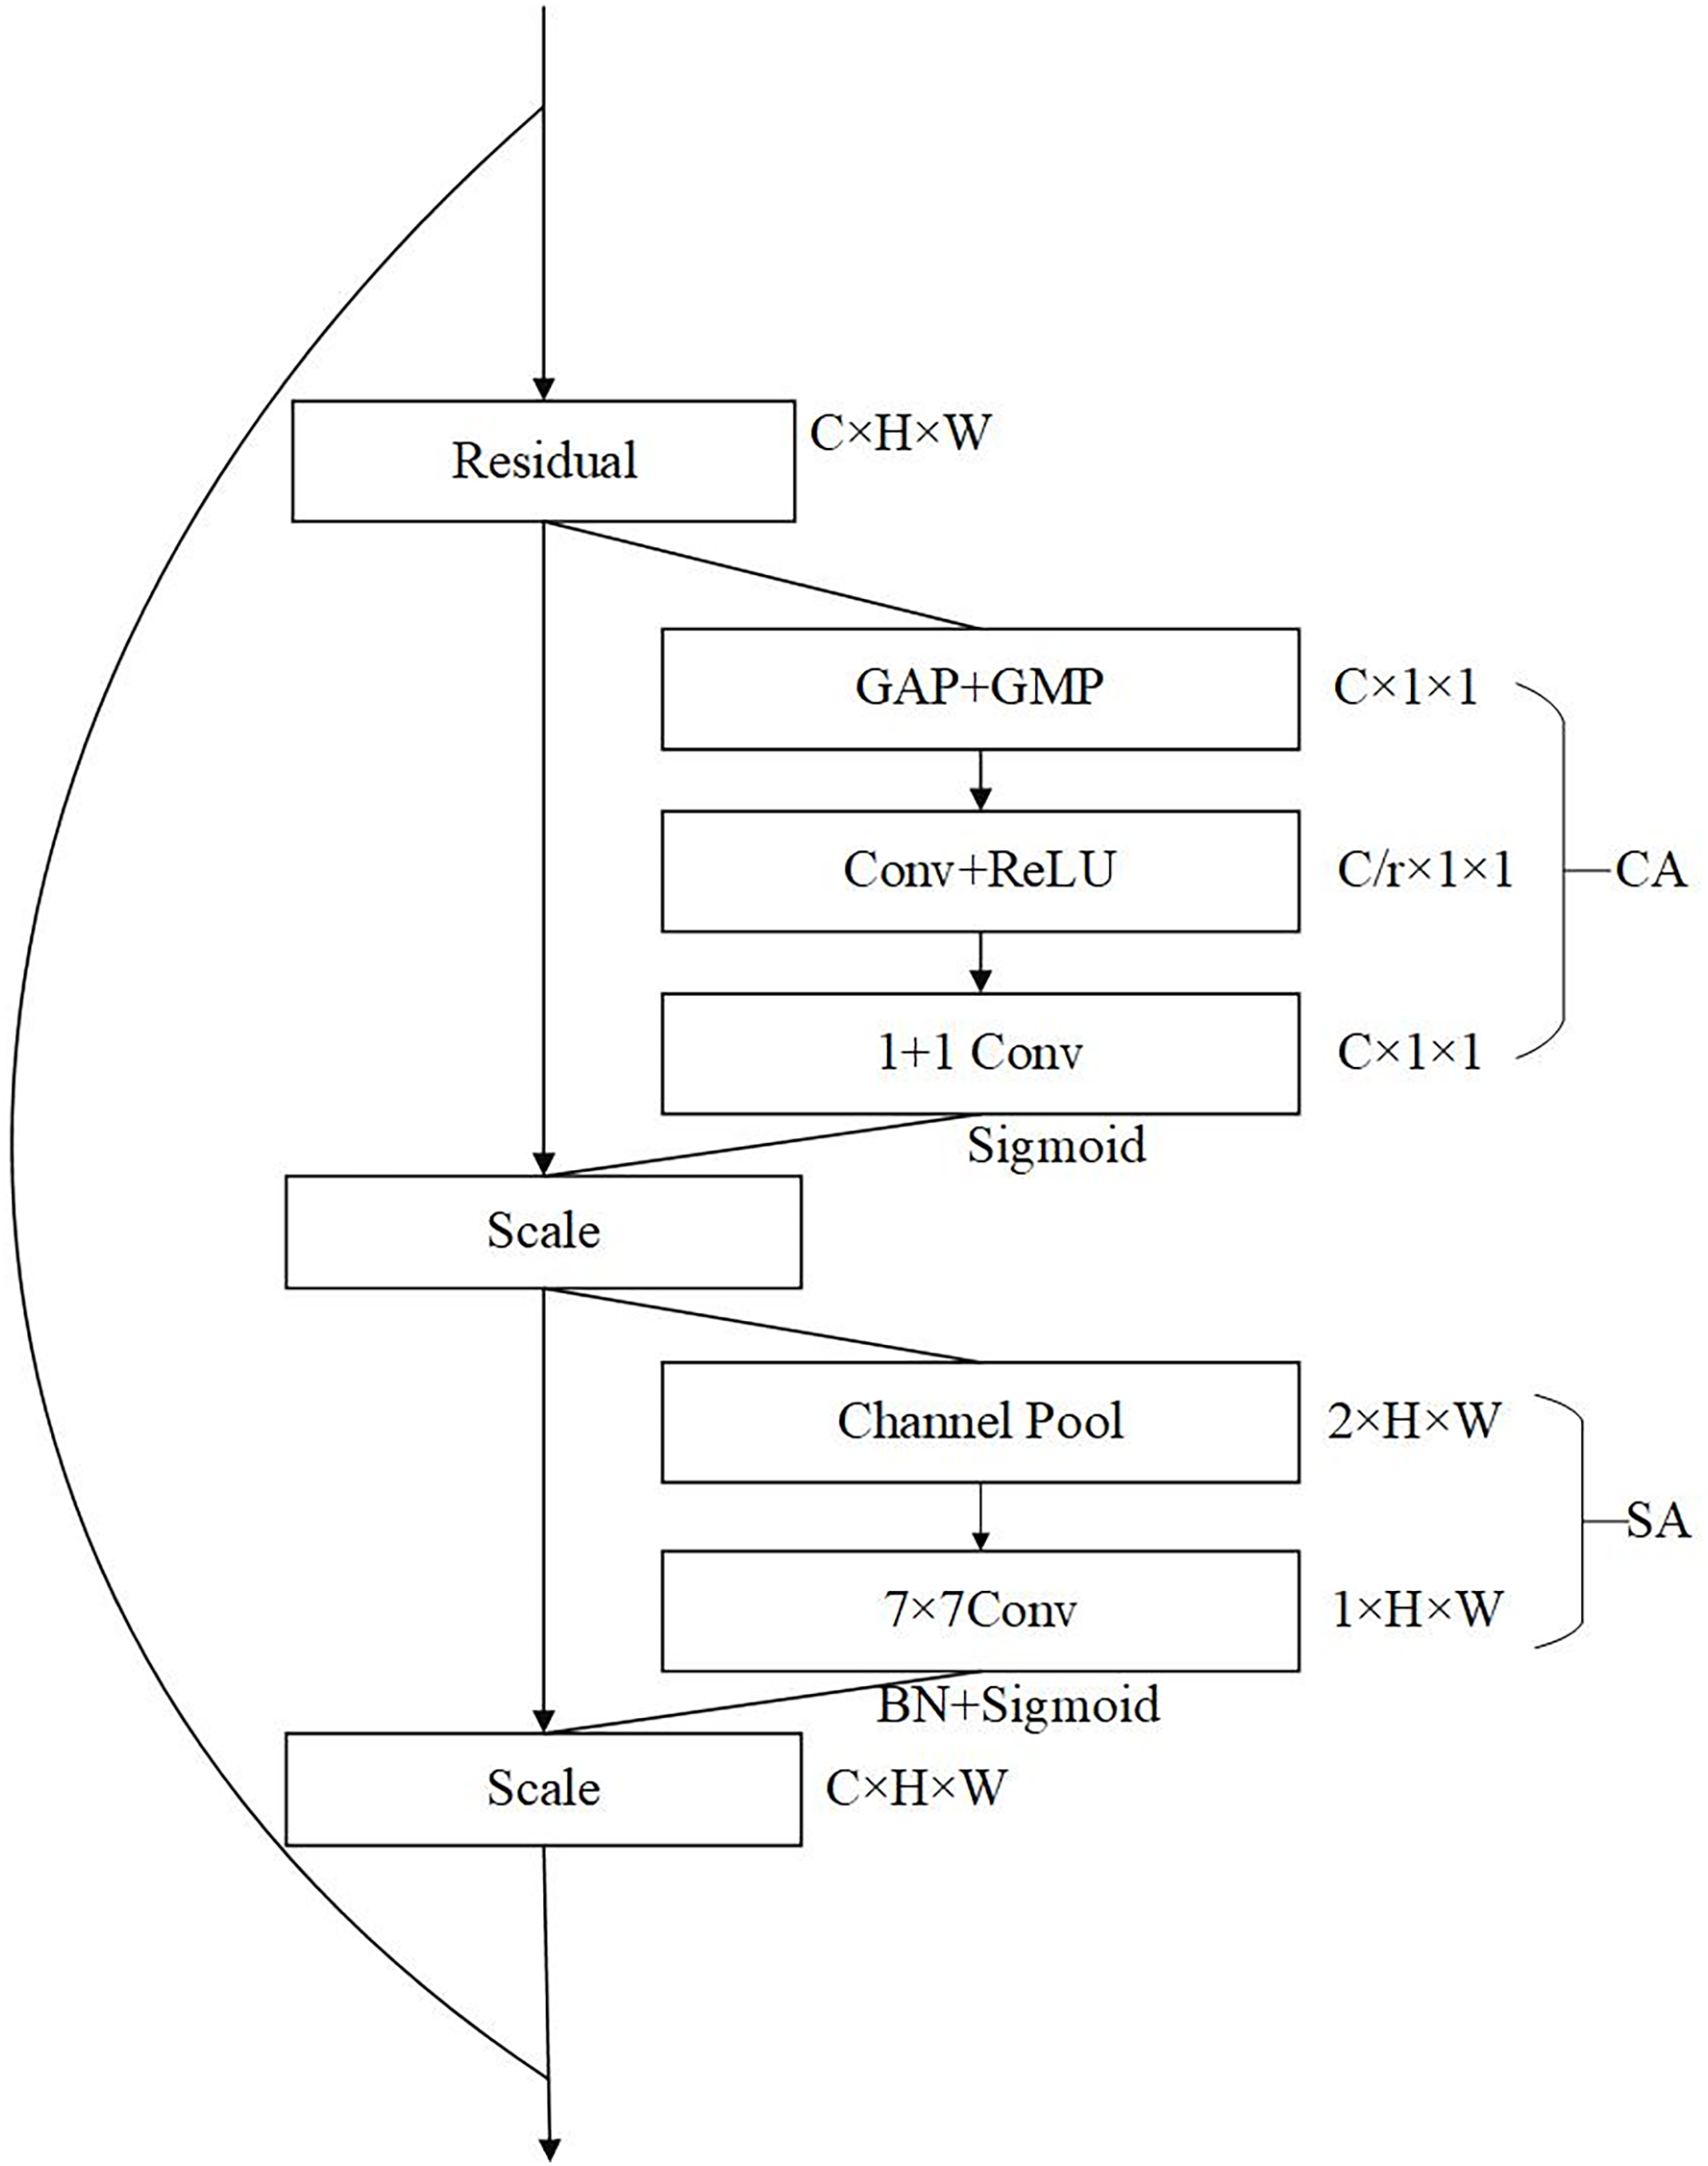
The structure of the CBAM attention module is shown in Fig. 6. It can be seen from the structure in the figure that CBAM is composed of channel attention and spatial attention, which are cascaded in sequence. The channel attention is located in the upper half, and the size of the received input feature map is C H W. The global semantic information of wheat spikes (such as the overall color distribution of spikes) is captured through the global average pooling (GAP), and the global maximum pooling (GMP) strengthens the local significant features (such as wheat awn texture), and then the pooling results are compressed to the c/r dimension through convolution to reduce the interference of redundant features. Then the number of channels is restored by convolution, and finally the channel weight is generated through the sigmoid function normalization. This process can enhance the wheat spike correlation channel and suppress the background noise channel (Liakos et al., 2018). The channel attention at the bottom, the received input is the channel weighted characteristic graph. First, channel pool should be done, that is, average pool and maximum pool should be done along the channel dimension to generate two channel spatial description graphs, which respectively represent the statistical distribution and local extreme value of wheat spikes. Then, the spatial weight is learned through large kernel convolution (7 7) to adapt to the distribution characteristics of the slender shape of wheat spikes. Finally, the sigmoid function is used to normalize the output to generate the spatial attention weight (Zhao, Shi & Qi, 2017). The processing of spatial attention can focus on the dense wheat spike area, suppress the interference areas such as leaves and stems, and improve the segmentation accuracy of spike leaf adhesion scene. The use of CA (channel attention) and SA (spatial attention) also has a good impact on the robustness of the model. The channel attention captures the local highlight characteristics of wheat spikes under strong light (such as the reflection of spikes at maturity) through GMP, and gap balances the overall brightness distribution, reducing the impact of image overexposure or underexposure, so that the model can adapt to the change of light; spatial attention models long-distance dependence through 7 7 large kernel convolution to recognize partially occluded wheat spike contours, which can improve the intersection and union ratio in dense occlusion with high inter spike overlap rate.
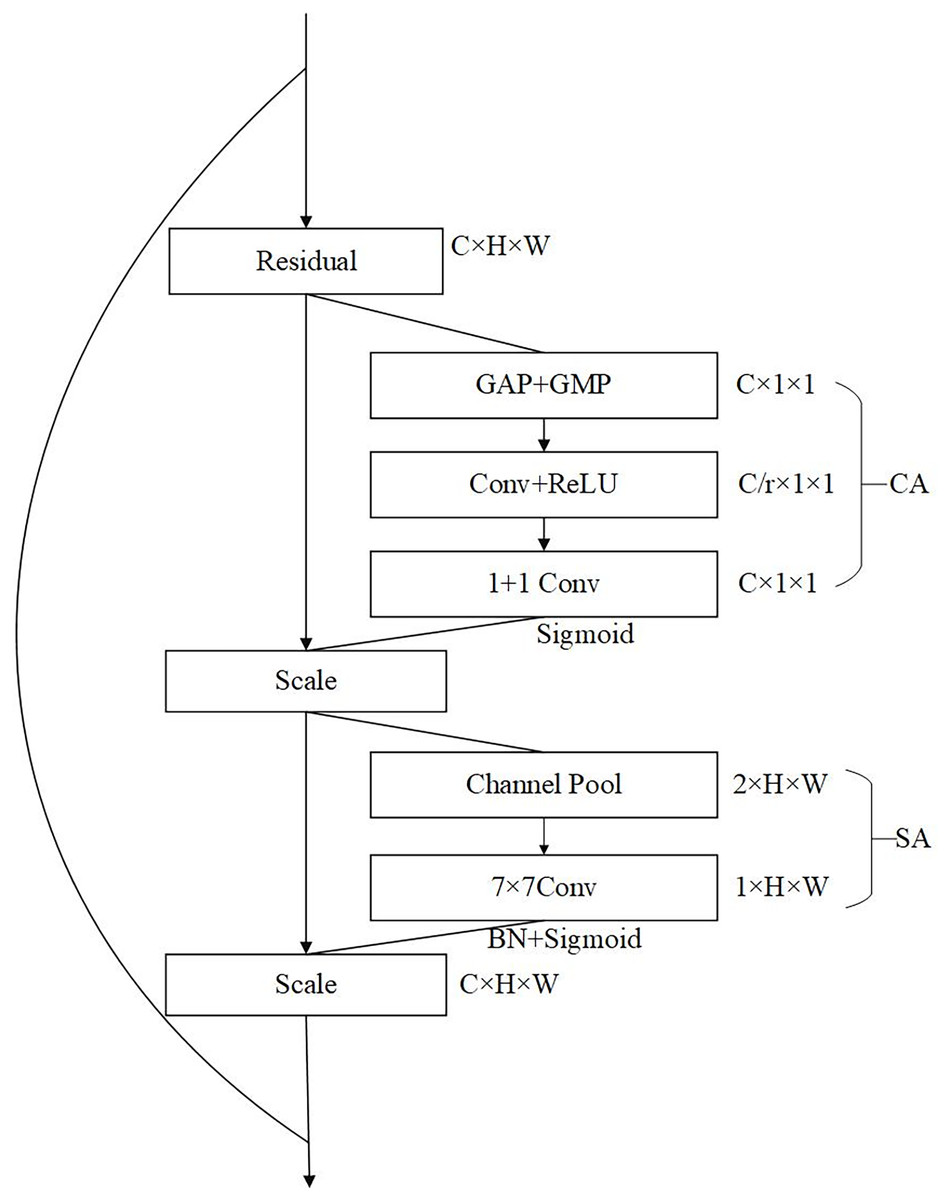
Figure 6: CBAM attention module.
In the U-Net segmentation model, the encoder’s primary task is to extract multi-scale features through layer-wise downsampling, focusing on the abstraction of low-level features (edges/textures) to high-level semantics (overall panicle shape). It mainly carries category semantic information, and spatial attention at this stage provides limited assistance for pixel-level localization (Hu, Shen & Sun, 2018). The decoder’s core task is to restore spatial details through upsampling and skip connections while receiving features from various encoder stages (Feat1 Feat5). At this stage, CBAM can adaptively adjust features based on their characteristics. For low-level features (Feat1 Feat3), spatial attention is used to enhance wheat awn and grain edges. For high-level features (Feat4 Feat5), channel attention is employed to strengthen semantic distinctions between the panicle and background. This combination further improves image segmentation performance. To verify the better effectiveness of attention modules in the decoder, this article conducted comparative experiments by setting attention modules in the encoder, decoder, and model’s skip connections. As shown in Table 1, the experimental results demonstrate the effectiveness of placing attention modules in the decoder.
| CBAM location | MIoU/% | ACC/% | MPA/% |
|---|---|---|---|
| Attention in decoder | 86.85 | 97.34 | 93.17 |
| Attention in encoder | 86.30 | 97.23 | 92.27 |
| Attention in skip connection | 85.79 | 96.6 | 92.31 |
Loss function
The problem of wheat spikes image segmentation can be regarded as a pixel level classification problem in the task definition, that is, the pixels in the image are divided into two categories: those belonging to wheat spikes and those not belonging to wheat spikes. By observing the image data set, it is obvious that the background and noise account for a larger proportion in the image, that is, the pixels not belonging to wheat spikes are far more than those belonging to wheat spikes. Therefore, wheat spikes image segmentation is also a typical pixel category imbalance problem. To address the problem of class imbalance in binary wheat image segmentation samples, this article constructs a combined loss function, which consists of Dice loss (DL) and focal loss (FL) (Sun, Gong & Yao, 2022).
Dice loss measures the degree of overlap between two samples. In binary classification, the formula for the Dice coefficient is:
where X represents the set of pixels predicted as positive in the segmentation image, Y represents the set of positive pixels in the ground truth segmentation image, and The intersection of X and Y is the size of the intersection between the two sets. DL is defined based on the Dice coefficient, as follows:
Thus, a larger Dice coefficient indicates a smaller DL, reflecting a higher similarity between the predicted segmentation image and the ground truth, suggesting better model performance. Conversely, lower similarity indicates poorer model performance.
Focal loss is a dynamically scaled cross-entropy loss function designed to address the limitations of ordinary cross-entropy loss when dealing with class imbalance and hard-to-classify samples. The formula for FL is:
where is the class score (predicted probability) for a given class, and is the focusing parameter. The term acts as a modulation factor.
FL helps the network focus more on challenging samples, enhancing training speed and accuracy, and better balancing the loss contribution between classes.
Thus, this study combines FL and DL through a weighted summation to obtain a joint loss function, defined as:
Experiment setup and evaluation metrics
The experiment is implemented using the open-source framework PyTorch and the Python programming language. The hardware environment consists of an NVIDIA GeForce RTX 3090 (24 GB) GPU, an Intel Xeon Gold 6330 CPU, Python 3.8, PyCharm 2022.3, PyTorch 1.13.0, and CUDA 11.7. The training and testing datasets are split at a 9:1 ratio. The batch size for training is set to 8, the optimizer used is Adam, and the total number of iterations (epochs) is 250. The model’s accuracy is validated on the validation set every 5 iterations, and the best model is saved and updated every 10 iterations.
To validate the effectiveness of the algorithm, the following metrics are used for comparative experiments: MIoU, mean pixel accuracy (MPA), and accuracy (Zhu, Yu & Liang, 2023). The formulas for these metrics are as follows:
where k represents the number of classes, pij indicates the number of pixels that are predicted as class i and truly belong to class j, TP is true positive, TN is true negative, FP is false positive, and FN is false negative. These metrics provide comprehensive insights into the performance of the model in various aspects, such as segmentation accuracy, pixel-wise accuracy, and overall classification accuracy (Zhang, Wang & Gu, 2019).
Results and analysis
Loss function validation
To validate the generalization capability of different loss functions and identify the optimal loss function, the article trains U-Net with ResNet50 as the backbone network, comparing the training results of the combined loss function of FL and DL, the combined loss function of cross-entropy loss (CE Loss) and DL, FL, and CE Loss. As shown in Table 1, the combined loss function of Focal Loss and Dice Loss yields the best segmentation results, while the segmentation results of using only CE Loss or FL are slightly worse. Thus, the subsequent model training uses the combined loss function of FL and DL.
Ablation experiment results comparison
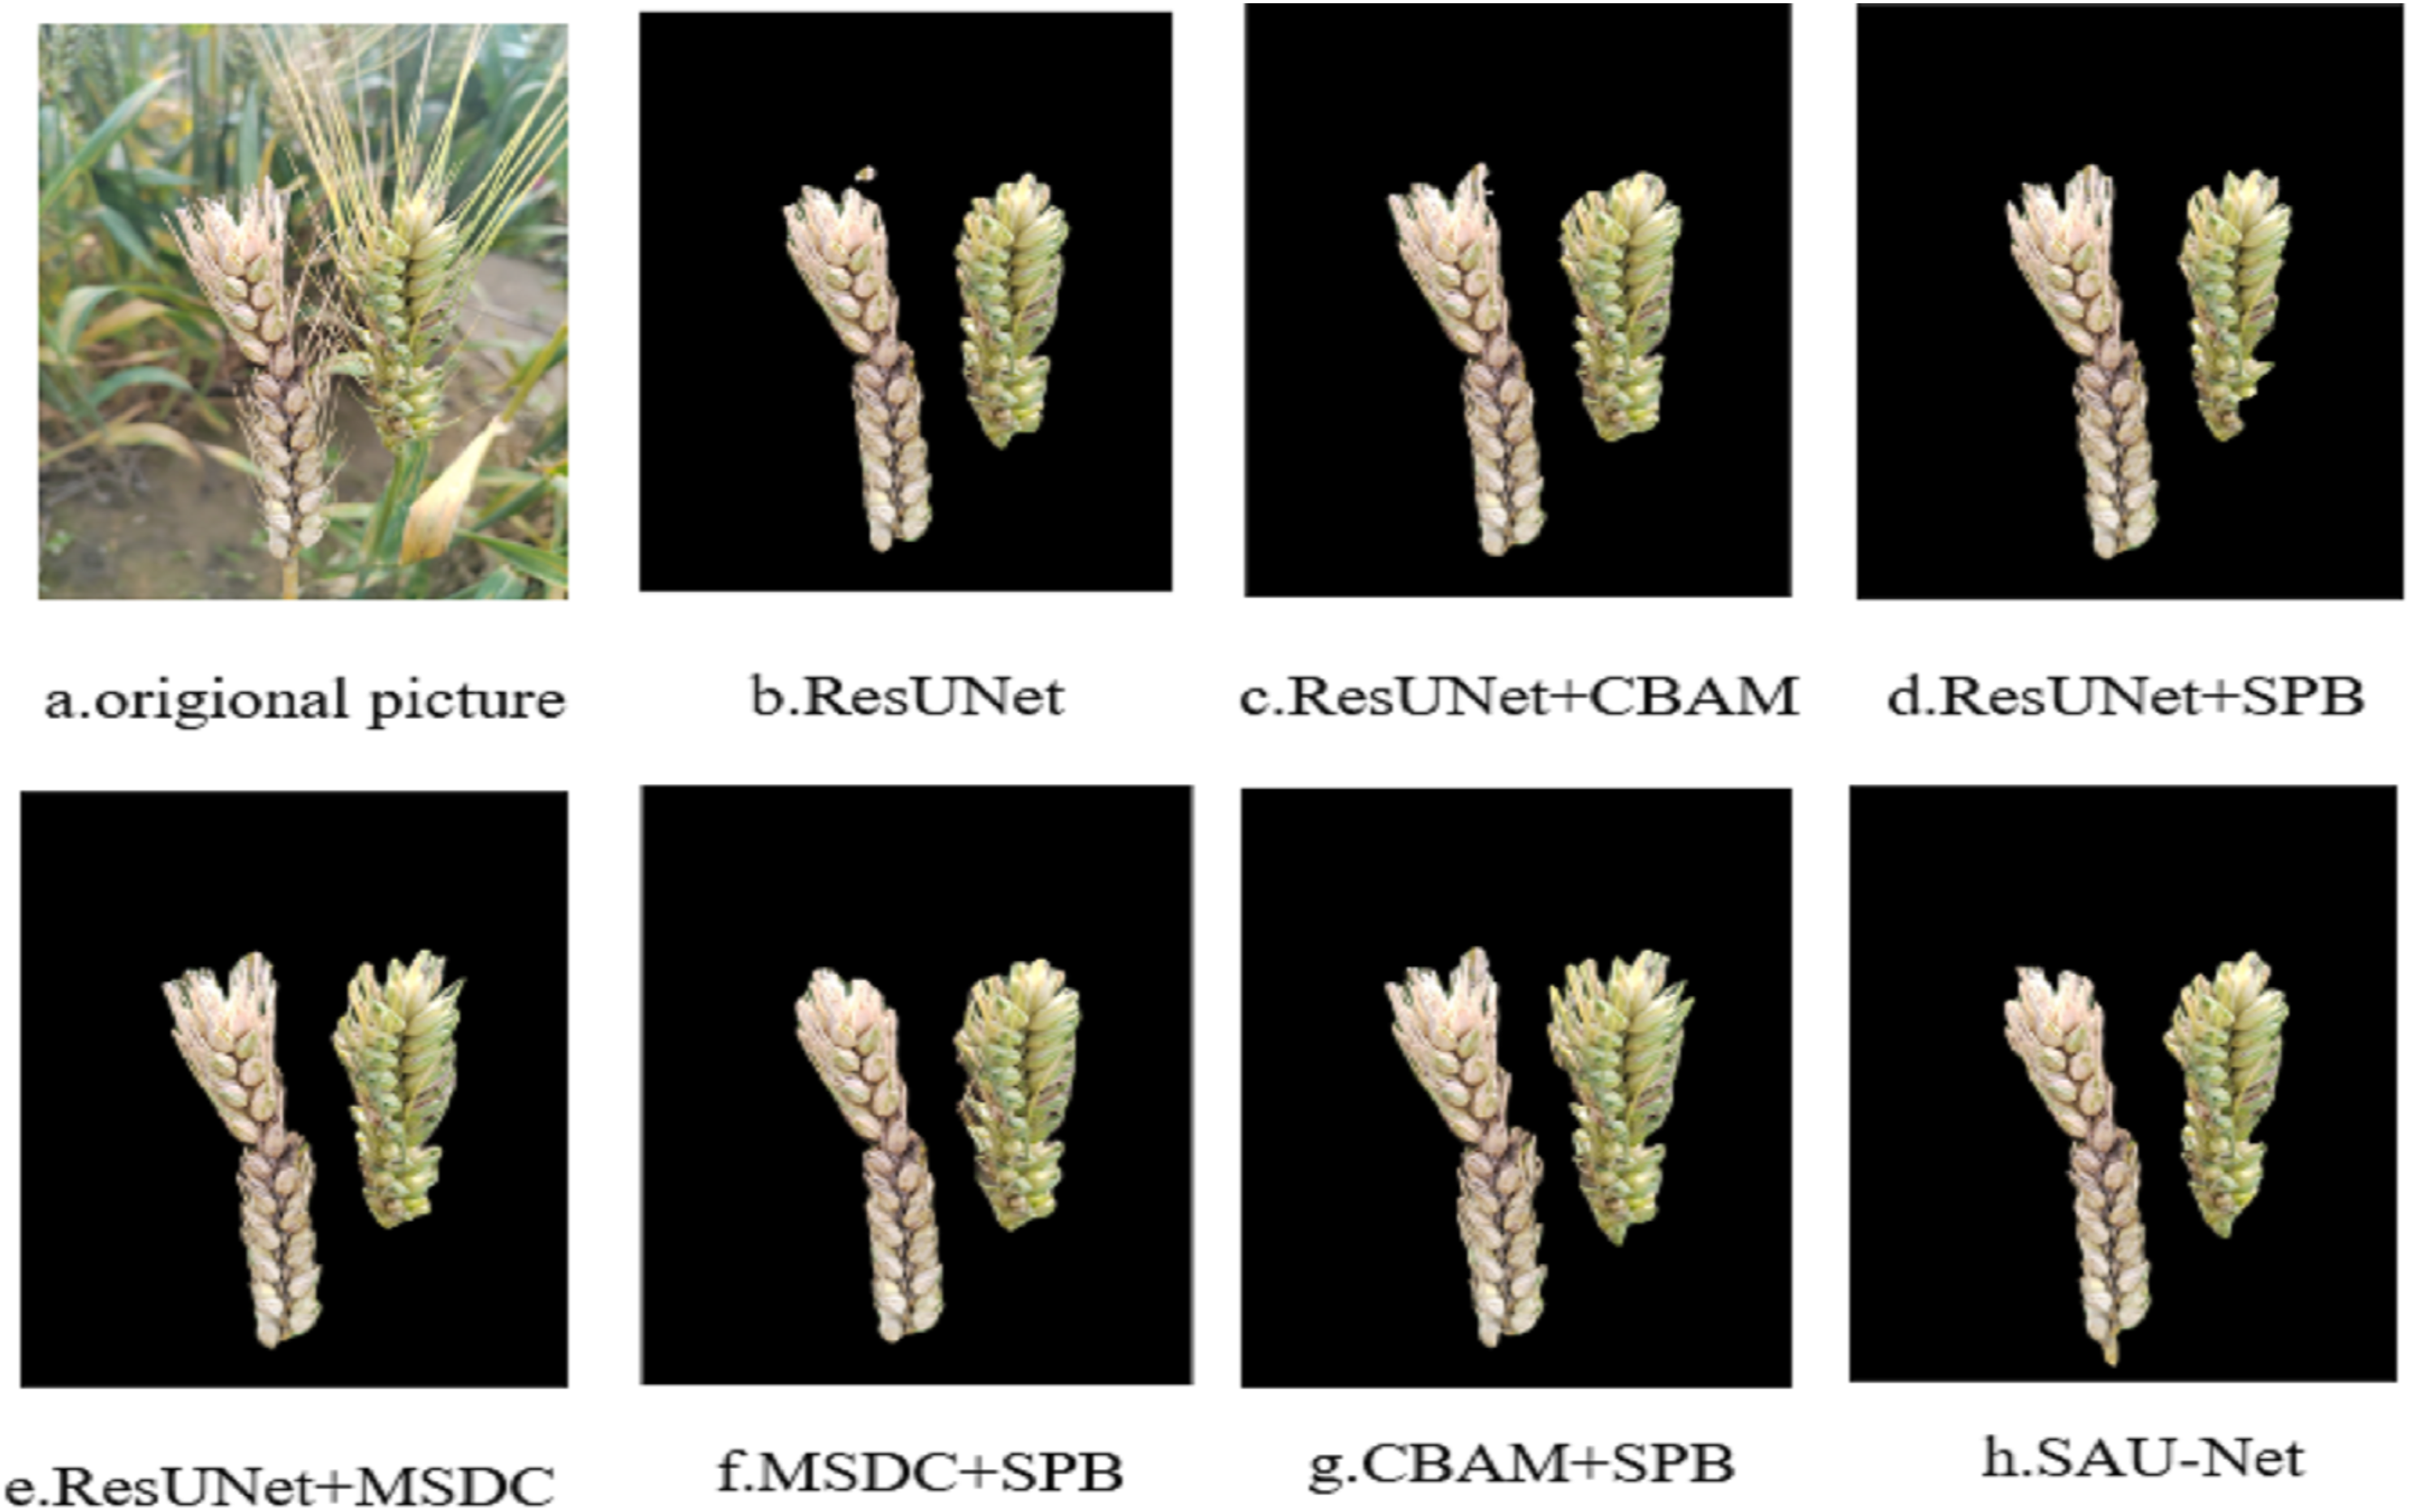
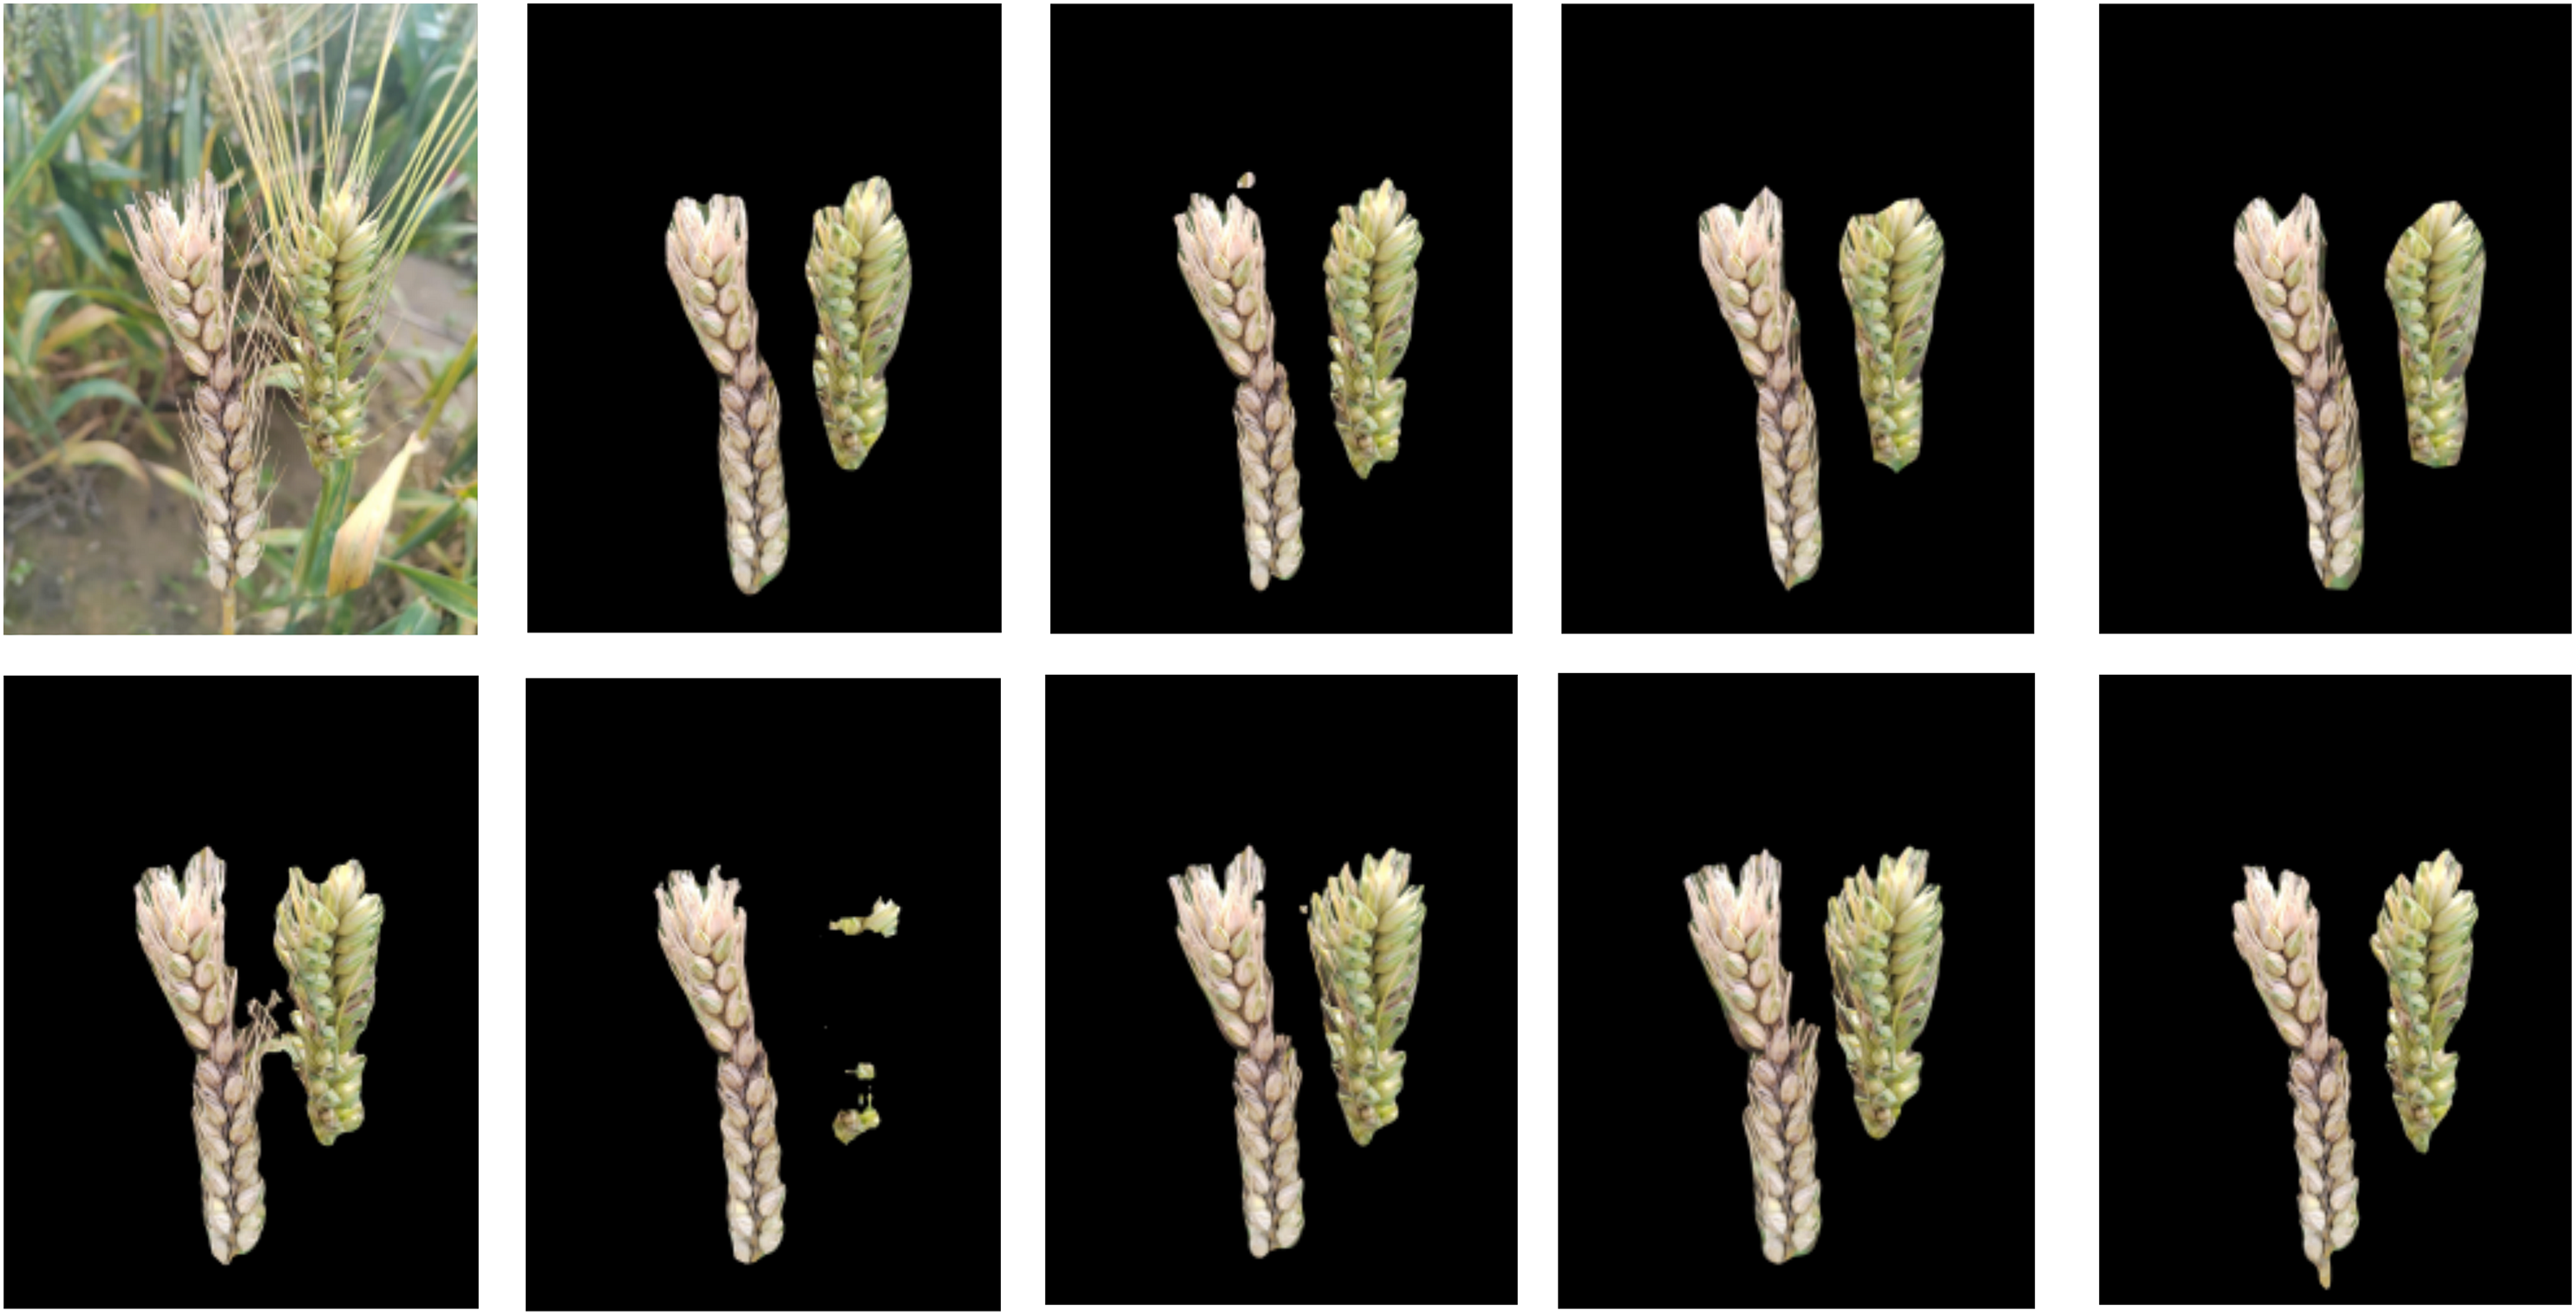
An ablation experiment is designed to validate the effectiveness of CBAM, SPB, and MSDC in wheat spike segmentation models. The segmentation results are shown in Fig. 7, with all models based on improvements to ResU-Net. The performance of ResU-Net is slightly worse, with redundant segmentation in image details (Fig. 7B). CBAM achieves better accuracy in understanding and utilizing image features, successfully overcoming the interference from complex backgrounds and attaining good segmentation results (Fig. 7C). SPB has a positive effect on segmentation details, but when used alone, it leads to some missing segments (Fig. 7D). MSDC achieves generally good segmentation results (Fig. 7E). The combination of SPB and MSDC yields better semantic segmentation results by addressing the common issue of local detail loss in traditional dilated convolutions, while also capturing edge information (Fig. 7F). The combination of SPB and CBAM shows slight shortcomings in segmenting the tips of wheat spikes (Fig. 7G). The combination of SPB, CBAM, and MSDC in the improved model achieves the best results in terms of segmentation details and accuracy (Fig. 7H).
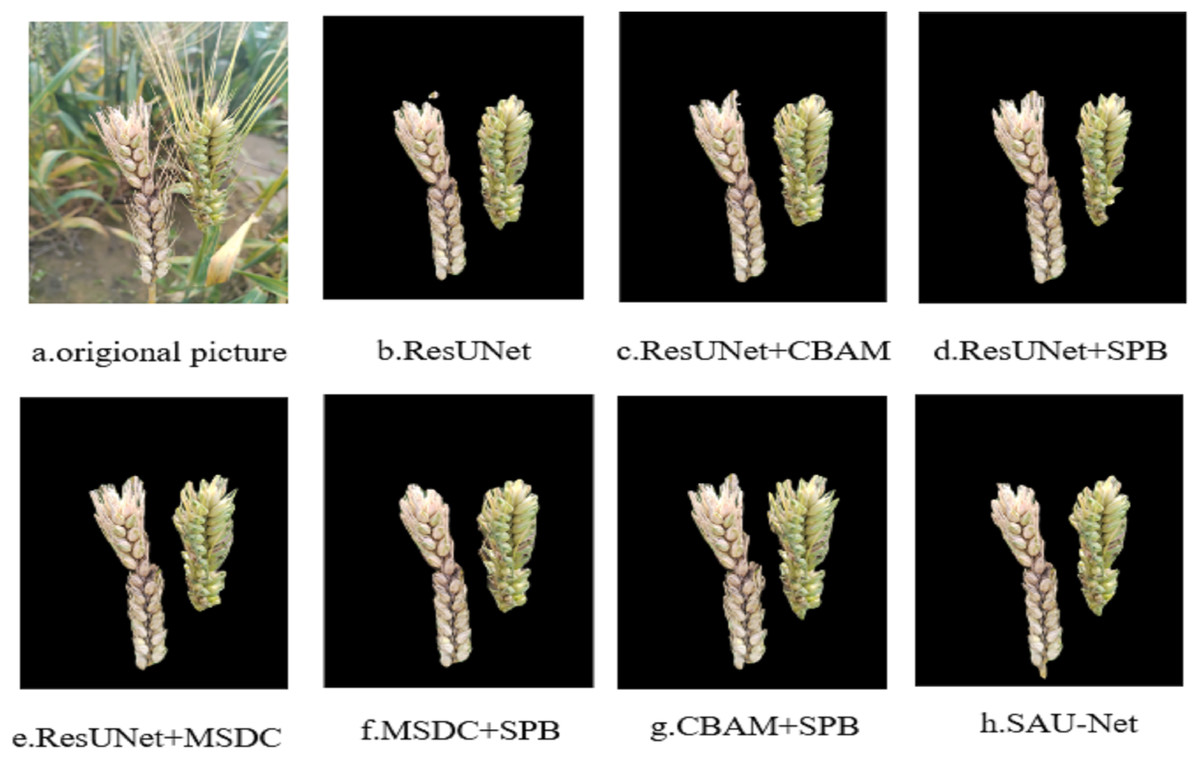
Figure 7: Comparison of ablation experiment results on wheat spike dataset.
The experimental results indicate that the combination of CBAM, SPB, and MSDC significantly improves segmentation performance in wheat spike segmentation tasks. The SPB module helps resolve the issue of local detail loss, CBAM effectively handles complex backgrounds, and MSDC enhances the model’s ability to recognize wheat spikes at different scales. By integrating these modules, the model can achieve more comprehensive and accurate semantic segmentation of wheat spike images.
The segmentation performance of the models on the test set is shown in Table 2. The original U-Net model achieves an MIoU of 83.28% in wheat spike segmentation. When using ResNet50 as the backbone, the MIoU increases to 86.12%, an improvement of 2.84 percentage points. With the addition of CBAM, MSDC, or SPB, the performance can reach 86.85%, 86.92%, and 87.34%, respectively. When adding CBAM or MSDC, the model performance improves slightly, with MIoU gains of less than 1 percentage point. However, when adding SPB, the performance improvement is more significant, with MIoU increasing by 1.22 percentage points, indicating that SPB has a particular advantage in handling local details, aiding the model in capturing stripe or texture information, thus improving its grasp of image details and edge information. When incorporating CBAM, MSDC, and SPB simultaneously, the performance of the model is significantly improved, with the highest MIoU of 88.57%, while MPA and Accuracy also significantly improve to 95.97% and 97.65%, respectively.
| Loss | MIoU/% | ACC/% | MPA/% |
|---|---|---|---|
| CE loss | 85.20 | 96.78 | 90.77 |
| Focal loss | 85.66 | 96.15 | 92.19 |
| CE loss + Dice loss | 85.92 | 96.82 | 91.72 |
| Focal loss + Dice loss | 86.12 | 97.23 | 92.12 |
In summary, the SPB module plays a critical role in wheat spike segmentation tasks, yielding the most significant performance improvement when introduced into the model. The combination of CBAM and MSDC also enhances performance, but their contribution is relatively smaller compared to SPB. However, when all three modules are used together, the ResU-Net model achieves the best wheat spike segmentation performance.
Model performance comparison
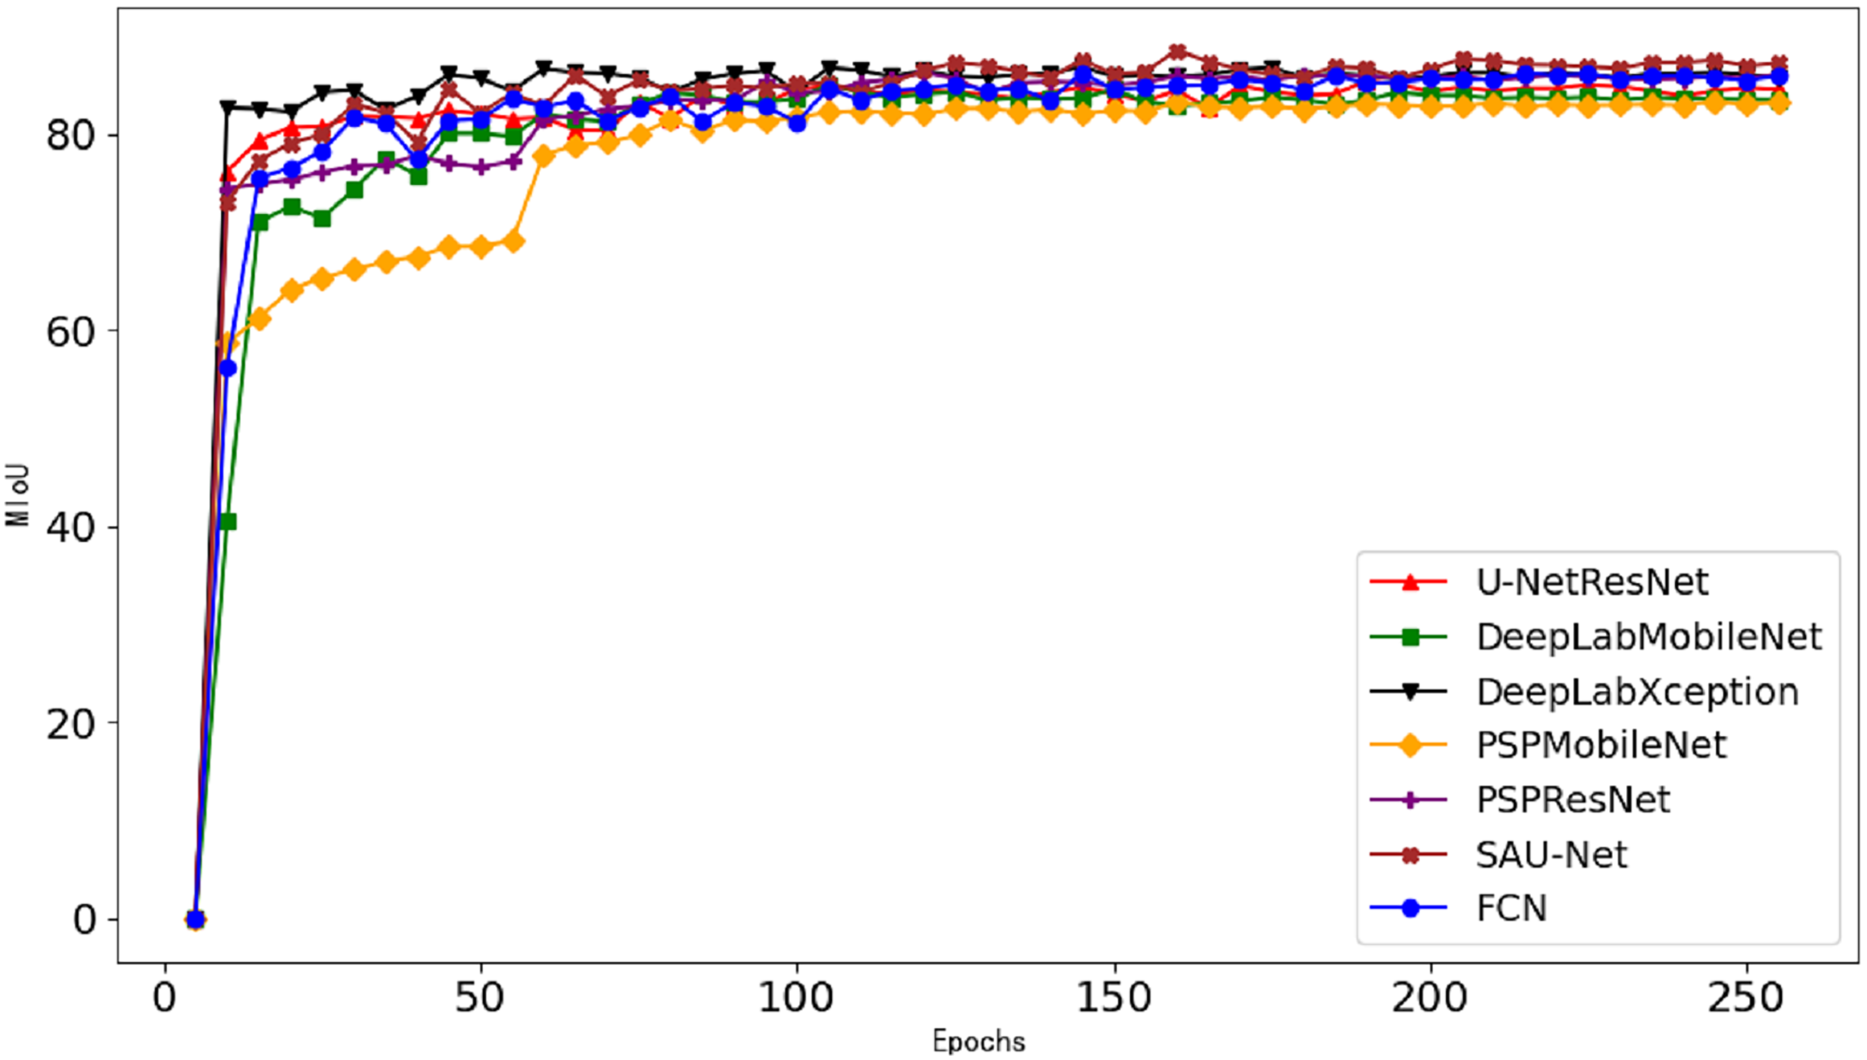
To comprehensively evaluate the effectiveness of the proposed SAU-Net model in wheat spike segmentation, various methods such as U-Net, ResU-Net, Pyramid Scene Parsing Network (PSPNet), Deep Convolutional Lab v3 (DeepLabv3), fully convolutional network (FCN) and Lite Residual Atrous Spatial Pyramid Pooling (Lraspp) are used to segment wheat spike images. The evaluation metrics include accuracy, MIoU, and MPA, with the segmentation results shown in Fig. 8. During model training, the MIoU curve on the validation set is depicted in Fig. 9.
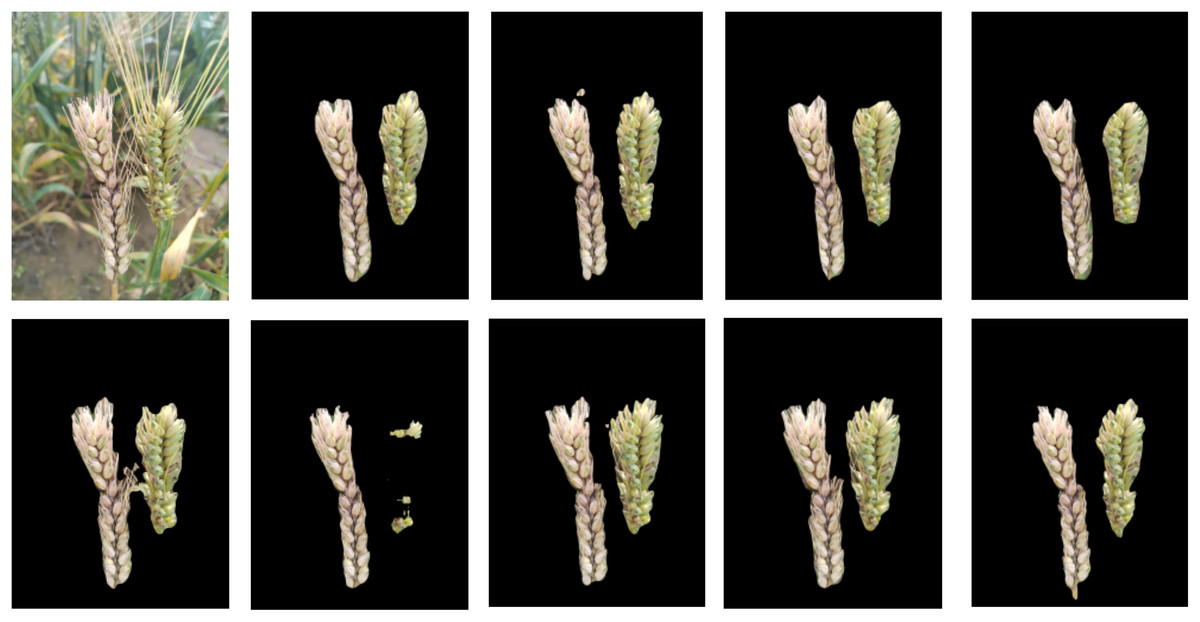
Figure 8: Segmentation results of different models.
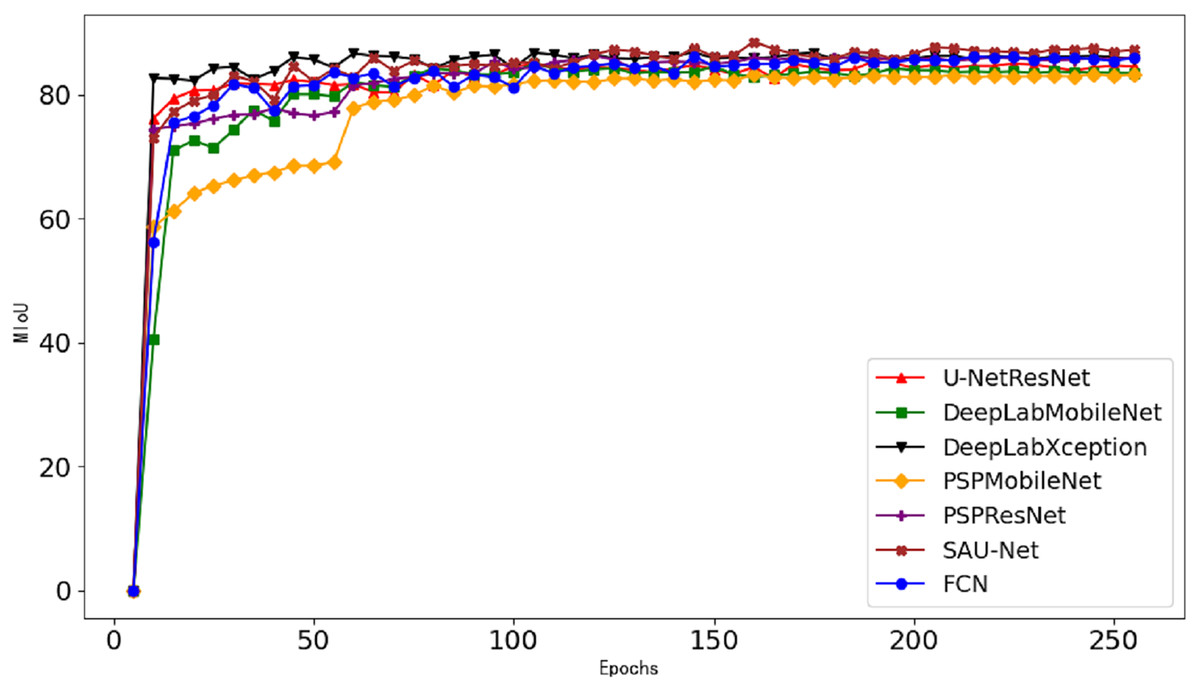
Figure 9: Segmentation curves of different models.
The U-Net model exhibits noticeable loss of details in wheat spike segmentation. The ResU-Net network can segment wheat spikes but loses some detailed features and generates some additional pixel segments. Models like Deeplabv3 and PSPNet, using different backbone networks, exhibit varying degrees of segmentation inaccuracy. The PSPNet with ResNet as the backbone network delivers a notable segmentation effect but lacks precision at the edges, while the PSPNet with MobileNetv2 as the backbone has similar edge segmentation issues with slightly lower overall performance. The DeepLabv3 with MobileNetv2 as the backbone can segment wheat spikes but shows considerable segmentation overlap, while the DeepLabv3 with Xception as the backbone suffers from segmentation loss (Wu et al., 2023). FCN and Lraspp tend to lose details on the wheat spike edges, with the left and lower edges being less accurately segmented, which can affect research results (Long, Shelhamer & Darrell, 2015).
As shown in Fig. 9 depicting the mIoU on the validation set during model training, the segmentation accuracy stabilizes after 100 training epochs. Under identical backbone network configurations (ResNet50), a comparative analysis between widely-used semantic segmentation networks (PSPNet, FCN, and the original U-Net) and our proposed SAU-Net reveals clear performance distinctions: PSPNet achieves 85.7% mIoU with 97.16% accuracy, FCN attains 85.6% mIoU with 97.06% accuracy, and the original U-Net reaches 86.12% mIoU with 97.23% accuracy, while SAU-Net demonstrates superior performance with 88.57% mIoU and 97.65% accuracy, conclusively validating its enhanced segmentation capability.
Based on the comparison in Table 3 of various segmentation metrics across different models, it is evident that the SAU-Net model achieves the highest MIoU among all segmentation models. When using different backbones (Xception, MobileNetv2, and ResNet50), Deeplabv3 and PSPNet demonstrate relatively consistent performance. Among the Deeplabv3 models with different backbones, MobileNetv2 performs slightly better than Xception in terms of MIoU and Accuracy. In models where MobileNetv2 is the backbone, including DeepLabV3, PSPNet, and Lraspp, the Lraspp model shows superior segmentation performance compared to the other two.
| Mode | ResNet50 | CBAM | MSDC | SPB | MIoU/% | MPA/% | ACC/% |
|---|---|---|---|---|---|---|---|
| U-Net | 83.28 | 90.37 | 95.92 | ||||
| ✓ | 86.12 | 92.12 | 97.23 | ||||
| ✓ | ✓ | 86.92 | 93.81 | 97.32 | |||
| ✓ | ✓ | 86.85 | 93.17 | 97.34 | |||
| ✓ | ✓ | 87.34 | 94.21 | 97.35 | |||
| ✓ | ✓ | ✓ | 87.56 | 95.08 | 97.40 | ||
| ✓ | ✓ | ✓ | 87.39 | 94.21 | 97.36 | ||
| ✓ | ✓ | ✓ | ✓ | 88.57 | 95.97 | 97.65 |
U-Net with ResNet50 as the backbone achieves higher MIoU and Accuracy, improving by about 3 percentage points in MIoU and 1.24 percentage points in Accuracy compared to when using VGG as the backbone. FCN with ResNet50 as the backbone also achieves relatively high MIoU and accuracy, indicating that ResNet50 is effective in wheat spike segmentation tasks.
As shown in Table 4, using different backbones has a significant impact on wheat spike segmentation tasks. ResNet50 demonstrates better performance in multiple models. The SAU-Net model outperforms all others, indicating its effectiveness for wheat spike segmentation tasks. These findings suggest that careful consideration of backbone selection can significantly impact model performance, and SAU-Net’s design provides a robust solution for accurate segmentation.
| Model | Backbone | MIoU/% | ACC/% | FLOPs/G | Parameters/M | Inf.Time/ms | FPS |
|---|---|---|---|---|---|---|---|
| Deeplabv3 | Xception | 83.52 | 96.50 | 83.3 | 54.7 | 48.90 | 28.4 |
| MobileNetv2 | 84.58 | 96.79 | 26.4 | 5.8 | 35.60 | 28.1 | |
| PSPNet | MobileNetv2 | 83.26 | 96.53 | 8.61 | 2.4 | 28.50 | 35.1 |
| ResNet50 | 85.70 | 97.16 | 162.16 | 47.7 | 52.80 | 18.9 | |
| U-Net | VGG | 83.28 | 95.92 | 2834.0 | 26.5 | 67.80 | 14.8 |
| ResNet50 | 86.12 | 97.23 | 91.9 | 46.5 | 45.20 | 22.1 | |
| FCN | ResNet50 | 85.6 | 97.06 | 24.00 | 35.31 | 38.70 | 25.8 |
| Lraspp | MobileNetv2 | 85.0 | 96.8 | 1.49 | 3.84 | 24.87 | 40.2 |
| SAU-Net | ResNet50 | 88.57 | 97.65 | 152.5 | 73.3 | 65.20 | 15.3 |
The traditional indicators (MIoU, ACC, FLOPs, parameter count, inference time) can accurately reflect the performance of the algorithm. Although the improved model Sau-net shows obvious advantages in segmentation performance, and MIoU is 2.45% higher than the benchmark model, the parameter quantity is 1.5 times that of the benchmark model, and the inference time is also significantly increased, which points out the direction for the subsequent model optimization. At the same time, if the model is deployed in the actual production environment, it needs to focus on the hardware resource constraints, real-time requirements and system compatibility of field equipment. The size of model parameters directly determines the memory requirements, especially in resource constrained network edge devices. For excessive parameters of the model, quantitative compression can be considered to reduce the memory occupation and computational overhead by reducing the numerical accuracy of model parameters, while maintaining the model accuracy as much as possible. For the case that the reasoning time of the model is high and it is difficult to meet the real-time requirements of the agricultural scene, the layer fusion and operator optimization of the model can be considered, and the cooperation of the two can greatly improve the reasoning speed of the model. The hardware instruction set and computing unit characteristics of the equipment used in the field deployment also have an important impact on the efficient operation of the model, so the field deployment needs to adapt to the hardware characteristics.
Model generalization validation
To validate the model’s generalization ability, two sets of generalization performance evaluation experiments were specifically designed to test the model designed in this article on public datasets:
The first experiment used a portion of the images from the public wheat head dataset Global Wheat Head Dataset 2020 (http://www.global-wheat.com) as the test set. The experimental data is shown in Table 5, which indicates that the model performed reasonably well on the public wheat head detection dataset, achieving 74.74% MIOU, 88.97% ACC and 86.99% precision. The segmentation mask after processing is shown in the Fig. 10. Compared to the approximately 88.74% MIoU obtained on the self owned wheat dataset in this article, the model performance has decreased by approximately 14%. This significant difference highlights the domain shift problem of the model when applied to new domains with different distributions from the training data (i.e., GWHD 2020 dataset). Analyzing the reasons for domain transfer, firstly, our own dataset is mainly collected under relatively controllable or typical lighting conditions in specific areas. The GWHD 2020 dataset collects field images from multiple countries around the world (Australia, Canada, Japan, UK, etc.), with extremely diverse and challenging lighting conditions, including strong direct sunlight (causing highlights, overexposure), shadow coverage (wheat spikes partially or completely in shadow), cloudy diffuse light (low contrast), and color temperature changes at different times (early morning, noon, evening). This drastic change in lighting seriously affects the apparent features of the image and affects the segmentation effect. Secondly, the proprietary dataset mainly includes images of specific (or limited) varieties of wheat, spike shape, size, density, posture (upright or curved), and awning features are relatively consistent. The GWHD 2020 dataset contains an extremely diverse variety of species worldwide. There are significant differences in shape, size, density, and posture among wheat spikes of different varieties, which poses great challenges to the segmentation performance of the model.
| Dataset | MIoU/% | ACC/% | MPA/% |
|---|---|---|---|
| Global wheat head dataset 2020 | 74.74 | 88.97 | 86.99 |
| Potato leaf disease dataset | 69.52 | 92.55 | 84.50 |
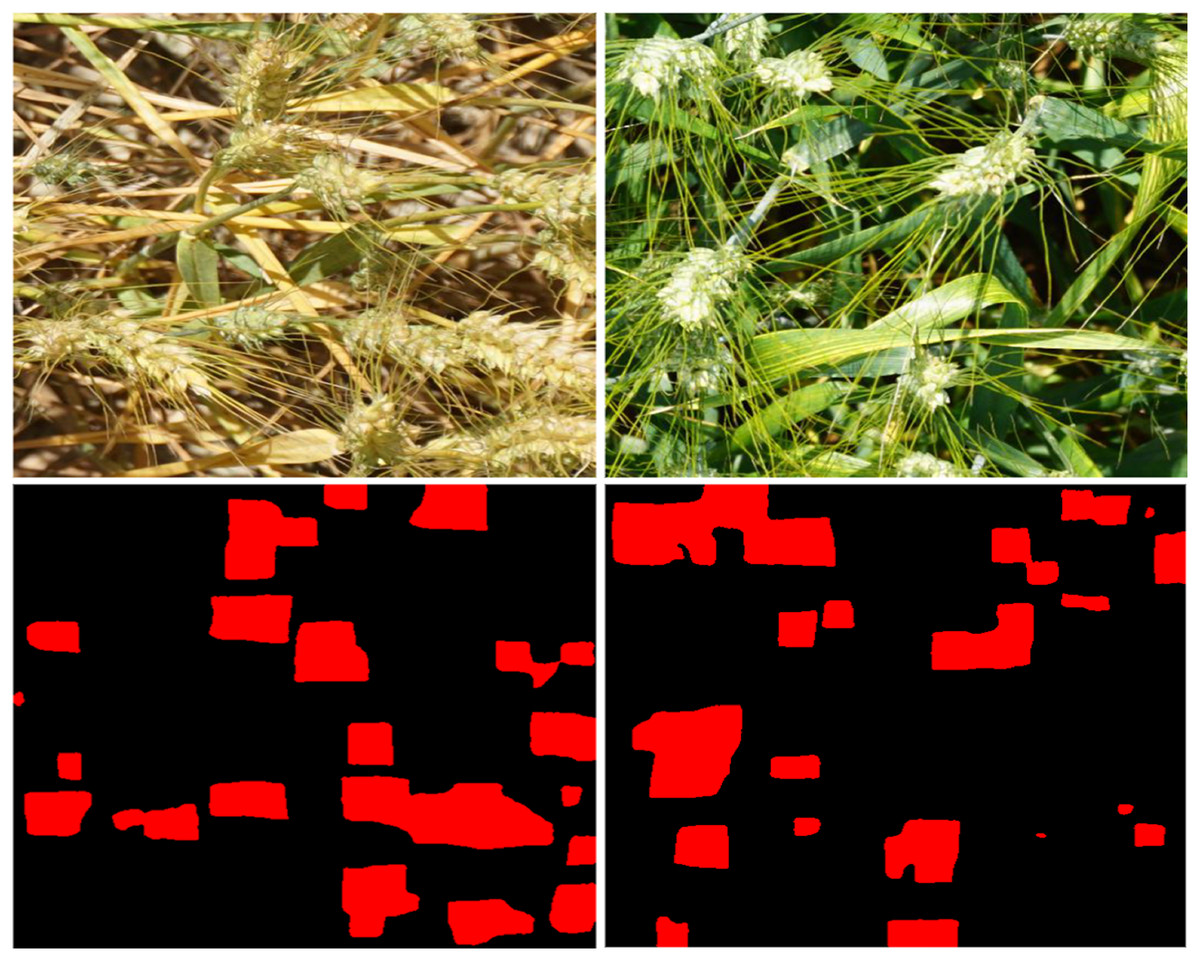
Figure 10: Segmentation mask for GWHD.
To address the above issues, consider using domain adaptation (DA) techniques such as style transfer and multi domain training to improve the model’s cross dataset generalization ability. By combining the significant domain differences between our own dataset (source domain) and the Global Wheat Head Dataset 2020 (target domain), such as lighting conditions, variety morphology, and background environment, a generative adversarial network (GAN) can be used to learn the visual style mapping between the source and target domains. While preserving the semantic content of the image (wheat spike structure), low-level features such as lighting and color in the target domain can be transferred to the training data in the source domain. Specifically, CycleGAN can be used to construct a cyclically consistent bidirectional transformation, achieving mutual transformation between our own dataset images and GWHD 2020 style, such as converting the image background from direct strong light to cloudy diffuse light or from loess to black soil background. Domain Mixup can also be used to incorporate some unlabeled data from GWHD 2020 into the training process. Linear interpolation can be applied to the source domain (labeled data) and target domain (unlabeled data) samples to enable the model to learn cross domain invariant features. Studying more robust wheat ear segmentation algorithms across datasets is also a key direction for future research.
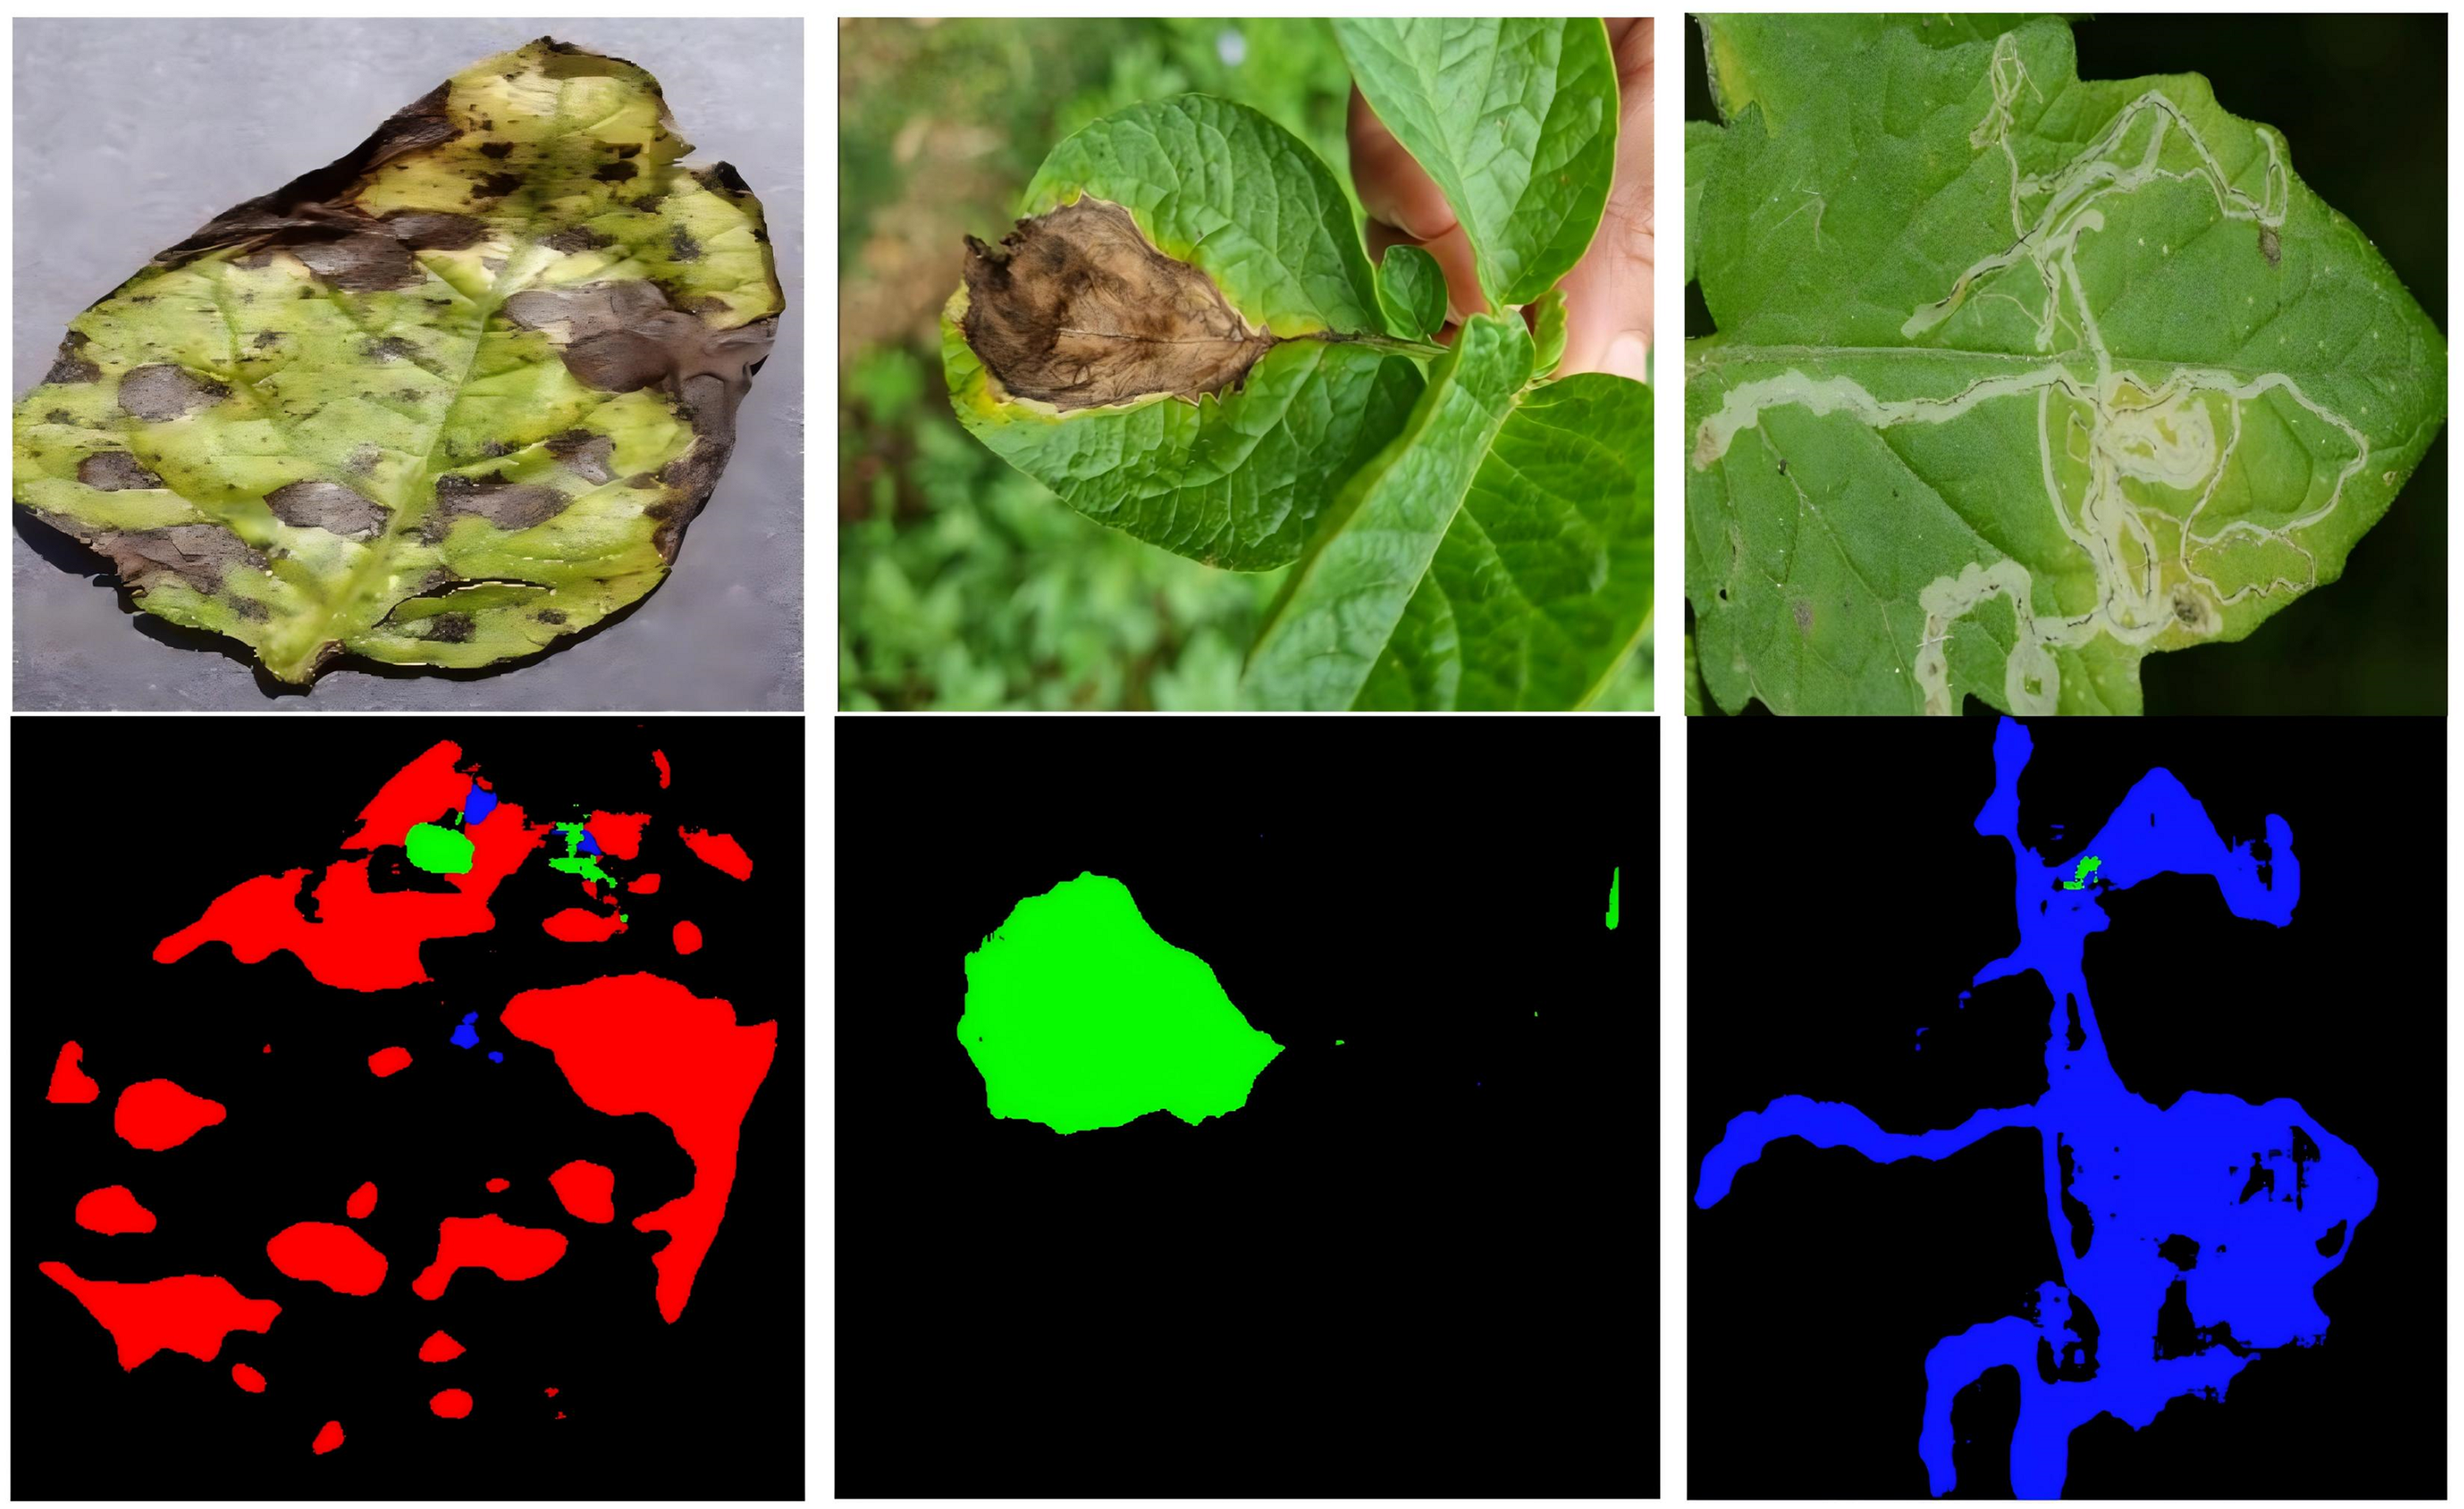
The second experiment aimed to validate the model’s performance in multi-class segmentation tasks using the public potato leaf disease dataset (https://universe.roboflow.com/anupkaygm/potato_disease-binb3), which includes samples of early blight, late blight, and leaf miner diseases. The experimental results are shown in Table 5, indicating that the model achieved a MIOU of 69.52% and an ACC of 92.55% on the multi-class segmentation dataset. The segmentation masks are illustrated in Fig. 11.
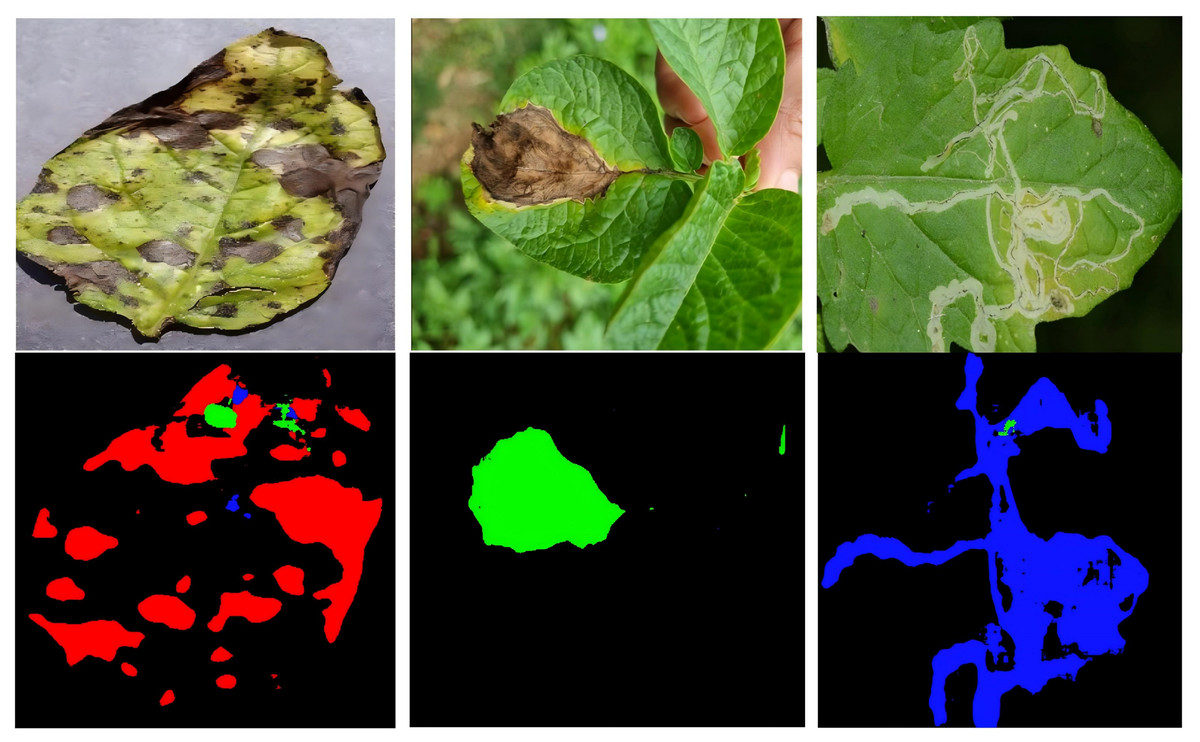
Figure 11: Segmentation mask for potato leaf disease dataset.
Discussion
A model with higher segmentation accuracy
Traditional image semantic segmentation methods
There are numerous methods for segmenting crop images, primarily encompassing traditional semantic segmentation techniques and deep learning segmentation approaches. In traditional semantic segmentation methods, commonly utilized techniques include threshold-based segmentation, edge detection, region segmentation, watershed algorithms, and more (Wang, Li & Su, 2023). These methods predominantly rely on low-level image features such as color, texture, and shape, achieving the division of different regions in the image through the establishment of fixed rules or algorithms (Hou, Zhang & Cheng, 2020). For instance, Basavaiah & Arlene Anthony (2020) introduced a method that combines multiple features to identify tomato leaf diseases, achieving a classification accuracy exceeding 90%. Although crop image segmentation methods based on traditional machine learning algorithms can yield relatively satisfactory results, these traditional methods necessitate manual feature extraction, making it challenging to effectively handle noise and interference in the image, leading to unstable segmentation outcomes and reduced accuracy.
Image segmentation method based on deep learning
With the continuous advancement of deep learning technology, image segmentation methods based on convolutional neural networks (CNNs) have gradually become mainstream. Deep learning algorithms predominantly encompass fully convolutional networks (FCN), SegNet, DeepLab, and more (Woo, Park & Lee, 2018). These segmentation algorithms incorporate diverse structures and techniques, enhancing the accuracy and efficiency of image segmentation. For instance, Wang et al. (2023) achieved precise segmentation of dragon fruit using YOLOV4, achieving an average precision (ACC) of 96%; Guoyu, Dong & Guang (2024) utilized the VGG16 model to segment grapevine images, achieving an average precision of 94.15%. Evidently, various deep learning models exhibit varying impacts on different datasets.
Image segmentation model in this article
To enhance model performance on the wheat spike dataset in this study, we designed a deep learning image semantic segmentation model based on an improved U-Net for segmenting wheat spike images. Distinct from the aforementioned models, our approach employs a ResNet deep residual network as the backbone network for feature extraction. Comparative performance analysis of the model reveals that ResNet50 achieved an MIoU of 86.12% and an Acc of 97.23%, surpassing the methods mentioned in the aforementioned literature by 1.23% and 3.08%, respectively, demonstrating superior segmentation performance. In this study, we introduced a striped pooling module (SPB) into the encoder. Ablation experiments demonstrate that the SPB pooling mechanism effectively extracts striped and texture information from images, boasting a smaller parameter count and reduced computational overhead. This effectively enhances the model’s comprehension of global contextual information, playing a pivotal role in enhancing segmentation accuracy.
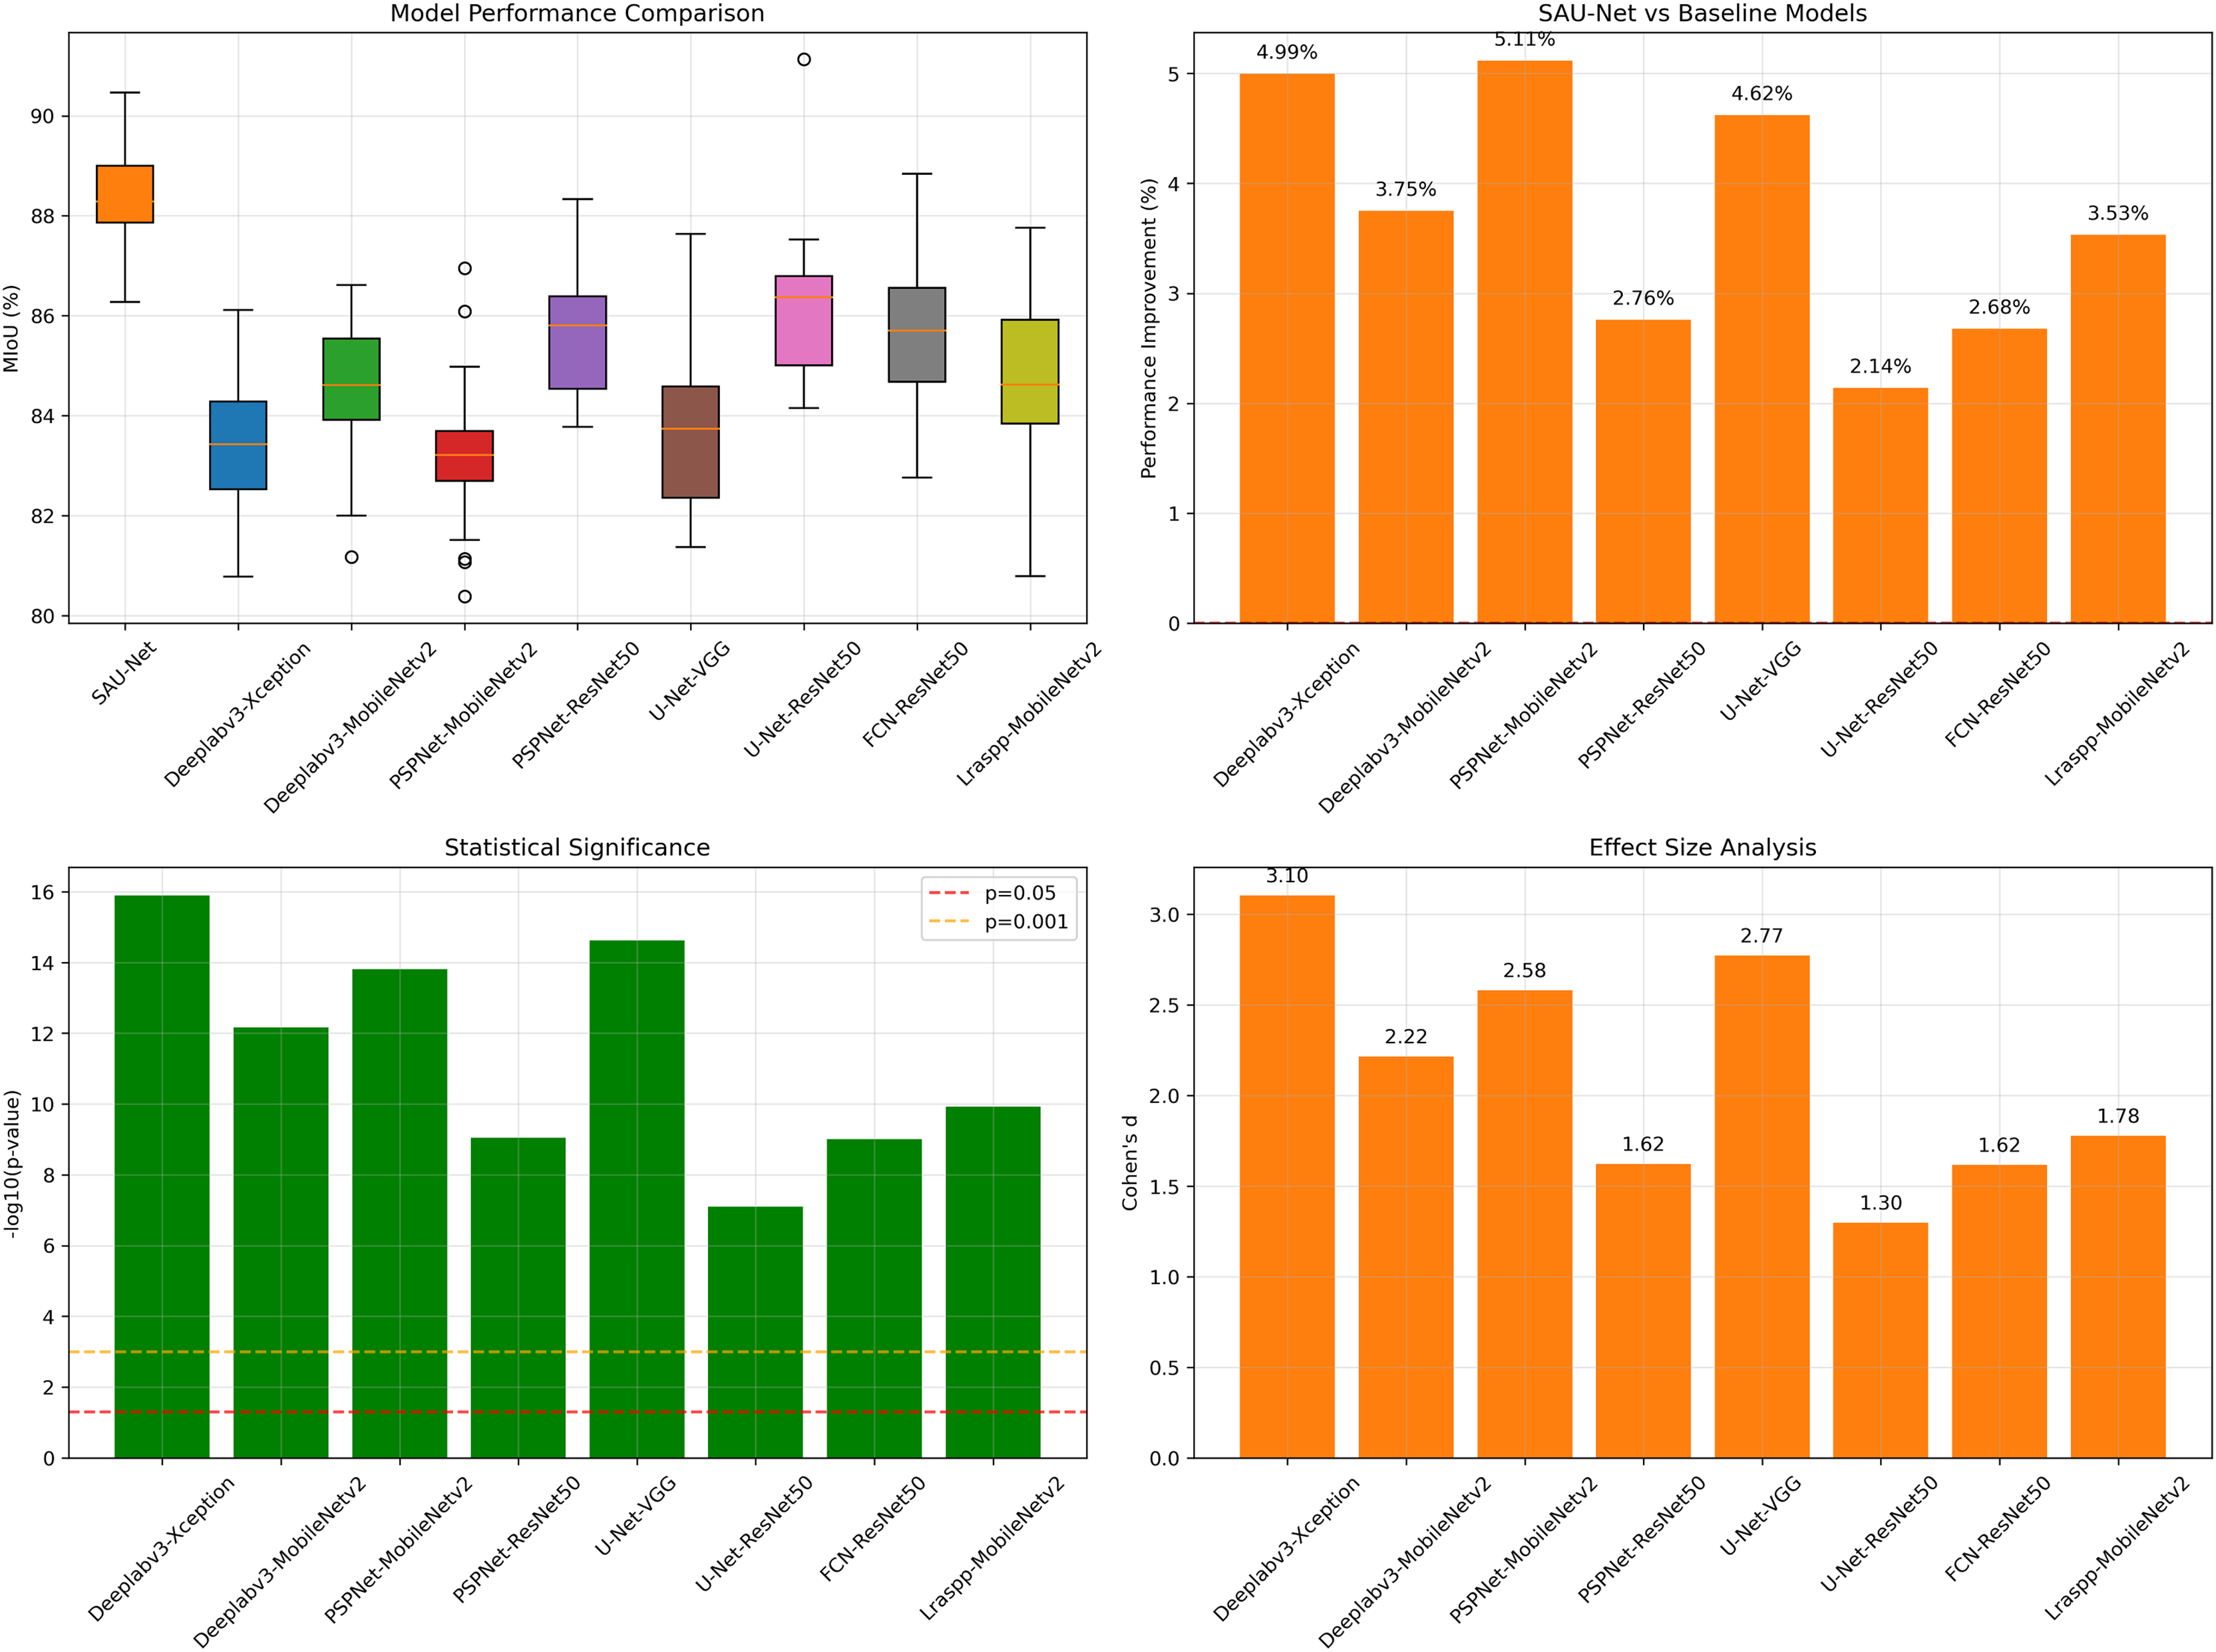
In order to verify whether the performance improvement of SAU-Net relative to each baseline model is significant and non accidental, a systematic statistical analysis is carried out in this article. As shown in Fig. 12, the box diagram shows that Sau net performs better on Miou as a whole; Further, the performance improvement comparison chart shows that it has achieved an improvement of 2.14% to 5.11% on multiple models. The statistical significance test results show that all comparisons are statistically significant (P < 0.001), and the Cohen’s D effect is greater than 1, which proves that the performance improvement is significant at the statistical and practical levels. Therefore, it can be confirmed that the observed performance improvement is not accidental, but the real gain brought by model improvement.
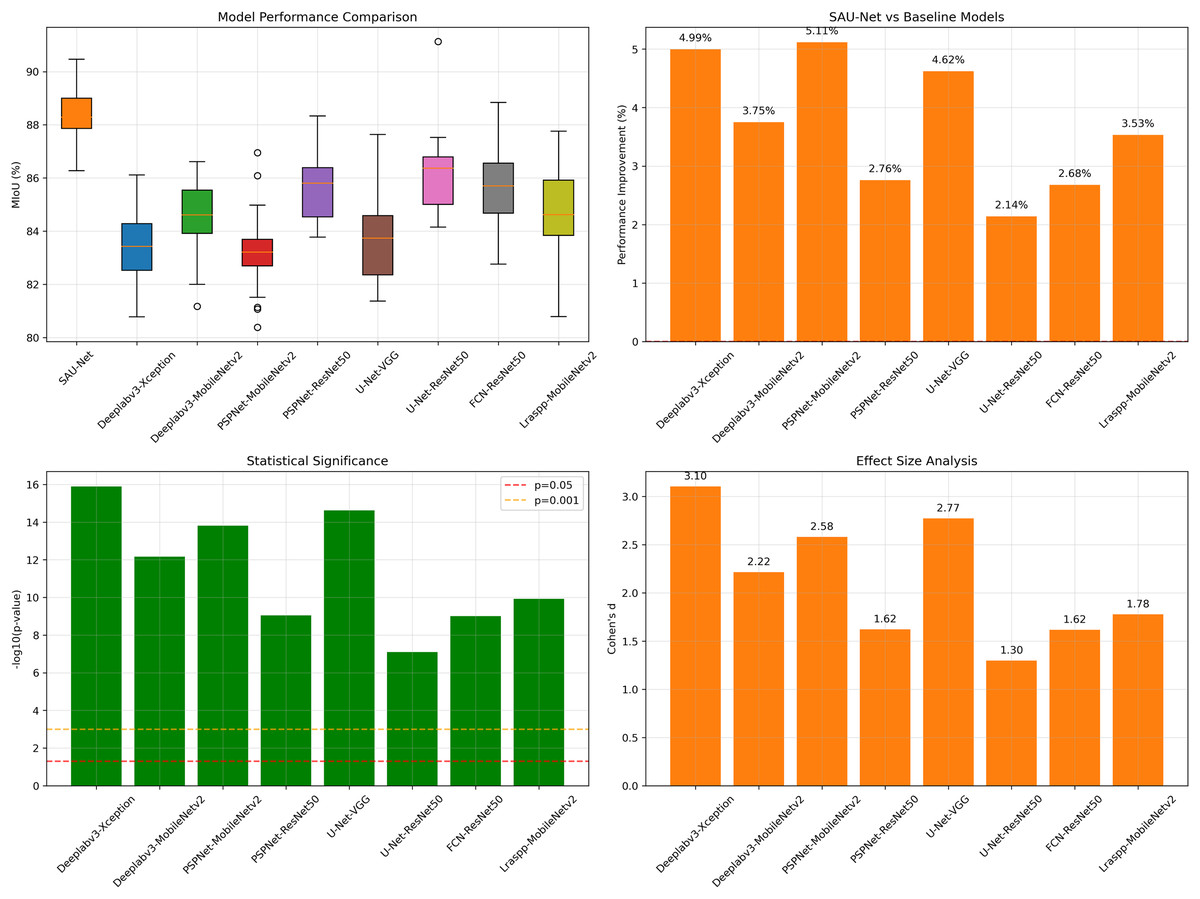
Figure 12: Statistical significance tests of model improvement.
Robustness under different conditions
This study applies multi-scale dilated convolution (MSDC) to the last two layers of the U-Net model encoder. It can receive feature maps that have undergone multiple downsampling operations and perceive features of different scales without reducing resolution, thereby better capturing contextual information of the image (Milletari, Navab & Ahmadi, 2016). Experiments demonstrate that when using ResNet50 as the backbone alone, the MIoU is 86.12%. When the MSDC module is introduced, the performance slightly improves to 86.92%, an increase of 0.8%. Additionally, an attention module (CBAM) is used in the decoder to adaptively adjust the weights of different channel features and spatial features, enabling the network to automatically perform feature recalibration and selectively emphasize informative features while suppressing useless ones by utilizing learned global information. When both CBAM and MSDC modules are introduced, the model performance achieves the greatest improvement, with MIoU reaching the highest value of 88.57%. Mean pixel accuracy (MPA) and accuracy (Acc) also significantly increase, reaching 95.97% and 97.65%, respectively. These improvement measures can reduce the impact of image noise, demonstrating good wheat spike segmentation capabilities even in complex field background environments, significantly improving the robustness of the system.
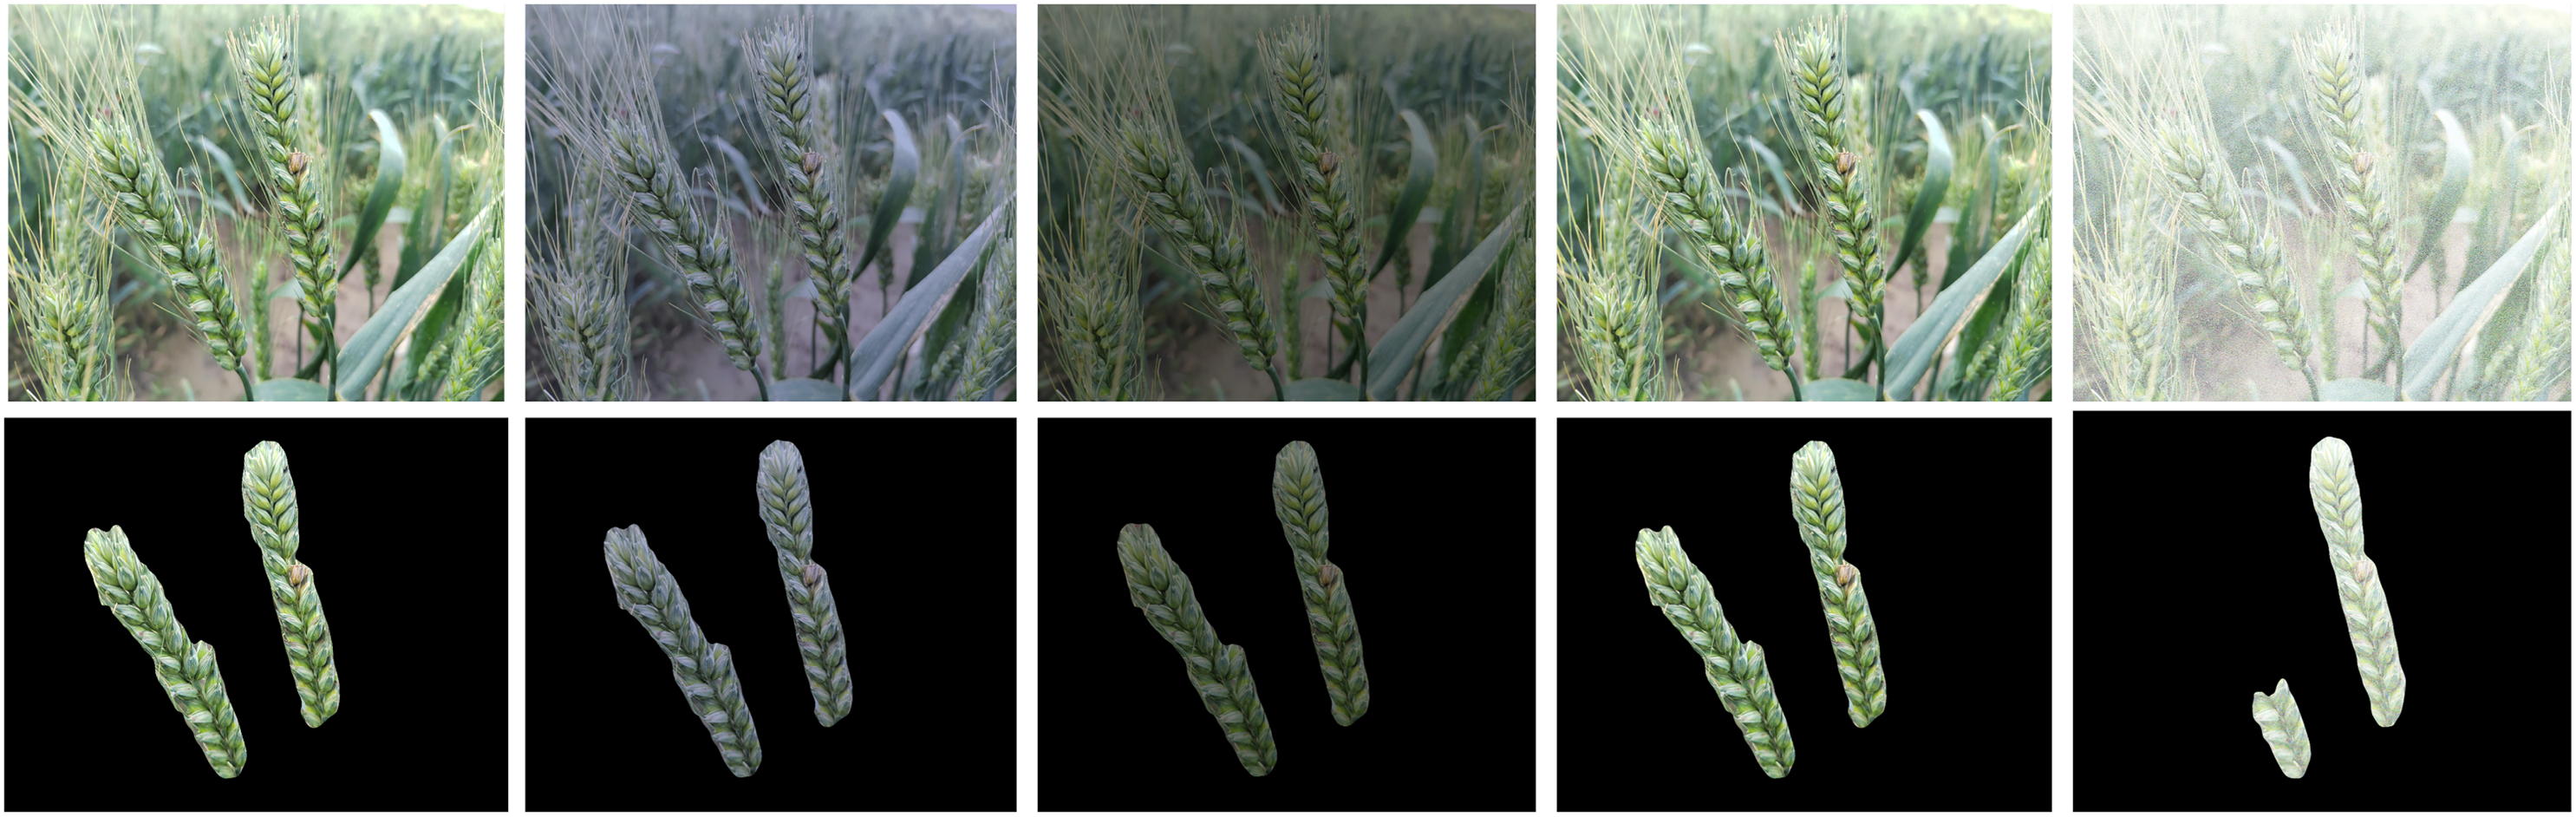
In order to verify the robustness of the model, based on data synthesis technology, model test samples were generated under various weather and lighting conditions, and robustness verification experiments were designed. The image segmentation results are shown in Fig. 13. Under cloudy, rainy and dark conditions, the segmentation quality remains acceptable, and only the image segmentation effect of Gaussian noise with standard deviation of 50 is poor, which verifies that the model has good robustness.
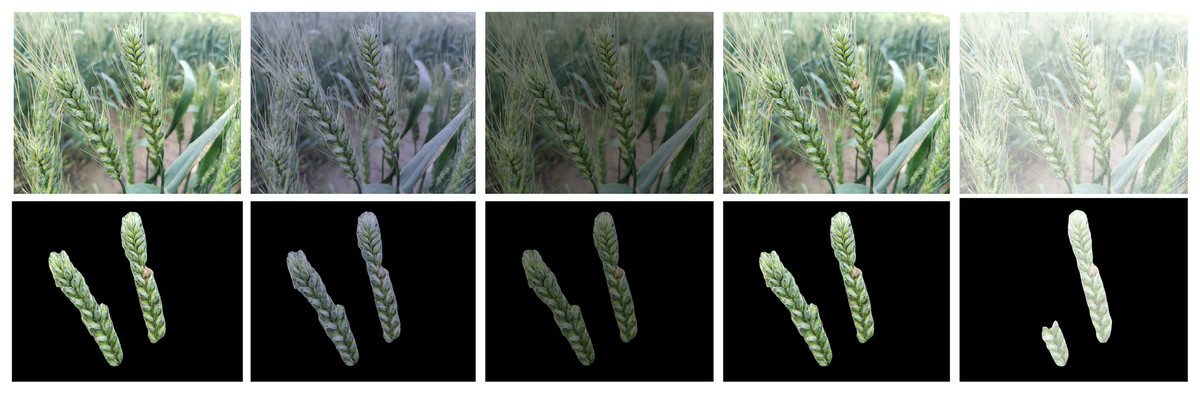
Figure 13: Segmentation result of robustness experiment.
Future improvement directions
Although the method proposed in this study has achieved certain results in wheat spike segmentation under complex backgrounds, and the model exhibits good generalization capabilities, its architecture is somewhat complex, and there is a slight deficiency in the balance between recognition accuracy and speed (Tsung-Yi et al., 2017). Current model designs tend towards lightweight to enable deployment on mobile devices (Redmon, Divvala & Girshick, 2016). Therefore, further exploration is needed on how to achieve lightweight design of the model while maintaining high-precision segmentation. At the same time, it should be noted that this study mainly collected the image data of the same variety of wheat spike at flowering, filling and maturity stages, which led to the possible systematic bias in its own data set. These deviations are mainly due to the uneven distribution of specific wheat varieties and environmental conditions in the process of data collection, which may have a hidden constraint on the actual generalization ability of the model. However, in the future, the dataset can be further expanded to include image data of wheat spikes from different varieties and growth stages, in order to enhance the generalization capability and applicability of the model. Therefore, future research needs to focus on these aspects to promote the development and application of agricultural image analysis technology in natural environments.
Conclusion
In summary, this study constructs a deep semantic segmentation network capable of segmenting wheat spikes in complex backgrounds. Based on the U-Net as the benchmark model, the original encoder module in the model is replaced with a ResNet deep residual network, and a striped pooling module and a multi-scale dilated convolution module are added to the new decoder. The CBAM attention mechanism is also incorporated into the decoder module, ultimately achieving high segmentation accuracy for field wheat spike segmentation. Experimental results show that the constructed SAU-Net network achieves a segmentation MIoU of 88.57%, an MPA value of 95.97%, and a segmentation accuracy of 97.65% on the wheat spike segmentation dataset. Compared with commonly used segmentation networks such as PSPNet, FCN, and DeepLabv3, it has relatively obvious accuracy advantages and can provide strong technical support for subsequent wheat disease identification and yield estimation.
Supplemental Information
Raw data 1 of wheat ear images.
50 sets of raw data of wheat ear images.
Raw data 2 of wheat ear images.
51–100 sets of raw data of wheat ear images.
Raw data 3 of wheat ear images.
101–146 sets of raw data of wheat ear images.