
MultCPM: a multi-omics cancer recurrence prediction model utilizing a multi-head attention mechanism
- Published
- Accepted
- Received
- Academic Editor
- Fabio Cumbo
- Subject Areas
- Algorithms and Analysis of Algorithms, Artificial Intelligence, Data Mining and Machine Learning
- Keywords
- Cancer recurrence prediction, Multi-head attention mechanism, Multi-omics integration, Deep learning
- Copyright
- © 2025 Liu et al.
- Licence
- This is an open access article distributed under the terms of the Creative Commons Attribution License, which permits unrestricted use, distribution, reproduction and adaptation in any medium and for any purpose provided that it is properly attributed. For attribution, the original author(s), title, publication source (PeerJ Computer Science) and either DOI or URL of the article must be cited.
- Cite this article
- 2025. MultCPM: a multi-omics cancer recurrence prediction model utilizing a multi-head attention mechanism. PeerJ Computer Science 11:e3294 https://doi.org/10.7717/peerj-cs.3294
Abstract
Deep learning-based approaches for integrating multi-omics data offer a novel perspective on cancer recurrence prediction. However, existing methods struggle to manage the complex relationships within multi-omics data and the intrinsic correlations between samples, leading to suboptimal prediction accuracy. To tackle these challenges, we propose a multi-omics cancer recurrence prediction model (MultCPM), which employs a multi-head attention mechanism to extract key information from biological pathways. Integrated with a hierarchical fusion module, the model performs layered integration of omics data to effectively capture their interdependence. Ultimately, the fused information is consolidated into a unified feature matrix, refining critical features and their relationships across omics. Results from 5-fold cross-validation, repeated five times on Breast Cancer (BRCA), Bladder Cancer (BLCA), and Liver Cancer (LIHC) datasets, demonstrate that the MultCPM model achieves superior prediction performance and robustness. Additionally, Deep SHapley Additive exPlanations (DeepSHAP) was utilized to analyze the model’s interpretability, revealing key genes closely associated with cancer recurrence, thus providing valuable insights for biological research and the development of cancer recurrence prediction algorithms.
The code is publicly available at https://github.com/dowell2016/MultCPM.
Introduction
Cancer remains one of the most significant global health challenges, with recurrence representing a major obstacle in its management. Accurate prediction of cancer recurrence not only enhances patients’ quality of life but also aids physicians in providing more tailored treatment options. The rapid progress of high-throughput sequencing technologies has generated extensive omics datasets, creating new opportunities for cancer diagnosis, treatment, and recurrence or survival prediction. Multimodal learning for integrated multi-omics analysis enables researchers to explore the molecular mechanisms underlying cancer pathogenesis and improve clinical decision-making (Tabakhi et al., 2023). In recent years, numerous cancer prognostic and classification models have incorporated multi-omics data (Leng et al., 2022; Vale-Silva & Rohr, 2020; Wang et al., 2021a; Yang et al., 2022; Zhang et al., 2022). Studies indicate that integrating multi-omics data significantly improves the performance of predictive models compared to single-omics approaches (Cao, Hong & Wan, 2022; Chai et al., 2021; Kang, Ko & Mersha, 2022; Steyaert et al., 2023). Nevertheless, the effective integration of such data remains a significant challenge (Subramanian et al., 2020). Thus, further research is warranted to optimize the integration of multi-omics data for cancer recurrence analysis.
In recent years, the application of deep learning to analyze multi-omics data for cancer classification has become a prominent research focus. Deep learning models exhibit powerful learning capabilities, and by integrating diverse omics data, they not only enhance classification accuracy but also demonstrate strong generalization ability (Zhou et al., 2024b). Current research on integrating multi-omics data for cancer classification using deep learning models primarily focuses on several aspects. One significant approach involves utilizing autoencoders for cancer recurrence and survival prediction. Liu & Song (2023) proposed ProgCAE, a prognostic model utilizing a convolutional autoencoder to integrate multi-omics data for predicting survival-associated cancer subtypes. This method successfully identified 12 cancer subtypes with significant survival differences and demonstrated superior predictive accuracy compared to traditional methods. Although ProgCAE has demonstrated good performance in survival prediction, its application in differential gene expression analysis and biological pathway mechanism exploration remains limited, and it lacks an in-depth biological interpretation of the model’s predictive results. Similarly, Jiang et al. (2024) introduced the Autosurv prognostic prediction model, which integrates clinical data and omics information to provide a comprehensive understanding of cancer prognosis. This model has been applied to breast and ovarian cancer datasets, achieving remarkable results. However, Autosurv employs a simple feature concatenation method to integrate omics and clinical information, which fails to effectively model the deep interactions between different data modalities, thereby limiting its ability to fully leverage the complementary information provided by multimodal data. Autoencoders (AEs) leverage their nonlinear feature extraction and dimensionality reduction capabilities to effectively extract latent representations from omics data for cancer recurrence prediction and subtype identification. However, when applied to multi-omics data (such as mRNA, miRNA, and SNV), a single autoencoder model typically processes each omics independently, lacking the ability to capture the complementary relationships and complex interactions between omics layers, thereby limiting its effectiveness in multi-omics fusion analysis.
On the other hand, leveraging attention mechanisms to construct predictive models for cancer subtype classification and survival prediction has emerged as a prominent research focus. Moon & Lee (2022) proposed MOMA, a novel multi-task attention learning algorithm that applies geometric methods to vectorize features and modules, emphasizing key components in multi-omics data using attention mechanisms. Experimental results demonstrate that this method achieves superior performance in multiple classification tasks conducted on publicly available cancer datasets. However, MOMA applies uniform loss weights in the multi-task learning process, which fails to adequately balance the optimization requirements of different tasks and may result in optimization conflicts or imbalanced learning outcomes across tasks. Lan et al. (2024) tackled the problem of disregarding potential sample correlations during multi-omics data integration and introduced DeepKEGG, an interpretable approach for predicting cancer recurrence and identifying biomarkers. The experimental findings revealed that DeepKEGG achieved superior performance compared to other state-of-the-art methods in 5-fold cross-validation. However, this method primarily focuses on the pathway correlations of internal features within individual samples and fails to effectively model the complex interactions and potential dependencies between different omics, thereby limiting its expressive capacity in cross-modal feature fusion. Similarly, Pan et al. (2023b) observed significant differences in the multi-omics data and clinical features of different cancer subtypes. To accurately categorize these subtypes, they developed a model based on supervised multi-attention mechanisms (SMA), which was successfully applied to cancer subtype classification. Although the SMA model introduces a multi-head attention mechanism to extract key features from multimodal data, it does not further present visualizations of the attention weights or explore their biological significance in depth, thereby limiting the model’s interpretability. Although attention mechanisms have achieved promising results in tasks such as cancer recurrence prediction and subtype identification, existing methods primarily employ simple feature concatenation or uniform attention structures, failing to fully capture the complex nonlinear interactions between multi-omics modalities. This limits the models’ ability to effectively model the complementarity and coupling of multi-omics features.
Finally, many researchers have integrated multi-omics data for cancer classification prediction by combining graph neural networks with deep learning methods. Zhu et al. (2023) proposed a novel supervised deep learning approach to address the challenges traditional machine learning techniques encounter when handling high-dimensional genomic data with limited sample sizes. This approach integrates geometric features extracted from genomic networks into a deep learning model, thereby enhancing both predictive capability and interpretability. However, this method provides limited insight into biological mechanisms and fails to fully elucidate the specific biological roles of key features in disease onset. Similarly, Poirion et al. (2021) tackled the computational integration challenges of multi-omics data by proposing a framework called DeepProg, which combines deep learning and machine learning methods. DeepProg effectively utilizes multi-omics data to predict patient survival subtypes and significantly improve risk stratification. However, DeepProg primarily relies on data-driven methods and does not incorporate prior biological knowledge, such as Kyoto Encyclopedia of Genes and Genomes (KEGG) pathways, which limits its interpretability at the mechanistic level and constrains its capacity for biologically relevant analysis. Wang et al. (2021a) proposed MOGONET, a multi-omics integration framework based on graph convolutional networks (GCN) for biomedical classification tasks. This method constructs graph structures for each omics type, learns omics-specific feature representations, and enhances classification performance by modeling cross-omics correlations. Additionally, MOGONET can identify potential biomarkers from various disease-related omics data types. However, the framework independently constructs graph structures for each omics type and uses separate GCNs for feature extraction, lacking a mechanism to directly model interactions between different omics types, thereby limiting its ability to fully exploit the potential synergistic effects of multi-omics data. Kesimoglu & Bozdag (2023) proposed the SUPREME multi-omics integration framework, which constructs a similarity network of multi-omics features to generate patient embeddings and fuses these embeddings with original features to uncover complementary information in multi-omics data. SUPREME demonstrated superior performance in subtype prediction tasks across multiple breast cancer datasets compared to traditional methods. However, this approach lacks an attention mechanism, which limits its ability to dynamically model the intrinsic dependencies between different omics, thereby reducing its capacity to capture complex cross-modal interactions and explore potential biological associations within multi-omics data. Tanvir et al. (2024) proposed the MOGAT framework, which combines graph neural networks with multi-head attention mechanisms to integrate multi-omics data for cancer subtype prediction. This method enhances the model’s ability to extract key information by assigning differentiated attention weights to neighboring samples, demonstrating strong performance in multiple cancer subtype prediction tasks. However, MOGAT does not address the mechanisms of feature extraction in the GCN process or their biological interpretability, thus limiting the model’s explainability and the exploration of biological significance.
Although the aforementioned methods have achieved remarkable success in integrating multi-omics data, several limitations remain: (1) Multi-omics data are typically high-dimensional with a large number of features, making it challenging for some methods to effectively capture feature correlations. (2) Furthermore, complex interrelationships and dependencies exist among multi-omics data, but existing methods often overlook the intrinsic correlations between samples.
Inspired by the attention mechanism and hierarchical fusion, the attention mechanism focuses on features critical to classification outcomes, while hierarchical fusion captures interrelationships between modalities (Gong et al., 2023; Pan et al., 2023a; Zhao, Zhang & Geng, 2024). Building upon this, this article proposes a multi-omics cancer recurrence prediction model based on a multi-head attention mechanism for cancer recurrence prediction. The main contributions of this study are as follows:
-
(1)
Feature matrices for multi-omics data and biological pathways were constructed, and three multi-head attention modules were utilized to extract key features from the pathway feature matrices, thereby improving the model’s predictive performance.
-
(2)
A hierarchical fusion module is designed to first fuse features learned through multi-head attention in pairs, capturing interdependencies between different multi-omics data. Subsequently, the pairwise-fused features are further integrated into a feature matrix, which summarizes all critical features of the multi-omics data and their correlation information.
-
(3)
DeepSHAP is employed to analyze the model’s interpretability and identify key genes influencing cancer recurrence.
-
(4)
The model’s performance is evaluated through five rounds of 5-fold cross-validation on the BRCA, BLCA, and LIHC datasets.
In summary, this study presents a multi-omics cancer recurrence prediction model based on a multi-head attention mechanism and a hierarchical fusion strategy. The model fully leverages the complementarity between different omics data and employs bio-pathway-guided feature learning to enhance its predictive capability for cancer recurrence. Experimental results on three publicly available cancer datasets BRCA, BLCA, and LIHC demonstrate that the proposed method outperforms existing state-of-the-art methods across multiple evaluation metrics, including accuracy (ACC), Area Under the ROC Curve (AUC), F1-score, Recall (REC), and Area Under the Precision–Recall Curve (AUPR), thereby validating its predictive efficacy and cross-dataset generalization capability.
The structure of this article is as follows: the Methods section provides a detailed introduction to the overall framework of the proposed model and the design of its key modules; the Experimental section describes the data preprocessing workflow, the selection of evaluation metrics, and the experimental setup; the Results section presents a comparison of the model’s performance on multi-omics data and an analysis of its interpretability; finally, the Conclusion section summarizes the work presented in this article and outlines potential directions for future research.
Methods
MultCPM model framework
MultCPM, a deep learning model for cancer recurrence prediction, integrates clinical and multi-omics data, as depicted in Fig. 1. The model comprises four components: a biological pathway module, a pathway multi-head attention module, a hierarchical fusion module and a recurrence prediction module. First, the preprocessed multi-omics data, comprising mRNA, miRNA, and SNV, are associated with their respective biological pathways. Subsequently, three relationship matrices (mRNA-pathway, miRNA-pathway, and SNV-pathway) are constructed to extract key features. Next, three independent pathway modules are constructed using a multi-head attention mechanism to capture pathway features within each sample. Finally, the learned pathway features are hierarchically fused, and the fused features are input into a multilayer perceptron model to perform cancer recurrence prediction and model interpretability analysis. The model enhances prediction accuracy by capturing correlations between multi-omics using the described method.
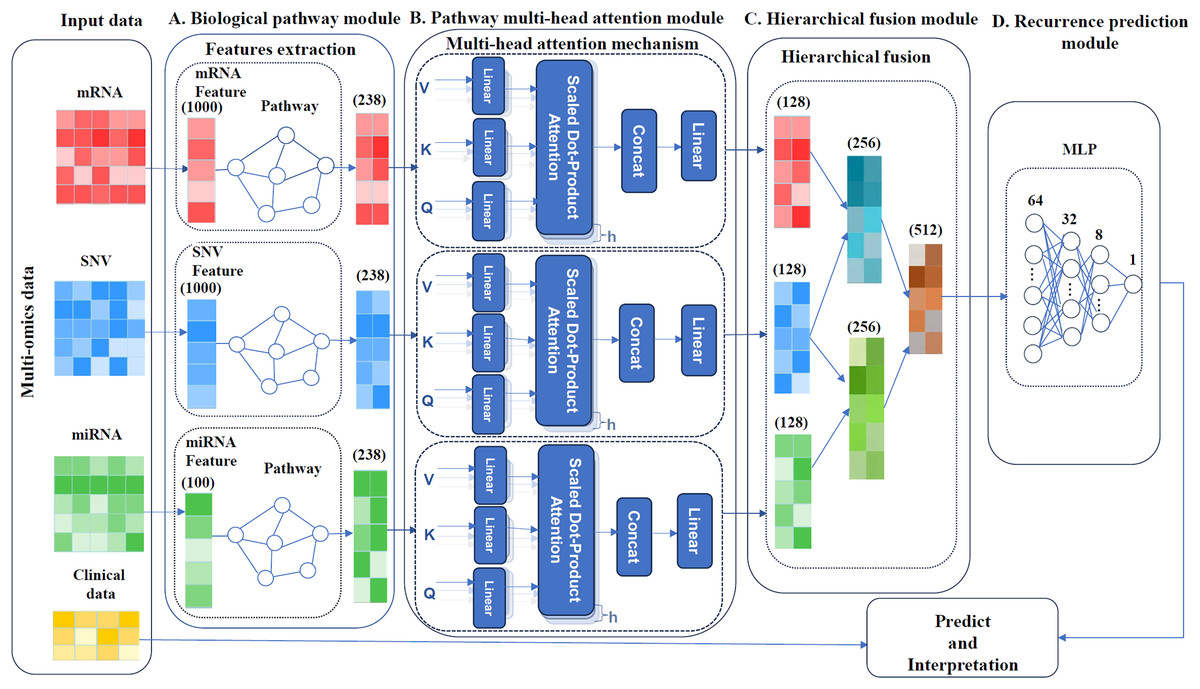
Figure 1: Framework of the MultCPM model.
(A) Biological pathway module, mapping of omics and pathways. (B) Pathway multi-head attention module, feature learning using feature matrices mapped multiple times with a multi-head attention mechanism. (C) Hierarchical fusion module, data is layered and merged after feature learning. (D) Recurrence prediction module, predicting cancer recurrence.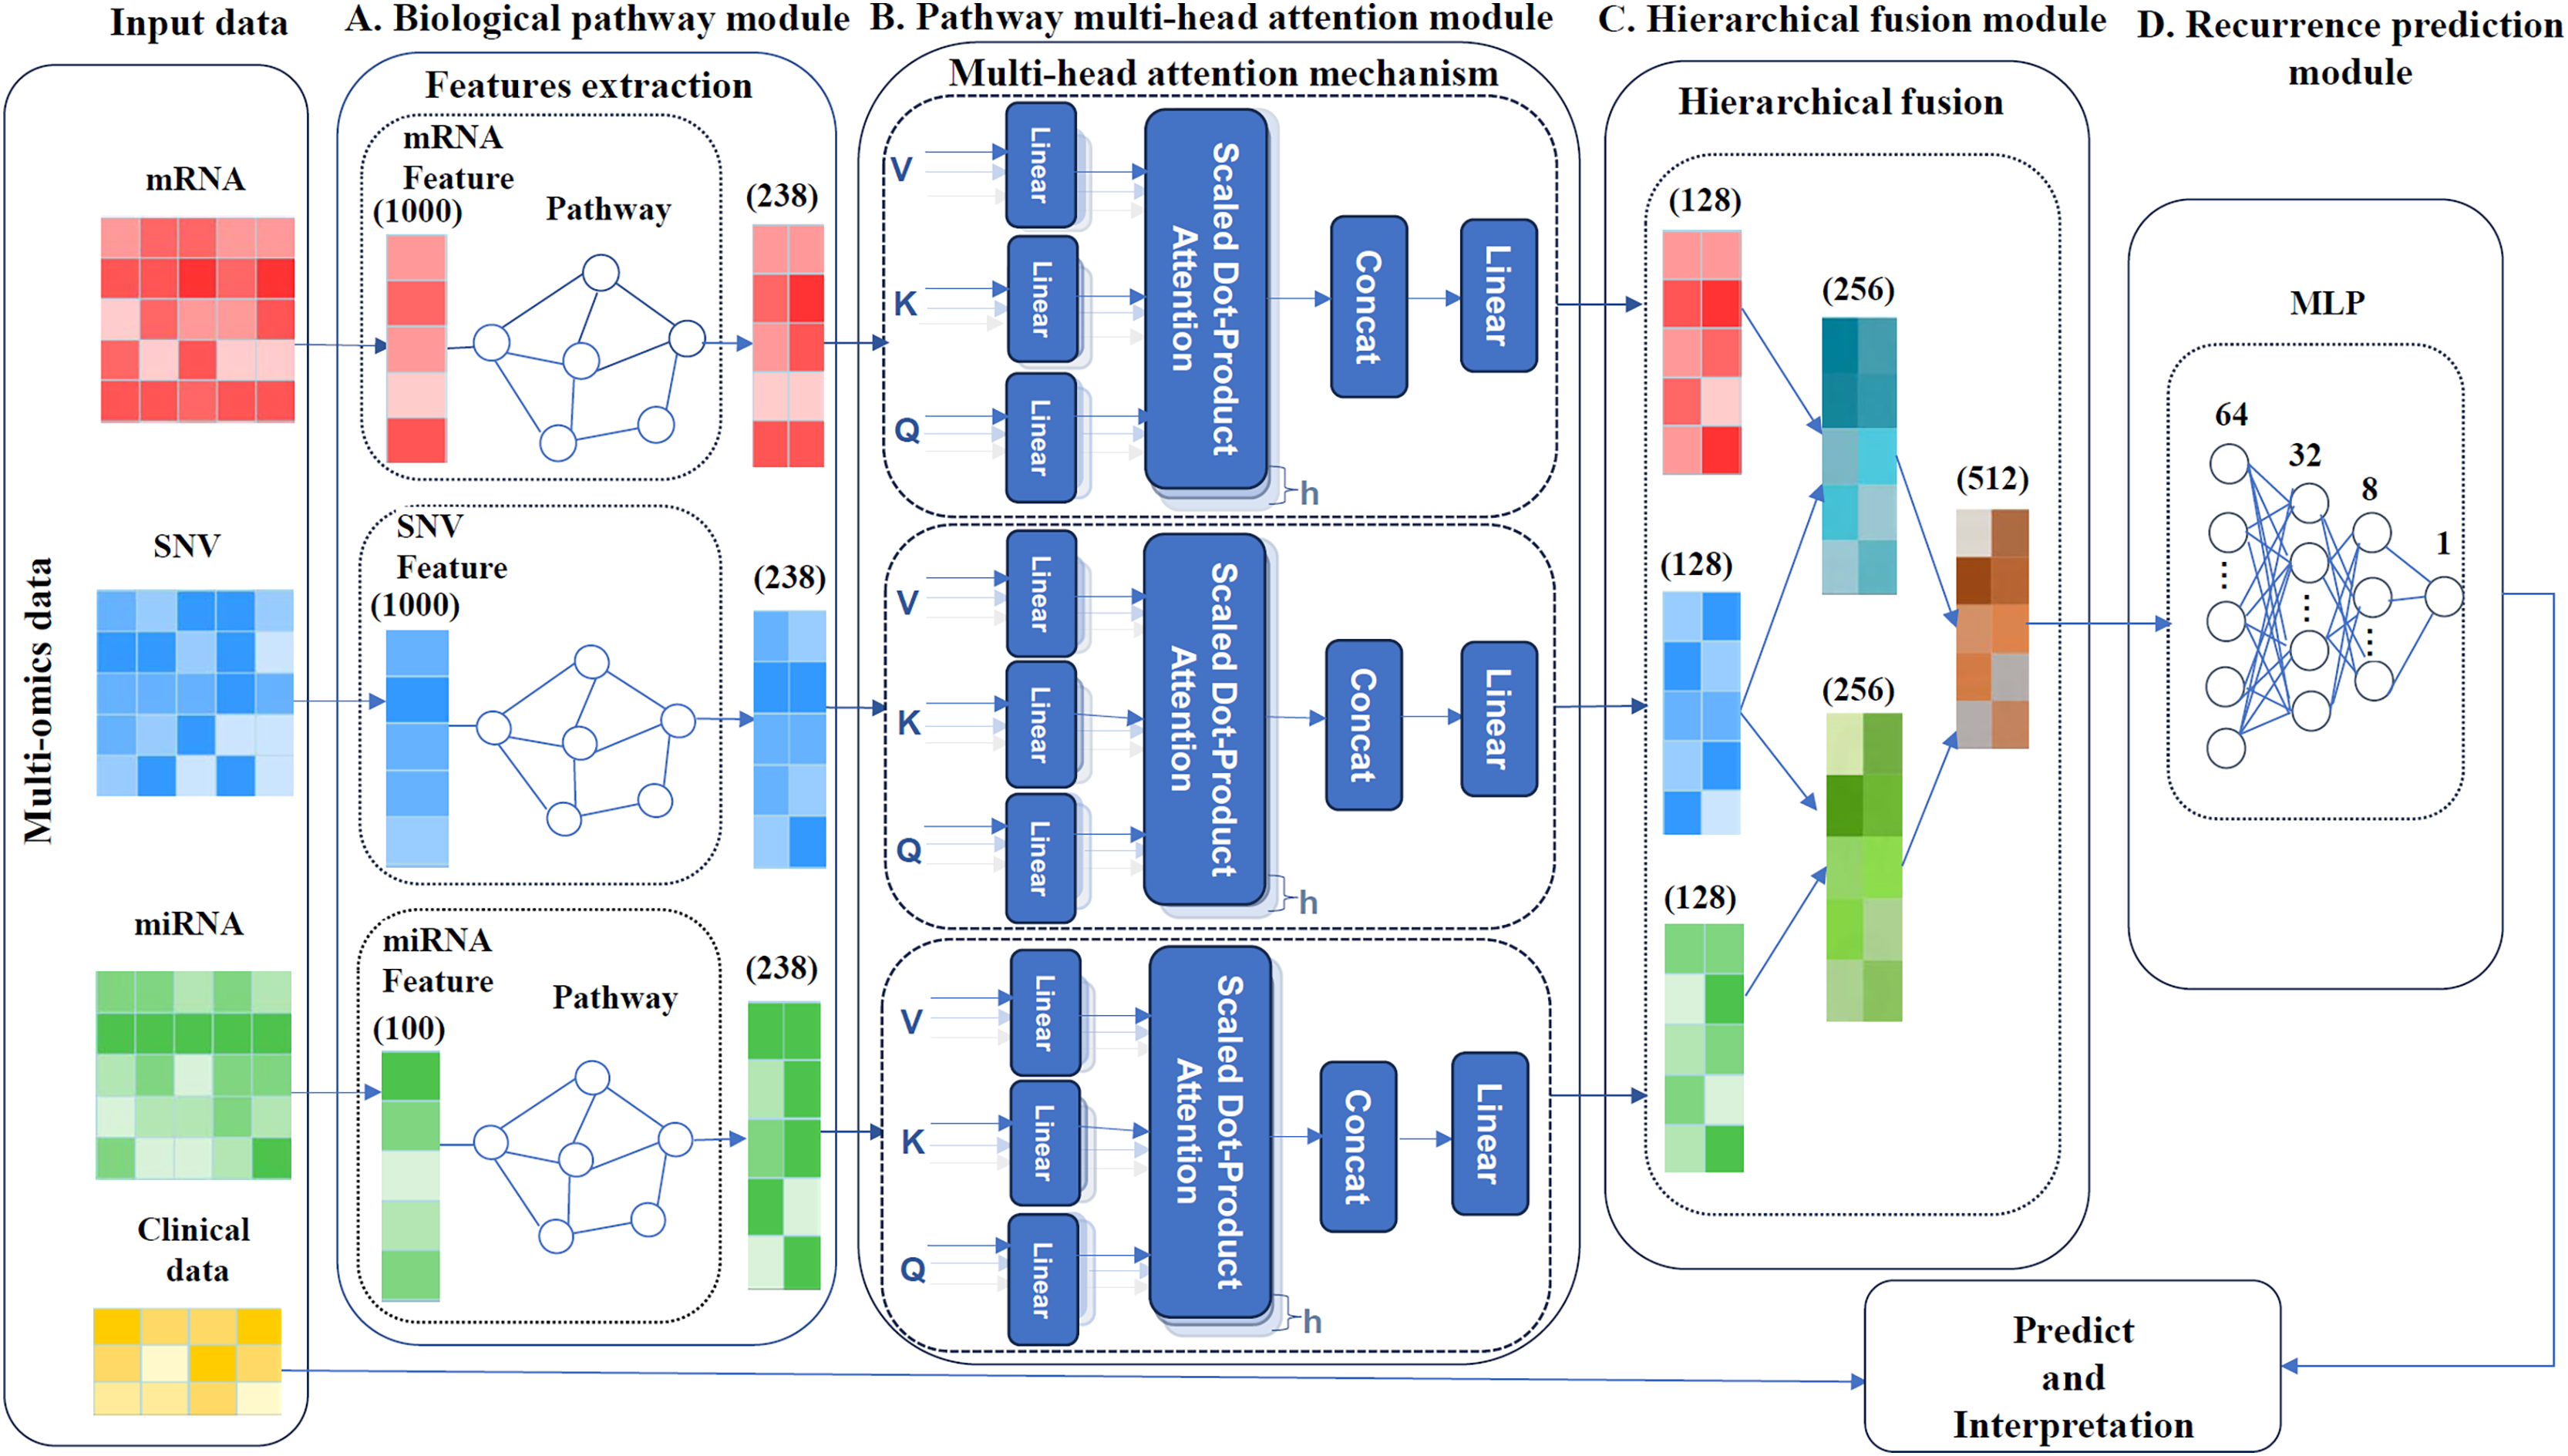
Biological pathways module
As shown in Fig. 1A, the biological pathway module of the MultCPM model consists of an omics feature layer and a pathway layer. Using a feedforward neural network, this module maps multi-omics data to a functional pathway space, establishing structured associations between omics features and known biological pathway nodes. The design of this module builds upon existing research (Hao et al., 2018; Zhou et al., 2024a), aiming to fully leverage biological knowledge graphs to guide feature modeling and enhance the biological plausibility and interpretability of feature learning. Let represent the raw feature matrix of the -th type of omics data (mRNA, miRNA, or SNV) after preprocessing, where denotes the number of samples and denotes the number of features. We then construct a sparse binary mapping matrix to characterize the association between all features of this omics type and biological pathways, where denotes the total number of pathways (i.e., the number of pathway nodes in KEGG). The mapping matrix is defined as follows:
(1)
Here, denotes the -th feature of the -th type of omics data, and denotes a node in a pathway. When feature is annotated in the biological knowledge graph as a component of pathway (e.g., labeled as a member gene of the pathway in KEGG), the corresponding relationship matrix element is assigned a value of 1, indicating a structural association between the feature and pathway node . Otherwise, it is assigned a value of 0, indicating no association between the two.
To further illustrate the construction process, a diagram of the mapping logic is provided in the Supplemental Materials, using the relationship between mRNA features and pathways as an example to demonstrate how matrix is generated.
Next, the feature propagation process from the omics feature layer to the pathway layer is described by the following formula:
(2)
In this formula, represents the pathway feature representation corresponding to the -th type of omics data, is the input omics feature matrix, is the association matrix between omics features and pathway nodes, and is the bias term. This formula performs a linear mapping from the original omics feature space to the pathway space, aiding in the identification of omics information related to specific biological pathways.
Using the biological pathway module, relationship matrices were constructed between mRNA, SNV, and miRNA data and their corresponding pathway nodes, denoted as , , and , where denotes the number of samples, and denotes the dimension of the -th type of omics feature after biological pathway mapping. In this study, the feature dimensions for each group are provided in Table 1. Each row of the relationship matrix corresponds to a sample, while the columns represent the feature representations of that sample across different pathway nodes, including gene expression levels, mutation status, and regulatory features, among other biological information.
| Datasets | |||
|---|---|---|---|
| BRCA | 1,000 | 1,000 | 100 |
| BLCA | 1,000 | 1,000 | 100 |
| LIHC | 1,000 | 1,000 | 200 |
Pathway multi-head attention module
To explore the potential correlations between samples, this study introduces the multi-head attention mechanism (Vaswani et al., 2017) to model the complex interactions between multi-omics data (mRNA, SNV, and miRNA) and biological pathway nodes. This mechanism captures biological dependencies at multiple levels by mapping input features to several subspaces, thereby extracting potential knowledge comprehensively. Multiple attention heads can simultaneously focus on the biological regulatory relationships between different omics features and their corresponding KEGG pathway nodes. Key genes in these pathways play a critical role in tumor progression and recurrence. Effective modeling of these dependencies aids in revealing potential recurrence drivers and enhances the model’s ability to comprehend the complexity of cancer biology.
As shown in Fig. 1B, the multi-head attention module consists of three parallel multi-head attention mechanisms, with inputs being pathway-level omics features mapped by the biological pathway module. These features incorporate KEGG pathway knowledge during construction, establishing a structured association between omics features and pathway nodes. Based on this, the attention mechanism effectively models feature dependencies between samples within the pathway space, deeply explores potential functional module synergies, and further enhance the model’s ability to represent key pathway features and provide biological interpretability.
For each attention mechanism, the feature matrix is linearly transformed to generate the query (Q), key (K), and value (V) matrices. The query identifies relevant pathway features, the key provides matching criteria, and the value contains the corresponding feature information. Each head computes the attention weights (W), which represent the correlations between different pathways, by calculating the dot product of the query matrix (Q) and the key matrix (K). The attention weights indicate the degree to which one pathway feature influences another. Higher attention weight implies that the features of one pathway are more dependent on those of another pathway.
Each attention head computes queries, keys, and values in distinct subspaces using independent linear transformations, allowing different heads to focus on various feature relationships, as expressed by the following formula:
(3) where is the dimension of the key matrix, used for normalization.
The features of each attention head are derived through multi-head processing, with the -th head computed as follows:
(4)
Here, , , represent the query, key, and value transformation matrices of the -th head.
Finally, the outputs from each head are concatenated and subjected to a linear transformation to produce the final multi-head attention output. This output represents the combined result of all attention heads and encapsulates information about the complex interactions among multiple pathways, as calculated by the following formula:
(5)
represents the training parameters, while denotes the number of heads. Here, we set to 16. For the impact of different numbers of heads on model performance, refer to the experimental analysis of MultCPM performance with varying attention heads in the experimental section.
Learning the correlations between samples using a multi-attention mechanism, extracting meaningful features from multiple perspectives, and generating high-dimensional feature representations that capture pathway feature correlations between samples can enhance the model’s predictive performance.
Hierarchical fusion module
In multi-omics cancer prediction tasks, capturing potential biological interactions between different omics is crucial for improving model performance and interpretability. Previous studies have shown that SNV mutations can regulate mRNA expression and stability by affecting promoter regions, splicing sites, and other mechanisms (Zhou et al., 2018). Additionally, SNVs may be located at miRNA binding sites or within the miRNA itself, thereby affecting miRNA production and function, and ultimately regulating target gene expression (Schneiderova et al., 2017; Urbanek-Trzeciak et al., 2020).
As shown in Fig. 1C, based on this biological motivation, we propose a “layered fusion strategy” to construct two typical regulatory pathways, “SNV-mRNA” and “SNV-miRNA”, and ultimately integrate them into a unified feature representation. The entire fusion process is as follows:
1. Encoding regulation fusion pathway
Concatenate the pathway features of SNV and mRNA to obtain the intermediate fusion representation of the encoding layer:
(6)
This step simulates the regulatory mechanism of SNV on gene expression.
2. Non-coding regulatory fusion pathway
Concatenate the pathway features of SNV and miRNA to form a fusion representation of non-coding regulation :
(7)
This reflects how SNV indirectly regulates gene expression by affecting the miRNA regulatory axis.
3. Global fusion
Fuse the two intermediate representations again to obtain the final feature representation :
(8)
The final representation integrates both coding and non-coding regulatory pathways, enabling the model to simultaneously model the effects of mutations on both layers of regulatory mechanisms. The specific implementation process of this hierarchical fusion is further illustrated by the pseudocode as follows (Box 1):
In the above hierarchical fusion, SNV features were reused twice during the fusion process due to their role as a core upstream factor in cancer development, influencing multiple regulatory pathways simultaneously. This “hierarchical splicing” strategy explicitly models hierarchical regulatory pathways (e.g., SNV-mRNA, SNV-miRNA) structurally, helping to preserve local regulatory structures and enhancing the model’s ability to model interactions at high-level feature abstraction. Compared to direct splicing of the entire histology and bilinear fusion, this approach improves performance and biological interpretability. The performance comparison of each fusion method is presented in the “Comparison of different fusion methods” section of the experimental results.
Recurrence prediction module
As illustrated in Fig. 1D, we construct a four-layer multilayer perceptron (MLP) network for cancer recurrence prediction, utilizing the tanh activation function in the hidden layers and the Sigmoid activation function in the output layer. The objective function for MLP classification is defined as follows:
(9)
Here, represents the number of samples, is the true label of the -th sample, where = 1 indicates recurrence and = 0 indicates no recurrence. denotes the probability predicted by the model for recurrence of the -th sample, which is finally output through the Sigmoid function. The features and clinical data obtained after hierarchical fusion are input into the network. After forward propagation through each hidden layer, the network outputs a recurrence probability for each patient. A higher probability value indicates a greater likelihood of recurrence, and vice versa.
Model interpretation
To evaluate the role of multi-omics features (mRNA, miRNA, and SNV) in predicting cancer recurrence, the DeepSHAP method (Chen, Lundberg & Lee, 2022; Eikså, Vatne & Lekkas, 2024) was used to analyze the interpretability of the trained MultCPM model. DeepSHAP combines Shapley value theory with the gradient decomposition mechanism of DeepLIFT (Bhattarai et al., 2024) to effectively measure the marginal contribution of each input feature in the deep neural network to cancer recurrence prediction. This method reveals the key features involved in the model’s decision-making process by quantifying their contributions to the prediction.
Figure 2 illustrates the complete process of DeepSHAP parsing the MultCPM model. First, mRNA expression data, miRNA expression data, and SNV mutation data are used as inputs, with the dataset divided into training and test sets in an 80%:20% ratio to ensure the independence of the training and evaluation processes. Subsequently, the three types of omics data are input into the MultCPM model for training, and prediction is performed on the test set to obtain the model output, which provides the basis for subsequent SHapley Additive exPlanations (SHAP) value calculation. In the DeepSHAP interpretation stage, the trained MultCPM model is combined with the test set inputs, and the SHAP value for each input feature quantifying its positive or negative contribution to the model output (i.e., cancer recurrence prediction) is calculated. Through this process, feature contribution matrices for mRNA, miRNA, and SNV data are obtained separately, revealing the decision-making basis and key drivers within the model.
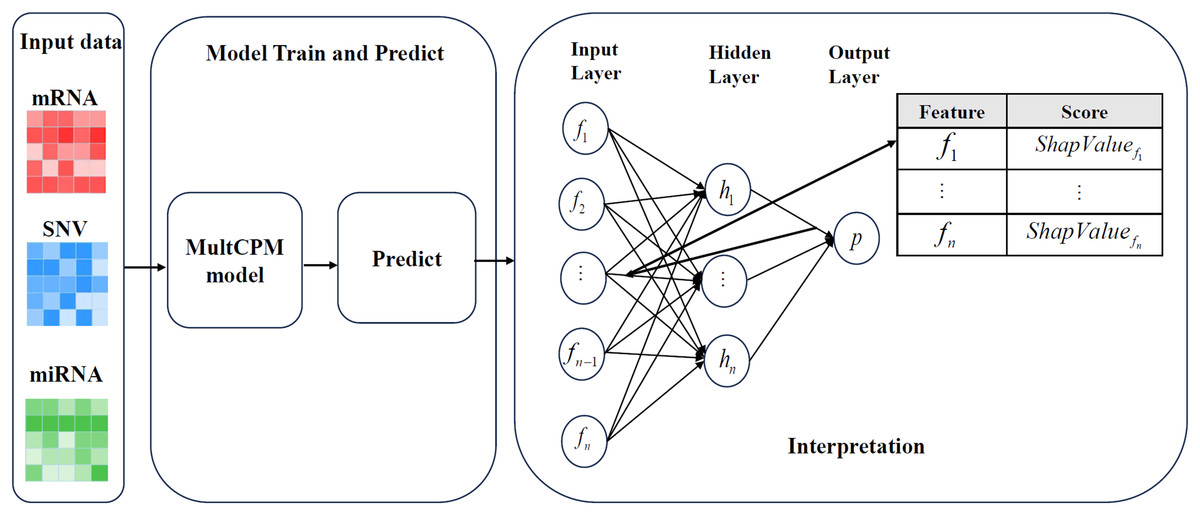
Figure 2: DeepSHAP’s parsing process for models.
Illustrates the complete process of DeepSHAP parsing the MultCPM model.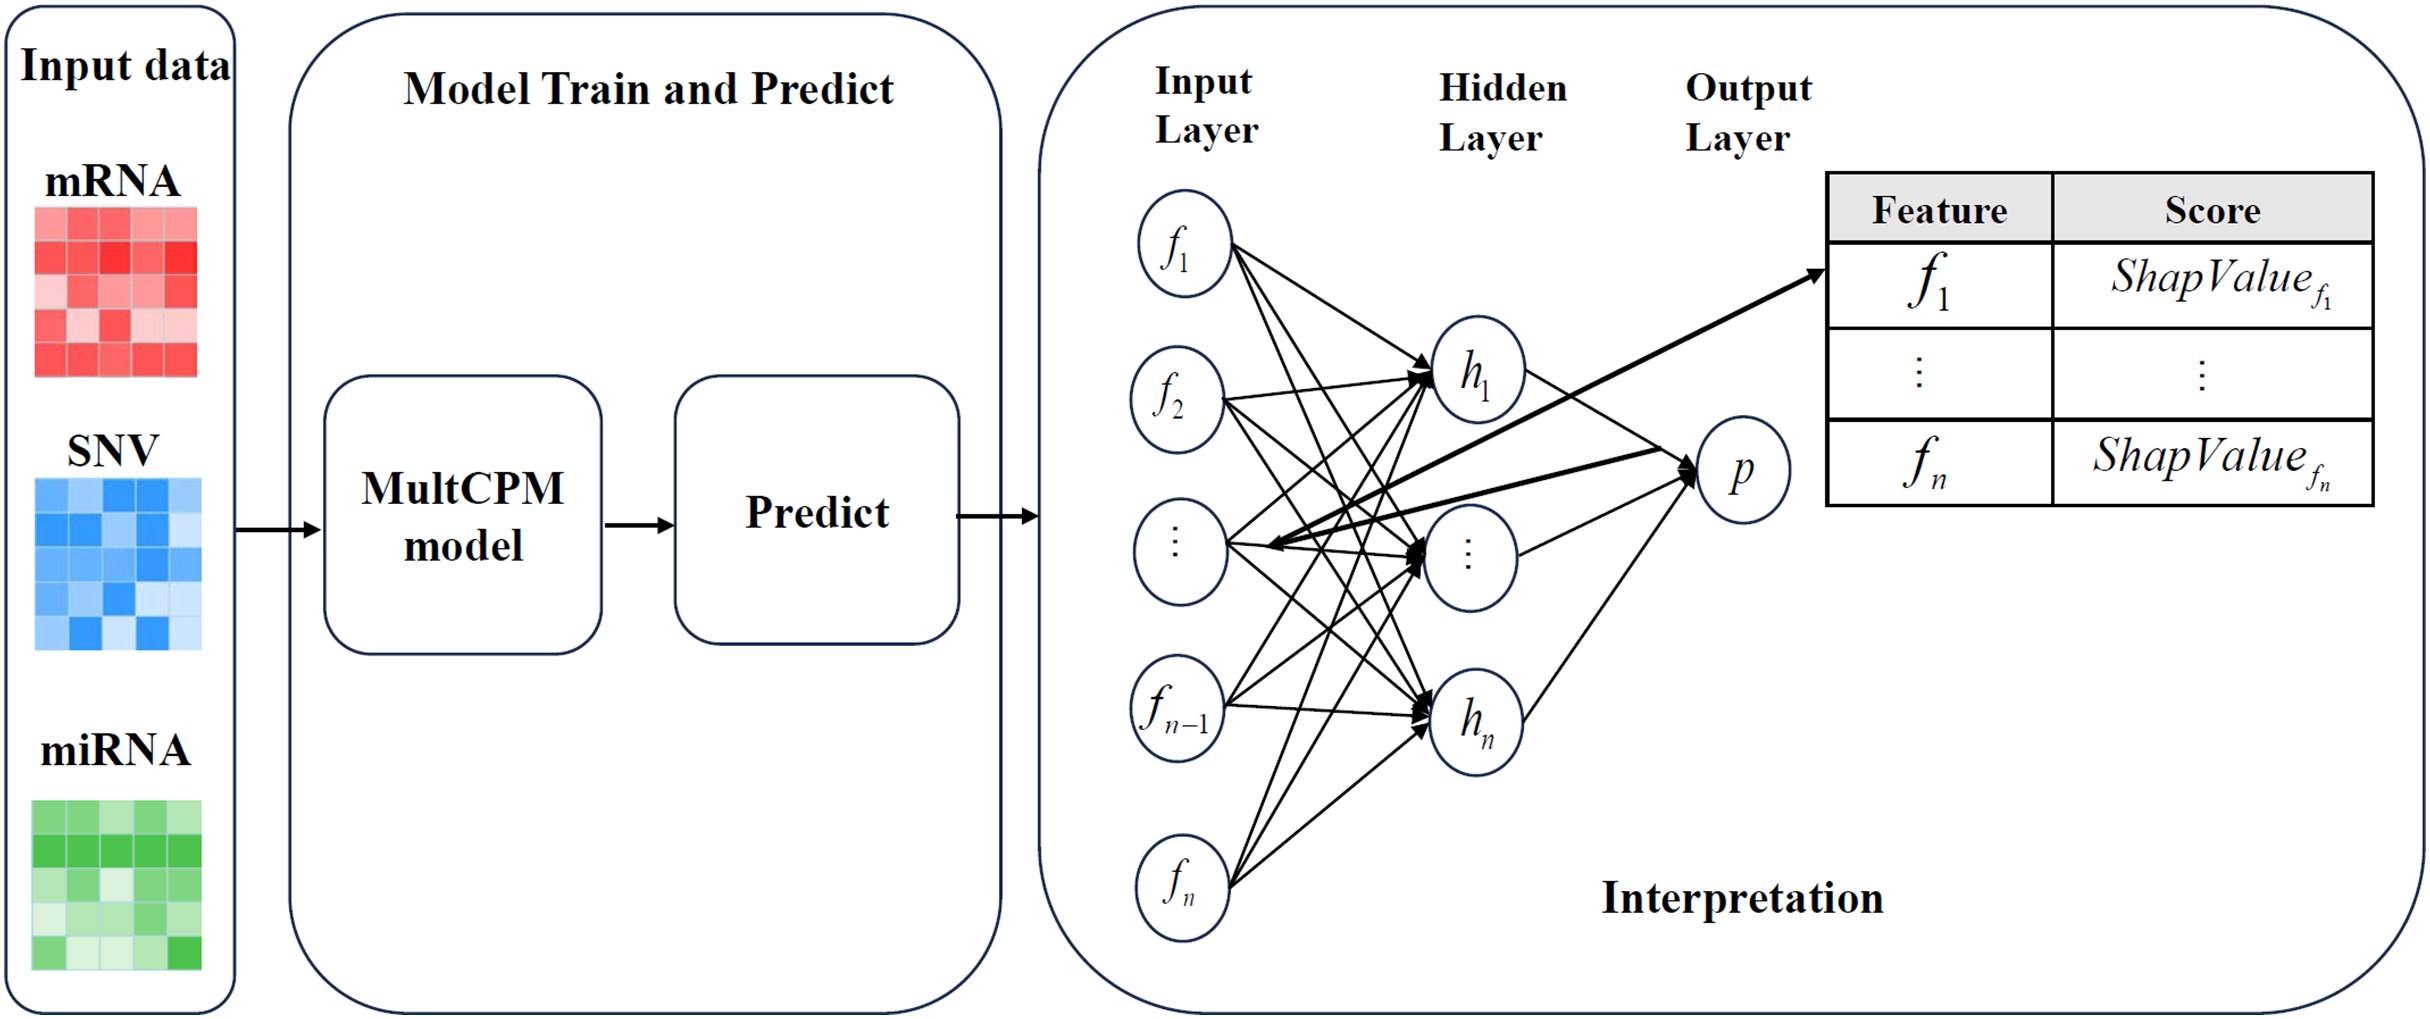
In DeepSHAP’s model parsing, the Shapley value is calculated as follows:
(10)
represents the SHAP value of feature for model under input . denotes the subset of features, and represents the full set of features. is the predicted output of the model using only the features in subset . This formula calculates the marginal contribution of each feature to the output when it is introduced into the feature subset . The contribution value of the feature is calculated as follows:
(11)
Here, represents the output of the model, denotes the gradient of the model at feature , is an input feature, and is the reference value for feature .
Through DeepSHAP’s model parsing, we not only mapped the model output back to the original feature layer but also quantified the importance of each feature in predicting cancer recurrence. This provided data support for the subsequent analysis of the biological mechanism and screening of potential markers.
Experiments
Data processing
In this study, we used cancer datasets from the The Cancer Genome Atlas (TCGA) and Therapeutically Applicable Research to Generate Effective Treatments (TARGET) databases, along with the KEGG pathway dataset, to evaluate the predictive performance of our models.
First, for the KEGG pathway dataset, pathways and their associated gene sets were primarily obtained in this study using the getGenesets function from the R package EnrichmentBrowser (Geistlinger, Csaba & Zimmer, 2016), which extracted 359 KEGG pathways and their corresponding 8,842 gene entries. Meanwhile, the mirPath v.3 web server (Vlachos et al., 2015) was used to obtain the set of miRNAs associated with KEGG pathways, involving 238 pathways and 952 miRNA entries. To improve the model’s generalization ability and avoid the overfitting effect of specific cancer pathways on the training results, we preprocessed the extracted pathway data as follows:
1. Elimination of cancer-specific pathways: 62 pathways clearly labeled as related to specific cancers, such as “hsa05224-Breast cancer,” were excluded based on pathway annotations from the KEGG website, leaving 297 pathways for subsequent modeling.
2. Standardization of pathway names: Some pathways were inconsistently named or lacked detailed descriptions in different sources. For instance, the “Mitogen-Activated Protein Kinase (MAPK) signaling pathway” was sometimes listed as just “MAPK.” We standardized and supplemented the names of these pathways using the KEGG database (Kanehisa et al., 2024), resulting in the correction and improvement of 32 pathway names.
3. Gene and miRNA de-duplication: Due to duplicate annotations of genes and miRNAs across different pathways, we removed 768 duplicate genes and 140 duplicate miRNAs, resulting in 8,074 unique genes and 812 unique miRNAs.
These steps ensured the completeness, consistency, and non-redundancy of the pathway data, making the mapping of multi-omics data to pathway features more accurate and reliable.
For the TCGA datasets, we obtained data for breast cancer (BRCA), liver cancer (LIHC), and bladder cancer (BLCA) from the Xena TCGA Pan-Cancer platform (Goldman et al., 2020). These data include multi-omics data for mRNA (FPKM), miRNA, and SNV (MuTect2), as well as clinical data on patient survival and mortality. For sample selection, a rigorous data screening process was employed to ensure that each sample had complete multi-omics characterization and clinical recurrence information, thus ensuring the scientific rigor and reproducibility of model training and evaluation. The following screening process was applied to retain samples with complete mRNA, miRNA, and SNV data, clinical data with clear recurrence information, and samples with less than 10% missing data for each histology, in accordance with the methodology of a previous study (Dhillon & Singh, 2020). After this screening, the final number of retained samples is shown in the sample column of Table 2.
| Datasets | Number of samples | Number of original features | Number of training features |
|---|---|---|---|
| BRCA | Recurrence: 82 | mRNA: 6,038 | mRNA: 1,000 |
| Non-recurrence: 129 | SNV: 6,569 | SNV: 1,000 | |
| miRNA: 437 | miRNA: 100 | ||
| BLCA | Recurrence: 143 | mRNA: 6,025 | mRNA: 1,000 |
| Non-recurrence: 259 | SNV: 6,819 | SNV: 1,000 | |
| miRNA: 479 | miRNA: 100 | ||
| LIHC | Recurrence: 171 | mRNA: 5,823 | mRNA: 1,000 |
| Non-recurrence: 183 | SNV: 5,797 | SNV: 1,000 | |
| miRNA: 469 | miRNA: 200 |
In this experiment, due to the different data formats of the original multi-omics data, it was necessary to normalize each histology dataset. For mRNA data, ENSGID identifiers were replaced with corresponding gene names, and only genes matching the KEGG gene set were retained, with gene expression values normalized. For miRNA data, only miRNAs associated with the KEGG pathway were retained, and their expression values were normalized. For SNV data, nucleotide variants in genes were marked as 1, and non-variants as 0. The feature dimensions before and after processing are shown in Table 2, which includes the number of raw and trained feature values. To fill missing values in mRNA and miRNA, we compared four commonly used methods: random forest, K-nearest neighbors (KNN), soft-impute, and Non-negative Matrix Factorization (NMF). The experimental results show that random forest is the optimal method for filling missing values, and the impact of this strategy on model performance is presented in Appendix B. Detailed information on the histology data of the TCGA dataset is provided in Table 2.
For the TARGET dataset, clinical data, mRNA, and miRNA expression data for acute myeloid leukemia (TARGET-AML) and nephroblastoma (TARGET-WT) were obtained from the GDC data portal (https://portal.gdc.cancer.gov/v1/). miRNA data were first processed using a log2 transformation to nonlinearly smooth their distribution, followed by normalization. mRNA data were pre-processed in the same manner as the TCGA dataset. For samples or genes/miRNAs with duplicate records, the final expression levels were obtained by averaging the values. To reduce the dimensionality of the multi-omics data and eliminate redundant features, the chi-square test was applied to screen features for each group. The missing value imputation strategy is consistent with TCGA and implemented using the random forest algorithm. The final dimensionality of the omics features in the TARGET dataset is detailed in Table 3.
| Datasets | Number of samples | Number of original features | Number of training features |
|---|---|---|---|
| AML | Recurrence: 120 | mRNA: 6,404 | mRNA: 2,000 |
| Non-recurrence: 101 | miRNA: 434 | miRNA: 100 | |
| WT | Recurrence: 88 | mRNA: 6,758 | mRNA: 2,000 |
| Non-recurrence: 24 | miRNA: 441 | miRNA: 200 |
Evaluation metrics
To evaluate the model’s performance in cancer recurrence prediction, we utilized standard evaluation metrics, including accuracy (Schneiderova et al., 2017), precision, recall, F1-score, Area Under the Receiver Operating Characteristic Curve (AUC-ROC), and area Under the Precision-Recall Curve (AUPR). Detailed definitions of these metrics are outlined below:
(12)
(13)
(14)
(15)
The predictive performance of the MultCPM model was assessed using these metrics.
Implementation details
The MultCPM model is built on the TensorFlow 2.6.0 framework and Python 3.9.13, with the primary development and runtime environment being Ubuntu 22.04. Model training is conducted on an NVIDIA RTX 4090 GPU (24 GB video memory). The optimizer used is Adam, with a learning rate of 1e−4, a batch size of 128, and 200 training epochs. The loss function employed is binary_crossentropy.
To ensure the robustness and generalization of model performance, we use 5-fold cross-validation repeated five times, with the average result serving as the final performance metric. Additionally, the number of attention heads, a key hyperparameter, is tuned. All code, data processing scripts, and running instructions are open sourced at https://github.com/dowell2016/MultCPM. The complete code conda run configuration file (README.md) is also provided.
Results and Discussion
Performance comparison with other advanced classification methods
To further assess the effectiveness of the proposed MultCPM model, its performance was compared against several widely used machine learning classifiers, such as Logistic Regression (LR) and Support Vector Machine (SVM), along with deep learning approaches like MOGONET (Wang et al., 2021a) and DeepKEGG (Lan et al., 2024). For training the LR and SVM models, the omics data connections were directly used as input features. The preprocessed data was used directly for training in the MOGONET method.
We comprehensively evaluated the performance of various machine learning and deep learning models on three cancer datasets BRCA, BLCA, and LIHC. Table 4 summarizes the comparison of LR, SVM, MOGONET, DeepKEGG, and our proposed MultCPM model across five key metrics: ACC, AUC, F1-score, AUPR, and REC.
| Datasets | Methods | ACC | AUC | F1-score | REC | AUPR |
|---|---|---|---|---|---|---|
| BRCA | LR | 0.726 ± 0.008** | 0.814 ± 0.011** | 0.581 ± 0.015** | 0.501 ± 0.024** | 0.747 ± 0.017** |
| SVM | 0.746 ± 0.008* | 0.823 ± 0.007** | 0.604 ± 0.015** | 0.511 ± 0.016** | 0.768 ± 0.011** | |
| MOGONET | 0.763 ± 0.016* | 0.827 ± 0.016** | 0.596 ± 0.033** | 0.489 ± 0.034** | 0.784 ± 0.021** | |
| DeepKEGG | 0.784 ± 0.006* | 0.869 ± 0.002* | 0.672 ± 0.007* | 0.603 ± 0.008* | 0.822 ± 0.013* | |
| MultCPM | 0.814 ± 0.004 | 0.900 ± 0.005 | 0.733 ± 0.013 | 0.632 ± 0.006 | 0.893 ± 0.006 | |
| BLCA | LR | 0.818 ± 0.005** | 0.915 ± 0.013** | 0.722 ± 0.011** | 0.668 ± 0.018** | 0.839 ± 0.012** |
| SVM | 0.811 ± 0.006** | 0.903 ± 0.014* | 0.703 ± 0.005** | 0.634 ± 0.006** | 0.828 ± 0.009** | |
| MOGONET | 0.777 ± 0.007* | 0.867 ± 0.009** | 0.681 ± 0.016** | 0.667 ± 0.033** | 0.713 ± 0.013** | |
| DeepKEGG | 0.896 ± 0.003 | 0.949 ± 0.008* | 0.857 ± 0.006* | 0.875 ± 0.013 | 0.923 ± 0.012* | |
| MultCPM | 0.903 ± 0.004 | 0.964 ± 0.011 | 0.863 ± 0.013 | 0.877 ± 0.025 | 0.949 ± 0.005 | |
| LIHC | LR | 0.777 ± 0.023** | 0.884 ± 0.017** | 0.760 ± 0.023** | 0.732 ± 0.020** | 0.868 ± 0.021* |
| SVM | 0.783 ± 0.008** | 0.905 ± 0.006* | 0.762 ± 0.011** | 0.718 ± 0.017** | 0.862 ± 0.014* | |
| MOGONET | 0.812 ± 0.009** | 0.865 ± 0.013** | 0.816 ± 0.011* | 0.852 ± 0.026* | 0.865 ± 0.017* | |
| DeepKEGG | 0.877 ± 0.006* | 0.955 ± 0.003* | 0.870 ± 0.007* | 0.856 ± 0.009* | 0.957 ± 0.002* | |
| MultCPM | 0.937 ± 0.008 | 0.979 ± 0.006 | 0.935 ± 0.005 | 0.929 ± 0.007 | 0.979 ± 0.005 |
Note:
The table above presents the t-test results comparing different methods to MultCPM in terms of various evaluation metrics on the BRCA, BLCA, and LIHC datasets. * and ** mean a p-value of less than 0.05 and 0.001 respectively. The bold indicate the best performance for each dataset.
The performance of the MultCPM model on the BRCA dataset is particularly noteworthy. The model achieves an ACC of 0.820 ± 0.004, significantly outperforming other methods, and an AUC of 0.900 ± 0.005, demonstrating clear advantages. The F1-score of 0.712 ± 0.013 is notably higher than that of DeepKEGG (0.672 ± 0.007) and MOGONET (0.596 ± 0.033). Additionally, the model achieves a REC of 0.632 ± 0.006 and an AUPR of 0.893 ± 0.006, which are significantly superior to those of DeepKEGG, MOGONET, and traditional machine learning models.
On the BLCA dataset, the MultCPM model demonstrated exceptional performance, achieving an ACC of 0.903 ± 0.004, slightly surpassing DeepKEGG 0.896 ± 0.003, and significantly outperforming traditional methods such as SVM and LR. The AUC reached 0.964 ± 0.011, markedly exceeding the performance of other models. The F1-score was 0.863 ± 0.013, outperforming DeepKEGG 0.857 ± 0.006, further emphasizing its advantage in handling imbalanced data. Additionally, the REC and AUPR were slightly higher than those of DeepKEGG and far exceeded other models, fully demonstrating its superior predictive capability.
The performance of MultCPM on the LIHC dataset is significantly improved, achieving an ACC of 0.937 ± 0.008, which is 6 percentage points higher than DeepKEGG 0.877 ± 0.006. The AUC reaches 0.979 ± 0.006, the highest among all models. The F1-score is 0.935 ± 0.005, substantially outperforming 0.870 ± 0.007 of DeepKEGG and 0.816 ± 0.011 of MOGONET. Additionally, its REC and AUPR are 0.877 ± 0.025 and 0.949 ± 0.005, respectively, fully demonstrating the superior capability of MultCPM in multimodal data integration.
In summary, MultCPM demonstrated outstanding classification performance across all three cancer datasets. Its superior results in ACC, F1-score, REC, AUC, and AUPR indicate that MultCPM effectively learns high-dimensional features in mRNA, miRNA, and SNV from multimodal data, significantly enhancing the model’s learning efficiency. By employing a hierarchical data integration approach, MultCPM fully captures the complex feature interactions among multi-omics data, substantially improving classification task performance. Notably, its exceptional performance on the LIHC dataset further validates the model’s strong adaptability and generalizability in handling heterogeneous biomedical data.
To further validate the generalization ability of the MultCPM model, this study conducted extended experiments on acute myeloid leukemia (AML) and nephroblastoma (WT) from the TARGET dataset. These experiments systematically evaluated the performance differences between MultCPM and other comparative methods in predicting recurrence across different cancer types. The results of the experiments are shown in Table 5.
| Datasets | Methods | ACC | AUC | F1-score | REC | AUPR |
|---|---|---|---|---|---|---|
| AML | LR | 0.740 ± 0.014* | 0.833 ± 0.012* | 0.758 ± 0.012* | 0.769 ± 0.016* | 0.859 ± 0.006* |
| SVM | 0.716 ± 0.014** | 0.784 ± 0.001** | 0.731 ± 0.013* | 0.758 ± 0.019** | 0.824 ± 0.004** | |
| MOGONET | 0.719 ± 0.014** | 0.806 ± 0.005** | 0.718 ± 0.004** | 0.772 ± 0.029* | 0.834 ± 0.007** | |
| DeepKEGG | 0.768 ± 0.005* | 0.847 ± 0.001* | 0.790 ± 0.005 | 0.800 ± 0.004* | 0.879 ± 0.001* | |
| MultCPM | 0.778 ± 0.016 | 0.851 ± 0.003 | 0.796 ± 0.011 | 0.808 ± 0.006 | 0.883 ± 0.002 | |
| WT | LR | 0.796 ± 0.016** | 0.844 ± 0.004* | 0.875 ± 0.010* | 0.843 ± 0.008** | 0.954 ± 0.005* |
| SVM | 0.787 ± 0.010** | 0.832 ± 0.013* | 0.869 ± 0.007** | 0.842 ± 0.007** | 0.953 ± 0.004* | |
| MOGONET | 0.823 ± 0.008* | 0.829 ± 0.021** | 0.888 ± 0.005* | 0.886 ± 0.018* | 0.948 ± 0.007* | |
| DeepKEGG | 0.830 ± 0.005* | 0.852 ± 0.003* | 0.892 ± 0.003 | 0.900 ± 0.006* | 0.962 ± 0.001 | |
| MultCPM | 0.849 ± 0.003 | 0.865 ± 0.004 | 0.906 ± 0.007 | 0.920 ± 0.003 | 0.963 ± 0.008 |
Note:
The table above presents the results of t-tests comparing different methods with MultCPM on various evaluation metrics for the AML and WT datasets. * and ** mean a p-value of less than 0.05 and 0.001 respectively. The bold indicate the best performance for each dataset.
The MultCPM model achieved the best performance on the AML dataset. Its ACC reached 0.778 ± 0.016, approximately 1 percentage point higher than DeepKEGG’s 0.768 ± 0.005. The AUC of MultCPM reached 0.851 ± 0.003, slightly higher than DeepKEGG’s 0.847 ± 0.001, marking the highest value among all models. Its F1-score was 0.796 ± 0.011, significantly better than DeepKEGG’s 0.790 ± 0.005 and MOGONET’s 0.718 ± 0.004, reflecting its stronger category balancing ability. In terms of recall (REC) and AUPR, MultCPM achieved 0.808 ± 0.006 and 0.883 ± 0.002, respectively, further confirming its robustness and superiority in handling high-dimensional heterogeneous data fusion.
MultCPM also delivered the best performance on the WT dataset. Its ACC was 0.849 ± 0.003, and its AUC reached 0.865 ± 0.004, both the highest values among all models. The F1-score of 0.906 ± 0.007 was significantly higher than DeepKEGG’s 0.892 ± 0.003, outperforming all baseline models. Additionally, MultCPM’s REC reached 0.920 ± 0.003, and AUPR reached 0.963 ± 0.008, demonstrating strong recurrence patient identification and stable prediction performance. These results further highlight the generalization advantage of this method in multi-omics integration.
Performance comparison of prediction for single-omics data and multi-omics integration
To further validate the effectiveness of integrating multi-omics data in cancer recurrence prediction, this study applied the MultCPM model to both multi-omics integration and single-omics input tasks. Using the BRCA, BLCA, and LIHC datasets, we systematically compared the classification performance of multi-omics integration with that of the three single-omics (SNV, mRNA, and miRNA). The results are shown on Fig. 3.
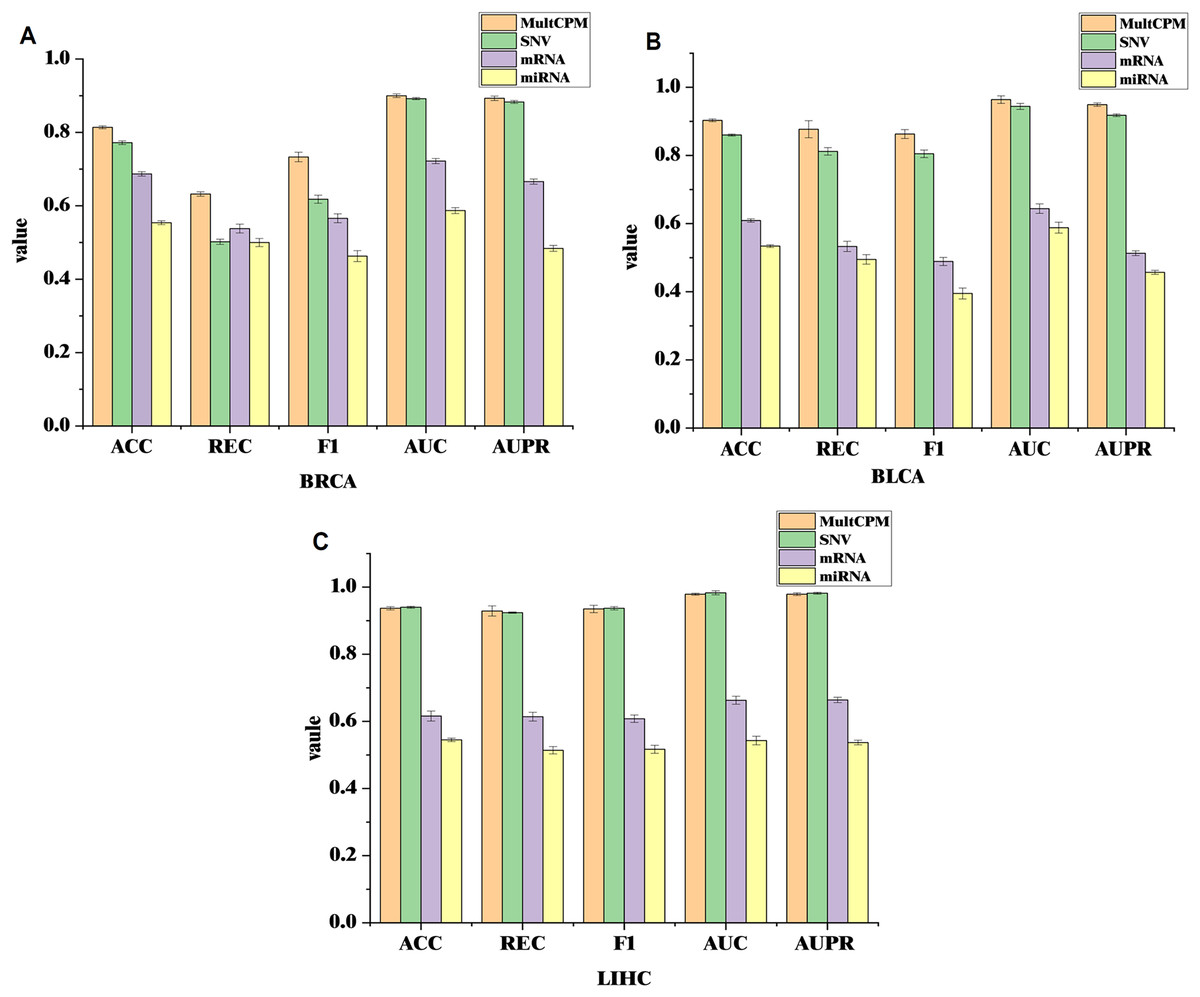
Figure 3: Comparison of MultCPM’s predictive performance using single-omics data vs multi-omics integration.
(A) Performance on the BRCA dataset. (B) Performance on the BLCA dataset. (C) Performance on the LIHC dataset. Using the BRCA, BLCA, and LIHC datasets, compared the classification performance of multi-omics integration with that of the three single-omics (SNV, mRNA, and miRNA).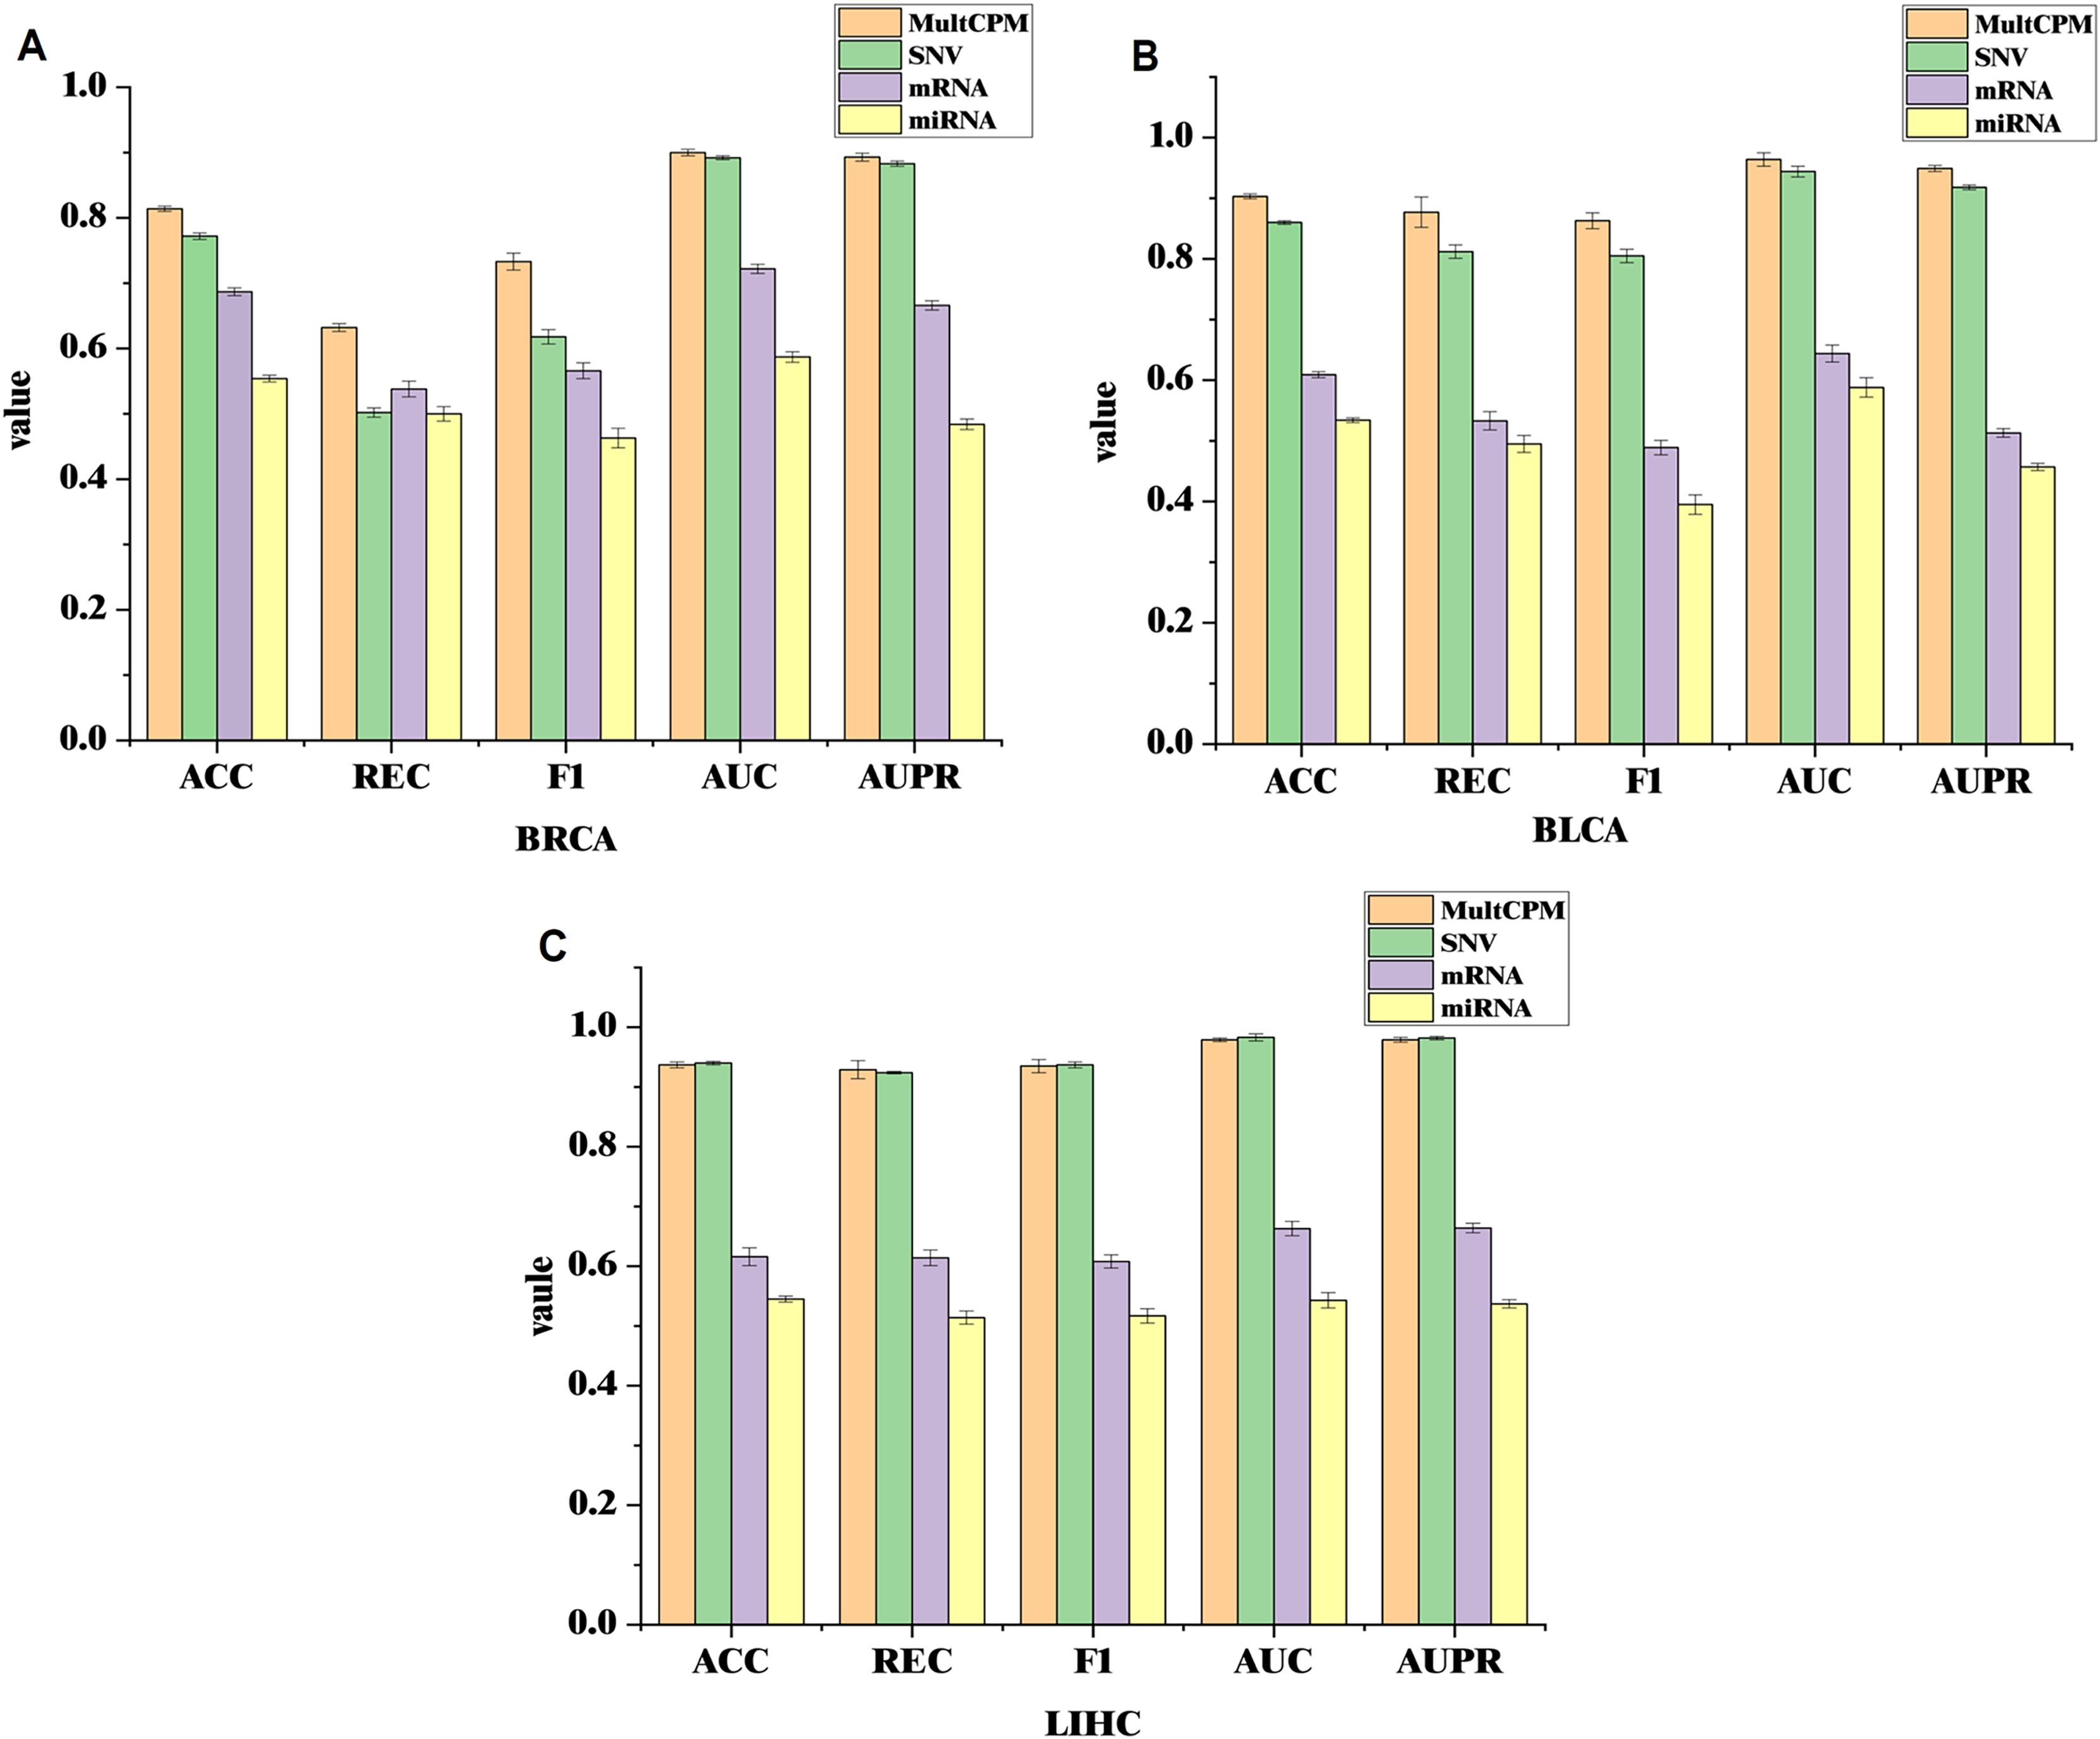
The experimental results show that in the BRCA and BLCA datasets, the multi-omics fusion model outperforms the single-omics model in terms of ACC, AUC, F1-score, REC, AUPR, and other metrics. This demonstrates that the MultCPM model effectively explores the potential complementarities between data from different groups, improving the prediction of complex diseases. However, in the LIHC dataset, the SNV single-omics model outperforms the multi-omics fusion model in some metrics, which raises our concern. To further investigate this, we evaluated the existing multi-omics model DeepKEGG on the same dataset and found that it also performs better with the SNV single-omics model than the multi-omics fusion model. We hypothesize that this may be due to the lower quality or limited information of mRNA and miRNA features in the LIHC dataset, preventing the multi-omics fusion from fully leveraging its advantages. In contrast, SNV, as the core mutation-level information, holds greater predictive value in the recurrence mechanism of LIHC cancers. This phenomenon suggests that, during multi-omics fusion modeling, the quality differences and information redundancy of data from different groups must be carefully considered. Future work will further analyze the biological characteristics of the various omics features in the LIHC dataset and their impact on optimizing fusion strategies.
Comparison of different fusion methods
To further assess the effectiveness of the proposed hierarchical fusion method, we conducted ablation experiments on three cancer datasets to systematically evaluate its performance. Specifically, the hierarchical fusion method was compared with two alternative data fusion methods: direct splicing (concatenate) and bilinear fusion (Wang et al., 2021b). To achieve bilinear fusion, this study designed a custom BilinearFusion layer, which takes as input the feature tensors of SNV and mRNA, and SNV and miRNA, processed by the multi-head attention module. The layer effectively models the bilinear interaction between the two feature sets through two tensor dot product operations. Implementation details are provided in Appendix C. To ensure a fair comparison with the hierarchical fusion approach, bilinear fusion is computed separately for SNV-mRNA and SNV-miRNA, with the fusion results of both sets concatenated to form the final input feature representation. The experimental comparison of different fusion strategies is shown in Table 6, further validating the performance differences of the respective methods in the multi-omics integration task.
| Datasets | Methods | ACC | AUC | F1-score | REC | AUPR |
|---|---|---|---|---|---|---|
| BRCA | Bilinear | 0.787 ± 0.003 | 0.887 ± 0.004 | 0.638 ± 0.014 | 0.529 ± 0.008 | 0.87 ± 0.011 |
| Concat | 0.805 ± 0.003 | 0.889 ± 0.004 | 0.687 ± 0.011 | 0.588 ± 0.007 | 0.864 ± 0.008 | |
| MultCPM | 0.814 ± 0.004 | 0.900 ± 0.005 | 0.733 ± 0.013 | 0.632 ± 0.006 | 0.893 ± 0.006 | |
| BLCA | Bilinear | 0.828 ± 0.007 | 0.924 ± 0.006 | 0.765 ± 0.011 | 0.798 ± 0.012 | 0.889 ± 0.013 |
| Concat | 0.898 ± 0.003 | 0.957 ± 0.004 | 0.86 ± 0.003 | 0.861 ± 0.005 | 0.937 ± 0.003 | |
| MultCPM | 0.903 ± 0.004 | 0.964 ± 0.011 | 0.863 ± 0.013 | 0.877 ± 0.025 | 0.949 ± 0.005 | |
| LIHC | Bilinear | 0.89 ± 0.003 | 0.962 ± 0.004 | 0.882 ± 0.007 | 0.859 ± 0.009 | 0.964 ± 0.006 |
| Concat | 0.909 ± 0.004 | 0.971 ± 0.003 | 0.904 ± 0.004 | 0.894 ± 0.005 | 0.971 ± 0.003 | |
| MultCPM | 0.937 ± 0.008 | 0.979 ± 0.006 | 0.935 ± 0.005 | 0.929 ± 0.007 | 0.979 ± 0.005 |
The experimental results, presented in Table 6, show that the hierarchical fusion method significantly outperforms direct splicing and bilinear fusion across multiple evaluation metrics, including F1-score, ACC, AUC, REC, and AUPR. These findings indicate that the hierarchical fusion method effectively captures the potential complementarity and complex interaction between different omics data, thereby significantly enhancing prediction performance.
Performance of MultCPM with different attention heads
The number of attention heads should be balanced against model complexity and dataset size. When a smaller value of is chosen, the model has limited ability to learn complex interactions between the omics data, making it difficult to adequately capture key features. In contrast, a larger value of enhances the model’s expressive power but also increases computational complexity, potentially leading to overfitting, especially on datasets with limited sample sizes.
We conducted five 5-fold cross-validation experiments on three datasets BLCA, LIHC, and BRCA using several evaluation metrics, including F1-score, ACC, AUC, REC, and AUPR. Additionally, in conjunction with the cancer datasets (sample sizes ranging from approximately 200 to 400), we set to a small range of discrete values {8, 16, 32, 64} to evaluate model performance variation under different settings. Here, serves as the minimum attention-head configuration for assessing the lower-bound performance of models with limited expression capabilities. The final performance evaluation results (averaged over five 5-fold cross-validation experiments) are shown in Table 7.
| Datasets | Heads | ACC | AUC | F1-score | REC | AUPR |
|---|---|---|---|---|---|---|
| BRCA | 8 | 0.787 ± 0.002 | 0.892 ± 0.005 | 0.623 ± 0.015 | 0.503 ± 0.007 | 0.874 ± 0.011 |
| 16 | 0.814 ± 0.004 | 0.900 ± 0.005 | 0.733 ± 0.013 | 0.632 ± 0.006 | 0.893 ± 0.006 | |
| 32 | 0.801 ± 0.005 | 0.898 ± 0.002 | 0.666 ± 0.014 | 0.552 ± 0.008 | 0.893 ± 0.008 | |
| 64 | 0.782 ± 0.003 | 0.900 ± 0.003 | 0.605 ± 0.012 | 0.491 ± 0.009 | 0.891 ± 0.006 | |
| BLCA | 8 | 0.873 ± 0.006 | 0.951 ± 0.007 | 0.826 ± 0.012 | 0.832 ± 0.011 | 0.932 ± 0.007 |
| 16 | 0.903 ± 0.004 | 0.964 ± 0.011 | 0.863 ± 0.013 | 0.877 ± 0.025 | 0.949 ± 0.005 | |
| 32 | 0.89 ± 0.005 | 0.95 ± 0.005 | 0.845 ± 0.004 | 0.846 ± 0.007 | 0.932 ± 0.005 | |
| 64 | 0.895 ± 0.003 | 0.96 ± 0.013 | 0.849 ± 0.011 | 0.832 ± 0.013 | 0.944 ± 0.006 | |
| LIHC | 8 | 0.923 ± 0.004 | 0.975 ± 0.003 | 0.917 ± 0.005 | 0.889 ± 0.008 | 0.976 ± 0.003 |
| 16 | 0.937 ± 0.008 | 0.979 ± 0.006 | 0.935 ± 0.005 | 0.929 ± 0.007 | 0.979 ± 0.005 | |
| 32 | 0.906 ± 0.005 | 0.97 ± 0.004 | 0.904 ± 0.003 | 0.906 ± 0.003 | 0.972 ± 0.004 | |
| 64 | 0.918 ± 0.007 | 0.968 ± 0.003 | 0.916 ± 0.006 | 0.918 ± 0.005 | 0.969 ± 0.002 |
The results above indicate that the F1-score, ACC, AUC, REC, and AUPR of the model follow a pattern of “initial increase, followed by stabilization, and then decrease” as the number of attention heads increases across the three datasets. When , the model is underfitted, whereas when and , the model exhibits overfitting to some extent. The best prediction performance on all three datasets was achieved when , significantly outperforming other settings.
This finding suggests that an optimal number of attention heads can better capture dependencies between multi-omics data, thereby improving the model’s generalization and predictive power. Considering both model performance and computational cost, is selected as the optimal hyperparameter configuration for MultCPM.
DeepSHAP interpretability analysis
To better illustrate the contributions of individual features to the model’s prediction outcomes on the BRCA dataset, we visualized the model using SHAP values. By generating the SHAP Heatmap, we highlighted the distribution of SHAP values for the top mRNA, SNV, and miRNA features and examined how variations in these feature values affect the prediction results, as depicted in Fig. 4.
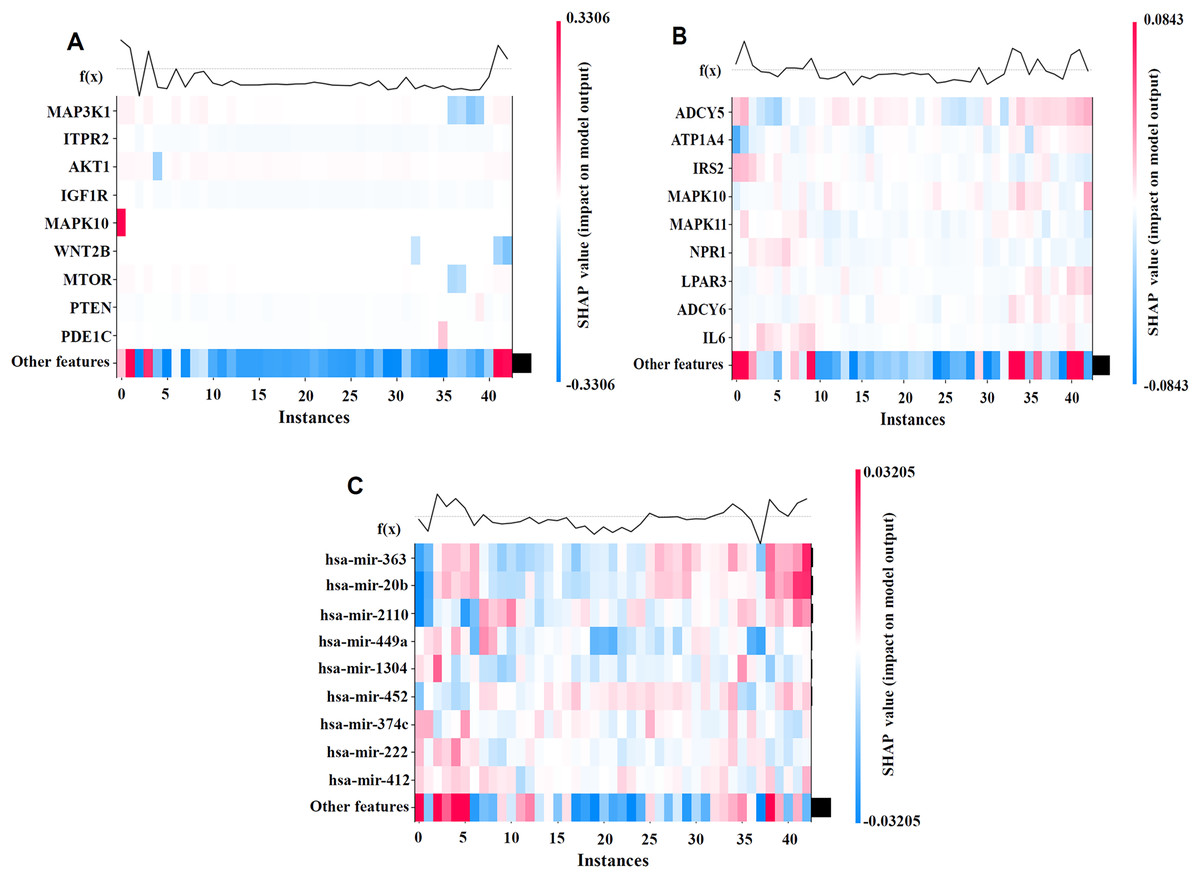
Figure 4: SHAP visualization results on the BRCA dataset.
(A) Shows the important feature values of mRNA. (B) Shows the important feature values of SNV. (C) Shows the important feature values of miRNA. By generating the SHAP Heatmap, the distribution of SHAP values for the top mRNA, SNV, and miRNA features and examined how variations in these feature values affect the prediction results.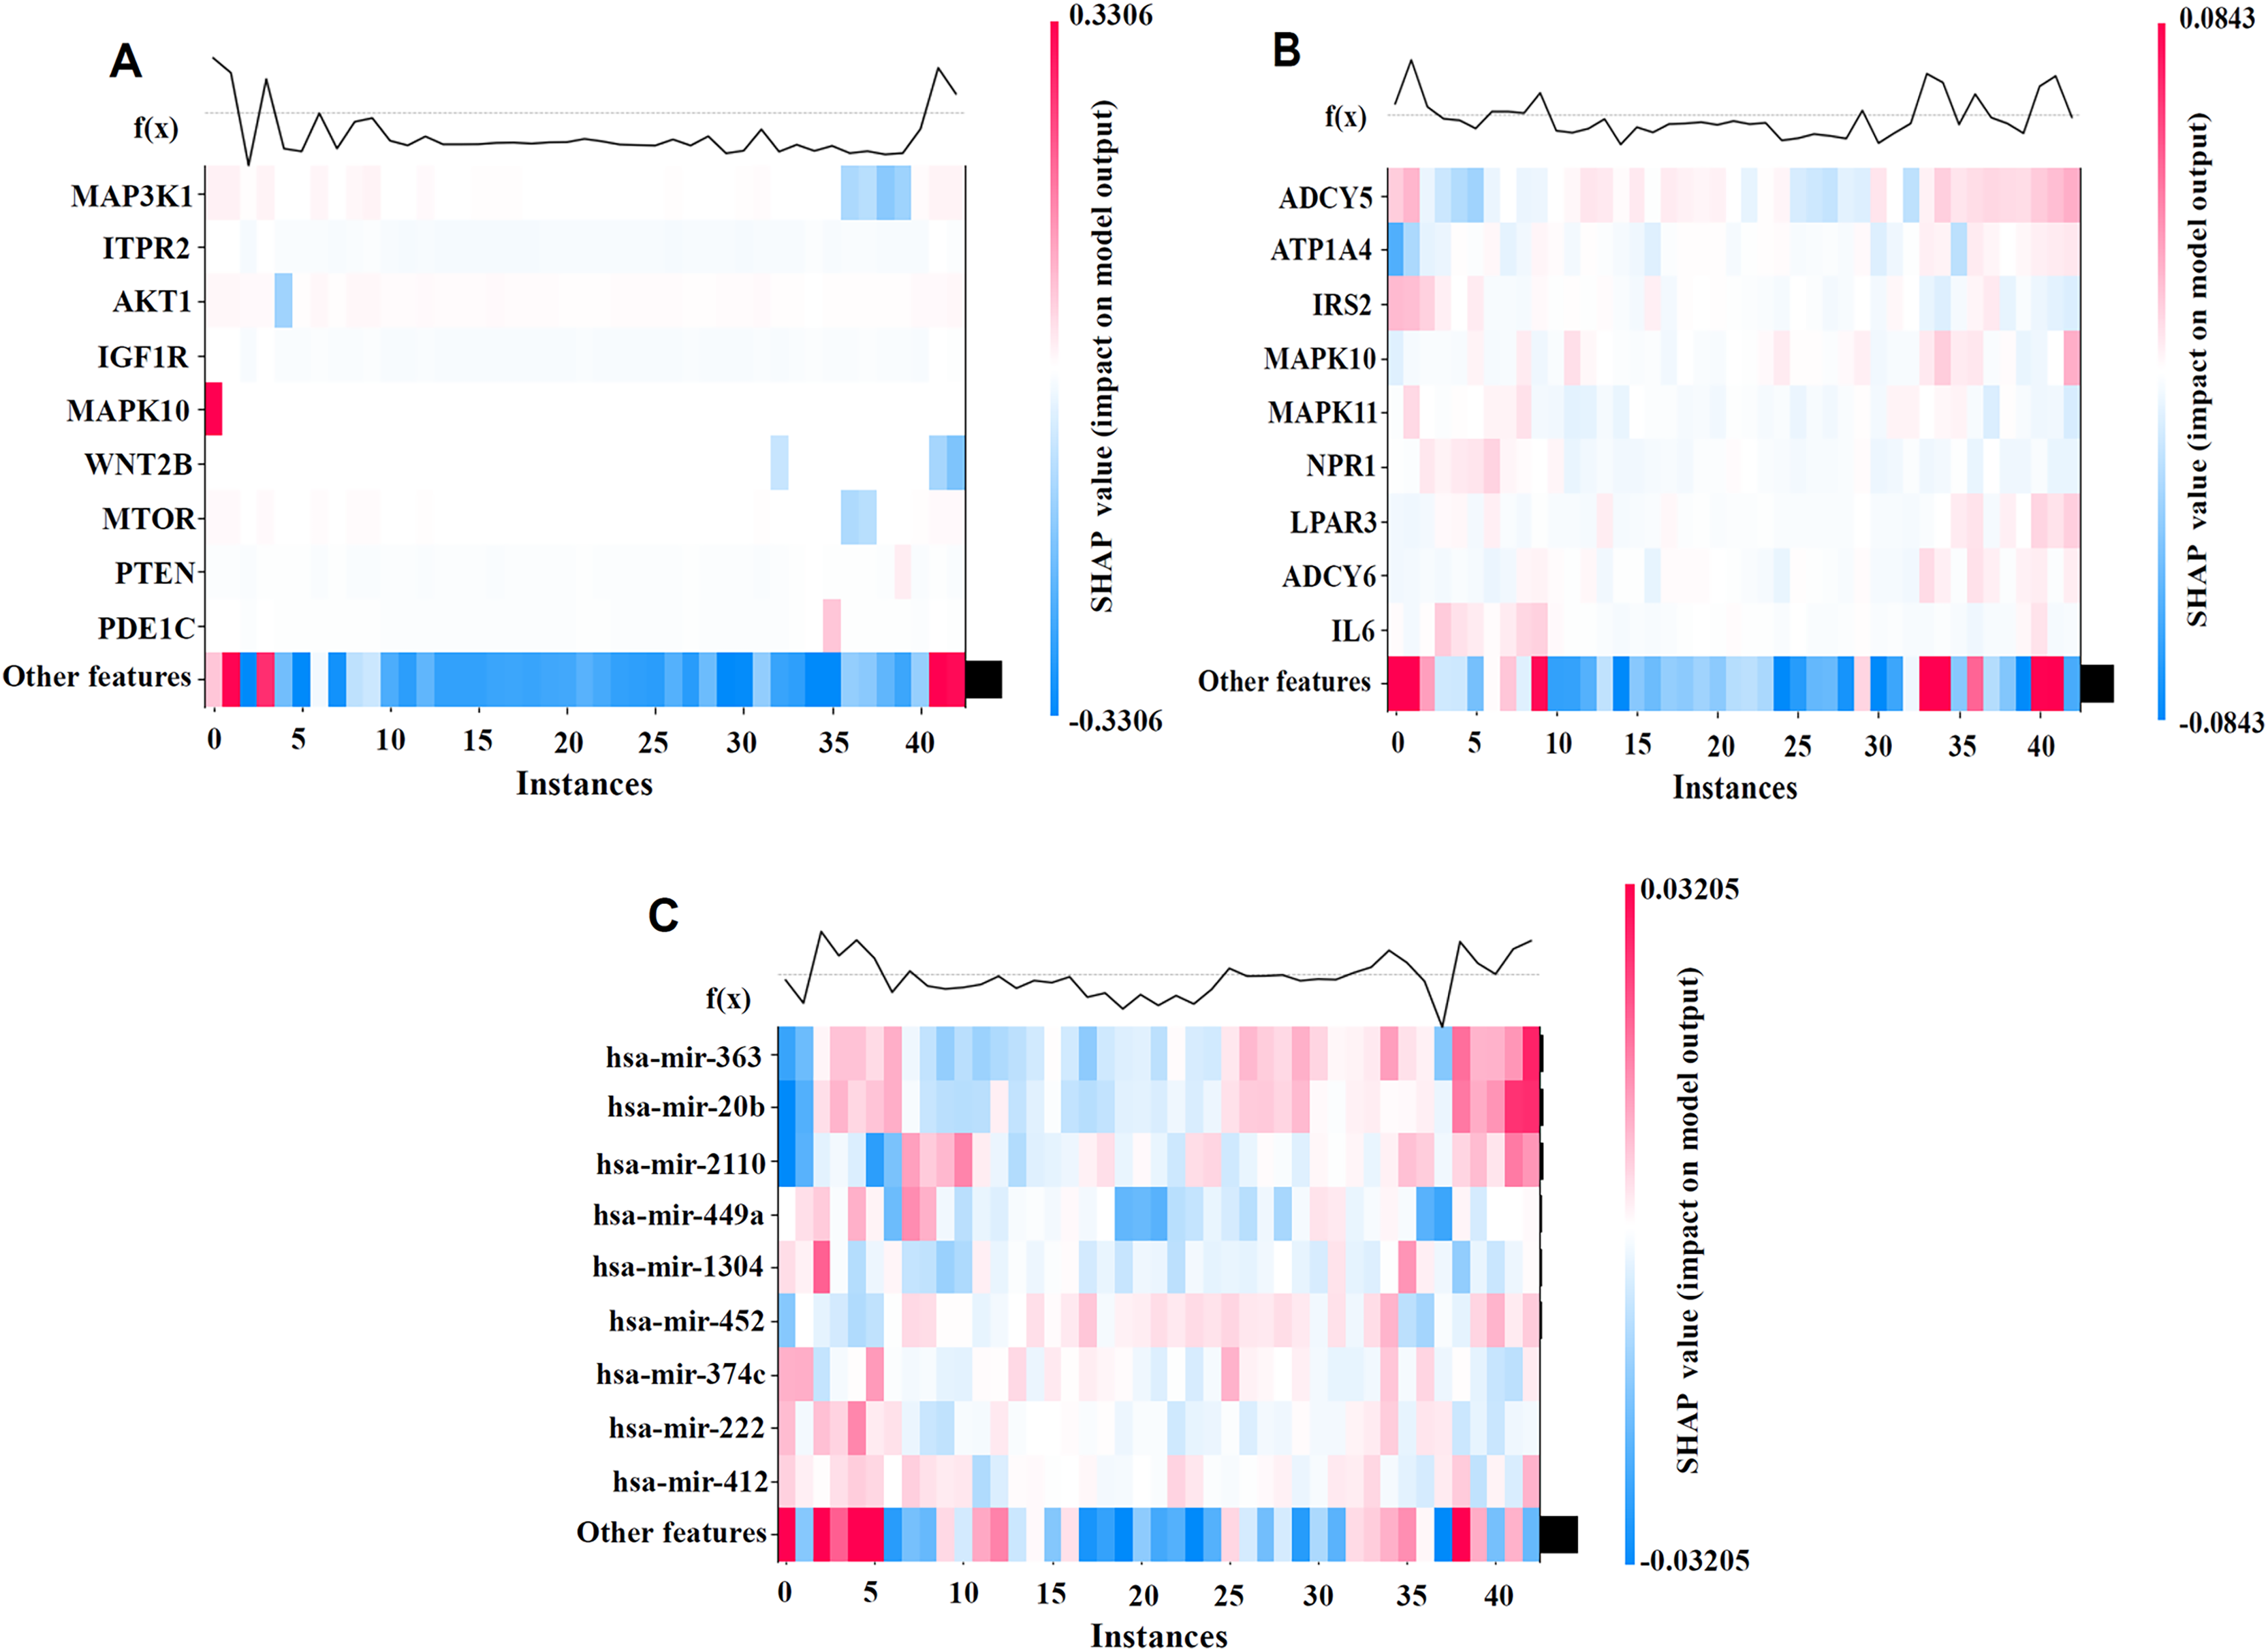
The analysis results revealed that MAP3K1, MYLK, and MAPK10 in the mRNA profile; ADCY5, ATP1A4, and IL6 in the SNV profile; and hsa-miR-363 and hsa-miR-20b in the miRNA profile had high SHAP values, indicating their significant impact on cancer recurrence prediction. The high SHAP values of these genes suggest that they play crucial positive or negative roles in prediction, thereby supporting the biological interpretability of the model.
The biological relevance of the high SHAP-value mRNAs, miRNAs, and SNV features identified in relation to cancer recurrence was validated through DeepSHAP’s interpretive analysis. For instance, the MAP3K1 and MYLK genes are well-documented as key regulators of cancer development and recurrence, and DeepSHAP analysis further highlights their significance in our predictive models (Liu et al., 2018). Similarly, hsa-miR-363 and hsa-miR-20b have been strongly associated with metastasis and recurrence across various cancer types, suggesting their critical regulatory roles in cancer recurrence mechanisms (Hui et al., 2020; Wang, Yang & Xiao, 2016). Additionally, the analysis of SNV loci provides valuable references for mutation-related studies, further underscoring their potential significance in cancer recurrence research (Kandoth et al., 2013).
In summary, DeepSHAP analysis not only provided a reliable basis for interpreting the model’s prediction results but also revealed the key molecules and their pathway mechanisms that the model relies on at the biological level, enhancing the model’s interpretability and potential for application in clinical cancer recurrence risk assessment.
Conclusions
In this study, we propose the MultCPM model, which predicts cancer recurrence by integrating multi-omics data with clinical information. The model combines omics data with biological pathways to construct a biologically meaningful pathway connection feature matrix and utilizes the multi-head attention mechanism to capture the complex interactions between omics data. A hierarchical fusion strategy is applied to integrate high-dimensional features, further enhancing the prediction performance and interpretability. Compared to the four other models, MultCPM demonstrates significant advantages across multiple metrics. However, the model requires high data integrity, and its adaptability to missing data and computational complexity needs further improvement. Future work will explore new fusion mechanisms and integrate additional modalities, such as imaging and metabolomics data, to further improve the model’s performance and robustness.
Supplemental Information
Raw data and code used to run theMultCPMmodel.
KEGG pathway data and multi-omics data, BRCA data, LIHC, and WT data.
The code includes run codes for cancers such as BRCA, BLCA, LIHC, AML, and WT.
Appendix of the Manuscript.
Include three Appendix : Appendix A: Implementation Notes for the Biological Pathway Module, Appendix B: Impact of Imputation Strategies on Model Performance, Appendix C: Bilinear Fusion Implementation Code (Bilinear Fusion Layer).