
Enhancing confidence indices estimation: an analytical framework harnessing online behavioral data
- Published
- Accepted
- Received
- Academic Editor
- Davide Chicco
- Subject Areas
- Data Mining and Machine Learning, Social Computing
- Keywords
- Confidence index, Network group intelligence, Social network, Big data analysis, Behavior analysis
- Copyright
- © 2025 Guo and Yi
- Licence
- This is an open access article distributed under the terms of the Creative Commons Attribution License, which permits unrestricted use, distribution, reproduction and adaptation in any medium and for any purpose provided that it is properly attributed. For attribution, the original author(s), title, publication source (PeerJ Computer Science) and either DOI or URL of the article must be cited.
- Cite this article
- 2025. Enhancing confidence indices estimation: an analytical framework harnessing online behavioral data. PeerJ Computer Science 11:e3282 https://doi.org/10.7717/peerj-cs.3282
Abstract
The consumer confidence index serves as a vital barometer, encapsulating economic health, income dynamics, and consumer sentiments. Traditional methods for computing consumer confidence indices heavily rely on survey data curated by national statistical agencies. While these surveys offer the advantage of being conducted on representative samples, thereby reflecting average consumer attitudes, they may lack in terms of speed and agility to capture rapid fluctuations. This study embarks on an innovative approach, utilizing online behavioral data to formulate an equation that models the consumer confidence curve, thereby facilitating the calculation of the confidence index. This methodology boasts several strengths: a streamlined data acquisition process, enhanced computational precision, and the capacity to dissect consumer confidence indices across diverse macro and microeconomic levels. To validate the efficacy of our approach, we conducted rigorous experiments comparing the performance of various algorithms. The experimental outcomes underscore the remarkable accuracy and stability of the proposed algorithm, demonstrating its superiority in capturing the nuances of consumer confidence with precision and efficiency.
Introduction
Consumer sentiment or confidence stands as a cornerstone for businesses, widely regarded as a pivotal economic indicator. At the heart of economic activity, consumer behaviors and decisions offer valuable insights into the current state of economic prosperity and its anticipated trajectory. Consumer confidence, a pivotal factor influencing consumption choices, is quantitatively assessed through the Consumer Confidence Index (CCI) (Dong et al., 2020). This index serves as a barometer, reflecting consumers’ subjective evaluation of the economic climate. Another vital metric is Consumer Surplus, which encapsulates the discrepancy between the maximum price a consumer is willing to pay for a specific quantity of a good and the actual price paid. This serves as a significant yardstick to gauge consumer well-being, emphasizing the psychological dimension rather than a tangible increase in income. Consumer Surplus measures the perceived additional benefit that a buyer derives from a transaction, signifying a sense of satisfaction or gain. The formula to compute Consumer Surplus succinctly expresses this concept: Consumer Surplus = Buyer’s Valuation-Buyer’s Actual Payment.
Assuming a reasonable congruence between shifts in people’s sentiments, expectations, and subsequent actions, the Consumer Confidence Index has emerged as a premier indicator for anticipating consumer and economic trends. It also constitutes a vital foundation for monitoring fluctuations within the economic cycle. Given its significance, accurately and efficiently forecasting consumer confidence becomes paramount.
Relying solely on questionnaires to assess consumer confidence is not only time-consuming and labor-intensive but also yields coarse-grained data. Furthermore, this approach restricts the analysis to a broad, macro-level perspective, neglecting nuanced changes. In a dynamic economic and political landscape, there is a pressing need for a method that swiftly and precisely calculates consumer confidence, enabling a nuanced understanding from both macro and micro perspectives while minimizing data analysis costs.
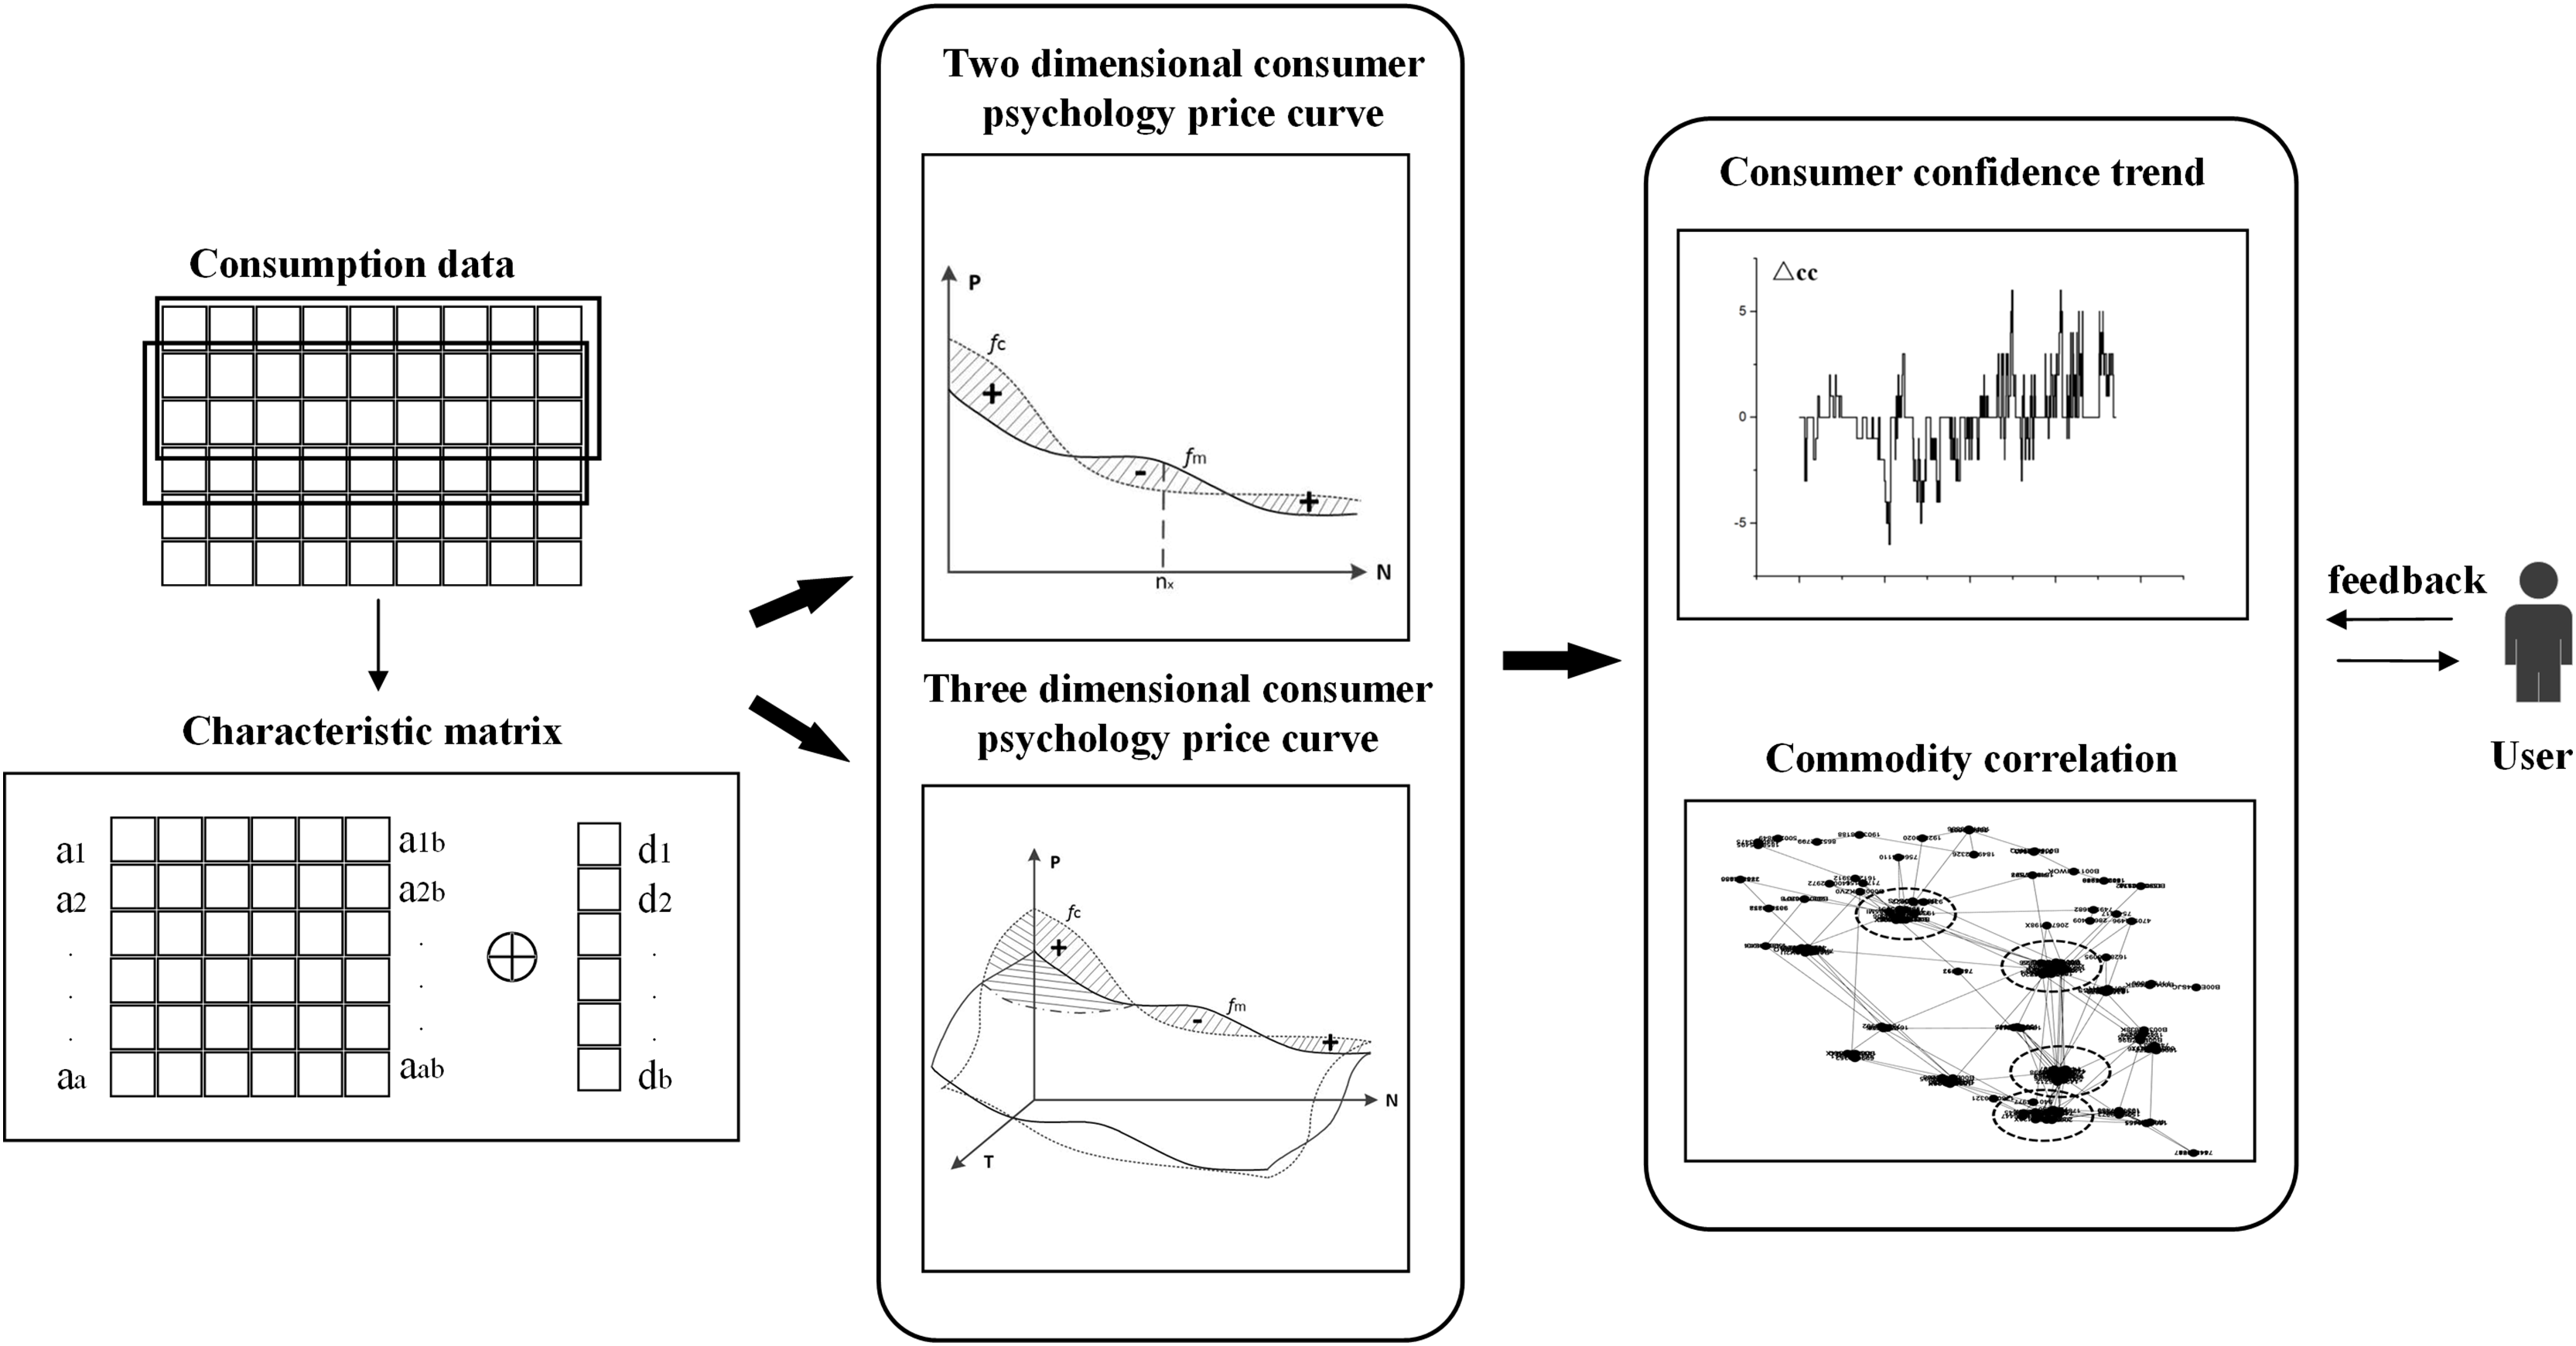
Swarm intelligence theories and Internet retrieval technologies serve as pivotal enablers in diverse research domains, notably artificial intelligence, underscoring their versatility. As depicted in Fig. 1, we mine a substantial volume of online transaction data, leveraging the internet’s inherent group intelligence to devise a consumer confidence index calculation model that boasts accuracy and stability. The algorithm’s efficacy is rigorously tested and validated in the experimental phase, utilizing a broad spectrum of datasets to ensure its robust implementation and effectiveness.
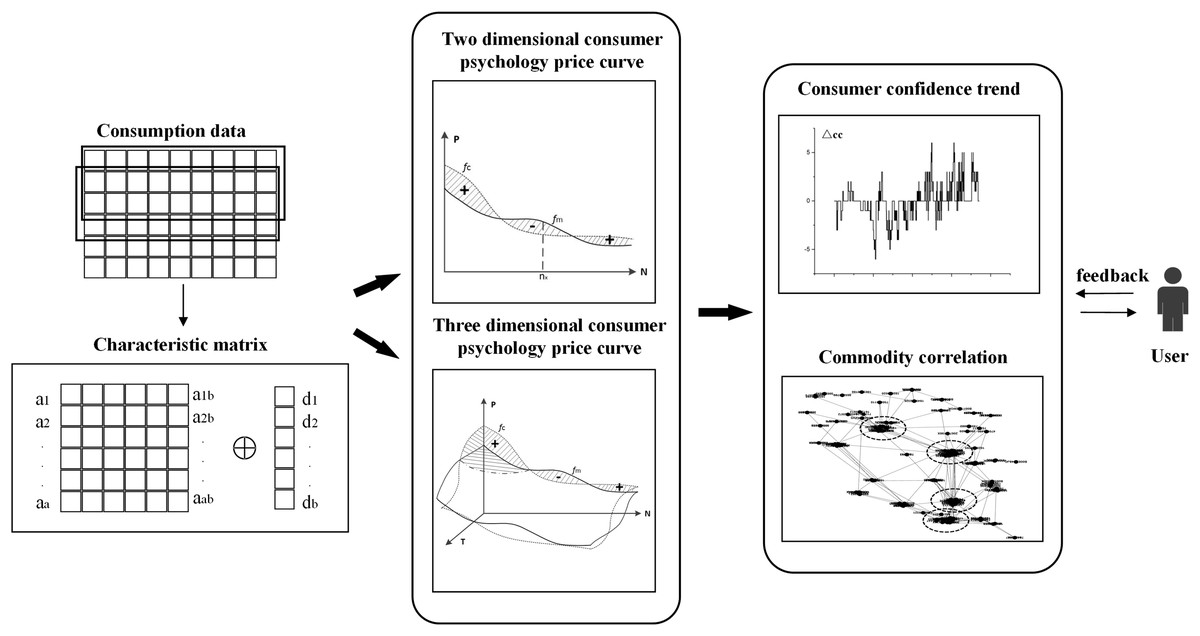
Figure 1: The architecture for computing consumer confidence.
Related works
With the swift proliferation of social networks, the establishment of consumer confidence computation models rooted in network data has garnered significant attention. Numerous research institutions and scholars have harnessed data sources like online reviews and search engine logs to fulfill the predictive capabilities for real-world events, with this approach being widely adopted across diverse sectors. The user behavior data residing within these networks boasts unparalleled advantages, including prompt data acquisition and heightened prediction accuracy, which are not easily replicated by other data types.
In relation to the consumer confidence calculation model, Chen, Jia & Liu (2021) employed the online consumer confidence index to scrutinize the dynamic interplay between online consumer confidence and economic growth, utilizing the count of medium-sized and larger companies as a quantitative proxy for economic growth. Their findings underscored a notable dynamic correlation between these two variables. Qiu (2020), on the other hand, introduced a hybrid approach integrating the regression tree algorithm with the MIDAS framework, elucidating how the lag in consumer confidence can elucidate the drivers of consumption growth. Lehrer, Xie & Zeng (2019) and Li, Ahani & Zhan (2021) delved into the nexus between web search data and societal phenomena, demonstrating that web data holds predictive power over event trends. de Castro Filho et al. (2020) and Shi, Yu & Chen (2021) further expanded this inquiry, examining the correlations among web search data, inflation, financial markets, and trading behaviors. Lastly, Jayles, Sire & Kurvers (2021) and George-Marios & Chen (2021) leveraged web search data to devise a consumption intention index, observing that this index surpassed traditional indicators in terms of predictive accuracy.
Adopting combinatorial algorithms in modeling consumer confidence represents an alternative approach. Li, He & Wang (2016) conducted a comparative analysis of Long Short-Term Memory (LSTM) and Support Vector Machine (SVM) in the context of stock price analysis, revealing that while SVM exhibits superior overall performance, LSTM shines in analyzing highly volatile stocks. Learning-based methodologies for stock price prediction have gained widespread popularity, with numerous strategies devised to enhance their predictive prowess (Sathyabama, Stemina & Sumithradevi, 2021). Liang (2017) innovatively proposed a comprehensive model that integrates learning machines, a radial basis function-based neural network, least squares support vector machine, and a gray wolf optimization algorithm. This ensemble prediction model not only provides a robust theoretical foundation for calculating the consumer confidence index but also fosters the evolution of the theoretical framework surrounding it (Kumar, Jain & Singh, 2021), marking a significant contribution to the field.
The consumer confidence index survey method, which relies on sampling, is inherently fraught with several limitations (Ogunsipe, 2017). Firstly, the relatively narrow scope of the data sample can introduce homogeneity errors, potentially skewing the representation of consumer sentiment. Secondly, ensuring the objectivity of survey outcomes poses a challenge, as respondents may be swayed by the societal value attached to the topic rather than reflecting their genuine personal circumstances, thereby diminishing the authenticity of the results. Lastly, the protracted data collection period associated with these surveys often leads to a time lag in the dissemination of findings, limiting their timeliness and relevance.
The vast expanse of data on the Internet encompasses millions of participants, underscoring its immense scale. In social networks, users concurrently assume the roles of information consumers and creators, generating a deluge of data that continually evolves in real-time. This dynamic nature extends not only to the ever-changing content within the networks but also to the evolving characteristics of the users themselves. To navigate this complex landscape, our work integrates data mining techniques with web big data analysis methodologies, thereby constructing a comprehensive consumer confidence index model. This fusion enables us to delve into intricate details, yielding nuanced and all-encompassing analysis outcomes.
Univariate confidence analysis model
In voluntary economic exchanges, a discernible disparity exists between the ceiling price that consumers are prepared to pay for a particular good and the actual market price of that good. To quantify this discrepancy, Alfred Marshall introduced the pivotal concept of “Consumer Surplus” in his seminal work, “Principles of Economics” (Marshall, 1890). Consumer surplus serves as a metric to assess the incremental satisfaction or benefit that consumers themselves perceive, above and beyond the monetary outlay. A consumer surplus arises whenever the price consumers pay for a product or service falls short of the maximum price they are willing to bear. Consequently, consumer surplus embodies the added value or advantage that accrues to the consumer as a result of the transaction. It is important to note that consumers’ perceived or psychological price threshold can exceed the prevailing market price, though it can also undershoot it. Therefore, it is imperative to consider the diverse scenarios that may unfold in market transactions, ensuring a nuanced understanding of consumer surplus.
The “demand curve” is a graphical depiction that illustrates the correlation between the frequency of a consumer’s purchases of a good over a defined period and their psychological price threshold for consumption. This curve encapsulates not merely the maximum price a consumer is prepared to pay for a product but also encapsulates the intricate relationship between the product’s price and the corresponding quantity demanded. Given that the market price is predetermined, the disparity between the price consumers are willing to pay and the actual price they pay constitutes their psychological surplus. This psychological surplus holds significant implications for consumer confidence; the higher it is, the greater the degree of trust and satisfaction among consumers. Conversely, a smaller psychological surplus translates into reduced consumer confidence. Recognizing this interplay, we can leverage the concept of consumer surplus as a valuable metric to gauge and assess consumer confidence levels.
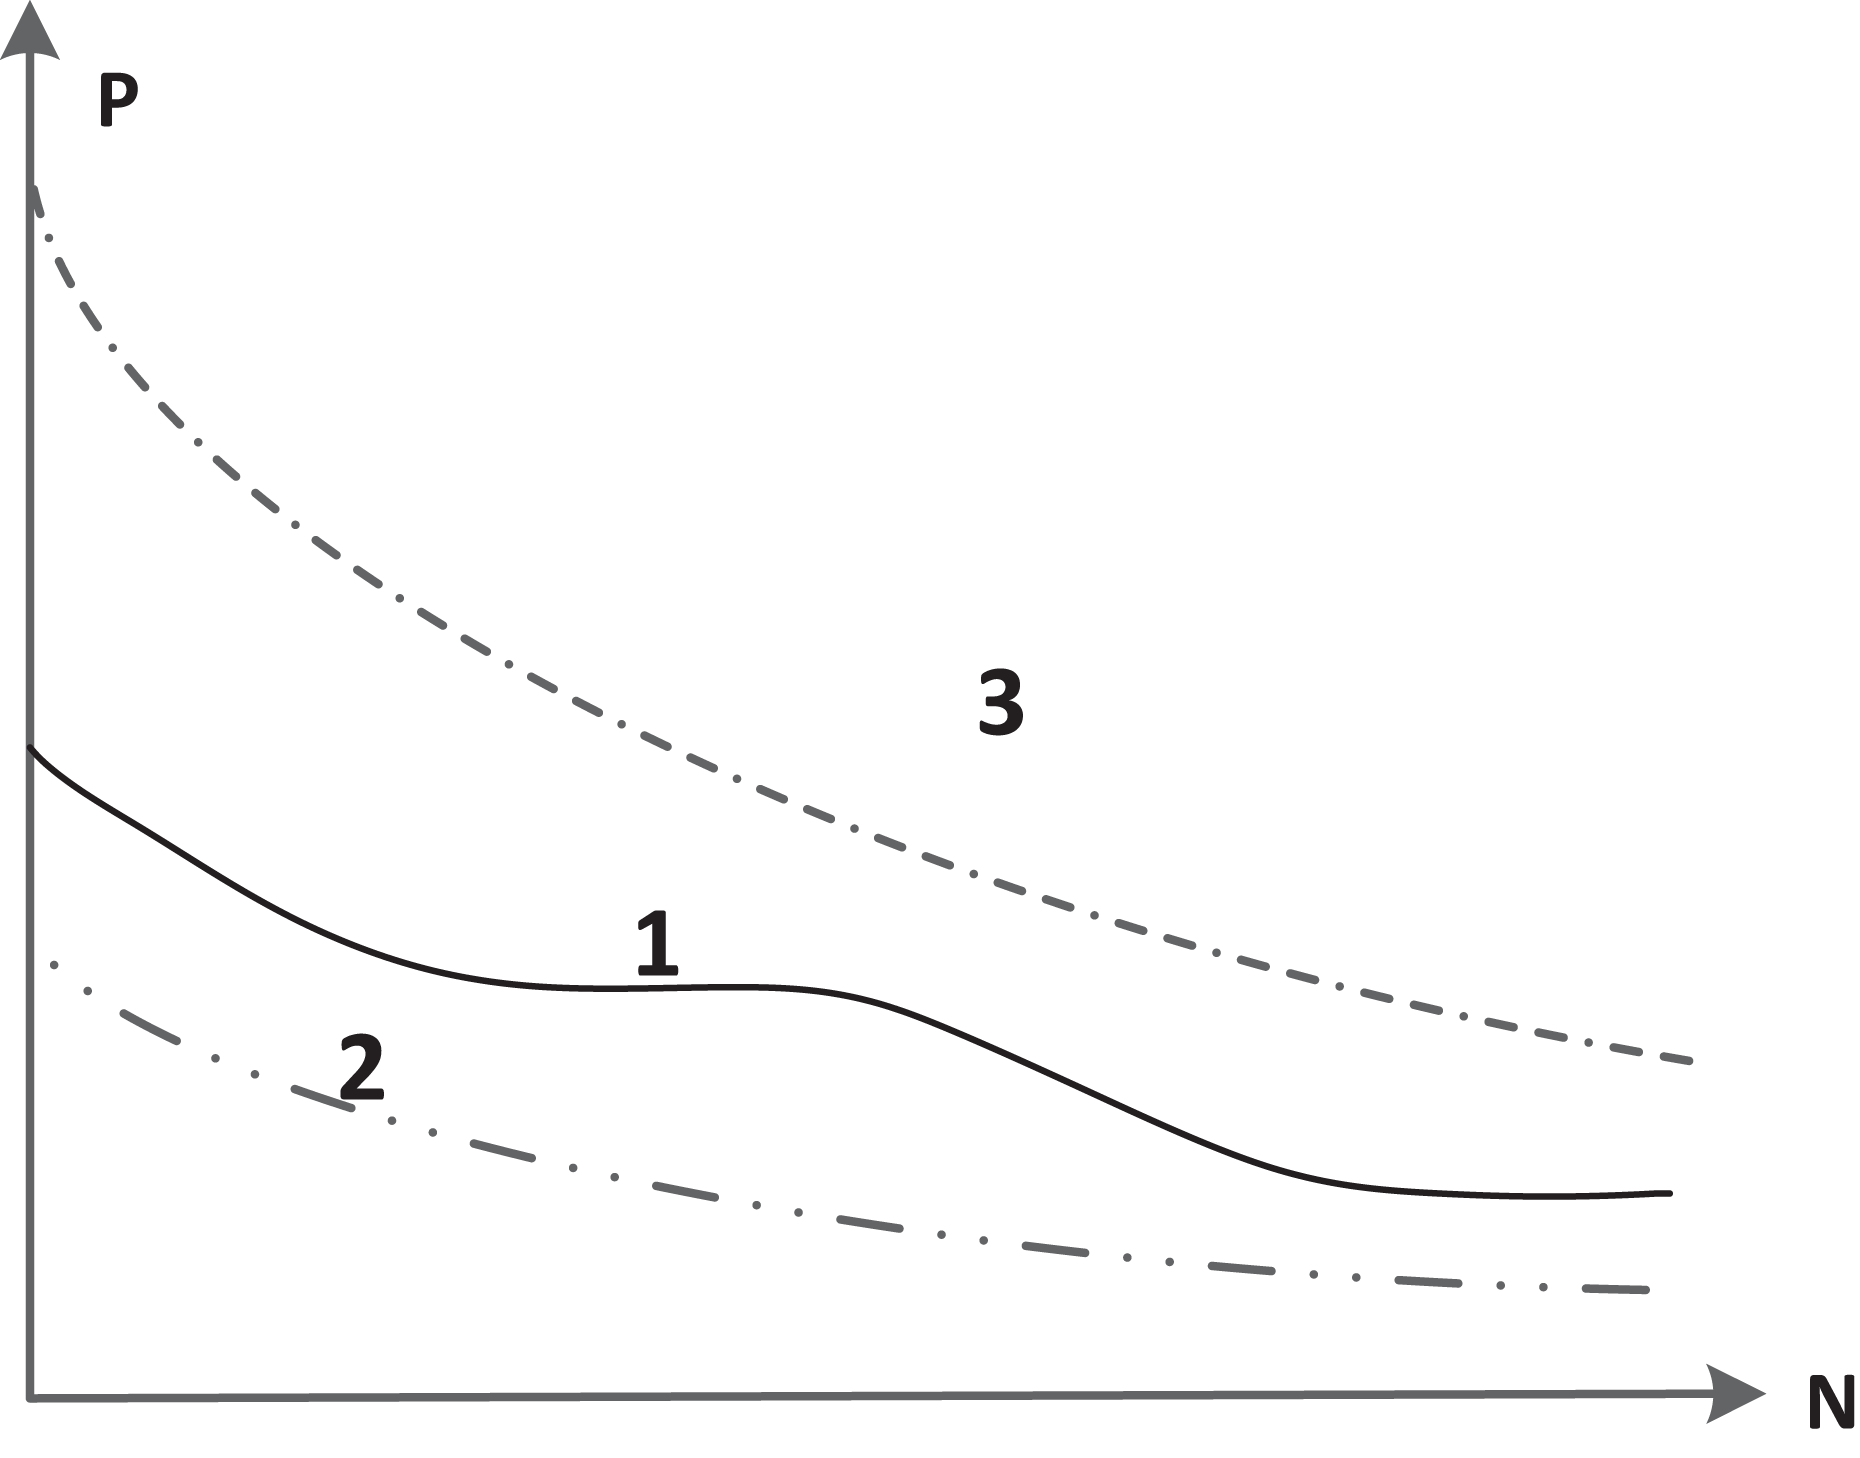
As the purchasing frequency escalates, the consumer’s psychological pricing perception converges towards the actual transaction price. Stated differently, the augmentation in transaction counts enhances consumers’ understanding of the prevailing market price, causing their psychological price estimates to align more closely with the market price. However, the trajectory of this convergence—whether the psychological price curve descends towards the true market price or ascends from beneath it—is contingent upon the unique characteristics and perceptions of individual consumers. Some individuals perceive the market as overpriced, while others view it as undervalued, and still, there are those who can accurately forecast the market price based on rational assessment.
Figure 2’s Curve 1 illustrates the dynamic interplay between a product’s psychological price and the frequency of purchases per unit time. Notably, the psychological price curves vary significantly across different commodities. When a commodity’s psychological price remains unaffected by changes in the number of transactions, it manifests as a straight, unwavering line. Conversely, for most goods, the psychological price undergoes fluctuations as purchasing frequency and quantity escalate. Given this inherent instability, Curve 1 depicts a fluctuating trajectory. Curves 2 and 3 in Fig. 2, on the other hand, represent the pinnacle of consumers’ willingness-to-pay for a given product, reflecting their psychological pricing threshold. Stemming from the diminishing marginal utility principle, the maximum price that consumers are prepared to offer for a commodity gradually declines. Nevertheless, amidst repeated market transactions, this psychological price gradually converges towards the product’s actual market price.
Figure 2: Confidence index calculated from commodity price curves and psychological price curves of consumers.
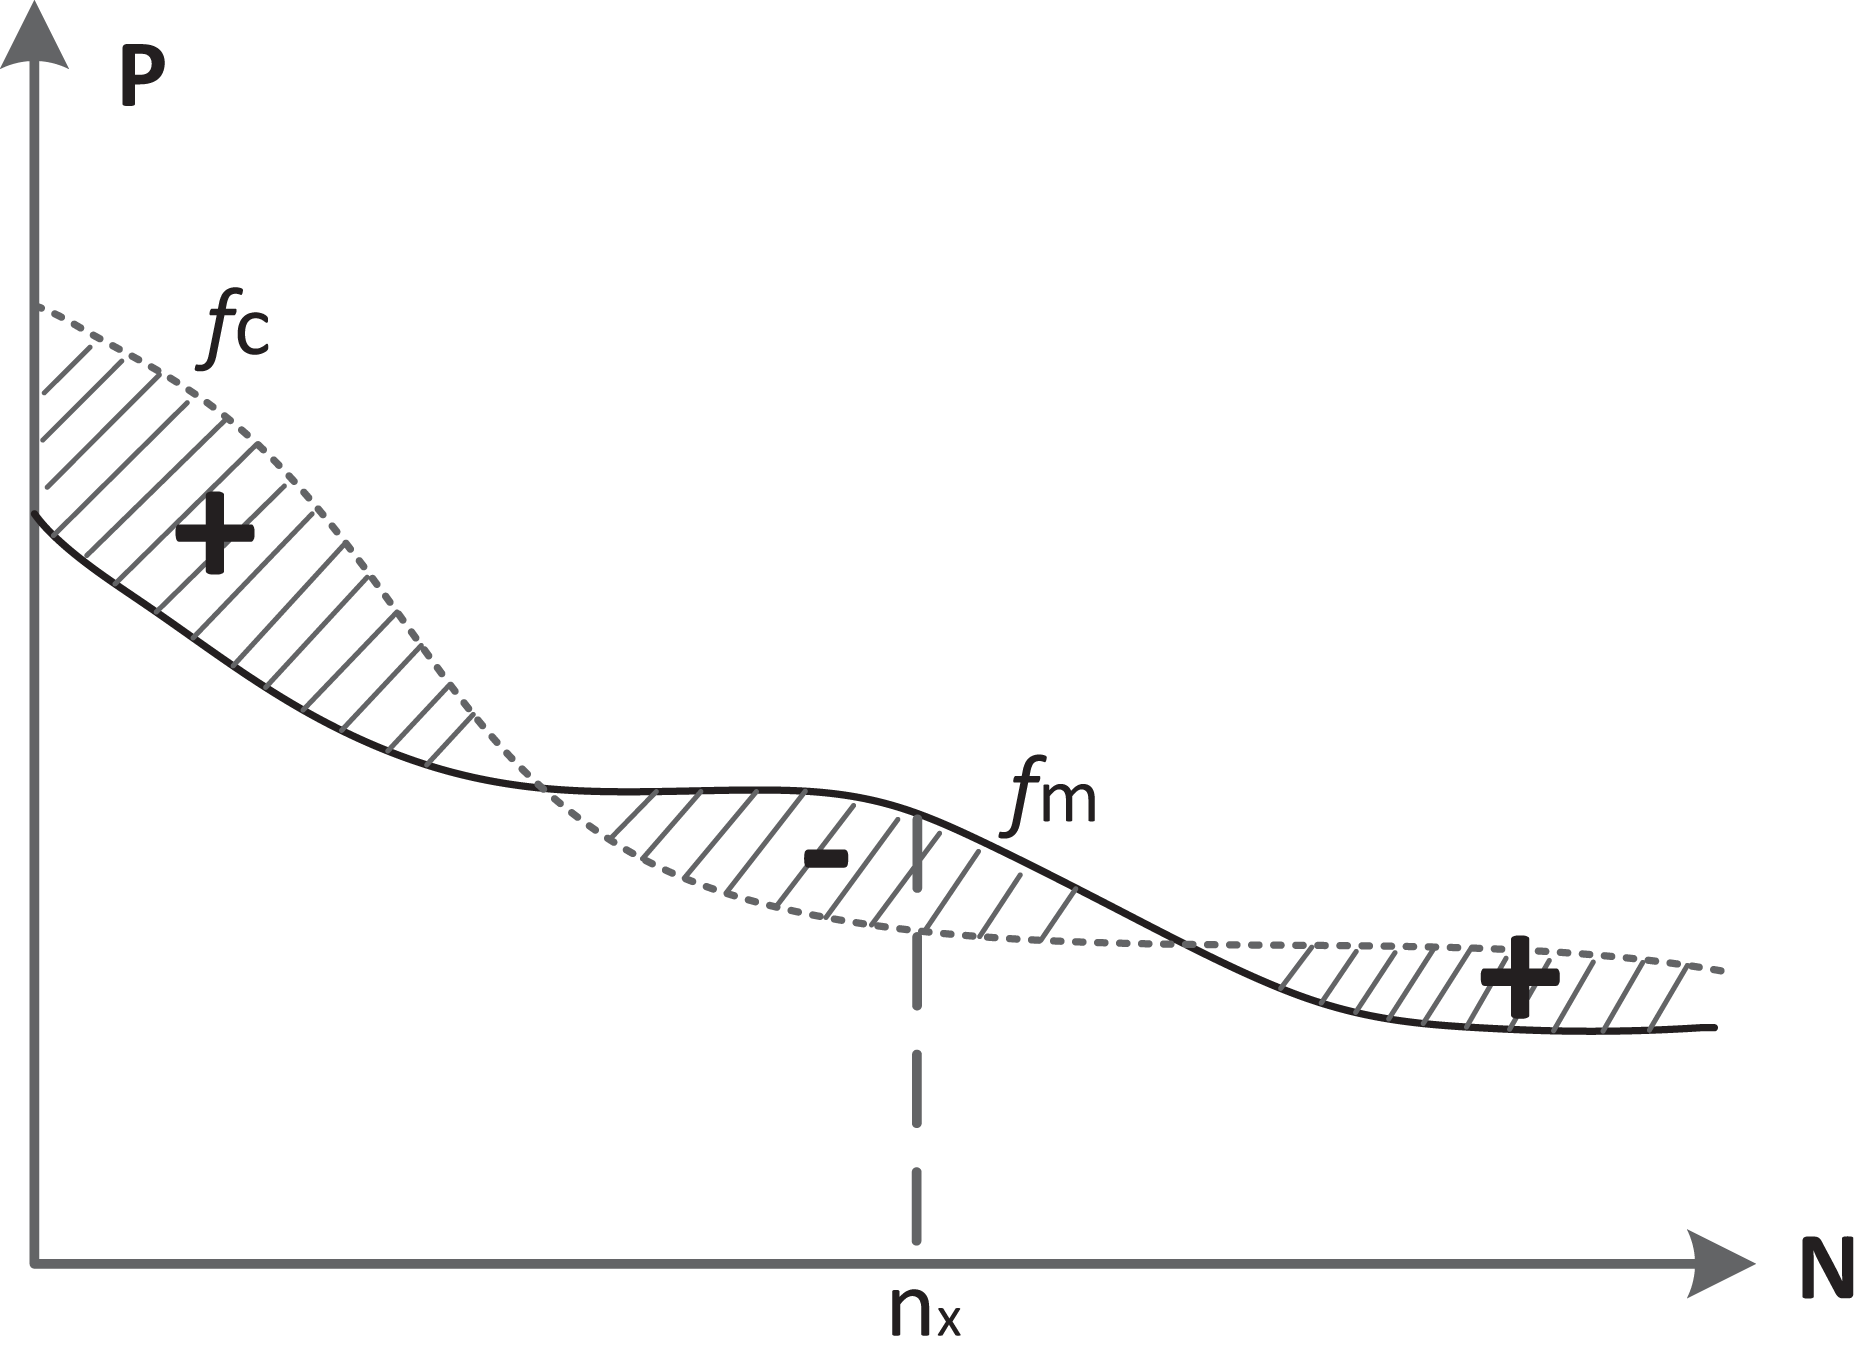
The market price curve is designated as fm, whereas the consumer’s psychological price curve is represented by fc. Consumer confidence is quantitatively assessed by determining the area encompassed between these two curves. The computational methodology is outlined below:
(1)
Δcc describes the area between the curve fm and fc. If fc is greater than fm, the area is greater than 0. Otherwise, the area is less than 0. Δcc can be calculated by integration. If Δcc is greater than 0, consumer confidence is positive. If Δcc is less than 0, the consumer confidence is negative. If Δcc is equal to 0, a turning point is generated.
Δcc quantifies the area located between the fm and fc curves. If fc surpasses fm, the area is positive (greater than 0); conversely, if fm exceeds fc, the area is negative (less than 0). The value of Δcc can be precisely determined through integration. When Δcc is positive, it signifies positive consumer confidence. Conversely, a negative value of Δcc indicates a lack of consumer confidence. Lastly, if Δcc equals 0, it marks the occurrence of a turning point.
As depicted in Fig. 3, the area between the fm and fc curves varies dynamically with the number of transactions (nx), resulting in fluctuations in Δcc. The cumulative sum of these areas across different time points provides insight into the evolution of consumer confidence. Positively marked areas in Fig. 3 signify positive consumer confidence, whereas negative areas indicate a lack of confidence. By calculating the cumulative area Δcc(nx) at various nodes, we can quantitatively analyze the trend of consumer confidence. If Δcc(nx) is greater than 0, it implies that consumers hold confidence in the current market conditions. Conversely, a value less than 0 suggests a lack of confidence. Lastly, if Δcc(nx) equals 0, it signifies that this particular node marks a pivotal transition in consumer confidence, either from a strong to a weak stance or vice versa.

Figure 3: The area difference between the commodity price curve (denoted fm) and the consumer psychology price curve (denoted fc).
Figure 4 describes the variation of the confidence index. The horizontal axis represents the number of purchases n and the vertical axis represents the accumulation value of the area Δcc. The function f(x) represents the consumer confidence curve. For a further analysis of the changes of Δcc, there are three possible cases of the derivative equation .
-
(1)
When f ′(x0) > 0, it signifies an upward trajectory in consumer confidence, indicating a growing level of optimism.
-
(2)
Conversely, when f ′(x0) < 0, it reflects a downward trend in consumer confidence, suggesting a decline in overall optimism.
-
(3)
The case where f ′(x0) = 0 marks a pivotal moment in the confidence index’s trajectory. At this turning point, Δcc reaches a peak, signifying that consumer confidence is transitioning from an increasing to a decreasing phase or vice versa, highlighting a shift in market sentiment.
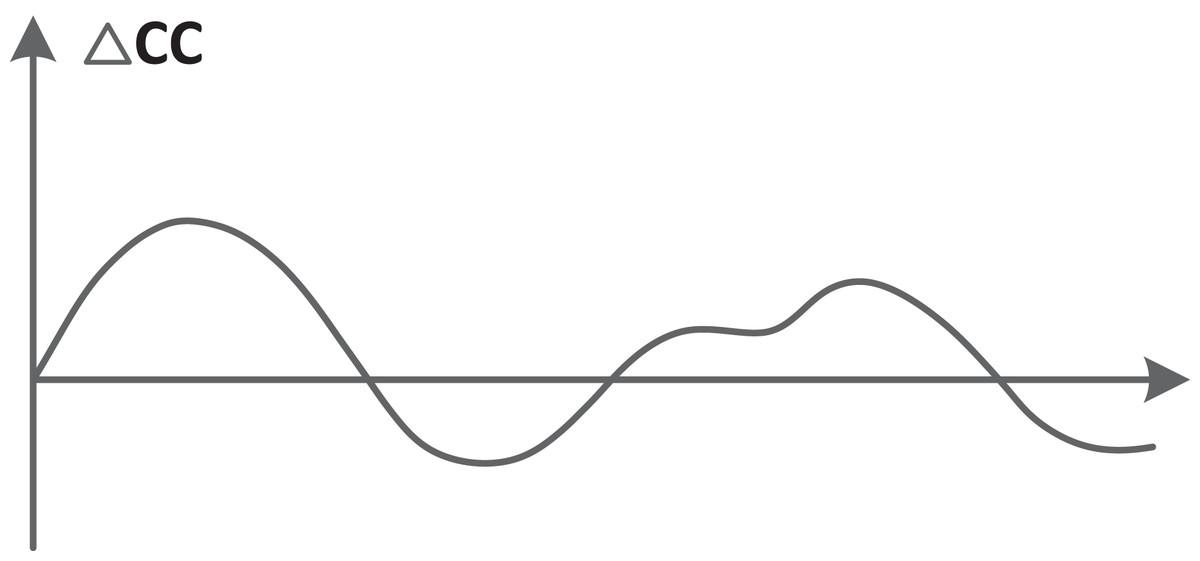
Figure 4: Changes in consumer confidence.
Multivariate consumer confidence analysis model
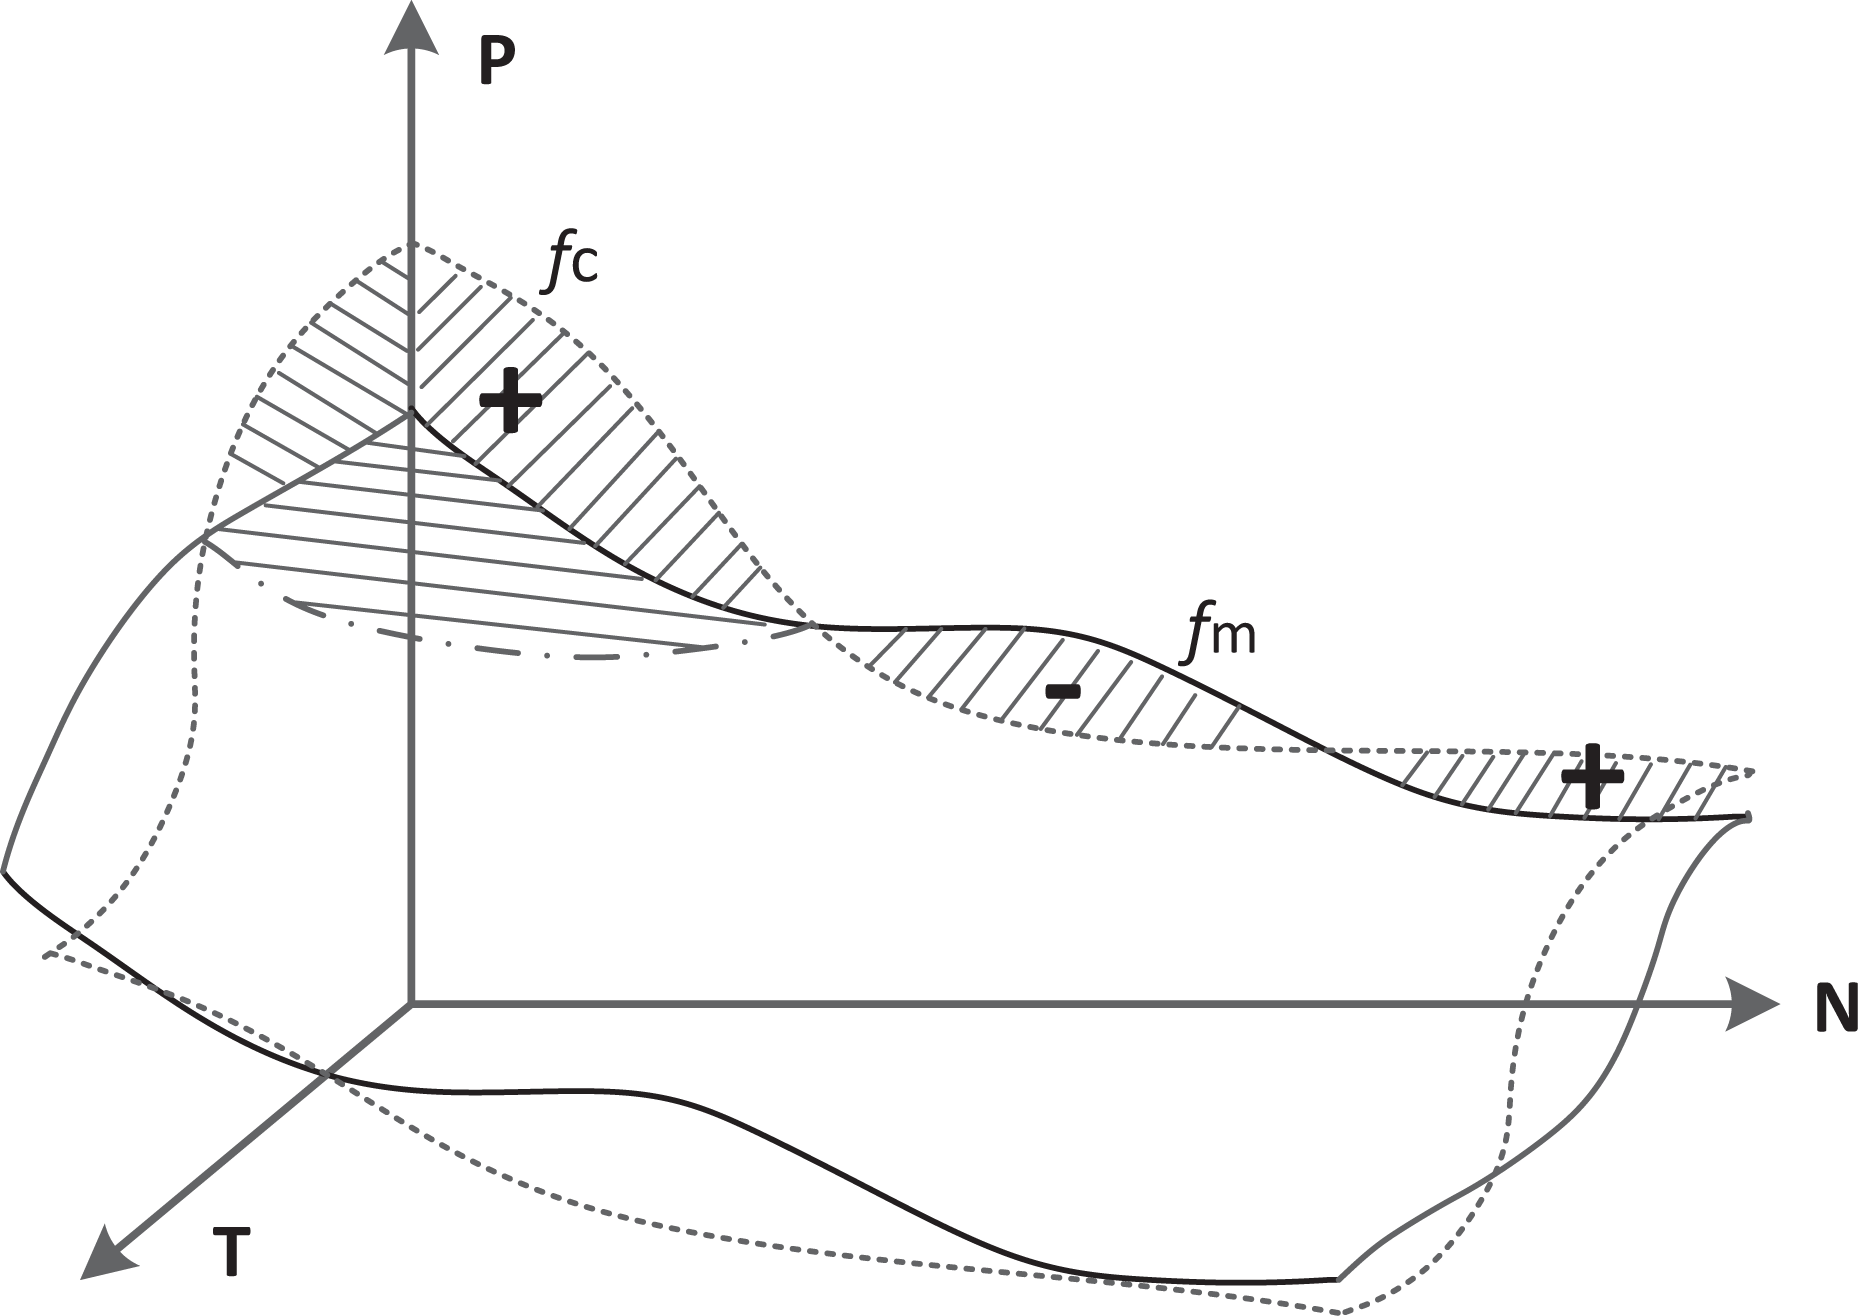
In the preceding chapter, we delved into consumer confidence, examining it through the lens of two primary dimensions: price and transaction timing. However, the intricate dynamics of the economy necessitate a deeper understanding, as commodity prices inherently fluctuate over time. These fluctuations vary significantly across diverse product categories, with some commodities experiencing high volatility in pricing while others maintaining a relatively stable trajectory. Drawing upon 2022 data, we observe stark price hikes in essential items like eggs (32.2% increase), butter (20.2% rise), and margarine (25% surge). Additionally, common food staples such as chicken, milk, and coffee have also witnessed substantial price escalations of at least 10%. Conversely, commodities like corn, wheat, mineral water, and hand towels exhibit more stable pricing patterns, further emphasizing the disparate nature of price changes across products. Concurrently, the psychological perception of price among consumers evolves over time, a factor that is overlooked in a two-dimensional analysis. This approach fails to capture the intricate interplay between price fluctuations and their temporal dimension, ultimately yielding an incomplete picture of consumer confidence. Therefore, to achieve a more holistic and accurate assessment, it is imperative to adopt a multivariate analysis that accounts for the dynamic nature of pricing and its influence on consumer sentiment. In this chapter, the time factor is added to the analysis process to construct a three-dimensional coordinate vector, as shown in Fig. 5. Here, we give the calculation of consumer confidence using three factors: transaction price, number of transactions, and time.
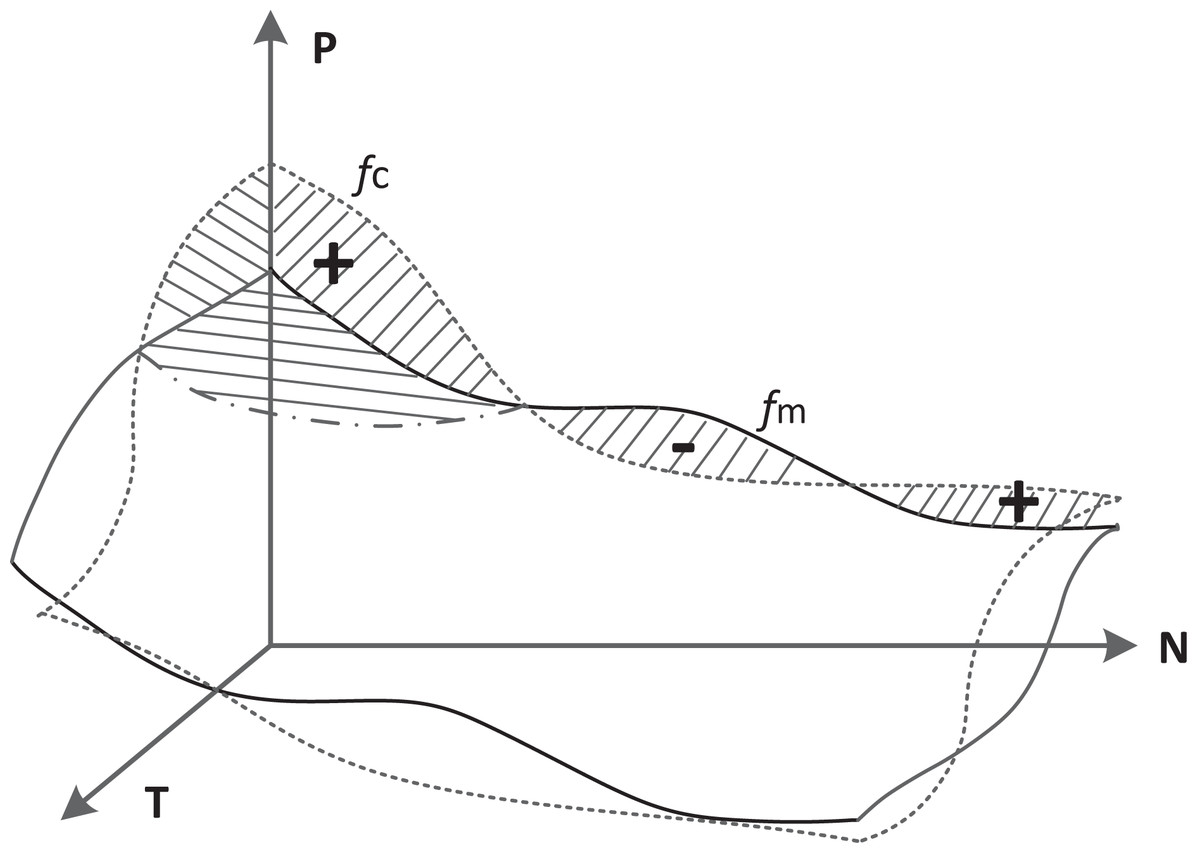
Figure 5: Analysis of consumer confidence in three-dimensional coordinates.
The three factors form a three-dimensional coordinate system, and to visualize their collective influence, a surface construction approach is employed. Specifically, we utilize the triangular surface slice approximation method for surface reconstruction. The algorithmic process of this triangular surface approximation is outlined as follow.
(2)
(3)
(4)
(5)
An m-degree triangular surface plate comprises a triangular arrangement of (m + 1)(m + 2)/2 control points, denoted as Vijk, where i, j, and k are non-negative integers satisfying i + j + k = m.
These points form the basis of the surface’s structure. is the Bernstein basis function defined in the trigonometric domain. For any point (u, v, w) on this surface, the equation determines its precise location. Once the surface equation is established, it becomes feasible to quantify the volume enclosed between two surfaces: one representing market prices and the other, psychological consumer prices. Notably, the interpretation of this volume differential varies depending on the chosen benchmark. If time is the benchmark, the volume difference signifies the evolution of consumer confidence over time, capturing shifts in sentiment across various time periods. Alternatively, when price serves as the benchmark, the discrepancy in volume reflects the variation in consumer confidence at different pricing points, elucidating how confidence levels fluctuate with price changes. Lastly, if the benchmark is the area defined by (t, n), the volume difference offers a comprehensive measure of consumer confidence, incorporating both purchase frequency and the number of purchases, thus providing a nuanced understanding of consumer behavior.
Based on these three parameters <price, time, number of purchases>, the formula for calculating consumer confidence is as follows.
(6) where, Dnt is the mapped area of fc(n, t, p) and fm(n, t, p) on Ont.
Here, Dnt represents the mapped area between the consumer’s perceived value surface fc(n, t, p) and the market price surface fm(n, t, p), both projected onto the domain Ont. This domain encapsulates the various combinations of these three parameters.
Given the surface S, which represents the overall landscape of consumer sentiment and behavior across these dimensions, the formula allows us to quantify consumer confidence by analyzing the discrepancy between the consumer’s expectations and the actual market conditions.
(7)
D* is a region on plane O′uv, and . P0(t(u0, v0), n(u0, v0), p(u0, v0)) = (t0, n0, p0) represents a point on the surface S. Then the tangent equation of the intersection point P0 of the surface S is:
(8)
S is a surface defined by some equation or parametric representation. P0 is a point on this surface, given in terms of its coordinates (t0, n0, p0) and the corresponding parametric values (u0, v0) in the parameter space of the surface. D* is a region on the plane O′uv, which we assume intersects the surface S at P0.
To find the tangent equation at P0, we need to consider the partial derivatives of the surface S with respect to its parameters u and v. These partial derivatives give us the direction vectors of the tangent plane at P0.
Let’s denote the partial derivatives as follows:
(9)
(10)
These vectors lie on the tangent plane to the surface S at the point P0. The tangent equation at P0 can then be written in the form of a plane equation, using the normal vector to the tangent plane. The normal vector to the tangent plane can be found by taking the cross product of the partial derivative vectors:
(11)
At P0, this normal vector will be evaluated at (u0, v0). The tangent equation can then be written as:
(12) where n is the normal vector evaluated at (u0, v0), and (t, n, p) represents any point on the tangent plane. Expanding this, we get:
(13)
This is the tangent equation of the intersection point P0 of the surface S with the plane D* (or more accurately, the tangent plane to the surface S at P0).
The node (n0, t0, p0) that fulfills condition Eq. (8) represents the pivotal point where the trajectory of consumer confidence undergoes a significant shift. Once this critical point (n0, t0, p0) is identified, it becomes imperative to compare it with its immediate subsequent node, denoted as (n0+δ, t0+δ, p0+δ), where δ signifies the smallest incremental value. This comparative analysis encompasses three distinct possibilities.
-
(1)
If Δcc(n0, t0, p0) > Δcc(n0+δ, t0+δ, p0+δ), then (n0, t0, p0) signifies the local maximum, or peak, of the consumer confidence curve, indicating a decline in confidence thereafter.
-
(2)
If Δcc(n0, t0, p0) < Δcc(n0+δ, t0+δ, p0+δ), then (n0, t0, p0) marks the local minimum of the consumer confidence curve, suggesting an increase in confidence as the curve progresses.
-
(3)
If Δcc(n0, t0, p0) = Δcc(n0+δ, t0+δ, p0+δ), it implies that there is minimal to no discernible change in the trajectory of the consumer confidence curve over this interval.
Experiment and analysis
Model experiment analysis
Datasets used in the experiment:
-
(1)
Stock Data (https://figshare.com/articles/dataset/Stock_Data/29890079?file=57122093): The experimental dataset encompasses stock trading information gathered by the Tushare software. This comprehensive dataset captures daily trading activities for an extensive selection of 100 stocks, mirroring the actual market trading prices. The pivotal aspect of this data lies in the calculation of the psychological price of consumers, which is derived from the average of real-time buy and sell orders, offering a nuanced understanding of market sentiment and behavior.
-
(2)
Onion Prices (https://tianchi.aliyun.com/dataset/92843?spm=a2c22.28136470.0.0.62124a0arTXK62&from=search-list): This dataset comprises comprehensive daily and weekly market prices of onions sourced from diverse markets across India throughout the year 2020. The data has been meticulously gathered from the reliable data.gov.in website, ensuring its authenticity and comprehensiveness. The dataset encompasses nine crucial columns, including the Name of the State, District, Market, Name of the commodity (onion), Variety of onion, the specific Arrival Date, the Minimum Price recorded, the Maximum Price observed, and the Modal Price, providing a holistic view of the onion market dynamics in India during this period.
-
(3)
Simulation Data (https://figshare.com/account/articles/29890076?file=57122021): Comprising a manually curated dataset, it encompasses 1,000 entries, each featuring the psychological pricing perceptions of consumers alongside the corresponding actual prices of goods. The structured format of this simulated dataset is organized as <time stamp, quantity of purchases, psychological price, actual price>.
The comparison algorithms employed in the experiment:
-
(1)
Statistical algorithm: This algorithmic approach leverages various visual data representation techniques, such as statistical charts, to vividly showcase data attributes. It is adept at deducing features from sample data, enabling a comprehensive understanding of the data’s overarching characteristics and elucidating intricate interrelationships among entities.
-
(2)
EC-Structure (Guo & Zhang, 2019): This innovative algorithm constructs consumption structures by harnessing the wealth of consumption data available on e-Commerce platforms. It meticulously analyzes these structures to ascertain the occurrence of consumption upgrading phenomena. By integrating multidimensional data, EC-Structure offers a holistic view of the progression of consumption upgrading and the profound societal impacts it engenders. This analysis offers valuable insights into the psychological and behavioral responses of consumers amidst changing economic landscapes.
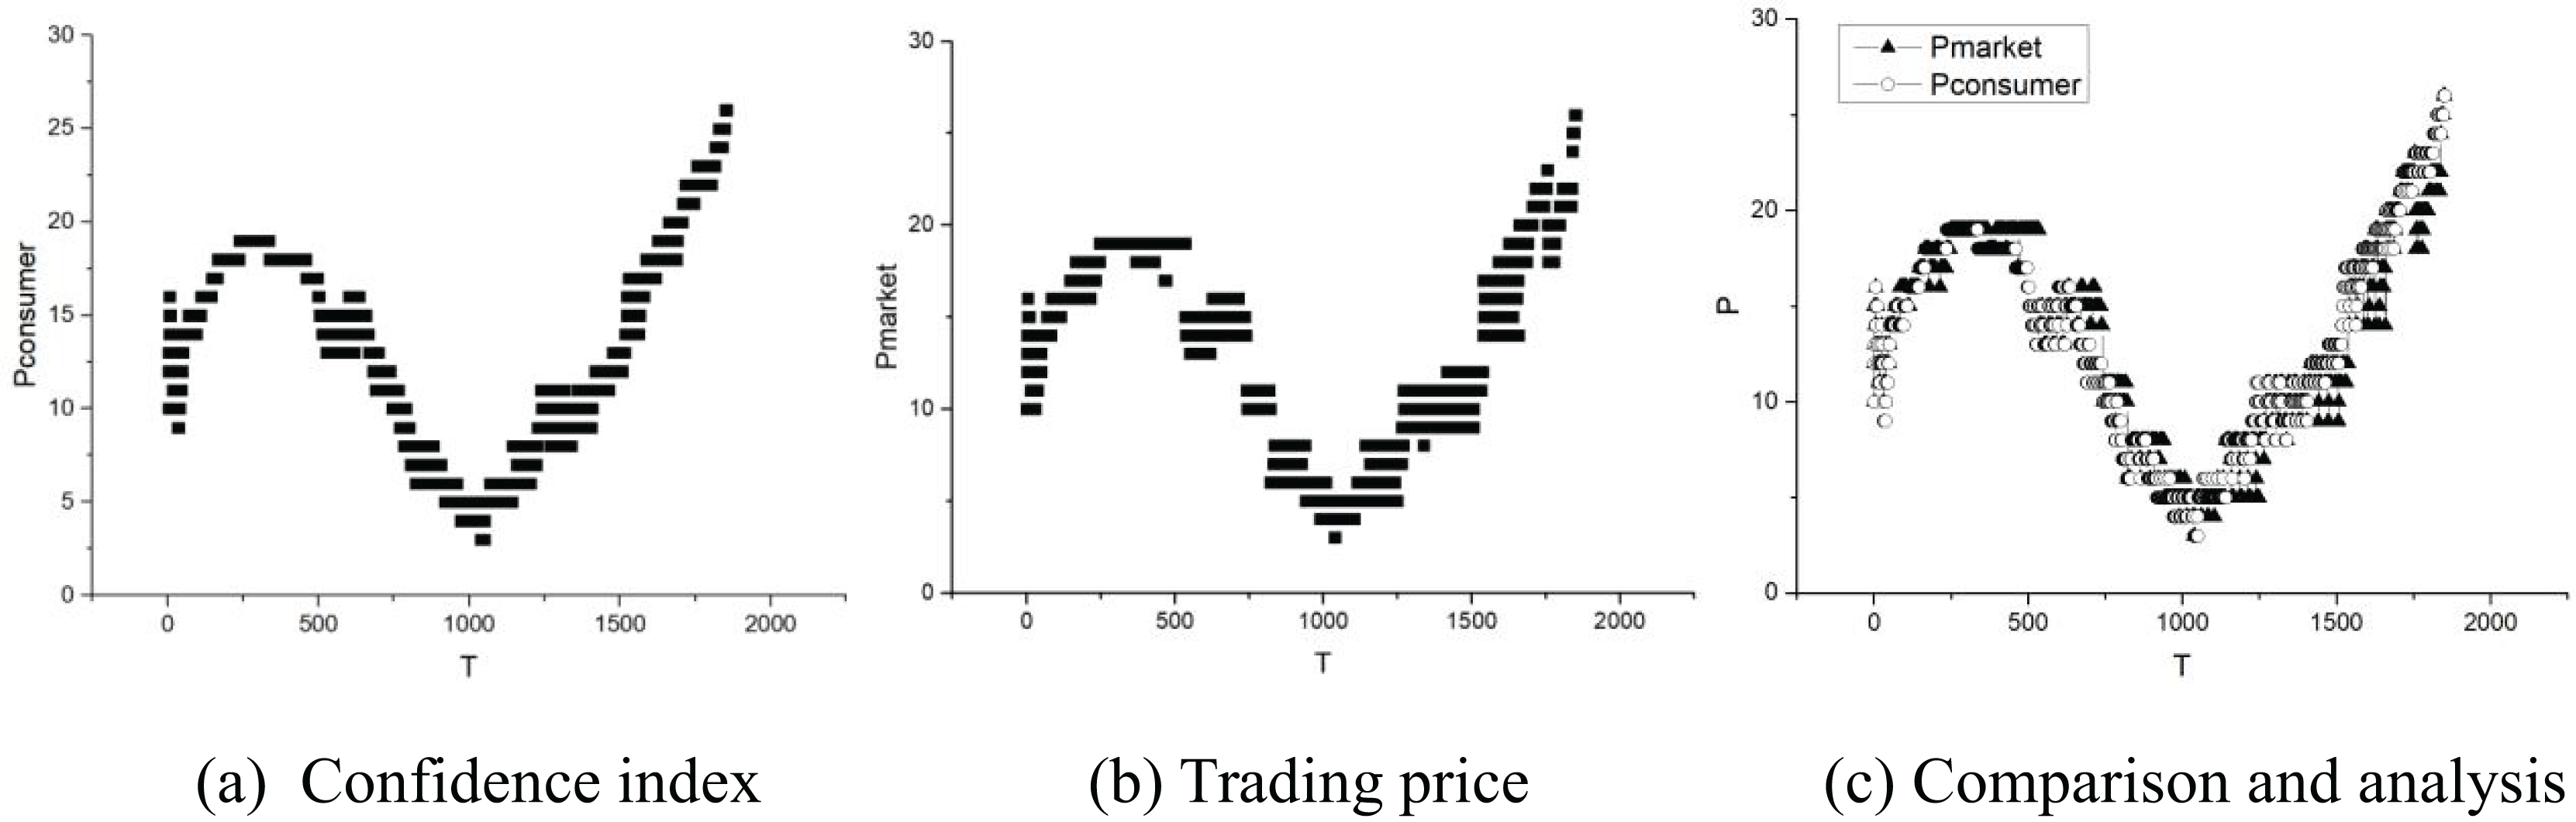
For a more straightforward comparison, Fig. 6 abstracts away from the dimension of transaction frequency, solely portraying the trajectories of consumer confidence and market prices. Specifically, Fig. 6C analyzes the curves from Figs. 6A and 6B, visually illustrating their evolution. The evident congruence in the variation patterns of the consumer confidence curve and the market price curve justifies the use of the consumer confidence index as a measure of the market economy. However, it is acknowledged that consumer confidence shifts may precede or lag behind market changes, posing challenges for economic trend forecasting. Nevertheless, the consumer confidence index remains a highly suitable metric for gauging market fluctuations.
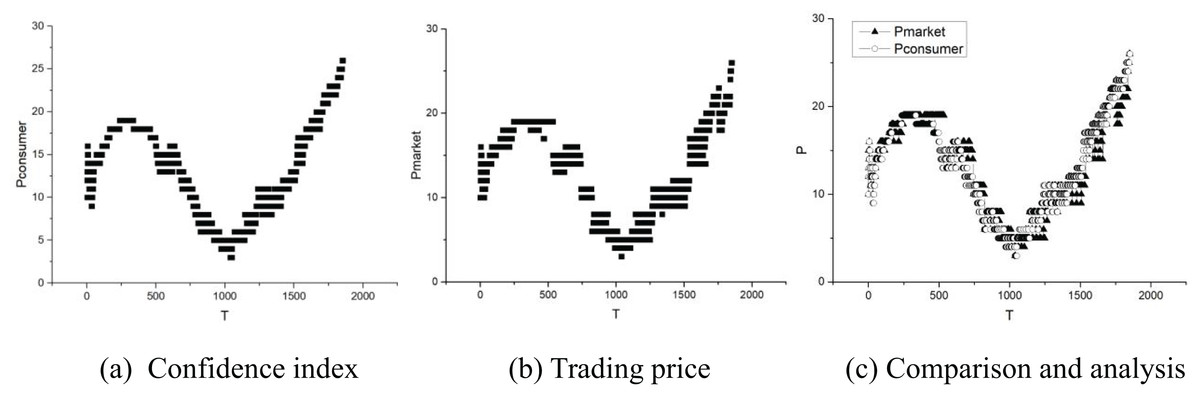
Figure 6: (A–C) Curves of <trading time, trading price>.
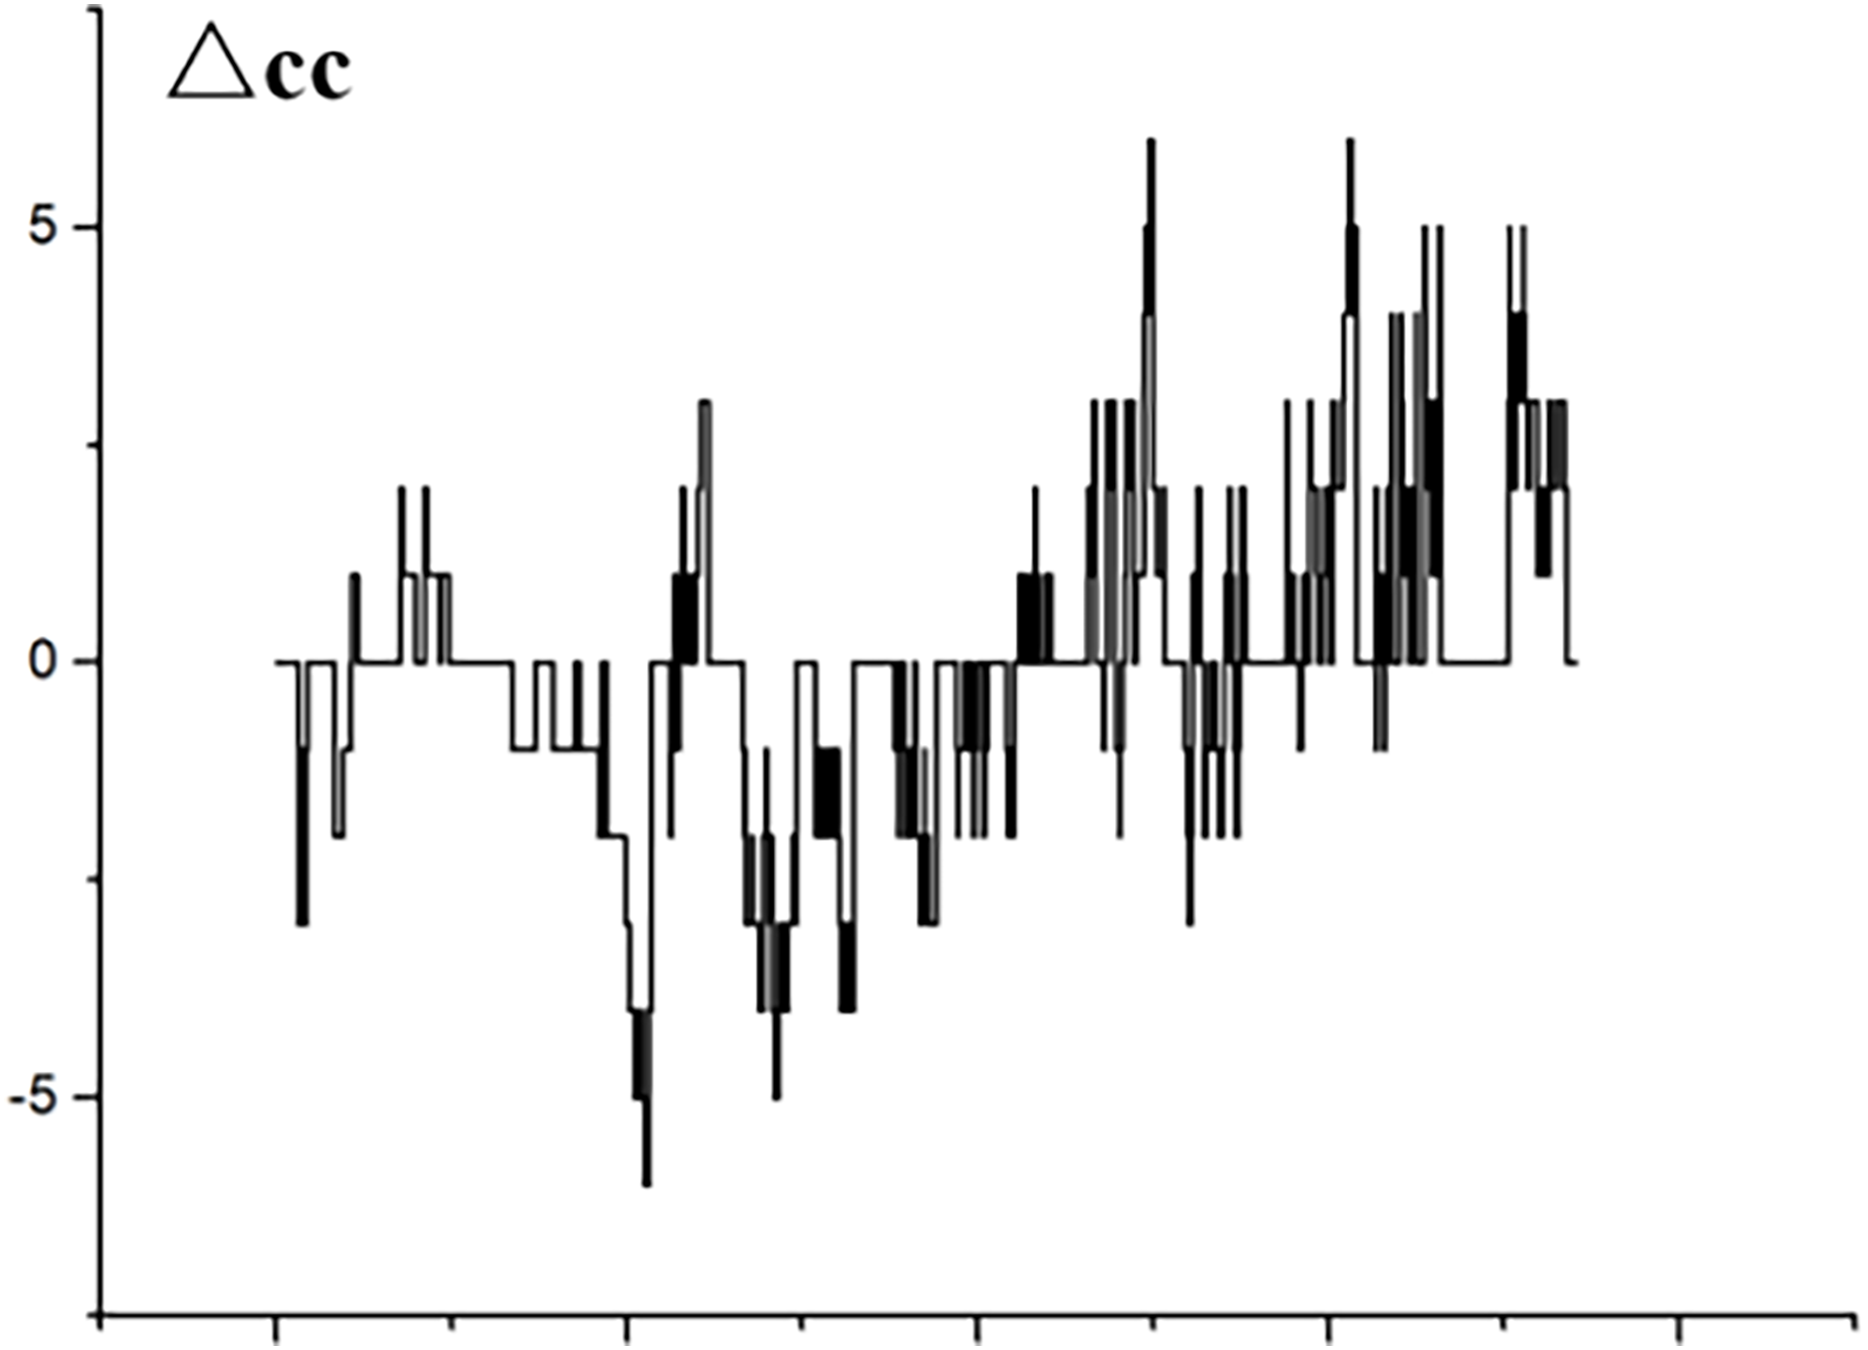
Figure 7 illustrates the trajectory of △cc, where the horizontal axis encapsulates the dual dimensions of transaction frequency and volume. Specifically, it depicts the fluctuations of △cc against the combined metric of <transaction frequency, number of transactions>. A positive confidence index signifies a robust level of market assurance within the prevailing conditions, with the index’s magnitude directly proportional to the intensity of this confidence. Conversely, a negative index indicates low confidence. Since the horizontal coordinate is a comprehensive index of two parameters (number of transactions and frequency of transactions), the curve in Fig. 7 is not a smooth curve, but a curve with a wide range of variations. A pronounced curve amplitude enhances the discernibility of features, whereas a flat curve obscures them. Conversely, an increase in the curve’s amplitude mirrors an expanded distribution of consumer confidence attributes, facilitating a more straightforward extraction of data features. Figure 8 thus validates the effectiveness of the algorithm proposed in this article for constructing a robust measure of consumer confidence.
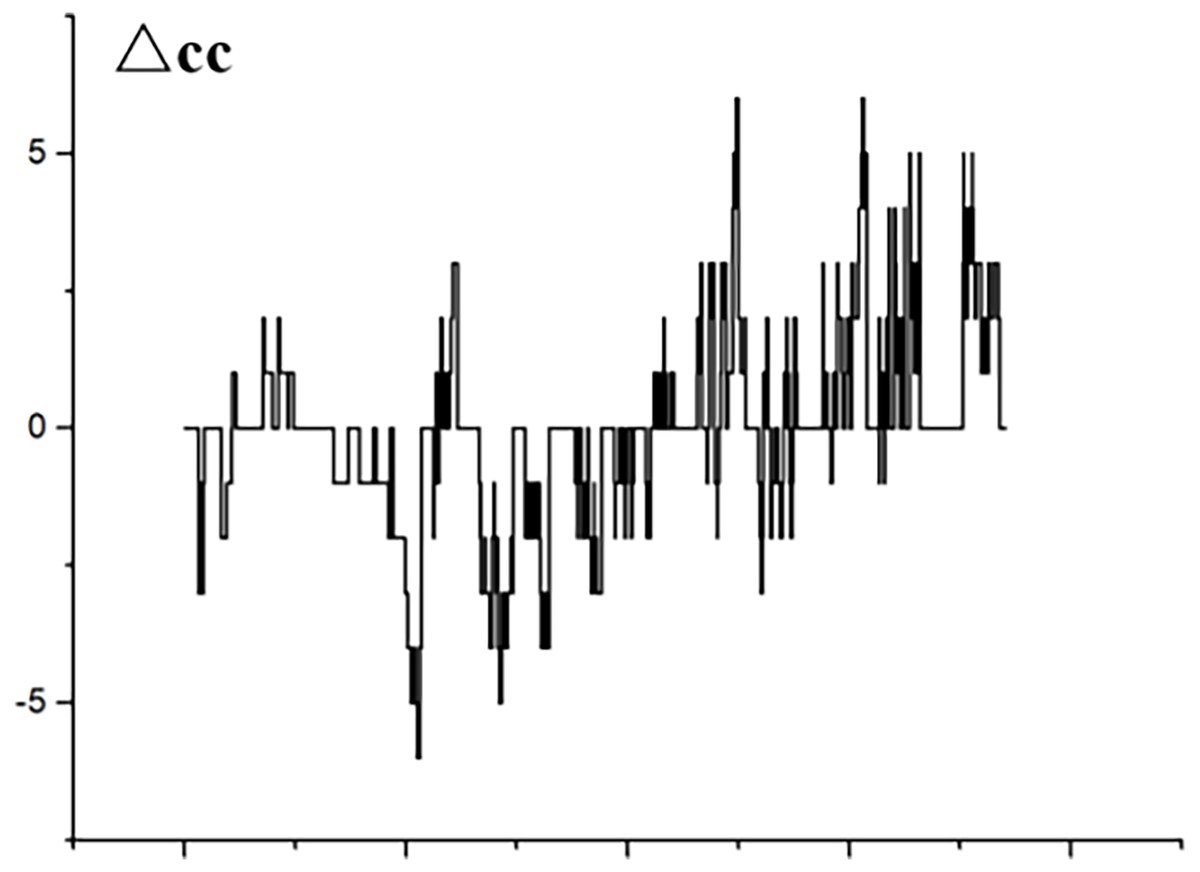
Figure 7: Trends in consumer confidence.
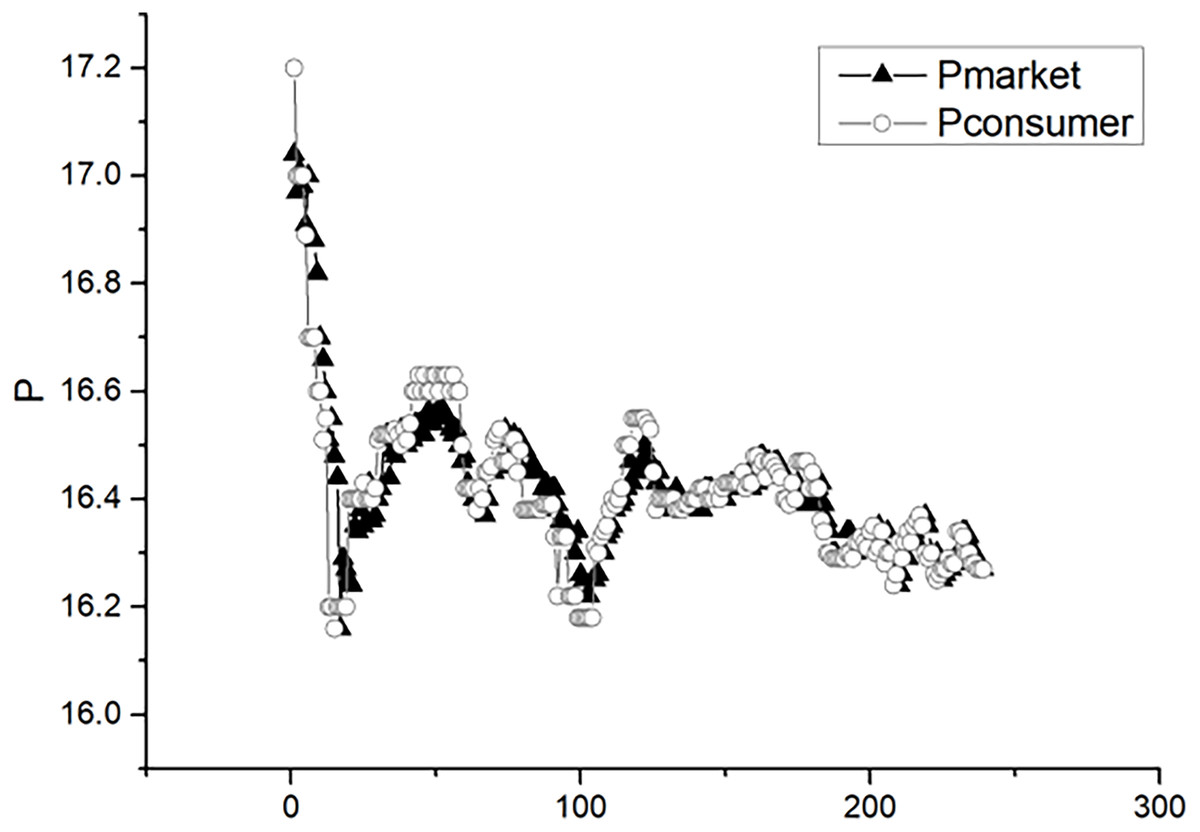
Figure 8: Graph of consumer confidence and market prices.
The daily trading data of timeshare stocks serves as the basis for actual market prices, while the average of real-time order data provides insights into consumers’ psychological pricing. Figure 8 visualizes this interplay between actual stock market prices and consumers’ perceived prices. Data analysis reveals a nuanced correlation pattern: while the consumer confidence index exhibits a modest link with consumer spending, it displays a robust correlation with lagging economic indicators. Exploring the nexus between consumer confidence and the stock market, an upsurge in confidence translates into a heightened propensity for consumers to engage in spending, thereby fostering economic stimulus. Conversely, in the bond market, investors tend to favor a lower consumer confidence index, as it signals reduced consumption appetite and a heightened probability of economic deceleration.
To validate the precision and robustness of the proposed algorithm, we adopt performance metrics including precision (P), recall rate (R), and F1-score (FB), as defined in Tofallis (2015) and Sul, Dennis & Yuan (2017). Specifically, precision (P) is calculated as tp/(tp + fp), where tp represents the number of users with rising confidence correctly identified, and fp denotes those incorrectly classified as such. Recall rate (R) is computed as tp/(tp + fn), with fn standing for users with rising confidence erroneously overlooked. The F1-score (FB), a harmonic mean of precision and recall, is given by P × R × 2/(P + R).
Furthermore, to holistically assess the algorithm’s prediction accuracy, we introduce the accuracy parameter (ACC), which is defined as tp/(tp + tn + fn + fp). Here, tn represents the number of users with falling confidence accurately predicted. This additional metric enhances our experimental evaluation by providing a more comprehensive understanding of the algorithm’s performance.
Table 1 presents a comparative analysis of the s-CCI algorithm introduced in this article against other prevalent algorithms. The results demonstrate that s-CCI surpasses its counterparts, showcasing superior performance across various datasets. Notably, its consistent and stable operation across diverse datasets underscores the algorithm’s correctness and robustness, validating its effectiveness in practical applications.
| Dataset | Statistical algorithm | EC-Structure | s-CCI | |||||||||
|---|---|---|---|---|---|---|---|---|---|---|---|---|
| P | R | FB | ACC | P | R | FB | ACC | P | R | FB | ACC | |
| Simulation data | 0.67 | 0.65 | 0.66 | 0.61 | 0.78 | 0.81 | 0.79 | 0.80 | 0.85 | 0.86 | 0.85 | 0.86 |
| Stock data | 0.64 | 0.72 | 0.68 | 0.63 | 0.78 | 0.80 | 0.79 | 0.79 | 0.85 | 0.88 | 0.86 | 0.87 |
| Onion prices | 0.62 | 0.66 | 0.64 | 0.64 | 0.81 | 0.78 | 0.80 | 0.80 | 0.84 | 0.85 | 0.84 | 0.85 |
Empirical analysis
To strengthen the validation of the model, this study employs a questionnaire survey to empirically analyze online consumer confidence, focusing on users of an e-commerce platform. A total of 600 online questionnaires were disseminated, yielding 569 valid responses, achieving a commendable effective response rate of 94.83%. The questionnaire encompasses multiple factors: economic situation (X1), employment level (X2), living conditions (X3), investment sentiment (X4), and consumers’ psychological price perception (X5). Responses were gauged using Likert’s five-point scale, ensuring a comprehensive evaluation.
The statistical analysis reveals a robust reliability coefficient (alpha) exceeding 0.8, signifying the high reliability of the questionnaire. Furthermore, Cronbach’s alpha values for each variable surpass 0.6, underscoring the strong internal consistency within each scale. Additionally, the Kaiser-Meyer-Olkin (KMO) measure exceeds 0.7, confirming the adequacy and appropriateness of the scale structure for factor analysis. These findings collectively demonstrate the validity and robustness of the data collected.
Utilizing SPSS software, we conducted a thorough correlation analysis and linear regression analysis on the collected data to gain insights into the relationships among various factors. The results of the correlation analysis, summarized in Table 2, highlight significant findings. Specifically, the correlations between X2 (employment level) and X5 (consumers’ psychological price perception), X3 (living conditions) and X5, as well as X4 (investment sentiment) and X5, all exhibit statistical significance at the p < 0.001 level. The respective Pearson correlation coefficients of 0.569, 0.648, and 0.626 indicate moderate-to-strong positive correlations, suggesting that employment level, living conditions, and investment sentiment are all positively associated with consumer confidence. This underscores the importance of these factors in influencing consumers’ overall confidence levels within the online marketplace.
| Correlation | Pearson | Sig. |
|---|---|---|
| X1 & X5 | 0.231 | 0.0000 |
| X2 & X5 | 0.569 | 0.0010 |
| X3 & X5 | 0.648 | 0.0011 |
| X4 & X5 | 0.626 | 0.0017 |
The positive correlations observed between the factors mentioned above employment level, living conditions, investment sentiment, and consumer confidence, serve as validation for the algorithm or model proposed in this study. These findings indicate that the underlying theoretical framework upon which the algorithm is built is sound and aligns with empirical evidence. The significant and positive relationships suggest that the variables selected for analysis are indeed relevant and their inclusion in the model is justified. Therefore, the algorithm or model can be considered reasonably constructed and grounded in a correct theoretical architecture, further reinforcing its potential for accurate predictions and insights into consumer behavior and confidence levels.
Conclusions
The social network encapsulates a vast array of authentic transaction data, evaluation metrics, scoring insights, and more, thereby conferring a substantial advantage in analyzing consumer confidence. In this research, we devise a comprehensive approach to calculating the consumer confidence index by crafting a surface equation that meticulously integrates three pivotal factors: transaction price, timing, and volume. This methodology enables swift and dynamic tracking of consumer confidence fluctuations and trends.
Our experiments delve into a comparative analysis of various algorithms, with a particular focus on validating the accuracy and efficiency of the s-CCI algorithm from multiple angles. The results underscore the s-CCI’s key strengths: it simplifies data acquisition while achieving remarkable precision, thereby demonstrating its superiority in the realm of consumer confidence analysis.