
Hyperparameter optimization of convolutional neural networks using particle swarm optimization for diabetic retinopathy detection
- Published
- Accepted
- Received
- Academic Editor
- Paulo Jorge Coelho
- Subject Areas
- Artificial Intelligence, Computer Vision, Data Science, Optimization Theory and Computation, Neural Networks
- Keywords
- Diabetic retinopathy, Convolution neural network, Hyperparameter optimization, Particle swarm optimization, Pre-trained model
- Copyright
- © 2025 Almansour et al.
- Licence
- This is an open access article distributed under the terms of the Creative Commons Attribution License, which permits unrestricted use, distribution, reproduction and adaptation in any medium and for any purpose provided that it is properly attributed. For attribution, the original author(s), title, publication source (PeerJ Computer Science) and either DOI or URL of the article must be cited.
- Cite this article
- 2025. Hyperparameter optimization of convolutional neural networks using particle swarm optimization for diabetic retinopathy detection. PeerJ Computer Science 11:e3273 https://doi.org/10.7717/peerj-cs.3273
Abstract
The optimization of hyperparameters in convolutional neural networks (CNNs) is crucial for improving the accuracy and effectiveness of diabetic retinopathy (DR) image classification. Conventional approaches often rely on manual adjustments, which are time-consuming and inefficient. This research proposes variant particle swarm optimization (PSO) methods for fine-tuning the hyperparameters of pre-trained deep learning models—specifically PSO-VGG-16, PSO-DenseNet-121, and PSO-MobileNet. The proposed models enhance the exploratory capabilities of CNNs by searching for optimal hyperparameter configurations. Experiments were conducted using the APTOS 2019 DR image benchmark dataset. This study introduces a PSO-driven hyperparameter optimization framework tailored for pre-trained CNN architectures (VGG-16, DenseNet-121, and MobileNetV2) to improve DR classification performance. The proposed method outperforms conventional genetic algorithm (GA)-based tuning techniques, achieving superior accuracy and model robustness. The findings show that PSO achieved a classification accuracy of 97.41%, sensitivity of 96.8%, and specificity of 99.4%. Among the models, PSO-MobileNet demonstrated the best overall performance. These results confirm that PSO is a powerful tool for hyperparameter optimization, enhancing diagnostic accuracy and improving the efficiency of CNN models in medical image classification. This technique supports healthcare professionals in making timely and precise diagnoses, contributing to better patient outcomes and reduced strain on healthcare systems.
Introduction
Diabetes mellitus (DM) affects approximately 425 million people globally (Magliano, Boyko & IDF Diabetes Atlas 10th Edition Scientific Committee, 2022). It can result in serious complications, among which diabetic retinopathy (DR) (Chawla, Chawla & Jaggi, 2016), which is a vision-sensitive complication, should be emphasised. Diabetic retinopathy can rank high among diabetes consequences, as it is a primary cause of blindness in most countries in the West (Leasher et al., 2016). The prevalence of diabetic retinopathy confirms that proper classification and monitoring protocols should be used to decelerate vision deterioration in diabetes patients.
Diabetic retinopathy is an ocular disease manifest as hemorrhage, exudates, microangiopathies, and new vessel growth in the retina (Bodapati et al., 2020; Das & Saha, 2022). Diagnosis can often be accomplished by digital colour fundus photography. However, DR prevalence places a heavy workload burden on eye doctors, especially in areas with a lack of medical facilities (Huang et al., 2023). This makes necessary computerized diagnostic devices to lighten clinicians’ workload as much as possible, as well as ensure timely management of patients.
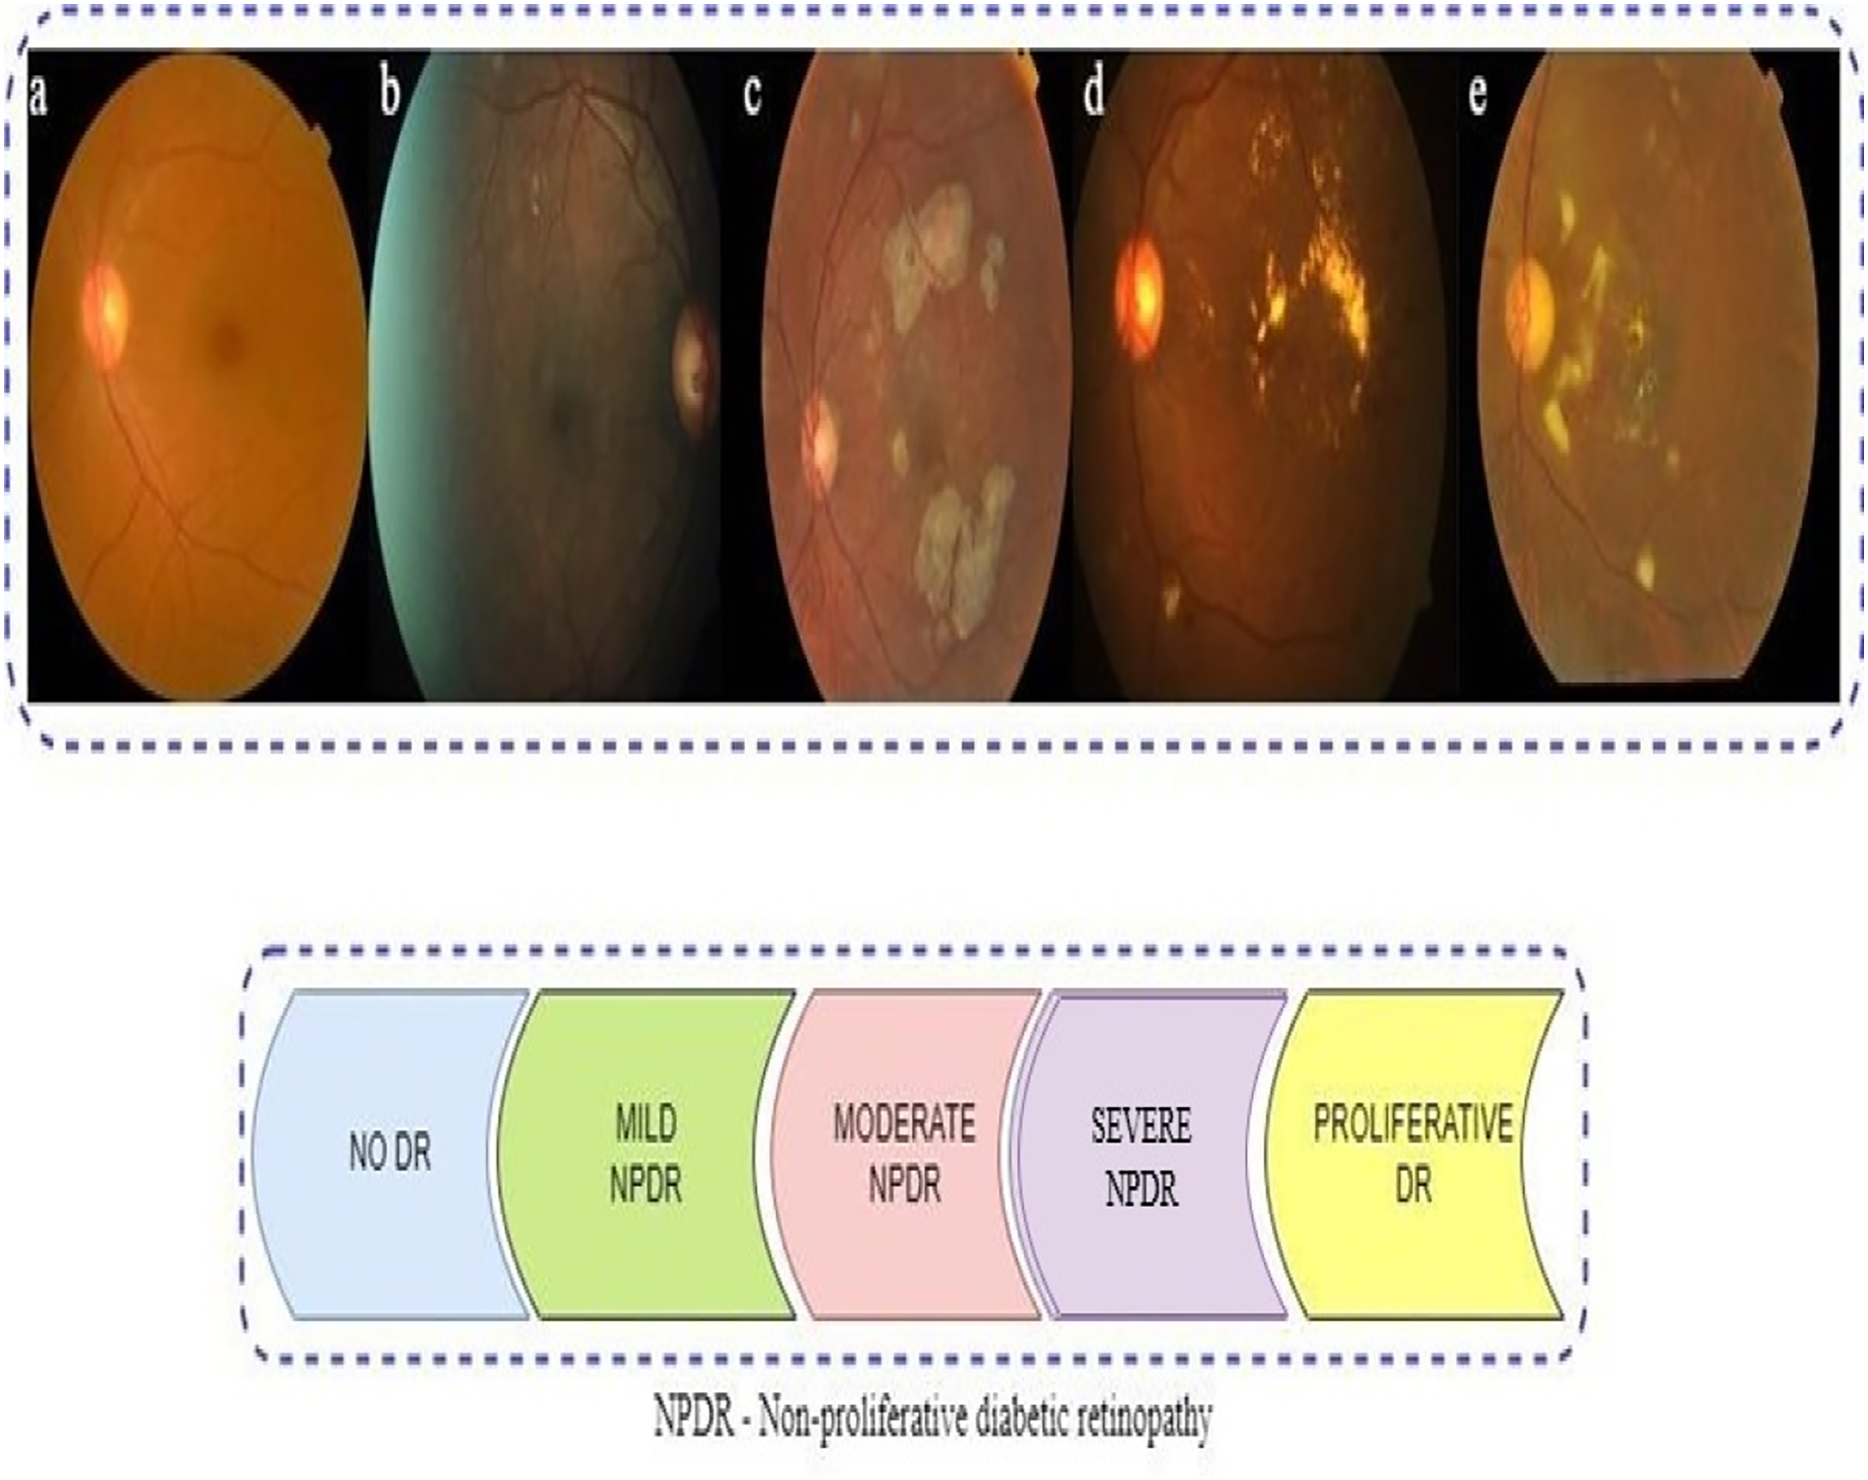
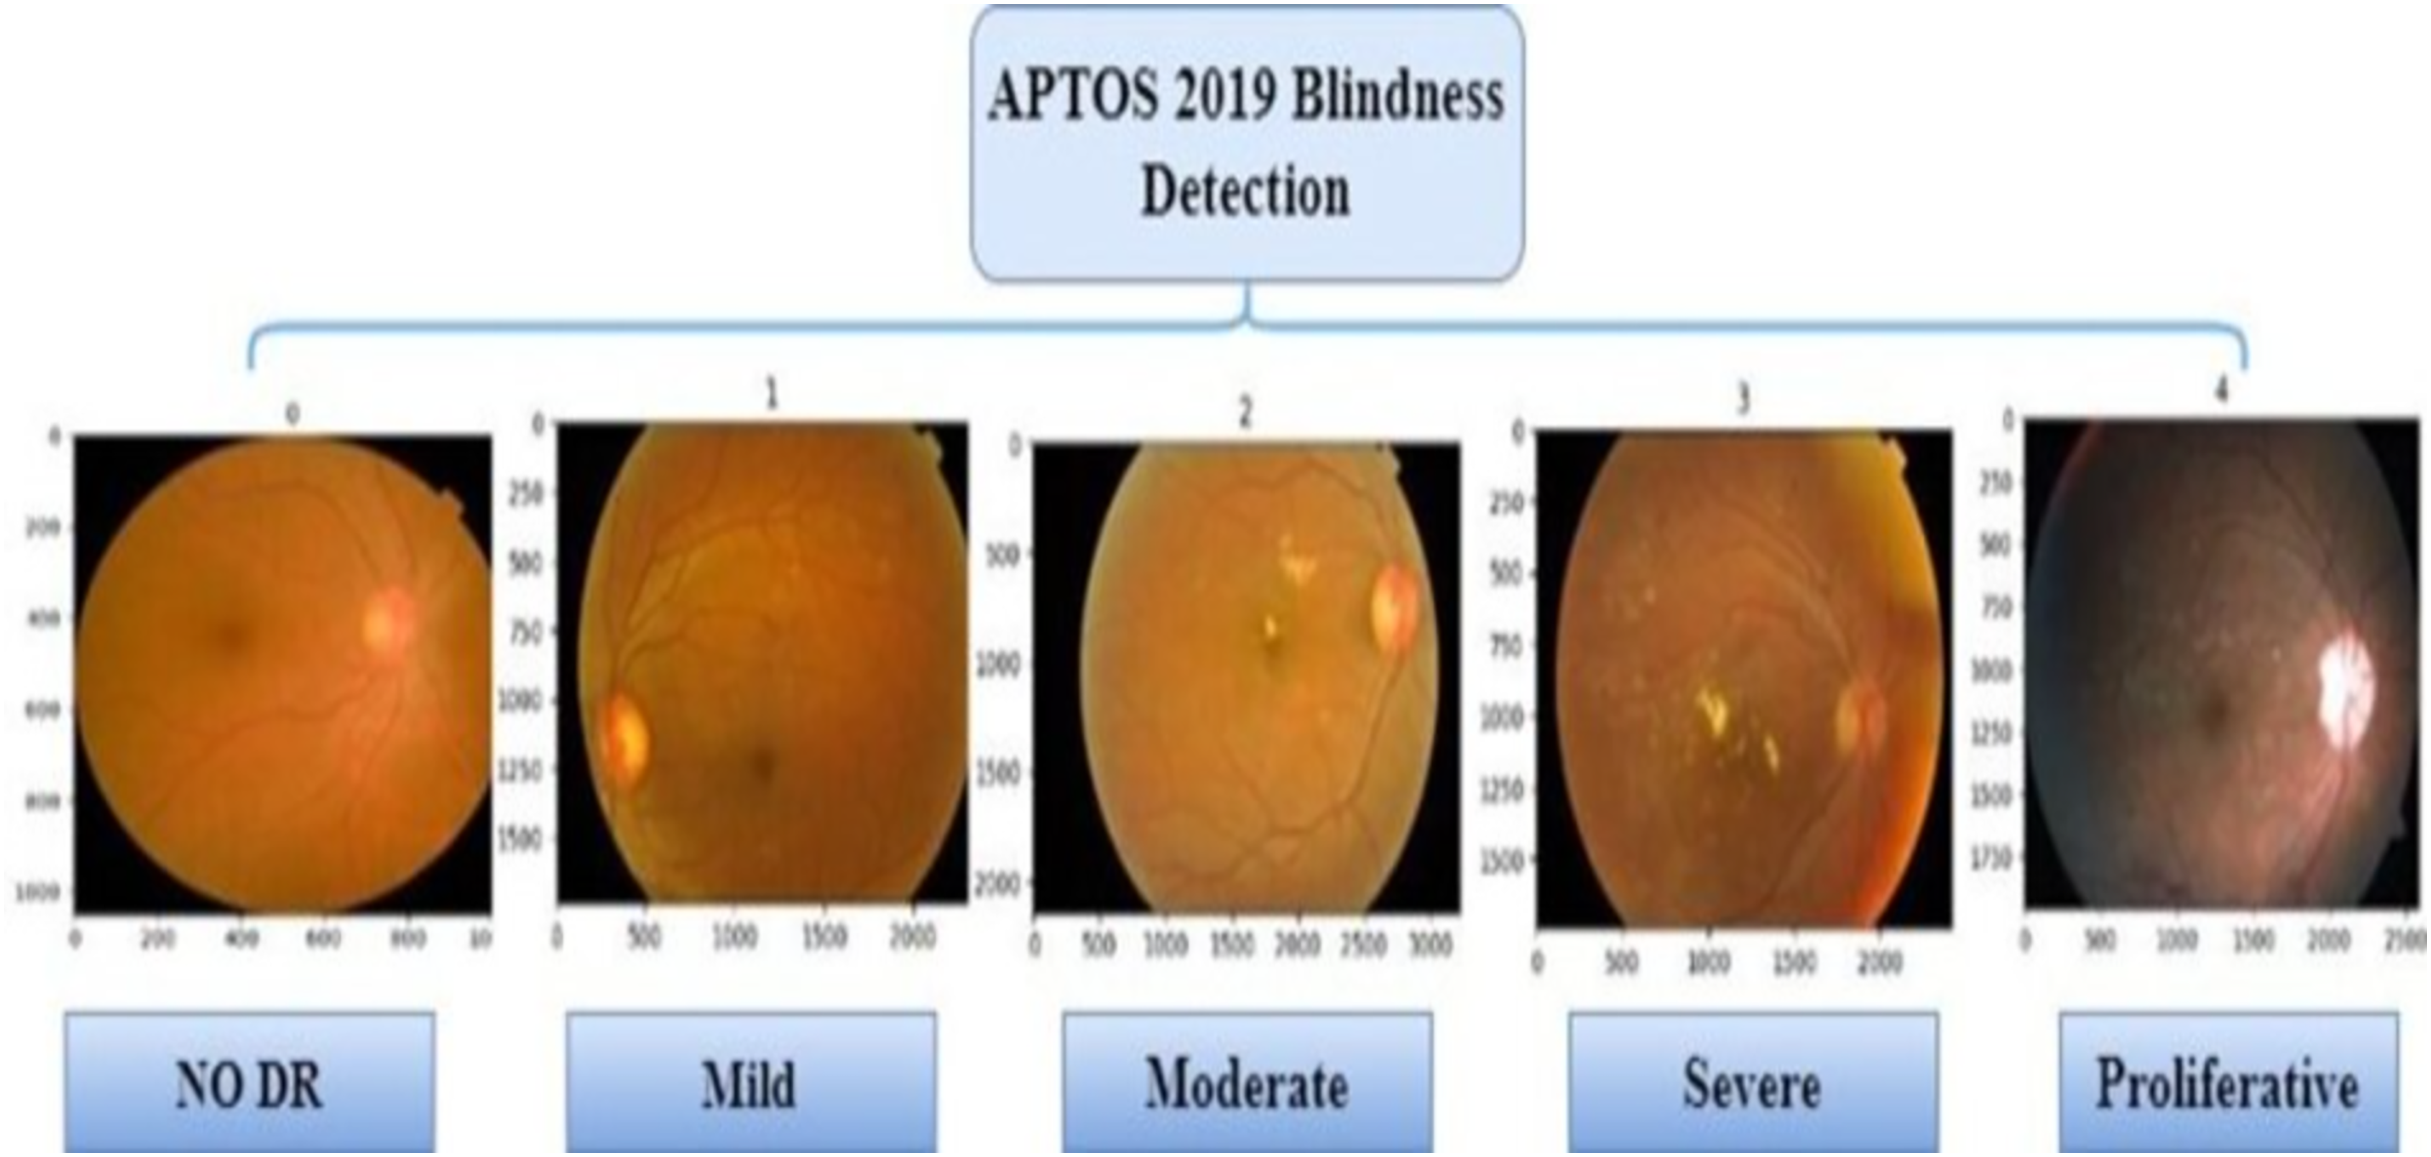
The presence of multiple lesions and abnormalities in retinal fundus images makes DR difficult to classify (Das & Saha, 2022; Bodapati et al., 2020; Gayathri, Gopi & Palanisamy, 2020). Researchers have divided DR into two broad forms: non-proliferative (NPDR) and proliferative (PDR). According to Mohanty et al. (2023), there are five stages in DR progression, from no visible signs to reaching a proliferative stage. Microaneurysms and compromised blood vessel function in the retina can be seen in the early stage of NPDR (Das & Saha, 2022). Severity levels along with blocked vessel extent in NPDR classify it as mild, moderate, or severe (Sharma et al., 2021). With the more progressed PDR stage, a shortage of oxygen in the retina leads to new, delicate blood vessel growth, which can bleed, severely compromising vision (Elsharkawy et al., 2022). Representative images in Fig. 1 illustrate the five DR stages: No DR, Mild, Moderate, Severe, and Proliferative. The images show how visually intricate and similar stages can appear, making it challenging to classify accurately.
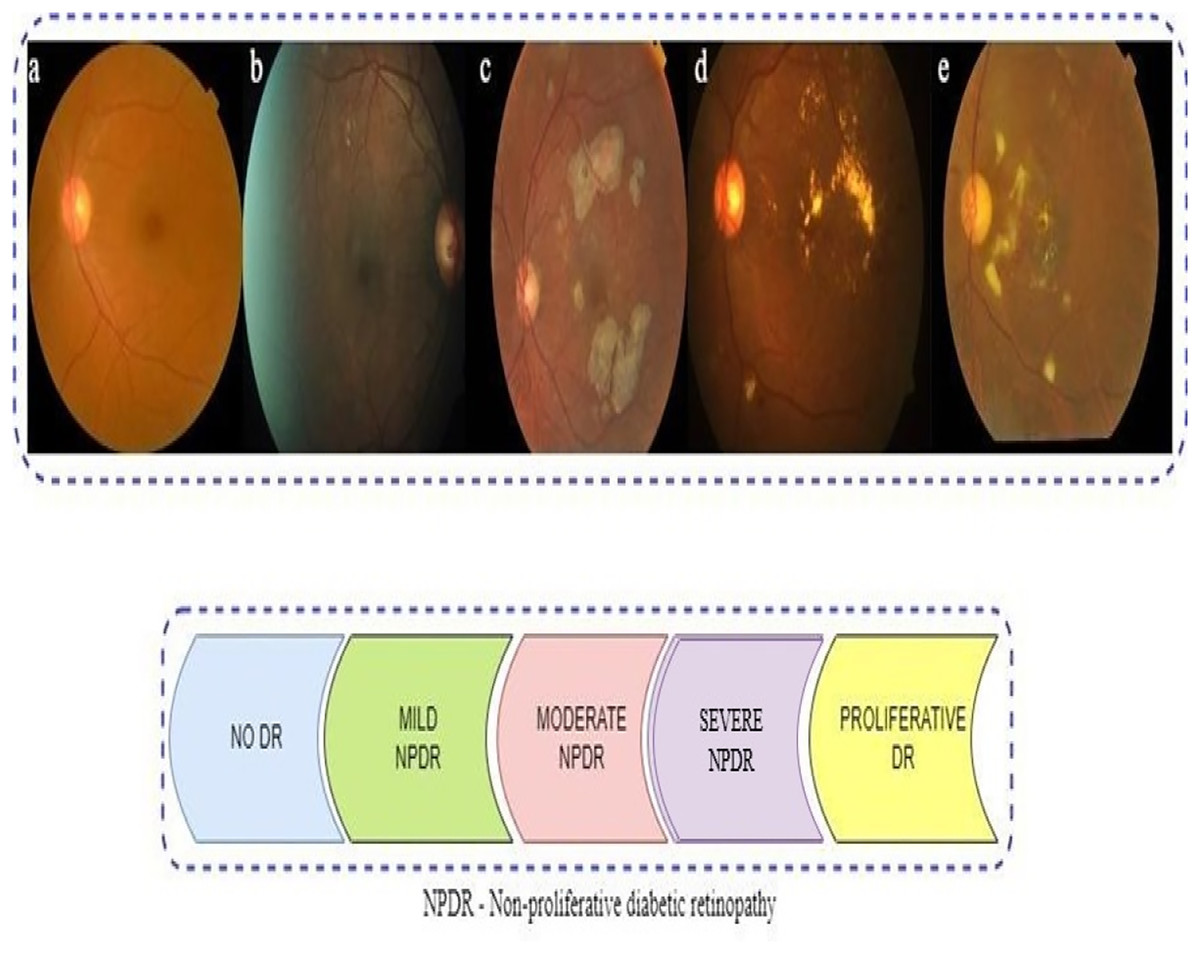
Figure 1: Represents sample retinal fundus images of different stages of diabetic retinopathy (DR): (A) NO DR (B) Mild non-proliferative (NPDR) (C) Moderate NPDR (D) Severe NPDR (E) proliferative (PDR).
The manual evaluation of retina scans by eye ophthalmologists to ascertain DR severity has been prone to errors, time-consuming, and costly (Dayana & Emmanuel, 2022; Lakshminarayanan et al., 2021). To address these challenges, computer-aided diagnostic (CAD) systems have been developed, which ensure better diagnostic accuracy and less dependence on human judgments (Akkuş et al., 2024; Qureshi, Ma & Abbas, 2019). Nevertheless, traditional CAD systems still demand considerable human efforts and domain expertise (Bai et al., 2022).
Deep learning-based CAD systems have shown remarkable success in DR classification, particularly through the use of convolutional neural networks (CNNs) (Badawy et al., 2023). CNNs have demonstrated superior performance in various image analysis tasks such as classification, detection, and segmentation across medical domains including breast cancer, colon cancer, and DR (Albashish, 2022; Atwan et al., 2024; Chen et al., 2021; Cong & Zhou, 2023; Gunasekaran et al., 2022). Pre-trained CNN architectures such as VGG16 (Simonyan & Zisserman, 2014), DenseNet121 (Huang et al., 2017), and MobileNet (Howard, 2017) have been proven to be efficient in interpreting medical images, especially when training data is limited (Saini & Susan, 2020).
During the training phase, CNNs continuously adjust their hyperparameters to improve both accuracy and computational performance (Aljarah, Faris & Mirjalili, 2018; Atteia et al., 2022; Murphy, 2012). However, when this tuning process is done manually, it often turns out to be inefficient, takes a lot of time, demands considerable resources, and can be influenced by human bias (Bergstra et al., 2011; Feurer & Hutter, 2019; Shawki et al., 2021; Yu & Zhu, 2020). In addition, deep learning models are not without their challenges. They often struggle with overfitting, data imbalance, and unstable convergence during training (Aljarah, Faris & Mirjalili, 2018; Goceri, 2023). To help address these limitations, researchers have increasingly turned to metaheuristic optimization techniques, which have shown impressive results in solving tasks like image classification (Almeshrky & Karacı, 2024).
Metaheuristic algorithms iteratively explore the search space using operators that combine existing solutions to discover better ones while avoiding local optima (Gad, 2022). Although effective across various domains, they do not guarantee the global optimum and often yield approximate solutions (Dokeroglu et al., 2019).
A wide range of metaheuristic techniques have been widely used to tackle the challenges of hyperparameter optimization in different areas of research. Some well-known examples include grey wolf optimization (GWO) (Nematzadeh et al., 2022), particle swarm optimization (PSO) (Ibrahim, Ghnemat & Abu Al-Haija, 2023), the firefly algorithm (Bacanin et al., 2020), the spotted hyena optimizer (SHO) (Nadeem et al., 2022), and the genetic algorithm (GA) (Purnomo et al., 2024). These are just a few among many approaches that have been explored in recent studies (Adamu et al., 2023; Van Luyen & Van Cuong, 2023).
This study aims to automate the process of identifying optimal hyperparameters for pre-trained CNN models using the PSO algorithm. Traditionally, selecting appropriate hyperparameters has required expert knowledge and extensive trial-and-error experimentation, often leading to inefficiencies and suboptimal configurations. Manual tuning is also prone to human error and consumes significant time and resources. In contrast, PSO provides an efficient and automated search mechanism that systematically explores the hyperparameter space. It requires only the definition of the search space while adaptively refining solutions through swarm intelligence. This method is preferred due to its ability to achieve faster convergence compared to other metaheuristic algorithms (Sahu, Panigrahi & Pattnaik, 2012).
This research examines the efficacy of three prominent pre-trained CNN models, VGG16, DenseNet121, and MobileNetV2, in diagnosing the severity of DR. The primary objective is to develop an optimized system that uses PSO to refine essential hyperparameters, such as the number of filters, dropout rates, and learning rates. This strategy seeks to enhance the accuracy and stability of the classification process by focusing on minimizing the loss function during training, thus enabling more accurate identification of DR using fundus images.
While PSO has been used in deep learning for hyperparameter tuning, in DR classification, its usage remains relatively limited particularly in the case of light-weight models as well as comparative optimization methods. For instance, Ibrahim, Ghnemat & Abu Al-Haija (2023) employed PSO in Alzheimer’s detection from MRI images, but not for retinal images. Similarly, Das & Saha (2022) used GA in a hybrid support vector machine-convolutional neural network (SVM-CNN) system for DR, while (Randive, Senapati & Rahulkar, 2019) employed the GWO as compared to PSO. In contrast, in our research, we use PSO to fine-tune a number of pre-trained CNNs, that is, MobileNetV2, DenseNet121 and VGG16, and make a head-to-head comparison with GA optimization. Further, unlike the research by Kale & Sharma (2023) which used stacking methods in a non-optimized way, in our research, we use optimization by a metaheuristic which enhances diagnostic accuracy by utilizing the APTOS 2019 dataset. What distinguishes our research is a rigorous evaluation process, wherein a variety of performance metrics like accuracy, recall, F1-score, specificity, Kappa statistic, and the confusion matrix all validate the robustness and efficacy of our proposed PSO-based framework.
The sections of this article are organized as follows. ‘Literature Survey’ highlights the latest advances in DR classification, pre-trained CNN models, and hyper-parameter tuning utilizing algorithms nature-inspired. ‘Methodology’ describes the proposed methodology, followed by an explanation of the proposed model in ‘Particle Swarm Optimization Algorithm’ and the experimental findings and analysis. Finally, ‘Experiments Results and Discussion’ provides the study conclusion and discusses future work.
Literature survey
This section briefly overviews the most recent studies on pre-trained CNN models used for DR classification. The following text provides a succinct analysis of critical research on metaheuristics, specifically focusing on its role in optimizing hyperparameters in CNNs. A noteworthy recent study by Kassani et al. (2019) developed a technique that uses a pre-trained Xception architecture to extract features to classify DR illnesses. They employed a deep layer aggregation approach to combine multilevel features extracted from different convolutional layers of the Xception architecture. Integrating Xception model components with CNN layers enhanced the detection rates.
The model attained an accuracy of 83.09% on the APTOS 2019 dataset. In addition Ohri & Kumar (2024) presented a groundbreaking method for categorizing DR. They utilized a CNN-pretrained ResNet-50 model, followed by Softmax activation layers. The model attained an accuracy of 80.1% on the APTOS dataset. However, it performed poorly in scenarios with little data and could not generalize well. Lin & Wu (2023) suggested modifications to the ResNet-50 model to boost the accuracy of DR diagnosis. To get the right features from specific layers in ResNet-50, they used preprocessing methods, visualization tools, adaptive learning modifiers, and L2 regularization. Using a dataset consisting of 35,126 fundus photos obtained from Kaggle, they were able to improve the effectiveness of their model compared to the original model. This improvement resulted in better DR diagnosis and increased accuracy. On the other hand, Shaban et al. (2020) introduced a deep CNN consisting of 18 convolutional layers and three fully connected layers. Using image preprocessing techniques, they achieved an 89% success rate on the APTOS-2019 dataset, demonstrating its ability to detect diseases at an early stage. However, it is worth noting that it may be prone to overfitting. Jia, Chen & Chi (2024) presented a GAN-based super-resolution technique for fundus retinal images as guided by vascular structure segmentation with a pre-trained U-Net. They implemented spatial and channel attentions to better reconstruct fine structures and limit structural distortions and presented better results compared to other GAN-based models in terms of clarity and structural preservation.
Another recent work is that by Gangwar & Ravi (2021) developed a hybrid model that uses transfer learning from the Inception-ResNet-v2 models to diagnose DR. They used an Adam optimizer to generate a 299 299 RGB image size. The model had a peak accuracy of 82.18%. Meanwhile, Kale & Sharma (2023) employed a stacking ensemble approach with pre-trained VGG16 and VGG19, resulting in an accuracy rate of 87.31%—however, the methodology suffered from a limited and ambiguous sample size. Similarly, the authors (Bodapati et al., 2020) used hybrid models to enhance data representation. To extract profound features, they employed pre-trained ConvNet architectures, specifically VGG16, NASNet, Xception, and Inception ResNetV2. They used a uni-modal approach, a single feature, and a multi-modal methodology, which involved mixing deep characteristics. Similarly, Mohanty et al. (2023) introduced two advanced deep learning models: a hybrid network combining the VGG16 architecture with the XGBoost Classifier and the DenseNet 121 network. The APTOS 2019 dataset evaluated these designs, and DenseNet 121 exceeded expectations by achieving an accuracy of 97.30%.
Furthermore, Zhang et al. (2021) employed deep learning models to classify the severity of DR, thus enhancing the hyperparameters. They examined the precision of the input, the effectiveness of the loss functions, and the methods used for data augmentation. The DenseNet121 model exhibited exceptional accuracy; nevertheless, it encountered difficulties due to unbalanced data and suboptimal training image quality. In Mutawa, Alnajdi & Sruthi (2023) investigated how the integration of varied datasets using educational transfer technology improved model performance. They used hyperparameter optimization to identify the optimal coefficients for pre-trained CNNs, specifically targeting DenseNet and ResNet. The training on APTOS and EyePACS resulted in notable performance improvements. However, there were issues with overgeneralization, and the training process took longer than expected.
There are also many works that have employed metaheuristic algorithms in different applications and fields. Among these, Badawy et al. (2023) developed a dualistic framework for classifying renal diseases, specifically for the diagnosis of malignancies and kidney stones. To enhance classification accuracy, they employed pre-trained CNN models with the Sparrow search algorithm (SpaSA). The findings demonstrated that their approach with SpaSA successfully yielded beneficial effects on CNN parameters and hyperparameters. On the other hand, Alnabhan et al. (2022) employed the Egyptian Vulture optimization (EVO) method to optimize the hyper-parameters of a CNN. They integrated machine learning techniques such as MLP, ELM, and ensemble learning. Their model demonstrated superior performance compared to other models in the categorization of brain tumor imaging, achieving the highest and lowest error rates.
In Davoudi & Thulasiraman (2021) introduced a novel approach for classifying histological breast images. The GA fine-tuned the CNNs they used. They trained their model using mini-batch gradient descent, Adam, and GA classifiers. They assessed the solution’s fitness based on its categorization error rate and ranked it according to its fitness values. The Adam optimizer achieved superior performance compared to mini-batch gradient descent and GA approaches, with an improvement of 85.83%. Likewise, Ibrahim, Ghnemat & Abu Al-Haija (2023) devised a refined deep learning framework based on CNNs to classify Alzheimer’s disease, combining the CNN-PSO algorithm to improve classification performance. They found the ideal parameters of the model, which included the learning rate, activation function, non-linearity activation function, epochs, and batch size. Furthermore, they identified the model’s optimal parameters, and despite misclassification and low resolution, it achieved an impressive accuracy rate of 98.83% over a span of 8 min.
Related to DR disease, the study (Jadhav, Patil & Biradar, 2021) introduced a classification model for illness recognition that utilizes the deep belief network (DBN) to detect different phases of the disease accurately. The modified rider optimization algorithm with gear and steering mechanism (MGS-ROA) chose the best features and tuned the DBN weights, leading to a 93.18% success rate in the DIARETDB1 dataset. Also, Randive, Senapati & Rahulkar (2019) sggested a revised self-adaptive process that utilizes gray wolf optimization (SA-GWO) to pick and categorize features related to DR. The model employs segmentation, feature extraction, and classification techniques. It uses neural networks for the classification task and incorporates a novel SA-GWO approach for optimum feature selection. In addition (Roshini et al., 2020) enhanced a deep CNN to diagnose DR and segment blood vessels. They achieved this by employing fitness-probability-based chicken swarm optimization and adaptive average filtering. They attained a 93% level of accuracy on a limited dataset, but they encountered obstacles like overfitting and extended computation durations. Another recent research study (Das & Saha, 2022) introduced a CNN-GA-SVM technique to optimize convolution and pooling layers parameters, kernel selection, and size. Despite limitations on input image size and batch size, the method improved classification accuracy using the CNN-GA-SVM methodology.
In recent years, researchers have increasingly focused on improving how CNNs perform in medical image analysis by fine-tuning their internal settings summarized in Table 1, related studies trend in using deep CNN and optimization techniques to classify diabetic retinopathy. In Atteia et al. (2022) worked to improve how CNNs detect diabetic maculopathy using fundus and OCT images. They adjusted settings such as learning rate, depth, and regularization through Bayesian optimization, and their model performed well, achieving 94.2% precision on fundus images and 95.8% on OCT. These results were better than models that were not optimised. Later, Nilatika, Pramono & Rahmadwati (2024) focused on DR detection using the APTOS 2019 dataset. They used a GA to change the number and size of filters in the CNN model. Their method raised accuracy from 93.09% to 97.45%. Both studies showed that carefully tuning CNN settings can really make a difference when analyzing medical images. Similarly, Rawat & Kumar (2024) introduced a hybrid CNN optimized by the self-adaptive Jaya Algorithm (SAJOA), aiming at important hyperparameters such as batch size and dropout rate. They achieved a precision of 96.5% and an F1-score of 87.7% in DRIVE, ranging from 7% to 8% better than U-Net and V-Net. They attained significant generalisability and improved segmentation of retinal anomalies. Following this direction, Dhiravidachelvi et al. (2023) presented a hybrid CNN-RNN model fine-tuned using artificial hummingbird optimization (AHBO) to promote exudate detection in fundus images. The AHBO algorithm has been utilized to optimize hyperparameters like learning rate, dropout, and batch size in both networks. Although the approach was very accurate, it consumed high computational resources during training. Pamula et al. (2025) developed a bilinear convolutional attention network with an electric fish optimisation algorithm, with attention and hyperparameter optimisation. They achieved an accuracy of 94.6% and an F1-score of 91.7% on APTOS 2019, illustrating the effectiveness of attention-augmented metaheuristic optimization for retinal image classification.
| Author(s) | Dataset used | CNN architecture | Accuracy | Optimization algorithm | Training approach |
|---|---|---|---|---|---|
| Kassani et al. (2019) | APTOS 2019 | Xception | 83.09% | None | Feature fusion using deep layers |
| Ohri & Kumar (2024) | APTOS 2019 | ResNet-50 | 80.1% | None | Supervised training (no tuning) |
| Lin & Wu (2023) | Kaggle DR | ResNet-50 (mod.) | – | Adaptive learning + L2 | Regularization improvement |
| Shaban et al. (2020) | APTOS 2019 | Custom CNN | 89.0% | None | Deep CNN from scratch |
| Pamula et al. (2025) | APTOS 2019 | DenseNet121 | 94.27% | GA | GA-based CNN hyperparameter tuning |
| Nilatika, Pramono & Rahmadwati (2024) | Kaggle DR | VGG16 | 93.91% | PSO | PSO for CNN tuning with preprocessing |
| Nilatika, Pramono & Rahmadwati (2024) | Kaggle DR | ResNet50 | 94.58% | GA | GA-based fine-tuning of CNN architecture |
While there is strong potential shown by CNN-based models for DR detection, their performance is still largely hyperparameter-dependent. Although recent research has leveraged techniques including GA, Bayesian methods, and hybrid metaheuristics for optimizing hyperparameters with a consideration towards improving accuracy in classifications, there are principal limitations that cannot be ignored, including limited generalizability, data deficiency, and a lack of clinical validation. In an effort to overcome such deficiencies, this article presents a PSO-based strategy for optimizing pre-trained CNN models for DR detection and more reliable diagnostic predictive values.
Methodology
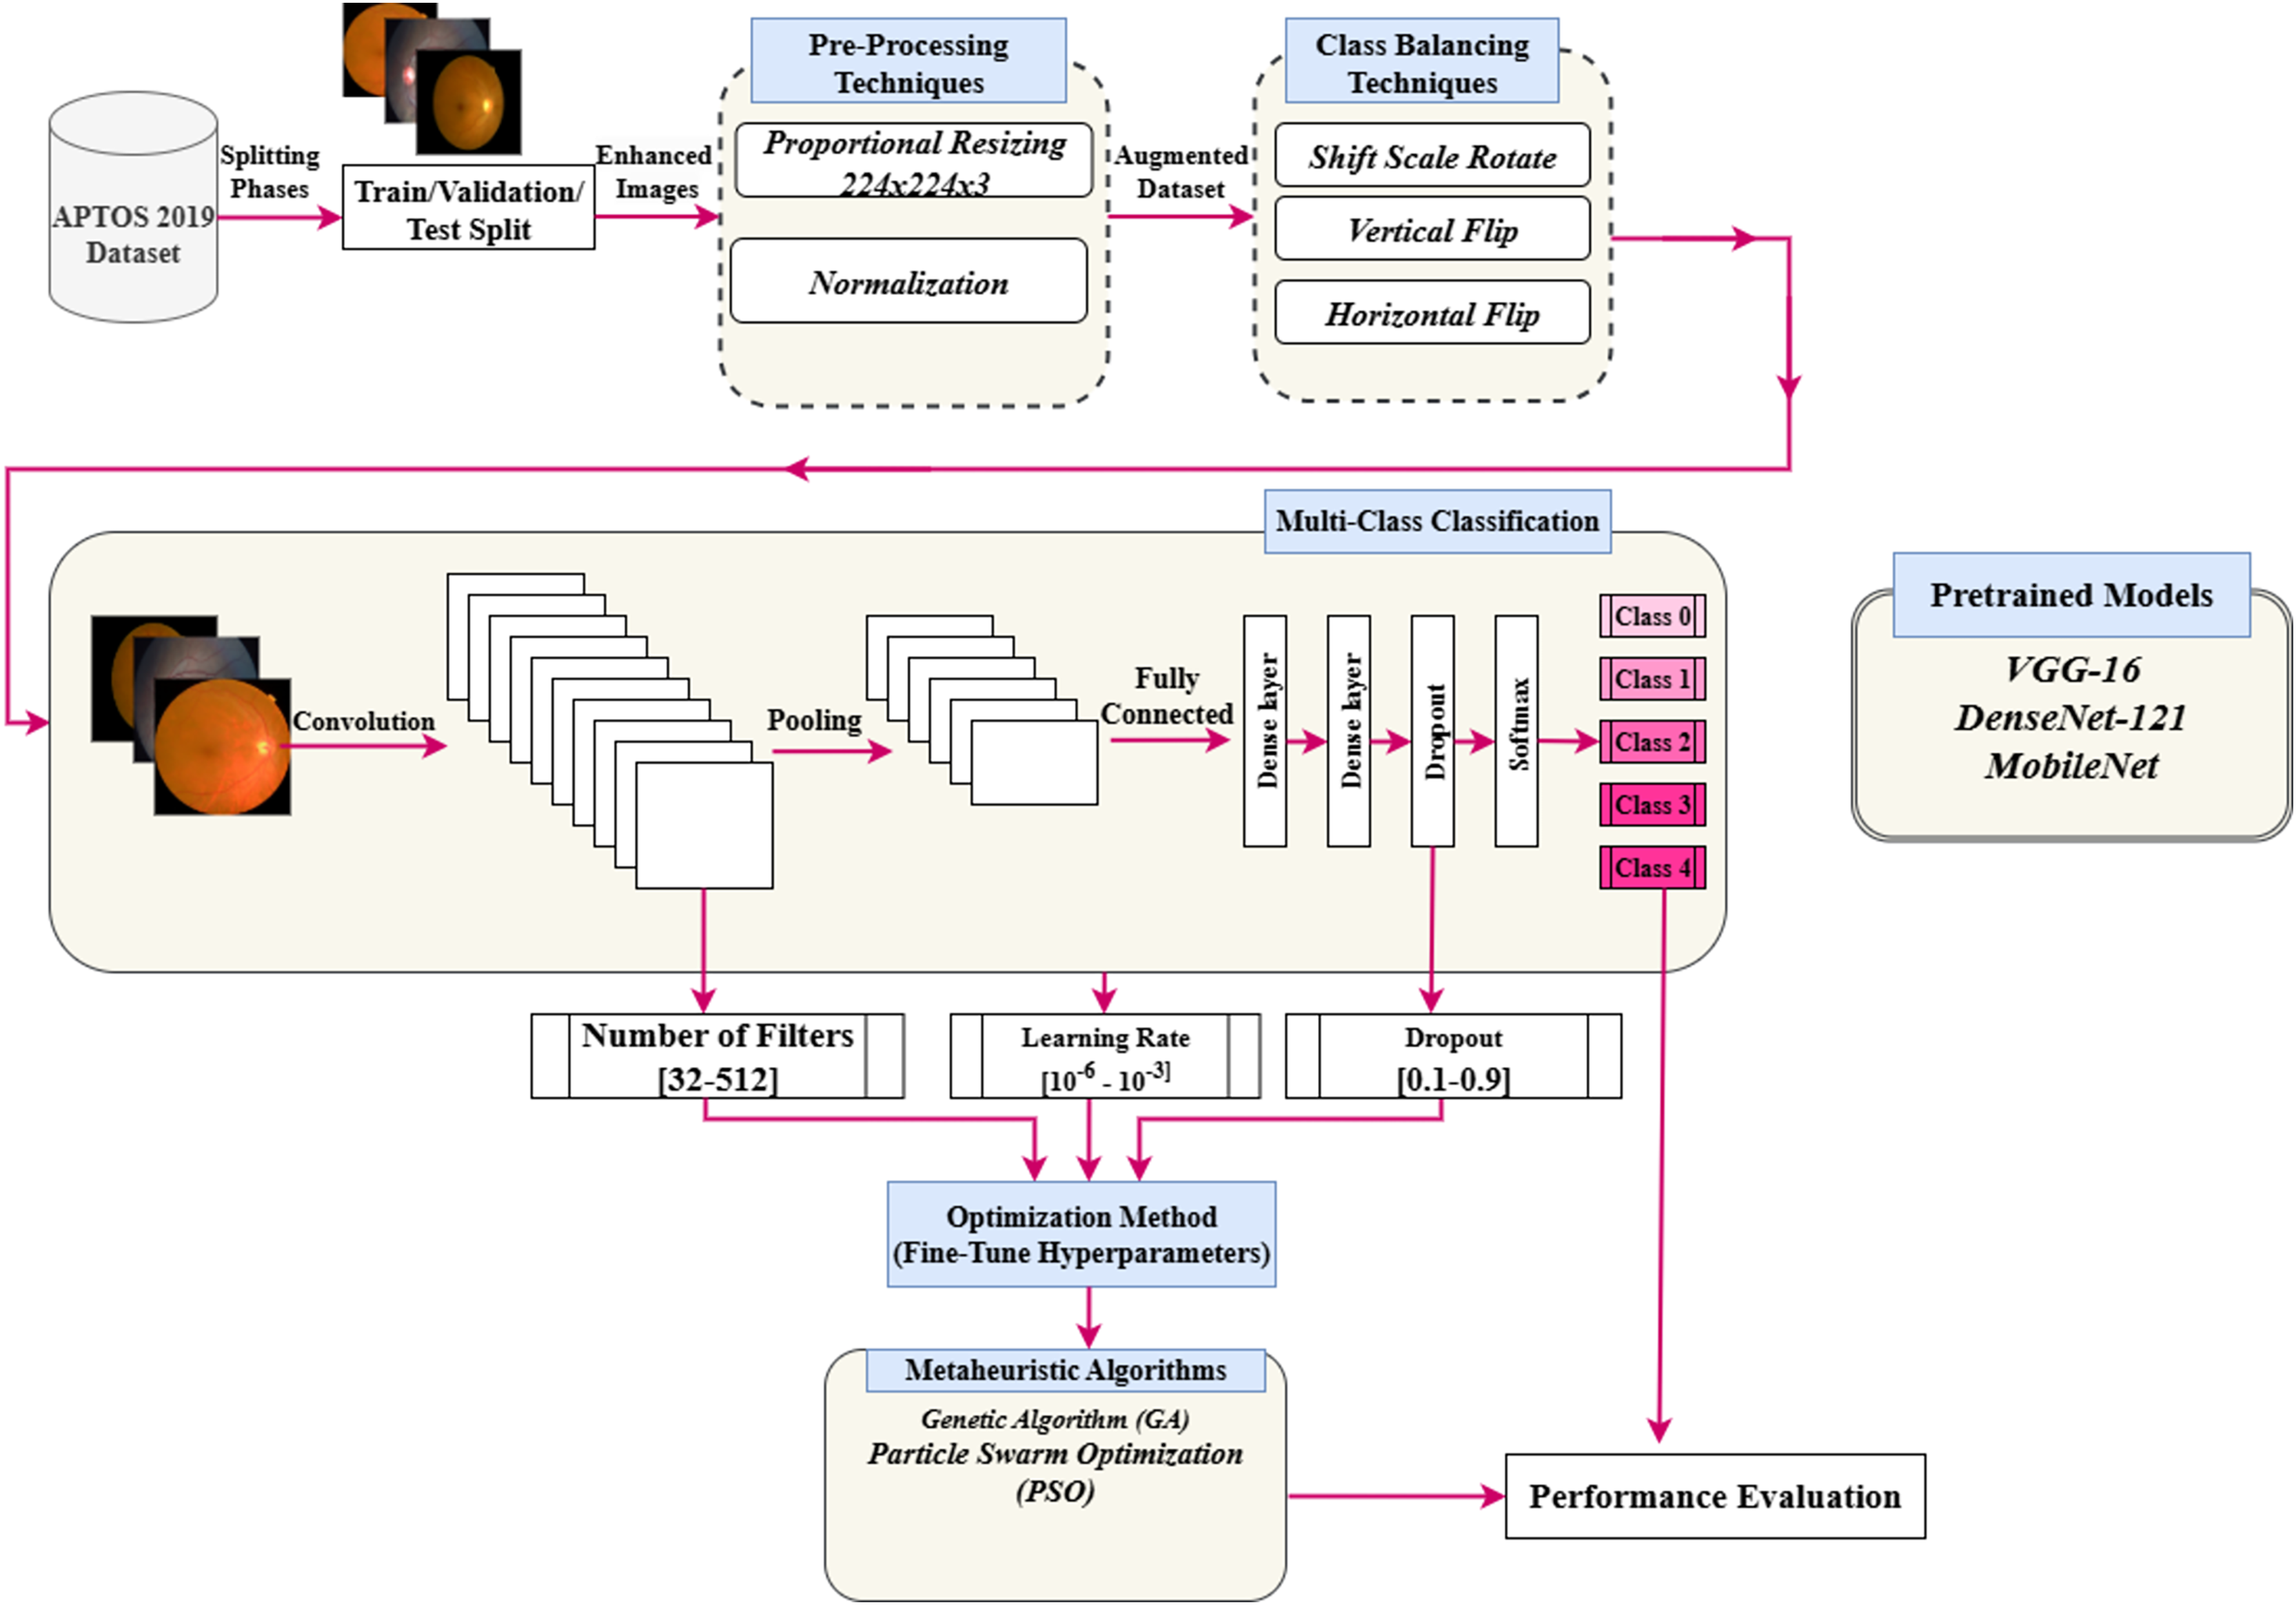
This section presents a detailed approach to enhance the hyperparameters of a pre-trained deep CNN optimized by a PSO algorithm. This approach is used to enhance the classification performance of the DR images. Figure 2 illustrates the suggested framework. The key phases of the framework are preprocessing, data augmentation technique, hyperparameters tuning using the PSO algorithm, and classification task. The main subsections are PSO, pre-trained models, and the proposed hyperparameters tuning using PSO.
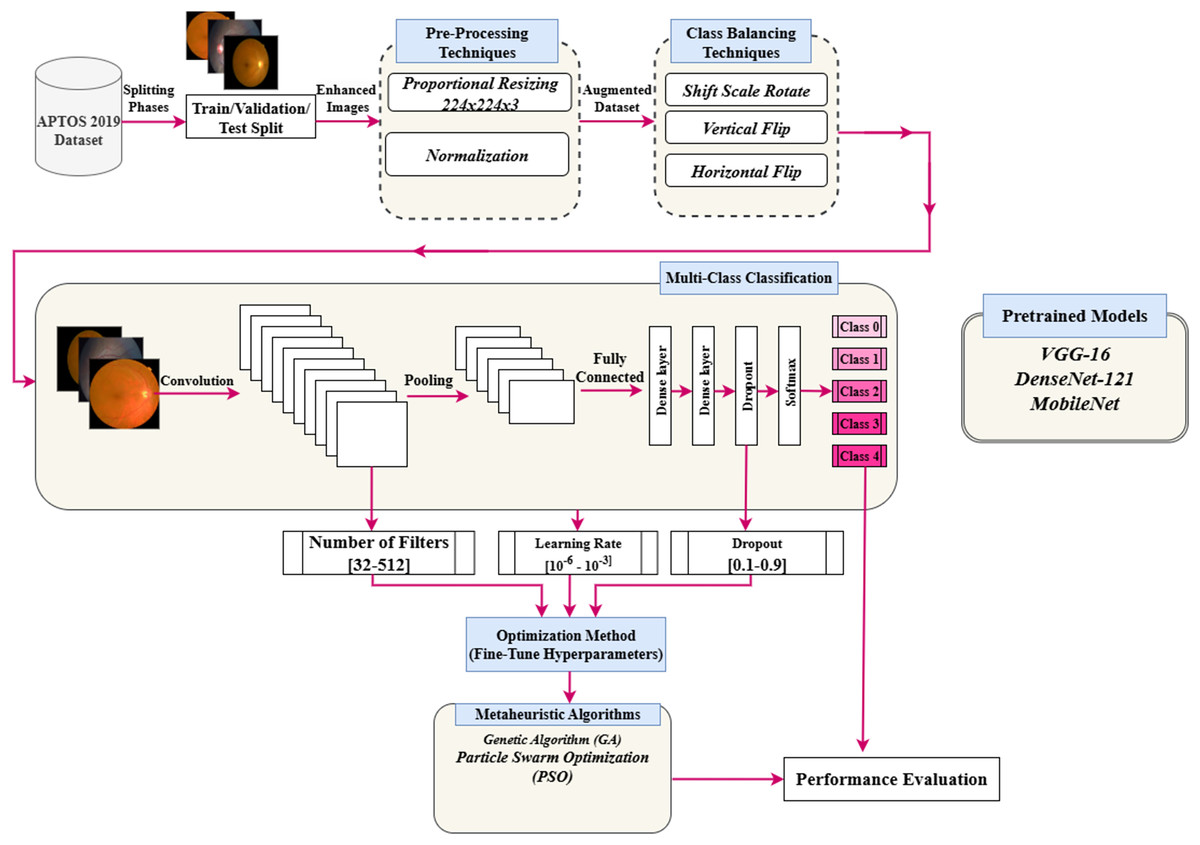
Figure 2: Flowchart of implementation of the research.
Particle swarm optimization algorithm
Kennedy and Eberhart first presented the PSO algorithm in 1995 (Kennedy & Eberhart, 1995). The algorithm’s outcomes are modelled after the gathering of birds and schooling of fish. PSO mimics how birds search for food by relying on the swarm’s collective intelligence. In practice, birds scatter or congregate while searching for food, eventually settling in a specific area where they may find food. Additionally, when birds are moving around looking for food, there is always one with a strong sense of the food’s scent. This indicates that the bird is aware of the probable location of its prey and can effectively communicate with its sources. Together, the birds will fly in the direction of the food source. Since this communication occurs simultaneously, the birds will fly in unison toward the food source. Each member of the swarm or group is referred to as a particle, and the technique is based on mimicking animal behaviour to solve global optimization functions or problems. In PSO, the locations of each particle in the population are updated using two mathematical Eqs. (1) and (2) within the global search space.
(1)
Equation (1) defines the velocity update rule in the PSO algorithm. The velocity of each particle is determined by three components: the inertia term , the cognitive term , and the social term . Here, is the inertia weight controlling momentum from the previous step, while and are acceleration coefficients that determine the influence of the particle’s personal best position and the global best position, respectively. The terms and are random values in the range , introduced to encourage exploration and prevent premature convergence.
In this context, is the current position of particle , is its best-known position so far, and represents the best position discovered by the entire swarm. These velocity updates allow the particle to balance its own experience with that of the swarm, effectively navigating the search space. Once the new velocity is calculated, the particle’s position is updated accordingly. If the velocity remains unchanged, the particle retains its current position. This update process continues iteratively for all particles until a termination condition is met, such as reaching a maximum number of iterations or satisfying a convergence criterion. This iterative update continues until one of the following termination conditions is met:
In the optimal position, the swarm has been moved by a distance smaller than the specified minimum step size, denoted by the symbol .
The fitness value of the particle has grown by a minimum degree than the specified threshold, denoted by the symbol .
The swarm has reached its maximum number of generations .
Based on the above requirements, the first requirement was intended to reduce the number of oscillations resulting from the corresponding solutions. Moreover, the second requirement is achieved in the case of the swarm converging on a coordinate body. As for the optimal result, where the best global position is returned.
Equations (2) and (3) govern the update mechanism of the personal and global best positions in the PSO algorithm. Specifically, Eq. (2) evaluates whether the current particle position outperforms its previous best , and retains the better one as the updated personal best. Subsequently, Eq.(3) selects the global best by identifying the particle with the highest fitness among all personal best positions in the swarm. This update mechanism ensures that the algorithm continuously tracks the most promising solutions during optimization.
(2)
(3) where .
Pre-trained CNN architectures
A significant challenge in medical image classification is its dependence on data. Due to the uniqueness of medical imaging, access to medical data for research purposes can sometimes be limited. Nevertheless, overfitting may influence experimental results when training DNN designs, such as CNNs, with inadequate data. This study presents transfer learning as an outcome. DL employs a technique known as transfer learning, which involves the transfer of knowledge from one expert to another. By leveraging the similarities across data, tasks, or models like ImageNet, this technique leverages information from one domain (the source domain) to enhance learning in another domain (the target domain). The point of this study was to show the efficacy pre-trained models (VGG16, DenseNet121, and MobileNetV2) and metaheuristic algorithms can improve CNN models’ hyperparameters for classifying DR fundus images and finding DR early on.
VGG16 model
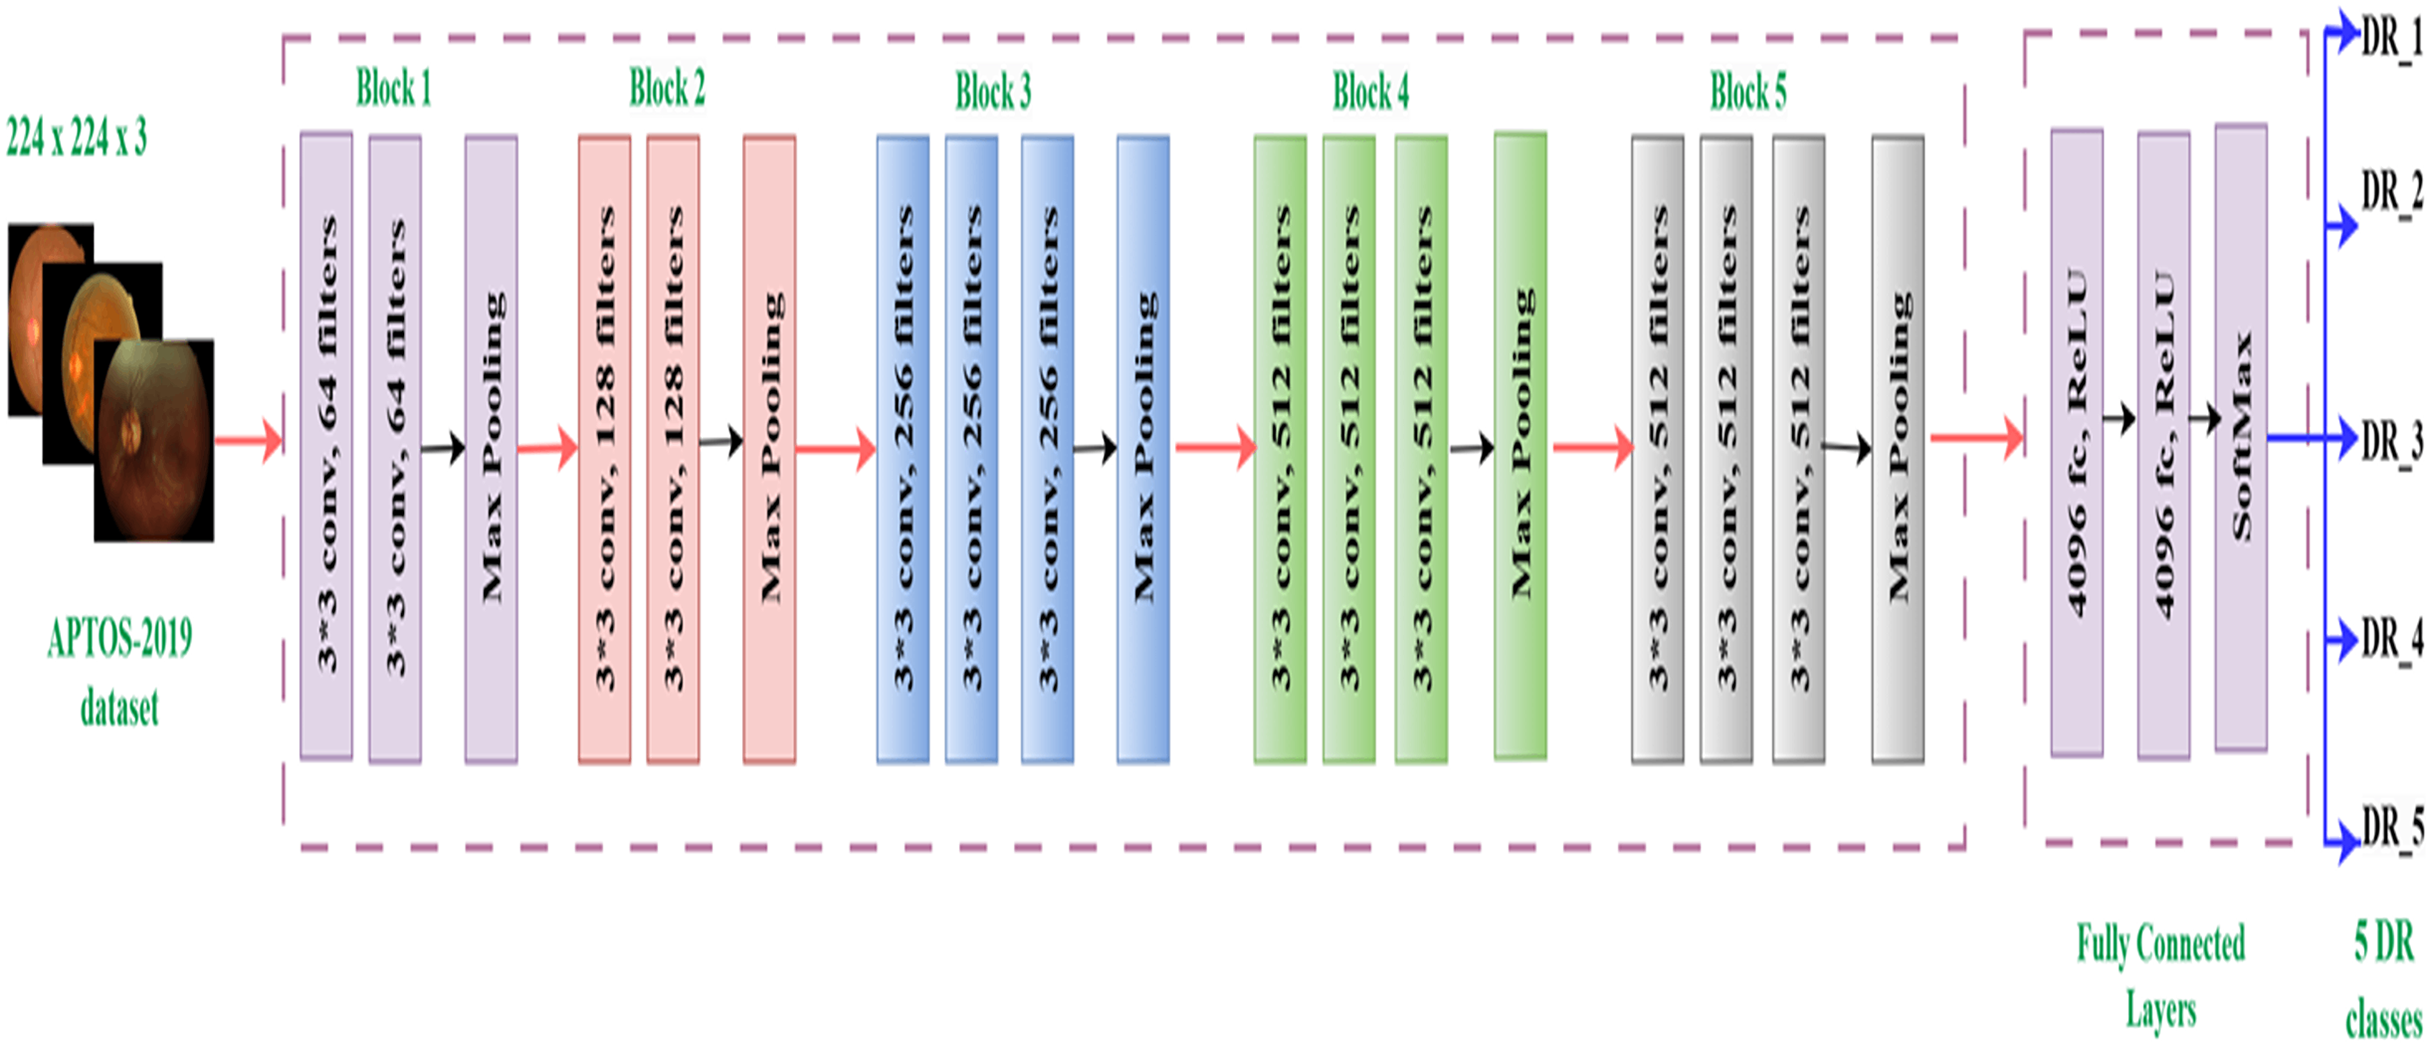
The Visual Geometry Group (VGG16) model, developed by Simonyan & Zisserman (2014), is a CNN with 16 layers and a total of 138,355,752 parameters. The architecture has 13 convolutional layers and three fully linked layers, all of which employ ReLU activation. The design streamlines previous methodologies by employing many 3 3 filters instead of larger kernels. The VGG16 model applies a sequence of convolutional layers to 224 224 RGB images. Max pooling layers follow these layers, which include progressively increasing numbers of filters (64, 128, 256, and 512). Three completely linked layers, each containing 4,096, 4,096, and 1,000 neurons, compose the network. Despite its high processing cost, this complex design has demonstrated significant efficacy in image recognition tasks, rendering it a widely favored option for diverse applications (Albashish, 2022), such as our investigation on diabetic retinopathy categorization. Figure 3 displays the architecture of the basic VGG16 (Simonyan & Zisserman, 2014).
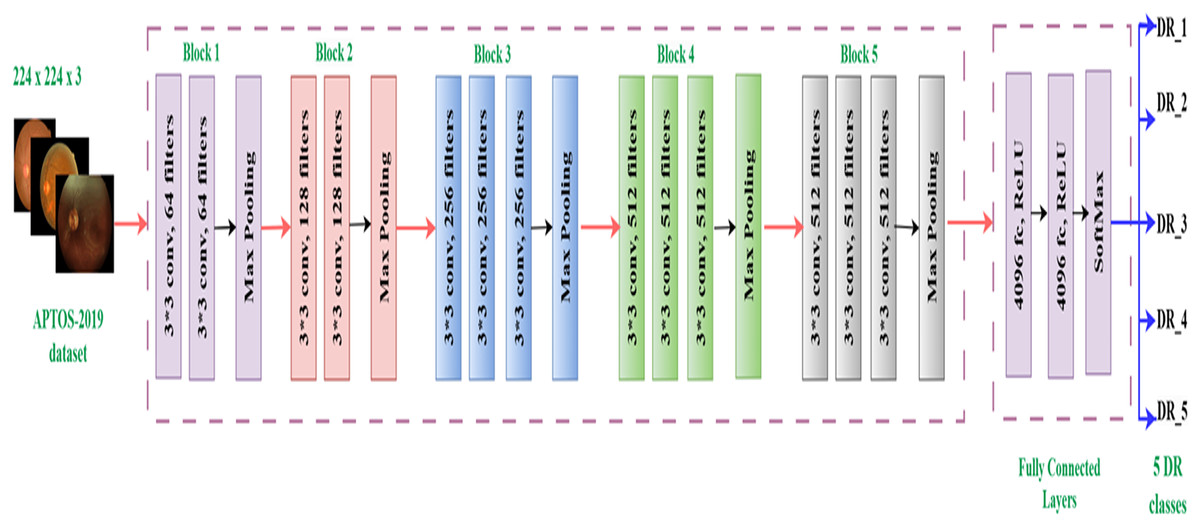
Figure 3: VGG16 architecture.
DenseNet-121 model
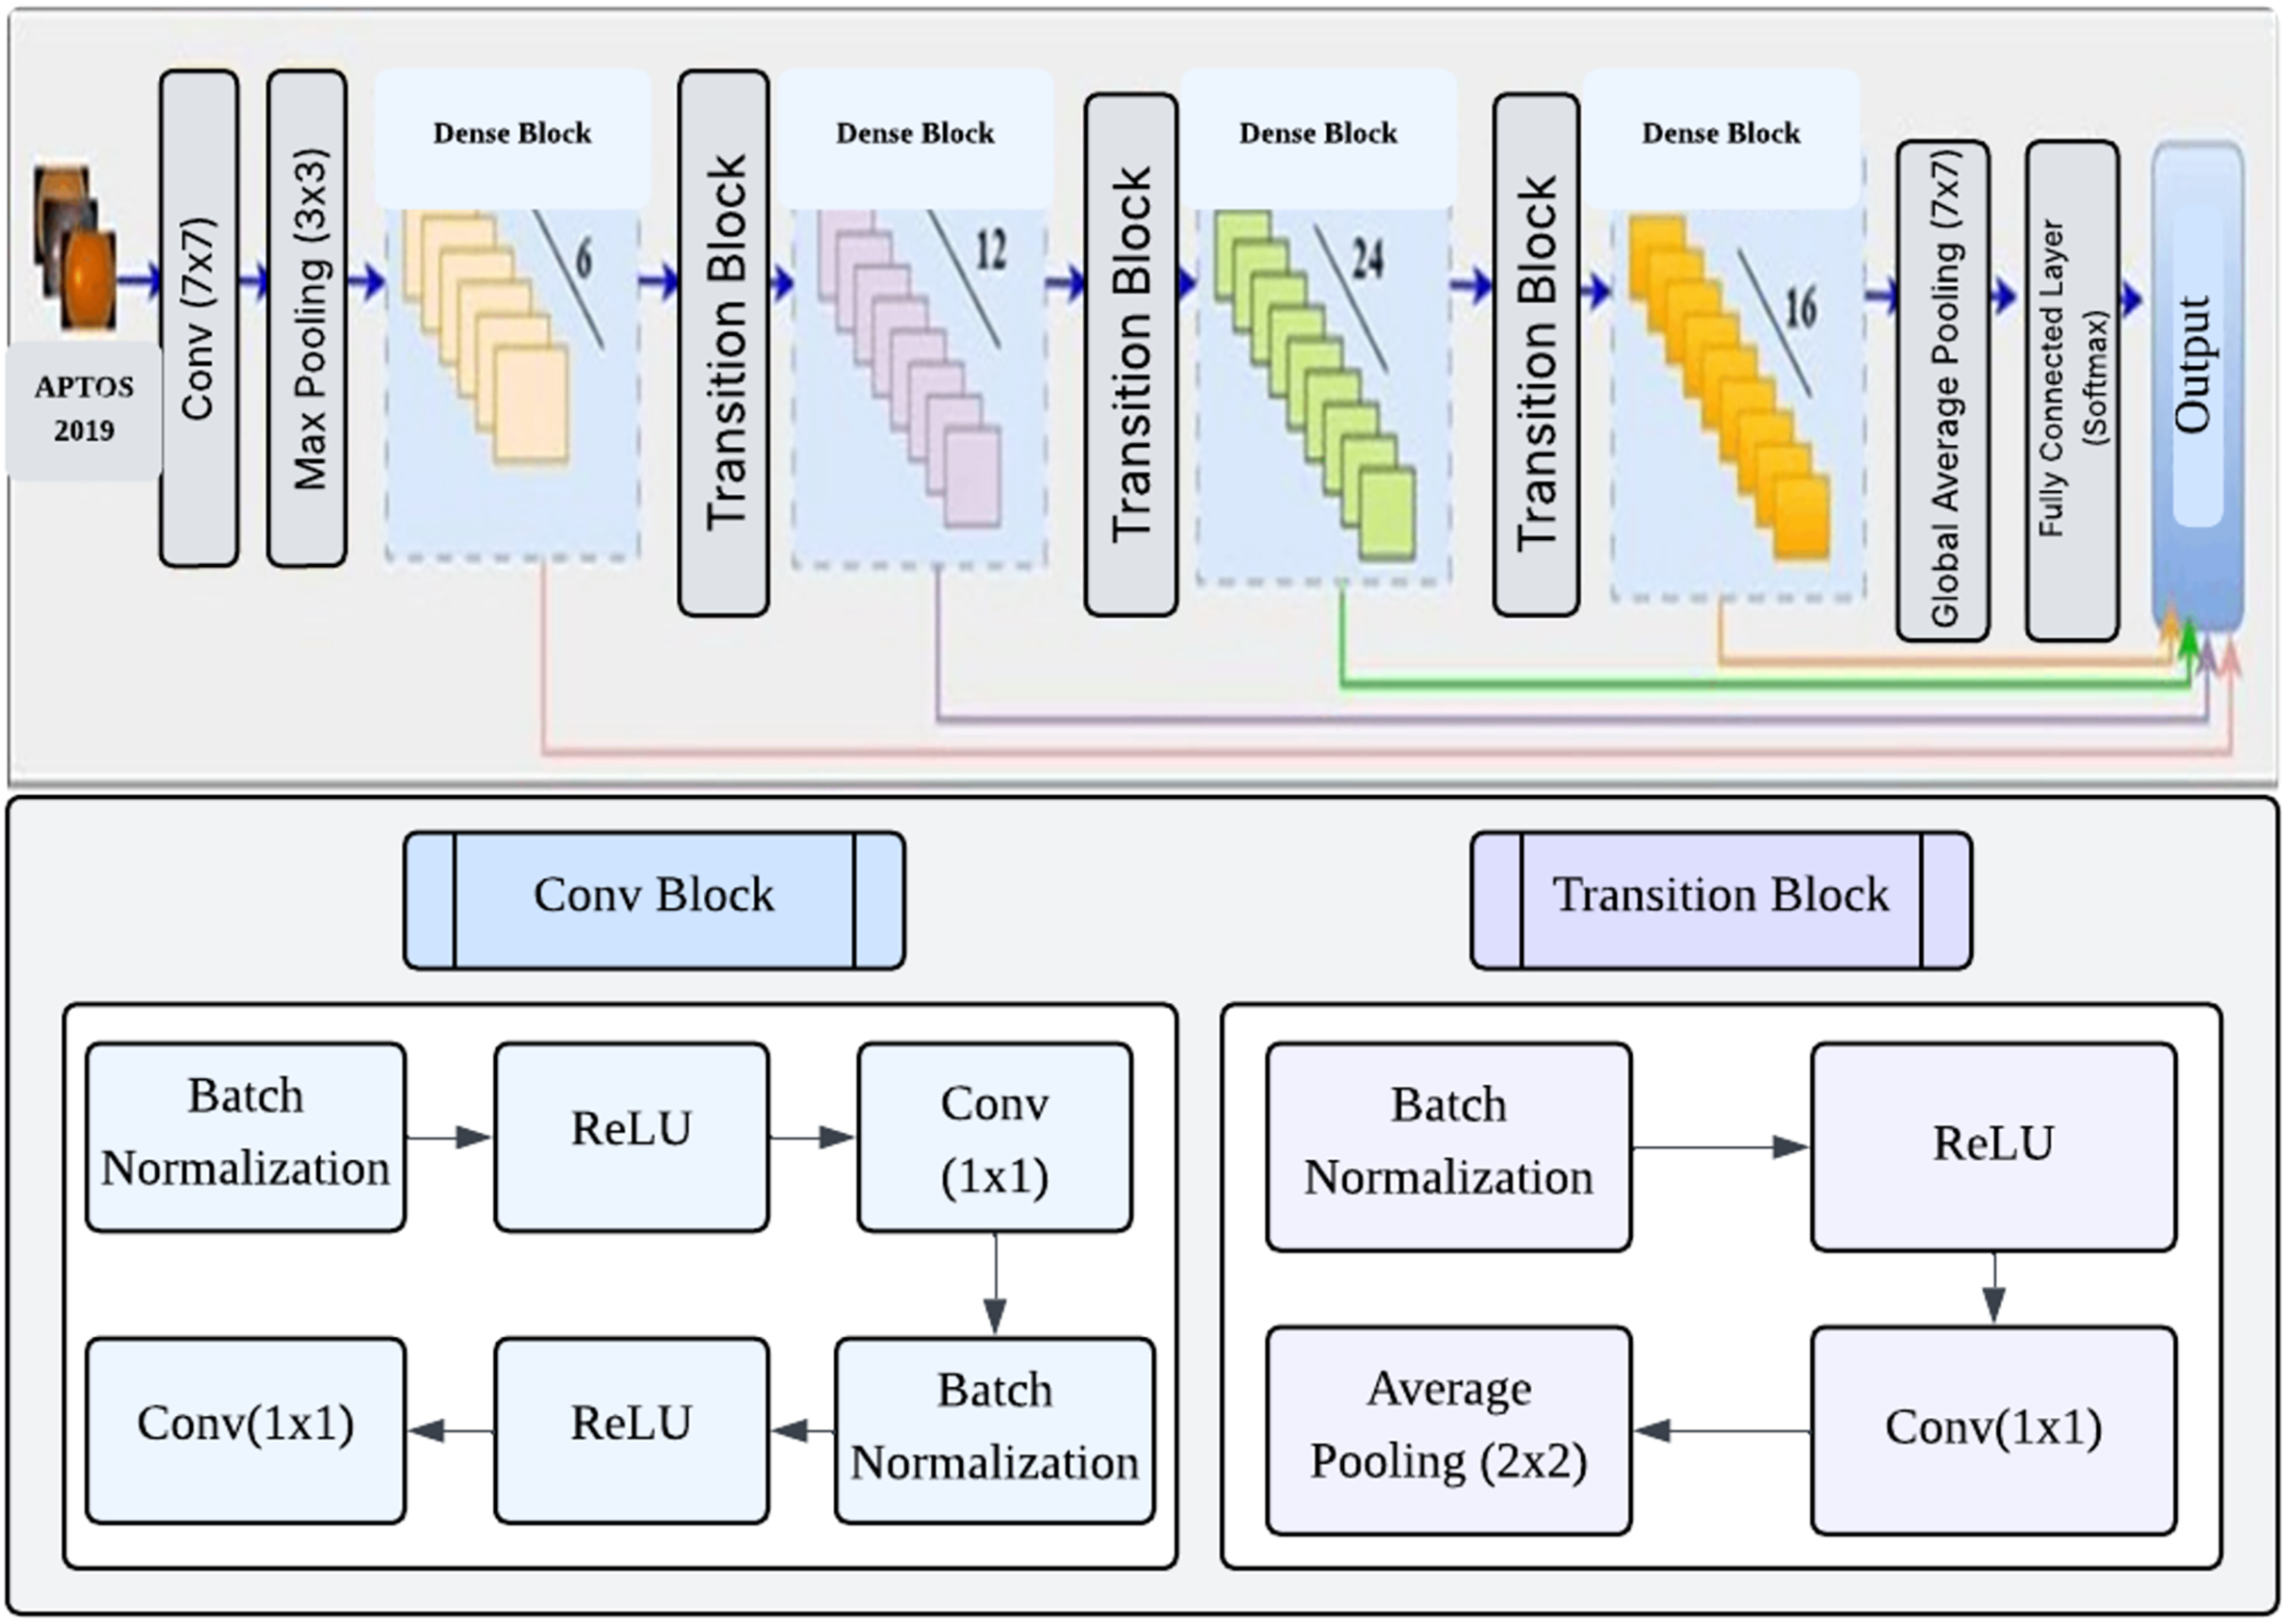
DenseNet (Huang et al., 2017) is a convolutional network design that enhances typical CNNs by establishing dense connections between each layer and every other layer in a feed-forward manner. A dense network with L layers has a total of direct connections. These connections let each layer receive feature maps from all previous layers and contribute its own feature maps to all subsequent layers. This approach facilitates enhanced information dissemination, the reuse of features, and the optimization of parameters (Huang et al., 2017). DenseNet121 is a specific implementation consisting of four dense blocks, with each block containing 6, 12, 24, and 16 convolution blocks, respectively. Each convolution block consists of two convolution layers, each measuring 1 1 and the other 3 3. The transition layers that separate the dense blocks include a 1 1 convolution layer and a 2 2 average pooling layer. The network begins with a 7 7 convolutional layer and ends with a fully linked layer for classification. The network starts with a 7 7 convolutional layer and concludes with a fully connected classification layer, resulting in a total of 121 layers. The approach has several benefits, such as reduced parameter count, faster training, and the capability to utilize all feature maps in the network for classification decisions (Tan et al., 2018). Figure 4 shows the architecture of the DenseNet121 network.
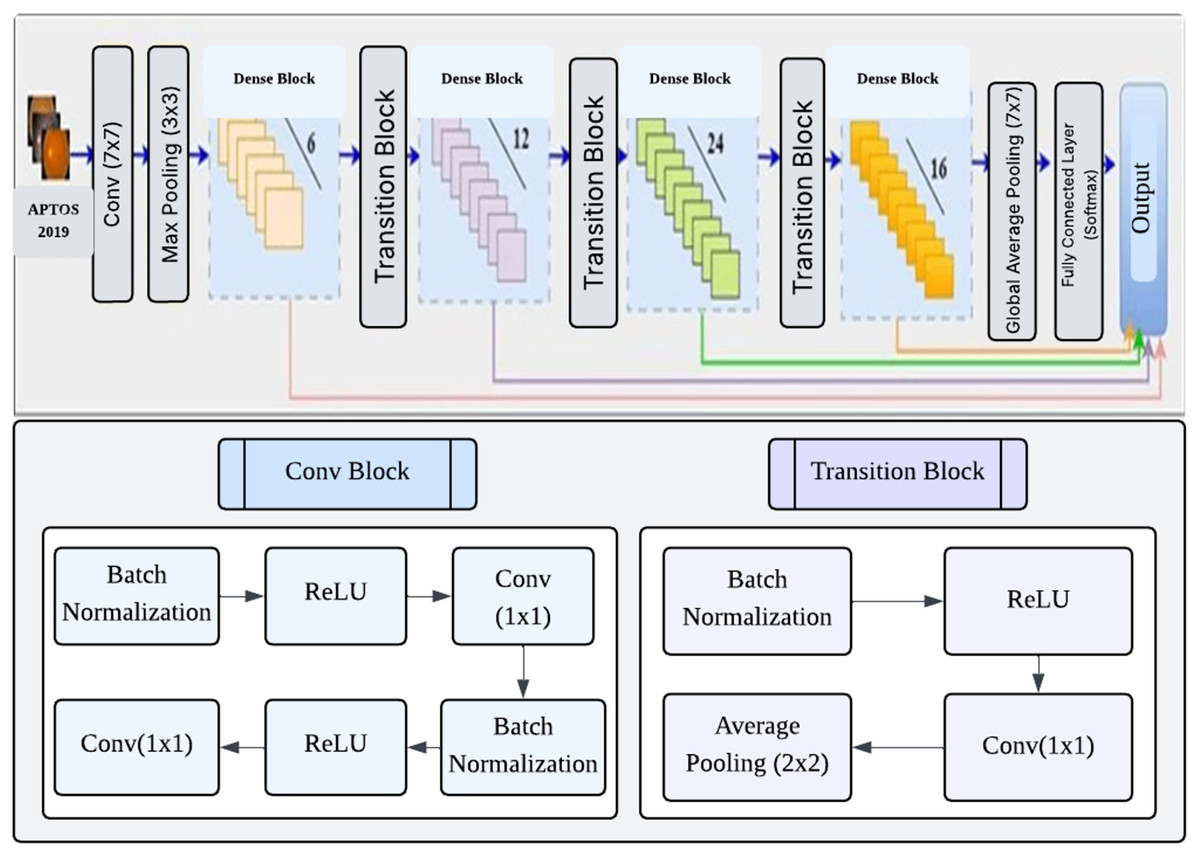
Figure 4: Architecture DenseNet121.
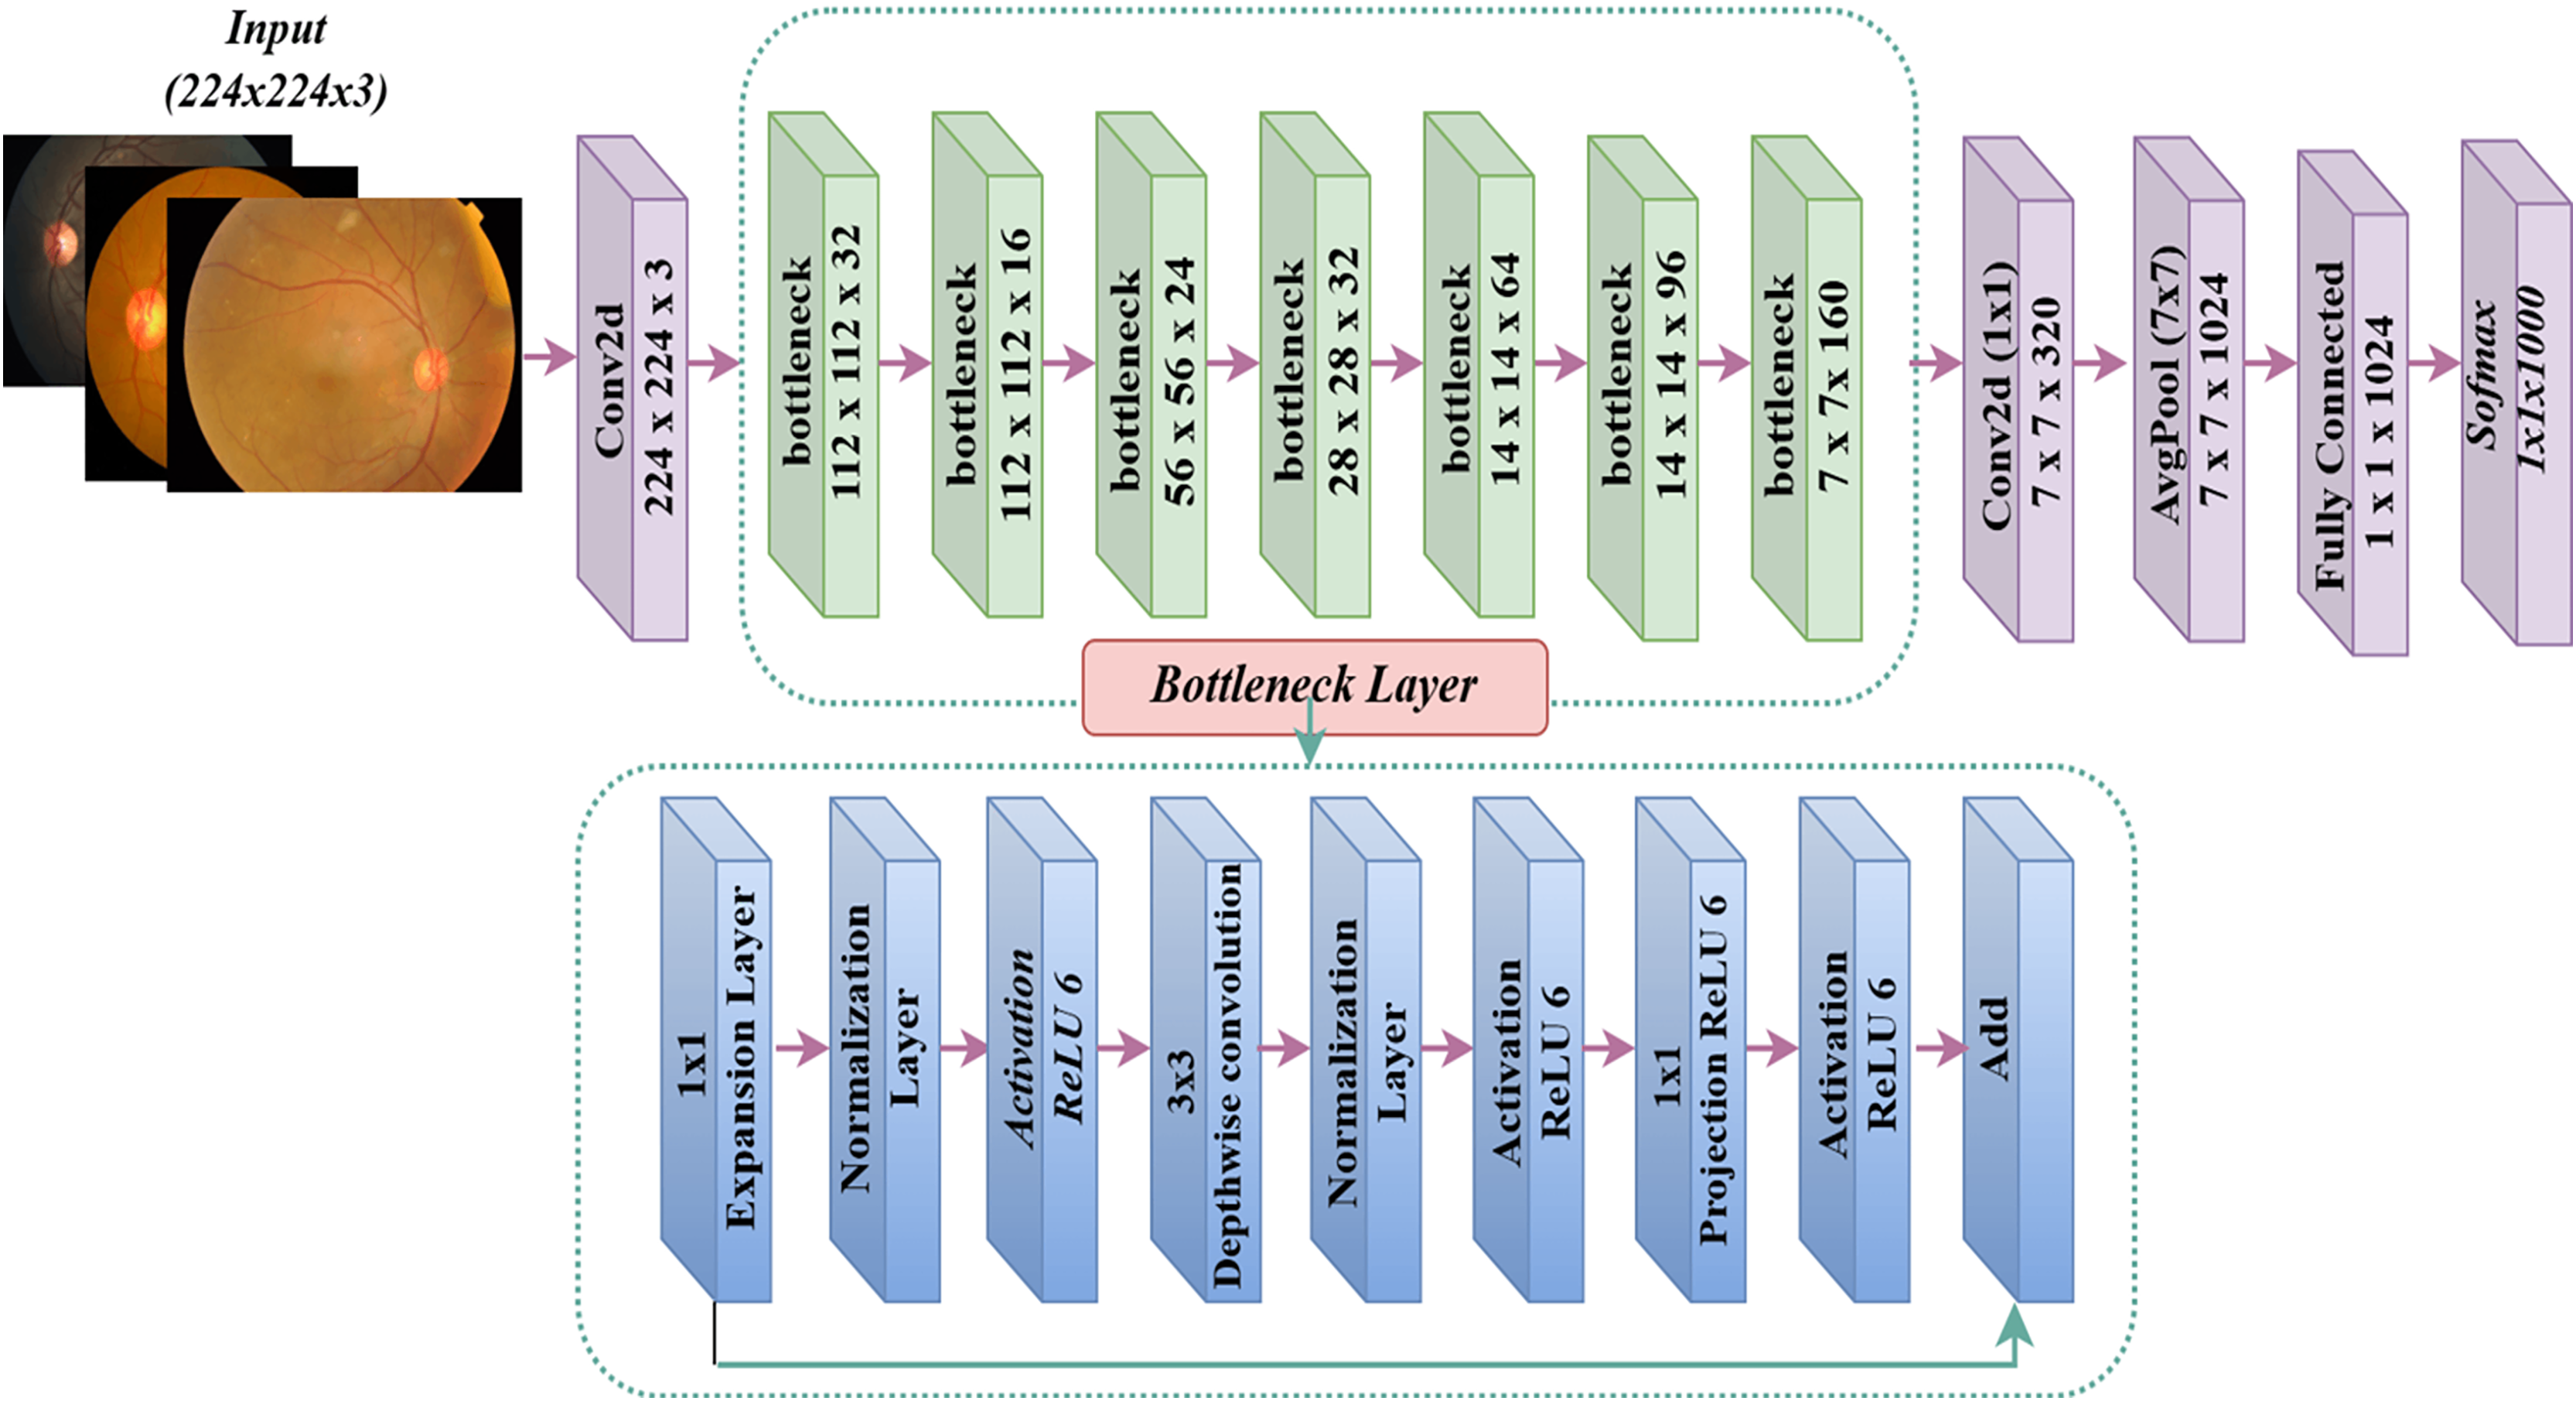
MobileNet model
Google introduced MobileNet (Howard, 2017), a deep learning framework designed exclusively for mobile devices. The exceptional computational performance and small dimensions of MobileNet set it apart. The MobileNet architecture may attain exceptional accuracy rates with a restricted number of hyperparameters (Khudaier & Radhi, 2024). The design predominantly depends on depth-wise separable convolution. The design has 32 initial convolution layers, followed by 19 bottleneck layers. Figure 5 displays the MobileNetV2 model. The conventional 2D convolution performs simultaneous processing of all input channels to generate a solitary output channel while also convolving across the depth dimension (channel). Conversely, depthwise convolution partitions the input image and filters it into distinct channels, subsequently conducting convolution on each input channel using its corresponding filter channel. After generating the filtered output channels, we combine them to form a stack. Separable depthwise convolution is a process in which the stacked output channels are filtered using a 1 1 convolution, also known as pointwise convolution, to merge them into a single channel.
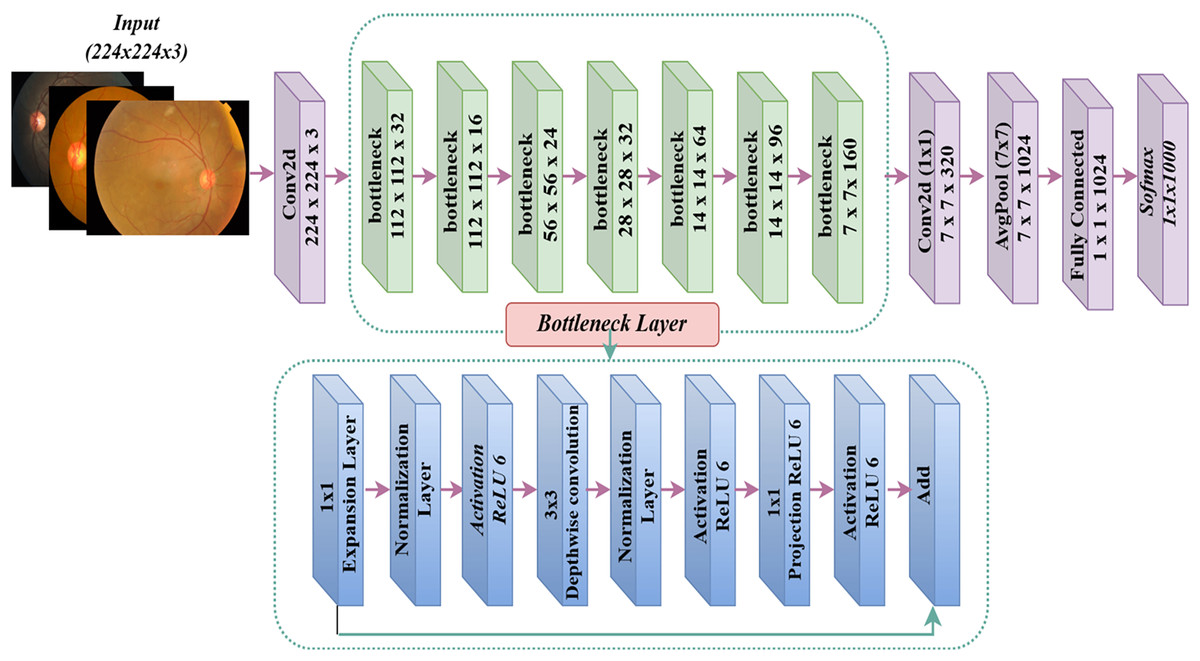
Figure 5: MobileNetV2 architecture.
CNN hyper-parameter optimization using PSO
A CNN’s hyperparameters are critical parameters established before model training, regulating the learning process and influencing performance. Thus, this research seeks to design a method to optimise the pre-trained models’ hyperparameters, i.e., VGG-16, DenseNet121, and MobileNetV2. In particular, the performance of the pre-trained models is marginally dependent on their hyperparameters, which remain a substantial obstacle in building pre-trained models.
This section focuses on tuning hyper-parameters in pre-trained CNN models to categorize DR images. The system utilizes a sophisticated metaheuristic approach known as the PSO algorithm. The primary objective is to identify the critical hyperparameters that significantly impact the performance of pre-trained models such as VGG-16, DenseNet121, and MobileNetV2. The PSO approach is used to find the ideal values for these parameters.
A key part of improving CNN models’ performance is the PSO algorithm, which changes important hyperparameters like the number of filters in convolutional layers, the learning rate, and the dropout rate in fully connected layers. By manipulating the number of filters, PSO enhances the ability of convolutional layers to capture intricate information in images. Additionally, by optimizing the dropout and learning rates, PSO improves the performance of fully connected layers during training, resulting in enhanced accuracy of the outcomes. These improvements boost the efficiency of feature extraction, mitigate overfitting, and facilitate successful learning of the model. Collectively, these changes result in a more robust and accurate model, which is particularly crucial for complex tasks in DR classification. The experimental findings provide substantial enhancements in accuracy and other performance measures, highlighting the critical role of PSO in improving the overall performance of CNN.
The conducted experiment compared VGG-16, DenseNet121, and MobileNetV2 to see how well they worked before and after PSO was added. Given that variations in CNN hyperparameters can lead to notable disparities in outcomes for identical tasks, we aim to ascertain these models’ most optimal hyperparameter configurations. Prior research and empirical evidence informed the selection of these hyperparameters, demonstrating their substantial influence on the model’s performance in tasks involving categorizing medical images. This study aimed to optimize three factors in dense layers: the number of filters, the incidence of dropouts, and the learning rate. Increasing the number of filters in CNNs improves the extraction of features and maintains a balance between model complexity and performance. This ensures that the model can effectively adapt to various datasets and efficiently utilize computing resources. Furthermore, choosing an optimal learning rate is critical because it directly impacts the pace at which training algorithms converge. A learning rate that is too little may lead to delayed convergence, while a rate that is too great may introduce instability. Applying an adequate dropout rate is critical for CNN regularization because it promotes model generalization and mitigates overfitting.
The objective is to utilize the PSO technique to enhance the efficiency and precision of pre-trained models in tasks related to DR categorization. This optimization approach aims to significantly improve the models’ performance, providing essential insights into the most optimal CNN hyper-parameter configurations within this domain.
Algorithm 1 provides a detailed elucidation of the PSO technique and its implementation in the methodology. The function g: represents an objective function derived from the given method. In this case, stands for the hyper-parameters and for the fitness function that checks how well the trained VGG-16, DenseNet121, and MobileNetV2 models can classify things. The study’s objective is to find a solution that satisfies the condition , where represents the whole set of potential hyper-parameter configurations.
| Require: Objective function , Hyperparameters h, Fitness function f |
| Ensure: Optimal solution |
| 1: Input: Pre-trained CNN models (VGG16, DenseNet121, MobileNetV2), Training and validation datasets |
| 2: Output: Optimized CNN model and best hyperparameters |
| 3: Initialize PSO parameters (swarm population size, maximum iterations, w, c1, c2) |
| 4: Randomly set particles into the search space |
| 5: Randomly set particle velocities |
| 6: Randomly set best particle positions and fitness values |
| 7: Define search space for hyperparameters: |
| 8: - Number of filters: |
| 9: - Dropout rate: |
| 10: - Learning rate: |
| 11: for each iteration t do |
| 12: for each particle x in swarm do |
| 13: Construct a new model based on the current particle position |
| 14: |
| 15: if loss fitness then |
| 16: Update personal best position and fitness |
| 17: end if |
| 18: if loss fitness then |
| 19: Update global best position and fitness |
| 20: end if |
| 21: Update the particle position |
| 22: end for |
| 23: end for |
| 24: Update the global best position as the best hyperparameters for CNN models |
| 25: Train the pretrained CNN models with the optimized hyperparameters on the dataset |
| 26: Test the trained CNN on a test dataset |
PSO employs a swarm of particles to facilitate the evolution process, with each particle representing a potential solution, namely a collection of hyper-parameter values. Each particle inside the swarm is characterized by its position within the search space, and its velocity, which determines its movement, denotes the most optimal location attained by any particle there. In contrast, it represents the best site acquired by the particle individually. This study suggests a PSO technique that is not dependent on the specific architecture of the CNN under optimization, and it could be employed in any suggested CNN model. The proposed PSO approach consists of two essential processes: “Swarm Initialization” and “Swarm Evaluation.
Initialization of the swarm
There are n dimensions of search space, and the starting point of each particle is shown as . It is chosen at random from a uniform distribution , and are the lower and upper limits for the hyperparameters. The starting location of each particle is defined as its own best-known position, denoted by . If the fitness value is greater than the fitness value of the swarm’s current best global position, then is recorded as the new global best position for the swarm, which is represented as S. We randomly select the particle’s starting velocity from a uniform distribution, ensuring it still meets the hyperparameter restrictions. Once initialized, the swarm consists of s particles, each represented as a tuple . These particles then undergo evolutionary processes.
Evaluation of the swarm
During each generation (denoted as gen, where specifies the maximum number of generations), the velocity values of all particles in the swarm are updated using the Eq. (1). It is worth noting that there is a relationship between specifying a certain number of hyper-parameters and the efficiency of the PSO algorithm, which is expressed as follows:
(4)
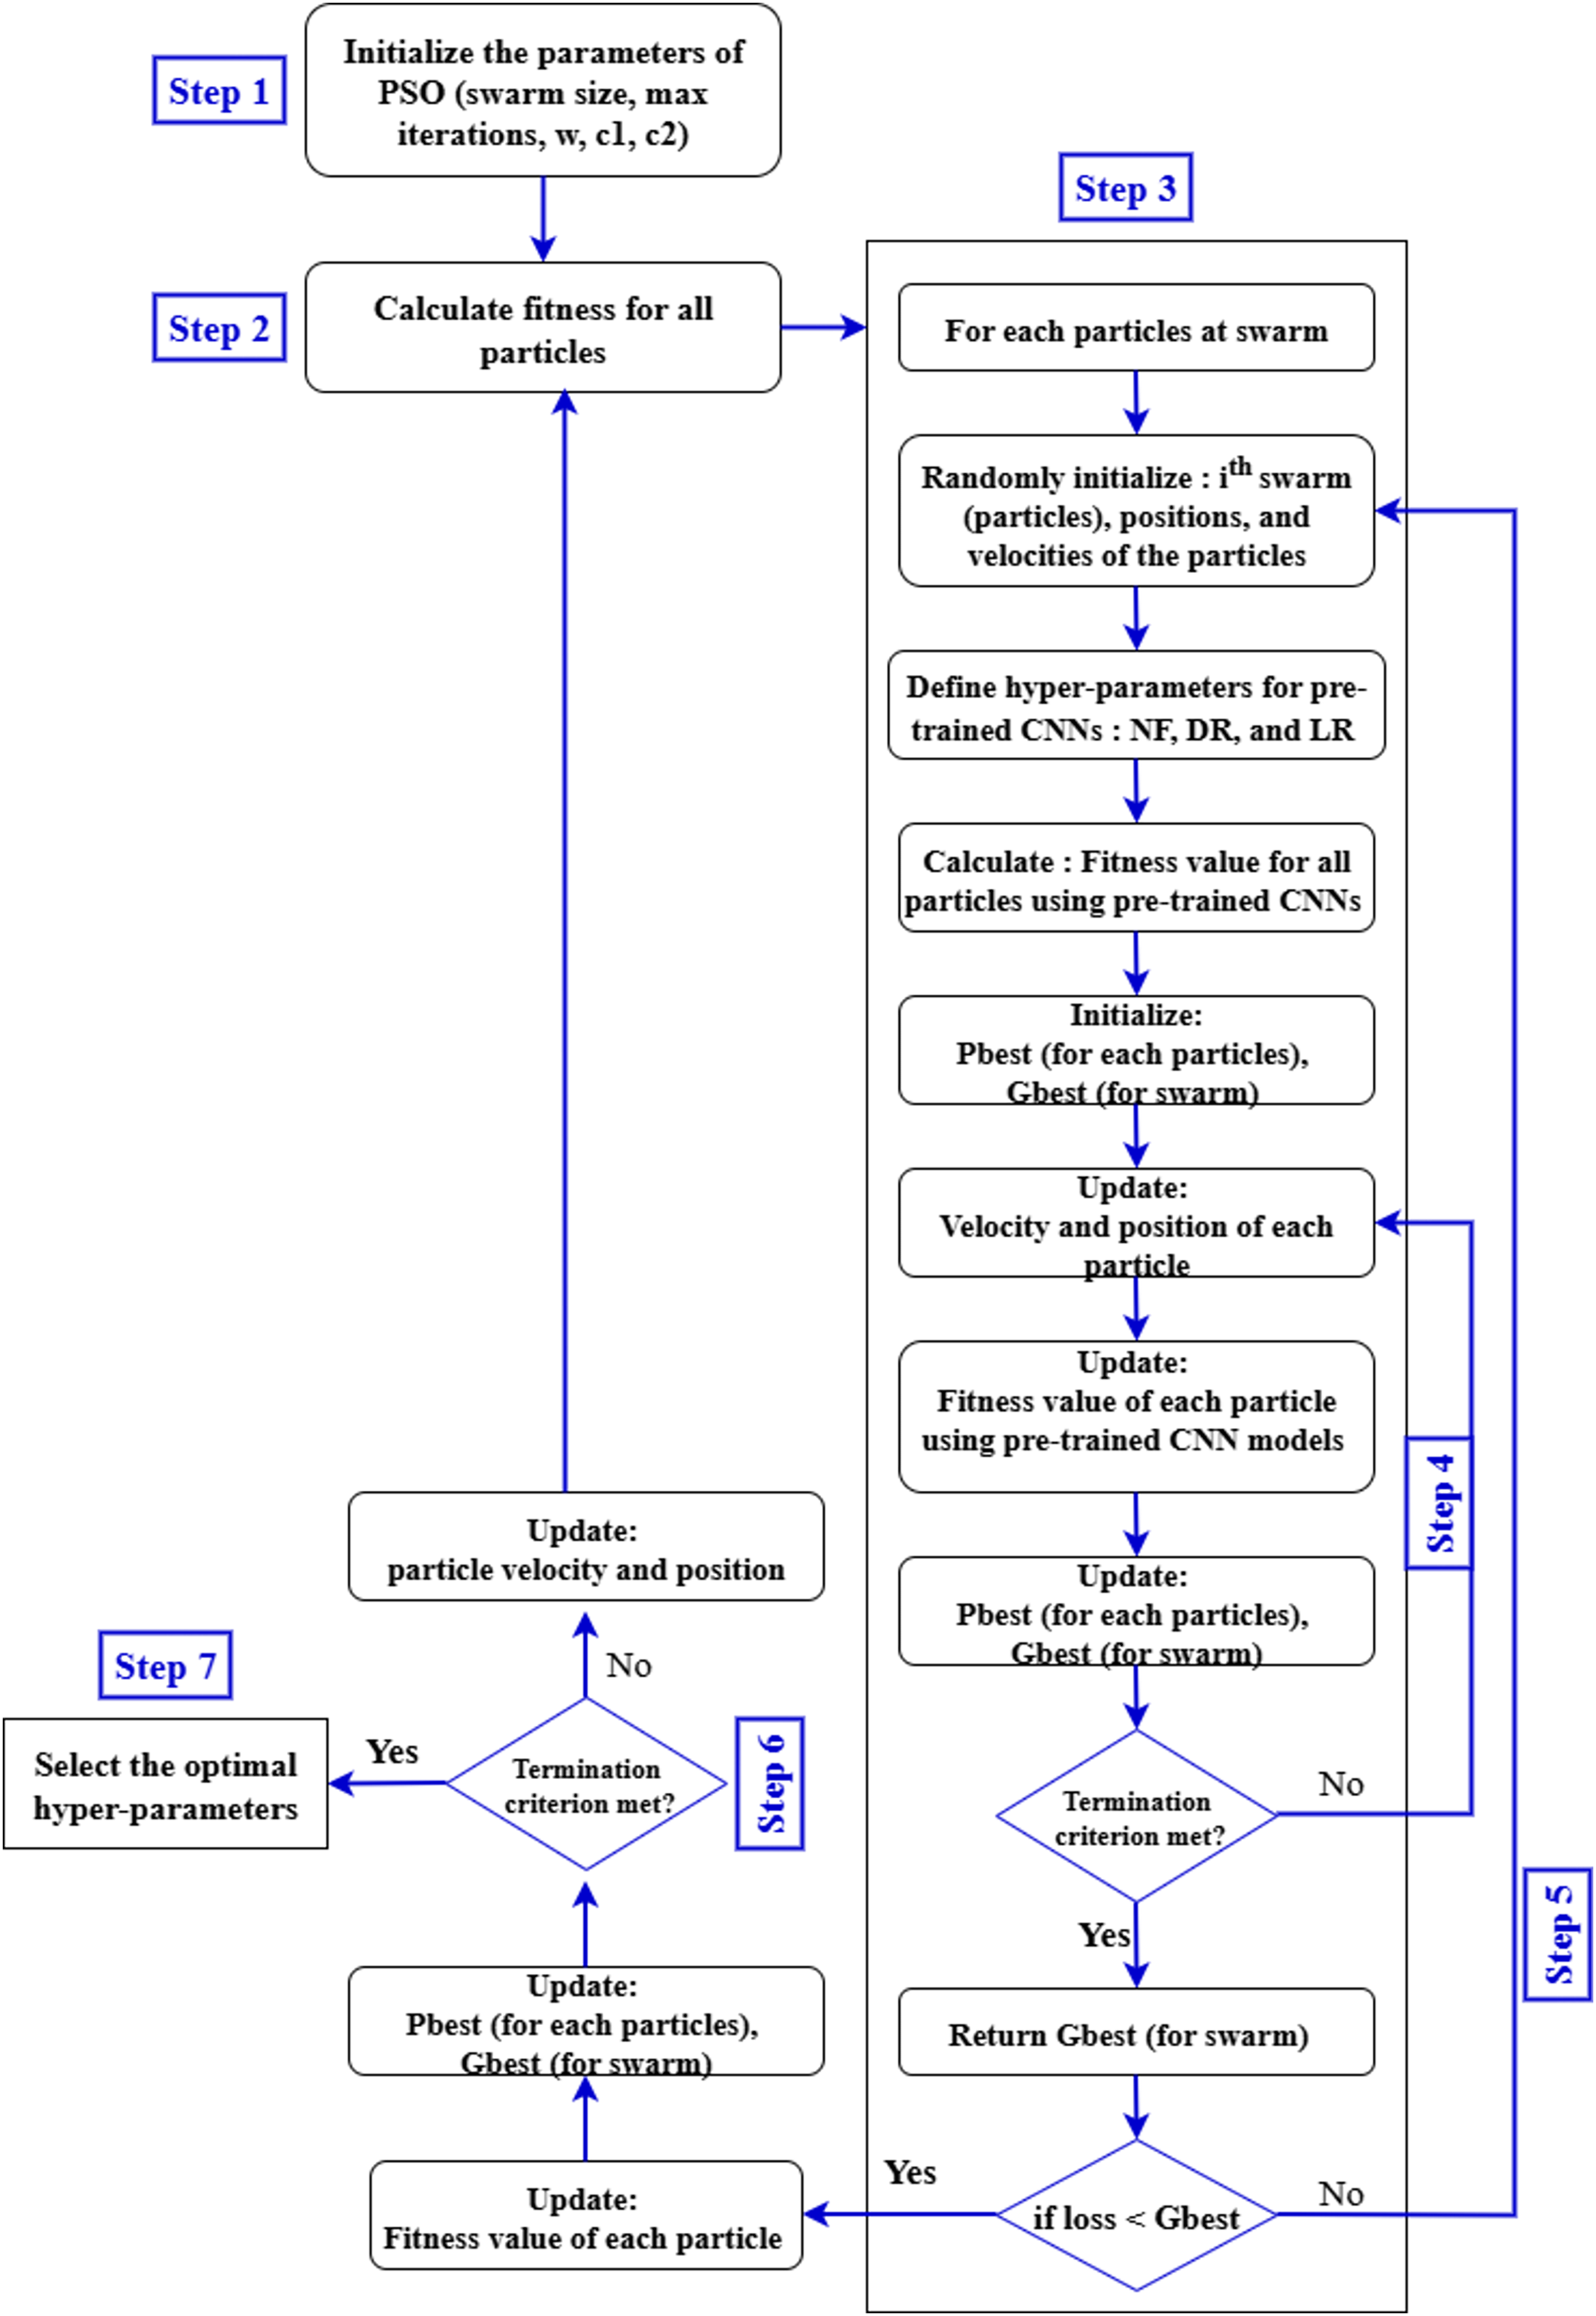
Equation (4) expresses the time complexity of the PSO algorithm as a product of three factors. Here, TPSO represents the total computational cost. The term S refers to the number of particles in the swarm, is the time required to evaluate the fitness function for a given set of hyperparameters , and denotes the maximum number of generations. Since each particle evaluates the fitness function in every generation, the total time increases proportionally with the number of particles and generations. Therefore, this equation provides a simple way to estimate the computational effort required by the PSO algorithm when tuning multiple hyperparameters. This estimation is essential for evaluating the scalability and computational feasibility of PSO in real-world hyperparameter tuning tasks. The general structure of the steps involved in optimizing the hyperparameters of pre-trained CNN models using the PSO algorithm is illustrated in Fig. 6.
-
•
Input database for pre-trained CNN models training: In this stage, the APTOS 2019 dataset to be analyzed and classified by VGG-16, DenseNet121, and MobileNetV2 is selected. It is crucial to ensure that all components of the dataset have the same pixel size, file format, and consistent structure.
-
•
Generate the particle population for the PSO algorithm: A PSO algorithm is initialized with specific numerical parameters such as number of iterations, number of particles, inertia weight, cognitive constant (C1), and social constant (C2). Table 2 defines the PSO parameters that were employed during the experiment.
-
•
Configure the pre-trained CNN models architectures: The VGG-16, DenseNet121, and MobileNetV2 architectures are created using the PSO-optimized hyperparameters (number of filters, dropout, and learning rate) and other parameters specified in Table 2.
-
•
Validation and training of pre-trained CNNs architectures: In this stage, the VGG-16, DenseNet121, and MobileNetV2 models read and process the input databases, collect images for training and validation, and generate classification accuracy rates. These values are returned by the objective function to the PSO algorithm.
-
•
Evaluate the objective function: In this step, the PSO algorithm performs an evaluation of the objective function through the equation below to obtain appropriate parameters: (5) In Eq. (6), the particle’s position is updated by adding the newly computed velocity to its current position, enabling exploration of the search space.
-
•
Update the PSO parameters: At each iteration, each particle in the PSO updates its speed and position based on its personal best position (Pbest) in the search space, and the global best position (Gbest) of the swarm as a whole.
-
•
Repeat the process: In our study, the number of repetitions is considered a criterion for stopping. The process continues until all particles are evaluated and the specified stopping conditions are achieved.
-
•
Select the best solution: In this phase, the particle with the global best position (Gbest) represents the best solution for the VGG-16, DenseNet121, and MobileNetV2 models.
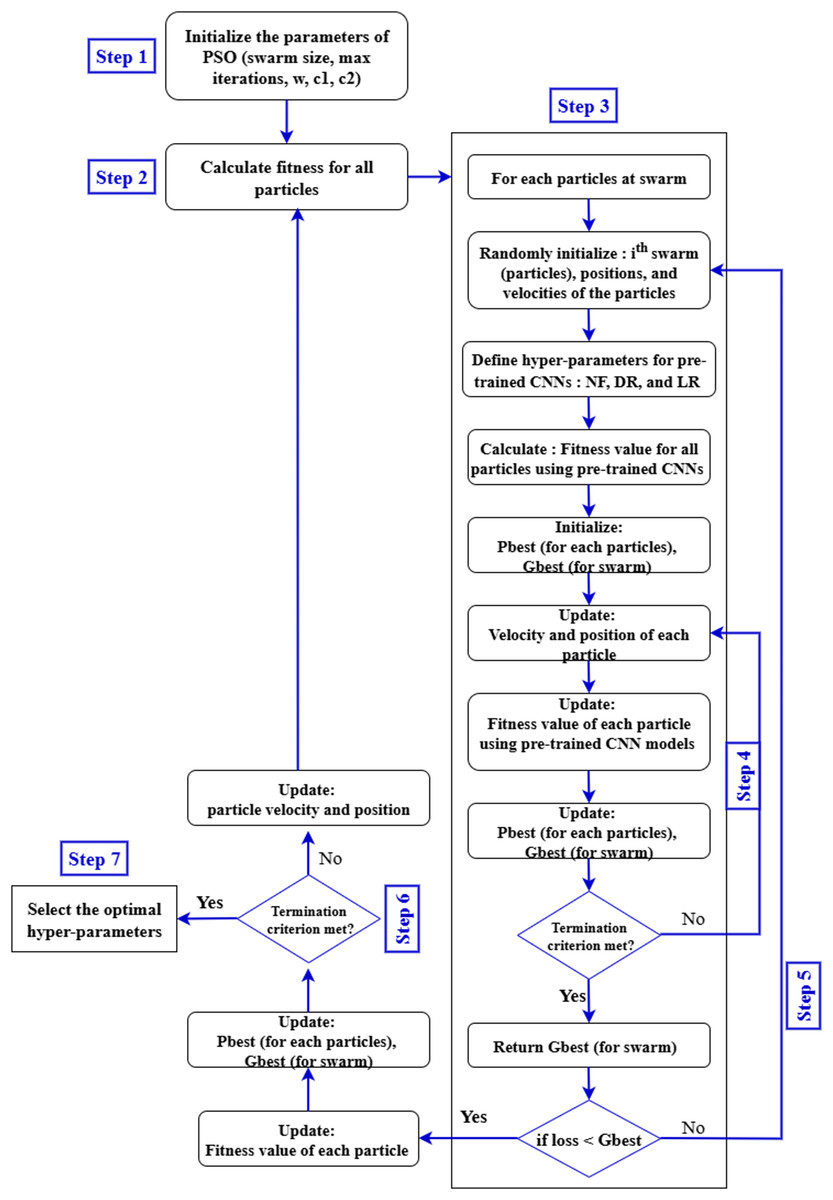
Figure 6: Proposed pre-trained CNN models with PSO.
| Parameters | Ranges |
|---|---|
| Input size | |
| Output size | 5 |
| Optimizer | Adam |
| Activation function | Softmax |
| Number of epochs | 40 |
| Activation function for activation layer | ReLU |
| Dropout | 0.4 |
| Loss function | Categorical crossentropy |
| Batch size | 32 |
| Learning rate | 0.00001 |
Through the PSO algorithm, our objective is to enhance the performance and precision of pre-trained models in classifying DR images. Our expectation is that the optimization process will immensely contribute to the efficiency and effectiveness of the model. This will give valuable insights into the optimal setting of CNN hyperparameters in this environment. For transparency and replicability of the experimental setup, we explicitly show what hyperparameters optimized with PSO for each CNN model are employed. They are the number of filters (N), dropout rate (D), and learning rate (L). The optimal hyperparameter values and the corresponding accuracies for VGG-16, DenseNet121, and MobileNetV2 were obtained by the suggested PSO-based tuning process.
Experiments results and discussion
Dataset
The Kaggle APTOS 2019 Blindness Detection Competition utilizes the Asia Pacific Tele-Ophthalmology Society APTOS 2019 dataset, which is publicly accessible on Kaggle (https://www.kaggle.com/c/aptos2019-blindness-detection/data, accessed on February 17, 2022). This challenge is to prefer deep learning models to analyze fundus images by themselves to discover early manifestations of DR, especially in remote areas where the tests are complex and take a long time (Taufiqurrahman et al., 2020). The dataset consists of 3,662 retinal images captured from various ophthalmology centres in India (the At Aravind Eye Hospital) using fundus imaging techniques and under various photographic conditions. This set also labels images into five categories: no DR (category 0), mild DR (Category 1), moderate DR (Category 2), severe DR (Category 3), and proliferative DR (Category 4). Table 1 reveals a notable imbalance in the distribution of the categories in the APTOS data set; 49% of the images belong to the non-proliferative DR category, 8% to the proliferative retinopathy category, and 5% to the severe disease category. Additionally, Fig. 7 displays some sample images extracted from the APTOS 2019 challenge data set for detecting blindness.
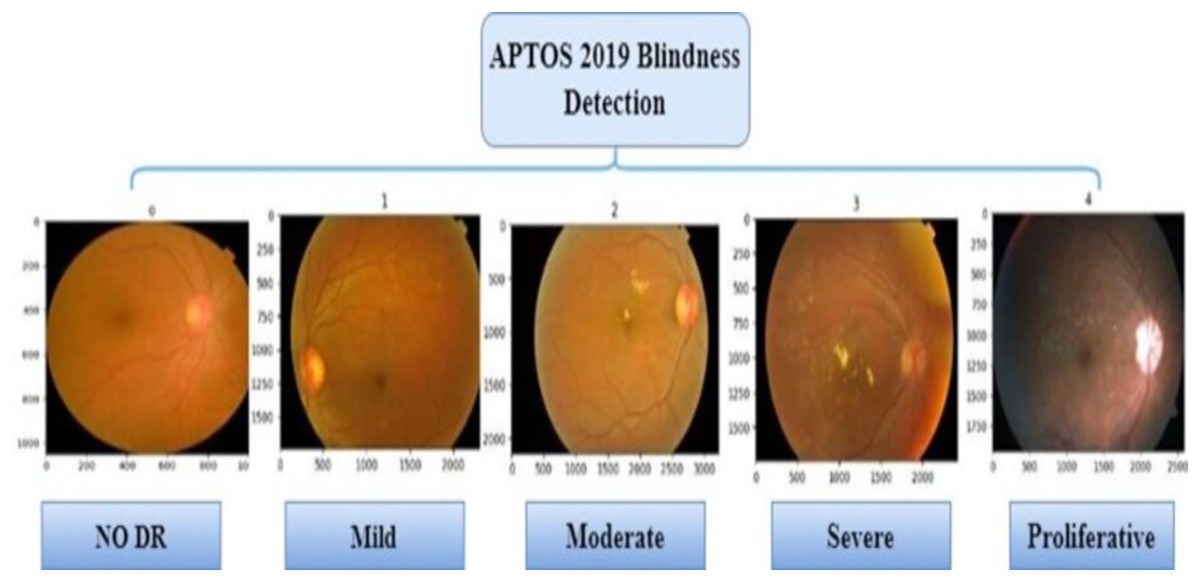
Figure 7: The APTOS 2019 dataset sample images.
As shown in Table 3, despite categorizing the data into five classes, there is a significant variation in each class sample, creating an imbalance in the data set. Such malfunction may lead to a high error rate in the classification and a decrease in the overall performance of the models. Data augmentation technology will be one of the possible ways to solve the problem. The extended APTOS dataset was created using traditional data augmentation with the original dataset, horizontal and vertical reflection, and adjustments in brightness level.
| Severity level | Class label | Number of samples | Percentage |
|---|---|---|---|
| NO DR | 0 | 1,805 | 50% |
| Mild | 1 | 370 | 10% |
| Moderate | 2 | 999 | 27% |
| Severe | 3 | 193 | 5% |
| Proliferative | 4 | 295 | 8% |
Data pre-processing
-
•
Proportional resizing
Pre-processing was initiated by changing the dimensions of the dataset proportionally to pixels and initiated model training for each pre-trained CNN model. This will accelerate model training of every pre-trained CNN model, such as VGG16, DenseNet121, and MobileNetV2.
-
•
Image Normalization
First of all, in this research, the data was re-measured using the minimum and maximum approach in data normalization, in which all pixel values were converted to the range between 0-1, as shown below: (6) where denotes the normal image, and O indicates the original input image data, while indicate the lower and upper values of the input image data.
-
•
Data augmentation
This study found that a significant number of training images is required to enhance the accuracy of CNN deep models. The chosen dataset, despite its abundance of photographs, proved insufficient. We must maximally diversify the training data to enhance the model’s stability. Therefore, we employed the data augmentation approach to increase the quantity and diversity of accessible pictures, improving the prediction accuracy. The APTOS 2019 dataset exhibited an unequal distribution of images among five classifications. Data augmentation enabled us to rebalance the dataset classes, thereby diminishing the prevalence of minority classes. The employed image augmentation techniques include shifting, horizontal, and vertical flipping.
Experimental setup
This study examined optimum hyperparameter selection for CNN models with PSO. The models for hyperparameter optimization were implemented in Python using the Google Colaboratory (CoLab) environment. The Keras API, with TensorFlow as the backend, was utilized to develop and train the DNN architectures. TensorFlow, a prominent open-source DL package, supplied the essential tools for building and assessing the proposed models. The integration of Python and TensorFlow enabled effective development, execution, and evaluation of the methodology. The PSO approach found the optimal hyperparameters for pre-trained CNN models.
All tests were conducted utilizing TensorFlow, the Keras API, and Python programming within Google Colaboratory (CoLab) running on a Microsoft machine with a Core i5 processor. Tesla GPUs were employed in CoLab to conduct testing once the dataset was uploaded to Google Drive for accessibility. The CoLab platform provided a practical and collaborative setting for executing computationally demanding experiments, facilitating effective examination of the model’s performance across many hyperparameter combinations. The APTOS 2019 competition dataset was employed, with an 80% training and 20% testing split (Alyoubi, Abulkhair & Shalash, 2021). This configuration enabled a thorough assessment of our hyperparameter optimization methods and their influence on the performance of CNN models.
The proposed approach was to build a foundation for the transfer learning technique with pre-trained models of bypass neural networks, such as CNN. The super parameters represented in Table 2 were kept using the same settings across all applicable models in the transfer learning process. To maintain input compatibility with such models, the images in APTOS 2019 were resized at a resolution of 224 224 pixels. Another critical parameter is the batch size, which was set to 32. The minimum learning rate, , is also set to 0.00001, which helps achieve accurate weight adjustments. Moreover, the number of training epochs was set to 40, an adequate iteration for models to gain effective knowledge generalization from available data (Alnabhan et al., 2022).
By fine-tuning these hyperparameters and leveraging the knowledge embedded in pre-trained CNN architectures through transfer learning, the proposed approach aimed to achieve optimal performance on the DR detection task. The careful selection of hyperparameters, such as batch size, learning rate, and the number of epochs, was crucial in ensuring stable training and maximizing the models’ predictive capabilities.
Evaluation metrics
This work used the benchmark APTOS 2019 dataset (Kassani et al., 2019) to deal with a multiclass (five-class) classification challenge for diabetic retinopathy detection. This work used the benchmark APTOS 2019 dataset for a multiclass (five-class) classification challenge for DR detection. Using the proposed PSO, this study enhanced the performance of pre-trained CNN architectures on this demanding task.
In this work, the revised models were tested with CNN using the following various performance metrics: accuracy (ACC), specificity (SP), sensitivity (SEN), future operating characteristic curve analysis (ROC), and accuracy, recall, and F1-score metrics. All these metrics are extracted from the confusion matrix. The confusion matrix classifies the model predictions into four categories: true negatives (TN), true positives (TP), false negatives (FN), and false positives (FP). TN, in the context of the classification of DR, represents those cases where healthy patients were correctly classified as uninfected or non-proliferative. TP shows patients with DR who have been correctly diagnosed with the disease. FP is used to showcase whereby healthy patients were incorrectly classified as having DR, while FN indicates patients with DR who have been wrongly classified as normal. These scales are calculated using Eqs. (7), (8), (9), (10), and (11), as follows:
(7)
(8)
(9)
(10)
Further, Kappa statistics is used to evaluate the performance of the proposed strategy. The Kappa statistic calculates the actual accuracy in comparison with the statistical expectation of accuracy using the formula below:
(11)
Result and analysis
Evaluating pre-trained CNN models evolution
The results of using PSO hyperparameter optimization on CNN models that have already been trained, such as VGG16, DenseNet121, and MobileNetV2, to classify DR are shown in this section. The main focus here is on how this optimization improves the performance of such models compared to their original, unoptimized versions.
Table 4 shows the results concerning the DR classification performance using three pre-trained CNN models: VGG16, DenseNet121, and MobileNetV2. DenseNet121 achieved the best results, achieving an accuracy of 93.85% on the test set. MobileNetV2 followed with an accuracy of 92.79% on the test set. VGG16 proved to have the worst accuracy at 73.7% on the test set. To further present a more realistic evaluation of the reliability of these models, we also review their Kappa values. These ratings provide insight into the degree of agreement between the model’s predictions and actual outcomes, above what would be expected by chance. In this instance, DenseNet121 excels with a Kappa score of 92.30, demonstrating high agreement and reliability in producing reproducible classifications. MobileNetV2 has a Kappa score 90.99, which is slightly higher than VGG16’s score of 67.1; therefore, MobileNetV2 is more reliable. The accuracy and Kappa score for DenseNet121 showed a powerful link, underscoring the model’s reliability. It does not return excellent accuracy alone, but it makes correct predictions regularly; therefore, it is a reliable option for DR classification.
| Models | Accuracy | Precision | Recall | F1-score | Kappa score |
|---|---|---|---|---|---|
| VGG-16 | 73.7 | 73.6 | 73.7 | 73.0 | 67.1 |
| DenseNet-121 | 93.85 | 93.78 | 93.85 | 93.77 | 92.30 |
| MobileNet | 92.79 | 92.71 | 92.79 | 92.72 | 90.90 |
Table 5 displays the results of the hyperparameter optimization using the PSO technique. The PSO-MobileNetV2 model demonstrated exceptional performance on the test test, with an impressive accuracy rate of 97.4% and a Kappa score of 96.77%. This reflects the substantial improvements attained through the optimization process. Similarly, the PSO-DenseNet121 model showed significant improvements on the test set, with an accuracy of 96.34% and a Kappa score of 95.42%. Even though it represented an improvement, PSO-VGG16 was still behind, with an accuracy rate of 76.62% and a Kappa score of 70.77%. Significant gains in accuracy and Kappa score, particularly for the former MobileNetV2, really bring out the effectiveness of PSO optimization in improving model accuracy and the consistency and dependability of the predictions. These results can be considered proof of the power of PSO to improve the accuracy of models in complex classification problems, such as DR.
| Models | Accuracy | Precision | Recall | F1-score | Kappa score |
|---|---|---|---|---|---|
| PSO-VGG16 | 76.62 | 76.72 | 76.62 | 76.62 | 70.77 |
| PSO-DenseNet121 | 96.34 | 96.34 | 96.34 | 96.34 | 95.42 |
| PSO-MobileNet | 97.41 | 97.41 | 97.41 | 97.41 | 96.77 |
Results of the pre-trained models with hyperparameter tuning with PSO
The proposed method, which was described in the previous section, focused on developing an improved model through integrating the PSO algorithm and CNN models. The thought behind this method is that it should optimize the hyperparameters of the CNN model in a predefined range so that the accuracy of DR prediction is maximized and the value of the loss function becomes minimized. The optimization method begins by identifying the hyperparameter search space, which defines the range and restrictions for the hyperparameters that will be tweaked. This initial phase is critical because it describes the parameters within which the PSO algorithm will investigate alternative solutions. In our analysis, we used the parameters shown in Table 2, with 40 epochs and a batch size of 32.
To evaluate the effectiveness of our suggested approach, we conducted two experiments. The first applied three unique pre-trained CNN models (VGG16, DenseNetNet121, and MobileNetV2). Second, by incorporating the PSO with pre-trained models, we aimed to identify the ideal hyperparameter configurations that would maximize the performance of these models in the context of diabetic retinopathy classification. The following sections present and analyze the results obtained from our experiments, demonstrating the efficacy of PSO-driven hyperparameter tuning in enhancing the predictive capabilities of CNN models for this critical medical detection.
The proposed PSO-CNN technique was used to tune the hyperparameters of three pre-trained CNN models: VGG16 (Simonyan & Zisserman, 2014; DenseNet121 Huang et al., 2017; and MobileNetV2 Howard, 2017), The findings are described in Tables 6, 7, and 8. The PSO-MobileNetV2 combination outperformed the MobileNetV2 model in predicting diabetic retinal disease. The hyperparameter values [N, D, l] = [237, 0.3, 0.0004] resulted in the most remarkable accuracy of 97.1%, with ‘N’ representing the number of filters, ‘D’ signifying the dropout rate, and ‘l’ representing the learning rate. Several other combinations, including [459, 0.1, 0.0003], [135, 0.5, 0.0008], and [41, 0.8, 0.0007], also yielded outstanding accuracy of more than 96%. Other groups, [333, 0.1, 0.0003] and [118, 0.5, 0.0008], had much lower accuracies, 77.5% and 67.4%, respectively. The DenseNet121 model effectively predicted the sickness. The hyperparameter values [N, D, L] = [32, 0.6, 0.0009] provided the highest accuracy of 96.1%. In comparison, the setup [90, 0.6, 0.0009] produced a lower accuracy of 64.8%. Finally, when detecting diabetic retinopathy using the VGG16 model, the PSO-VGG16 approach fared somewhat worse than the others. The greatest accuracy was 76.5% for hyperparameter values [N, D, L] = [273, 0.5, 0.0004]. Configurations such as [378, 0.8, 0.0003] and [205, 0.4, 0.0001] also yielded accuracy above 72%. However, the configurations [273, 0.5, 0.0004] and [409, 0.3, 0.0008] resulted in lower accuracies of 48.7% and 50.9%, respectively. These results demonstrate the effectiveness of the PSO-CNN method in optimizing hyperparameters [NF, DR, LR] and achieving high accuracies across the APTOS 2019 dataset. In particular, the MobileNetV2 and DenseNet121 models exhibited superior performance with optimized hyperparameters, while the VGG16 model showed relatively lower accuracies. The findings highlight the importance of hyperparameter tuning and the potential of metaheuristic optimization techniques, such as PSO, in enhancing the predictive capabilities of CNN models for DR classification.
| Hyper-parameters [N, D, L] | Accuracy |
|---|---|
| [273, 0.5, 0.0004] | 48.7 |
| [409, 0.3, 0.0008] | 50.9 |
| [342, 0.1, 0.0008] | 55.1 |
| [332, 0.7, 0.0005] | 69.5 |
| [211, 0.4, 0.0001] | 70.6 |
| [281, 0.1, 0.0008] | 73.1 |
| [378, 0.8, 0.0003] | 73.3 |
| [319, 0.7, 0.0005] | 73.6 |
| [205, 0.4, 0.0001] | 76.0 |
| [273, 0.5, 0.0004] | 76.5 |
| Best values of | |
| Hyper-parameters [N, D, L] | Accuracy |
|---|---|
| [90, 0.6, 0.0009] | 64.8 |
| [304, 0.6, 0.0001] | 81.1 |
| [329, 0.3, 0.0009] | 95.9 |
| [188, 0.8, 0.0006] | 94.9 |
| [294, 0.3, 0.0009] | 95.7 |
| [32, 0.6, 0.0009] | 96.1 |
| [247, 0.3, 0.0009] | 95.9 |
| [233, 0.3, 0.0001] | 96.01 |
| [167, 0.2, 0.0008] | 95.7 |
| [229, 0.8, 0.0006] | 96.6 |
| Best values of | |
| Hyper-parameters [N, D, L] | Accuracy |
|---|---|
| [118, 0.5, 0.0008] | 67.4 |
| [333, 0.1, 0.0003] | 77.5 |
| [74, 0.7, 0.0003] | 85.8 |
| [108, 0.3, 0.0009] | 96.01 |
| [439, 0.6, 0.0007] | 95.7 |
| [303, 0.3, 0.0004] | 96.1 |
| [135, 0.5, 0.0008] | 97.06 |
| [459, 0.1, 0.0003] | 96.7 |
| [41, 0.8, 0.0007] | 97.1 |
| [237, 0.3, 0.0004] | 97.1 |
| Best values of | |
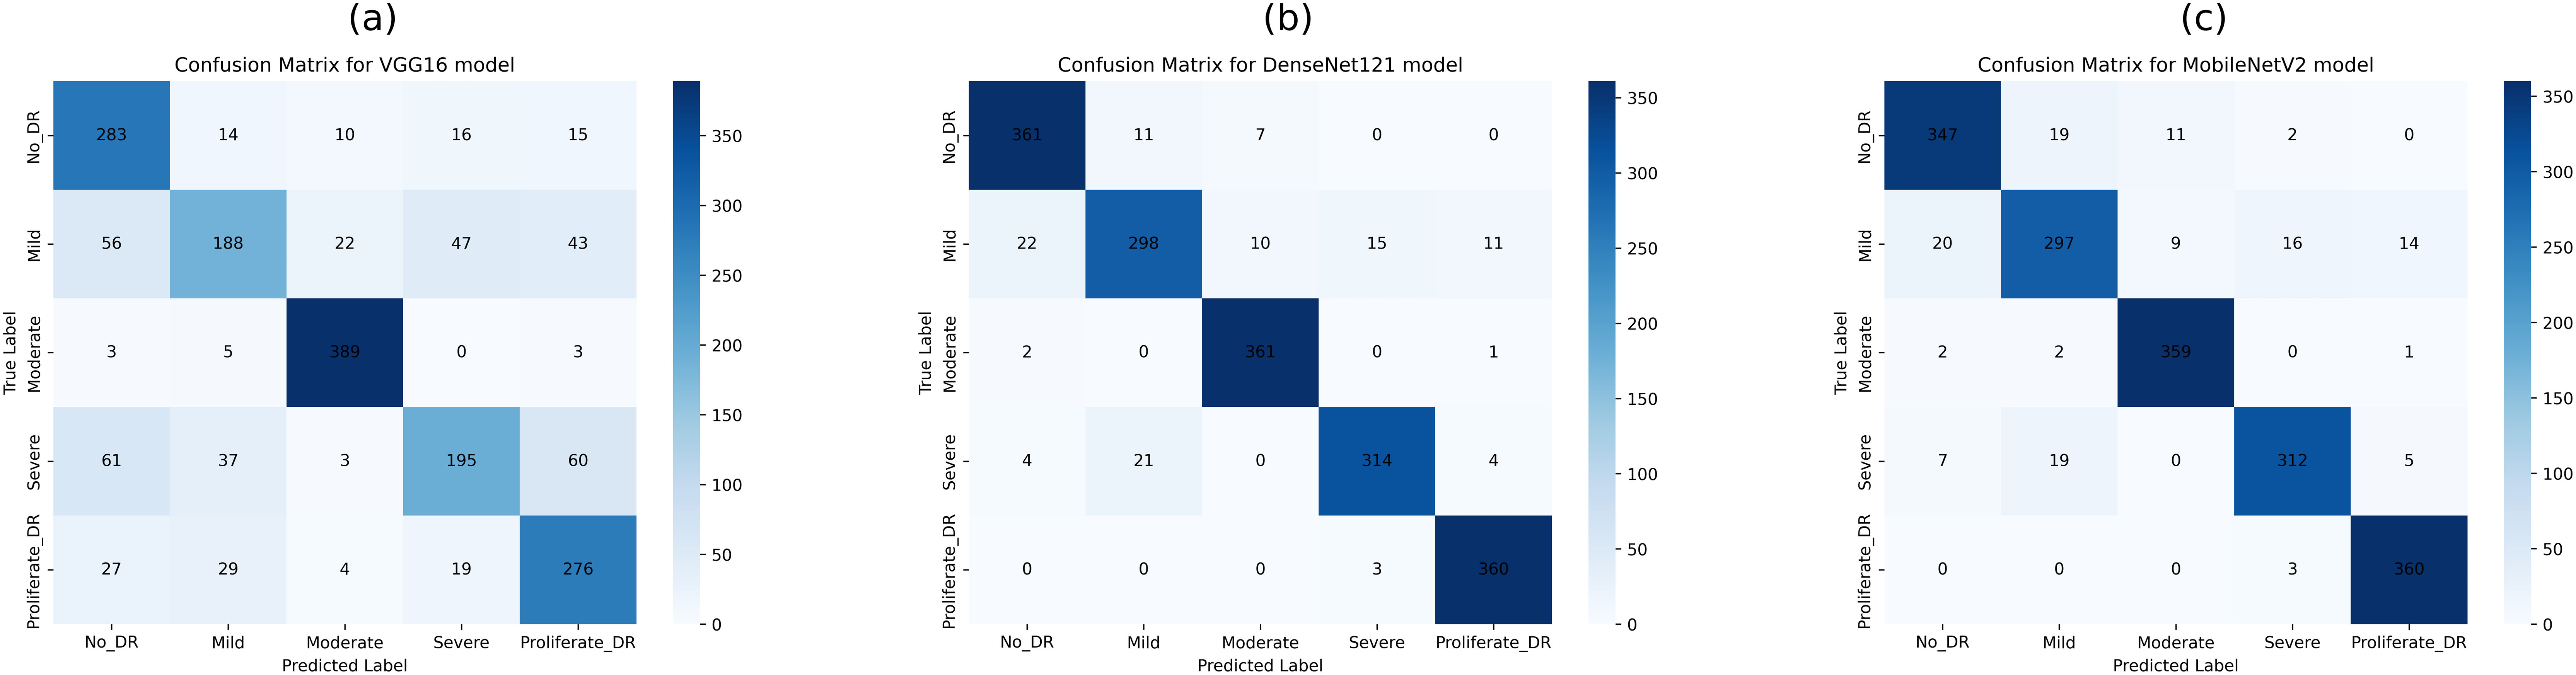
This study employed confusion matrices as a comprehensive performance metric to evaluate the efficacy of hyperparameter tuning on pre-trained CNN architectures for multiclass DR classification. Figures 8A–8C presents the confusion matrices for VGG16, DenseNet121, and MobileNetV2. These matrices, generated from the test dataset, provide a detailed breakdown of the models’ classification performance at various DR severity levels. The confusion matrices represent the models’ prediction accuracy by displaying TP, FP, TN, and FN for each DR class. This comprehensive study enables a more nuanced view of each model’s strengths and shortcomings in differentiating across stages of DR development. By comparing the matrices of the three CNN designs, we can see how model selection and hyperparameter tuning affect classification accuracy at each DR severity level. The confusion matrix for pre-trained CNN models and hyperparameter tuning based on PSO shows the number of samples that have been correctly and incorrectly identified and their actual and predicted labels.
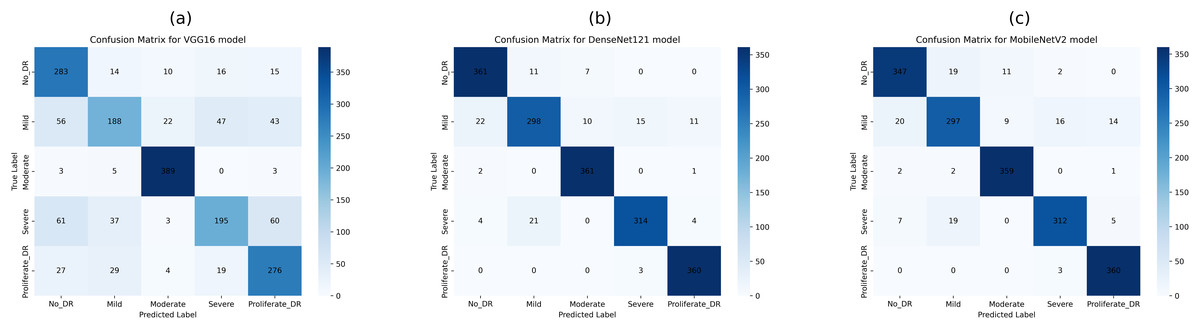
Figure 8: Confusion matrices of pretrained CNN models (VGG16, DenseNet121, and MobileNetV2) for 5-class diabetic retinopathy classification (class labels 0–4) using the APTOS 2019 dataset: (A) VGG16, (B) DenseNet121, (C) MobileNetV2.
Figure 8B shows the confusion matrix, wherein 361, 298, 361, 314, and 360 samples were correctly classified by the DenseNet121 model as DR0, DR1, DR2, DR3, and DR4, respectively. Also, according to the second row of the confusion matrix in Fig. 8B, the model has misclassified 22, 10, 15, and 11 samples of DR1 as DR0, DR2, DR3, and DR4, respectively. The test dataset was used to test all tuned models with PSO-VGG16, PSO-DenseNet121, and PSO-MobileNetV2. From the confusion matrices, it is clear that optimized models have fewer misclassifications (false negatives and positives) than base models, indicating that the modified models outperform the rest.
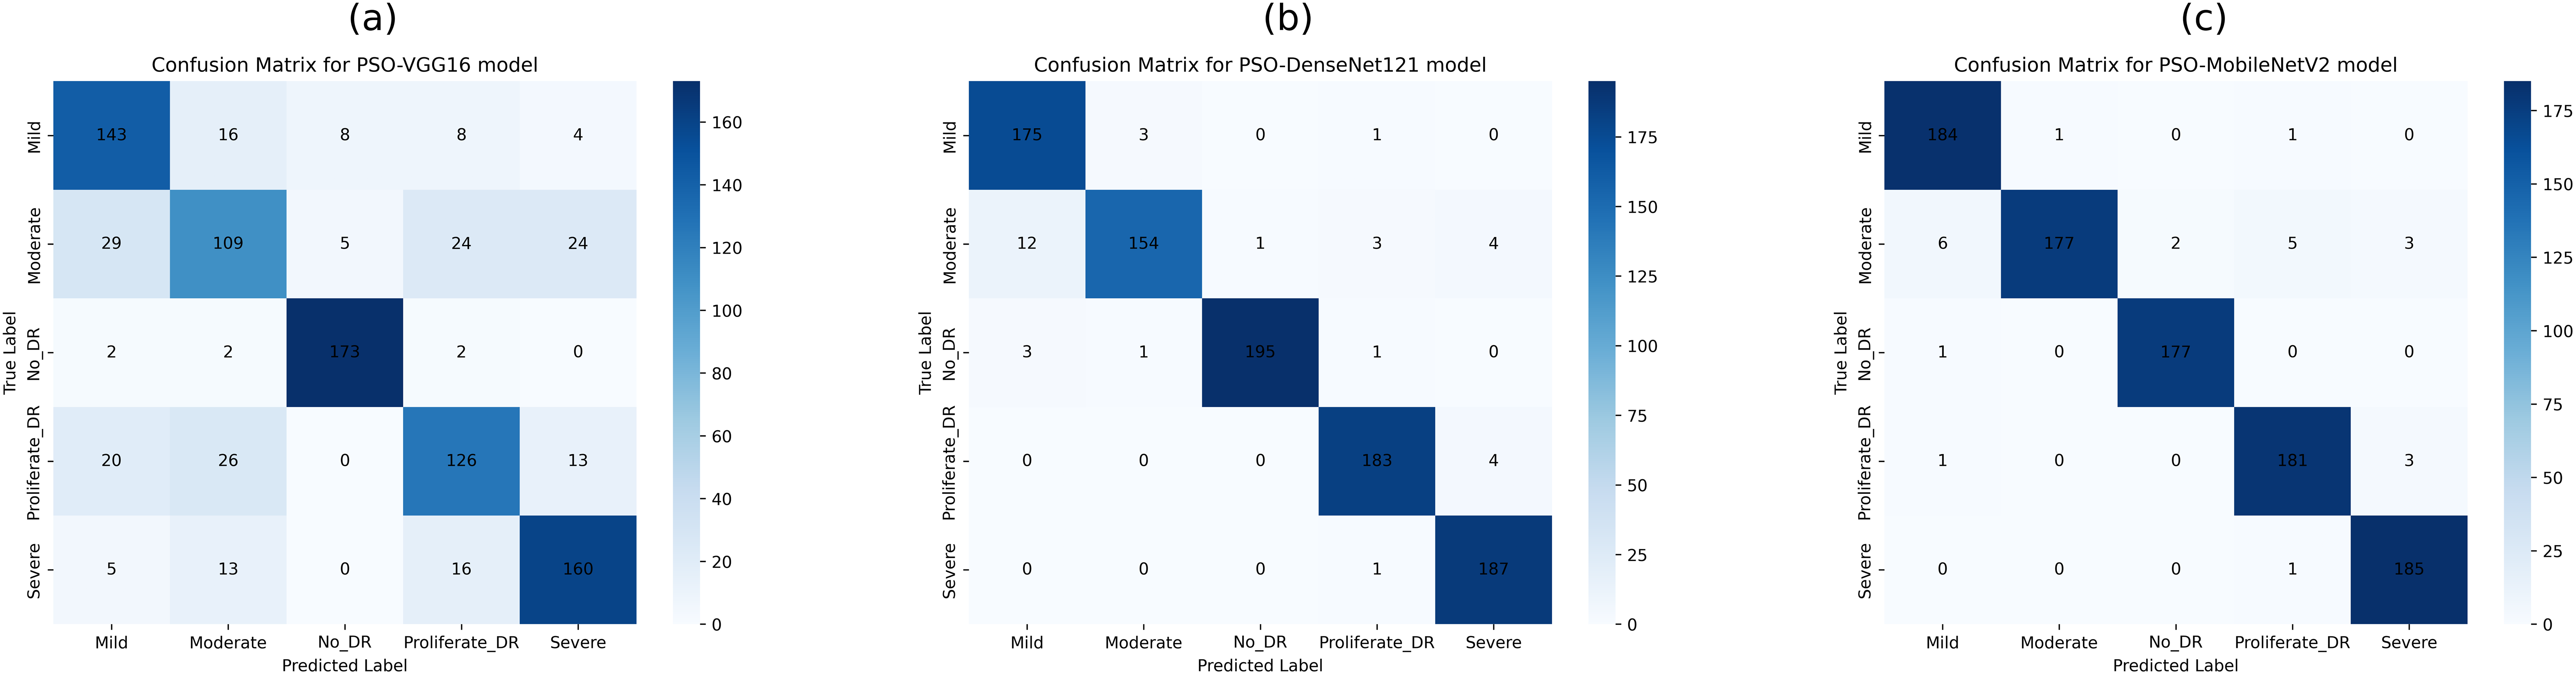
The confusion matrix in Fig. 9B shows that the PSO-DenseNet121 has properly identified 175, 154, 195, 183, and 187 samples. PSO-DenseNet121, shown in Fig. 9C, and PSO-MobileNetV2 identified 184, 177, 177, 181, and 185 as DR0, DR1, DR2, DR3, and DR4, respectively. Furthermore, the two rows of the confusion matrix in Fig. 9B show that PSO-DenseNet121 misclassified 12, 1, 3, and 4 samples of DR2 as DR0, DR1, DR3, and DR4, respectively. Figure 9C shows that PSO-MobileNetV2 misclassified 6, 2, 5, and 3 DR2 samples as DR0, DR1, DR3, and DR4, respectively.
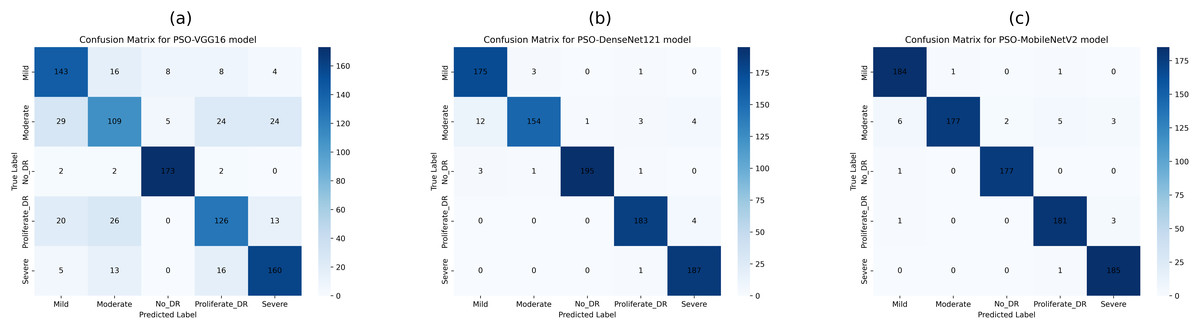
Figure 9: Confusion matrices of PSO-optimized CNN models (VGG16, DenseNet121, and MobileNetV2) for 5-class diabetic retinopathy classification (class labels 0–4) using the APTOS 2019 dataset: (A) PSO-VGG16, (B) PSO-DenseNet121, (C) PSO-MobileNetV2.
Figure 10 illustrates the ROC curves for the five DR classes using pre-trained CNN models (VGG16, DenseNet121, and MobileNetV2). It is evident that the DenseNet121 and MobileNetV2 models outperform the VGG16 model across various DR severity grades. Specifically, in Figs. 10B and 10C DenseNet121 and MobileNetV2 demonstrate superior performance in identifying moderate and PDR grades, indicated by larger ROC curve areas.
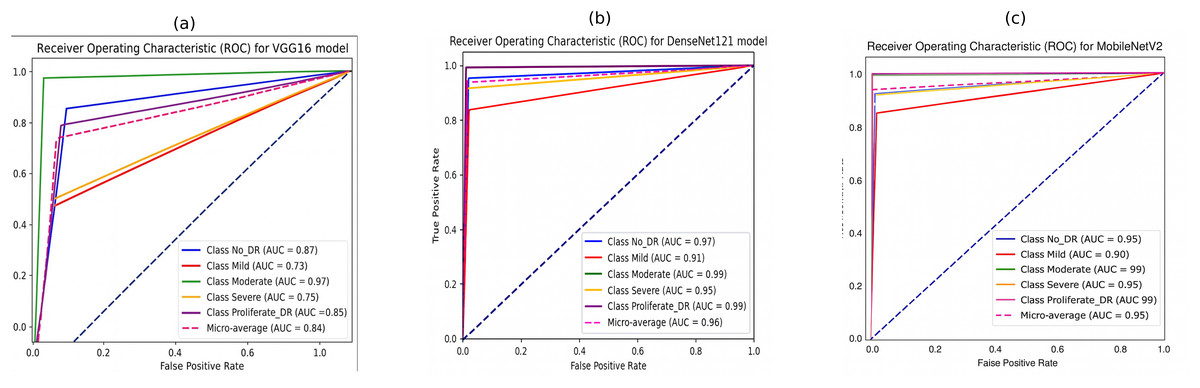
Figure 10: Receiver operating characteristic (ROC) curves of pretrained CNN models for 5-class diabetic retinopathy classification using the APTOS 2019 dataset: (A) VGG16, (B) DenseNet121, (C) MobileNetV2.
The performance in identifying the no-DR grade is also notably high for both models, followed by their performance in detecting the severe grade. The mild grade shows the lowest ROC curve area. The suggested DenseNet121 scored 97%, 91%, 99%, 95%, and 99% for no-DR, mild, moderate, severe, and PDR, respectively. At the same time, the MobileNet model achieved 95%, 90%, 99%, 95%, and 99% for NO DR, mild, moderate, severe, and PDR, respectively.
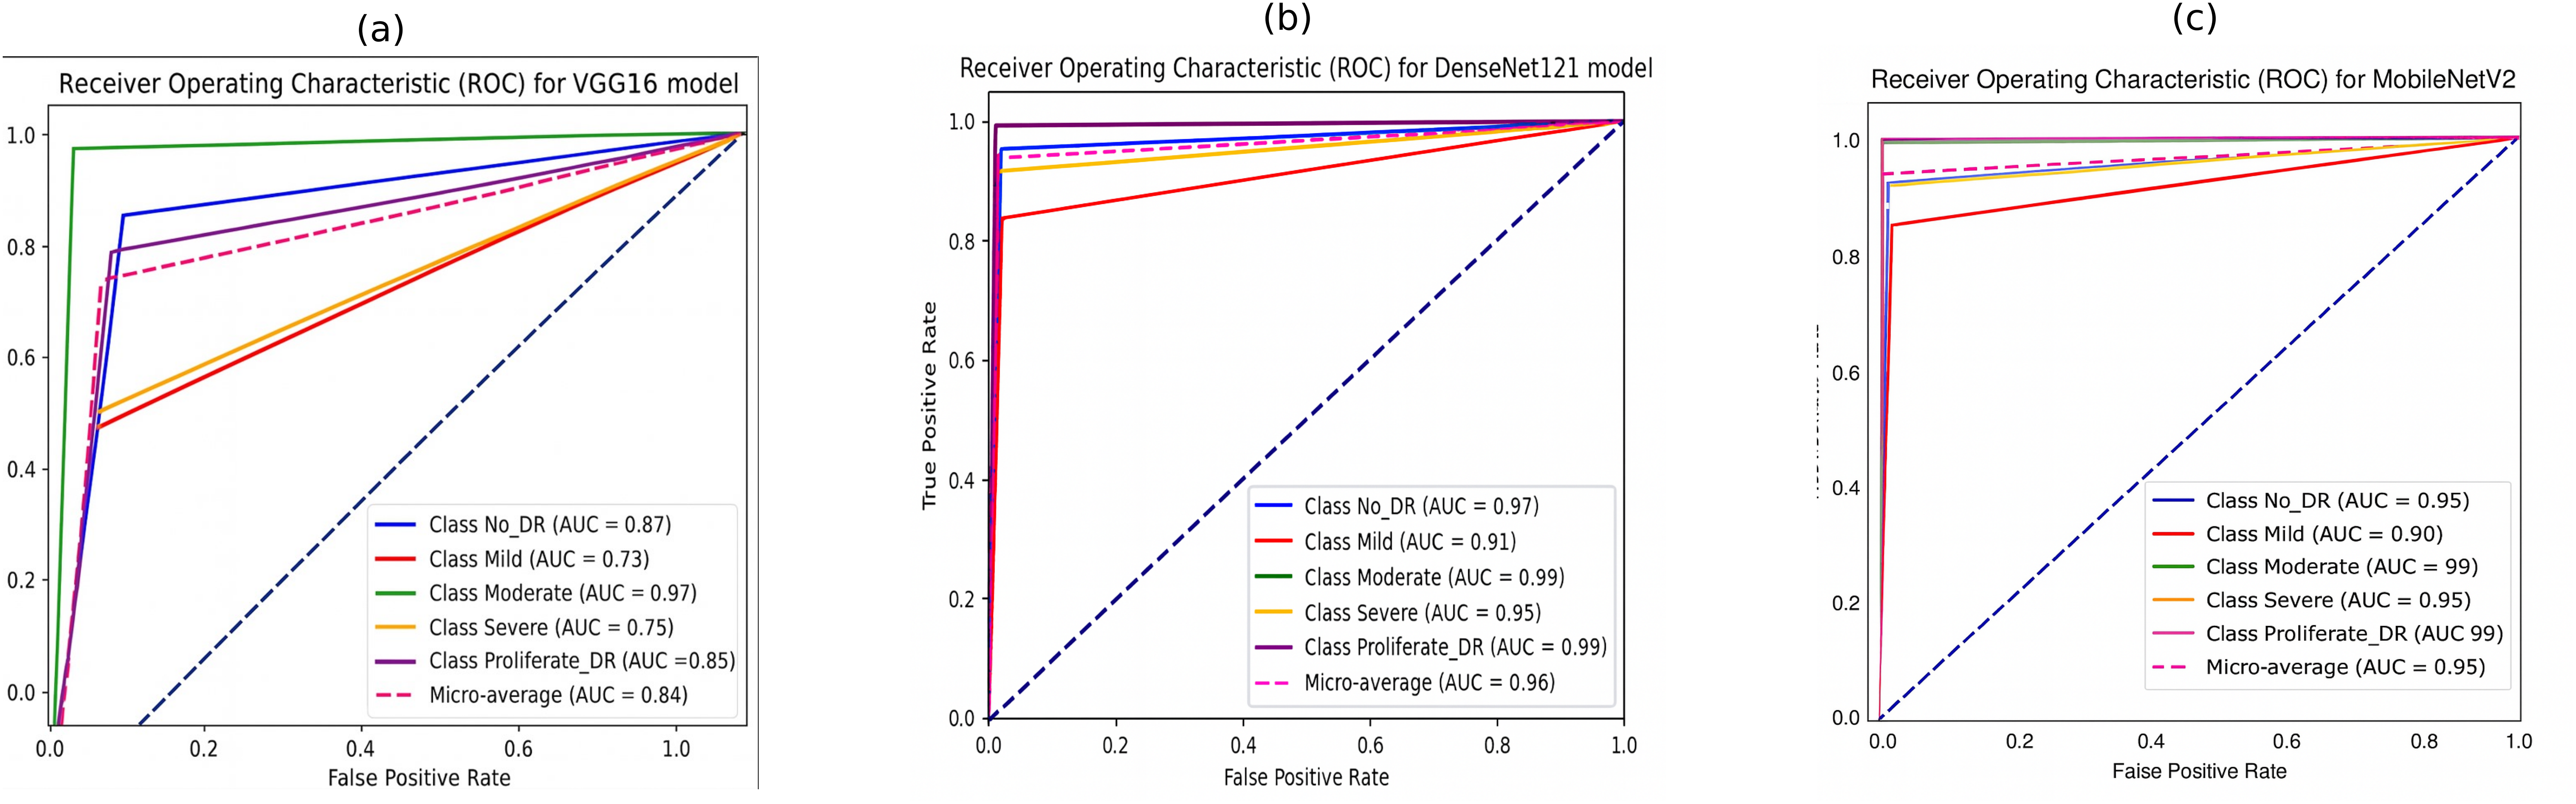
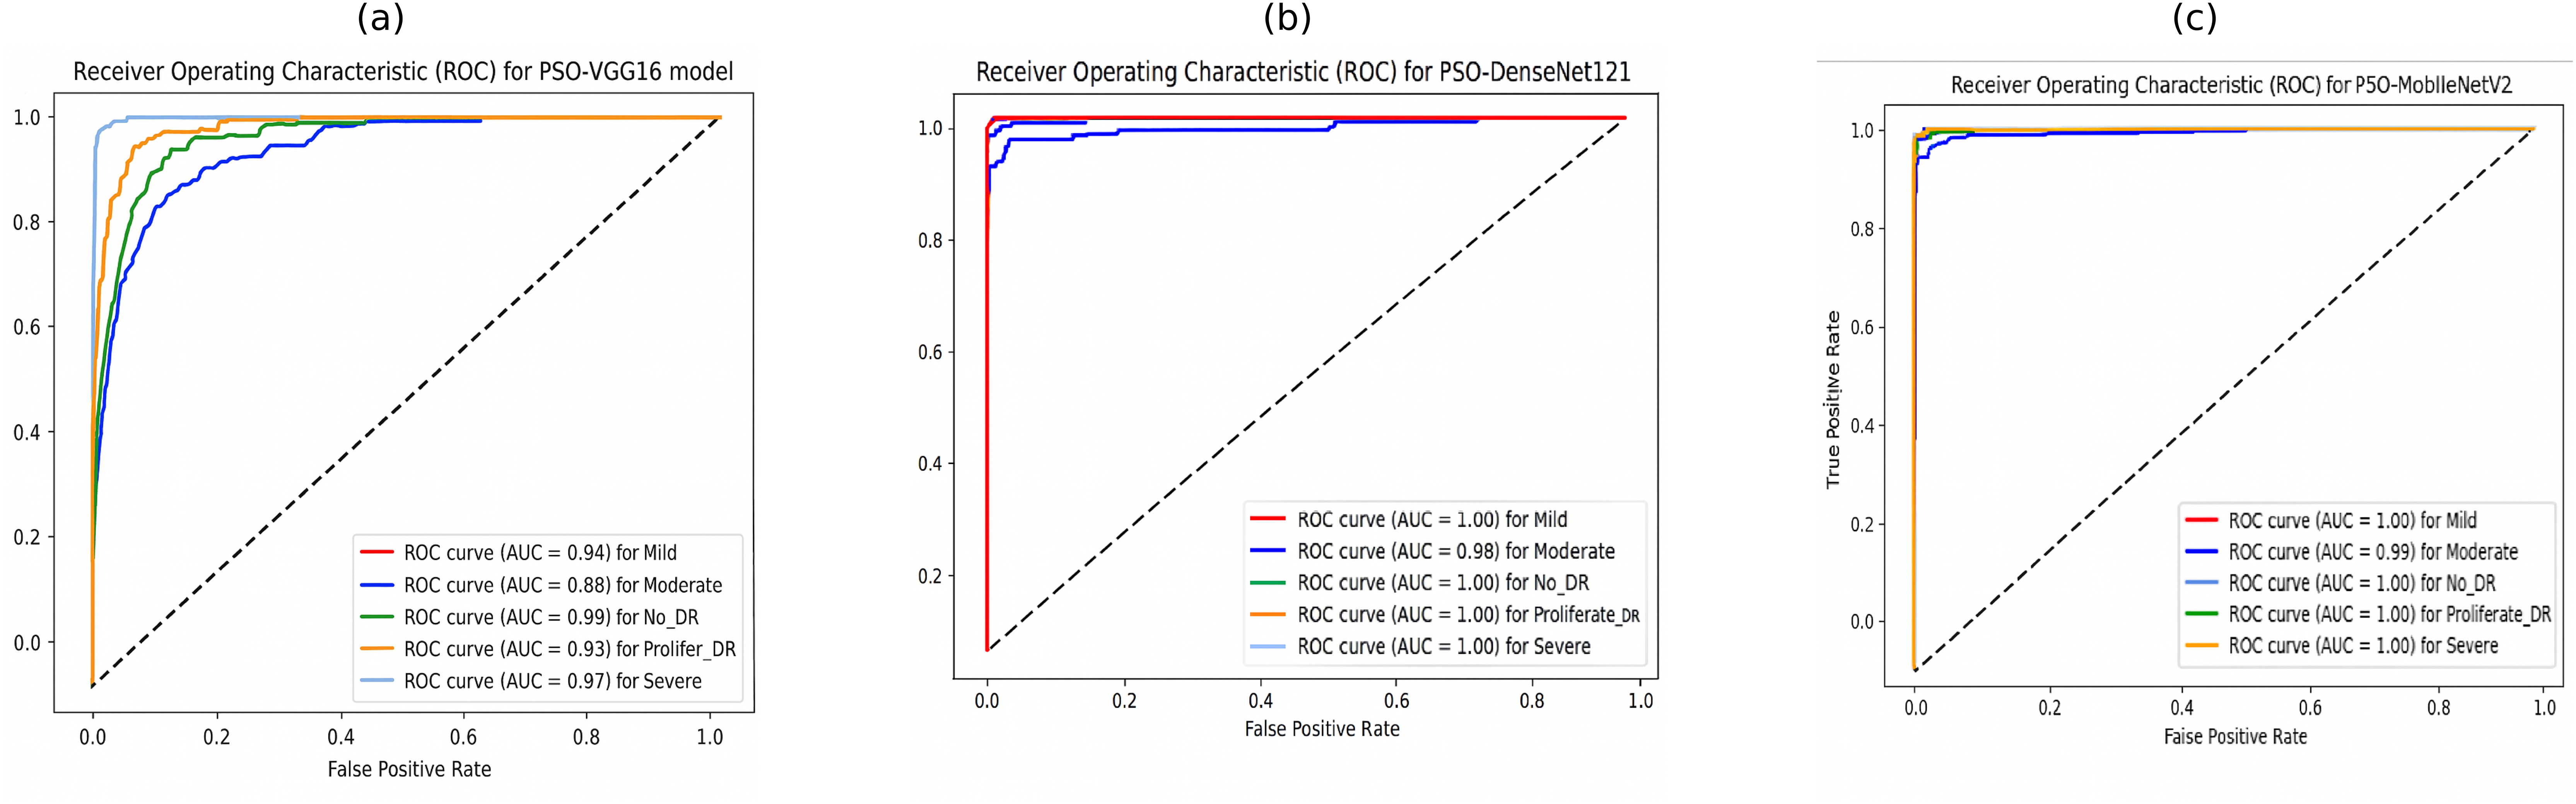
Furthermore, the ROC curves of PSO-DenseNet121 and PSO-MobileNetV2, shown in Figs. 11B and 11C, appear to outperform PSO-VGG16, with near-perfect classification across all severity levels. PSO-VGG16, while still performing well, has more significant variability in its ability to categorize different severity levels. Figure 11B shows that the suggested PSO-DenseNet121 scored 1.00%, 0.98%, 1.00%, 1.00%, and 1.00% for no-DR, mild, moderate, severe, and PDR, respectively. Figure 11C shows that the PSO-MobileNet model obtained 0.99%, 1.00%, 1.00%, 1.00%, and 1.00% for no-DR, mild, moderate, severe, and PDR, respectively.
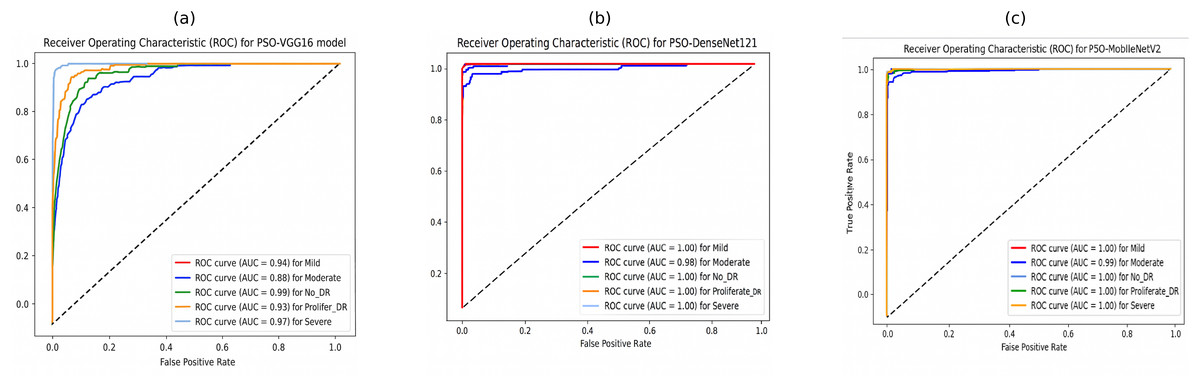
Figure 11: Receiver operating characteristic (ROC) curves of PSO-optimized CNN models for 5-class diabetic retinopathy classification using the APTOS 2019 dataset: (A) PSO-VGG16, (B) PSO-DenseNet121, (C) PSO-MobileNetV2.
Discussion
Analysis of model results based on GA and PSO
In this part, we compare optimized models with GA and PSO. These comparisons give useful information about the efficiency of the two optimization strategies in tweaking the model hyperparameters. Table 9 shows the performance metrics for both models.
| Transfer learning model | Metric | Algorithm | |
|---|---|---|---|
| GA | PSO | ||
| VGG-16 | Accuracy | 89.30 | 76.62 |
| Precision | 89.30 | 76.72 | |
| Recall | 89.30 | 76.62 | |
| F1-score | 89.25 | 76.62 | |
| Kappa score | 86.61 | 70.77 | |
| DenseNet-121 | Accuracy | 94.45 | 96.34 |
| Precision | 94.41 | 96.34 | |
| Recall | 94.45 | 96.34 | |
| F1-score | 94.41 | 96.34 | |
| Kappa score | 93.07 | 95.42 | |
| MobileNetV2 | Accuracy | 88.03 | 97.41 |
| Precision | 87.80 | 97.41 | |
| Recall | 88.03 | 97.41 | |
| F1-score | 87.90 | 97.41 | |
| Kappa score | 85.03 | 96.77 | |
Table 9 VGG-16, DenseNet-121 and MobileNetV2 for the DR classification on the APTOS 2019 dataset using accuracy, qualitative accuracy, recall, F1-score and Kappa statistic. This means that, among the compared models, VGG16 has a good accuracy of 73.7% but has yet to achieve the required levels for qualitative accuracy, recall, F1-score, and Kappa statistic; hence, specific limitations exist in correctly classifying disease stages. On the one hand, the best performance for all the metrics was performed by DenseNet121 and MobileNetV2; really, it elevates them to the position of the best option for the given task.
Therefore, the proposed model performed better than previous methods of transfer learning on all the assessment scales, indicating its importance and potential for DR classification. During the hyperparameter optimization using the GA algorithm, the DenseNet-121 architecture yielded an accuracy of 94.45%, along with high values in qualitative accuracy, recall, F1-score and Kappa statistic. These results reflect the high capability of the model in correctly classifying DR severity scores, making it a promising tool for early detection and diagnosis. The model did even more superbly when PSO was combined with MobileNetV2, yielding an accuracy of 97.41% with the best balance of qualitative accuracy, recall, and F1-score. This would show the model’s efficiency in identifying cases of Dr and enhancing the precision of clinical diagnosis.
Notably, our findings demonstrate the efficacy of both GA and PSO for hyperparameter optimization in pre-trained CNN models. The PSO-MobileNetV2 model achieved an outstanding accuracy of 97.41%, showcasing minimal performance discrepancies across various transfer learning models. This exceptional result underscores the potential of these methods to aid medical professionals in detecting and categorizing. The model’s high accuracy and recall scores confirm its reliability and efficacy in distinguishing between DR grades (no DR, mild, moderate, severe, and proliferative DR). Furthermore, the PSO-MobileNetV2 model demonstrated a remarkably low False Negative Rate (FNR) of 2.58%. This low FNR indicates that the proposed model is highly accurate in identifying positive cases of DR, thereby minimizing the number of missed diagnoses. Additionally, this research chose the metrics for their clinical utility and statistical reliability in DR screening. Recall is also extremely important in this context, since it accounts for how well the model gets true DR cases classified as positive, avoiding delayed treatment due to false negatives. Precision, on the flip side, is what ensures that positive cases found are actual positive cases, preventing false alarms that cause anxiety or expensive follow-up treatment. F1-score, being the harmonic mean of precision and recall, is a balanced measure that is optimal for dealing with class-imbalanced datasets such as APTOS 2019. Finally, the Kappa measure adjusts for agreement by chance, providing a better measure of classifier consistency, critical in high-risk clinical decision-making.
Comparison with existing methods
According to the experimental results, the proposed hyperparameter-optimization strategies (such as GA and PSO) and pre-trained CNN models beat other cutting-edge models in the DR fundus image classification task. The experimental results show that adopting hyperparameter optimization techniques for CNN models to medical image classification tasks increases classification performance.
To highlight the efficacy of our proposed hyperparameter-optimization algorithms, we compared our results on the DR fundus images benchmark dataset with the most recent relevant research. Table 10 presents a comparative analysis of our optimized CNN models against current state-of-the-art studies. The findings indicate that our approach, which leverages GA and PSO for hyperparameter tuning, significantly outperforms existing pre-trained models for DR detection. When applied to the APTOS 2019 dataset, our model achieved exceptional performance across two key metrics: accuracy of 97.41% and Cohen’s Kappa of 96.77%. These results represent a substantial improvement over the previous method. The consistently high values across all metrics underscore the robustness of our approach. Notably, the impressive kappa score of 0.9677 indicates excellent inter-rater reliability, further validating the effectiveness of our model in DR classification. For example, in Bodapati et al. (2020). One of the primary reasons for these superior results is the adaptation of the transfer learning models with the appropriate hyperparameters; additionally, hyperparameter tuning was incorporated using GA and PSO parameters, increasing the ability of the proposed pre-trained CNNs to discriminate between various classes in the DR fundus images dataset. Compared to the VGG16 and VGG19 models given in Kale & Sharma (2023), Sharma et al. (2021), which attained accuracies of 87.31%, the suggested model outperforms them. Similarly, the proposed model outperforms the accuracy reported by Shaban et al. (2020) (89%) and Lahmar & Idri (2022) (93.09%) for the APTOS 2019 dataset. Compared to the recent work by Taufiqurrahman et al. (2020), our hyperparameter tuning utilizing GA and PSO for CNNs performed better. They created a generic MobileNetV2 and then refined the model by merging it with an SVM classifier to fine-tune its parameters. Their classification accuracy for the fundus image dataset was 85%. We discover that the suggested strategy is preferable owing to appropriate hyperparameters determined using the GA and PSO optimization methods. Notably, the authors of Kassani et al. (2019) achieved an accuracy of 83.09% for multi-classification on the DR dataset by utilizing the modified Xception pre-trained model. Similar studies were previously conducted to evaluate the categorization of the APTOS 2019 dataset. Based on the findings, the suggested hybrid CNN models can distinguish five different classes in fundus images. Both hybrid CNN with ResNet and hybrid CNN with DenseNet had validation accuracy of around 93.18% and 96.22%, respectively. These results beat the VGG16 and Xception results in Bodapati et al. (2020) by around 16%.
| Reference | Dataset used | CNN model | Accuracy (%) |
|---|---|---|---|
| Bodapati et al. (2020) | Aptos 2019 | VGG16, Xception | 80.96 |
| Kale & Sharma (2023) | Aptos 2019 | VGG16 and VGG19 | 87.31 |
| Shaban et al. (2020) | Aptos 2019 | CNN | 89 |
| Lahmar & Idri (2022) | Aptos 2019 | VGG16 and MobileNetV2 | 85.89, 93.09 |
| AbdelMaksoud, Barakat & Elmogy (2020) | Aptos 2019 | DenseNet121 | 86.5 |
| Taufiqurrahman et al. (2020) | Aptos 2019 | MobileNetV2+SVM | 85 |
| Raja Sarobin & Panjanathan (2022) | Aptos 2019 | Modified of Xception | 83.09 |
| CNN with DenseNet and ResNet | 93.18 | ||
| Nilatika, Pramono & Rahmadwati (2024) | Aptos 2019 | Custom CNN | 97.45 |
| Pamula et al. (2025) | Aptos 2019 | BCAN with AM-CapsuleNet | 94.6 |
| GA (Proposed model) | Aptos 2019 | GA-VGG16 | 89.30 |
| GA-DenseNet121 | 94.45 | ||
| GA-MobileNetV2 | 88.03 | ||
| PSO (Proposed model) | Aptos 2019 | PSO-VGG16 | 76.62 |
| PSO-DenseNet121 | 96.34 | ||
| PSO-MobileNetV2 | 97.41 |
In all comparisons, our hyper-tuned CNNs utilizing metaheuristic optimization consistently outperformed conventional approaches regarding accuracy, precision, and the recall across various testing scenarios. These findings provide strong empirical support for the critical role that GA and PSO play in fine-tuning hyperparameters of pre-trained CNNs. The optimization achieved through GA and PSO significantly enhances classification efficiency and accuracy, underscoring their essential contribution to improving the performance of medical image classification models.
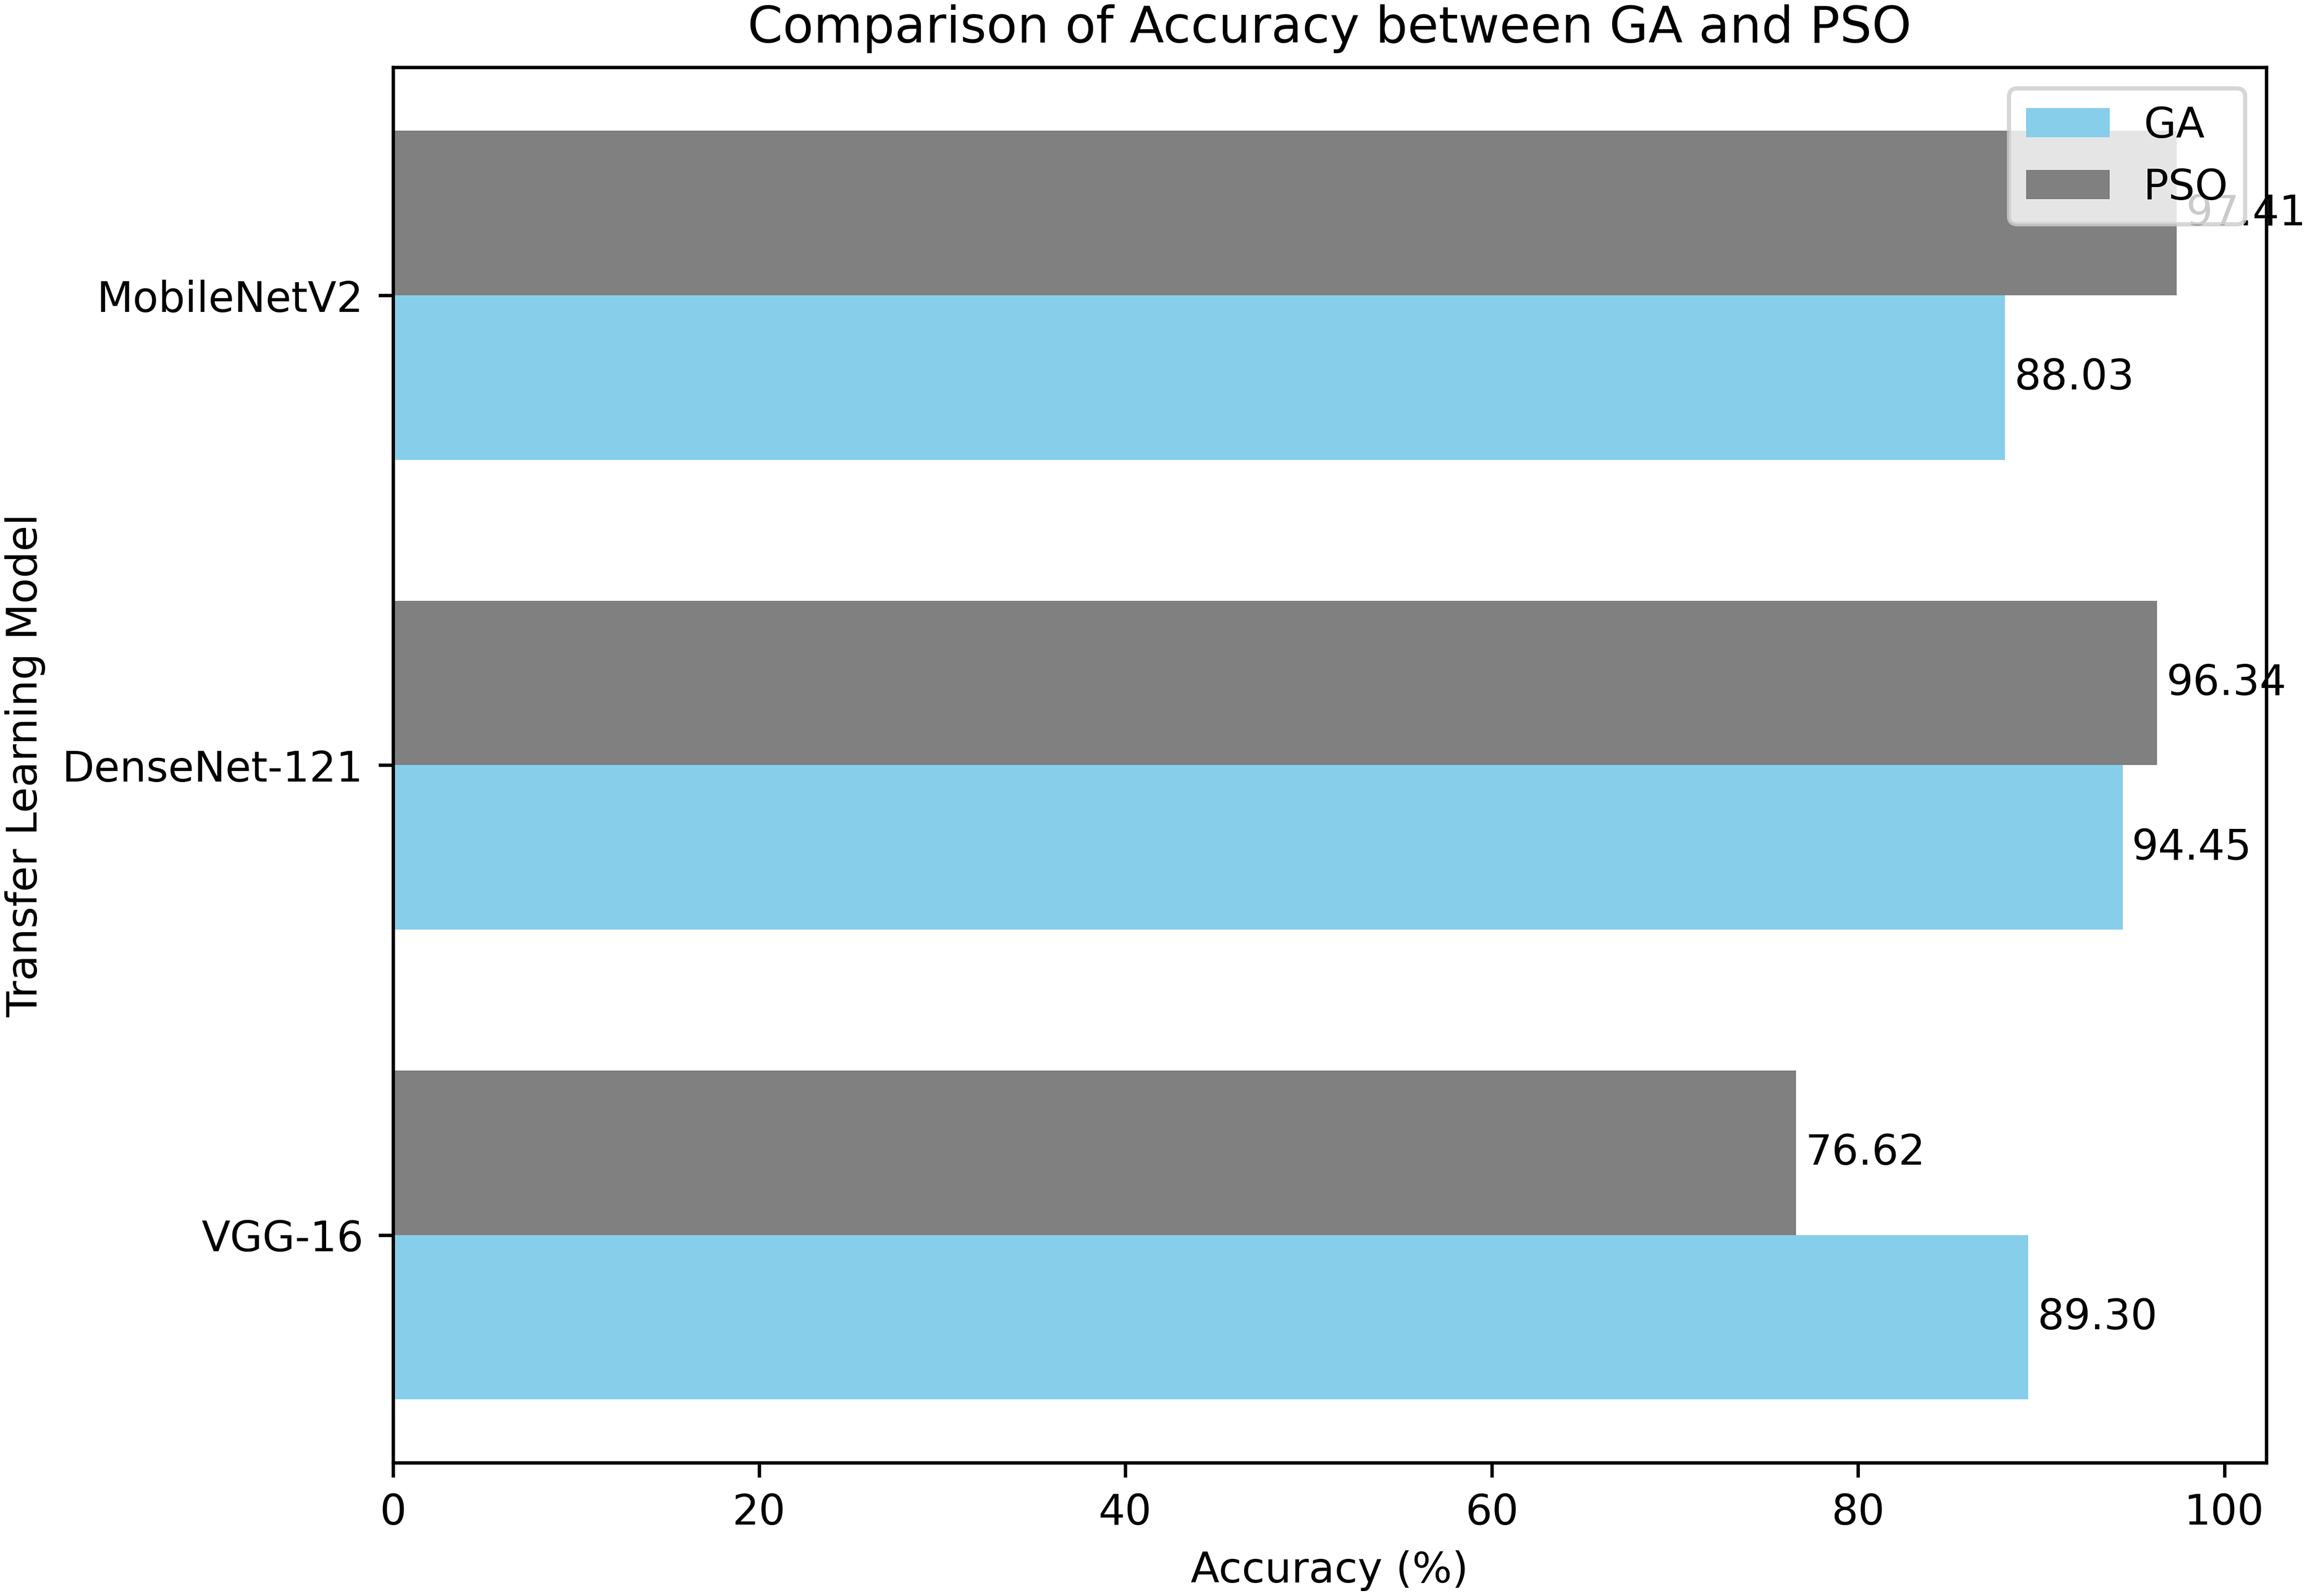
Our GA and PSO-based hyperparameter optimization strategy has proven highly effective in fine-tuning CNN models for DR detection. This approach enhances the model’s performance and demonstrates the potential for evolutionary algorithms in optimizing deep learning architectures for medical image analysis. Figure 12 illustrates the comparative classification accuracy of pretrained CNN models optimized using GA and PSO algorithms.
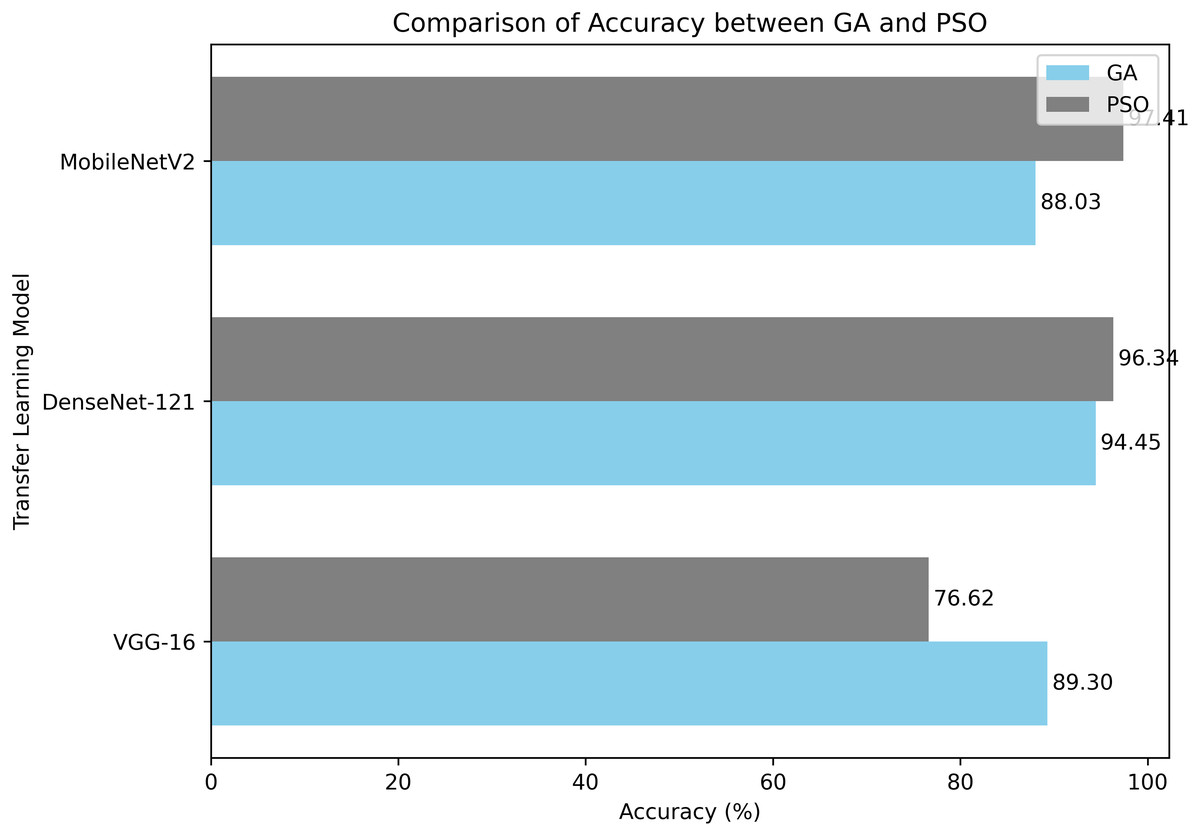
Figure 12: A comparison of PSO and GA with a pre-trained CNN models in terms of average classification accuracy.
Although the models trained using PSO demonstrated encouraging outcomes, it is crucial to recognize certain constraints:
The limited size of the dataset may hinder the model’s capacity to apply its knowledge to new, unknown data successfully. This emphasizes the need to use more enormous datasets or transfer learning methods to improve performance.
One might use resampling techniques and adjust class weights to enhance the model’s quality and address data imbalances.
PSO requires many resources and incurs significant computational charges, resulting in longer training durations and higher prices.
Utilizing contemporary tools and state-of-the-art computer technologies could overcome these obstacles, leading to increased production and reduced expenses.
Ethics and Privacy
This study strictly adheres to established ethical standards for medical imaging research. All datasets employed are publicly available and fully anonymized to ensure patient confidentiality and protect privacy. No personally identifiable information was accessed or processed during any stage of the experiments. Furthermore, the research complies with all relevant institutional and international guidelines governing the ethical use of medical data. Potential biases or ethical concerns related to data collection and usage were carefully identified and appropriately addressed.
Relevance from the medical perspective
The outcomes of this research exhibit evident clinical significance in illustrating how more sophisticated DL models can enhance the early diagnosis and grading of DR in regular healthcare practice. Through PSO optimization of CNN hyperparameters, the suggested framework achieves more precise and dependable diagnostic outcomes, thus facilitating ophthalmologists to make better-informed clinical decisions. This strategy has particular utility in settings with limited resources, where access to specialized clinicians could be limited, since it allows for quicker screening and prompt interventions to avert vision loss. The improved model performances constitute an important advancement toward the adoption of CAD tools in daily clinical routines, with the long-term objective of enhancing patient outcomes while alleviating the pressure on healthcare systems.
Conclusion and future works
This study investigates the significance of optimizing hyperparameters using PSO to improve the performance of pre-trained CNN models for DR classification. CNNs were chosen for their proficiency in effectively capturing spatial hierarchies in medical images, rendering them especially appropriate for DR fundus image categorization in contrast to conventional machine learning techniques that require manually constructed features. The APTOS 2019 dataset was used to test three well-known pre-trained CNN models: VGG16, DenseNet121, and MobileNetV2. PSO-MobileNetV2 had the best accuracy (97.41%) and the highest Kappa score (96. 77%), which means that it was very consistent in its classification.
MobileNetV2 was selected for training due to its computational efficiency, the use of depthwise separable convolutions, and the ability to maintain high classification accuracy with significantly lower computational cost compared to VGG16 and DenseNet121. In contrast to previous models, which are resource intensive and need significant processing capabilities, MobileNetV2 strikes a compromise between a lightweight architecture and effective feature extraction, making it especially appropriate for mobile and real-time applications. Its ability to surpass VGG16 and DenseNet121 while requiring fewer processing resources underscores its feasibility for categorizing the severity of DR.
In addition, PSO hyperparameter optimization markedly improved model performance by redefining critical parameters, including the learning rate, dropout rate, and number of filters. In contrast to traditional tuning approaches, PSO effectively explored the hyperparameter space, avoiding convergence to inferior solutions and expediting model improvement. This led to a 3% improvement in accuracy compared to the second-best model, GA-DenseNet121 (94.45%), which further supports the claim that PSO-MobileNetV2 is a good choice for CNN optimization.
In spite of the satisfactory results obtained in this study, there are a few limitations that must be overcome. While PSO has shown much potential in optimizing the performance of CNN models, overfitting risk still exists due to the small dataset size and imbalance in classes inherent to the problem may degrade the generalizability in real-world clinical settings. Although data augmentation methods were utilized to overcome the problem of a small dataset and class imbalance, further cross-validation on other test datasets is required in order to validate the generalizability and strength of the models. In addition, PSO optimization of CNN hyperparameters can be computationally burdensome, especially due to its high number of hyperparameters. This complexity can pose limitations on the scalability and real-world implementation of PSO methods. In future work, efforts will include the exploration of other metaheuristic optimization algorithms like white shark optimization (WSO), the bees algorithm (BA), or hybrid approaches for the fine tuning of a broader set of hyperparameters of interest in contrast to the ones tested in the study. In addition, extending the framework to other ophthalmologic conditions (like glaucoma or age-related macular degeneration) or to other medical imaging technologies may greatly boost its translational impact. In terms of deployment, the incorporation of the trained models within real time diagnosis tools remains problematic because of hardware limitations and variability in the quality of images across healthcare environments. Examining the use of lightweight deployment approaches and edge-based implementation will accordingly play a vital role in reducing accessibility barriers in low-resource settings.
Based on the above limitations, future work is planned in the following directions: model validation on other datasets like EyePACS or Messidor, implementation of other optimization methodologies in addition to PSO and GA, and extending the system for other ophthalmic disorders. Additionally, efforts will focus on reducing model complexity to support real-time deployment and assess performance reliability across a variety of imaging conditions and hardware configurations.
Supplemental Information
Supplemental Information 1
Introduce and explain my code.