
TS-YOLO: a lightweight real-time traffic sign detector in resource-constrained environments
- Published
- Accepted
- Received
- Academic Editor
- Giovanni Angiulli
- Subject Areas
- Artificial Intelligence, Computer Vision, Data Mining and Machine Learning, Real-Time and Embedded Systems, Neural Networks
- Keywords
- Traffic sign detection, Real-time detection, ITS, Resource-constrained environments, YOLOv8, RepCSP
- Copyright
- © 2025 Yu et al.
- Licence
- This is an open access article distributed under the terms of the Creative Commons Attribution License, which permits unrestricted use, distribution, reproduction and adaptation in any medium and for any purpose provided that it is properly attributed. For attribution, the original author(s), title, publication source (PeerJ Computer Science) and either DOI or URL of the article must be cited.
- Cite this article
- 2025. TS-YOLO: a lightweight real-time traffic sign detector in resource-constrained environments. PeerJ Computer Science 11:e3268 https://doi.org/10.7717/peerj-cs.3268
Abstract
Traffic sign detection is essential for ensuring driving safety in autonomous vehicles and advanced driver-assistance systems, particularly under limited computational resources and challenging real-world conditions such as extreme weather, occlusion, and diverse viewing angles. To address the trade-off between detection accuracy and computational efficiency, we propose TS-YOLO, a lightweight, real-time detector built on You Only Look Once version 8 (YOLOv8). TS-YOLO integrates a Repetition Cross Stage Partial (RepCSP) feature-enhancement module and a set of targeted training strategies designed to improve small-object recognition and to handle various challenging scenarios. Experimental results on the CCTSDB2021 dataset show that TS-YOLO achieves 98.4% mean Average Precision (mAP)@0.5 and 79.1% [email protected], with an inference time of only 0.6 ms per frame on embedded hardware. Compared to state-of-the-art methods—including Faster Region-based Convolutional Neural Network (Faster R-CNN), Efficient Object Detection (EfficientDet), and the original YOLOv8—TS-YOLO demonstrates superior accuracy and faster inference. Further robustness evaluations confirm consistent performance across adverse weather (fog, rain, low light), various road types (urban, rural, unstructured), and challenging object characteristics (scale variation, occlusion, irregular shapes). These findings suggest that TS-YOLO is a practical, high-performance solution for traffic sign detection in resource-constrained, complex driving environments.
Introduction
Visual perception in intelligent vehicles is critical to autonomous driving, and traffic-sign detection constitutes a core component (Li & Wang, 2018). Because the accuracy of traffic-sign recognition directly influences driving safety, it has become a central research focus within Intelligent Transportation Systems (ITS). Nevertheless, real-world traffic-sign detection remains challenging owing to diverse environmental conditions, physical degradation of signs, variation in sign designs, and perspective distortions introduced by differing camera angles.
Environmental complexity: Variable weather conditions—such as rain, fog, or intense sunlight—can hinder detection performance.
Physical degradation and occlusion: Prolonged outdoor exposure may cause signs to fade, tilt, or become partially obscured, whereas roadside objects (e.g., plants, buildings, vehicles, pedestrians) can obstruct the camera’s view.
Design diversity and color variation: The coexistence of multiple signs with distinct patterns and hues within a single scene substantially increases detection difficulty.
Perspective variation: Oblique or non-frontal viewpoints can introduce geometric distortion, blur, and related aberrations, thereby further complicating detection.
To mitigate these challenges, we propose TS-YOLO, a structurally enhanced variant of the state-of-the-art You Only Look Once version 8 (YOLOv8) (Jocher, Chaurasia & Qiu, 2023). Optimized for resource-constrained deployment via tailored architecture and training strategies, TS-YOLO offers three principal contributions:
-
(1)
a lightweight, computation-efficient detection architecture customized to vehicular constraints;
-
(2)
robust performance on small-object and multi-angle detection across diverse traffic conditions (e.g., inclement weather, nighttime, high-speed scenes); and
-
(3)
a design philosophy emphasizing deployability and reproducibility, thereby ensuring real-world applicability within intelligent transportation systems.
Specifically, TS-YOLO integrates Repetition Cross Stage Partial (RepCSP) modules that exploit re-parameterization (RepVGG blocks) to facilitate multi-branch training while collapsing into a single branch at inference, thereby reducing computation. In addition, the framework incorporates TaskAlignedAssigner to balance classification and regression, and distribution focal loss to refine bounding-box localization. Moreover, we discard generic pre-training to specialize the network for traffic sign detection and to minimize overfitting to non-target datasets. By balancing accuracy and speed, TS-YOLO demonstrates strong potential for real-world automotive applications.
Related work
Traffic sign detection: existing approaches
Deep learning-based traffic sign recognition has attracted considerable attention. Early studies combined faster region-based convolutional neural network (Faster R-CNN) with MobileNet (Li & Wang, 2018; Howard et al., 2017), whereas subsequent work integrated the Hue-Saturation-Value (HSV) color space into enhanced LeNet-5 architectures (Cao et al., 2019; LeCun et al., 2002) and optimized versions of mask region-based convolutional neural network (Mask R-CNN) (Tabernik & Skočaj, 2019; He et al., 2017). Efforts to create lightweight models have encompassed knowledge distillation (Zhang et al., 2020), improvements to YOLOv4-Tiny (Bochkovskiy, Wang & Liao, 2020; Wang et al., 2021), and the use of generative adversarial networks (GANs) to generate diverse training samples (Dewi et al., 2021). Additionally, adaptations of YOLOv5 have been proposed to enhance small traffic sign detection (Chu et al., 2023; Jocher, Chaurasia & Qiu, 2020). An improved sparse region-based convolutional neural network (Sparse R-CNN) (Liang et al., 2022) incorporates coordinate attention and a feature pyramid to enhance small traffic sign detection. The accompanying self-adaption augmentation (SAA) and detection time augmentation (DTA) modules mitigate practical challenges, such as illumination variation. On the Beijing Union University Chinese Traffic Sign Detection Benchmark (BCTSDB) dataset, this configuration achieves 99.1% AP50 but operates at a relatively low frame rate of 18 frames per second (FPS). TSD-YOLO (Du et al., 2024), by contrast, employs SPD-Conv to preserve spatial details, SK attention to suppress background noise, and Weighted Intersection over Union v3 (WIoUv3) to alleviate class imbalance. It achieves 90.6% mean Average Precision at intersection over union threshold of 0.50 (mAP50) on the TT100K dataset at a high speed of 59 FPS, demonstrating its suitability for real-time autonomous driving scenarios.
Nonetheless, many existing methods still struggle to balance accuracy with speed under challenging conditions such as diminutive object sizes, drastic viewpoint changes, and complex illumination (He et al., 2017; Zhang et al., 2020; Bochkovskiy, Wang & Liao, 2020; Wang et al., 2021; Dewi et al., 2021). These constraints necessitate detectors that are simultaneously robust and efficient. Such challenges become even more pronounced in resource-constrained in-vehicle environments, where high computational overhead is untenable (Alaba, Gurbuz & Ball, 2024). Accordingly, designing a robust, lightweight network capable of operating across diverse driving scenarios remains imperative.
General object detection frameworks
Object detection automatically classifies and localizes objects in images and videos, thereby producing category labels and bounding boxes for each detected instance (Chen et al., 2024). Existing methods are commonly categorized by their processing pipeline (one-stage vs. two-stage) and by the mechanism used to generate bounding boxes (anchor-based vs. anchor-free).
One-stage detectors employ a linear-regression paradigm to regress bounding boxes, thereby achieving the speed required for real-time applications (Zhang & Cloutier, 2022). These algorithms are regarded as end-to-end detectors. Currently, numerous state-of-the-art models follow the one-stage paradigm, whose steadily improving accuracy provides an effective balance between speed and precision.
As the name implies, two-stage detectors divide the process into two sequential stages. For instance, in Faster R-CNN, the first stage generates region proposals via a region proposal network (RPN) (Ren et al., 2015). In the second stage, a classification head assigns categories and a regression head refines the coordinates, producing the final prediction boxes. Such algorithms attain high accuracy with low miss and false-positive rates; however, their extended training time and slower inference hinder real-time deployment.
Relative to two-stage methods, one-stage detectors extract features and regress boxes in a single pass, after which non-maximum suppression (NMS) is applied (Yu et al., 2023). By contrast, two-stage algorithms insert an RPN to generate region proposals before classification and regression.
Anchor-based detectors remain predominant in object detection (Zhang et al., 2020; Chu et al., 2023; Ren et al., 2015; Redmon & Farhadi, 2018; Dai et al., 2016; Redmon & Farhadi, 2017; Wang et al., 2019); representative examples include YOLOv2–YOLOv5 (Zhang et al., 2020; Chu et al., 2023; Dai et al., 2016; Redmon & Farhadi, 2017), YOLOv7 (Wang, Bochkovskiy & Liao, 2023), RetinaNet (Lin et al., 2017), Single Shot MultiBox Detector (SSD) (Liu et al., 2016), and Efficient Object Detection (EfficientDet) (Tan, Pang & Le, 2020). Additionally, two-stage models—such as Faster R-CNN (Ren et al., 2015), Feature Pyramid Network (FPN) (Lin et al., 2017), Cascade R-CNN (Cai & Vasconcelos, 2018), and Trident-Net (Li et al., 2019)—also rely on anchor-based mechanisms.
Anchor-free approaches have likewise gained popularity and can be broadly divided into key-point-based and dense-prediction-based methods. Key-point-based detectors first locate the top-left and bottom-right corners of an object and then associate these points with offset vectors to form the prediction box. For instance, YOLOX (Ge et al., 2021), CenterNet (Duan et al., 2019), CornerNet (Law & Deng, 2018), ExtremeNet (Zhou, Zhuo & Krahenbuhl, 2019), YOLOv6 (Li et al., 2022), and YOLOv8 all utilize anchor-free key-point mechanisms. Dense-prediction methods, by contrast, directly classify each pixel (x, y) inside a candidate box as positive or negative. They subsequently regress four distances—from the point to the top, bottom, left, and right edges—to recover the bounding box. Notable dense-prediction, anchor-free detectors include Feature Selective Anchor-Free Module (FSAF) (Zhu, He & Savvides, 2019), Fully Convolutional One-Stage Object Detector (FCOS) (Tian et al., 2019), Fovea-Based Box Prediction Network (FoveaBox) (Kong et al., 2020), and Soft Anchor-Point Detection (SAPD) (Zhu et al., 2020). Both paradigms typically exhibit strong performance on small objects while imposing lower hardware requirements.
Rationale for baseline selection
Ensuring real-time detection within stringent hardware constraints is paramount in safety-critical domains, such as autonomous vehicles and advanced driver-assistance systems (ADAS). Traffic-sign detection exemplifies this challenge, as signs are typically small, may appear under adverse weather conditions, and necessitate immediate processing to ensure driver safety. Consequently, one-stage, anchor-free detectors are increasingly attractive, owing to their low latency and ease of deployment on embedded platforms.
Guided by these considerations, we adopt YOLOv8—an anchor-free, one-stage detector—as the baseline for our study. Its streamlined architecture and training strategies are leveraged to address small-object detection under resource constraints and in complex road environments. By incorporating targeted training schemes that account for variations in sign scale and orientation, the resulting TS-YOLO model offers a promising route toward higher detection accuracy and robustness in complex, real-world road scenarios.
Method
Architecture
YOLOv8
YOLOv8 serves as the backbone of our detection framework. We selected YOLOv8 because it offers a favorable trade-off between accuracy and efficiency, rendering it particularly suitable for resource-constrained environments. Like YOLOv5, YOLOv8 comprises five model sizes (n, s, m, l, and x), enabling deployment across devices that range from resource-constrained edge hardware to high-performance servers. Among these variants, YOLOv8n delivers the highest inference speed and maintains a compact architecture, making it well suited to low-compute vehicular platforms where traffic-sign detection is critical. Consequently, this study adopts YOLOv8n as the primary backbone.
Architecturally, YOLOv8 comprises a robust backbone for feature extraction, an advanced neck—a Path Aggregation Network (PANet) (Liu et al., 2018) combined with an FPN (Lin et al., 2017)—for multi-scale feature fusion, and a dedicated prediction head for classification and regression. Drawing inspiration from the Efficient Layer Aggregation Network (ELAN) design in YOLOv7 (Wang, Bochkovskiy & Liao, 2023), YOLOv8 substitutes the Cross Stage Partial Connection 3 (C3) modules used in YOLOv5 with a C2F structure, thereby enhancing feature aggregation while preserving a lightweight design. Each model variant additionally employs a distinct channel configuration, which further improves performance without relying on a single, universally scaled parameter set.
YOLOv8 utilises an anchor-free detection head, which improves accuracy for small objects. The head adopts a decoupled framework that produces multi-scale predictions and significantly accelerates training convergence. Specifically, the architecture separates classification from bounding-box regression into distinct branches. For bounding-box regression, the model applies CIoU (Zheng et al., 2020) and DFL (Li et al., 2020), whereas binary cross-entropy (BCE) is used for classification. The overall loss is calculated as a weighted sum of these individual terms.
RepVGGBlock
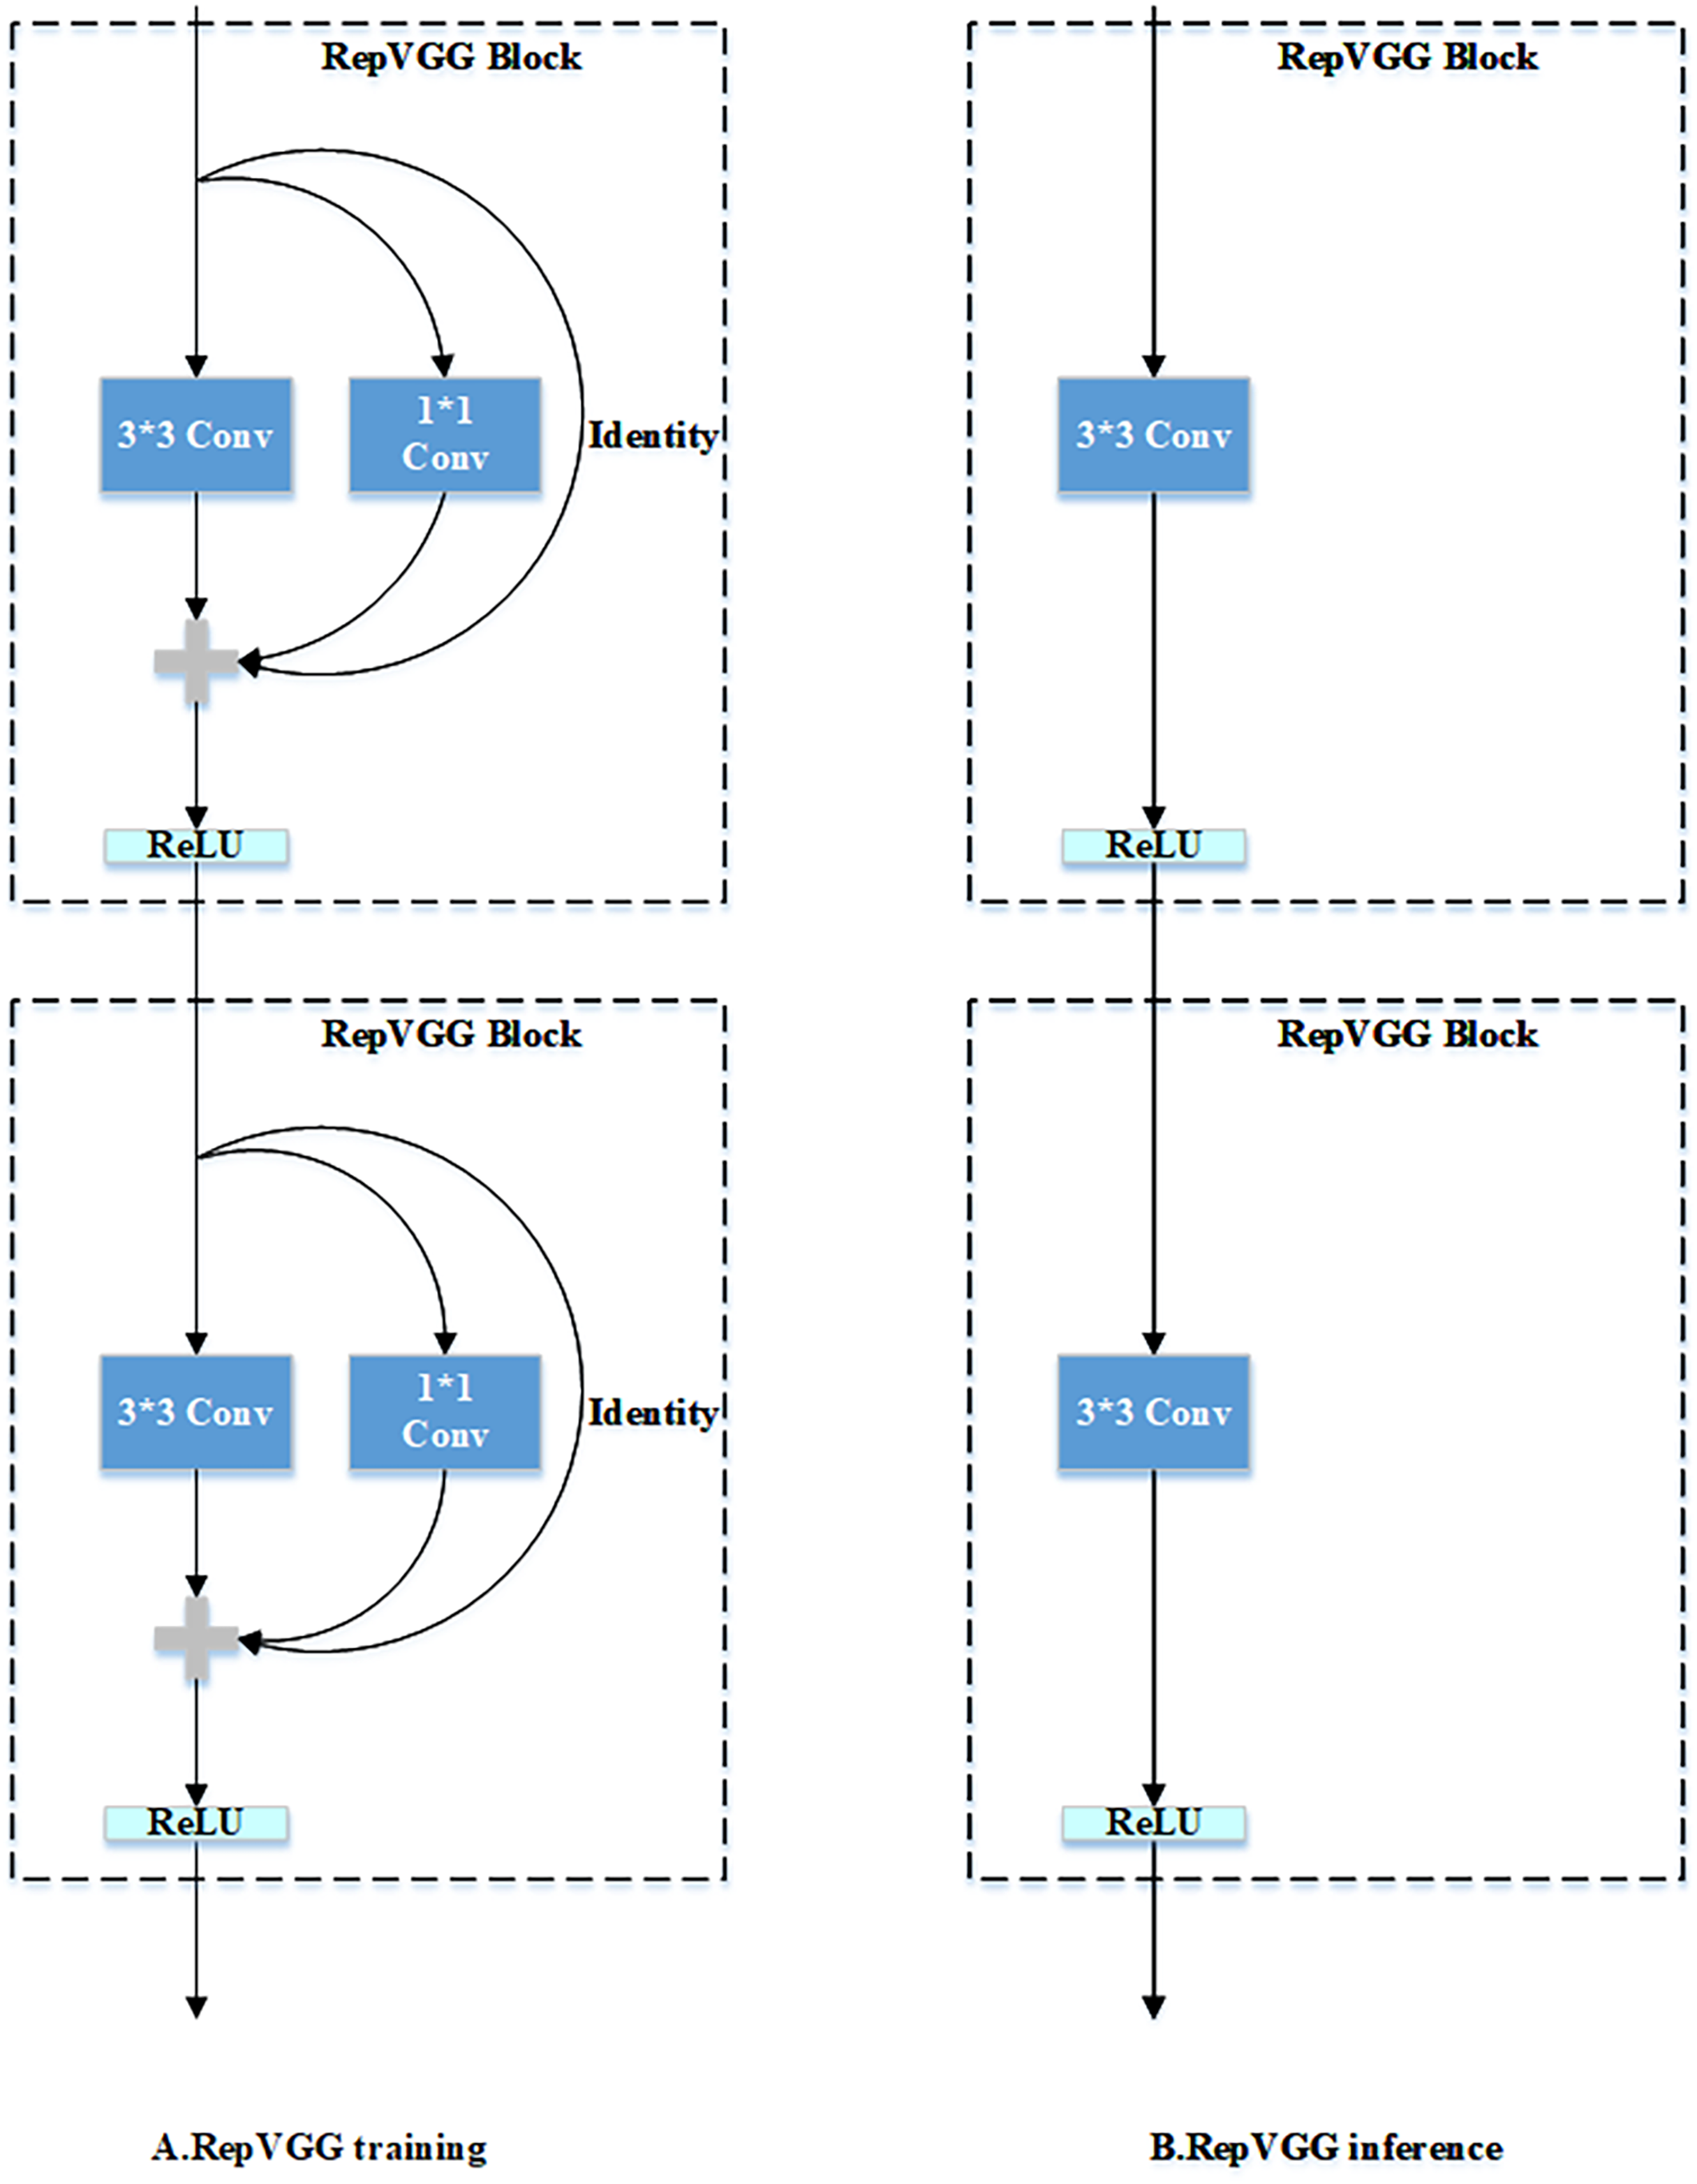
Numerous convolutional neural network architectures utilize multi-branch designs to capture richer features, as observed in architectures like ResNet (He et al., 2016) and Inception (Szegedy et al., 2015). However, these designs may hinder parallelism and reduce inference efficiency. RepVGG (Ding et al., 2021) addresses this issue by training with multiple branches but consolidating them into a single branch during inference, thus maintaining strong representational capacity without incurring additional runtime overhead. In the training phase, RepVGG employs a 3 × 3 convolution, a 1 × 1 convolution, and an identity mapping. These components are re-parameterized into a single 3 × 3 convolution during inference.
Thus, RepVGG overcomes these limitations by utilizing a multi-branch configuration for training and transitioning to a single-branch architecture for inference. Specifically, during the inference phase, the network relies on a streamlined 3 × 3 convolutional structure integrating ReLU activations. The core concept of RepVGG lies in structural re-parameterization, where a multi-branch network trained in the training phase transitions into a single-branch during inference, thereby ensuring efficient performance without additional runtime overhead.
Figure 1 illustrates that the RepVGG network consists of a sequence of identical RepVGGBlocks. In the training phase, each block comprises a 3 × 3 convolution, a 1 × 1 convolution, and an identity mapping. During inference, the multiple branches are consolidated into a single convolutional operation, obviating the need for separate 1 × 1 convolutions and identity mappings. ResNet employs a residual connection to model information flow as , where represents a 3 × 3 convolution for feature representation and denotes an identity mapping. This mechanism facilitates the acquisition of semantic features. Building on this concept, the RepVGGBlock integrates ResNet’s residual connection and enhances it with a 1 × 1 convolutional branch, yielding three distinct convolutional branches for the shortcut connection. The information flow in RepVGGBlock is expressed as , where represents the shortcut connection via a 1 × 1 convolution.
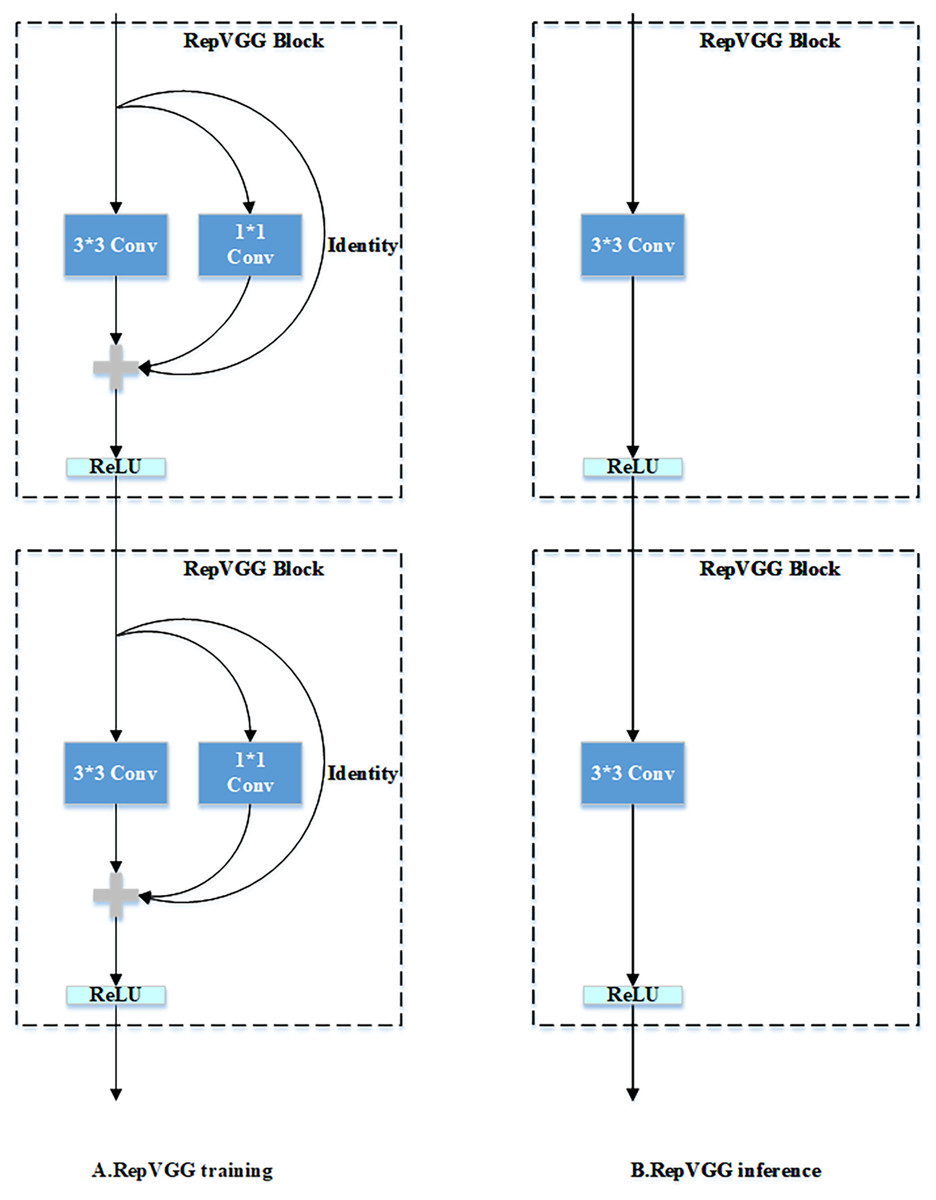
Figure 1: Overview of RepVGG: training and inference pipeline.
Network structure
The RepVGGBlock utilizes model reparameterization to merge multi-branch convolutions into a single-branch convolutional network. During training, the kernel parameters from three convolutional branches are merged into those of a single branch, which is subsequently used for inference and prediction. This approach enables a seamless transition from training to inference phase.
Inspired by CSPNet (Wang et al., 2020), YOLOv8 integrates the cross stage partial (CSP) architecture into its backbone and neck structures and incorporates the CSP Bottleneck with 2 Convolutions (C2F) module. This module inherited the cross-stage partial connection design from CSPNet by splitting the feature map into two branches (main path and shortcut path). It enables cross-stage gradient flow bifurcation, effectively alleviating the vanishing gradient problem and enhancing the deep network’s feature representation capability.
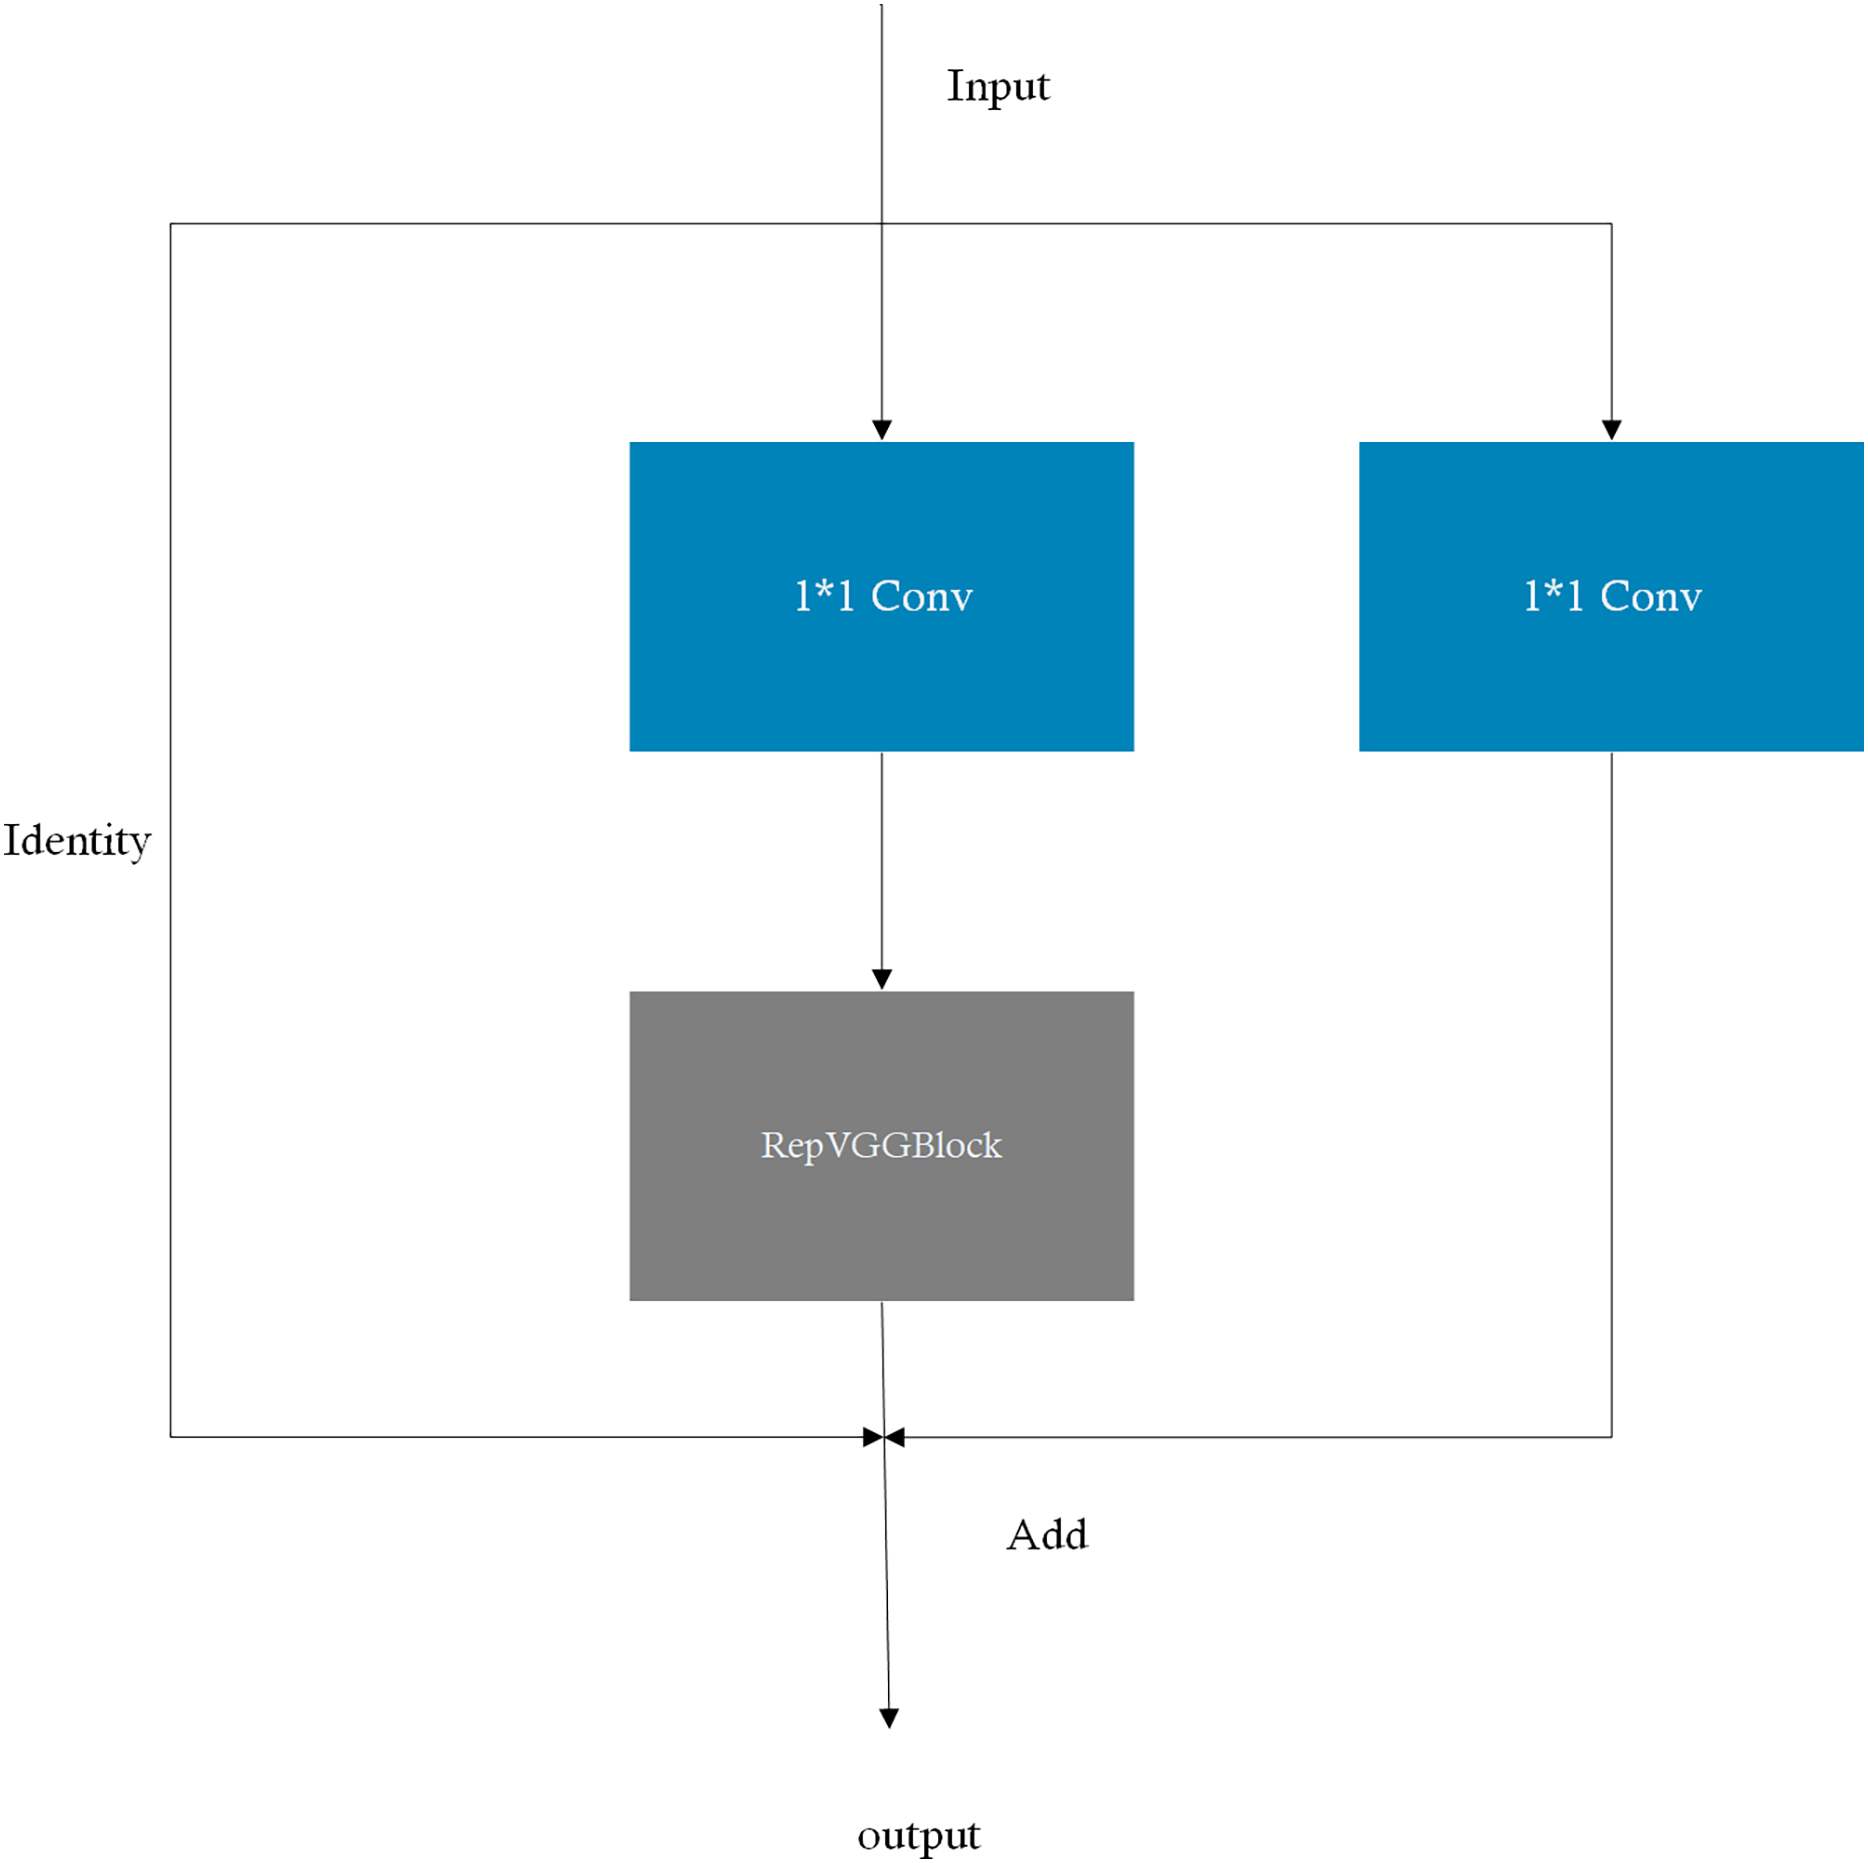
More specifically, the RepVGGBlock concept is embedded into the CSP module, yielding the RepCSP block, which merges multi-branch convolutions into a single branch during inference. The RepVGGBlock enhances model training through structural re-parameterization and can subsequently be fused into a single branch during inference, thereby reducing the number of parameters and computational load while increasing inference speed. The CSP module facilitates the extraction of rich semantic features. By integrating the RepVGGBlock into the CSP module and simplifying the CSP block structure, the model’s detection performance is enhanced. The structural diagram of the RepCSP block is presented in Fig. 2.
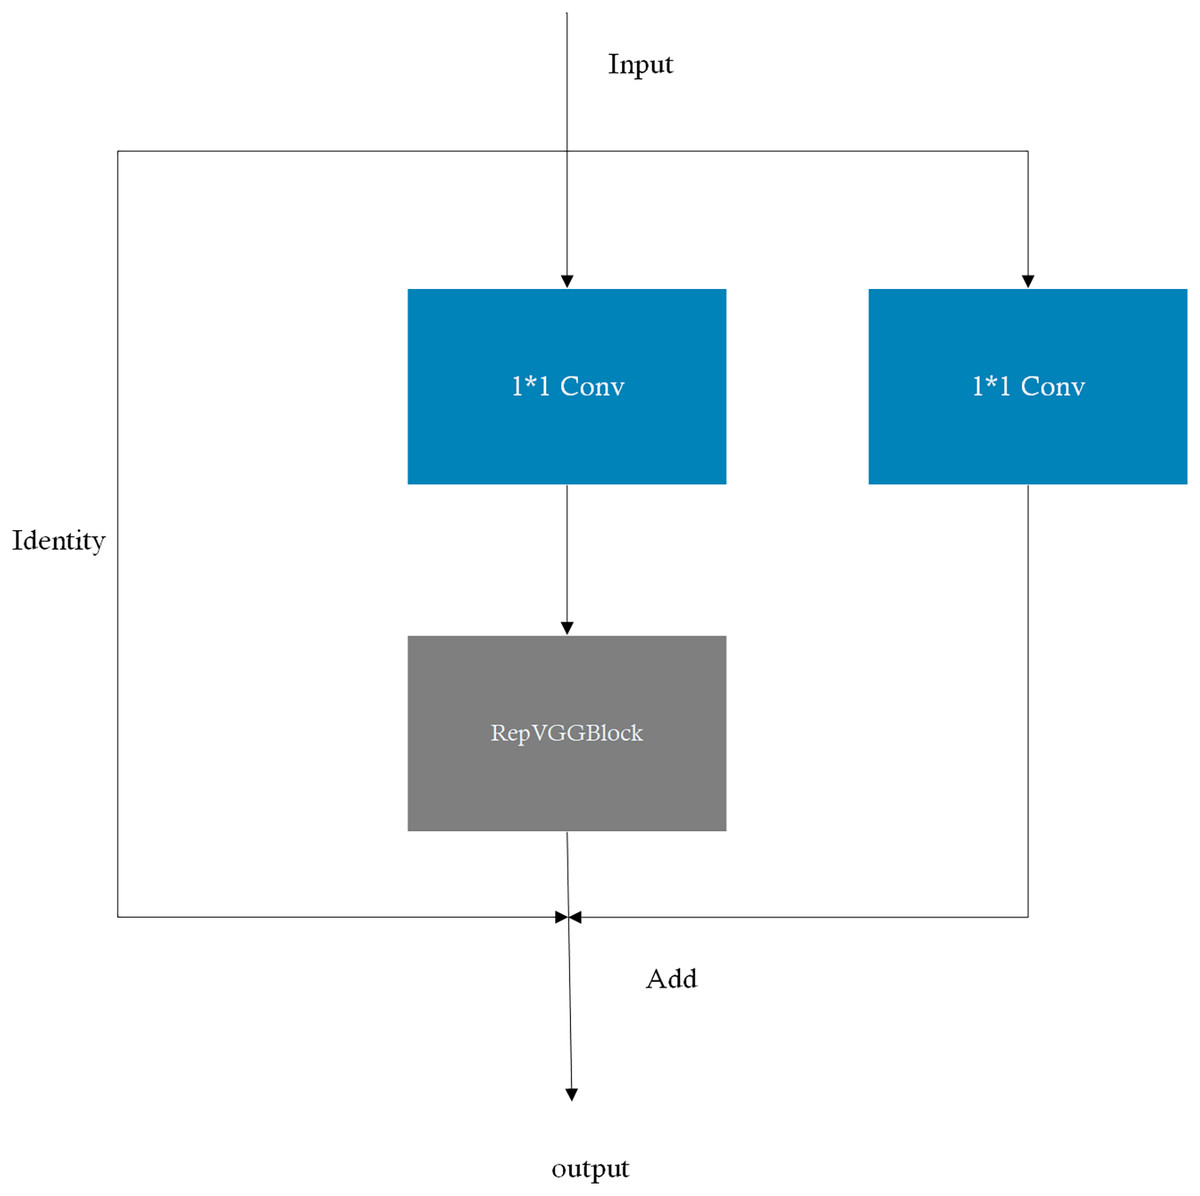
Figure 2: Architecture of the RepCSP Block in TS-YOLO.
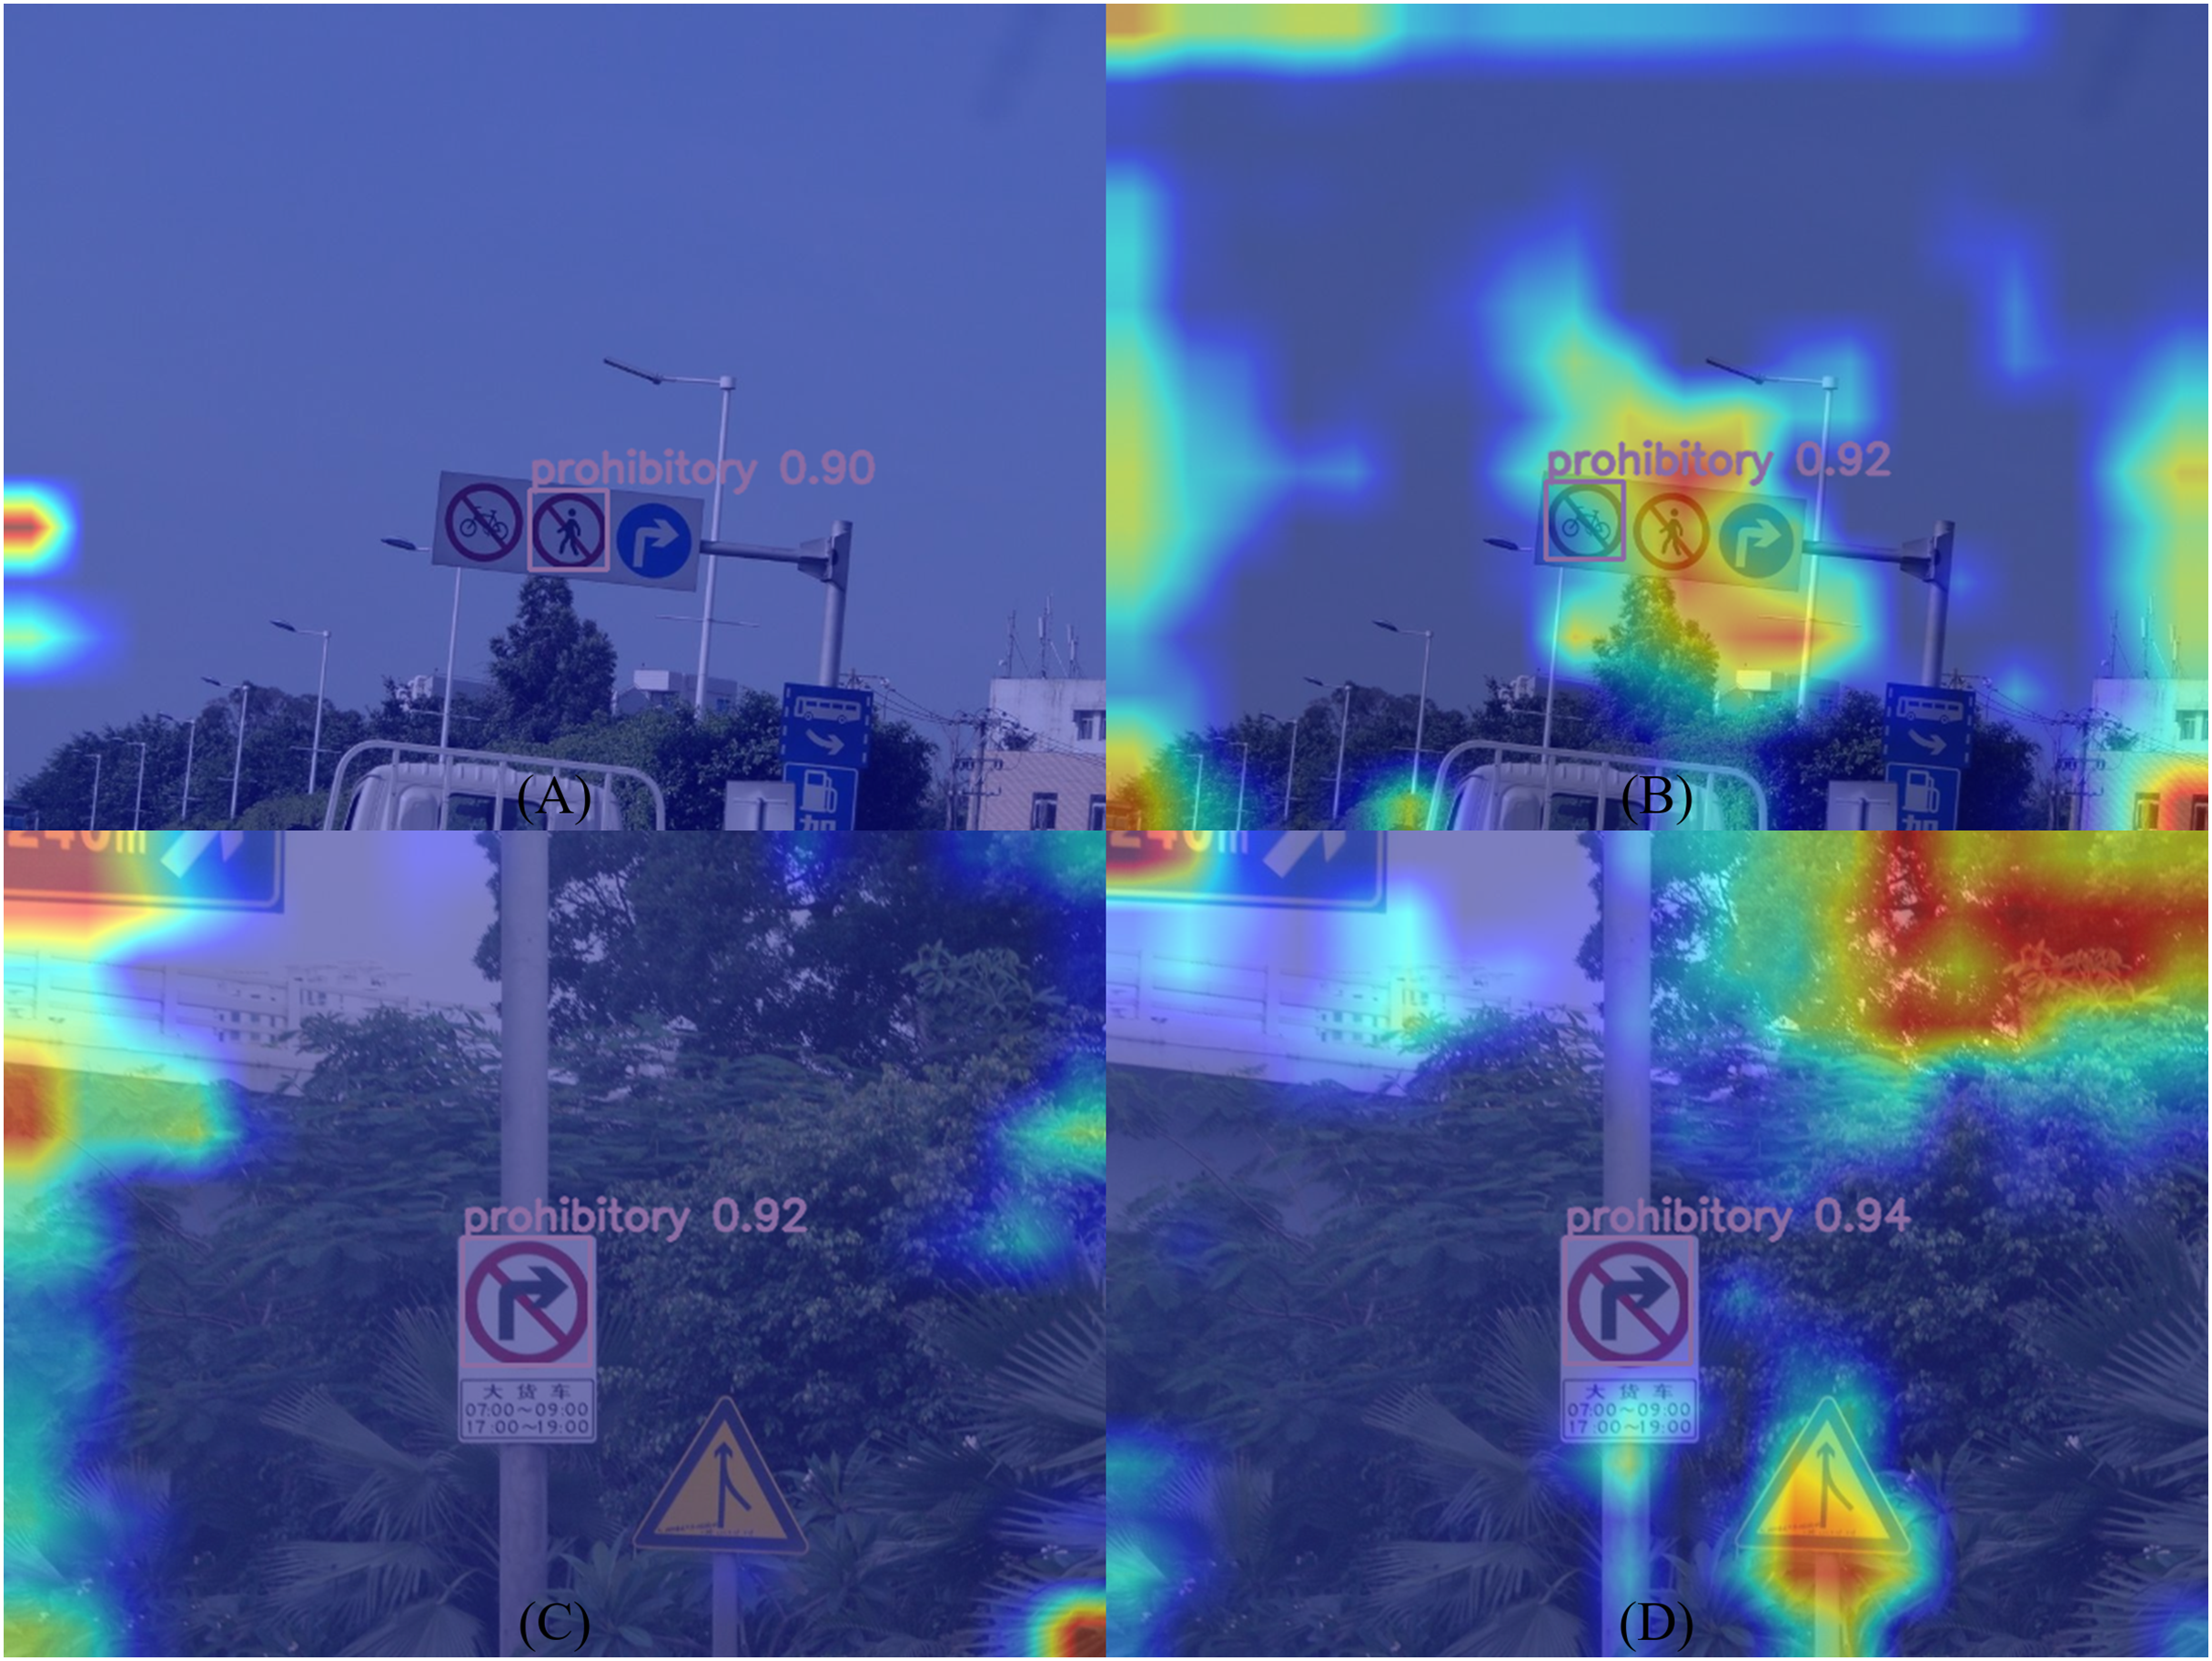
To systematically evaluate the feature enhancement mechanism of the RepCSP module, this study employed Grad-CAM++ (Chattopadhay et al., 2018) as an attention visualization framework. As illustrated in Fig. 3, compared to the YOLOv8 baseline, TS-YOLO exhibits enhanced activation responses in the edge regions of traffic signs within its attention heatmaps, indicating improved spatial focus on critical target areas. This enhanced feature representation can be attributed to the multi-scale feature preservation achieved by the re-parameterized branch, where structural re-parameterization facilitates cross-layer feature integration through learnable connection pathways.
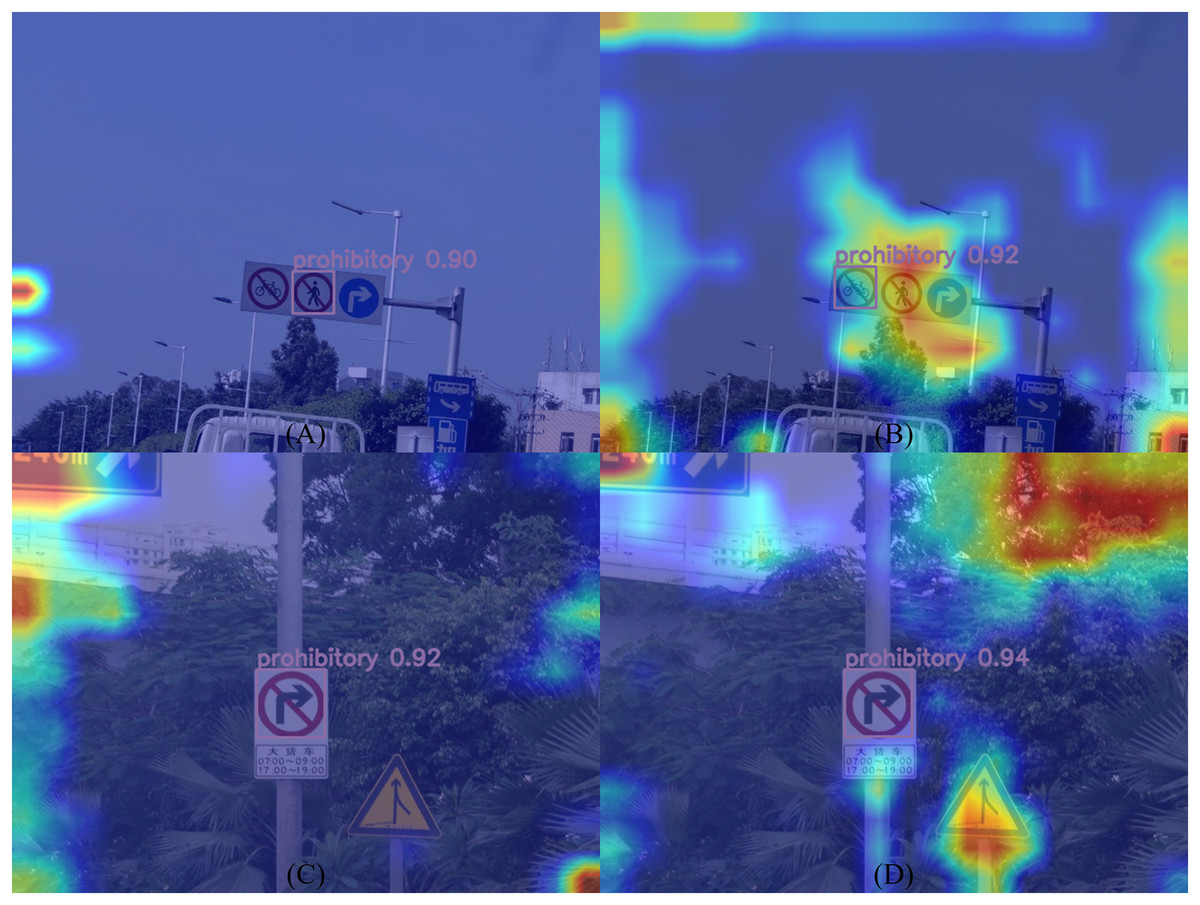
Figure 3: Attention heatmap comparison: (A) and (C) YOLOv8 vs. (B) and (D)TS-YOLO.
The final architecture of TS-YOLO is presented in Fig. 4, with modified components labeled using “△”. All C2F modules in DarkNet-53 and the neck are replaced with RepCSP blocks. The proposed RepCSP-based backbone architecture enables the network to learn discriminative features more effectively while preserving structural simplicity for deployment. Figure 5 presents the visualization of feature maps extracted by TS-YOLO.
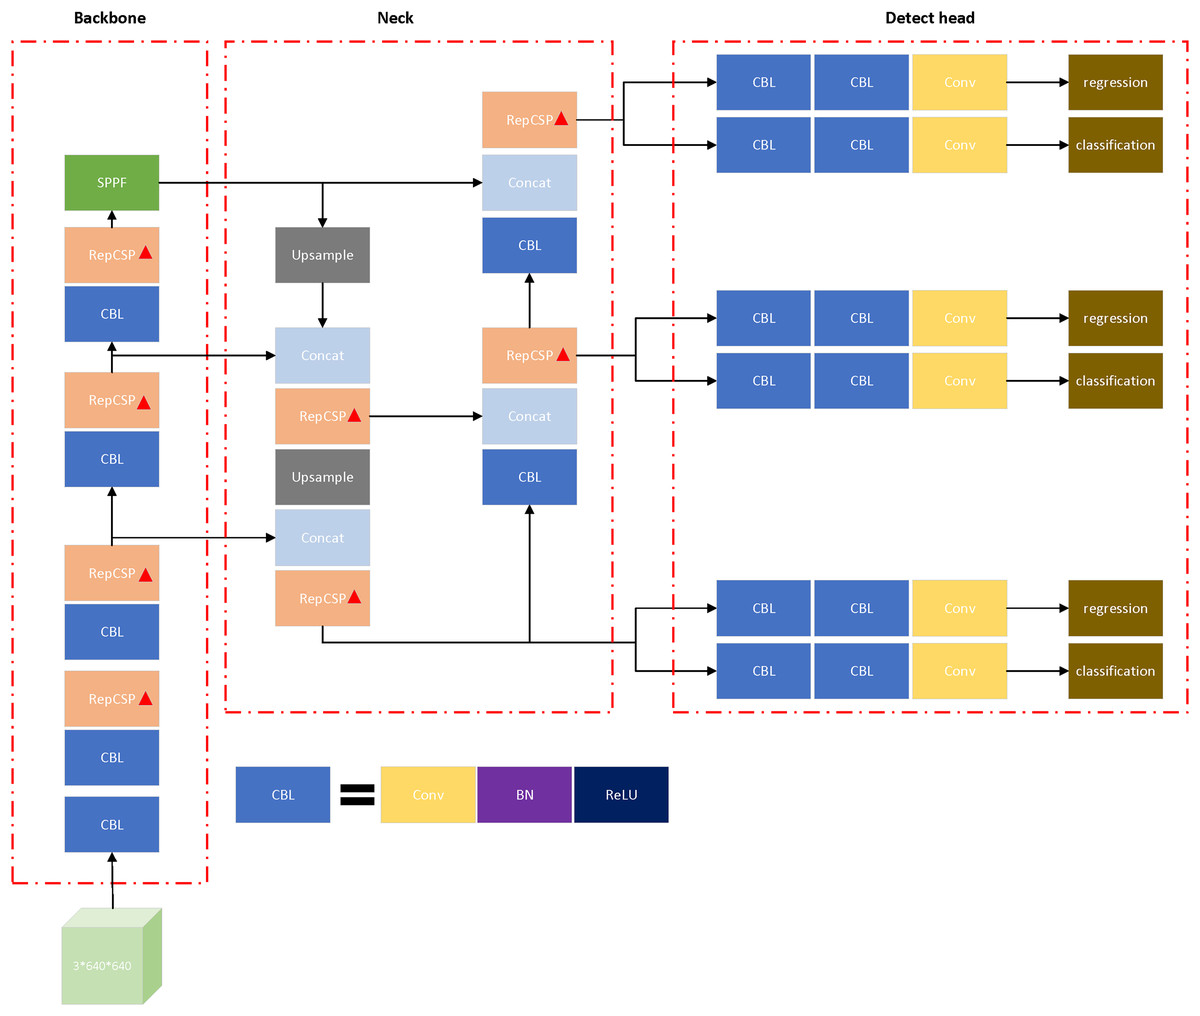
Figure 4: Architecture of TS-YOLO with modifications to YOLOv8 Marked by ‘△’.
“Conv” refers to a convolution layer; “BN” stands for batch normalization; “ReLU” is an activation function; and “CBL” is a combination of Conv, BN, and ReLU layers.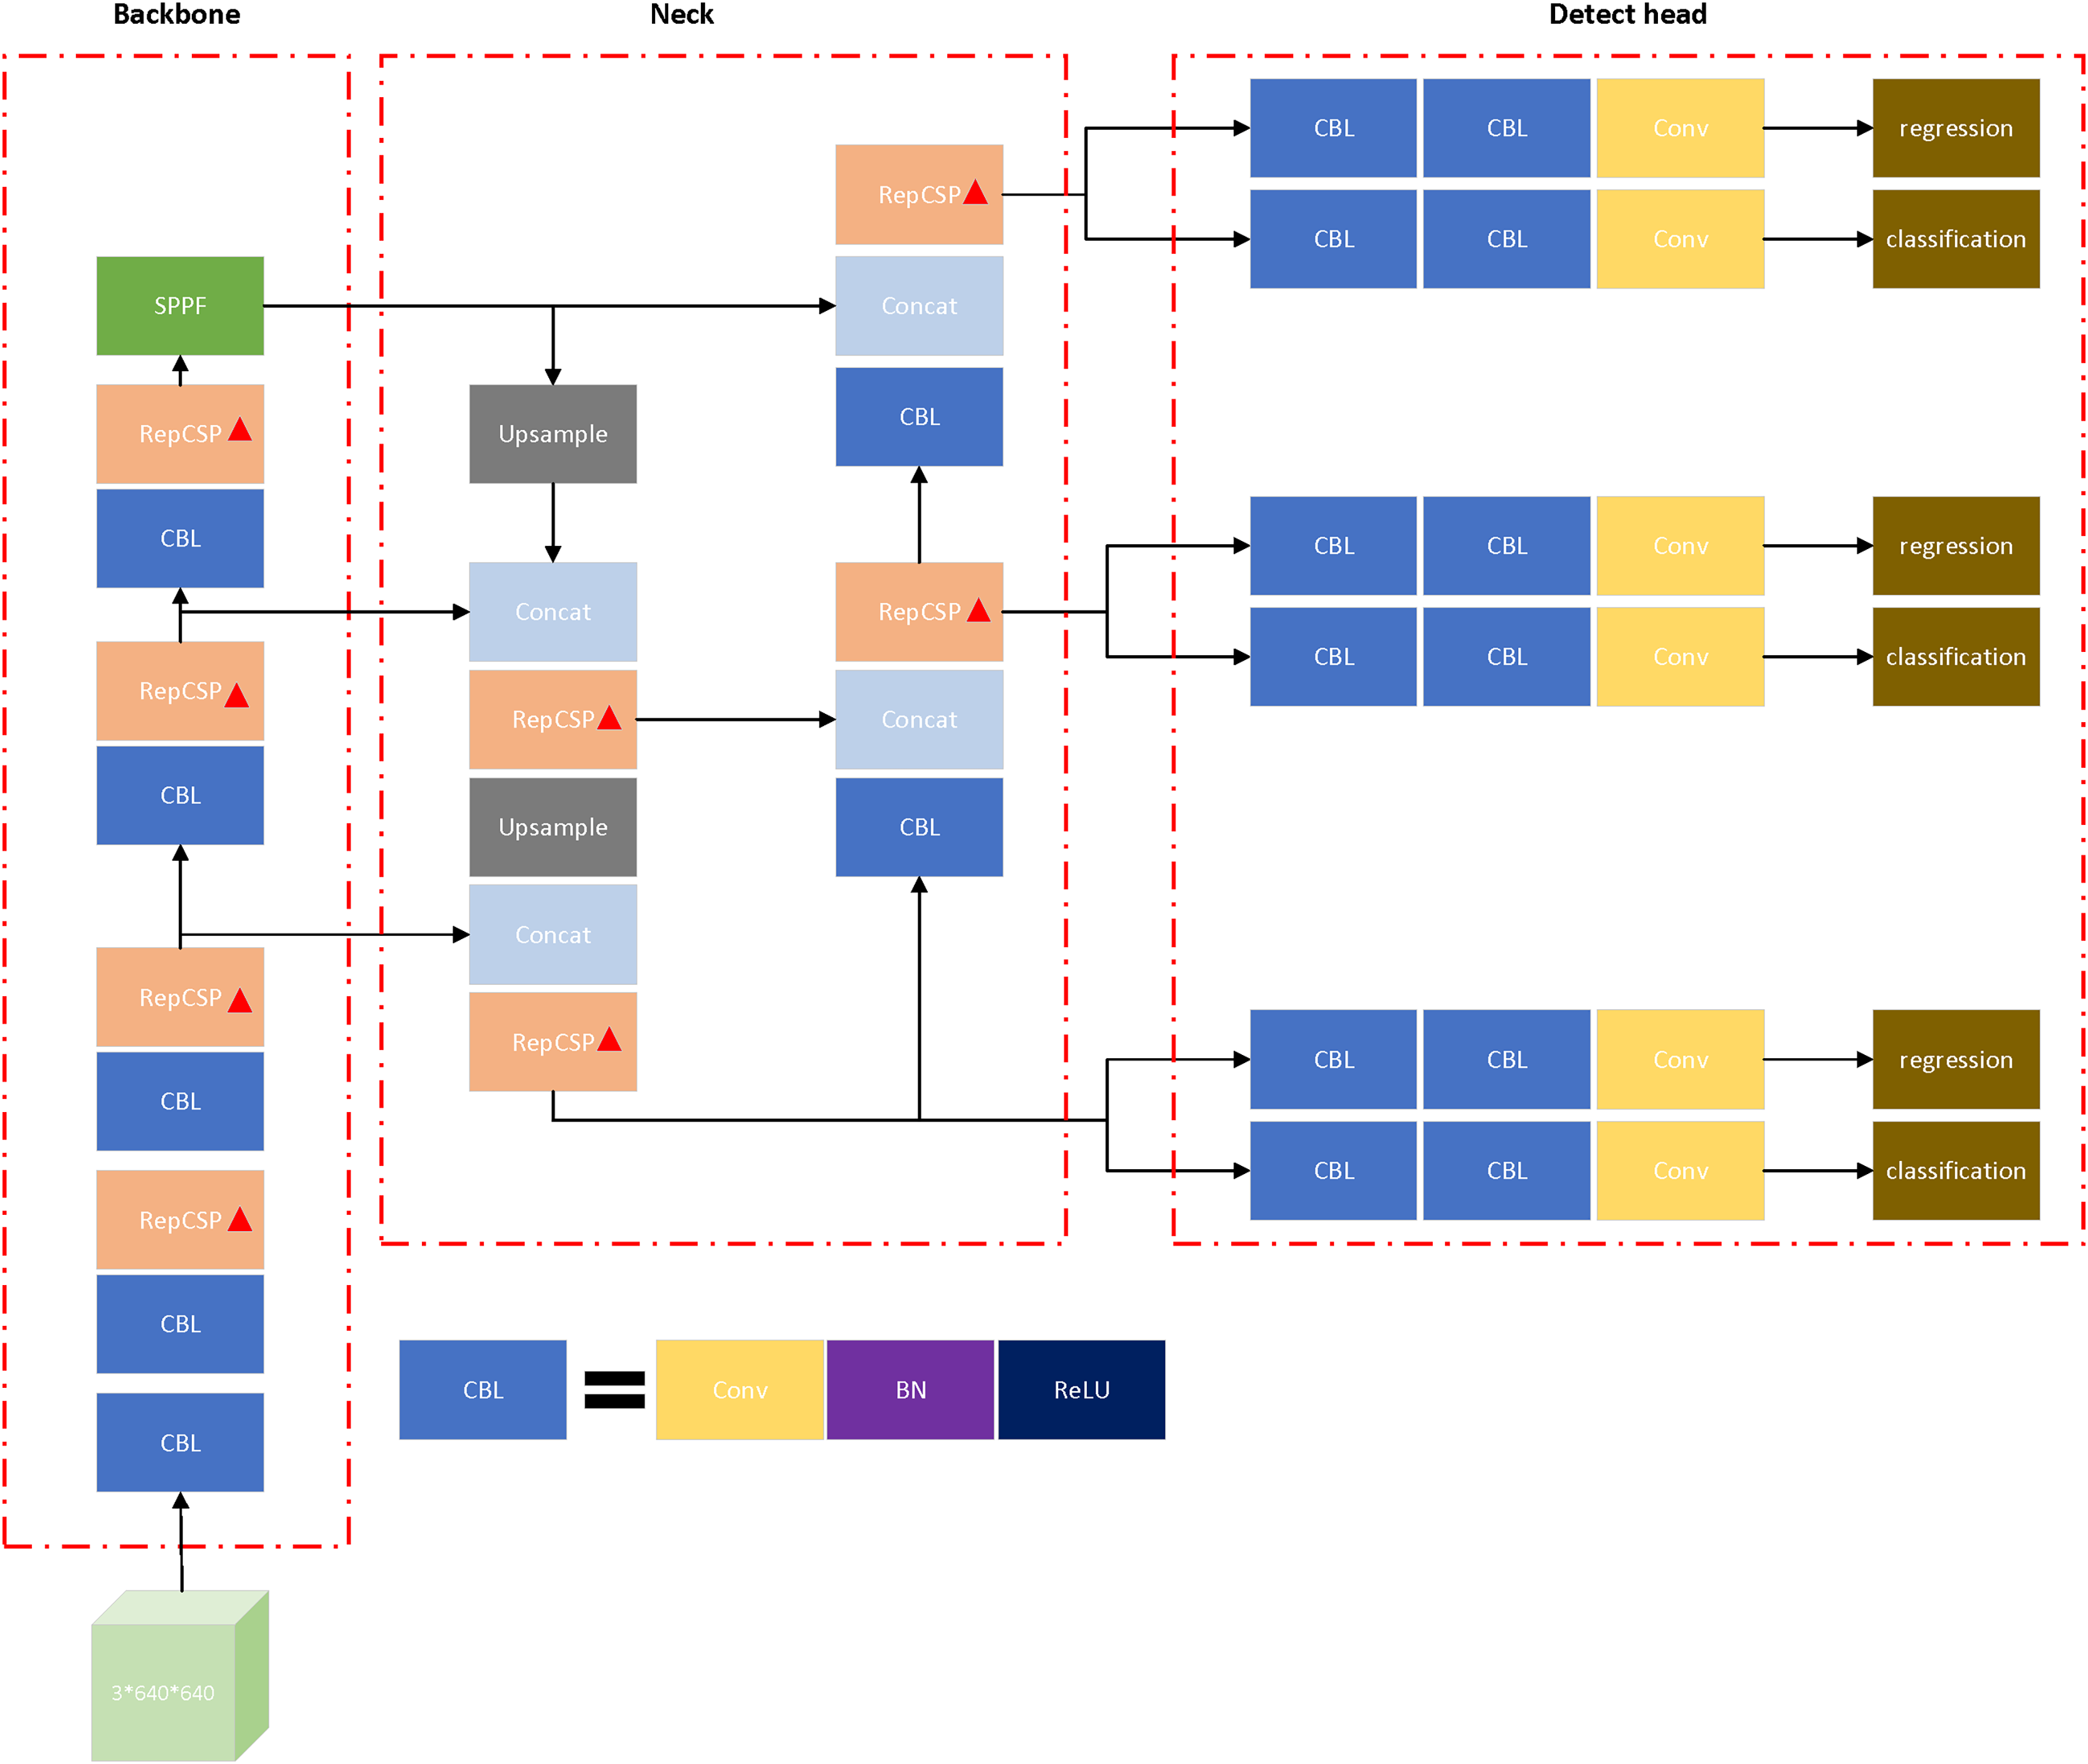
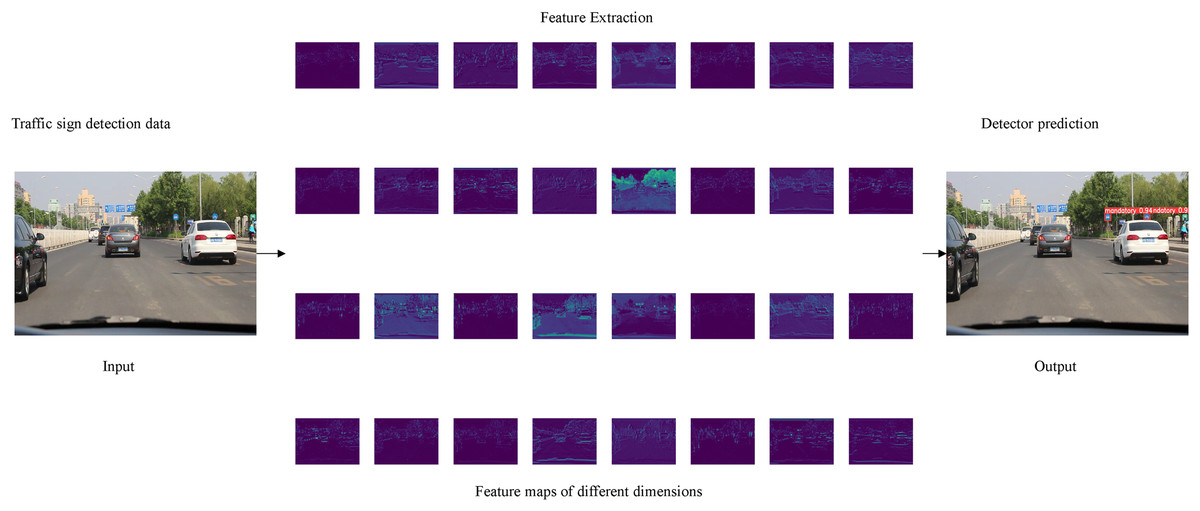
Figure 5: Visualization of feature maps extracted by TS-YOLO.
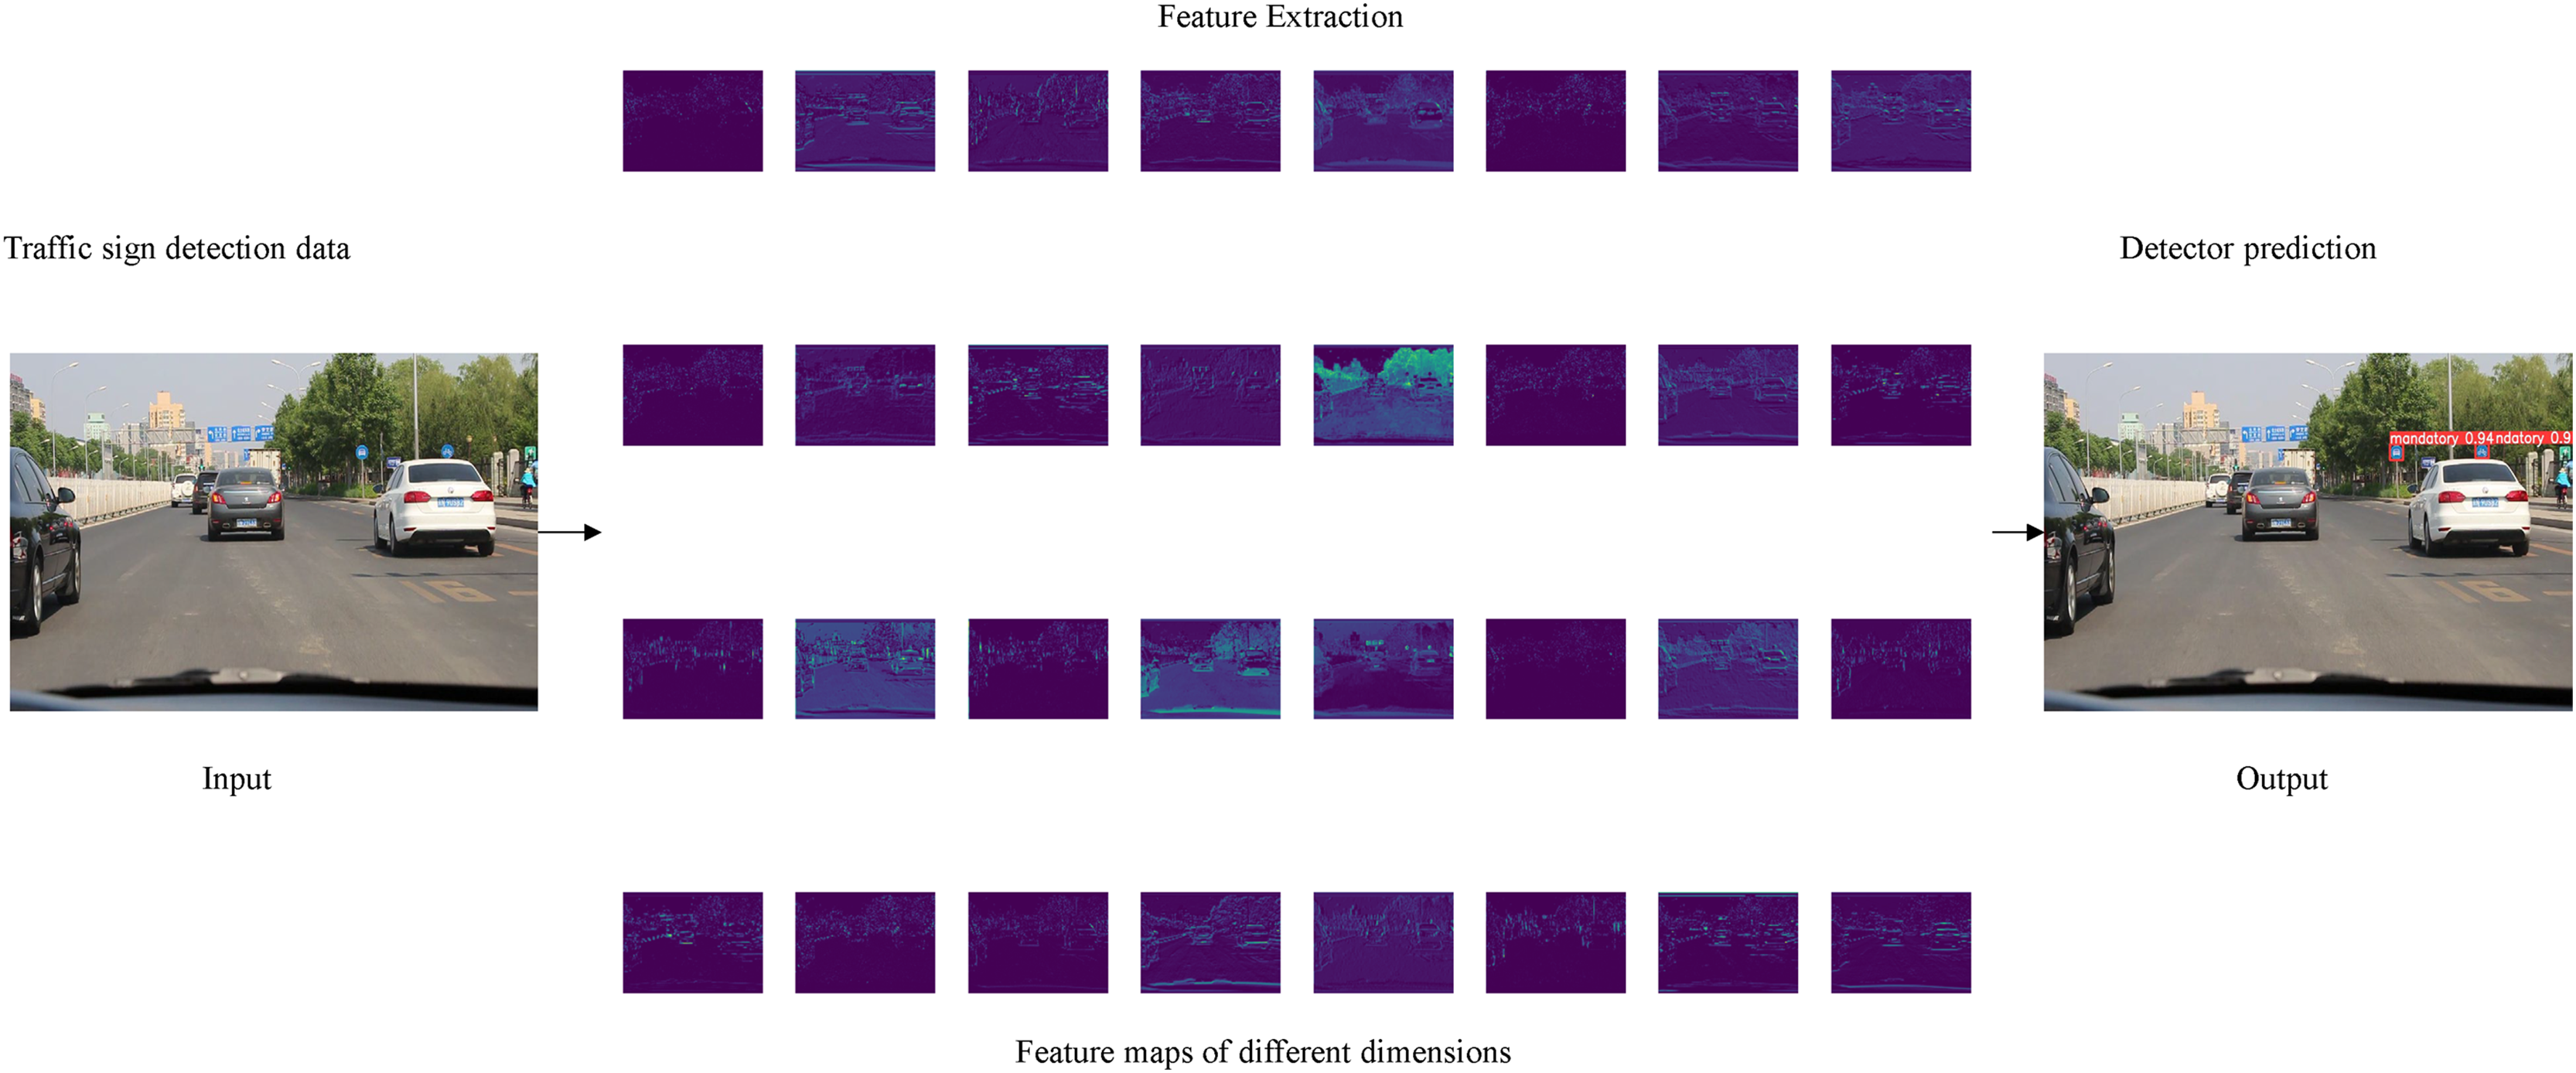
The RepCSP block incorporated into TS-YOLO employs a re-parameterization design. During training, the block comprises three branches: a 3 × 3 convolution, a 1 × 1 convolution, and an identity connection. Although this configuration enhances the representational capacity of the model, it introduces additional computational overhead, as evidenced by increased parameter counts and GFLOPs. During inference, re-parameterization merges the weights of the multi-branch structure into a single convolutional kernel, effectively converting the block into a single 3 × 3 convolutional layer and eliminating the overhead associated with the auxiliary branches. At this stage, the executed computational path, in comparison to the C2F block of YOLOv8, entails no redundant operations. After the RepCSP block is re-parameterized, the TS-YOLO model exhibits higher theoretical GFLOPs than YOLOv8 (see Ablation Studies); nevertheless, its practical inference efficiency improves owing to the following factors:
-
(1)
Branch fusion reduces memory traffic: multi-branch structures require multiple read and write operations of intermediate feature maps, whereas a single-branch implementation completes the computation in a single pass. Because memory-access latency frequently constitutes the primary bottleneck on modern hardware—particularly graphics processing units (GPUs)—its reduction directly reduces inference time.
-
(2)
A single-branch 3 × 3 convolution is more amenable to optimization by low-level acceleration libraries (e.g., cuDNN), thereby achieving higher computational throughput that compensates for the marginal increase in theoretical GFLOPs.
Consequently, while the pre-fusion multi-branch structure inflates the theoretical computational load (GFLOPs), the fused single-branch variant exhibits, during inference, a more compact computational graph, higher operational density, and a superior memory-access pattern. These characteristics allow it to match or even surpass the inference speed of ostensibly simpler models that lack such optimizations. In essence, re-parameterization exchanges structural complexity during training for enhanced efficiency during inference.
Training tricks
TaskAlignedAssigner
The TaskAlignedAssigner (Feng et al., 2021) assigns positive and negative samples by employing a weighted combination of classification and regression outputs to identify positive samples. This approach represents a dynamic strategy for sample assignment, as it automatically adjusts the number of positive samples per ground truth and selects the appropriate feature map for each bounding box.
In our TS-YOLO framework, TaskAlignedAssigner is tightly integrated with the anchor-free detection head incorporated into YOLOv8. By leveraging the multi-scale feature outputs from the RepCSP blocks, the assigner can more accurately identify and align object instances across scales, particularly small or partially occluded ones. During backpropagation, gradients flow from the detection head to the RepCSP backbone, ensuring that the improved sample assignment strategy also guides the feature extraction process. Other leading one-stage detectors (e.g., Task-aligned One-stage Object Detection (TOOD) (Feng et al., 2021)) have similarly demonstrated the benefits of a task-aligned approach. However, in TS-YOLO, we fine-tuned the hyperparameters to account for domain-specific traffic sign distributions, which distinguishes our method in balancing detection precision and runtime efficiency.
For each ground truth, the classification score s is computed for all associated bounding boxes, together with the CIoU loss u between each bounding box and the corresponding ground truth. These two factors are then combined through a weighted mechanism to generate an alignment score , effectively integrating classification and regression components. The alignment score is calculated as:
(1) where α and β are hyperparameters controlling the weights of s and u, respectively. Finally, bounding boxes with the highest alignment scores are considered positive samples, while the remaining ones are labeled as negative samples.
Distribution focal loss
A notable class imbalance is frequently observed among different categories in traffic sign detection tasks (Wang et al., 2024). While some signs appear with considerably higher frequency, specialized or rarely used signs occur only sporadically. This imbalance often hampers detection accuracy for minority classes. To mitigate this issue, we integrated DFL into the loss function, placing additional emphasis on rare and easily confused categories and alleviating biases introduced by skewed class distributions or high feature similarity. Like conventional Focal Loss, DFL enhances distribution-based gradient modulation by suppressing gradients for easily classified samples and amplifying those for more challenging ones. As a result, this approach achieves improved performance on both minority traffic sign classes and categories with high visual similarity.
DFL addresses the issue of limited bounding box coordinate precision, particularly under ambiguous boundary conditions such as occlusion. Traditional regression methods aim to approximate the predicted value to a discrete location consistent with the label. By contrast, regressing over a continuous distribution more accurately reflects real-world conditions than predicting a single discrete coordinate. Therefore, DFL models the bounding-box position as a general distribution, enabling the network to quickly focus on positions close to the ground-truth label.
However, an overly diffuse distribution may reduce the network’s learning efficiency, as a single target can correspond to multiple possible distributions. Since the underlying distribution typically lies near the labeled position, DFL increases the probabilities of positions adjacent to the label, enabling the network to more precisely concentrate its distribution in that region (Li et al., 2020). Given that the probability distribution is satisfied, the predicted regression value is computed as follows:
(2)
Within this context, can be derived through a softmax function, and for simplicity, we let represent . The DFL formula is then given by:
(3)
Pretrain
It was common to pre-train backbone networks for object detectors on the ImageNet classification dataset (Chen et al., 2017), with these pre-trained models serving as the network initialization. Pretraining, a form of transfer learning, leveraged pre-trained networks to facilitate training while improving performance. Compared with training from random initialization, pretraining accelerated convergence and can increase the training speed by approximately 1.3 to 8, depending on factors such as pre-trained model quality, data augmentation strategies, and dataset size. In situations where large-scale labeled data are challenging to acquire, pretraining significantly improved model training performance (Zoph et al., 2020).
However, He, Girshick & Dollár (2019) and other scholars (Shen et al., 2019; Ghiasi, Lin & Le, 2018; Zhang et al., 2024) have reported a surprising finding: pretraining on ImageNet does not necessarily enhance object detection accuracy on the COCO dataset, suggesting only a limited positive impact of ImageNet pretraining in this context. While ImageNet pretraining can accelerate initial convergence by providing low-dimensional feature representations, it does not increase the final accuracy. Moreover, tasks sensitive to spatial information, such as object detection, benefit less from ImageNet pretraining, which is developed primarily for classification rather than the localization demands of detection (Ding et al., 2021). Further studies indicate that substantial data augmentation and sufficient labeled data can diminish the importance of pretraining (Zoph et al., 2020).
Given the modifications introduced to the YOLOv8 architecture, the pre-trained YOLOv8—initially pre-trained on ImageNet—provides limited guidance for the revised model. Employing this pre-trained model may lead to parameter mismatches and interference caused by inconsistencies between the pre-trained and modified models, potentially hindering training performance.
In particular, because TS-YOLO integrates RepCSP blocks and the TaskAlignedAssigner, the backbone’s feature representation and sample assignment procedures differ considerably from the standard YOLOv8 pipeline. If the dataset is relatively small or contains domain-specific object appearances (e.g., traffic signs), ImageNet-based pretraining may fail to boost final accuracy and can even introduce negative transfer (Rodríguez-de-Vera et al., 2025; Plested & Gedeon, 2022). Hence, we forgo pretraining for network initialization and adopt random initialization, ensuring that the network’s early-stage feature maps are learned solely from the in-domain dataset. This choice is further supported by our experiments, which demonstrate that, under these conditions, random initialization yields superior detection accuracy for traffic sign-related tasks.
Training from scratch proves more beneficial for the dataset and model examined here. Experimental results, illustrated in the Ablation Studies section, support this conclusion.
Experiment
To validate the performance and efficiency of our TS-YOLO, we conducted a series of ablation experiments and comparative analyses, confirming its capability to detect traffic signs in real-world road environments.
Experiments settings
The experimental setup employs the Windows 11 operating system (OS), with computations performed using an NVIDIA GeForce RTX 4060Ti 16GB GPU. The framework employed is PyTorch, with torch version 2.1.2, CUDA version 12.1, and Python version 3.9.
In this study, the YOLOv8n variant was employed under strictly controlled conditions to ensure methodological consistency. For training, an input resolution of 640 × 640 was used, along with a batch size of 32, the Sigmoid Linear Unit (SiLU) activation function, and eight parallel data-loading workers. Additionally, online data augmentation was applied, including adjustments to hue, saturation, and value, as well as translation, scaling, and mosaic techniques (Bochkovskiy, Wang & Liao, 2020). Complete hyperparameter specifications, including data augmentation parameters and ablation study settings, are systematically documented in Table 1.
| Parameter | Description | Value |
|---|---|---|
| Workers | Number of workers | 8 |
| Imgsz | Input images size | (640, 640) |
| Batch | Batch size | 32 |
| Optimizer | Optimizer to use | SGD |
| Momentum | SGD momentum | 0.937 |
| weight_decay | Optimizer weight decay | 0.0005 |
| Deterministic | Whether to enable deterministic mode | True |
| iou | Intersection over union (IoU) threshold for NMS | 0.7 |
| lr0 | Initial learning rate | 0.01 |
| warmup_epochs | Warmup epochs | 3.0 |
| warmup_momentum | Warmup momentum | 0.8 |
| warmup_bias_lr | Warmup initial learning rate | 0.1 |
| hsv_h | Image HSV-Hue augmentation (fraction) | 0.015 |
| hsv_s | Image HSV-Saturation augmentation (fraction) | 0.7 |
| hsv_v | Image HSV-Value augmentation (fraction) | 0.4 |
| Translate | Image translation (+/− fraction) | 0.1 |
| Scale | Image scale (+/− gain) | 0.5 |
| Mosaic | Image mosaic (probability) | 1.0 |
Dataset
We utilized the publicly available CCTSDB2021 traffic sign detection dataset (Zhang et al., 2022a, 2022b, 2022c), which contains 17,856 images and 30,065 traffic signs (as shown in Table 2). To ensure reproducibility, the dataset was randomly partitioned into training, test, and validation sets at an 8:1:1 ratio. This dataset comprises three primary traffic sign categories: prohibitory, warning, and mandatory. The distribution of instance counts across the three categories (prohibitory, warning, and mandatory) is presented in Table 3. Furthermore, all images were captured under typical road conditions in China. These images, recorded from multiple angles in real-world driving scenarios (e.g., from within a vehicle or via dashcams), enhance the dataset’s authenticity and practical relevance. Moreover, the CCTSDB2021 dataset, collected from multiple perspectives, encompasses challenging data categories, including adverse weather conditions (fog, snow, rain, night, sunny, and cloudy), low-light environments, complex occlusion scenarios, and ultra-small object instances, thereby comprehensively covering edge cases for environmental perception in autonomous vehicles.
| Dataset | Pictures |
|---|---|
| Train | 14,284 |
| Test | 1,786 |
| Validate | 1,786 |
| Category | Numbers |
|---|---|
| Prohibitory | 16,053 |
| Warning | 4,931 |
| Mandatory | 9,081 |
Evaluation metrics
The proposed method is evaluated from three perspectives: model complexity, detection accuracy, and inference speed.
Model complexity is measured by the number of parameters and floating-point operations (GFLOPs).
Detection accuracy is quantified using mean Average Precision (mAP), Average Precision (AP), and precision.
-
•
[email protected]: the mean AP across all classes at an IoU threshold of 0.5;
-
•
[email protected]: the mean AP computed over ten IoU thresholds ranging from 0.5 to 0.95 with a step of 0.05;
-
•
[email protected] and [email protected] denote the AP under the respective IoU settings.
Inference speed is represented by the inference time per image.
Intersection over Union (IoU) quantifies the overlap between a predicted bounding box (P) and its ground-truth counterpart (G), defined as: , where ∩ and ∪ denote the intersection and union operators, respectively. IoU values range from 0 to 1, with higher values indicating greater overlap and thus more accurate predictions.
Ablation studies
In this subsection, we evaluated the significance of our TS-YOLO model through a series of ablation studies (Table 4), which assessed the impact of each component. We further illustrated how the performance of our object detector can be progressively enhanced by sequentially integrating each optimized module, thereby validating the effectiveness of these improvements.
| Method | Parameters/M | GFLOPs | [email protected]/% | [email protected]/% | Inference time/ms | |
|---|---|---|---|---|---|---|
| A | YOLOv8 | 11.47 | 8.1 | 98.1 | 78.0 | 0.6 |
| B | YOLOv8 + Epoch optimization | 11.47 | 8.1 | 98.2 | 78.7 | 0.6 |
| C |
B+RepCSP (TS-YOLO) |
14.98 | 10.4 | 98.4 | 79.1 | 0.6 |
| D | C+pretrained | 14.98 | 10.4 | 98.3 | 79.1 | 0.6 |
A→ B: Model B was first obtained by refining the original YOLOv8 (hereafter Model A) via epoch optimisation. By default, YOLOv8 is trained for 500 epochs. To mitigate over-fitting, we adopted a YOLOX-inspired strategy that disables data augmentation during the last ten epochs. We therefore carried out a series of experiments with total training epochs ranging from 300 to 700 to identify the optimal training duration and augmentation cut-off. As summarised in Table 5, training for 600 epochs and discontinuing data augmentation at epoch 570 yielded the best overall performance. Under these settings, [email protected] reached 98.2%, an improvement of 0.1 percentage points over the baseline configuration (500 epochs, augmentation disabled during the last ten epochs). Similarly, [email protected] increased to 78.7%, reflecting a 0.7 percentage-point gain. Figure 6 contrasts the training performance before and after epoch optimisation, showing that the [email protected] curve benefits significantly from the revised strategy.
| Epoch | Closing data augmentation epochs | [email protected]/% | [email protected]/% |
|---|---|---|---|
| 300 | 10 | 97.6 | 77.0 |
| 15 | 97.6 | 77.0 | |
| 20 | 97.6 | 77.1 | |
| 30 | 97.6 | 77.1 | |
| 40 | 97.6 | 77.2 | |
| 400 | 10 | 97.8 | 77.5 |
| 20 | 97.9 | 77.5 | |
| 30 | 97.9 | 77.6 | |
| 40 | 97.9 | 77.6 | |
| 50 | 97.8 | 77.7 | |
| 500 | 10 | 98.1 | 78.0 |
| 20 | 98.0 | 78.2 | |
| 25 | 98.0 | 78.1 | |
| 50 | 98.1 | 78.3 | |
| 60 | 97.8 | 78.3 | |
| 600 | 10 | 98.2 | 78.6 |
| 20 | 98.2 | 78.7 | |
| 30 | 98.2 | 78.7 | |
| 40 | 98.2 | 78.6 | |
| 60 | 98.1 | 78.6 | |
| 70 | 98.1 | 78.8 | |
| 700 | 10 | 98.1 | 78.3 |
| 35 | 98.2 | 78.7 | |
| 70 | 98.2 | 78.6 |
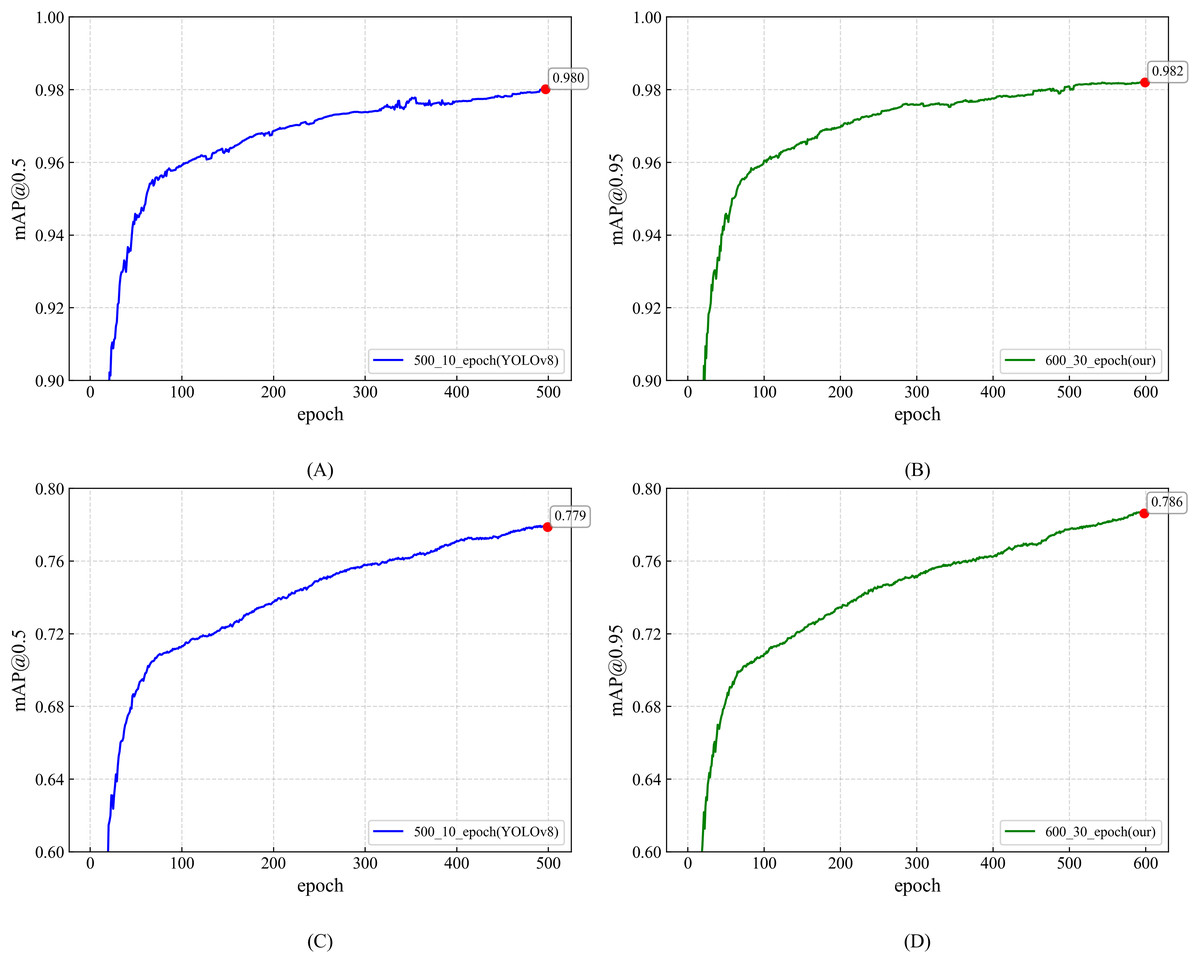
Figure 6: Training performance: epoch-based comparison of YOLOv8 and TS-YOLO.
(A) and (C): YOLOv8 [email protected] and [email protected] (500 epochs; data augmentation off in last 10 epochs) (B) and (D): TS-YOLO [email protected] and [email protected] (600 epochs; data augmentation off in last 30 epochs).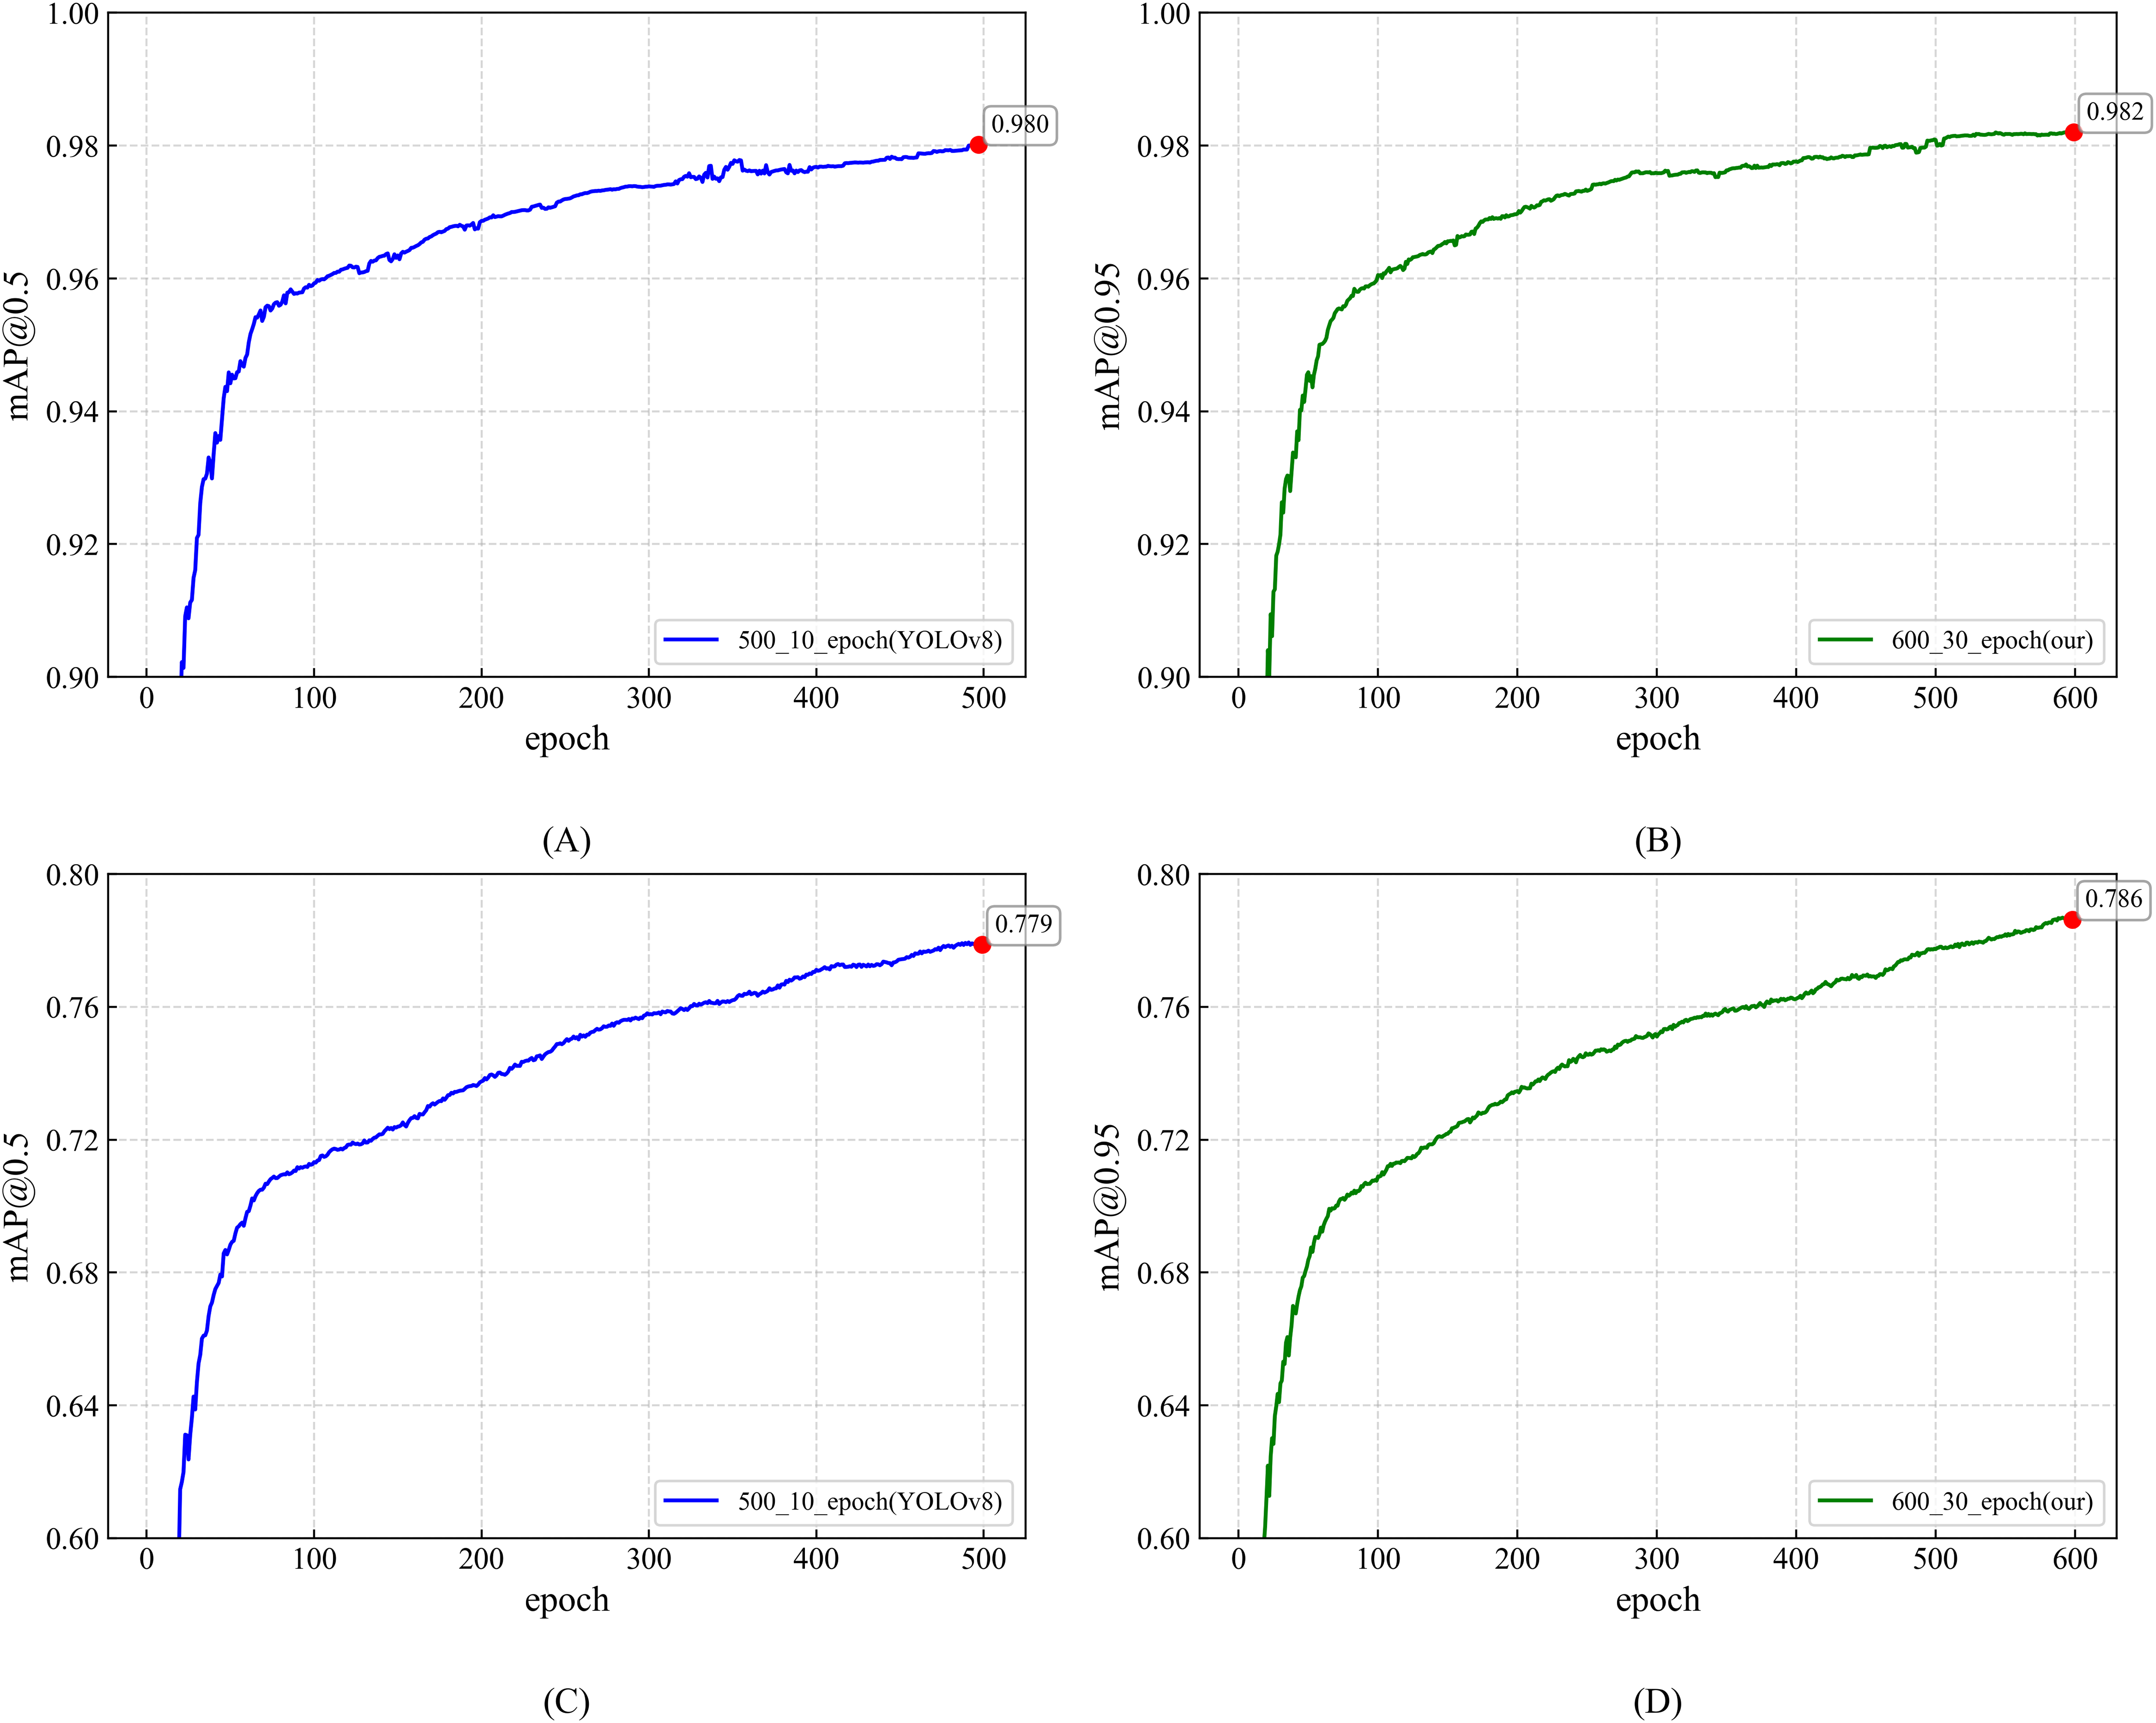
B→ C: Subsequently, we validated the efficacy of the optimised network architecture using the epoch-optimised Model B as the experimental baseline. Because the architecture had changed, we omitted pre-training and trained the model from scratch. The resulting model is referred to as Model C (TS-YOLO), which incorporates the architectural refinements. As reported in Table 4, [email protected] increased to 98.4% (+0.2%) and [email protected] rose to 79.1% (+0.4%) after applying the architectural refinements. Relative to Model A, TS-YOLO improves [email protected] by 0.3 percentage points and [email protected] by 1.1 percentage points. Notably, these gains incur only 3.51 M additional parameters and 2.3 GFLOPs, while the inference speed remains 0.6 ms per image. Both TS-YOLO and YOLOv8 achieve the same 0.6 ms inference time on an NVIDIA RTX 4060 Ti. This parity confirms the practical efficacy of the single-branch computation realised through re-parameterising the RepCSP block. Theoretical GFLOPs quantify the static number of floating-point operations (Redmon & Farhadi, 2018), whereas actual inference speed depends on dynamic factors such as hardware parallelism, memory bandwidth, and computational paths (e.g., branch count) (Jegham et al., 2024). Therefore, the TS-YOLO results illustrate how re-parameterisation reconciles theoretical and practical efficiency.
Figure 7 visually compares the mAP training curves and highlights the enhanced convergence of the optimized model. Precision is likewise essential: as shown in Fig. 8, YOLOv8 and TS-YOLO achieve final precisions of 96.4% and 97.3%, respectively, corroborating the effectiveness of the improvements. Overall, the smoother training curves underscore the improved convergence behaviour attained through these optimizations.
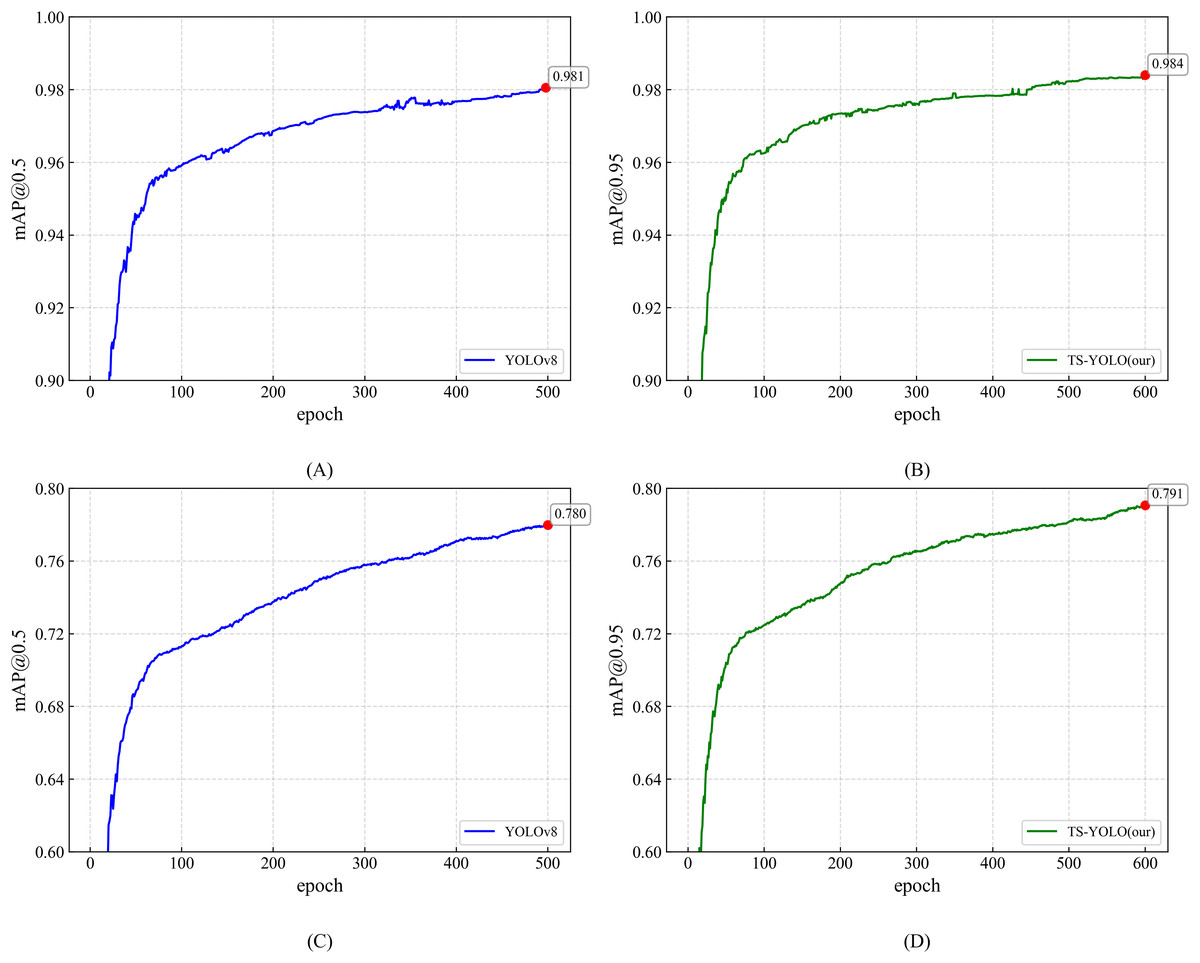
Figure 7: Training performance comparison: [email protected] and [email protected] curves of YOLOv8 vs. TS-YOLO.
(A) YOLOv8 [email protected] curve; (B) TS-YOLO (Ours) [email protected] curve; (C) YOLOv8 [email protected] curve; (D) TS-YOLO (Ours) [email protected] curve.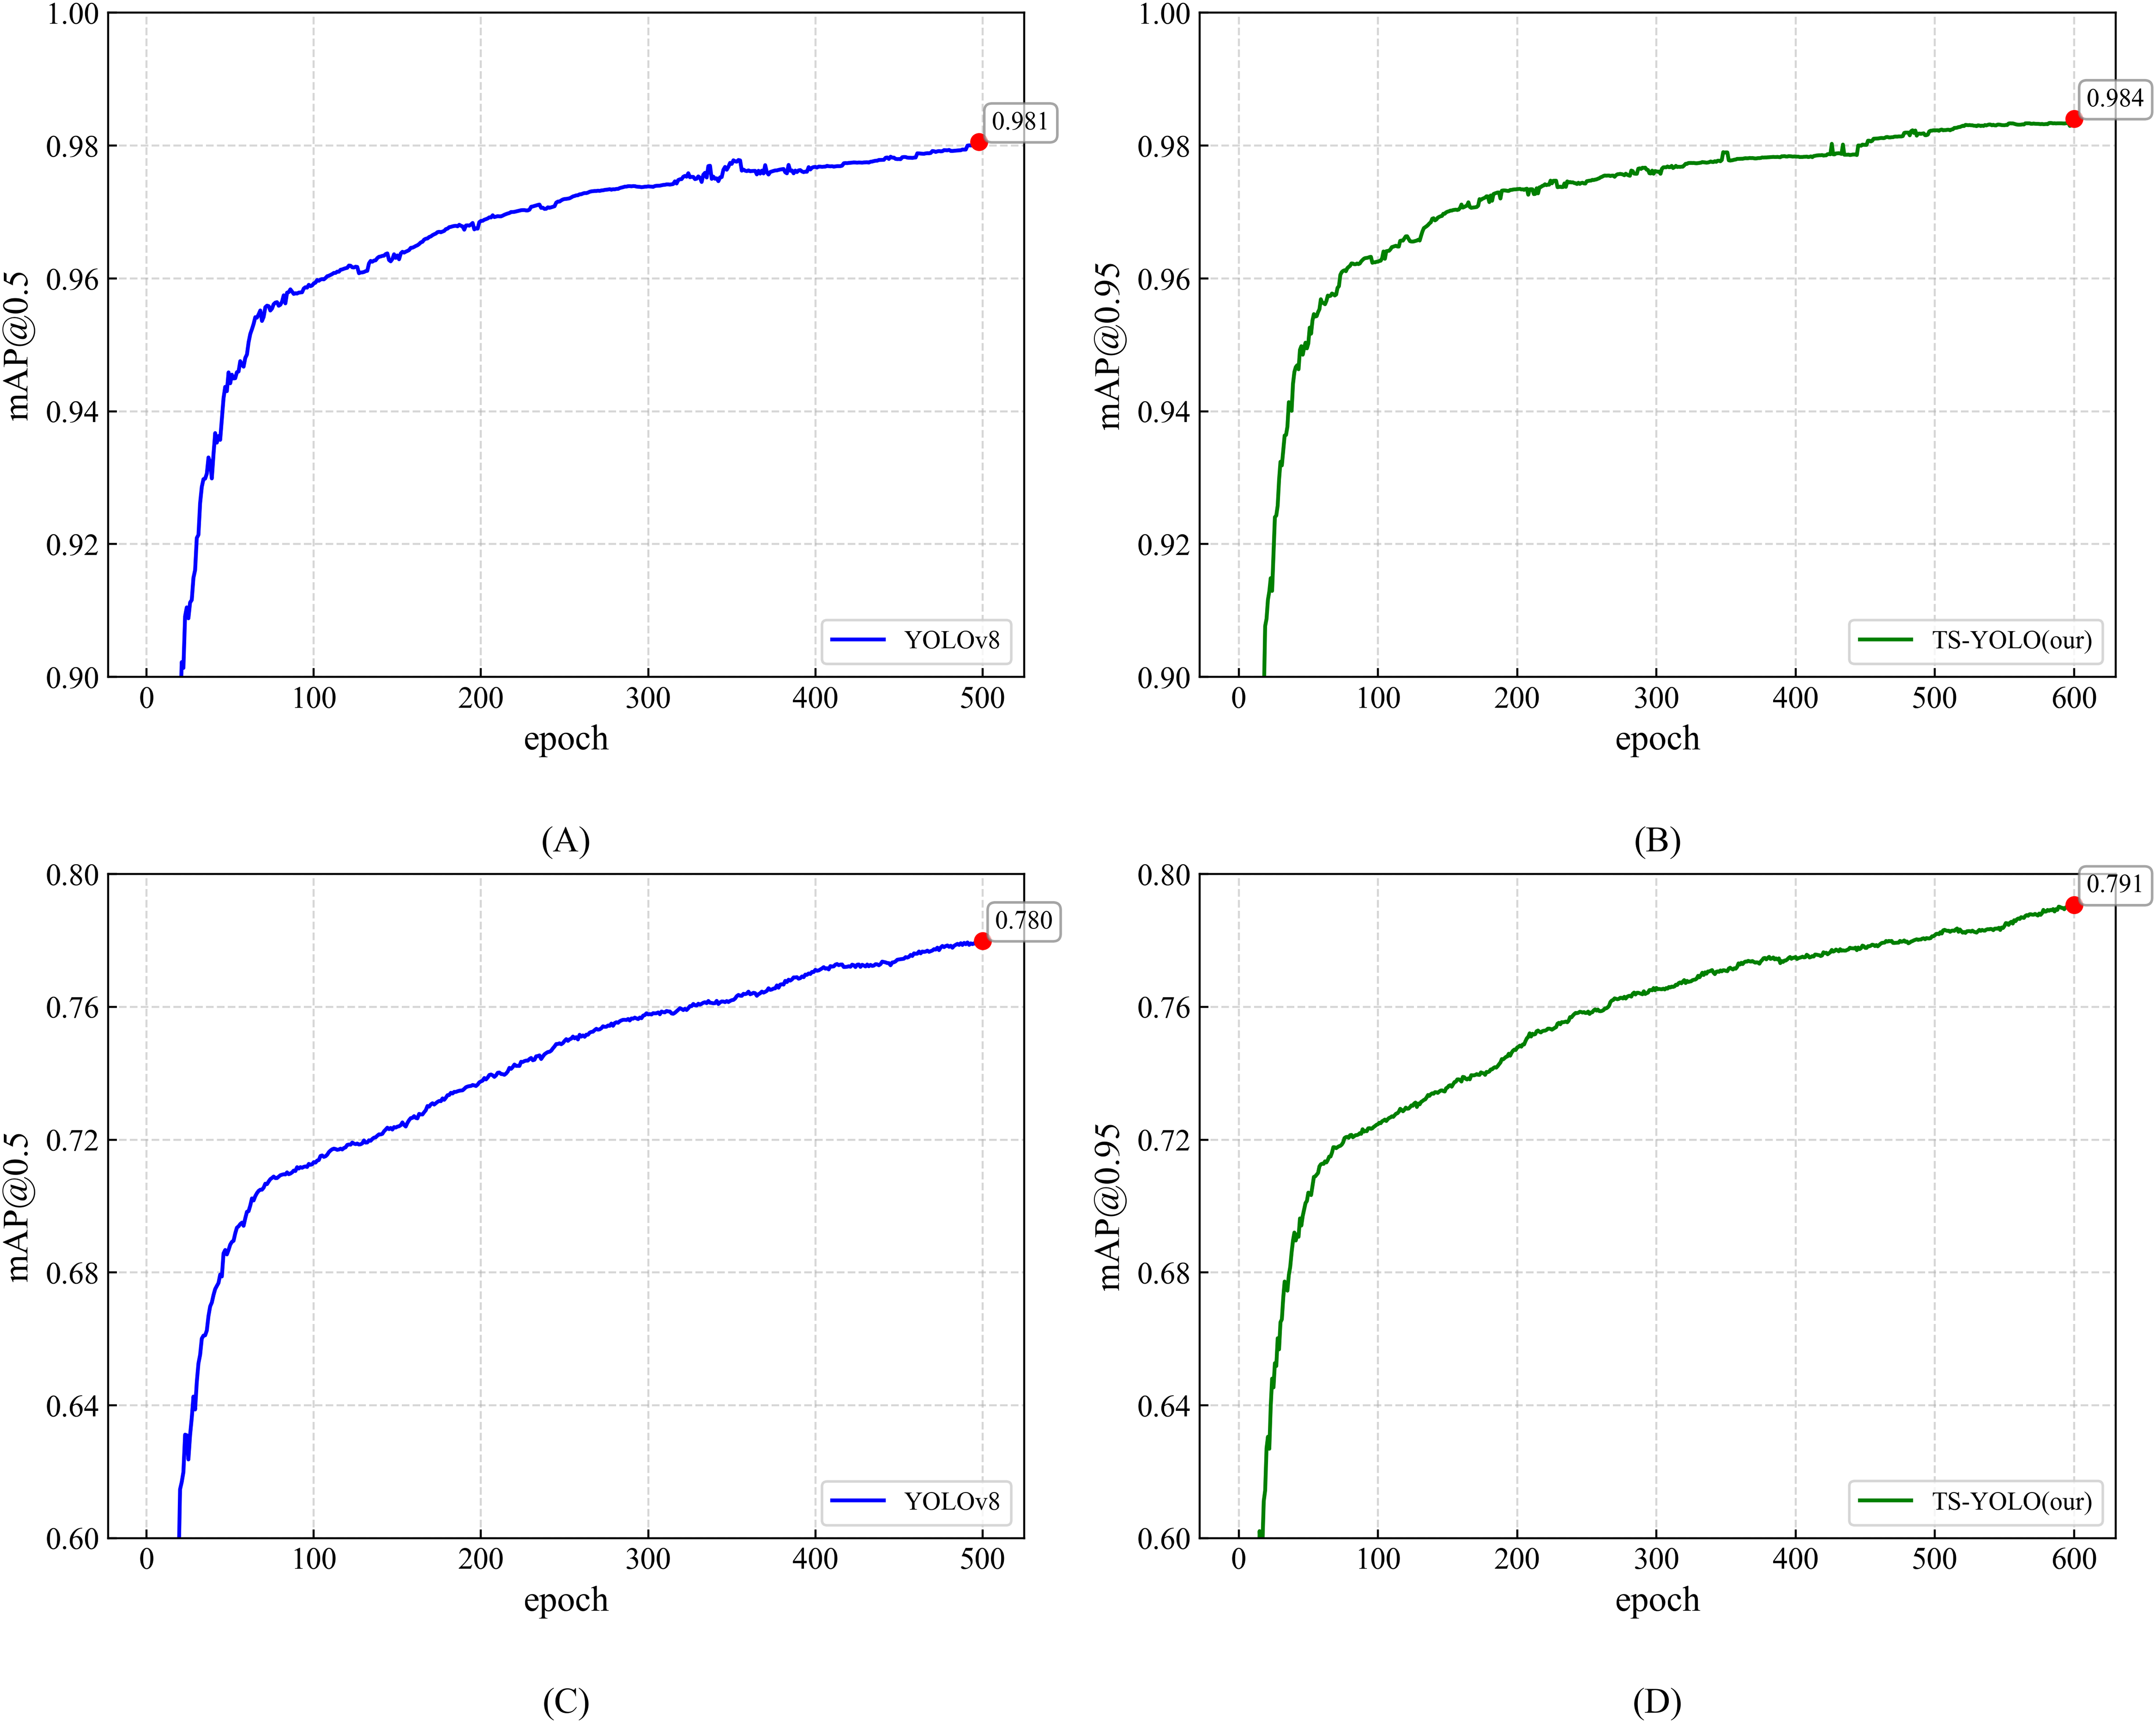
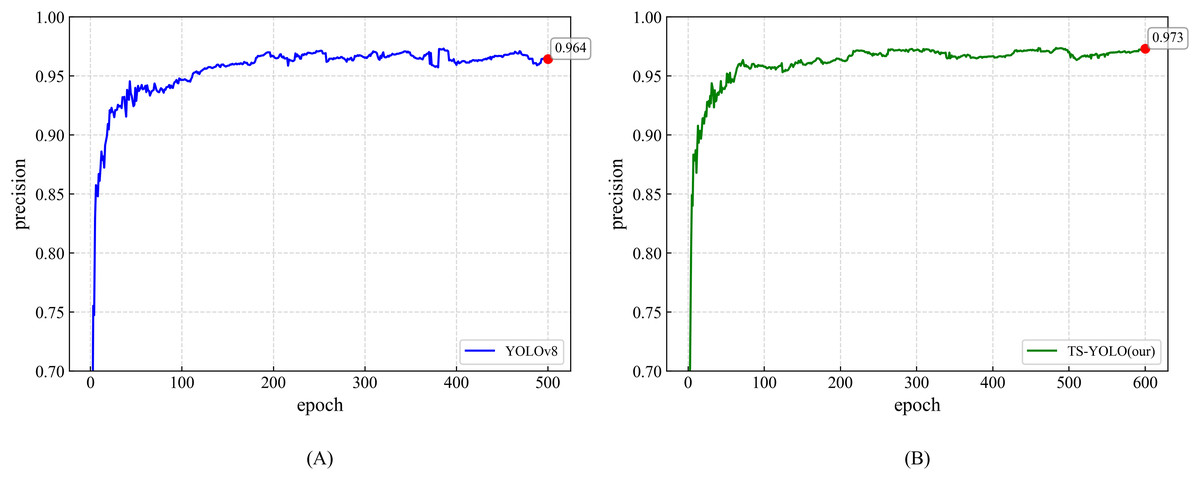
Figure 8: Precision curves for YOLOv8 and TS-YOLO.
(A) Precision of YOLOv8 (B) Precision of TS-YOLO.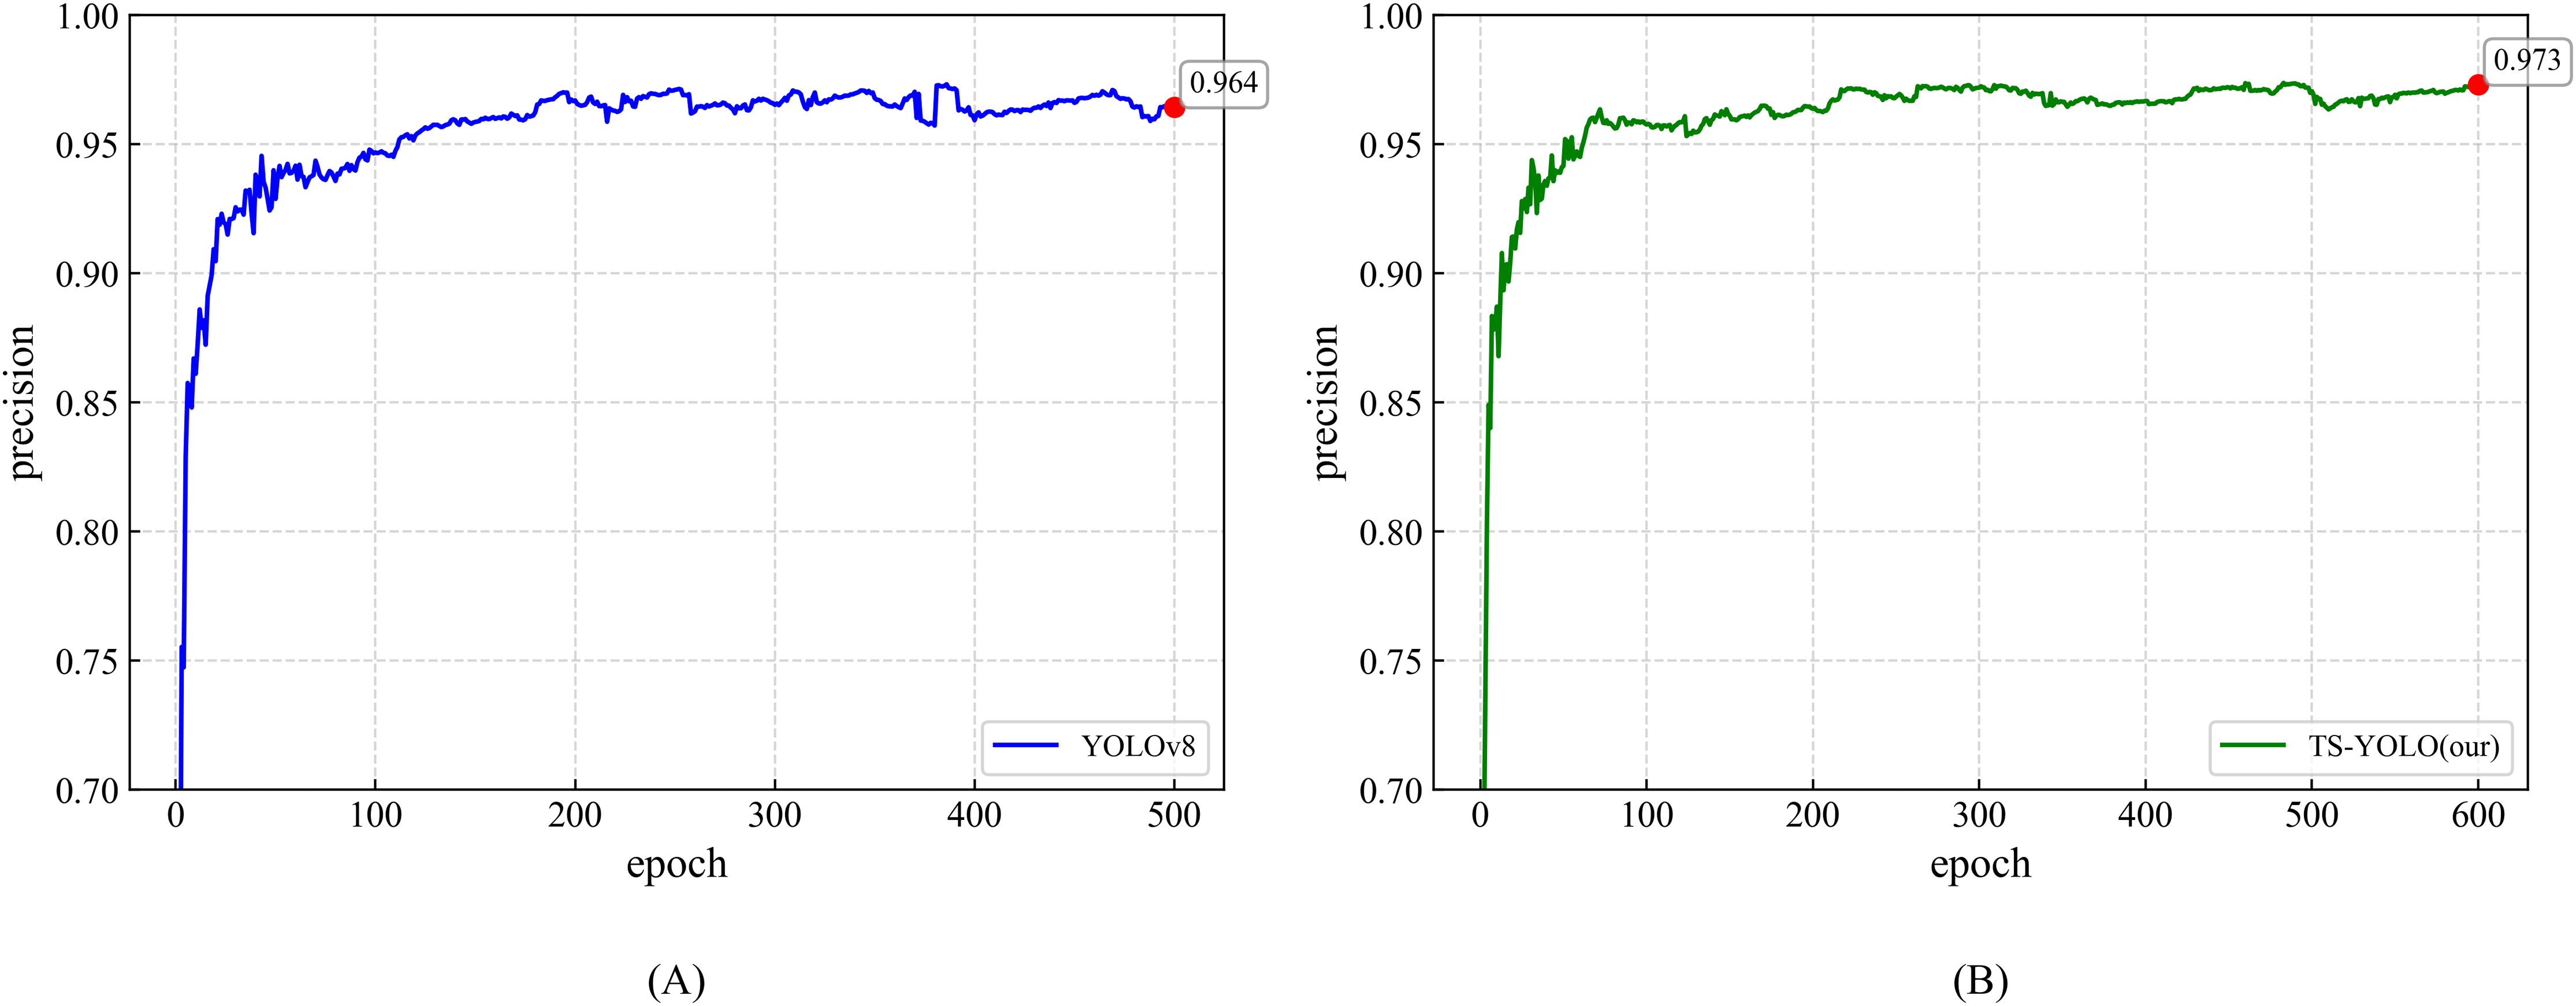
C→D: Following the optimization of the number of training epochs and the network architecture, we compared Model D (pretrained on ImageNet) with Model C (randomly initialized). The experimental results indicate that a network trained for 600 epochs from random initialization surpasses its counterpart initialized with pretrained weights. Specifically, the non-pretrained model attains an [email protected] that is 0.1 percentage points higher. These observations imply that pretraining chiefly accelerates early-stage convergence but confers no benefit on final accuracy. Because ImageNet pretraining emphasizes global semantic classification rather than spatial localization, its contribution to object detection tasks, in which precise spatial prediction is indispensable, is inherently constrained.
Results validated through ablation studies indicate considerable improvements in traffic sign detection. Specifically, the proposed method achieves an [email protected] of 98.4% and an [email protected] of 79.1%, processes a frame in only 0.6 ms, and maintains a compact model size of 14.98 M parameters with a computational cost of 8.1 GFLOPs. The proposed architecture is well-suited to in-vehicle embedded platforms, delivering real-time inference at 30 FPS even under resource-constrained conditions.
Table 6 compares the AP of three traffic-sign categories—prohibitory, warning, and mandatory—before and after the proposed improvements. As illustrated, the enhanced TS-YOLO surpasses the baseline model in every subcategory, yielding higher [email protected] and [email protected] values.
| Category | Methods | [email protected]/% | [email protected]/% |
|---|---|---|---|
| Prohibitory | YOLOv8 | 97.5 | 78.0 |
| TS-YOLO | 97.8 | 78.9 | |
| Warning | YOLOv8 | 98.0 | 75.7 |
| TS-YOLO | 98.6 | 77.5 | |
| Mandatory | YOLOv8 | 98.7 | 80.3 |
| TS-YOLO | 98.8 | 80.9 |
Figure 9 presents a comprehensive performance comparison between TS-YOLO and the baseline YOLOv8 across three categories of challenging scenarios:
-
(1)
-
(2)
-
(3)
Complex target characteristics, namely small objects, occlusions, deformed signs, and motion-blurred instances.
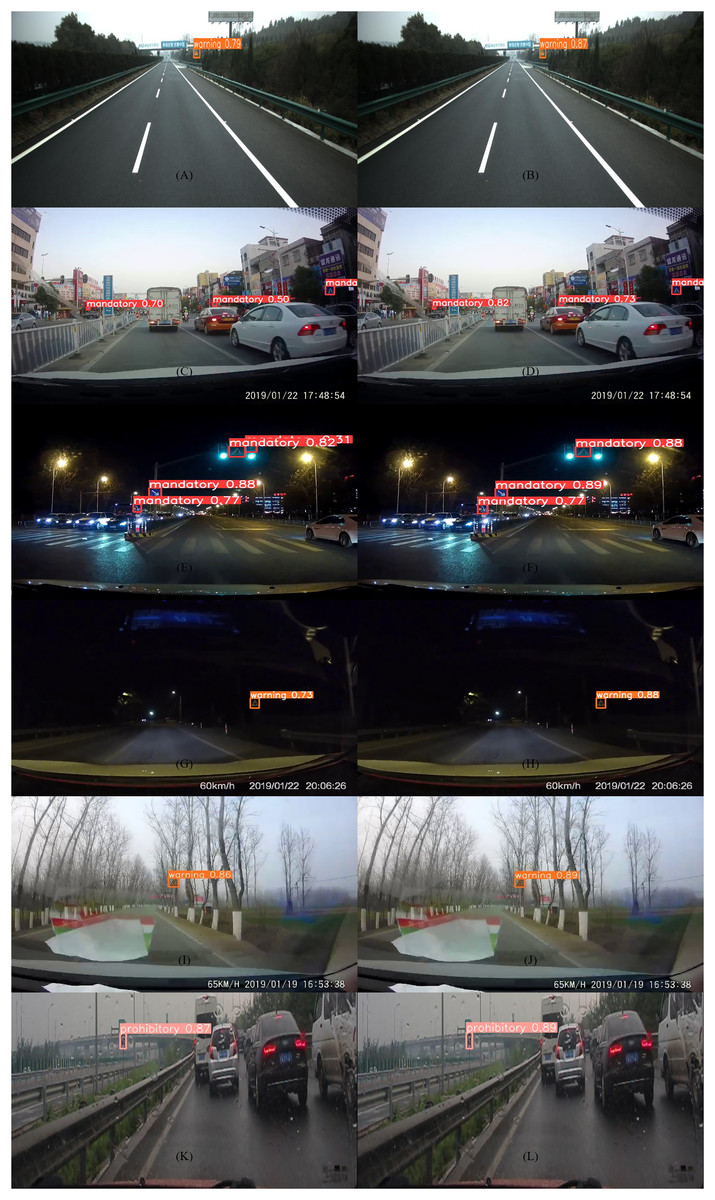
Figure 9: Qualitative comparison of YOLOv8 and TS-YOLO in complex traffic scenarios.
(A, B) Highway; (C, D) Urban streets; (E, F) Urban nighttime; (G, H) National highway nighttime; (I, J) Fog; (K, L) Rain.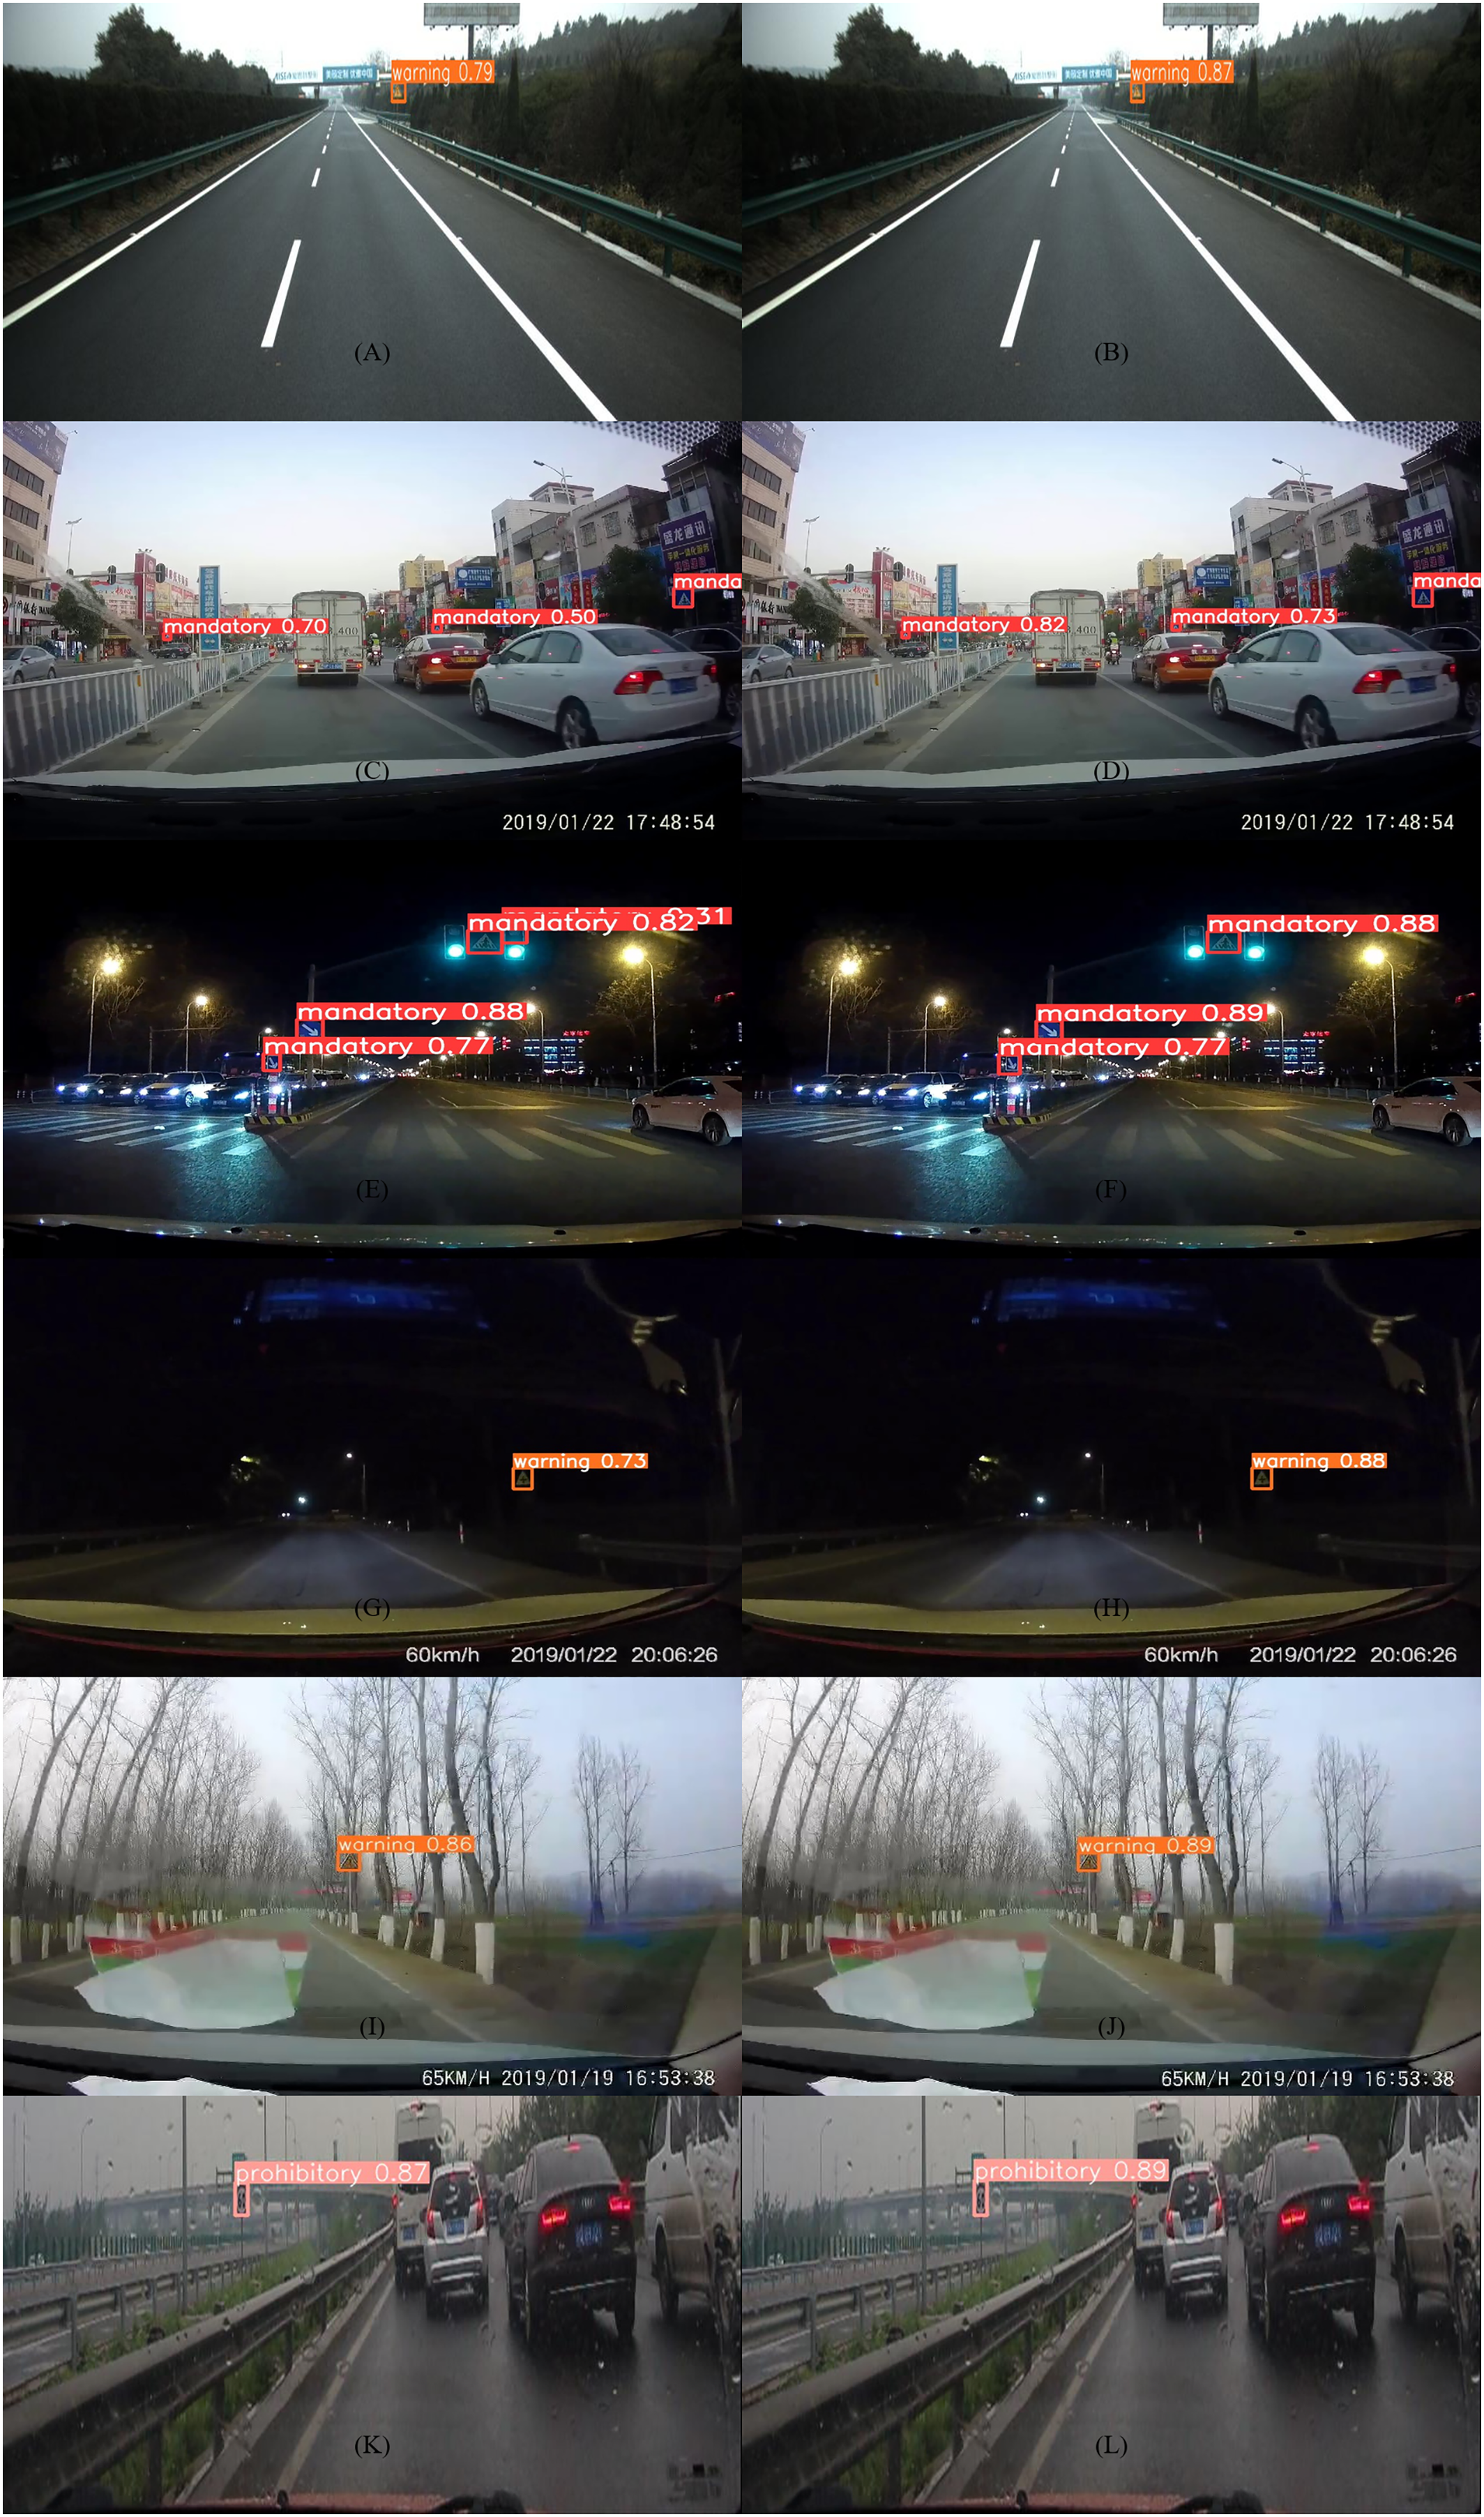
The results in Fig. 9 confirm that, compared with YOLOv8, TS-YOLO reduces false detections and slightly increases overall accuracy. Notably, TS-YOLO maintains more stable accuracy in adverse weather and lowers the false-positive rate for small or occluded targets in complex road scenes, even though the visual differences between the two models are subtle.
Comparisons
Under identical training configurations (batch size of 32, 600 epochs, and random weight initialization), TS-YOLO was benchmarked against thirteen mainstream detectors, including YOLOv3–YOLOv8, YOLOX, EfficientDet-d0, SSD, RetinaNet, Faster R-CNN, and CenterNet. The minimal variants of YOLOv5, YOLOv6, and YOLOX (i.e., the “n” versions) were selected to align with YOLOv8. As shown in Table 7, TS-YOLO achieves the highest accuracy among all evaluated models, attaining a [email protected] of 98.4% and a [email protected] of 79.1%, which exceed those of YOLOv8 by 0.3% and 1.1%, respectively. While TS-YOLO’s parameter count (14.98 M) and computational requirement (10.4 GFLOPs) are marginally greater than those of the YOLOv8 baseline (11.47 M, 8.1 GFLOPs), they remain an order of magnitude lower than those required by YOLOv7 (141.93 M, 105.1 GFLOPs), achieving 0.5% higher [email protected] and 0.8% higher [email protected] with only one-tenth the resources. When compared with the lightweight YOLOv5 (6.74 M, 4.2 GFLOPs) and YOLOv6 (4.30 M, 11.06 GFLOPs) variants, TS-YOLO incurs only a modest increase in model complexity, yet yields gains of approximately 0.8–0.9% in [email protected] and 2.9–3.4% in [email protected], thereby demonstrating an improved accuracy–efficiency trade-off. Against traditional two-stage and anchor-based detectors—SSD (26.23 M, 62.75 GFLOPs, 58.4%/24.7%), RetinaNet (37.97 M, 170.09 GFLOPs, 21.2%/15.9%), and Faster R-CNN (137.10 M, 370.21 GFLOPs, 72.1%/35.1%)—TS-YOLO achieves an order-of-magnitude lower computational load, while providing improvements of at least 26.3% in [email protected] and 43.2% in [email protected]. Furthermore, TS-YOLO surpasses CenterNet (32.67 M, 70.22 GFLOPs, 86.1%/39.7%) by 12.3% in [email protected] and 39.4% in [email protected], while utilizing less than half of the computational resources. These findings confirm that TS-YOLO offers a superior compromise between model size, inference speed, and detection accuracy, rendering it particularly suitable for real-time, resource-constrained in-vehicle applications and complex roadway environments.
| Methods | Parameters/M | GFLOPs | [email protected]/% | [email protected]/% |
|---|---|---|---|---|
| YOLOv3 | 61.95 | 66.17 | 91.0 | 38.9 |
| YOLOv4 | 64.36 | 60.53 | 88.8 | 38.6 |
| YOLOv5 | 6.74 | 4.2 | 97.6 | 75.7 |
| YOLOv6 | 4.30 | 11.06 | 97.5 | 76.2 |
| YOLOv7 | 141.93 | 105.1 | 97.9 | 78.3 |
| YOLOv8 | 11.47 | 8.1 | 98.1 | 78.0 |
| YOLOX | 54.21 | 156.01 | 95.5 | 59.2 |
| EfficientDet-d0 | 3.87 | 5.23 | 12.6 | 17.3 |
| SSD | 26.23 | 62.75 | 58.4 | 24.7 |
| RetinaNet | 37.97 | 170.09 | 21.2 | 15.9 |
| Faster R-CNN | 137.10 | 370.21 | 72.1 | 35.1 |
| CenterNet | 32.67 | 70.22 | 86.1 | 39.7 |
| TS-YOLO (our) | 14.98 | 10.4 | 98.4 | 79.1 |
Discussion
The TS-YOLO model proposed in this study has demonstrated promising performance in real-time traffic-sign detection under complex conditions. However, given the study’s scope and the dataset’s characteristics, the work still exhibits several limitations.
First, the dataset presents geographical limitations. The current experiments evaluated the model solely on the CCTSDB2021 dataset, which predominantly comprises Chinese traffic signs and lacks samples from other regions, such as Europe or the Americas. Because the shape, color, and semantic rules of traffic signs vary across regions—for instance, many European warning signs are diamond-shaped and several U.S. prohibitory signs employ distinctive graphics—the model’s cross-domain adaptability remains unverified, and the generality of its performance requires further investigation.
Second, the model has not been sufficiently validated in real deployment scenarios. The efficiency evaluations were conducted primarily on laboratory GPUs (e.g., an NVIDIA RTX 4060 Ti); no on-board tests were performed on actual vehicle-mounted embedded platforms. However, embedded devices—such as low-power edge chips—offer markedly different computing resources, memory bandwidths, and thermal characteristics compared with general-purpose GPUs. Consequently, the model’s real-time performance, stability, and long-term reliability in vehicular settings remain to be confirmed.
To address these limitations and enhance the model’s practicality and generalization, future work will proceed along the following lines:
-
(1)
Expansion of cross-domain datasets to bolster generalization: Future experiments will incorporate multi-regional datasets—such as GTSDB (Europe), LISA (United States), and TT100K (multiple regions). Cross-domain training and domain-adaptation techniques (e.g., domain adversarial networks) will be employed to improve the model’s adaptability to diverse traffic-sign systems and to validate the robustness of TS-YOLO in global scenarios.
-
(2)
Enhancement of data-augmentation strategies to improve robustness: Generative models from the GAN family (e.g., StyleGAN, CycleGAN) will be leveraged to produce diverse synthetic samples. These samples will mimic challenging conditions—such as heavy rain, fog, occlusion, and low illumination—thereby supplementing scarce edge cases and further strengthening the model’s resilience to non-ideal inputs.
-
(3)
Targeted optimization of the loss function: To mitigate class imbalance (e.g., an over-representation of prohibitory signs relative to indicative signs) and the inadequate detection of small objects, we will design weighted loss functions or attention-assisted loss strategies. These modifications will concentrate on enhancing the recognition accuracy of hard samples.
-
(4)
Enhanced on-site evaluation on embedded platforms: We plan to deploy the model to mainstream automotive edge devices—specifically, the NVIDIA Jetson Nano and Raspberry Pi 4—and to assess its performance in real road scenarios by quantifying inference latency, memory usage, and thermal behaviour during prolonged operation. These experiments will substantiate the model’s utility in resource-constrained environments and furnish reliable technical references for applications such as autonomous driving.
Conclusions
This study proposes TS-YOLO, a lightweight, real-time traffic sign detection algorithm. By integrating the proposed RepCSP module into YOLOv8 and applying targeted training strategies, TS-YOLO achieves an [email protected] of 98.4% and an [email protected] of 79.1% on the CCTSDB2021 dataset, while sustaining an inference latency of only 0.6 ms per frame. The model thus attains a favorable trade-off between detection accuracy and computational cost. Moreover, TS-YOLO maintains robust performance under adverse weather conditions—rain, fog, and low-light nighttime—across diverse road scenarios, highlighting its suitability for resource-constrained, in-vehicle deployment. Collectively, these advances render TS-YOLO a promising candidate for safety-critical automotive applications that demand a balanced accuracy–speed profile.