

Develop an esthetic-zonal non-invasive periodontal assessment tool based on YOLOv8 and intraoral images
- Published
- Accepted
- Received
- Academic Editor
- Paulo Jorge Coelho
- Subject Areas
- Algorithms and Analysis of Algorithms, Artificial Intelligence, Computer Vision, Data Mining and Machine Learning, Neural Networks
- Keywords
- Periodontal disease, YOLOv8, Machine learning, Oral esthetics, Intraoral digital photography, Computer-assisted instruction
- Copyright
- © 2025 Hong et al.
- Licence
- This is an open access article distributed under the terms of the Creative Commons Attribution License, which permits using, remixing, and building upon the work non-commercially, as long as it is properly attributed. For attribution, the original author(s), title, publication source (PeerJ Computer Science) and either DOI or URL of the article must be cited.
- Cite this article
- 2025. Develop an esthetic-zonal non-invasive periodontal assessment tool based on YOLOv8 and intraoral images. PeerJ Computer Science 11:e3229 https://doi.org/10.7717/peerj-cs.3229
Abstract
Objective
Non-periodontal specialists (e.g., orthodontists and prosthodontists) often struggle to efficiently monitor periodontal health in the anterior esthetic zone. This study aimed to develop the Esthetic-zonal Non-invasive Periodontal Assessment Tool (ENPAT), a you look only once (YOLO)v8-based tool that screens oral health conditions and grades periodontal abnormalities from intraoral images.
Methods
From 3,608 frontal intraoral images, a lightweight YOLOv8 classification model produced unlabeled oral health grading (OHG, Fair/Acceptable/Poor) to pre-screen image labelability. For unit-level assessment, triangular gingival regions were annotated in 2,029 images for modified gingival index (MGI) and 1,847 images for papillae filling index (PFI). We trained YOLOv8s-seg and a GhostNet-modified variant (YOLOv8-Ghost) with five-fold cross-validation, using ResNet-50 as a baseline classifier. A retrospective real-world test set (MGI n = 156 and PFI n = 121) was used to assess generalization, while two junior dentists then graded the same set twice (with and without artificial intelligence (AI)) to analyze agreement (Cohen’s κ and weighted κ) with experts’ diagnosis and efficiency (ΔTime%).
Results
OHG achieved mean accuracy of 0.872. In cross-validation, YOLOv8 outperformed Ghost-YOLOv8 on PFI (macro-accuracy 0.927 vs. 0.920, F1-score 0.762 vs. 0.743, mAP@50 0.726 vs. 0.702; P ≤ 0.001), with smaller grade-specific gains on MGI (e.g., accuracy of MGI0 0.867 vs. 0.853, P = 0.017). Both YOLOv8 variants exceeded ResNet-50 on real-world set, while YOLOv8 showed the strongest overall PFI performance (accuracy 0.940, mAP@50 0.854, F1-score 0.838). YOLOv8-Ghost reduced complexity substantially (−44.2% params and −29.0% GFLOPs). With AI assistance, junior dentists’ diagnosis rose to satisfactory levels (weighted κ up to 0.799), and per-image evaluation time decreased by 18.10% for MGI and 22.79% for PFI (P < 0.05).
Conclusion
ENPAT delivers real-time, multi-class grading of periodontal conditions from routine intraoral photos. The standard YOLOv8s-seg model offers the best overall accuracy and sensitivity, while YOLOv8-Ghost provides a compelling lightweight alternative. These results support ENPAT’s potential to enhance periodontal screening and education for non-periodontal practitioners.
Introduction
Periodontal complications in the anterior esthetic zone (Jivraj & Chee, 2006), such as localized gingivitis, alveolar bone loss, gingival recession, hypertrophy, temporary hyperplasia, and dark triangles, are common during medium- to long-term oral treatments (e.g. orthodontics and prosthodontics) (Alfuriji et al., 2014; Jepsen, Sculean & Jepsen, 2023). These complications not only interfere with ongoing treatments but can also have negative effects on systemic health (Villoria et al., 2024). Therefore, monitoring the periodontal condition throughout treatment is essential.
Currently, periodontal clinical examination (PCE), including visual assessment, periodontal probing and X-ray examination, is fundamental to diagnosis and treatment planning of periodontal disease (Pawlaczyk-Kamieńska, Torlińska-Walkowiak & Borysewicz-Lewicka, 2018). As dominate signals of periodontal abnormalities, gingival bleeding on probing (BoP%), gingival index (GI) and oral hygiene index (OHI), including the simplified calculus index (CI-S) and simplified debris index (DI-S), are commonly used indicators of health conditions in PCE (Chapple et al., 2018; Sosiawan et al., 2022). However, these examinations are invasive, contradicting the principles of comfort dentistry. Furthermore, PCE often requires auxiliary agents, such as the plaque disclosing agents, and specialized instruments, such as periodontal probes, leading to the clinical examination with low efficiency (Alghamdi et al., 2022). The interpretation of PCE results is also subjective and can be influenced by factors such as operator skill, examination technique, and the instruments used, leading to potential inconsistencies in diagnostic outcomes and poor stability. Additionally, the lack of specialized diagnostic devices and limited clinical experience in periodontal assessment among non-periodontal specialists, especially orthodontists and prosthodontists, may make comprehensive examination time-consuming and complex. Consequently, there is a pressing need for an efficient and accurate tool that non-periodontists can utilized to monitor periodontal health.
Intraoral digital photographic examination (IDPE) offers a non-invasive and more efficient alternative to traditional PCE for monitoring periodontal condition (Estai et al., 2017; Salvi et al., 2023). Previous studies have demonstrated that modified gingival index (MGI) based on intraoral images, provides accurate, non-invasive grading of gingival health (Tobias & Spanier, 2020a). In addition, the open gingival embrasure space (OGES) (also known as gingival black triangles), commonly seen in patients with chronic periodontitis and gingival papillae recession (Kurth & Kokich, 2001; Tanwar et al., 2016; Ziahosseini, Hussain & Millar, 2014), can be quantitively assessed using the papillae filling index (PFI) (Nordland & Tarnow, 1998). This study also introduces the oral health grading (OHG), a self-defined metric that serves as an alternative to OHI for supplementary assessment alongside MGI and PFI.
Artificial intelligence (AI)-based diagnosis models using intraoral photography have gained significant attention in the field of dental caries (Mohammad-Rahimi et al., 2022), periodontal diseases (Revilla-Leon et al., 2023), dental trauma and vertical root fracture (Revilla-León et al., 2022), dento-maxillofacial deformities (Ragodos et al., 2022), implantology (Revilla-León et al., 2023) and oral mucosa disease (Lin et al., 2021). You look only once v8 (YOLOv8), a state-of-the-art object detection model released by Ultralytics in January 2023, has shown extensive potential for the image-based diagnosis in the dental research, demonstrating exceptional performance across a range of applications (Chen et al., 2024; Gaudin et al., 2024; Lin et al., 2024; Mureșanu et al., 2024; Wu et al., 2024; Xie et al., 2024; Xue, Chen & Sun, 2024). Whereas YOLOv8 has not been applied for multi-grade periodontal diagnosis of primary dental visit and quick visual examination (Yurdakurban et al., 2025) so far. Therefore, the aim of the current study is to develop a YOLOv8-based diagnostic model that provides standardized labeling and detailed periodontal evaluation reports for anterior esthetic zone using OHG, MGI and PFI through intraoral images.
Methodology
This retrospective study complied with the World Medical Association’s Declaration of Helsinki for biomedical research involving human subjects and was approved by the Ethics Committee of West China Hospital of Stomatology, Sichuan University (protocol number: WCHSIRB-D-2021-331). We retrospectively collected 12,168 frontal intraoral digital photographs from clinical visits between January 2019 and June 2024. Informed consent was waived as this was a retrospective study based on existing data. All longitudinal clinical records were anonymized. The workflow was summarized in Fig. 1. Images were acquired with a professional dental camera using a 105-mm macro lens and macro flash, and stored as RGB JPEGs.
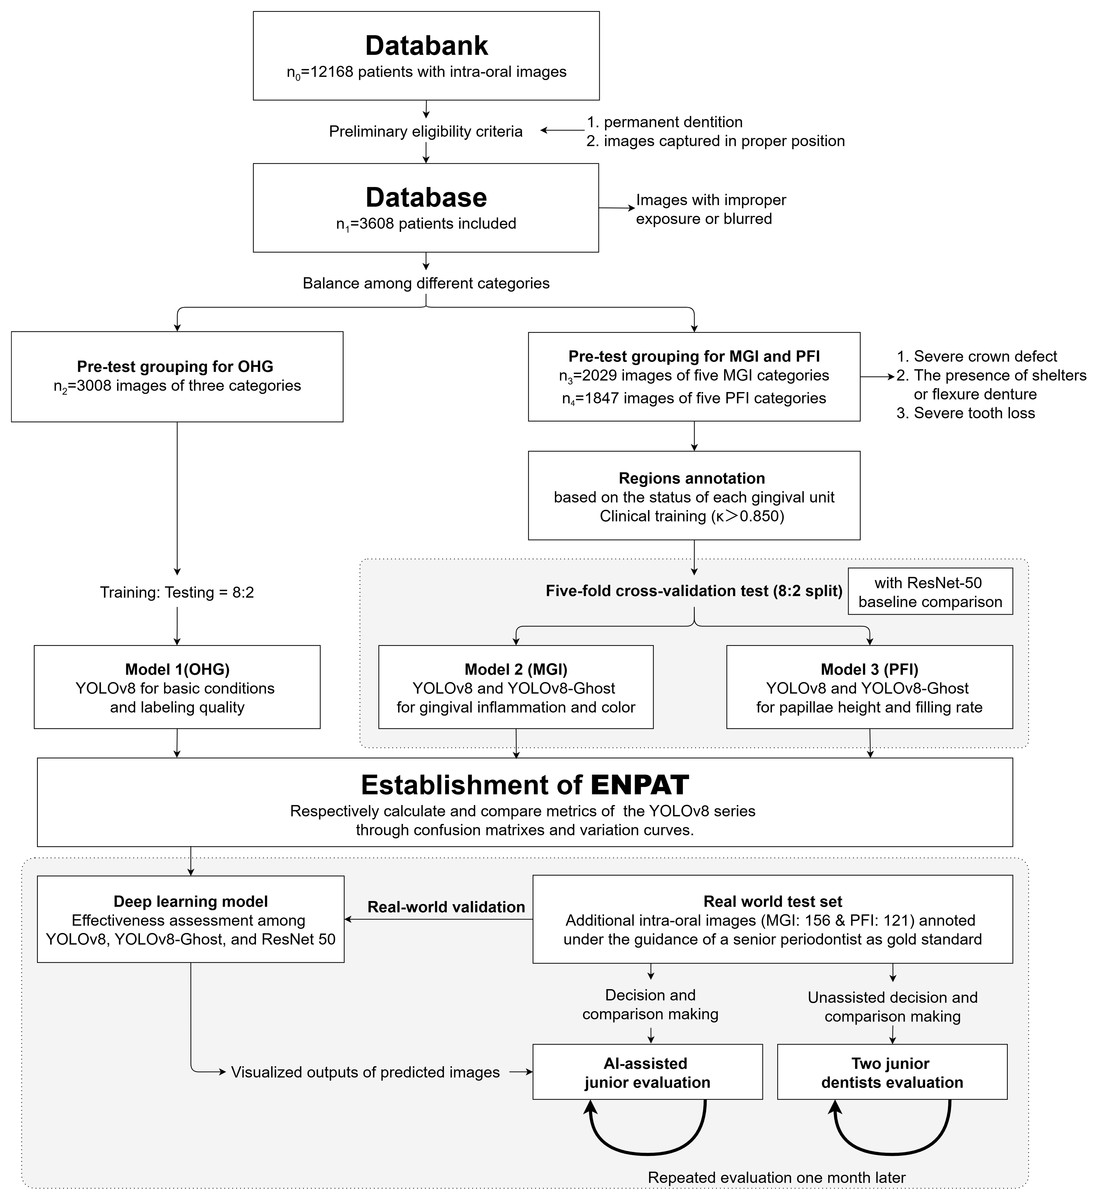
Figure 1: Study flowchart.
Represents a systematic approach (including classification, annotations, the model training, validation and the assessment) to developing a YOLOv8-based diagnostic model and assessing its accuracy and efficiency for anterior periodontal health conditions in combination with clinical indices. MGI, Modified gingival index; PFI, Papillae filling index; ENPAT, Esthetic-zonal Non-invasive Periodontal Assessment Tool.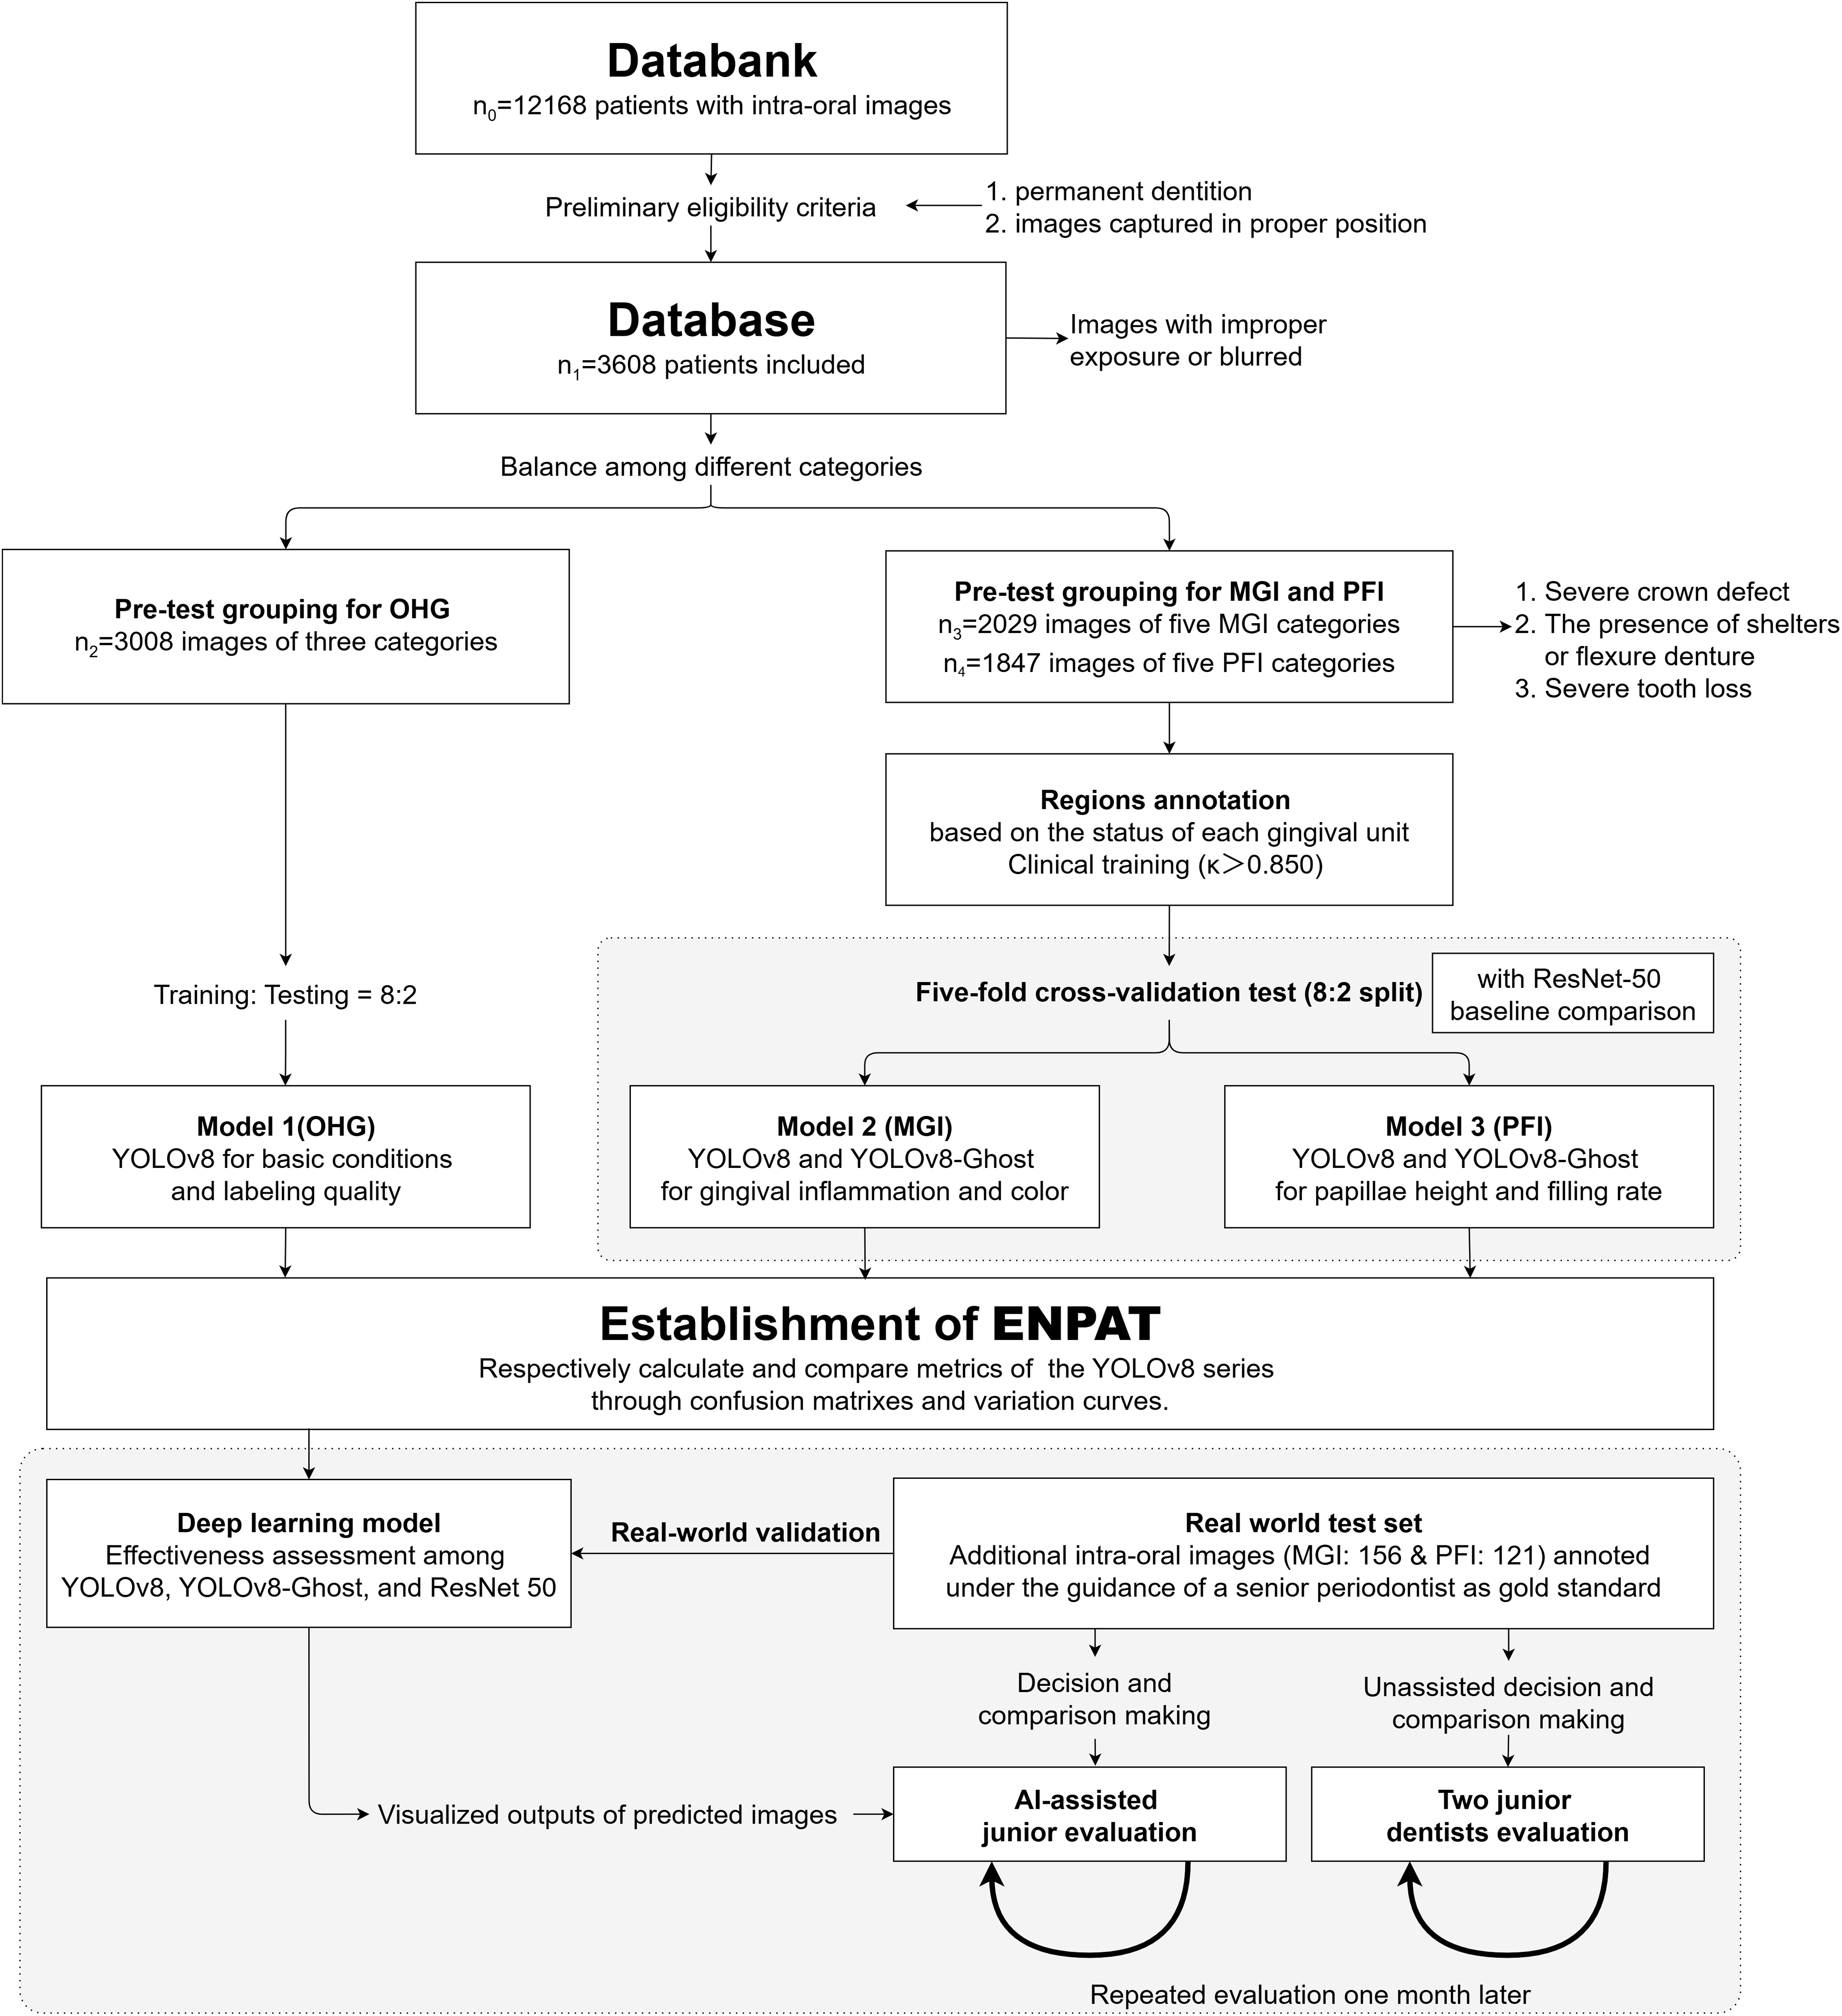
Eligibility and pre-grouping
The inclusion criteria were as follows: Images of patients with permanent dentition captured under a standardized protocol (maxillary midline centered, horizontal plane aligned camera, and balanced buccal spaces). Exclusions were images with improper exposure (either too high or too low) or blurred due to improper focal length adjustment, which hindered the identification of key structures (e.g., severe pigment deposition, demineralization, dental calculus, gingival margin or papillae, and other important anatomical features). After screening, 3,608 images entered the database. The demographic and clinical characteristics of the included subjects are summarized in Table 1.
| Characteristic | Total (n) |
|---|---|
| Age, median (range), y | 31.2 (13, 72) |
| Sex, n (%) | |
| Male | 1,536, 43% |
| Female | 2,072, 57% |
| Oral health conditions | 3,008 |
| Fair | 987 |
| Acceptable | 1,052 |
| Poor | 969 |
| Gingival conditions | 2,029 |
| Healthy (MGI 0) | 353 |
| Inflammatory (MGI 1 ~ 4) | 1,676 |
| MGI 1 | 397 |
| MGI 2 | 375 |
| MGI 3 | 449 |
| MGI 4 | 455 |
| Papillary conditions | 1,847 |
| Normal | 742 |
| PFI 2 | 368 |
| PFI 3 | 374 |
| Papillary recession | 733 |
| PFI 0 | 379 |
| PFI 1 | 354 |
| Over filling (PFI 4) | 372 |
Note:
MGI, Modified gingival index; PFI, Papillae filling index.
For overall oral health grading, 3,008 images were used (Fair: 987; Acceptable: 1,652; and Poor: 969). A total of 600 images were randomly down-sampled from the Acceptable to balance the group sizes, and an 8:2 split was used for training and testing. Subsequently, a visual periodontal diagnosis was performed, and materials unsuitable for MGI and PFI labeling and training were identified based on the following criteria: severe crown defects or removable prosthesis shielding the anterior zone, and obvious tooth loss (<6 anterior teeth or <5 interproximal spaces). Two datasets were then provided: MGI (n = 2,029; overall MGI0-4: 353, 397, 375, 449, and 455, respectively), and PFI (n = 1,847, overall PFI0-4: 379, 354, 368, 374, and 372, respectively). Considering the classification from Periodontal and Peri-Implant Diseases and Conditions (Chapple et al., 2018), the overall classification criteria of individual intraoral images are summarized in the third column of Table 2 and we balanced the number of images (≈300–450 per class) for the model cohorts to avoid training bias. Besides, an independent retrospective set involving 156 images for MGI and 121 for PFI was assembled to assess generalization on unseen but same-source databank. All splits were performed at the patient-level to avoid subject overlap across training and validation test.
| Indicators and labeling | Gingival unit-level diagnosisa | Overall image-level diagnosis |
|---|---|---|
| Oral health grading, OHG | ||
| Fair | Health gum, with normal color or mild edema, no visible accumulation of soft deposits and calculus. | |
| Acceptable | Soft deposits or calculus seen in 1 to 2 teeth, local gingival redness or receding, with or without pigmentation, or mild malocclusion. | |
| Poor | Soft deposits and calculus seen at multiple dental sites, and/or widespread redness and swelling of the gums, and/or spontaneous bleeding, and/or severe gingival receding, with or without pigmentation, or severe malocclusion. | |
| Modified gingival index, MGI | ||
| 0 | Normal and absence of inflammation. | Entire gingival units of anterior zone |
| 1 | Mild inflammation, which indicates slight change in color, little change in texture. | Of at least 1 unit; Without MGI 2–4 |
| 2 | Mild to moderatea inflammation, severer than MGI1a. | Of at least 1 unit; Without MGI 3–4 |
| 3 | Moderate inflammation (moderate glazing, redness, edema, and/or hypertrophy). | Of at least 1 unit; Without MGI 4 |
| 4 | Severe inflammation (marked redness and edema/hypertrophy, spontaneous bleeding, or ulceration). | Of at least 1 unit |
| Papillae filling index, PFI | ||
| 0 | The apex of papillae ≤ baselineb height. | Of at least 1 unit* |
| 1 | The apex of papillae ≤ 1/2 of the distance from the contact point to the baseline. | Of at least 1 unit; Without PFI4 and PFI0* |
| 2 | The apex of papillae ≥ 1/2 of the distance from the contact point to the baseline, but not reaching the contact point (mostly located). | Only PFI2 and three exist; PFI3 ≤ PFI2 in label quantity |
| 3 | The apex of papillae = the height of the contact point (ideal and theoretical height). | Only PFI2 and three exist; PFI3 > PFI2 in label quantity |
| 4 | The apex of papillae > the height of contact point, indicating gingival swelling and hyperplasia. | Of at least 1 unit; Without PFI0* |
Note:
Sample annotation
The Labelme annotation tool (version 5.2.1, Anaconda, Austin, TX) written in Python was utilized to annotate the periodontal area according to the predefined standards. All annotations were exported in JSON format, including rectangular boxes and triangular masks.
For unit-level labeling, We implemented MGI (Lobene et al., 1986) and PFI criteria (Nordland & Tarnow, 1998) for refined gingival unit, especially each adjacent dental space and its surrounding gingival margin (Table 2, the second column). Three trained dentists (Hong J., Tang Z., and Li H.) annotated triangular gingival units for MGI (simplified as G) and PFI (simplified as P) following Table 2 and exemplar atlas (as illustrated in Fig. 2) within 2 months. Prior to labeling, the team completed a calibration session to harmonize grade boundaries and polygon placement. During labeling, annotators were blinded to each other’s marks. Intra- and inter-annotator agreement was high (Cohen’s κ = 0.855–0.967, with calibration session displayed in Supplement S1.1) (Cohen, 1960), and disagreements were resolved by consensus. Unresolved cases (approximately 8% MGI and 2% PFI) were adjudicated by a senior dentist (Yi J.).
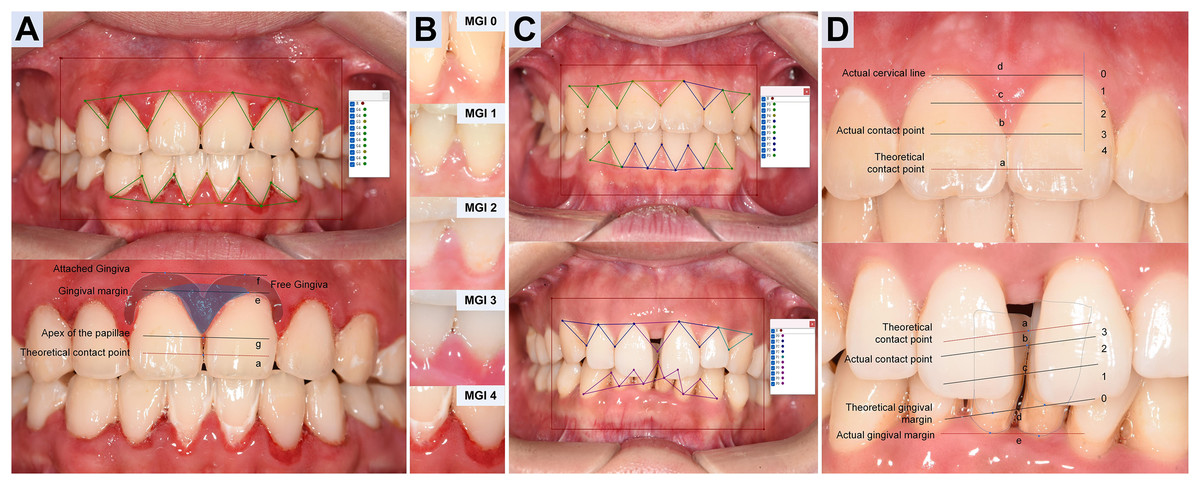
Figure 2: Annotation design and diagnostic criteria of Modified gingival index and Papillae filling index.
(A) MGI annotation. For each gingival unit, draw a triangular wedge, the base spans from the lowest cervical margin (le) to the attached gingiva (lf) of adjacent teeth; the vertex is the papillary apex (lg), not the theoretical contact point (la). Polygon label: G. (B) MGI grading (0–4). Determined mainly by color and texture of each triangular unit, ignoring differences in photographic exposure. (C) PFI annotation. Use a triangular wedge labeled P with vertices at the actual cervical line (ld), the actual contact point (lb, replacing la) and the actual papillary apex (le). Note ld may be covered (thick biotype/hyperplasia/inflammation) or exposed (recession). (D) PFI grading. For each gingival unit, PFI0: the height of le ≤ ld; PFI1: le between ld and lc (1/2 height of ld and the actual contact point); PFI2: le between lc and lb (the actual contact point); PFI3: the height of le ≈ lb; PFI4, le above lb.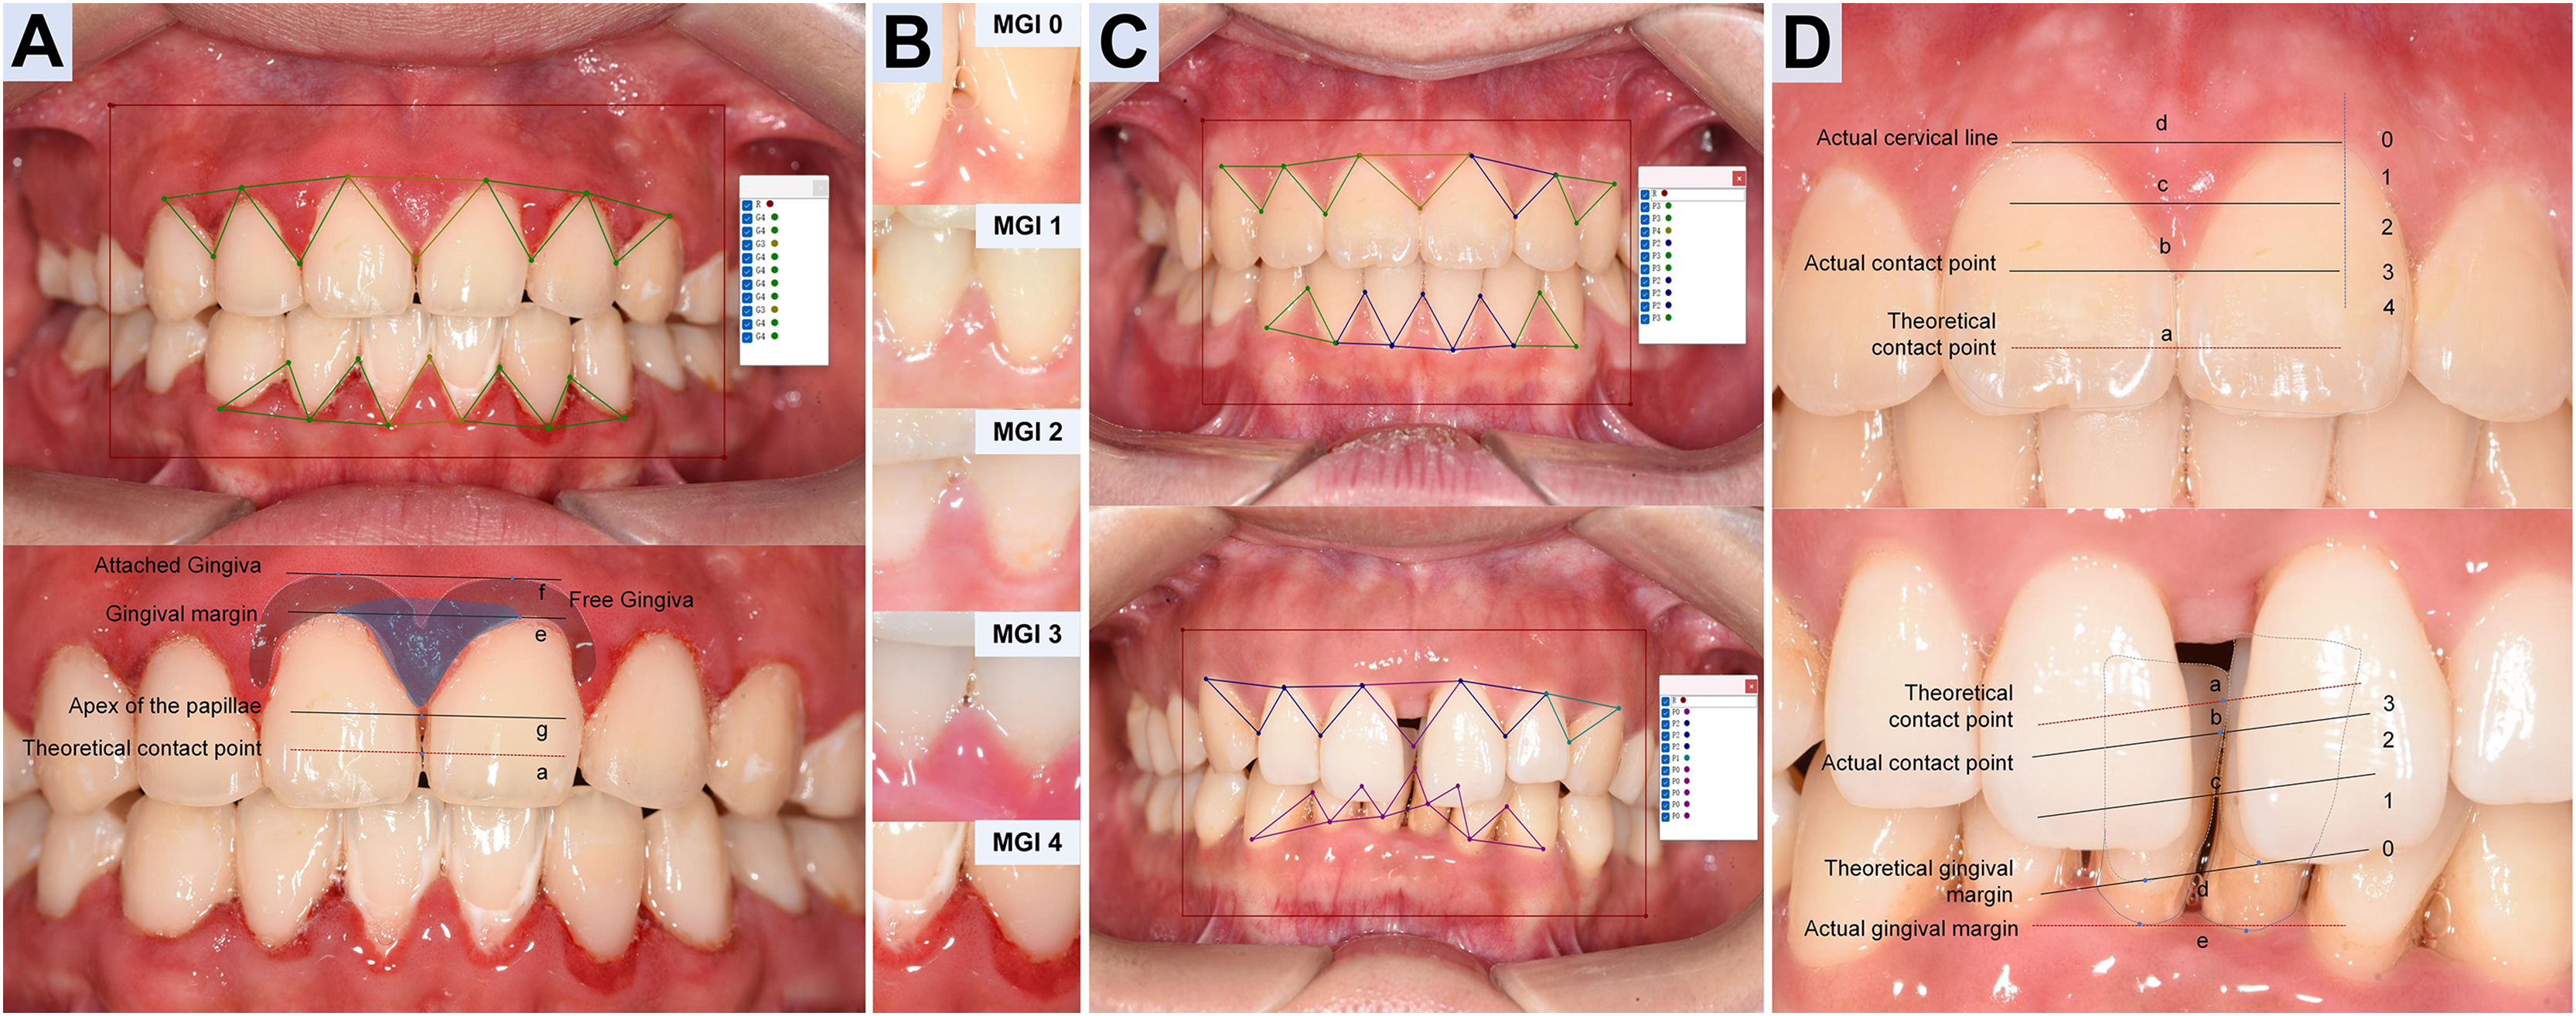
Furthermore, following the reference framework reported (Li et al., 2022), images from real-world test (RWT) set were annotated under the supervision of the senior periodontist as the reference. Two junior dental student volunteers then graded the RWT twice (without and with AI assistance) 1 month apart, enabling analysis of agreement and efficiency.
Model establishment and architecture
YOLOv8
YOLO is a high-efficiency convolutional neural network (CNN)-based object detection framework that reframes detection as a regression problem, directly predicting bounding boxes and class probabilities from raw image pixels. For this study, we adopted the YOLOv8s-seg variant, which optimizes lightweight design and real-time inference while supporting multi-grade segmentation masks for precise clinical assessment (Sohan et al., 2024). The detailed architecture of YOLOv8, involving redesigned backbone, decoupled detection head, and updated loss functions, is depicted in Fig. 3 referred to the structure provided (Range & Jocher, 2023).
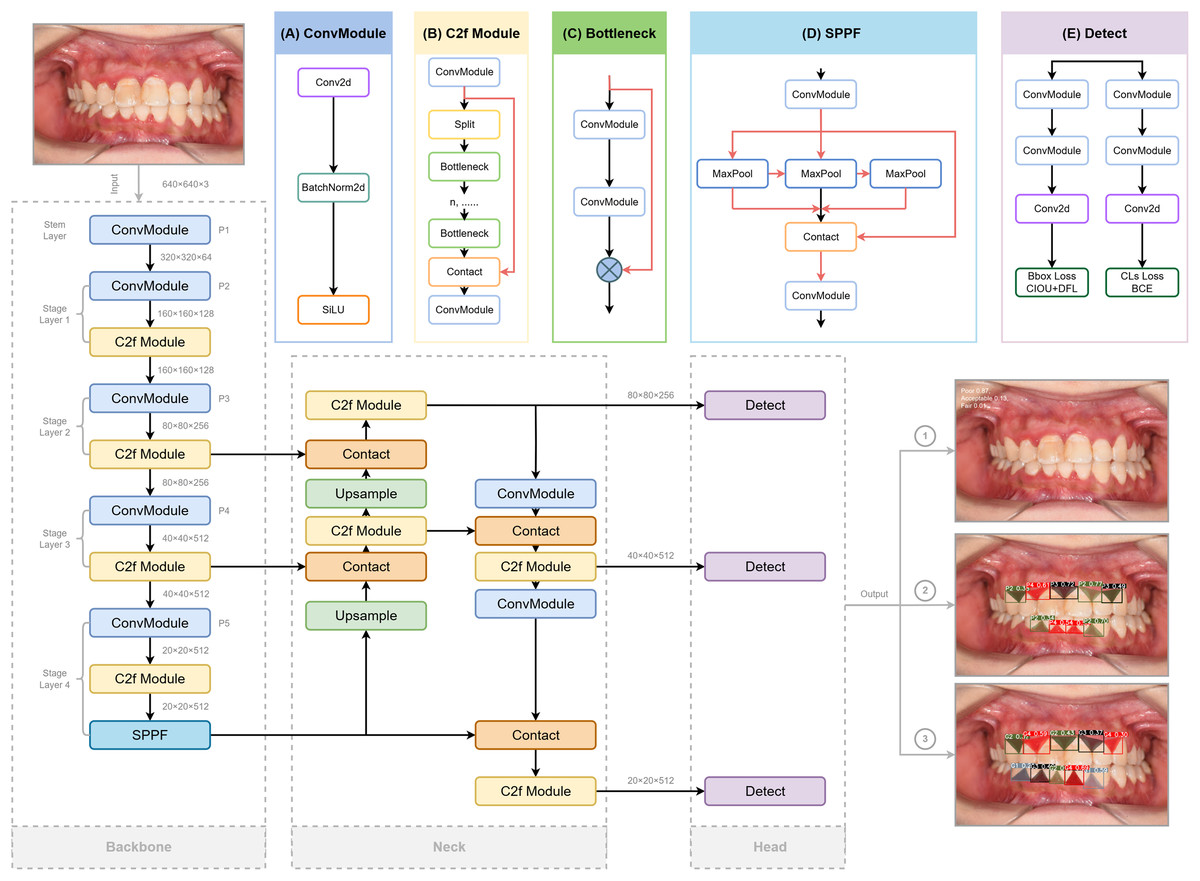
Figure 3: The structure of Yolov8 and processing of the input and output of the images, highlighting its key components for enhanced object detection.
Three crucial portions are included: Backbone for extracting features from the input image, Neck for fusing the features extracted from the trunk and detection Head (originated from RangeKing@github). (A) Convolution(conv). Two ConvModules integrates convolution with batch normalization and SiLu activation functions to streamline the network and maintain high performance. (B) C2f Module. The C2f module in the backbone concatenates bottleneck module outputs, enhancing feature extraction and reducing computational load. (C) Bottleneck. DarknetBottleneck reduces parameters and improves complex feature capture through two consecutive convolutional layers. (D) Spatial Pyramid Pooling Fast (SPPF). SPPF in Stage 4 boosts multi-scale feature extraction, leading to our model with a better learning ability and shorter inference time. (E) Detection Layer. A task alignment score is introduced to address potential misalignment caused by the decoupled head separating classification and regression tasks in object detection, guiding the model in selecting and optimizing positive samples using BCE, CIoU, and DFL loss functions. These detection heads generate bounding boxes, assign confidence scores, and classify the boxes according to their category, while BCE ensures label prediction accuracy, CIoU refines bounding box positioning, and DFL optimizes boundary distribution for improved overall performance.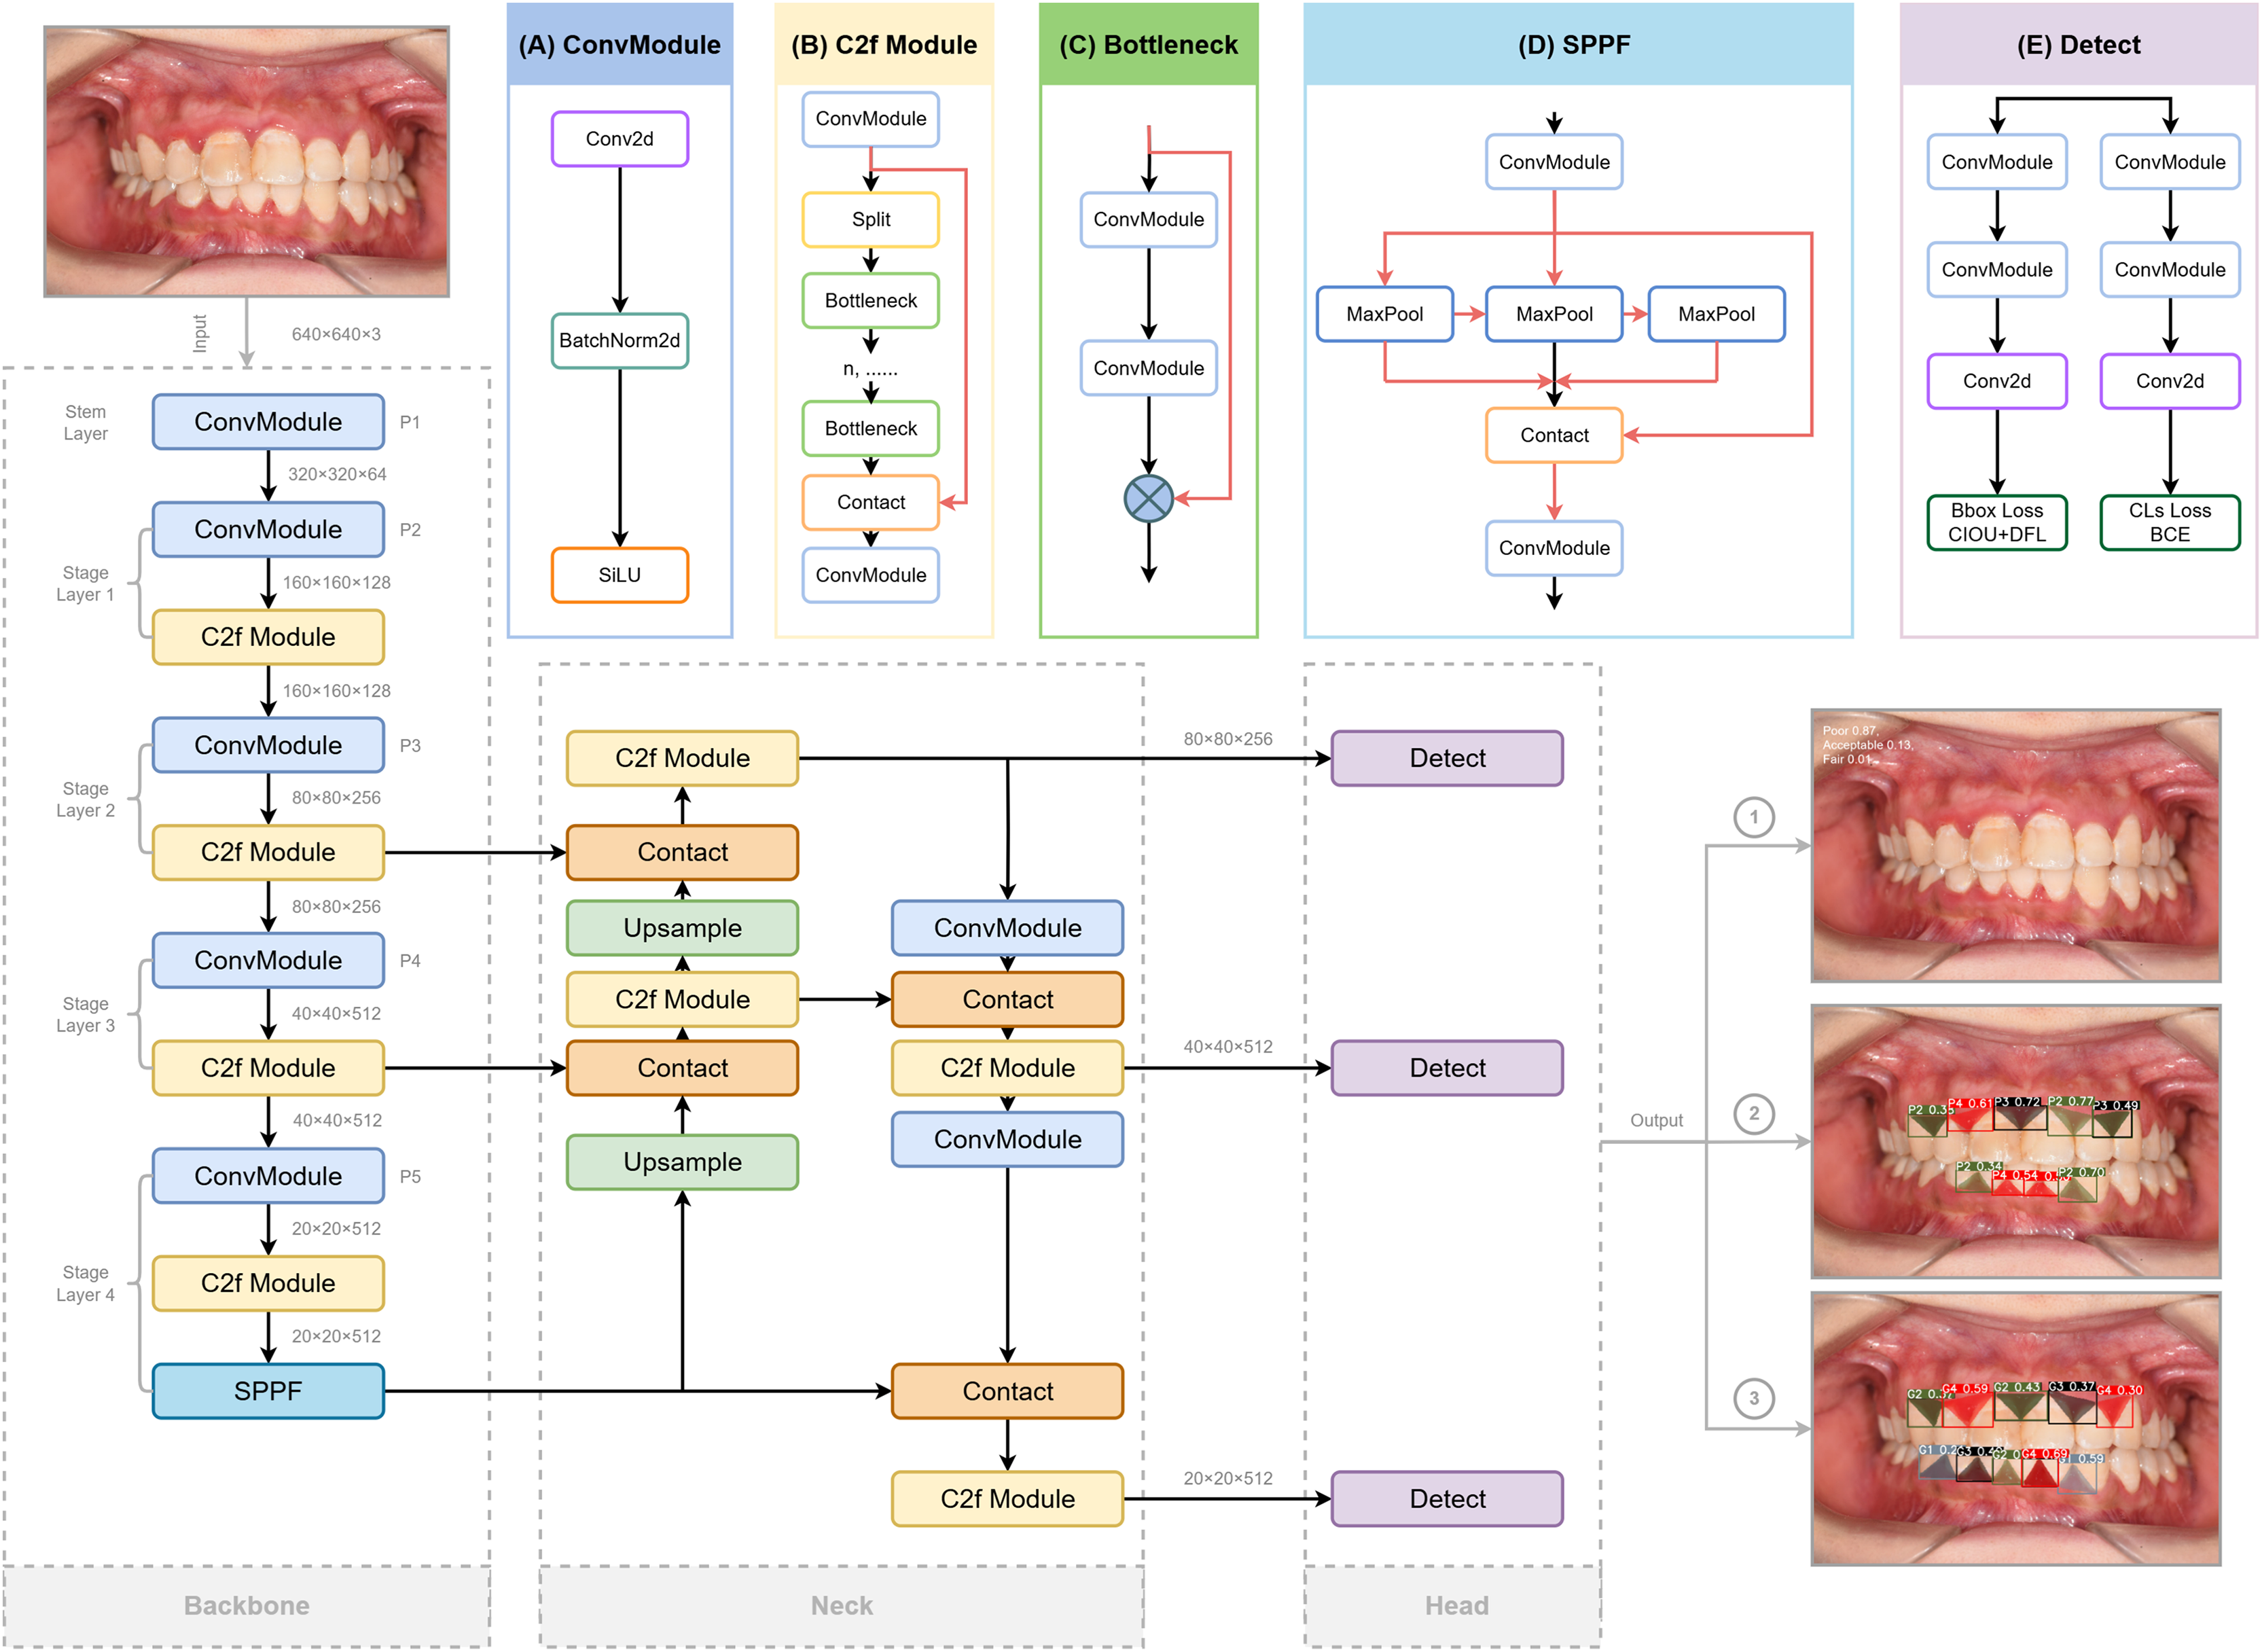
Backbone
YOLOv8 employs modified CSPDarknet53 backbone with five downsampling stages to extract multi-scale features (Redmon & Farhadi, 2018). The C2f module integrates dense and residual structures, enhancing gradient flow and feature representation while maintaining a lightweight design. This is in contrast to the cross-stage partial (CSP) module, which is more computationally intensive but effective in extracting features (Wang et al., 2020). A spatial pyramid pooling fast (SPPF) module at the end of the backbone further reduces complexity and latency, boosting detection performance across different feature scales (He et al., 2015).
Neck
The Neck combines a feature pyramid network (FPN) (Lin et al., 2017) for bottom feature map enhancement via a top-down pathway, and a path aggregation network (PANet) (Liu et al., 2018) for high-level semantic aggregation through a bottom-up pathway, adding more information to the top feature map. The FP-PAN multi-scale feature fusion method merges both shallow and deep feature maps, enabling the model to better recognize polygonal regions of interest. The feature maps from convolution layers P3, P4, and P5 are transmitted through various levels of the pyramid, and are integrated to ensure robust and precise predictions for images of various sizes.
Detection head
A task-aligned assigner (Feng et al., 2021) replaces traditional anchors-based mechanisms to improve the model’s detection accuracy and robustness, which could dynamically categorize samples as “positive” or “negative”. To generate segmentation masks, a decoupled head structure is adopted, involving separate branches for simultaneous object classification and bounding box regression for detection (Chabi Adjobo et al., 2023). Classification is optimized using binary cross-entropy (BCE) loss, while bounding box regression combines distribution focal loss (DFL) (Li et al., 2023) and complete intersection over union (CIoU) (Zheng et al., 2020) loss to enhance object localization precision and convergence speed (Khalili & Smyth, 2024; Zheng et al., 2020).
YOLOv8-Ghost
To enable deployment on resource-constrained devices, we integrated GhostNet into YOLOv8. GhostNet is a lightweight neural network designed to generate more feature maps at a lower computational cost compared to conventional convolutions (Han et al., 2020). By leveraging depthwise-separable convolutions (Fig. 4A), the network reduces Parameters (Params) and GFLOPs while largely preserving detection and segmentation accuracy (Ding et al., 2024). In YOLOv8-Ghost variant, Ghost bottleneck modules were embedded into C2f blocks (forming C2f-Ghost) (Jiale et al., 2024), and standard convolutions were replaced with Ghost convolutions (Figs. 4B–4D). This variant was trained and evaluated in parallel with the vanilla YOLOv8s-seg.
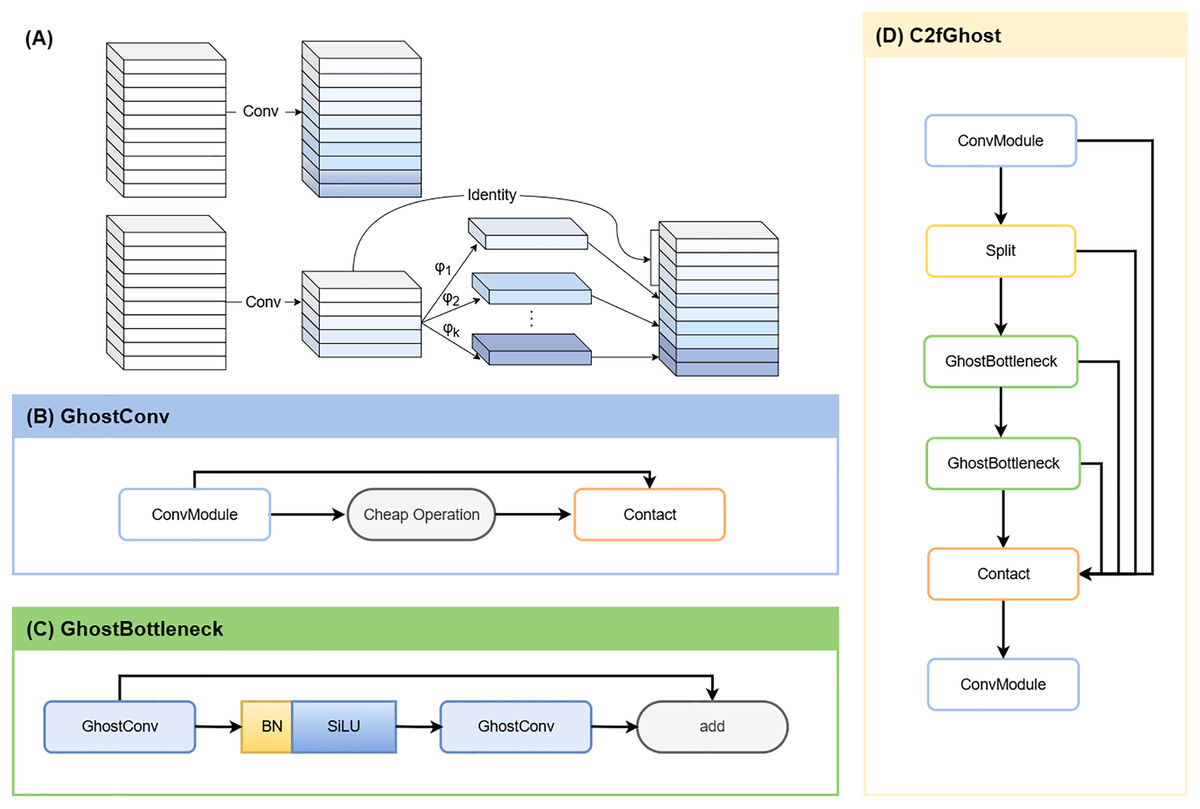
Figure 4: YOLOv8-Ghost improvement.
(A) Ordinary convolution vs. GhostConv. The Ghost module replaces a single dense convolution with a two-step process: a standard convolution first produces a small set of intrinsic feature maps; inexpensive linear operations (involving depth-wise convolution or linear transforms) then derive additional and similar “ghost” features from them. Concatenating the intrinsic and ghost features yields the desired channel count at lower computational cost. (B) GhostConv structure. (C) GhostBottleneck structure. (D) C2fGhost module.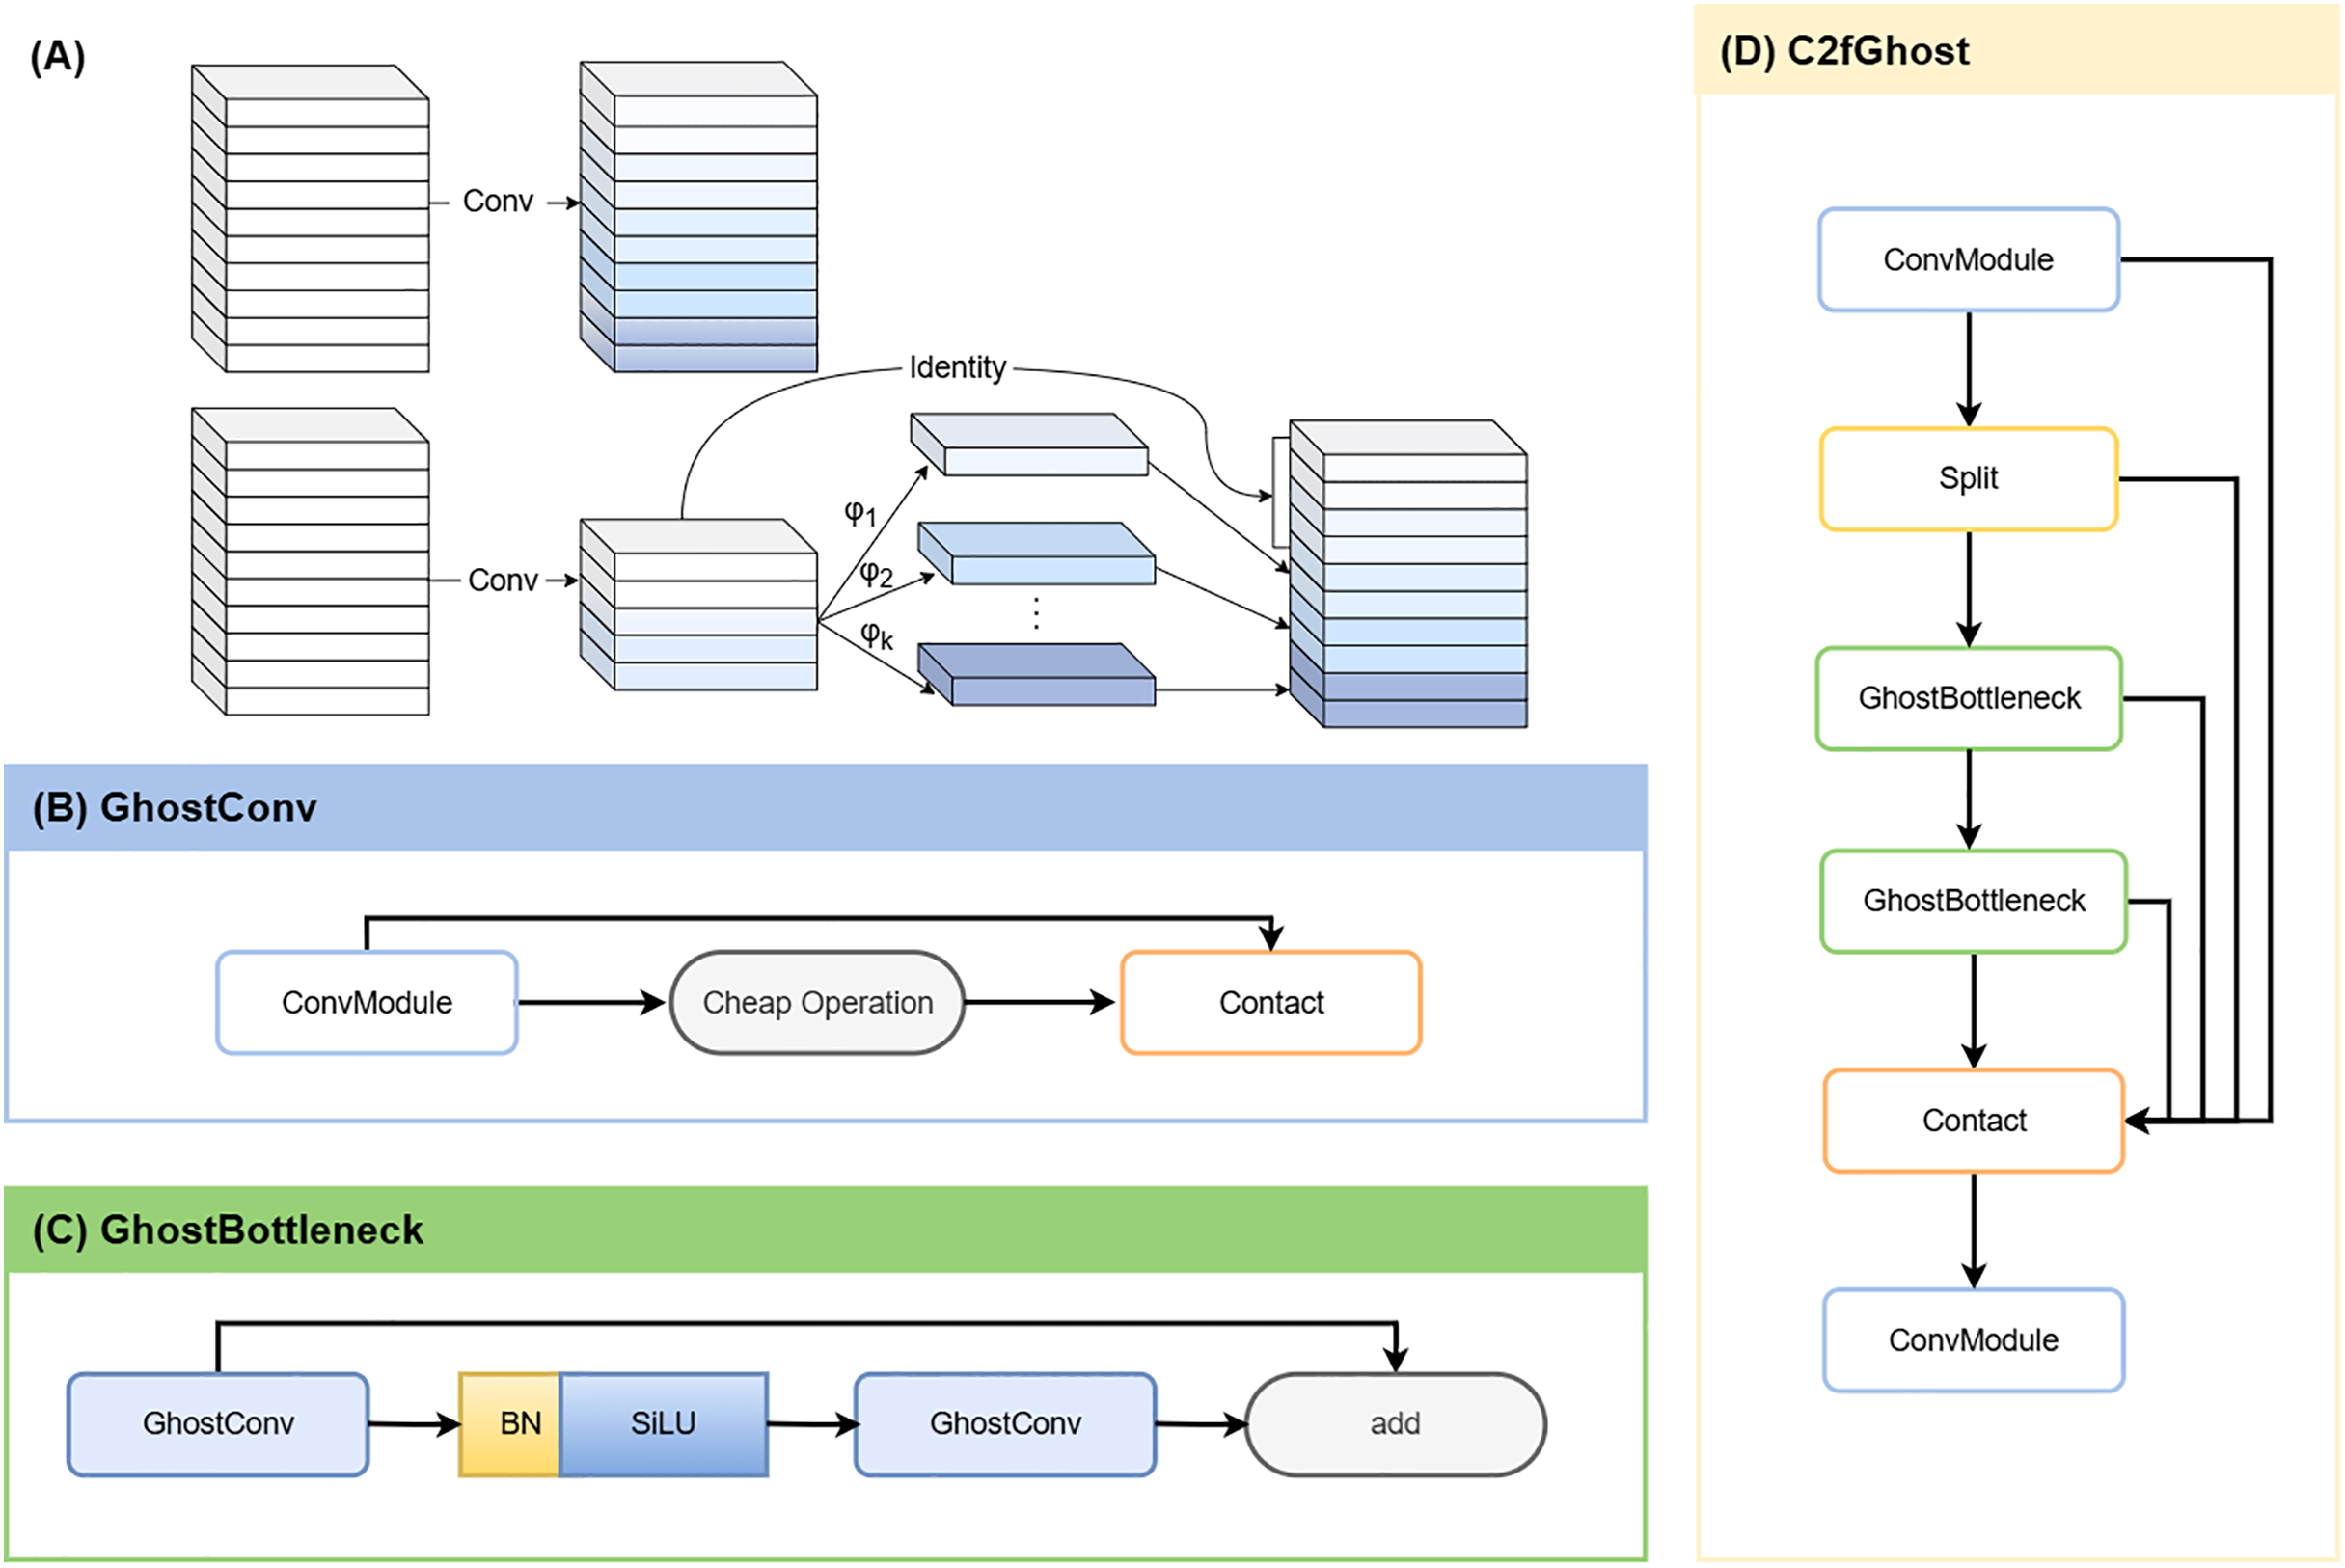
ResNet-50
ResNet-50, composed of convolutional, activation, and pooling layers within a 50-layer deep residual architecture, served as a reference baseline classifier (Huang et al., 2023). The 50-layer residual architecture mitigates vanishing and exploding gradients via identity skip connections. Each convolutional layer is followed by a ReLU activation function to accelerate computation and prevent gradient saturation, while pooling layers downsample feature maps to further reduce computational load. A fully connected layer then maps the extracted feature space to the label space, and a SoftMax layer converts the output scores into class probabilities to generate the final classification results.
Statistical analysis
Models were trained and tested on Ubuntu 20.04 64-bit OS with PyTorch using Intel(R) i7-12700kf CPU and Nvidia 2080Ti GPUs. Tunable hyperparameters adjusted from the reference (Chabi Adjobo et al., 2023) are listed in Table S1. For OHG (ternary and image-level), the predicted grade with maximum probability was compared with the dentist’s diagnosis. For MGI and PFI (of five-class and unit-level), a prediction was counted correct when the target region exceeded the confidence threshold and the class matched the reference. 5 × 5 Confusion matrices (with background excluded) were used to visualize the algorithm’s performance. True positive (TP), false positive (FP), false negative (FN) and true negative (TN) values were derived from confusion matrix cells, and the remaining metrics were derived accordingly (Oh, Kim & Lee, 2023).
Primary performance metrics were accuracy (ACC), mean average precision at 50% (mAP@50), sensitivity (recall), F1-score, precision (positive predicted value, PPV), specificity and negative predicted value (NPV). The definitions and equations for these metrics mentioned above are provided in Supplement S1.3. Continuous variables are reported as mean ± standard deviation (SD) or median (Interquartile Range, IQR) according to Shapiro-Wilk normality tests. Two-tailed P < 0.05 indicated statistical significance.
For cross-validation comparisons, metrics from confusion matrices under the threshold that maximized macro-F1-scores were computed per fold and per grade, then macro-averaged. To compare YOLOv8 with Ghost-YOLOv8, paired tests were performed on matched observations of same fold and grade. Groups that demonstrated normal distribution and homogeneity of variance, a paired-sample t-test was conducted. Conversely, Wilcoxon signed ranks tests were applied to groups exhibiting either non-normal distributions or non-homogeneous variances. 95% confidence intervals (CIs) were obtained from the paired t-test or, for non-normal data, as Hodges-Lehmann median differences from the Wilcoxon procedure.
For ordinal multi-class classification tasks in real-world validation, both Cohen’s and weighted (with task-specific clinical penalty, detailed in Supplement S1.3.2B, S1.3.2C) were calculated by python program to assess agreement with the gold standard, thus only point estimates were reported. In AI-assisted evaluation, diagnostic metrics were analyzed using paired-sample t-tests (or Wilcoxon signed ranks tests for non-normal data between AI-assisted and manual evaluations, and were expressed as ΔMean (%) with 95% CIs. Besides, given the high inter-individual variability in raw or absolute evaluation time, efficiency gains were assessed using the relative reduction (ΔTime%, calculated as Formula in Supplement S1.3.2D). A one-sample t-test against 0 assessed whether mean ΔTime% was significantly positive, and results are reported with 95% CIs.
All statistical analyses were conducted using Microsoft® Excel® 2019 MSO (Microsoft Corp., Redmond, WA, USA), IBM SPSS Statistics 24.0 (IBM, Corps., Armonk, NY, USA), and PyCharm 2023.3.3 (JetBrains, Prague, Czech Republic) with relevant statistical libraries.
Results
Performance of label-free ternary classification for oral health grading
According to Table 3, the YOLOv8 model achieved high accuracy in the ternary classification of OHG, with mean accuracy, F1-score, precision and recall of 0.872 ± 0.023, 0.810 ± 0.023, 0.810 ± 0.047 and 0.810 ± 0.037, respectively. Mean specificity and NPV were both reaching 0.903 with SD ≤ 0.030, indicating reliable exclusion of negatives across Fair, Acceptable, and Poor. At the grade level, Poor reached accuracy = 0.902, F1-score = 0.846, recall = 0.831, and specificity = 0.935. In practice, this module serves as a pre-screen step to label images with severe malocclusion or anterior tooth loss that might distort downstream MGI or PFI assessment.
| Grades | Metrics | |||||
|---|---|---|---|---|---|---|
| Accuracy | F1-score | Precision | Recall | NPV | Specificity | |
| Fair | 0.889 | 0.818 | 0.803 | 0.833 | 0.927 | 0.912 |
| Acceptable | 0.826 | 0.767 | 0.767 | 0.767 | 0.861 | 0.861 |
| Poor | 0.902 | 0.846 | 0.861 | 0.831 | 0.920 | 0.935 |
| Mean ± SD | 0.872 ± 0.023 | 0.810 ± 0.023 | 0.810 ± 0.047 | 0.810 ± 0.037 | 0.903 ± 0.030 | 0.903 ± 0.031 |
Note:
NPV, Negative predictive value; SD, Standard deviation.
Performance of multi-classification for periodontal condition
The loss functions and convergence metrics for model performance across different metrics (Figs. S1, S2) demonstrated steadily improving metrics and decreasing losses across epochs. Early stopping was therefore applied to mitigate overfitting once gains plateaued. Besides, the label distributions in training were as shown in Figs. S3, S4.
Five-fold cross-validation results and baseline comparison
In the five-fold cross-validation experiments, YOLOv8 consistently outperformed the lighter YOLOv8-Ghost on most metrics for both MGI and PFI (Tables 4, 5). Paired-sample t-tests were used for normally distributed differences, otherwise Wilcoxon signed ranks tests with Hodges-Lehmann estimates to compute median differences and their 95% CIs.
| Parameters | Grade | Mean ± SD/Mean (QR) | Paired-sample t-test/Wilcoxon signed ranks test | |||||
|---|---|---|---|---|---|---|---|---|
| YOLOv8 | +GhostNet | ΔM (%) | 95% CI (%) | t/Z | P | |||
| Lower | Upper | |||||||
| Accuracy | All | 0.859 ± 0.072 | 0.851 ± 0.077 | 0.80 | 0.42 | 1.18 | 4.351 | 0.000* |
| MGI0 | 0.867 ± 0.009 | 0.853 ± 0.005 | 1.44 | 0.43 | 2.45 | 3.968 | 0.017* | |
| MGI1 | 0.757 ± 0.012 | 0.741 ± 0.008 | 1.51 | 0.38 | 2.63 | 3.726 | 0.02* | |
| MGI2 | 0.813 ± 0.006 | 0.804 ± 0.009 | 0.89 | 0.23 | 1.55 | 3.73 | 0.02* | |
| MGI3 | 0.897 ± 0.006 | 0.896 ± 0.009 | 0.08 | −0.97 | 1.14 | 0.222 | 0.835 | |
| MGI4 | 0.961 ± 0.027 | 0.961 ± 0.004 | 0.08 | −0.39 | 0.54 | 0.456 | 0.672 | |
| mAP@50 | All | 0.593 (0.570, 0.671)** | 0.577 (0.557, 0.668)** | 1.80 | 1.10 | 2.50 | 3.350a | 0.001* |
| MGI0 | 0.901 ± 0.008 | 0.891 ± 0.013 | 0.96 | −0.34 | 2.26 | 2.053 | 0.109 | |
| MGI1 | 0.598 ± 0.031 | 0.576 ± 0.021 | 2.24 | 0.85 | 3.63 | 4.475 | 0.011* | |
| MGI2 | 0.566 ± 0.016 | 0.539 ± 0.014 | 2.64 | 1.68 | 3.60 | 7.634 | 0.002* | |
| MGI3 | 0.657 ± 0.016 | 0.648 ± 0.022 | 0.98 | −2.59 | 4.55 | 0.763 | 0.488 | |
| MGI4 | 0.570 ± 0.029 | 0.569 (0.515, 0.580)** | 1.90 | −2.10 | 5.90 | 1.214a | 0.225 | |
| F1-score | All | 0.564 (0.520, 0.605)** | 0.536 (0.495, 0.604)** | 2.20 | 1.00 | 3.40 | 3.215a | 0.001* |
| MGI0 | 0.822 (0.804, 0.824)** | 0.793 ± 0.014 | 2.40 | 1.20 | 3.60 | 2.023a | 0.043* | |
| MGI1 | 0.562 ± 0.014 | 0.532 (0.504, 0.539)** | 2.10 | −2.40 | 4.70 | 1.483a | 0.138 | |
| MGI2 | 0.511 ± 0.012 | 0.503 ± 0.024 | 0.76 | −2.20 | 3.72 | 0.714 | 0.515 | |
| MGI3 | 0.593 ± 0.014 | 0.575 ± 0.027 | 1.76 | −2.03 | 5.56 | 1.289 | 0.267 | |
| MGI4 | 0.509 ± 0.053 | 0.453 ± 0.055 | 5.60 | −1.32 | 12.53 | 2.246 | 0.088 | |
| Precision | All | 0.571 (0.531, 0.644)** | 0.562 (0.503, 0.681)** | 1.60 | −0.40 | 3.10 | 1.655a | 0.098 |
| MGI0 | 0.827 ± 0.034 | 0.816 ± 0.023 | 1.16 | −3.59 | 5.91 | 0.679 | 0.535 | |
| MGI1 | 0.540 (0.545, 0.569)** | 0.522 ± 0.019 | 2.60 | 0.10 | 5.50 | 2.023a | 0.043* | |
| MGI2 | 0.509 ± 0.012 | 0.487 ± 0.016 | 2.31 | 0.85 | 3.78 | 4.383 | 0.012* | |
| MGI3 | 0.584 ± 0.038 | 0.585 ± 0.024 | −0.08 | −5.84 | 5.68 | −0.038 | 0.972 | |
| MGI4 | 0.591 ± 0.045 | 0.600 ± 0.089 | −0.78 | −11.59 | 10.03 | −0.2 | 0.851 | |
| Recall | All | 0.591 ± 0.129 | 0.560 ± 0.138 | 3.15 | 0.21 | 6.10 | 2.208 | 0.037* |
| MGI0 | 0.806 ± 0.022 | 0.773 ± 0.034 | 3.32 | −2.28 | 8.91 | 1.646 | 0.175 | |
| MGI1 | 0.578 ± 0.030 | 0.569 ± 0.025 | 0.88 | −5.55 | 7.32 | 0.381 | 0.723 | |
| MGI2 | 0.512 ± 0.022 | 0.522 ± 0.041 | −0.97 | −7.66 | 5.73 | −0.401 | 0.709 | |
| MGI3 | 0.606 ± 0.04 | 0.569 ± 0.057 | 3.67 | −6.92 | 14.25 | 0.962 | 0.391 | |
| MGI4 | 0.454 ± 0.087 | 0.365 ± 0.046 | 8.86 | −2.78 | 20.51 | 2.113 | 0.102 | |
| NPV | All | 0.907 ± 0.050 | 0.901 ± 0.050 | 0.60 | −0.38 | 1.58 | 1.26 | 0.22 |
| MGI0 | 0.890 ± 0.013 | 0.874 ± 0.010 | 1.64 | −0.65 | 3.93 | 1.993 | 0.117 | |
| MGI1 | 0.839 ± 0.019 | 0.846 ± 0.020 | −0.70 | −5.06 | 3.67 | −0.443 | 0.681 | |
| MGI2 | 0.885 ± 0.006 | 0.883 (0.847, 0.894)** | 0.20 | −1.20 | 7.40 | 0.135a | 0.890 | |
| MGI3 | 0.943 ± 0.010 | 0.939 ± 0.006 | 0.40 | −0.92 | 1.72 | 0.850 | 0.443 | |
| MGI4 | 0.975 ± 0.003 | 0.971 ± 0.004 | 0.41 | −0.12 | 0.93 | 2.161 | 0.097 | |
| Specificity | All | 0.907 ± 0.056 | 0.901 ± 0.065 | 0.58 | −0.25 | 1.42 | 1.444 | 0.162 |
| MGI0 | 0.903 ± 0.019 | 0.899 ± 0.020 | 0.47 | −3.33 | 4.26 | 0.341 | 0.750 | |
| MGI1 | 0.824 ± 0.014 | 0.805 ± 0.012 | 1.80 | −0.49 | 4.10 | 2.179 | 0.095 | |
| MGI2 | 0.884 ± 0.007 | 0.871 ± 0.012 | 1.35 | −0.71 | 3.40 | 1.817 | 0.143 | |
| MGI3 | 0.938 ± 0.008 | 0.947 (0.931, 0.950)** | −0.50 | −2.40 | 2.90 | −0.674a | 0.500 | |
| MGI4 | 0.985 ± 0.005 | 0.989 ± 0.003 | −0.35 | −1.14 | 0.44 | −1.235 | 0.284 | |
Notes:
| Parameters | Grade | Mean ± SD/Mean (QR) | Paired-sample t-test/Wilcoxon signed ranks test | |||||
|---|---|---|---|---|---|---|---|---|
| YOLOv8 | +GhostNet | ΔM (%) | 95% CI (%) | t/Z | P | |||
| Lower | Upper | |||||||
| Accuracy | All | 0.927 (0.861, 0.973)** | 0.920 (0.853, 0.969)** | 0.50 | 0.40 | 0.70 | 4.171a | 0.000* |
| PFI0 | 0.977 ± 0.003 | 0.975 ± 0.005 | 0.27 | −0.23 | 0.77 | 1.502 | 0.207 | |
| PFI1 | 0.925 ± 0.006 | 0.920 ± 0.007 | 0.56 | 0.24 | 0.88 | 4.915 | 0.008* | |
| PFI2 | 0.830 ± 0.005 | 0.821 ± 0.006 | 0.98 | 0.33 | 1.64 | 4.174 | 0.014* | |
| PFI3 | 0.866 ± 0.006 | 0.859 ± 0.006 | 0.74 | 0.16 | 1.31 | 3.56 | 0.024* | |
| PFI4 | 0.971 (0.965, 0.973)** | 0.967 ± 0.003 | 0.30 | −0.20 | 0.50 | 1.753a | 0.080 | |
| mAP@50 | All | 0.726 ± 0.087 | 0.702 ± 0.089 | 2.47 | 1.11 | 3.83 | 3.748 | 0.001* |
| PFI0 | 0.728 ± 0.032 | 0.705 ± 0.032 | 2.36 | 1.62 | 3.10 | 8.882 | 0.001* | |
| PFI1 | 0.674 (0.644, 0.678)** | 0.641 ± 0.033 | 2.50 | 0.60 | 4.30 | 2.023a | 0.043* | |
| PFI2 | 0.837 ± 0.010 | 0.829 ± 0.008 | 0.86 | 0.65 | 1.07 | 11.492 | 0.000* | |
| PFI3 | 0.760 ± 0.011 | 0.742 ± 0.010 | 1.80 | 0.29 | 3.31 | 3.314 | 0.030* | |
| PFI4 | 0.642 ± 0.113 | 0.592 ± 0.056 | 5.04 | −3.64 | 13.72 | 1.611 | 0.182 | |
| F1-score | All | 0.762 ± 0.045 | 0.743 ± 0.048 | 1.88 | 0.80 | 2.95 | 3.591 | 0.001* |
| PFI0 | 0.773 ± 0.033 | 0.759 ± 0.030 | 1.34 | −4.63 | 7.31 | 0.625 | 0.566 | |
| PFI1 | 0.722 ± 0.018 | 0.704 ± 0.023 | 1.80 | 0.17 | 3.42 | 3.065 | 0.037* | |
| PFI2 | 0.823 ± 0.007 | 0.813 ± 0.012 | 1.00 | −0.08 | 2.09 | 2.569 | 0.062 | |
| PFI3 | 0.757 (0.739, 0.761)** | 0.735 ± 0.016 | 1.80 | −0.60 | 4.20 | 1.483a | 0.138 | |
| PFI4 | 0.739 ± 0.051 | 0.703 ± 0.041 | 3.61 | 0.41 | 6.80 | 3.134 | 0.035* | |
| Precision | All | 0.779 ± 0.056 | 0.764 ± 0.061 | 1.51 | −0.38 | 3.41 | 1.648 | 0.112 |
| PFI0 | 0.808 ± 0.0368 | 0.765 ± 0.064 | 4.31 | −3.73 | 12.35 | 1.489 | 0.211 | |
| PFI1 | 0.729 ± 0.026 | 0.702 ± 0.012 | 2.67 | 0.74 | 4.61 | 3.840 | 0.018* | |
| PFI2 | 0.810 (0.808, 0.826)** | 0.805 ± 0.018 | 1.20 | −1.40 | 3.80 | 1.214a | 0.230 | |
| PFI3 | 0.746 ± 0.027 | 0.737 ± 0.030 | 0.90 | −3.70 | 5.50 | 0.544 | 0.615 | |
| PFI4 | 0.797 ± 0.090 | 0.811 ± 0.080 | −1.42 | −9.23 | 6.39 | −0.505 | 0.640 | |
| Recall | All | 0.749 ± 0.063 | 0.731 ± 0.083 | 1.76 | −1.00 | 4.53 | 1.315 | 0.201 |
| PFI0 | 0.743 ± 0.061 | 791 (0.712, 0.797)** | −2.30 | −14.00 | 14.20 | −0.405a | 0.686 | |
| PFI1 | 0.716 ± 0.024 | 0.707 ± 0.041 | 0.90 | −2.83 | 4.62 | 0.667 | 0.541 | |
| PFI2 | 0.832 ± 0.019 | 0.824 ± 0.043 | 0.78 | −4.03 | 5.58 | 0.448 | 0.677 | |
| PFI3 | 0.759 ± 0.049 | 0.737 ± 0.059 | 2.23 | −5.82 | 10.29 | 0.770 | 0.484 | |
| PFI4 | 0.694 ± 0.056 | 0.656 (0.581, 0.658)** | 7.10 | 1.50 | 14.50 | 2.023a | 0.043* | |
| NPV | All | 0.954 (0.894, 0.981)** | 0.958 (0.898, 0.979)** | 0.10 | −0.50 | 0.60 | −0.202a | 0.840 |
| PFI0 | 0.986 ± 0.004 | 0.989 (0.982, 0.990)** | −0.10 | −0.80 | 0.90 | 0.405a | 0.686 | |
| PFI1 | 0.956 ± 0.007 | 0.958 (0.955, 0.975)** | −0.20 | −4.00 | 0.40 | −0.405a | 0.686 | |
| PFI2 | 0.845 ± 0.016 | 0.865 ± 0.050 | −1.97 | −8.76 | 4.82 | −0.806 | 0.465 | |
| PFI3 | 0.912 ± 0.017 | 0.905 ± 0.016 | 0.70 | −1.52 | 2.91 | 0.872 | 0.432 | |
| PFI4 | 0.980 ± 0.003 | 0.975 ± 0.004 | 0.45 | −0.11 | 1.01 | 2.214 | 0.091 | |
| Specificity | All | 0.959 (0.889, 0.989)** | 0.955 (0.886, 0.988)** | 0.40 | −0.20 | 1.00 | 1.224a | 0.221 |
| PFI0 | 0.990 ± 0.002 | 0.987 ± 0.005 | 0.36 | −0.36 | 1.09 | 1.386 | 0.238 | |
| PFI1 | 0.959 ± 0.003 | 0.953 ± 0.003 | 0.52 | −0.09 | 1.14 | 2.353 | 0.078 | |
| PFI2 | 0.829 ± 0.015 | 0.818 ± 0.029 | 1.19 | −3.18 | 5.55 | 0.754 | 0.493 | |
| PFI3 | 0.905 ± 0.017 | 0.903 ± 0.023 | 0.27 | −2.71 | 3.25 | 0.251 | 0.814 | |
| PFI4 | 0.988 ± 0.007 | 0.990 ± 0.005 | −0.22 | −0.85 | 0.41 | −0.968 | 0.388 | |
Notes:
For MGI, YOLOv8 models, YOLOv8 vs. Ghost, showed strong, stable performance on healthy gingiva (MGI0), with the values of accuracy, mAP@50, F1-score, precision, recall achieving 0.867 vs. 0.853, 0.901 vs. 0.891, 0.822 vs. 0.793, 0.827 vs. 0.816, and 0.806 vs. 0.773, respectively. Across all grades, YOLOv8 achieved a macro-accuracy of 0.859 ± 0.072, higher than Ghost variant by 0.80% (95% CI [0.42–1.18], P < 0.001). Macro-F1-scores of 0.564 (IQR: 0.520–0.605), mAP@50 of 0.593 (IQR: 0.570–0.671), and recall of 0.591 ± 0.129 exceeded YOLOv8-Ghost by 2.20% (95% CI [1.00–3.40], P = 0.001), 1.80% (95% CI [1.10–2.50], P = 0.001), and 3.15% (95% CI [0.21–6.10], P = 0.037), respectively. After introducing GhostNet, the largest mAP@50 reductions occurred in mild inflammation. Specifically, MGI1 decreased by 2.24% (95% CI [0.85–3.63]) and MGI2 by 2.64% (95% CI [1.68–3.60%]) (P < 0.05). For severe inflammation (MGI4), recall showed a notable reduction of 8.86% (95% CI [–2.78 to 20.51], P = 0.102), not statistically significant but suggesting room to improve advanced-grade detection for severity. Consistent with this, F1-score (0.453) and recall (0.365) of YOLOv8-Ghost’s MGI4 were slightly below ResNet-50 (0.505 and 0.451, respectively), according to the results in Table S2.
For PFI classification, the YOLOv8 achieved the best overall performance among the three networks, with a macro-accuracy of 0.927 (IQR: 0.861-0.973), exceeding YOLOv8-Ghost (0.920, IQR: 0.853–0.969) by 0.50% (95% CI [0.40–0.70], P < 0.001). Macro-F1-scores were 0.762 ± 0.045 (YOLOv8) and 0.743 ± 0.048 (YOLOv8-Ghost), corresponding to a 1.88% gain (95% CI [0.80–2.95], P = 0.001). YOLOv8’s precision, recall, NPV, and specificity were 0.779 ± 0.056, 0.749 ± 0.063, 0.954 (IQR: 0.894-0.981), and 0.959 (IQR: 0.889-0.989), respectively (Table 5). In addition, both YOLOv8 variants surpassed ResNet-50 on mAP@50 values (0.726 ± 0.087 and 0.702 ± 0.089, respectively, vs. 0.610 ± 0.100), with particularly strong performance on normal gingival height (PFI2). Although Ghost outperformed ResNet-50 overall and per-grade (Table 5 and Table S2), its lightweight design entailed a 2.47% (95% CI [1.11–3.83], P = 0.001) reduction in mAP@50 and lower sensitivity to subtle morphological variations, involving precision of –2.67% for detecting mild gingival recession (PFI1, 95% CI [0.74–4.61], P = 0.018) and recall of −7.10% for detecting overfilled papillae (PFI4, 95% CI [1.50–14.50], P = 0.043).
Compared with the baseline ResNet-50 model (Table S2), both YOLOv8 variants delivered substantially higher accuracy, mAP@50, and macro-F1-scores for MGI and PFI. However, similar to GhostNet integration, ResNet-50 showed pronounced grade-wise variability, especially reduced mAP@50 in mild inflammation (MGI1,2) and recession (PFI1) categories.
Results of the real-world generalization
On the retrospective real-world test set, both YOLOv8 and YOLOv8-Ghost maintained high performance when applied to previously unseen, high-quality clinical images. Confidence-performance curves of each MGI grade were shown in Figs. 5A–5C. The F1-scores of YOLOv8, YOLOv8-Ghost and ResNet-50 initially increased with confidence, peaking at 0.700, 0.740, and 0.400 when the confidence threshold were set to 0.324, 0.398, and 0.342, respectively, and per-model confusion matrices were correspondingly reported. Similarly, Figs. 6A–6C depicts the variation of F1-score with confidence and confusion matrices data for PFI. The F1-scores for PFI reached peaks of 0.780, 0.720, and 0.450 at confidence values of 0.340, 0.278, and 0.350, respectively. The normalized confusion matrices for OHG, MGI and PFI models could be found in Fig. S5. Each image contained multi-class labeled units aggregated to image-level results, making typical paired binary tests inapplicable. Therefore, descriptive comparisons were reported below according to Table 6.
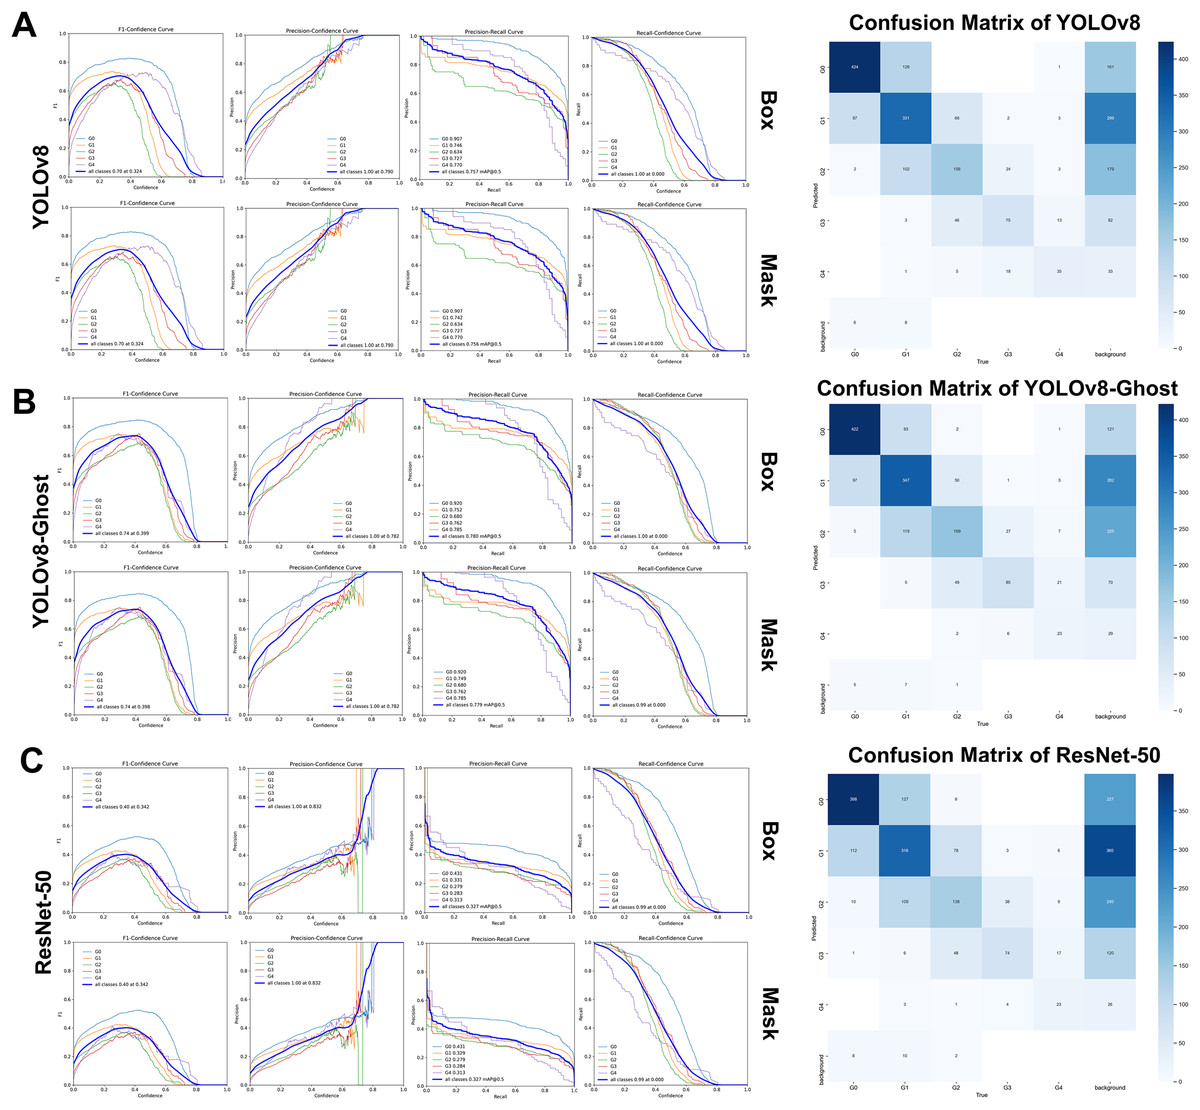
Figure 5: The variation curves of F1-score, Precision and Recall of box and mask with confidence for Modified gingival index.
(A) Variation curves and confusion matrix of YOLOv8; (B) Variation curves and confusion matrix of GhostNet variant; (C) Variation curves and confusion matrix of ResNet 50.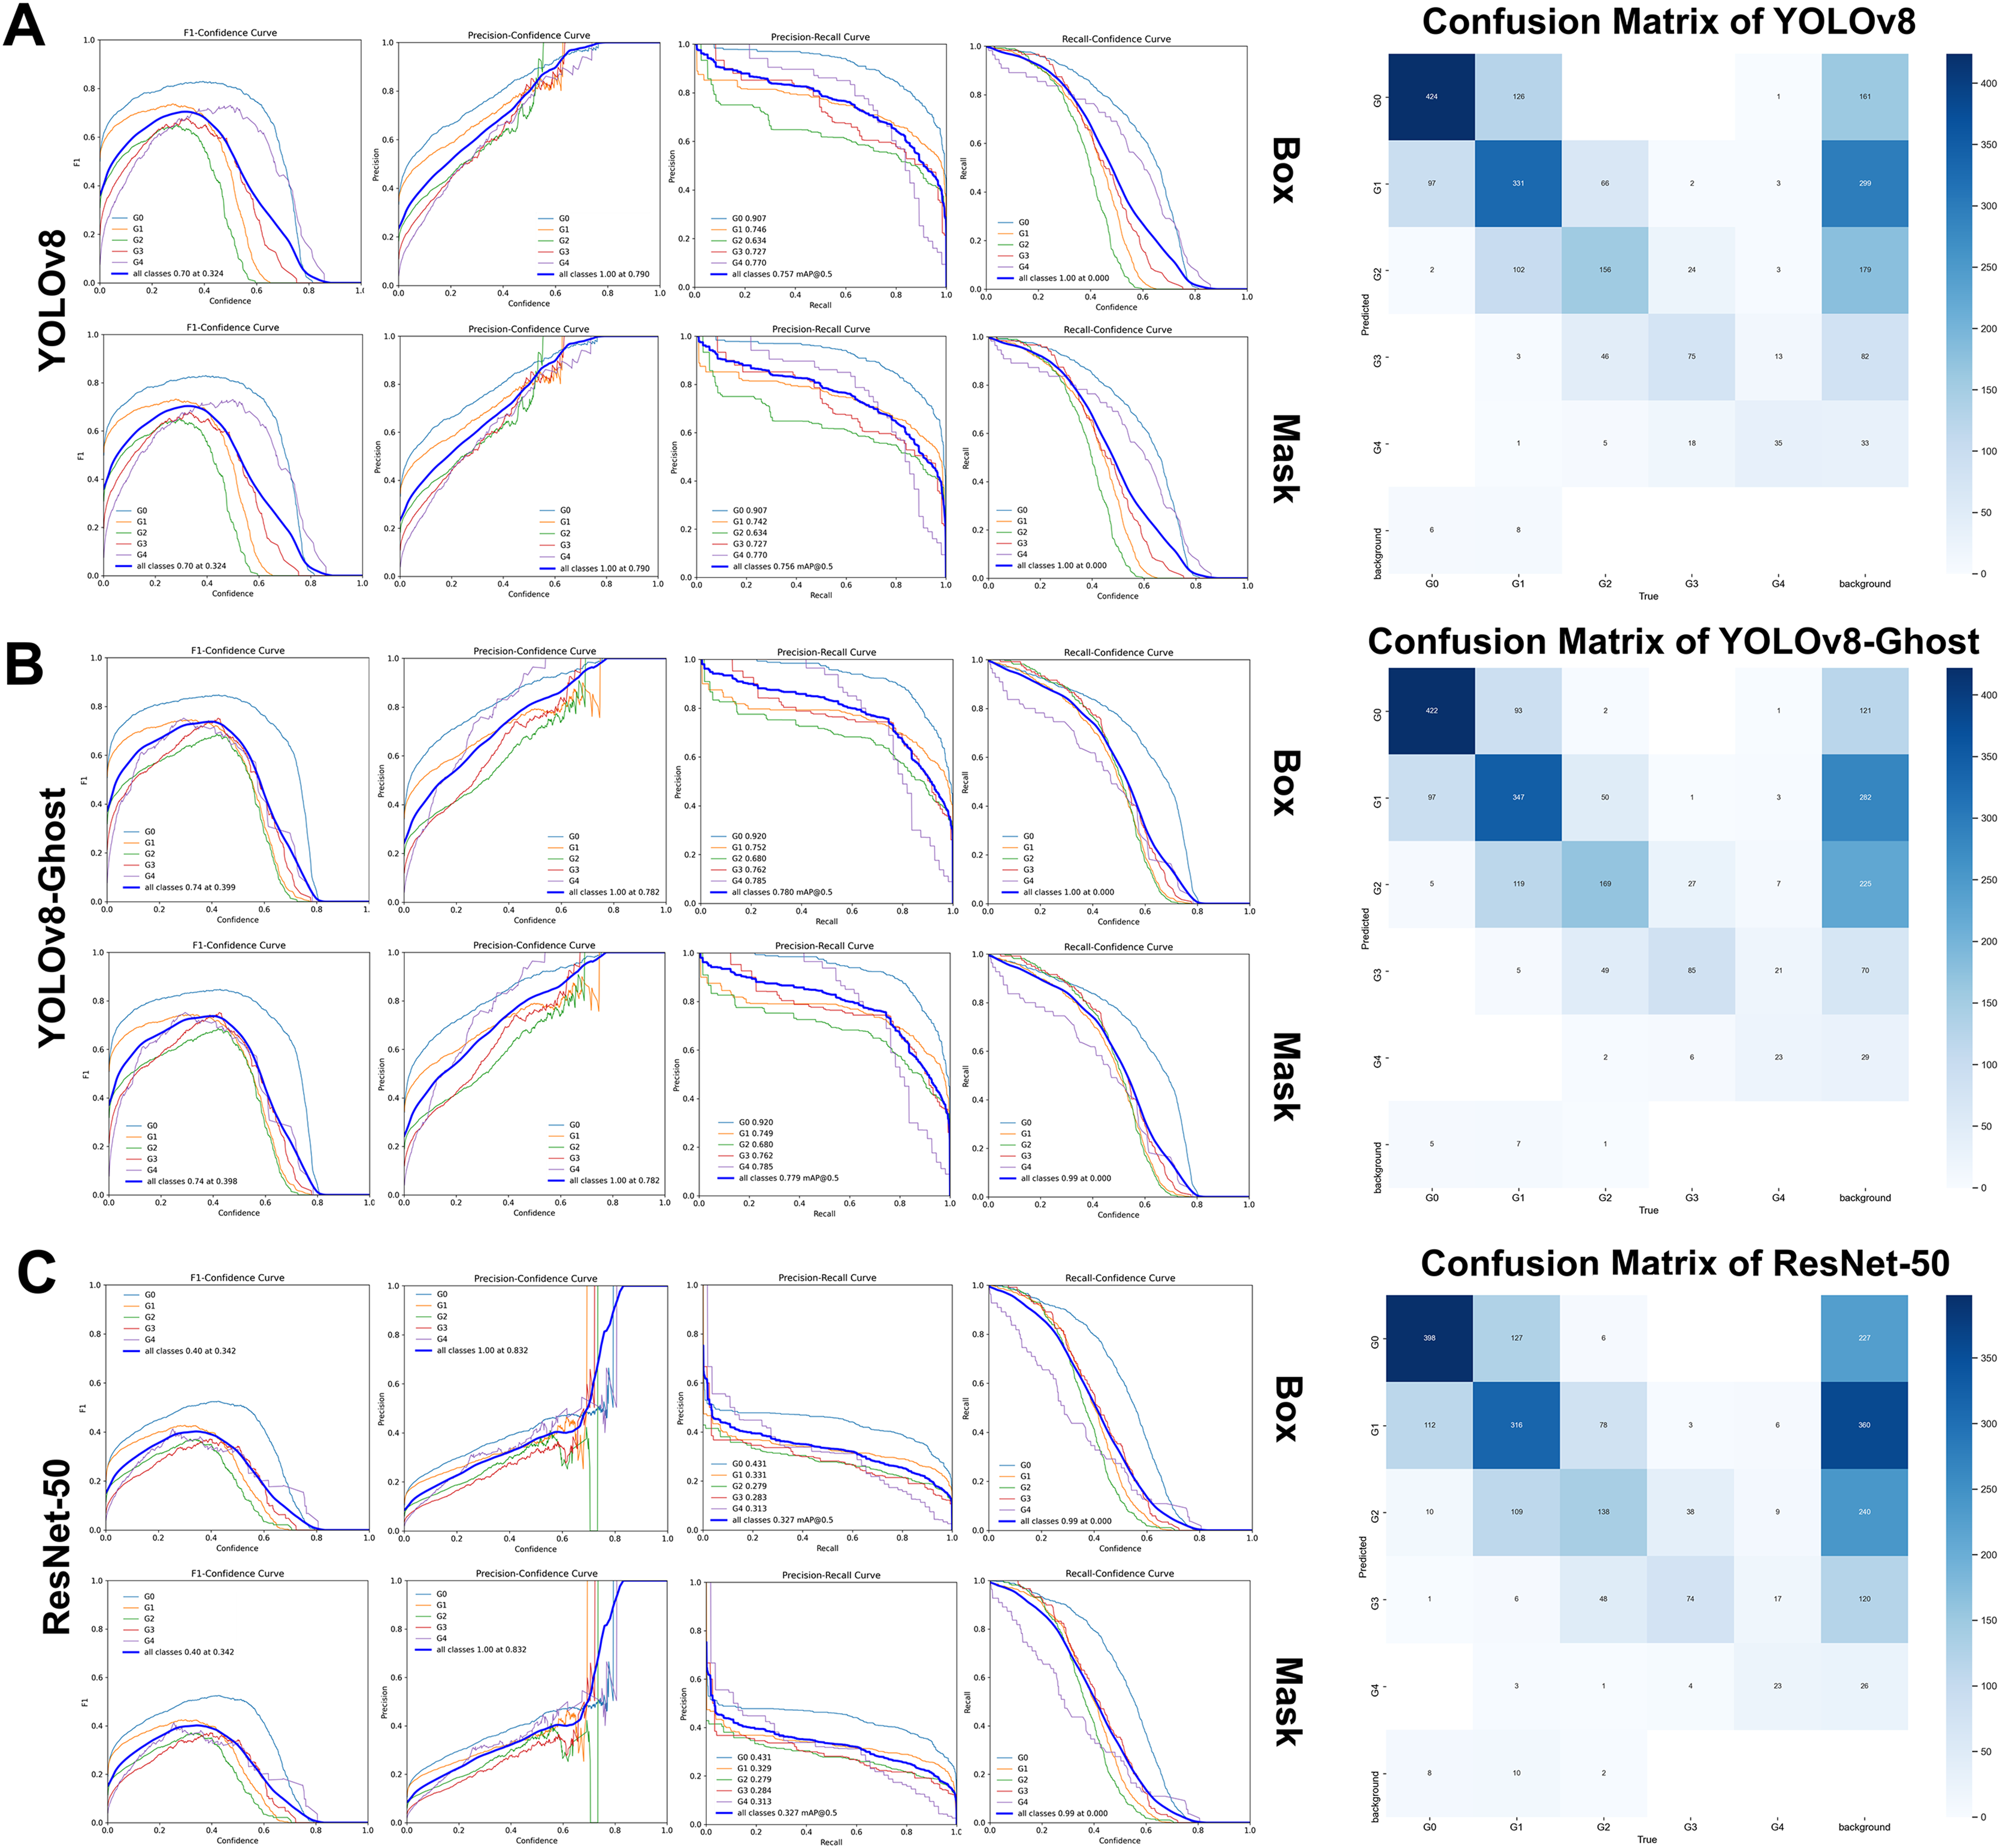
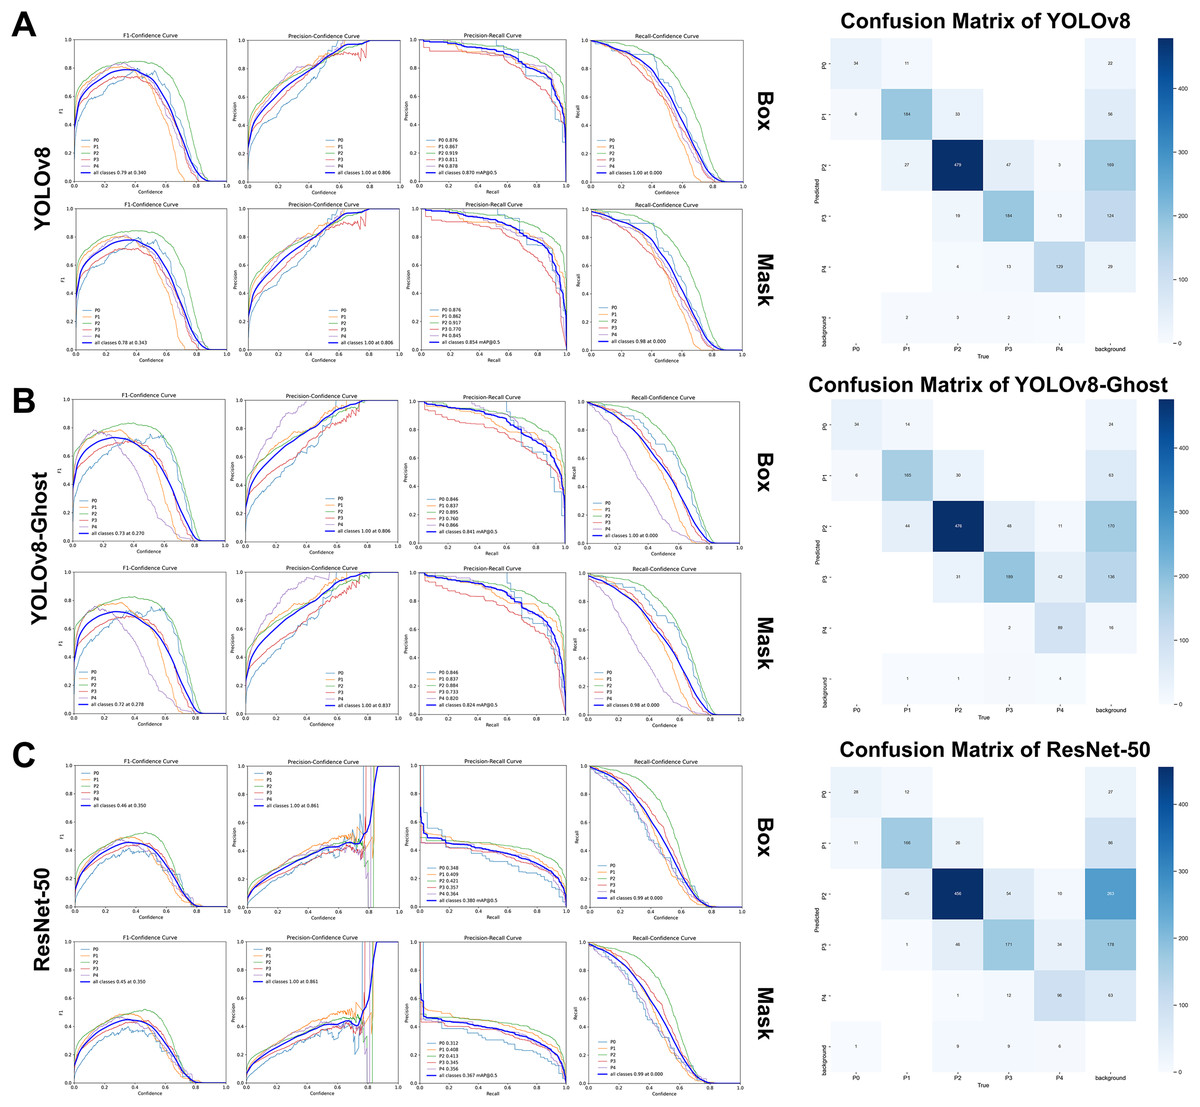
Figure 6: The variation curves of F1-score, precision and recall of box and mask with confidence for Papillae filling index.
(A) Variation curves and confusion matrix of YOLOv8; (B) Variation curves and confusion matrix of GhostNet variant; (C) Variation curves and confusion matrix of ResNet 50.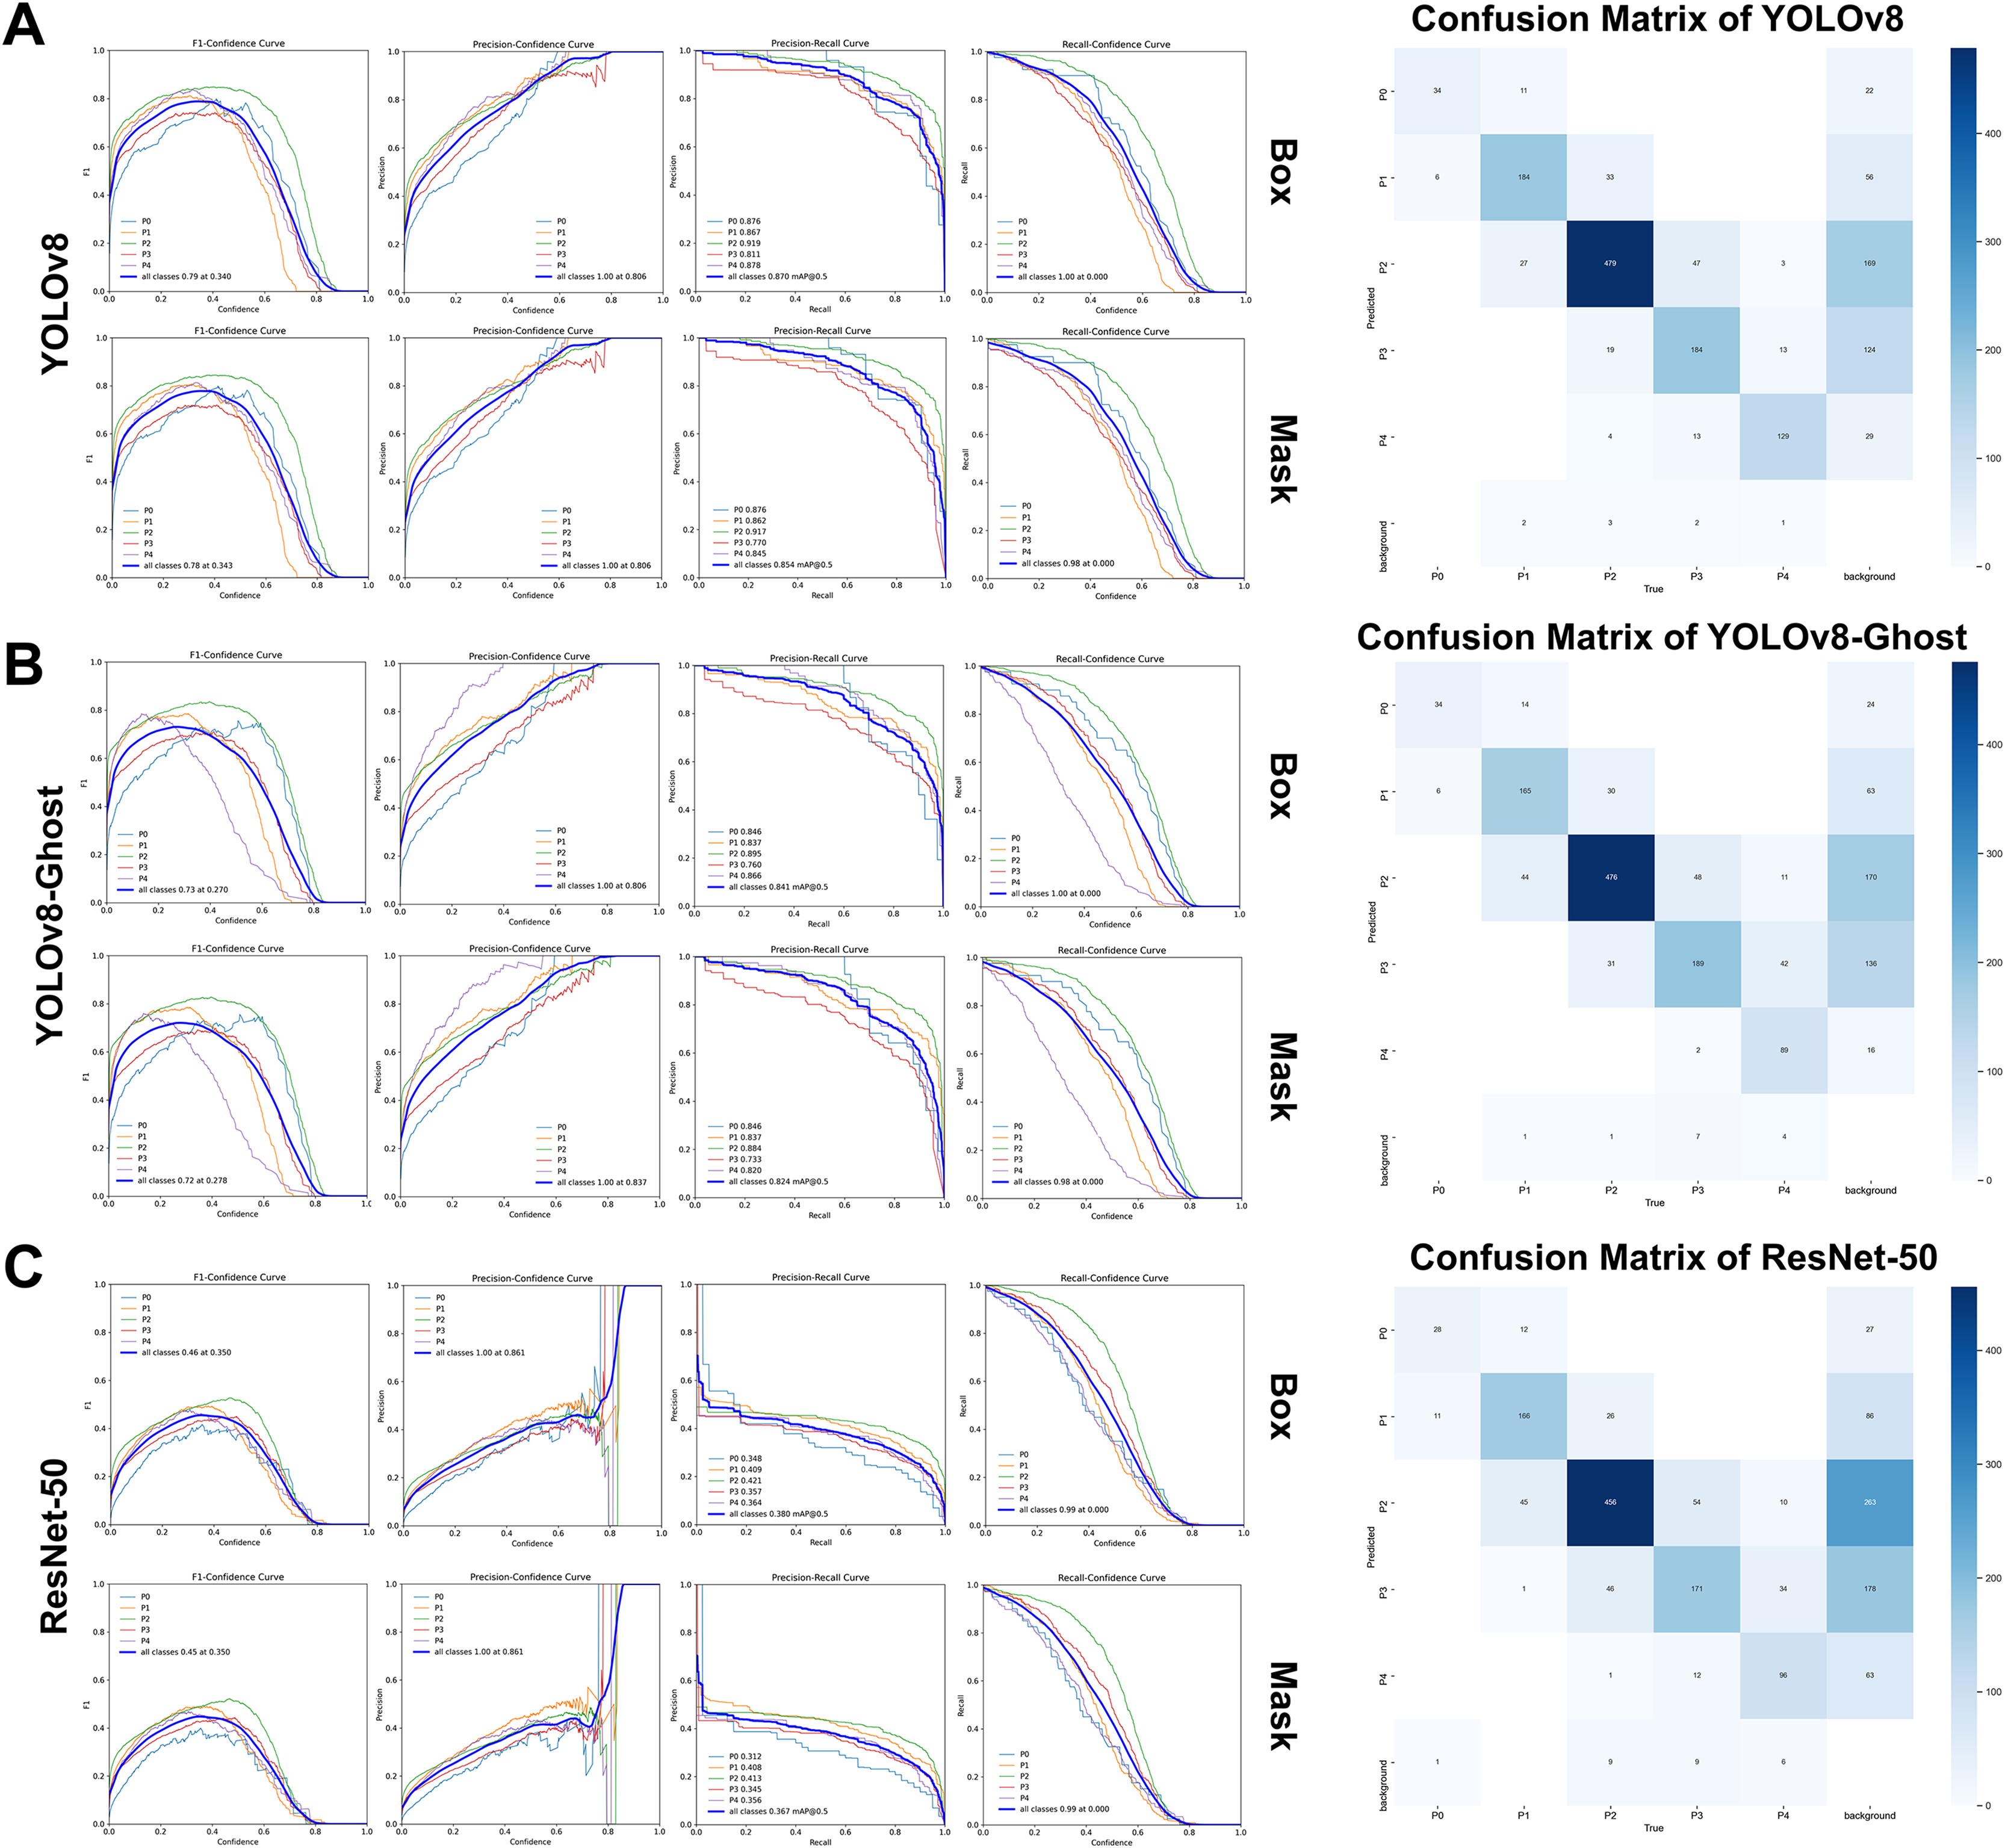
| Networks & indices | Metrics (Mean ± SD) | |||||||||
|---|---|---|---|---|---|---|---|---|---|---|
| Accuracy | mAP@50 | F1-score | Precision | Recall | NPV | Specificity | Cohen’s κ | Weighted κ | ||
| Modified gingival index, MGI | ||||||||||
| All | YOLOv8 | 0.867 ± 0.090 | 0.756 ± 0.099 | 0.634 ± 0.091 | 0.623 ± 0.094 | 0.647 ± 0.095 | 0.907 ± 0.083 | 0.908 ± 0.063 | 0.534 | 0.645 |
| +GhostNet | 0.873 ± 0.084 | 0.779 ± 0.088 | 0.634 ± 0.108 | 0.660 ± 0.131 | 0.635 ± 0.144 | 0.912 ± 0.077 | 0.913 ± 0.059 | 0.557 | 0.645 | |
| ResNet50 | 0.849 ± 0.104 | 0.327 ± 0.062 | 0.584 ± 0.105 | 0.613 ± 0.134 | 0.575 ± 0.129 | 0.894 ± 0.089 | 0.895 ± 0.078 | 0.470 | 0.565 | |
| MGI0 | YOLOv8 | 0.853 | 0.907 | 0.790 | 0.770 | 0.811 | 0.899 | 0.874 | – | – |
| +GhostNet | 0.871 | 0.920 | 0.810 | 0.815 | 0.805 | 0.900 | 0.905 | – | – | |
| ResNet50 | 0.832 | 0.431 | 0.757 | 0.750 | 0.764 | 0.877 | 0.868 | – | – | |
| MGI1 | YOLOv8 | 0.739 | 0.742 | 0.686 | 0.663 | 0.588 | 0.776 | 0.827 | – | – |
| +GhostNet | 0.760 | 0.749 | 0.654 | 0.697 | 0.615 | 0.791 | 0.844 | – | – | |
| ResNet50 | 0.710 | 0.329 | 0.587 | 0.614 | 0.563 | 0.758 | 0.794 | – | – | |
| MGI2 | YOLOv8 | 0.838 | 0.634 | 0.557 | 0.544 | 0.571 | 0.906 | 0.896 | – | – |
| +GhostNet | 0.830 | 0.680 | 0.564 | 0.517 | 0.621 | 0.915 | 0.875 | – | – | |
| ResNet50 | 0.804 | 0.279 | 0.480 | 0.454 | 0.509 | 0.891 | 0.868 | – | – | |
| MGI3 | YOLOv8 | 0.932 | 0.727 | 0.586 | 0.547 | 0.630 | 0.969 | 0.957 | – | – |
| +GhostNet | 0.930 | 0.762 | 0.609 | 0.531 | 0.714 | 0.976 | 0.948 | – | – | |
| ResNet50 | 0.924 | 0.284 | 0.559 | 0.507 | 0.622 | 0.968 | 0.950 | – | – | |
| MGI4 | YOLOv8 | 0.971 | 0.770 | 0.614 | 0.593 | 0.636 | 0.986 | 0.984 | – | – |
| +GhostNet | 0.974 | 0.785 | 0.535 | 0.742 | 0.418 | 0.979 | 0.995 | – | – | |
| ResNet50 | 0.974 | 0.313 | 0.535 | 0.742 | 0.418 | 0.979 | 0.995 | – | – | |
| Papillae filling index, PFI | ||||||||||
| All | YOLOv8 | 0.940 ± 0.039 | 0.854 ± 0.054 | 0.838 ± 0.042 | 0.836 ± 0.049 | 0.844 ± 0.057 | 0.958 ± 0.034 | 0.957 ± 0.044 | 0.788 | 0.816 |
| +GhostNet | 0.924 ± 0.047 | 0.824 ± 0.056 | 0.785 ± 0.040 | 0.810 ± 0.108 | 0.779 ± 0.102 | 0.947 ± 0.034 | 0.943 ± 0.064 | 0.720 | 0.737 | |
| ResNet50 | 0.915 ± 0.055 | 0.367 ± 0.043 | 0.758 ± 0.055 | 0.777 ± 0.085 | 0.746 ± 0.068 | 0.940 ± 0.041 | 0.937 ± 0.067 | 0.688 | 0.720 | |
| PFI0 | YOLOv8 | 0.986 | 0.876 | 0.800 | 0.756 | 0.850 | 0.995 | 0.990 | – | – |
| +GhostNet | 0.983 | 0.846 | 0.773 | 0.708 | 0.850 | 0.995 | 0.988 | – | – | |
| ResNet50 | 0.980 | 0.312 | 0.709 | 0.700 | 0.718 | 0.990 | 0.989 | – | – | |
| PFI1 | YOLOv8 | 0.935 | 0.862 | 0.827 | 0.825 | 0.829 | 0.961 | 0.960 | – | – |
| +GhostNet | 0.920 | 0.837 | 0.778 | 0.821 | 0.740 | 0.941 | 0.962 | – | – | |
| ResNet50 | 0.919 | 0.408 | 0.778 | 0.818 | 0.741 | 0.940 | 0.961 | – | – | |
| PFI2 | YOLOv8 | 0.888 | 0.917 | 0.878 | 0.862 | 0.895 | 0.911 | 0.882 | – | – |
| +GhostNet | 0.861 | 0.884 | 0.853 | 0.822 | 0.886 | 0.899 | 0.840 | – | – | |
| ResNet50 | 0.844 | 0.413 | 0.834 | 0.807 | 0.862 | 0.879 | 0.830 | – | – | |
| PFI3 | YOLOv8 | 0.924 | 0.770 | 0.800 | 0.852 | 0.754 | 0.940 | 0.967 | – | – |
| +GhostNet | 0.900 | 0.733 | 0.755 | 0.721 | 0.791 | 0.948 | 0.926 | – | – | |
| ResNet50 | 0.879 | 0.345 | 0.699 | 0.676 | 0.722 | 0.932 | 0.917 | – | – | |
| PFI4 | YOLOv8 | 0.972 | 0.845 | 0.887 | 0.884 | 0.890 | 0.985 | 0.984 | – | – |
| +GhostNet | 0.953 | 0.820 | 0.764 | 0.978 | 0.627 | 0.951 | 0.998 | – | – | |
| ResNet50 | 0.951 | 0.356 | 0.771 | 0.881 | 0.686 | 0.959 | 0.987 | – | – | |
Note:
NPV, Negative predictive value; SD, Standard deviation.
Modified gingival index
The YOLOv8 variants achieved overall classification accuracies of 0.867 ± 0.090 and 0.873 ± 0.084, mAP@50 of 0.756 ± 0.099 and 0.779 ± 0.088, and F1-scores of 0.634 ± 0.091 and 0.634 ± 0.108. In contrast, ResNet-50 values were lower, with overall accuracy, mAP@50, and F1-score of 0.849 ± 0.104, 0.327 ± 0.062, and 0.584 ± 0.105, respectively. For grade-specific analysis, both YOLOv8 models exhibited the best performance in detecting healthy gingiva (MGI0), particularly with mAP@50 values of 0.907 and 0.920 (>0.900) and recall values of 0.811 and 0.805 (>0.800), consistent with the results of five-fold cross-validation. YOLOv8 maintained a relatively high and stable recall rate (0.636) for severe inflammation (MGI4), while YOLOv8-Ghost delivered the highest MGI4 mAP@50 (0.785) but a markedly lower recall (0.418), indicating reduced sensitivity to severe inflammation.
Papillae filling index
YOLOv8 and YOLOv8-Ghost remained robust within the validation set, achieving accuracies of 0.940 ± 0.039 and 0.924 ± 0.047, mAP@50 of 0.854 ± 0.054 and 0.824 ± 0.056, F1-scores of 0.838 ± 0.042 and 0.785 ± 0.040, precisions of 0.836 ± 0.049 and 0.810 ± 0.108, and recalls of 0.844 ± 0.057 and 0.779 ± 0.102, which were all higher than those obtained from ResNet-50 (Table 6). The mAP@50 advantage over ResNet-50 (0.367 ± 0.043) was pronounced. Importantly, YOLOv8 achieved a recall of 0.890 for PFI4, which was numerically higher than GhostNet variant (0.627) and ResNet-50 (0.686).
Customized grade-severity weight matrices were utilized for agreement analyses (Supplement S1.3.2). On the real-world set, ResNet-50 showed lower agreement (MGI weighted κ < 0.600 and PFI weighted κ ≤ 0.720). YOLOv8 and YOLOv8-Ghost achieved substantial agreement for PFI (Cohen’s κ of 0.788 and 0.720, corresponding weighted κ of 0.816 and 0.737), and moderate agreement for MGI grading (Cohen’s κ of 0.534 and 0.557, corresponding weighted κ of 0.645). Overall, YOLOv8 provided the highest agreement, while Ghost preserved clinically acceptable agreement with reduced complexity.
Model complexity and runtime efficiency
As presented in Table 7, the GhostNet variant substantially reduced complexity vs. vanilla YOLOv8, containing a 44.19% reduction in params (6.58M vs. 11.78M), and a 29.01% reduction of GFLOPs (42.40 vs. 30.10). Nevertheless, cross-referencing Tables 4 and 5 reveals that this lightweighting and efficiency came with a statistically significant recall drop, which was most evident for mild or subtle lesions, highlighting an efficiency-sensitivity trade-off. Besides, ResNet-50 delivered the fastest inference (FPS 211.22 for MGI and 221.60 for PFI), yet it reached only about half of YOLOv8’s mAP@50 values (Table 6), indicating that prioritizing computational speed without sufficient diagnostic performance might compromise applicability.
| Networks | Params | Layers | GFLOPs | FPS (MGI) | FPS (PFI) |
|---|---|---|---|---|---|
| YOLOv8 | 11.78M | 195 | 42.40 | 154.48 | 112.99 |
| +GhostNet | 6.58M | 339 | 30.10 | 154.99 | 137.91 |
| ResNet 50 | 6.32M | 141 | 26.90 | 211.22 | 211.60 |
Note:
MGI, Modified gingival index; PFI, Papillae filling index; FPS, Frame per second.
With even performance (Figs. S1, S2), low across-fold variability (SD generally <0.100) indicates internal consistency under different train-validation splits, requiring external robustness evaluation beyond the source dataset.
AI-assisted evaluation
AI assistance markedly improved junior dentists’ performance on the real-world test set (Tables 8, 9, and Supplement S2).
| Indices & Parameters | Mean ± SD/Median (QR) | Paired-sample t-test/Wilcoxon signed ranks test | |||||
|---|---|---|---|---|---|---|---|
| Juniors | Juniors + AI | ΔM (%) | 95%CI (%) | t/Z | P | ||
| Lower | Upper | ||||||
| Modified gingival index, MGI | |||||||
| Accuracy | 0.733 (0.621, 0.923)** | 0.886 ± 0.079 | 11.60 | 7.20 | 15.60 | 3.920a | 0.000* |
| F1-score | 0.316 ± 0.175 | 0.697 ± 0.087 | 38.04 | 30.62 | 45.46 | 10.735 | 0.000* |
| Precision | 0.315 ± 0.222 | 0.677 ± 0.115 | 36.20 | 28.14 | 44.27 | 9.391 | 0.000* |
| Recall | 0.395 ± 0.127 | 0.728 ± 0.082 | 33.31 | 27.84 | 38.79 | 12.733 | 0.000* |
| Weighted κ | 0.260 ± 0.073 | 0.673 ± 0.087 | 41.30 | 29.11 | 53.49 | 10.779 | 0.002* |
| Papillae filling index, PFI | |||||||
| Accuracy | 0.851 ± 0.093 | 0.909 ± 0.063 | 5.77 | 3.58 | 7.95 | 5.524 | 0.000* |
| F1-score | 0.551 ± 0.161 | 0.773 ± 0.096 | 22.20 | 13.44 | 30.95 | 5.307 | 0.000* |
| Precision | 0.547 ± 0.220 | 0.772 ± 0.126 | 22.49 | 11.62 | 33.36 | 4.331 | 0.000* |
| Recall | 0.615 ± 0.095 | 0.783 ± 0.085 | 16.78 | 12.45 | 21.11 | 8.106 | 0.000* |
| Weighted κ | 0.483 ± 0.100 | 0.711 ± 0.061 | 22.88 | −0.71 | 46.46 | 3.087 | 0.054 |
Notes:
| Indices | Mean±SD (ms/s) | One-sample t-test | |||||||
|---|---|---|---|---|---|---|---|---|---|
| YOLOv8 (ms) | +GhostNet (ms) | Senior (s) | Juniors (s) | Juniors + AI (s) | ΔTime (%) | 95% CI (%) | P | ||
| Lower | Upper | ||||||||
| MGI | 6.47 | 6.45 | 45.56 | 69.18 ± 8.87 | 56.54 ± 6.24 | 18.10 | 14.21 | 22.00 | 0.001* |
| PFI | 8.85 | 7.25 | 51.04 | 78.36 ± 25.81 | 57.27 ± 10.60 | 22.79 | 5.84 | 39.74 | 0.023* |
Note:
For MGI assessment, accuracy rose from 0.733 (IQR: 0.621–0.923) to 0.886 ± 0.079, with a mean gain of 11.60% (95% CI [7.20–15.60], P < 0.001). Macro-F1-score increased by 38.04% (95% CI [30.62–45.46], P < 0.001), accompanied by notable improvements in precision (+36.20%, P < 0.001), recall (33.1%, P < 0.001), and weighted rising from 0.260 to 0.673. Similarly, for PFI classification, accuracy improved from 0.851 ± 0.093 to 0.909 ± 0.063 (+5.77%, P < 0.001), and macro-F1-score from 0.551 ± 0.161 to 0.773 ± 0.096 (+22.20%, P < 0.001), with parallel gains in precision (+22.49%, P < 0.001) and recall (+16.78%, P < 0.001). Weighted κ improved from 0.483 to 0.711, indicating a marked enhancement in agreement with the gold standard.
These findings highlighted that AI assistance effectively elevated junior dentists’ grading consistency from moderate or poor to satisfactory levels (weighted κ = 0.552–0.799), and also improved inter-observer agreement up to 0.642 for MGI and 0.717 for PFI (Tables S3, S4).
Moreover, efficiency gains were significant by one-sample t-tests on relative time reduction (Table 9), with ΔTime% of 18.10% (95% CI [14.21–22.00], P = 0.001) for MGI and 22.79% (95% CI [5.84–39.74], P = 0.023) for PFI, reflecting a clear efficiency advantage. These results support the role of AI in enhancing both diagnostic consistency and operational efficiency in periodontal assessment workflows.
Discussion
Periodontal monitoring and early diagnosis in the anterior esthetic zone remain challenging for non-periodontists. In this study, the ENPAT addresses this by coupling one-stage detection with multi-grade segmentation to localize gingival units and assign OHG, MGI, and PFI grades directly from frontal intraoral photographs. In network selection, we favored YOLOv8 because its FP-PAN multi-scale fusion and decoupled head align well with region-centric labels (triangular gingival units), yielding strong localization and grading performance across tasks.
GhostNet was introduced to explore a mobile-friendly alternative. The Ghost modules replace standard convolutions and bottlenecks in the YOLOv8 C2f blocks, generating additional “cheap” feature maps via depthwise-separable operations to reduce redundancy and computation. As expected, this markedly lowered model size and cost (−44.19% params and −29.01% GFLOPs), with only modest changes in accuracy across folds. However, our cross-validation and retrospective real-world testing revealed a consistent sensitivity trend: compared with vanilla YOLOv8, YOLOv8-Ghost showed lower mAP@50 overall for PFI (−2.47%), reduced precision for subtle papillary recession (PFI 1 of −2.67%), and decreased recall for overfilling (PFI 4 of −7.10%). For MGI, mAP@50 drops concentrated in mild gingival inflammation (MGI 1 of −2.24%, and MGI 2 of −2.64%). These patterns are consistent with known limits of highly factorized, depthwise-dominant backbones.
By contrast, the vanilla YOLOv8 backbone retains slightly higher representational capacity, which appears to translate into better detection of subtle morphological and RGB-image-based chromatic variations at a moderate computational cost, which is brought out from its higher mAP@50 and class-wise F1-scores and recalls on clinically important edge cases. The baseline ResNet-50 classifier runs fastest but lacks a native detection head. Accordingly, it trails both YOLOv8 series on region-level metrics, especially mAP@50 and grading F1-score, despite competitive top-line accuracy in some strata.
In practical terms, YOLOv8-based ENPAT remains our recommended primary deployment for clinics where diagnostic sensitivity is paramount, especially for early inflammatory changes and papillary abnormalities. YOLOv8-Ghost is a defensible choice for resource-constrained or mobile settings, accepting a small, quantified sensitivity trade-off for sizable efficiency gains. ResNet-50, while fast, lacks native segmentation and lags on region-level metrics.
Current research advances and improvement
As summarized in Table 10, numerous models have been developed over the past 8 years to early detect periodontal diseases using RGB-based images (IDPE). These models have advanced in algorithms (Alalharith et al., 2020; Andrade et al., 2023; Chau et al., 2023; Khaleel & Aziz, 2021; Kurt-Bayrakdar et al., 2023; Li et al., 2024, 2021, 2019, 2018; Liu et al., 2024; Rana et al., 2017; Wen et al., 2024; Yauney et al., 2019). Platform work has explored web or mobile deployment (Li et al., 2021; Tobias & Spanier, 2020b), and annotation-segmentation strategy (Andrade et al., 2023; Chau et al., 2023; Liu et al., 2024; Wen et al., 2024) have also been discussed. Reported performance is often strong for coarse, binary tasks, involving Mamba (Oral-Mamba) system accuracy of 0.830 for gingivitis detection (Liu et al., 2024), and YOLOx5 precision of 0.749 and F1-score of 0.746 for inflammation and hyperplasia (Kurt-Bayrakdar et al., 2023). However, most studies rely on relatively small datasets, whole-image labels, or omit region-level detection metrics. Ternary (Chau et al., 2023) or multi-class grading (Wen et al., 2024), which are essential for monitoring disease progression, remains uncommon, and papilla height is rarely quantified. The current study involves larger database volume, comprehensive performance reported, and enrichment of evaluation parameters and grading categories, with improvement in three aspects listed below:
| Research | Model | Metricsa | ||||||||||
|---|---|---|---|---|---|---|---|---|---|---|---|---|
| Author &Year | Subjects | Evaluation parameter | Category | Network | P | R | Acc | F1 | mAP@50 | NPV | Spec | Amount |
| Rana et al. (2017) | Gingivitis | MGI | Binary | CNNs with the classifier | 0.347 | 0.621 | – | 0.445* | – | – | – | 405b |
| Li et al. (2018) | Gingivitis | – | Binary | GLCM +ELM | 0.737* | 0.720 | 0.710 | 0.709* | – | 0.746* | 0.700* | 52b |
| Yauney et al. (2019) | Periodontal diseases | – | Binary | CNNs with the classifier | 0.271 | 0.429 | – | 0.333* | – | – | – | 1,215c |
| Li et al. (2019) | Gingivitis | – | Binary | CLAHE+ GLCM+ ELM | 0.724* | 0.750 | 0.740 | 0.734* | – | 0.743* | 0.730 | 93b |
| Tobias & Spanier (2020a) | Gingivitis | MGI | Binary | – | – | – | – | – | – | – | – | – |
| Alalharith et al. (2020) | Gingivitis | – | Binary | Faster R-CNN object detection model | 1.000 | 0.519 | 1.000 | 0.682* | 1.000 | – | – | 134b |
| ResNet-50 CNN feature extractor | 0.880 | 0.418 | 0.771 | 0.567* | 0.682 | – | – | |||||
| Li et al. (2021) | Gingivitis | GI, dental calculus, and dental deposits | Binary | Multi-Task Learning CNNs (FeatNet + ClassNet + LocateNet) for classifier | – | 0.878 | – | – | – | – | 0.639 | 3,932b |
| – | 0.601 | – | – | – | – | 0.839 | ||||||
| Multi-Task Learning CNNs (FeatNet + ClassNet + LocateNet) for Localization | High | 0.666 | – | – | – | – | – | |||||
| – | 0.432 | – | – | – | – | High | ||||||
| Khaleel & Aziz (2021) | Gingival disease | – | Binary | The Bat swarm algorithm | – | – | 0.979 | – | – | – | – | 120b |
| Kurt-Bayrakdar et al. (2023) | Gingival overgrowth | – | Binary | YOLOx5 | 0.675 | 0.757 | 0.555 | 0.714 | – | – | – | 654b (1,211)e |
| Gingivitis | – | Binary | 0.823 | 0.737 | 0.636 | 0.777 | – | – | – | 654b (2,956)e | ||
| Andrade et al. (2023) | Dental biofilm | – | Binary | U-Net | – | 0.672 | 0.918 | 0.606 | – | – | 0.944 | 576b |
| Chau et al. (2023) | Gingivitis | Self-defined metrics (Healthy, Diseased, Questioned) |
Ternary | DeepLabv3+ built on Keras with TensorFlow 2 | – | 0.920 | – | – | – | – | 0.940 | 567b |
| Liu et al. (2024) | Gingivitis, dental calculus | – | Binary | Mamba (Oral-Mamba) | 0.820 | 0.830 | 0.830 | – | – | 0.957* | 0.999* | 3,365d |
| Li et al. (2024) | Gingivitis | - | Binary | AlexNet | 0.980 | 0.920 | 0.920 | 0.950 | – | 0.995* | 0.999* | 683b |
| GoogLeNet | 0.980 | 0.910 | 0.900 | 0.930 | – | 0.990* | 0.998* | |||||
| ResNet | 0.970 | 0.870 | 0.870 | 0.920 | – | 0.998* | 0.999* | |||||
| VGGNet | 0.970 | 0.850 | 0.850 | 0.900 | – | 0.783* | 0.956* | |||||
| Wen et al. (2024) | Gingivitis | MGI | Multiple | t-SNE+ DenseNet with gingival margin feature extraction and tooth removal algorithms | 0.843 | 0.820 (0.800 ~ 0.838) | 0.763 (0.737 ~ 0.792) | 0.831 (0.776 ~ 0.814) | – | 0.618 | 0.691 (0.684 ~ 0.706) | 826b (8,214)e |
| Yurdakurban et al. (2025) | Gingival inflammation, gingival hyperplasia, dental plaque and dental calculus | – | Binary | YOLOv8 model | 0.784 ± 0.010 | 0.475 ± 0.007 | 0.961 ± 0.006 | 0.630 ± 0.007 | 0.603 ± 0.009 | – | – | 1,863b |
| – | Binary | U-Net + ResNet50 | 0.783 ± 0.056 | 0.498 ± 0.067 | 0.938 ± 0.027 | 0.640 ± 0.046 | 0.590 ± 0.056 | – | – | 1,863b | ||
| The current study (2025) | Papillae height | PFI | Multiple | YOLOv8 | 0.836 ± 0.049 | 0.844 ± 0.057 | 0.940 ± 0.039 | 0.838 ± 0.042 | 0.854 ± 0.054 | 0.958 ± 0.034 | 0.957 ± 0.044 | 1,847b (18,601)e |
| YOLOv8+GhostNet | 0.810 ± 0.108 | 0.779 ± 0.102 | 0.924 ± 0.047 | 0.785 ± 0.040 | 0.824 ± 0.056 | 0.947 ± 0.034 | 0.943 ± 0.064 | |||||
| ResNet 50 | 0.777 ± 0.085 | 0.746 ± 0.068 | 0.915 ± 0.055 | 0.758 ± 0.055 | 0.367 ± 0.043 | 0.940 ± 0.041 | 0.937 ± 0.067 | |||||
| Gingivitis | MGI | YOLOv8 | 0.623 ± 0.094 | 0.647 ± 0.095 | 0.867 ± 0.090 | 0.634 ± 0.091 | 0.756 ± 0.099 | 0.907 ± 0.083 | 0.908 ± 0.063 | 2,029b (19,714)e |
||
| YOLOv8+GhostNet | 0.660 ± 0.131 | 0.635 ± 0.144 | 0.873 ± 0.084 | 0.634 ± 0.108 | 0.779 ± 0.088 | 0.912 ± 0.077 | 0.913 ± 0.059 | |||||
| ResNet 50 | 0.613 ± 0.134 | 0.575 ± 0.129 | 0.849 ± 0.104 | 0.584 ± 0.105 | 0.327 ± 0.062 | 0.894 ± 0.089 | 0.895 ± 0.078 | |||||
| Oral health condition | Self-defined metrics (Fair, Acceptable, Poor) |
Ternary | YOLOv8 | 0.810 (0.767 ~ 0.861) | 0.811 (0.767 ~ 0.833) | 0.872 (0.826 ~ 0.902) | 0.810 (0.767 ~ 0.846) | – | 0.903 (0.861 ~ 0.927) | 0.903 (0.861 ~ 0.935) | 3,008b | |
Notes:
Task design
ENPAT uses one-stage detection with multi-class segmentation to localize refined triangular gingival units and assign OHG, MGI, and PFI grades directly from frontal photographs, removing the need for dye, disclosing agents or invasion auxiliary hardware that complicate operation (Andrade et al., 2023). Moreover, to our best knowledge, this is the first AI system to perform multi-class papilla height grading aligned to Nordland-Tarnow criteria (Nordland & Tarnow, 1998), which is critical for evaluating periodontal health and esthetic concerns in the anterior dental zone.
Comprehensive evaluation
Beyond accuracy, comprehensive region-level metrics that matter for detection quality and clinical decision-making were reported, involving mAP@50, macro-F1-score, precision/recall, specificity, and NPV (Padilla, Netto & Da Silva, 2020). In internal validation, YOLOv8 achieved mAP@50 of 0.901 (MGI 0) and 0.837 (PFI 2), with grade-level F1-scores of 0.822 and 0.823, respectively (Tables 4, 5), which can be considered desirable results in object detection tasks. On the retrospective external real-world set, PFI performance remained strong (reaching accuracy 0.940 ± 0.039, mAP@50 of 0.854 ± 0.054, and F1-scores of 0.838 ± 0.042), and YOLOv8 reached 0.890 recall for overfilled papillae (PFI 4), exceeding both YOLOv8-Ghost and ResNet-50. These results also indicate superior performance compared to other similar diagnostic models that reported lower recall values (e.g., Andrade et al. (2023) with 0.606, and (Li et al., 2021) with 0.666 and 0.432, and (Yurdakurban et al., 2025) with 0.475).
Labeling and segmentation strategy for visualization
Prior methods frequently used simple coarse boxes (e.g., quadrilateral detection regions and square segmentation) and irregular masks with heatmaps visualization (Li et al., 2021; Wen et al., 2024), involving gingival contour labeling (Chau et al., 2023) and gingiva removal strategies (Wen et al., 2024). However, these approaches might introduce subjective bias, instability, and poor reproducibility in experimental design. We adopt refined, clinically grounded triangular units around the main papilla and adjacent gingival margin (Lobene et al., 1986), paired with anchor-free FP-PAN of YOLOv8 to better handle variable shapes and aspect ratios (Sohan et al., 2024). Besides, mask-based thresholding confidence scores can be considered a quantitative proxy of visual explanation (Phang, Park & Geras, 2020). This improves reproducibility and aligns outputs with actionable periodontal landmarks, such as adjacent tooth contact points and cervical margins of different gingival biotypes (Fischer et al., 2018), ensuring the model’s applicability in real-world clinical settings.
Clinical significance and application potential
The ENPAT outputs per-image OHG plus unit-level MGI and PFI maps with bounding boxes, masks, and confidence scores, giving clinicians actionable and localized feedback, which can serve as a potential auxiliary tool to improve the periodontal diagnostic ability of early periodontal abnormalities among non-periodontists in clinical settings. The corresponding clinical significance of the output results and overall grading are detailed in Figs. 7–9. In typical use, MGI 1-2 flags sites for close attention, reinforced hygiene and monitoring (Fig. 8), while MGI 3-4 suggests timely intervention (e.g., periodontal therapy, adjusting orthodontic or prosthodontic treatment) to avoid further complications. In addition, PFI supports esthetic and biologic planning (Fig. 9). PFI2-3 denotes acceptable papilla height, PFI 0-1 signals recession (high risk of “black triangles” and poor periodontal conditions), and PFI 4 suggests edema or hyperplasia requiring cause analysis and follow-up. Because severe malocclusion and poor overall hygiene can confound color or morphology-based grading, OHG could serve as an upstream screen to contextualize MGI or PFI diagnosis reliability.
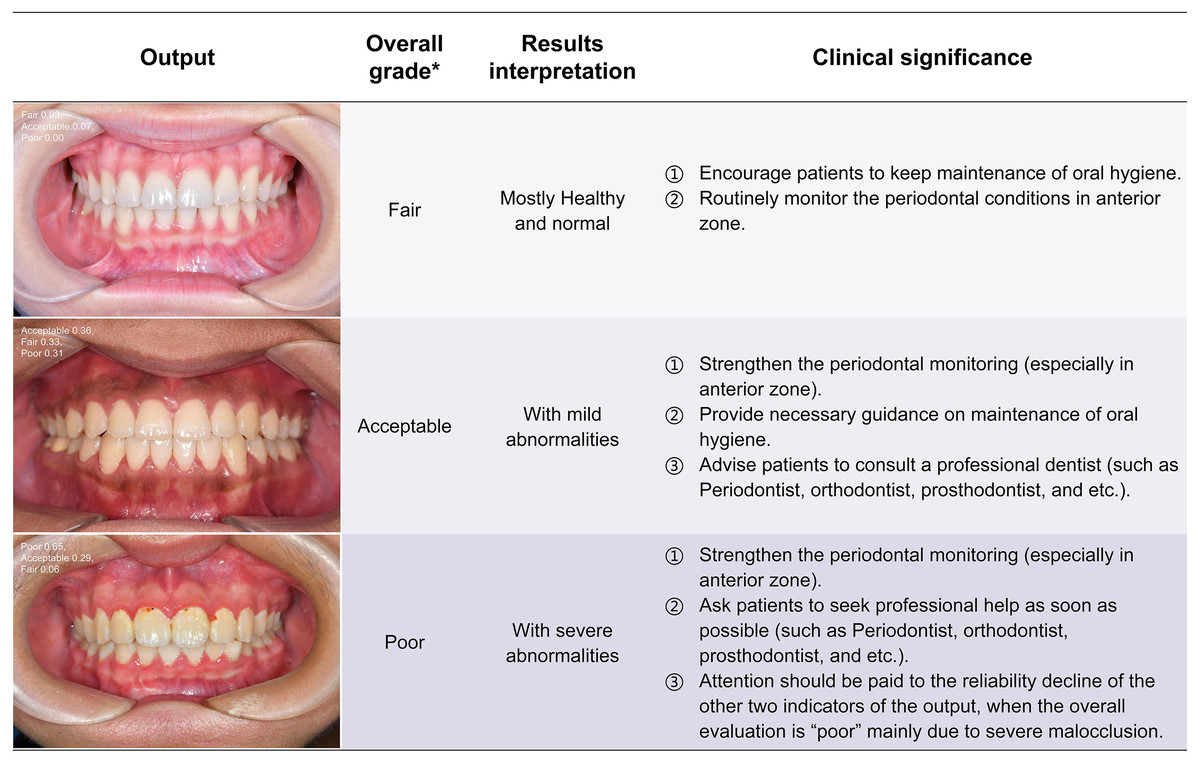
Figure 7: The visualization results of oral health grading.
The intraoral images of the health conditions without annotation are output in probability form, and the overall grading, results interpretation and clinical significance are correspondingly displayed in the table. *Oral health grading of each image was detailed in Table 2. PFI, Papillae filling index; MGI, Modified gingival index.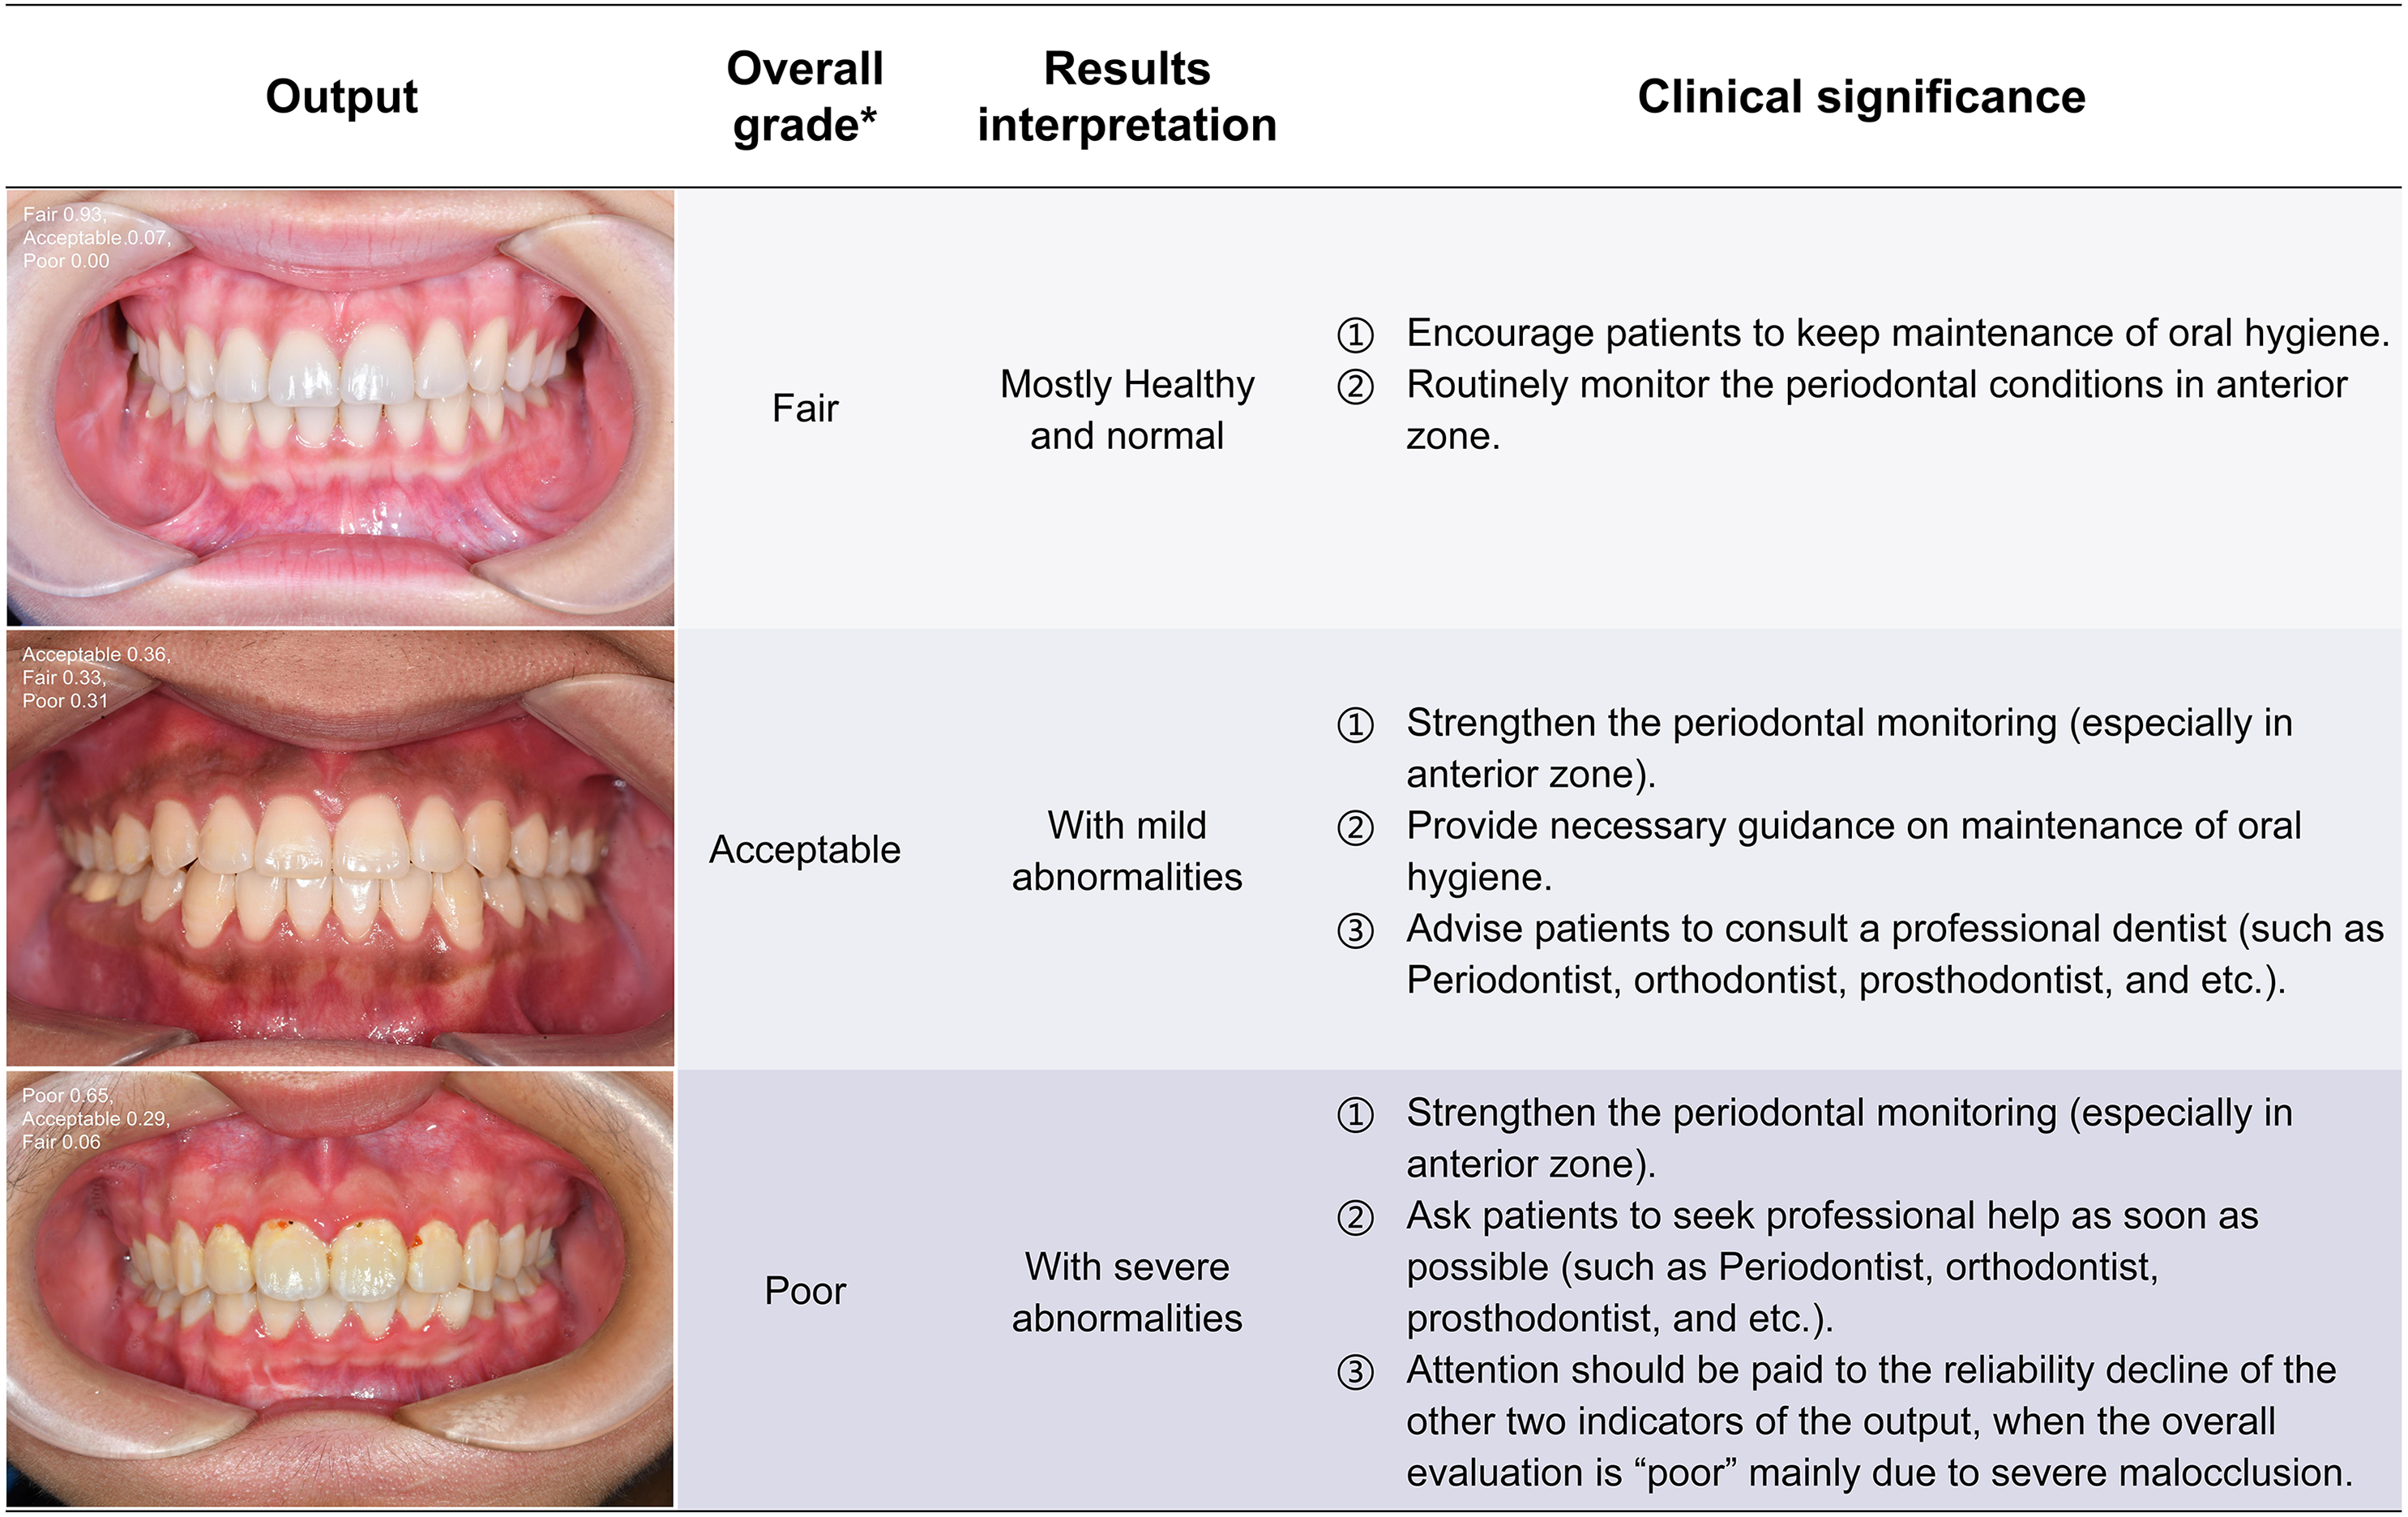
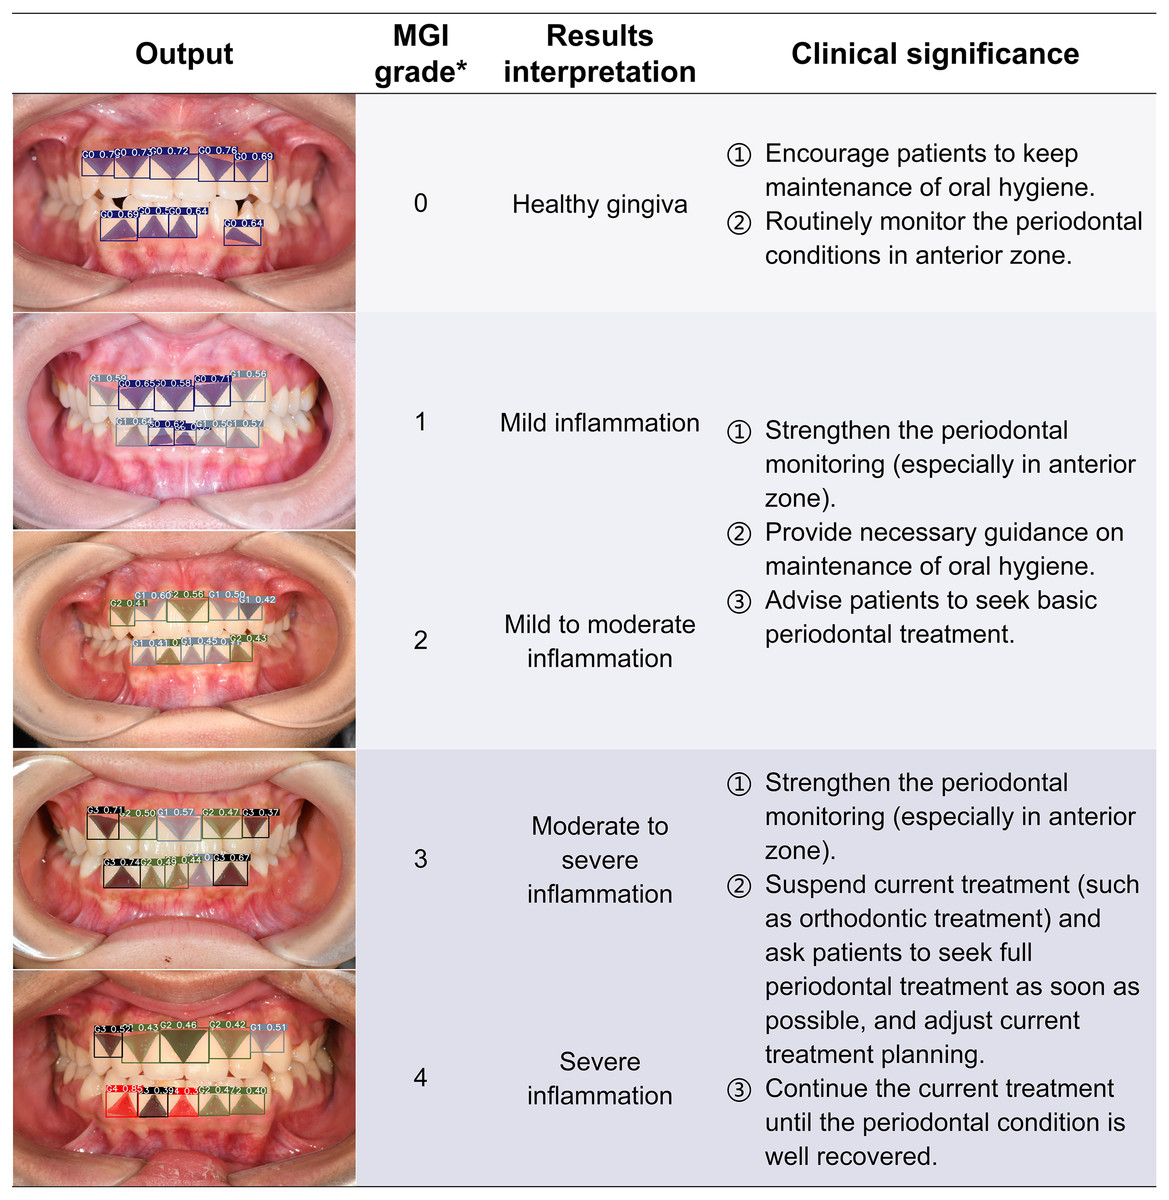
Figure 8: The visualization results of the predicted gingival units of modified gingival index grading.
The computer outputs the segmentation and grading confidence of each gingival unit, and the predicted images are listed in the form of the artificial inflammation grade taken place in each image, with gradually increasing scores from top to bottom, right corresponding to the overall grading and results interpretation. In order to provide a better reference for non-periodontists as well as non-professional readers, the base color of the table was divided into three groups according to different clinical significances. *The criteria of overall MGI classification of each image were detailed in Table 2. MGI, Modified gingival index.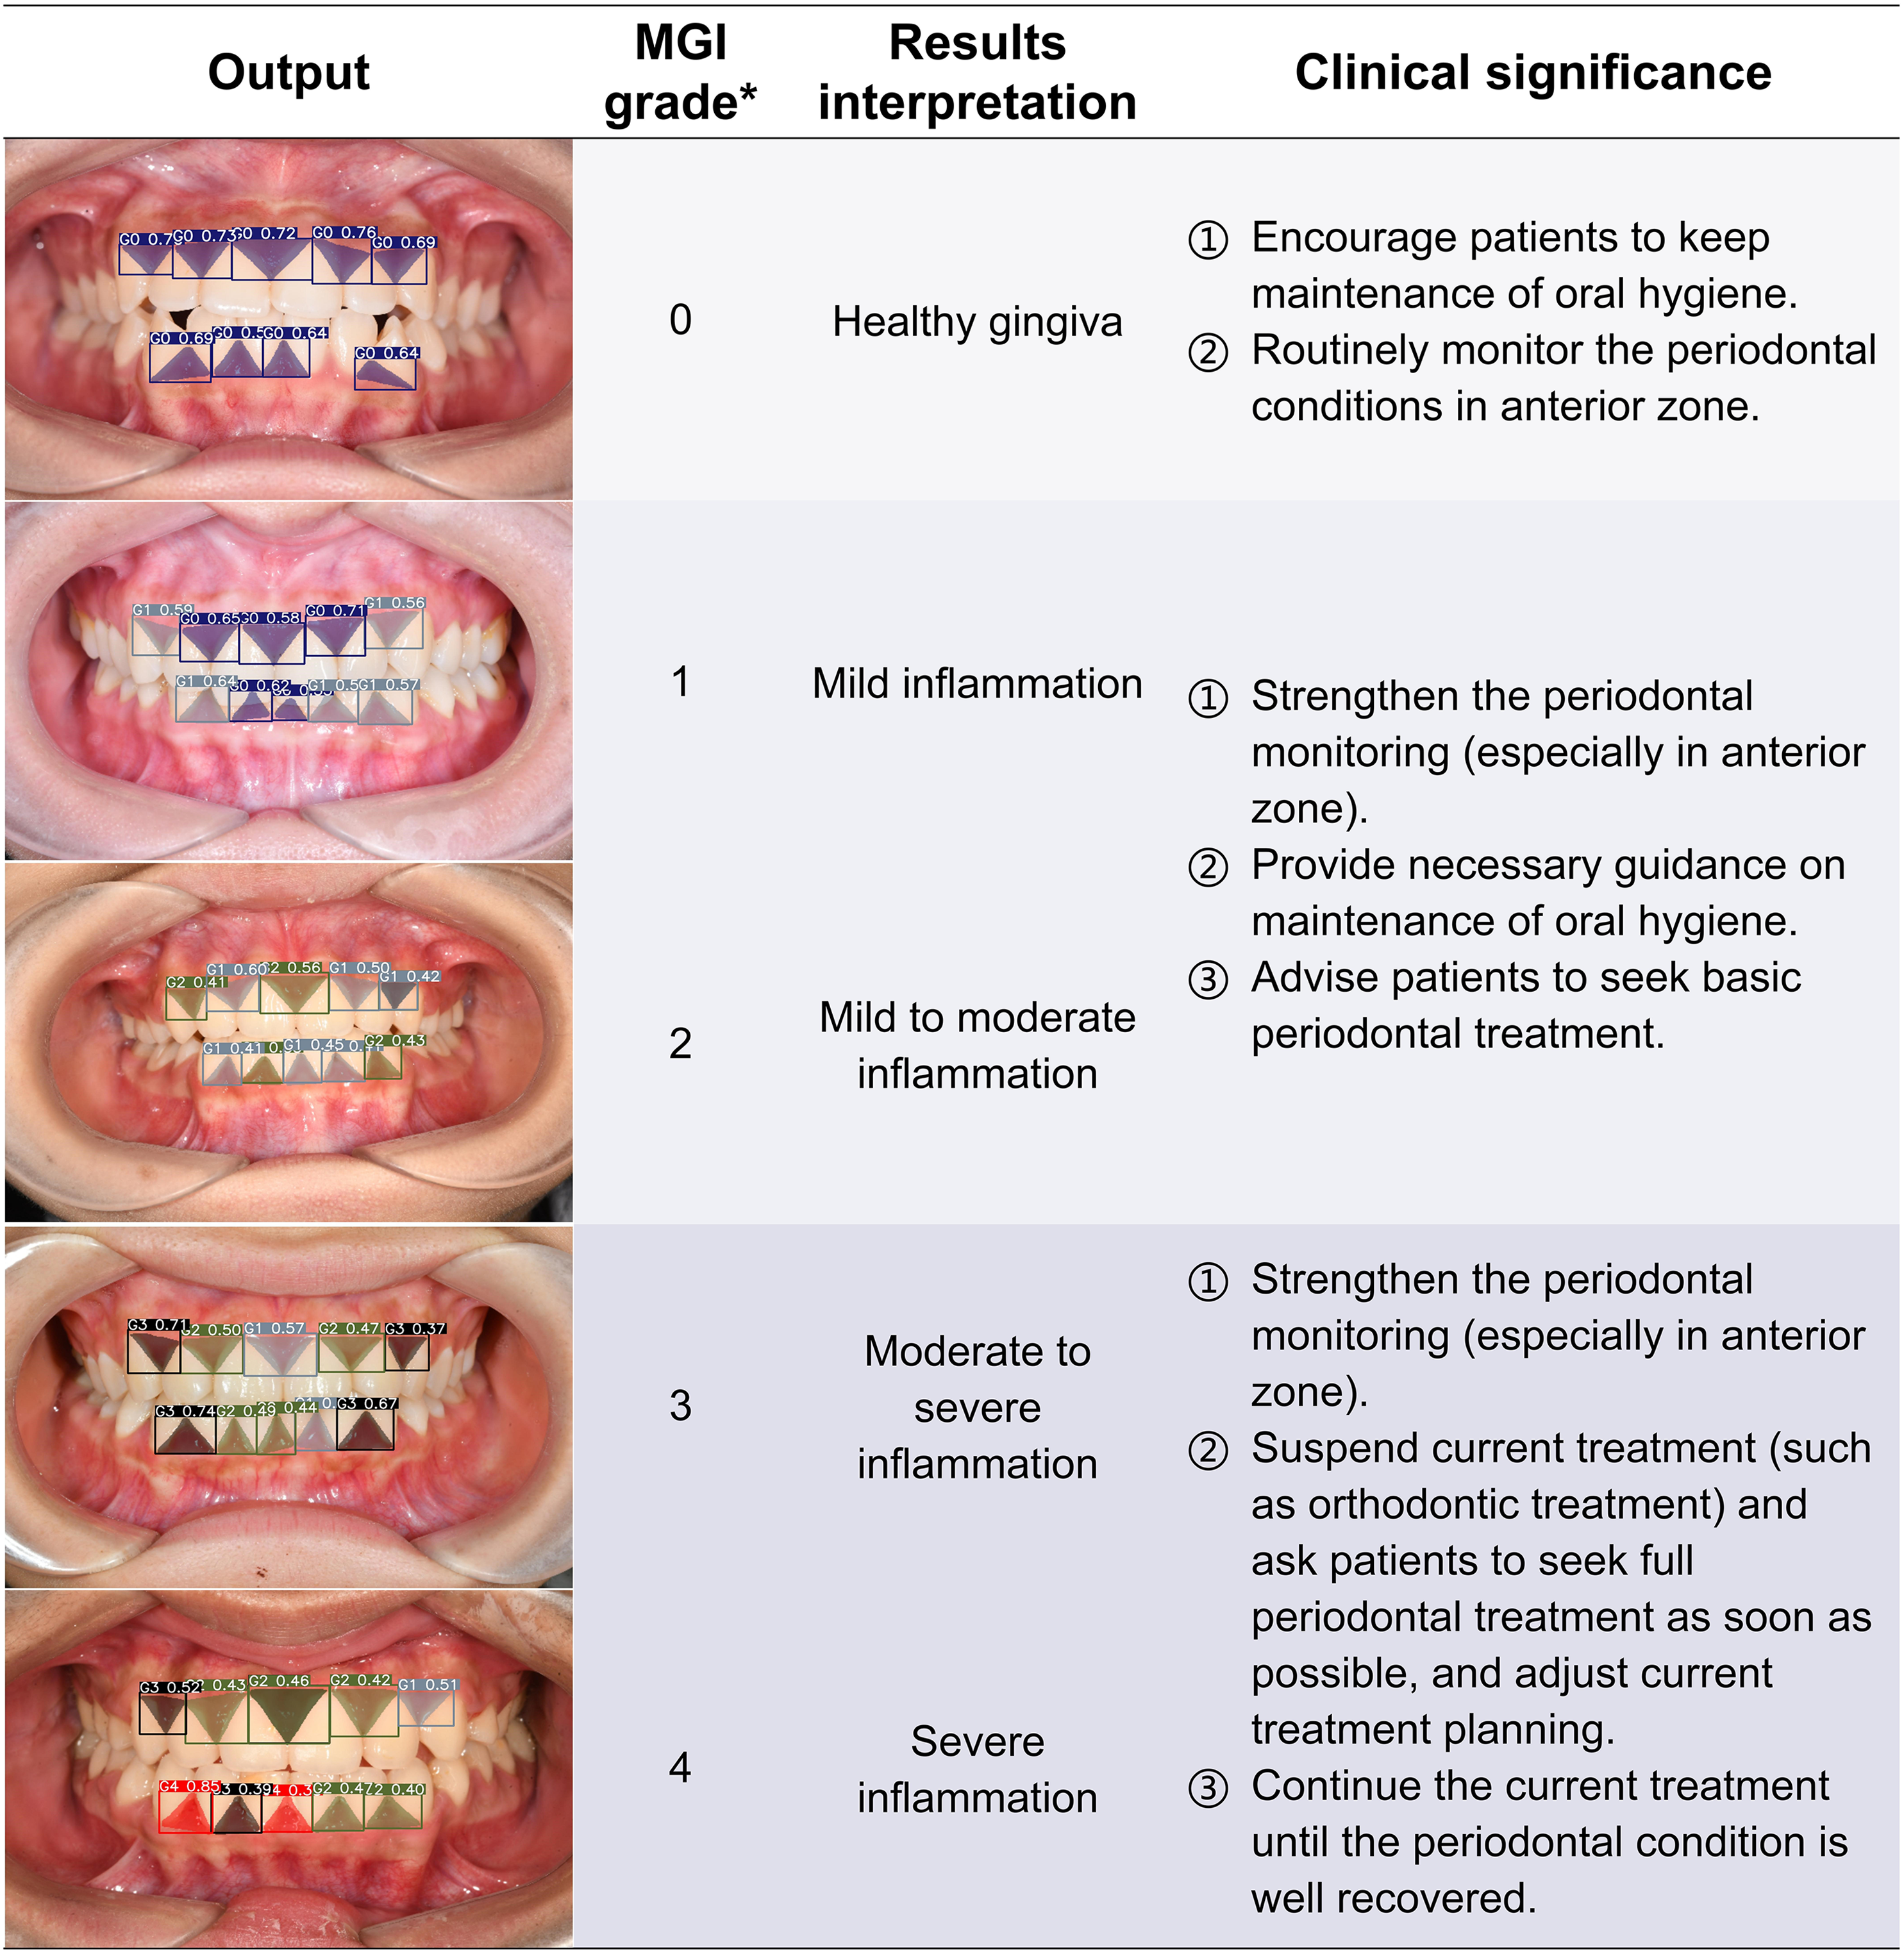
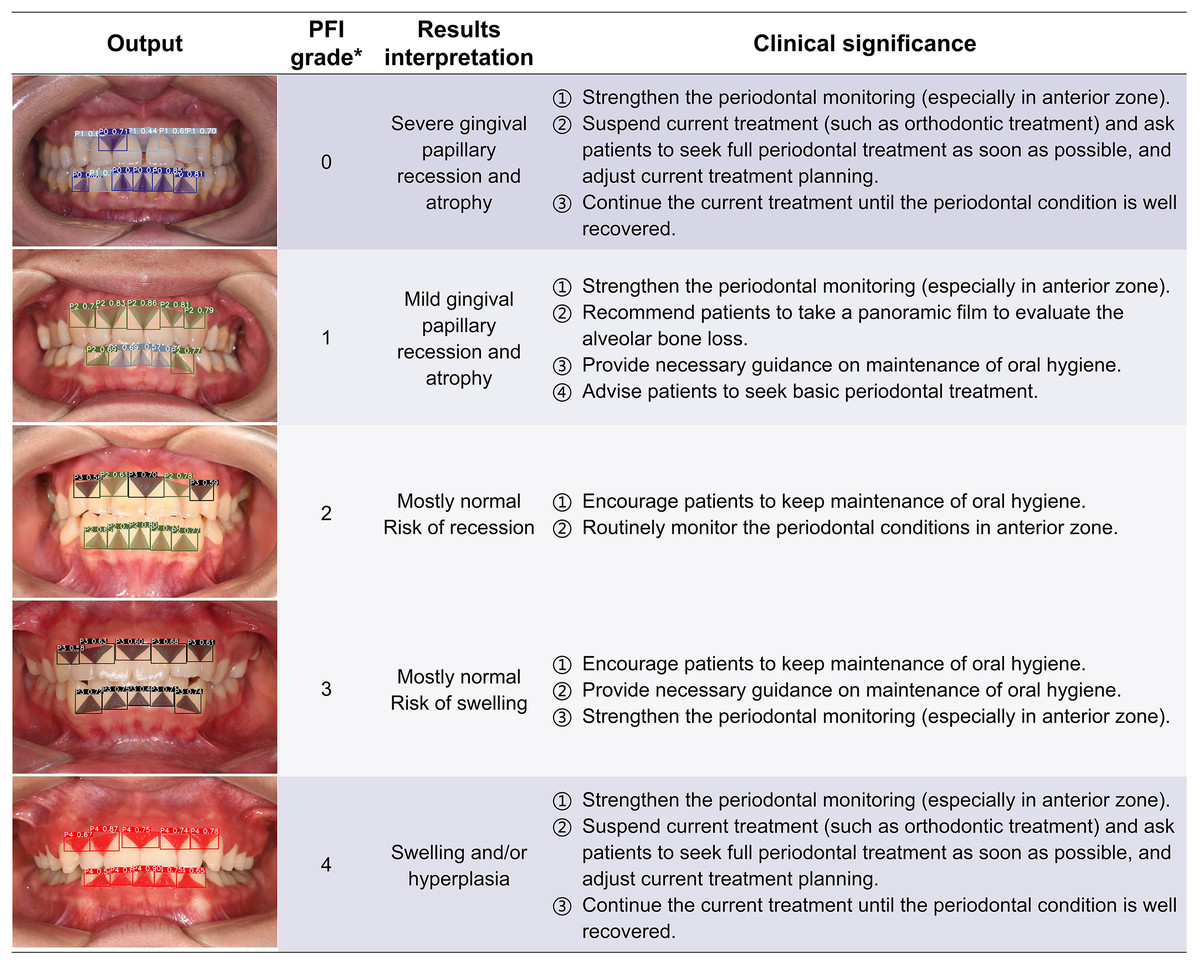
Figure 9: The visualization results of the predicted gingival units of papillae filling index grading.
The computer outputs the segmentation and grading results of each gingival unit, and the predicted images are listed in the form of the artificial inflammation grade taken place in each image. The cohort from top to bottom represents a change in the degree of anomaly from high to low and then up, right corresponding to the overall grading and results interpretation. In order to provide a better reference for non-periodontists as well as non-professional readers, the base color of the table was divided into three groups according to different clinical significances. *The criteria of overall PFI classification of each image were detailed in Table 2. PFI, Papillae filling index.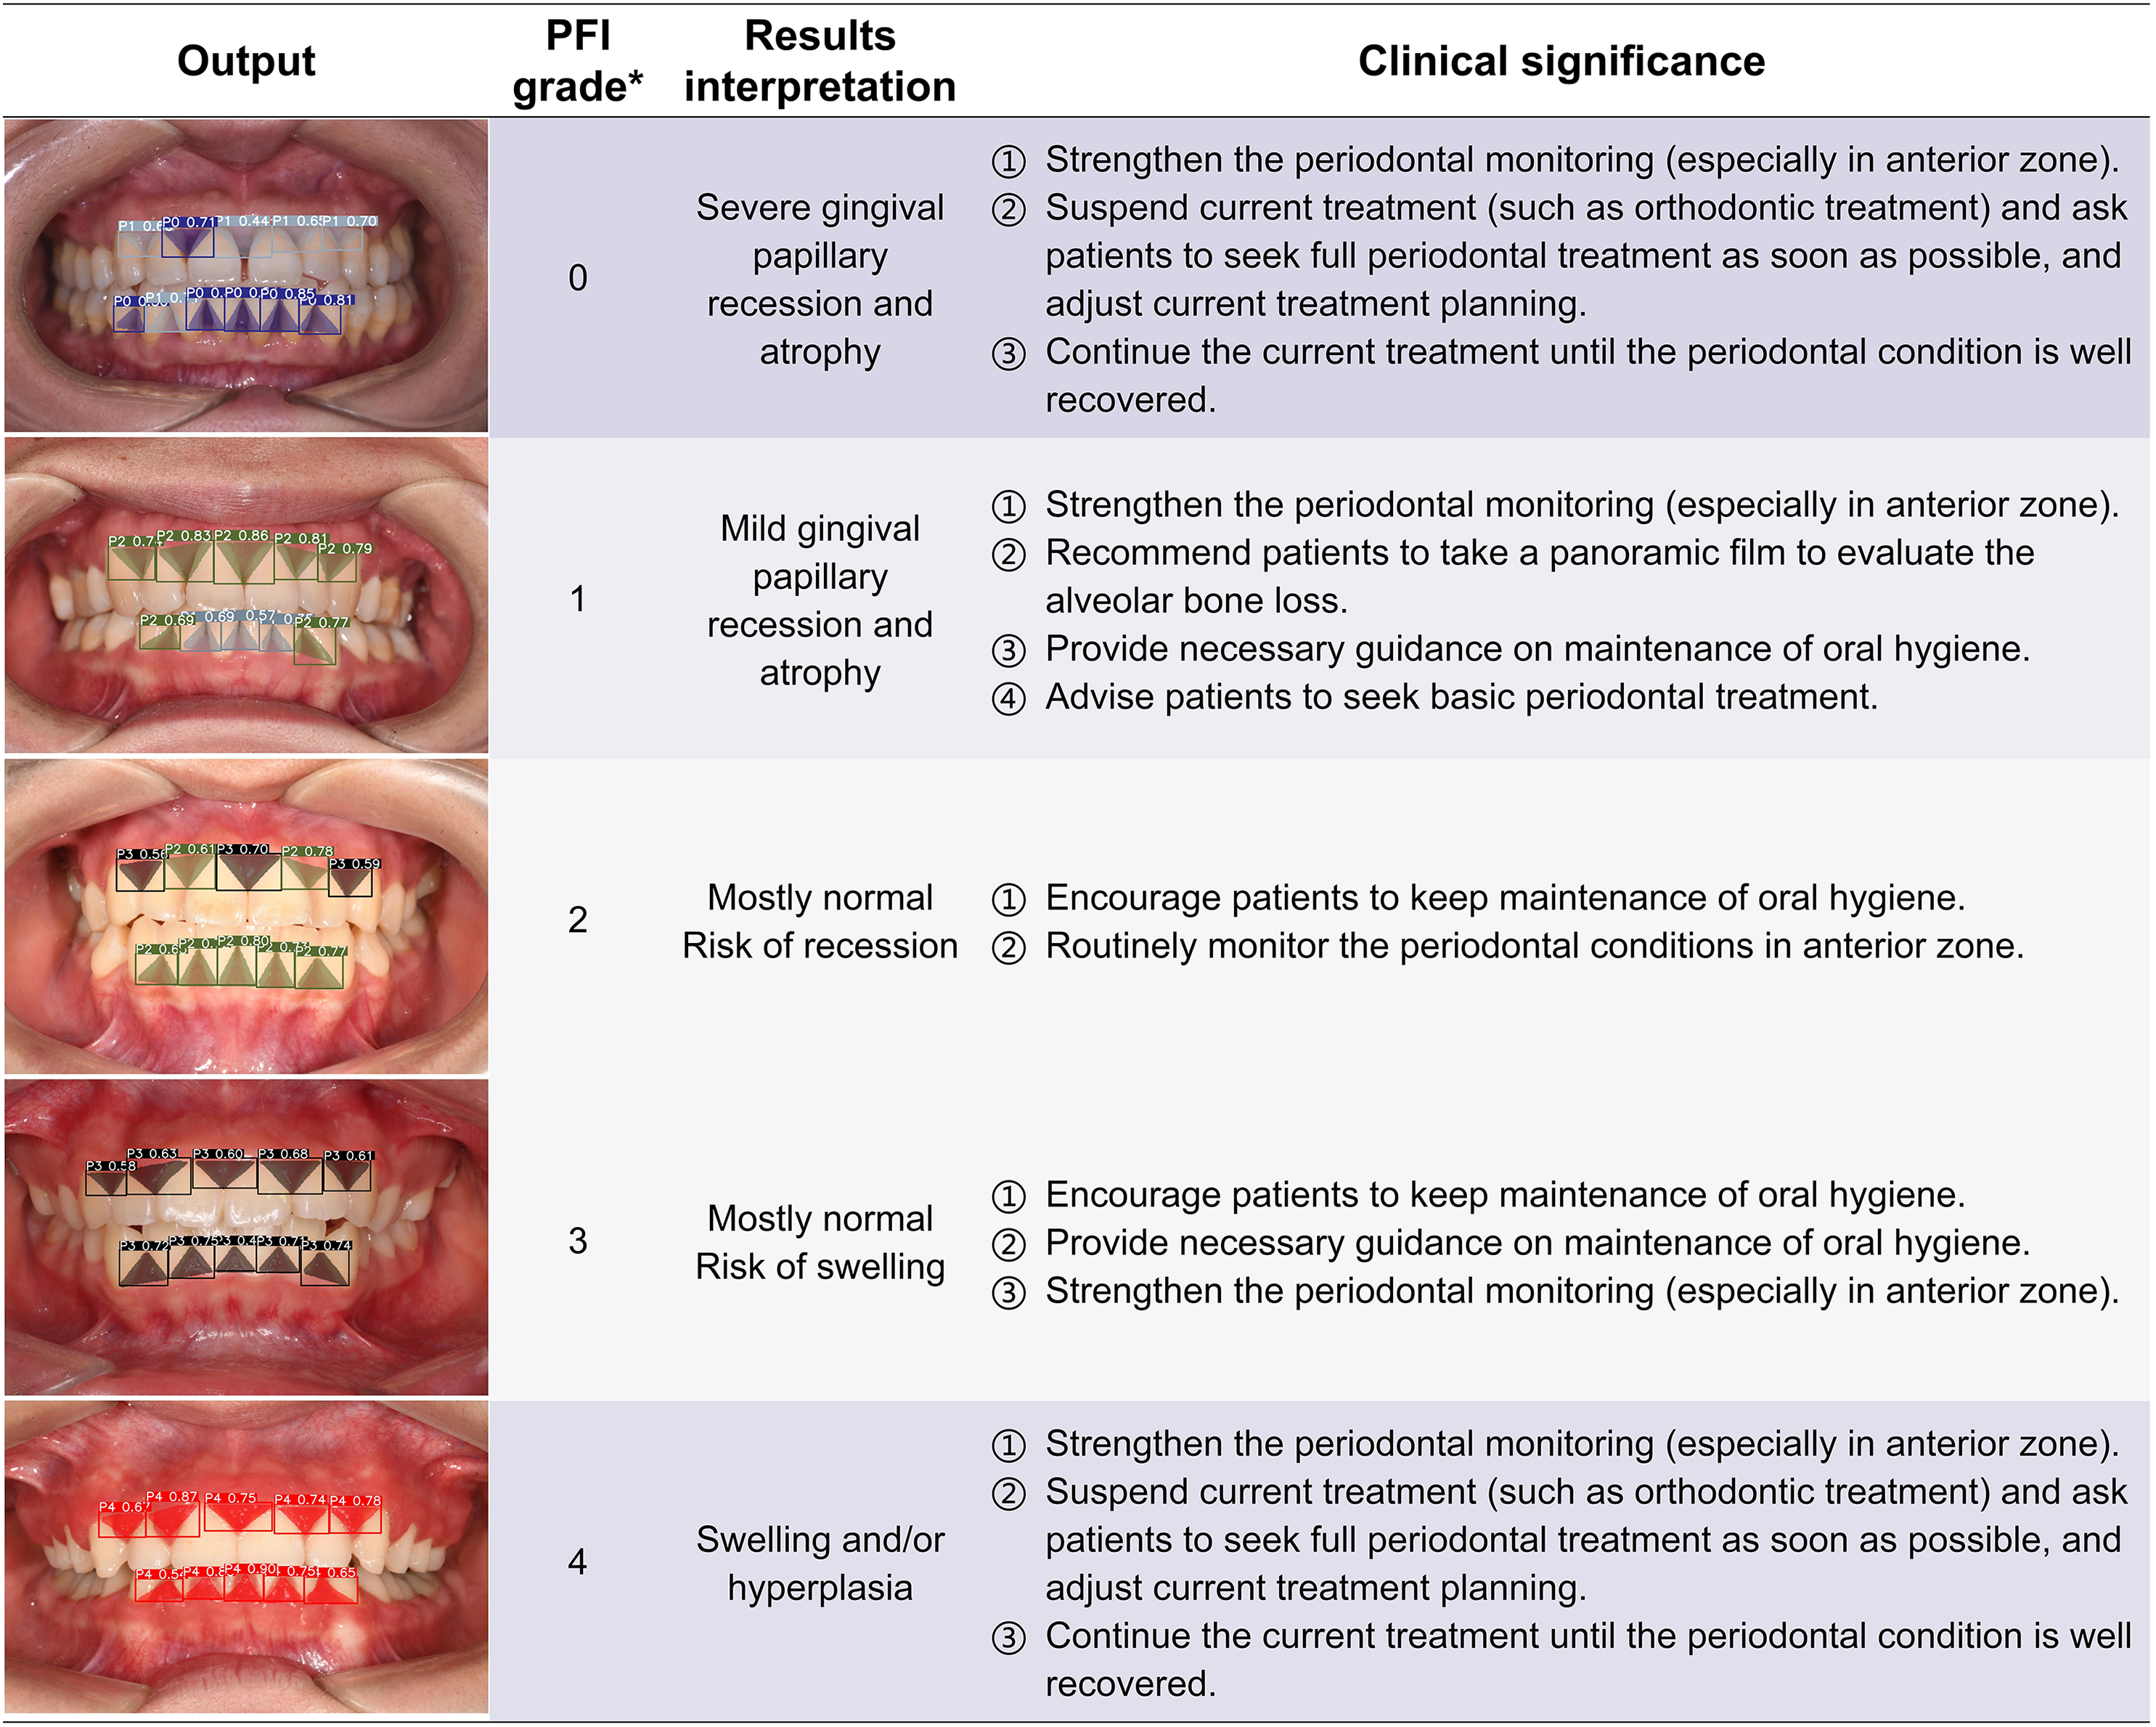
In longitudinal orthodontic care, repeated MGI and PFI mapping helps track tissue response to tooth movement and guides when to intensify hygiene, modify attachments and wires, or refer for periodontal co-management. Beyond decision support, ENPAT demonstrated educational in the retrospective trials. In junior users it improved agreement with experts’ grading (weighted κ typically >0.600 for PFI and MGI with YOLOv8) and reduced evaluation time by 18–23%, suggesting utility for training and workflow acceleration.
Limitation
Admittedly, this study did not cover certain periodontal conditions (e.g., CI-S). Training and validation were limited to frontal intraoral photographs, while findings that primarily occur on the lingual mandibular anterior surface (especially calculus) typically require endoscopy or conventional periodontal examinations and were beyond scope. Additionally, CNNs on RGB are often more contrast- than hue or saturation-sensitive, thus color-driven grading (MGI) is vulnerable to illumination condition or exposure variation. Under or over-exposure may obscure boundaries, and dim lighting can darken gingiva and inflate severity, partly explaining why PFI outperformed MGI. Optimization of model parameters could benefit from algorithms proposed (Srinivasan et al., 2024), which address robustness upon variable pigment. Moreover, external and perturbed validations are further needed to establish robustness since folds came from a relatively single source. Besides, κ values were reported as point estimates without CIs and stratified bootstrap could be adopted to quantify uncertainty. Finally, future iterations could explore explanatory visualizations through Grad-CAM modules, supplementing outputs boxes and masks with confidence scores. Despite these constraints, multi-class outputs showed fair-to-substantial agreement with experienced dentists, supporting the reliability and potential clinical utility of the ENPAT.
Conclusions
Esthetic-zonal Non-invasive Periodontal Assessment Tool (ENPAT), a novel YOLOv8-based detector with multi-grade segmentation, accurately assesses oral health grading, modified gingival index, and papillae filling index from frontal intraoral photos. In the internal validation and real-world test, ENPAT outperformed a ResNet-50 baseline on region-level metrics, and AI assistance improved junior dentists’ agreement and speed, providing support for non-periodontal specialists in detecting, monitoring and managing periodontal abnormalities during dental treatments.