
Pavement defect detection algorithm SSC-YOLO for fusing multiscale spatial channels in YOLOv8
- Published
- Accepted
- Received
- Academic Editor
- Doğan Aydın
- Subject Areas
- Artificial Intelligence, Computer Vision
- Keywords
- Spatial slicing downsampling, Multiscale spatial channels, MFConv convolution, YOLOv8
- Copyright
- © 2025 Sun and Jin
- Licence
- This is an open access article distributed under the terms of the Creative Commons Attribution License, which permits unrestricted use, distribution, reproduction and adaptation in any medium and for any purpose provided that it is properly attributed. For attribution, the original author(s), title, publication source (PeerJ Computer Science) and either DOI or URL of the article must be cited.
- Cite this article
- 2025. Pavement defect detection algorithm SSC-YOLO for fusing multiscale spatial channels in YOLOv8. PeerJ Computer Science 11:e3187 https://doi.org/10.7717/peerj-cs.3187
Abstract
To address the challenges of poor detection performance and low computational efficiency in existing pavement defect detection models, a novel algorithm, You Only Look Once with Spatial Slicing Convolution (SSC-YOLO), is proposed. This method enhances detection accuracy by integrating multi-scale spatial feature channels into the You Only Look Once version 8 (YOLOv8) framework. Key improvements include the replacement of conventional downsampling and upsampling operations with Spatial Slicing Downsampling (SSD) and Multichannel Fusion Upsampling (MUP), respectively, which more effectively preserve original feature information. A multi-scale convolutional module with large kernels is also incorporated to expand the receptive field and improve model robustness. In addition, the Multi-scale Fusion Convolution (MFConv) mechanism is introduced to construct a parameter-sharing detection head, thereby improving accuracy while simultaneously reducing memory usage and model complexity. Experimental results on the VOC2007 dataset demonstrate substantial performance gains, with improvements of 2.1% in average recall (AR), 2.2% in mean average precision at 50% Intersection over Union (IoU) (mAP50), 2.9% in mAP75, 3.2% in mAP50–95, 3.0% in average precision for small objects (APS), 2.5% for medium objects (APM), and 3.7% for large objects (APL).
Introduction
The development of a nation’s economy and the quality of life are closely tied to the condition of its transportation infrastructure. In recent years, the rapid expansion of China’s transportation network has significantly enhanced the convenience of daily life. However, this progress has also introduced growing challenges in road maintenance and management. If not addressed in a timely manner, these challenges may lead to increased road congestion and pose serious risks to traffic safety. Traditionally, road defects such as cracks and potholes are identified through manual inspection, a process that is both inefficient and labor-intensive. Consequently, there is a pressing need to develop a road defect detection system that is not only highly efficient but also capable of delivering high accuracy.
Since the early 2010s, pavement defect detection has undergone significant advancements. In the initial stages, traditional image processing techniques such as threshold segmentation (Devi, Latha & Sulochana, 2015), edge detection (Xu et al., 2014), and region-growing algorithms (Xu et al., 2014) were widely used. Threshold segmentation operates by dividing pixels in an image into two categories (e.g., defective and standard regions) based on a predefined pixel value threshold. While effective in scenarios with high contrast between the background and defects, this method performs poorly in complex environments or under varying lighting conditions. Edge detection, often implemented using algorithms such as the Canny operator, identifies regions with significant gray-scale variation to locate the boundaries of pavement defects. Although this approach is effective for contour localization, it is susceptible to false detections in the presence of noise or blurring. The region-growing algorithm initiates with a seed point and expands it based on pixel similarity, thereby aggregating regions with similar features. However, it lacks robustness in complex or noisy backgrounds and is easily affected by interference. With the advent of deep learning, convolutional neural network (CNN)-based methods have become prominent in defect detection. These methods are typically categorized into two types. The two-stage algorithms—such as Region-based Convolutional Neural Network (R-CNN) (Girshick et al., 2014), Fast R-CNN (Girshick, 2015), Faster R-CNN (Ren et al., 2017), and Mask R-CNN (He et al., 2017)—are known for their high detection accuracy but incur substantial computational costs. In contrast, single-stage models, including the Single Shot MultiBox Detector (SSD) (Liu et al., 2016) and the You Only Look Once (YOLO) series (Redmon et al., 2016; Redmon & Farhadi, 2017, 2018; Bochkovskiy, Wang & Mark Liao, 2004; Li et al., 2022; Wang, Bochkovskiy & Liao, 2023), offer faster inference speeds and higher efficiency, albeit sometimes at the expense of accuracy.
In recent years, research across both algorithm categories has increasingly focused on balancing detection speed and accuracy—a priority particularly critical for practical tasks such as pavement defect detection. For instance, Sun et al. (2020) proposed a Faster R-CNN-based network that improves crack detection accuracy by modifying the feature extraction layers and adjusting the aspect ratio of candidate bounding boxes. Similarly, Nui et al. (2023) enhanced the backbone of the Mask R-CNN model to improve its feature extraction capabilities, effectively addressing inefficiencies in defect detection. In another study, Cui et al. (2021) refined the YOLOv3 model by optimizing its activation and loss functions, thereby enhancing detection performance. Further improvements were made by An et al. (2023b), who introduced depthwise separable convolutions to replace the standard convolutional layers in YOLOv4 and incorporated the Adaptive Spatial Feature Fusion (ASFF) module. This approach adaptively learns spatial weights, reducing memory usage while preserving detection accuracy (An et al., 2023b). In addition, Han et al. (2023) utilized the SSD model for pavement defect detection and integrated it with the ArcMap system for visualization. To address computational constraints on mobile platforms, An et al. (2023a) proposed YOLOLWNet, a lightweight variant of YOLOv5 that significantly reduces computational complexity while maintaining detection performance. Wang, Wang & Ge (2024) developed the CNX2f feature extraction module and incorporated the Re-parameterized Convolution (RepConv) and Depthwise Bottleneck Block (DBB) reparameterization modules into the YOLOv8 backbone, culminating in the Spatial Pyramid Pooling Fast (SPPF)-Avg module. This design enhances multi-scale feature extraction and improves defect recognition accuracy (Wang, Wang & Ge, 2024; Sun et al., 2022). More recently, Ma et al. (2024) integrated a GS-Decoupled structure into YOLOv8 to strengthen feature extraction while reducing parameter count and computational load. However, the method still shows limitations in detecting small-scale defects. In another study, Zhang & Guo (2023) incorporated the Convolutional Block Attention Module (CBAM) into YOLOv7, enabling the model to extract pavement defect features more effectively. Nonetheless, this model overlooks certain aspects of the original image features, which may affect detection completeness.
Guo et al. (2023) proposed a pavement crack detection method based on the transformer network, which enables the model to better capture long-range dependencies and enhances the representation of crack features. This method demonstrated strong performance in automated crack detection, particularly in complex pavement scenarios. Similarly, Zhang et al. (2024) introduced a robust semantic segmentation framework that combines global contextual information with local image features using a multi-mixing strategy. This approach significantly improved the detection of complex cracks across varying scales and challenging backgrounds. Zhang & Liu (2024) proposed a high-accuracy network architecture designed for robust pavement crack segmentation. By enhancing feature extraction and optimizing the loss function, the model achieved substantial improvements in both detection accuracy and robustness, making it suitable for pavements with diverse surface materials and environmental conditions. To address domain shifts between different datasets and environments, Liu et al. (2024) explored the application of deep domain adaptation techniques in pavement crack detection. The proposed framework improved generalization on unseen datasets by effectively leveraging domain adaptation strategies. In addition, Alipour & Harris (2020) investigated the robustness of material-specific deep learning models, aiming to reduce the impact of material differences on detection performance. A method was introduced to enhance model adaptability across various material types, resulting in significantly improved detection accuracy. Finally, Wen et al. (2024) developed a detection system that integrates multi-scale contextual features with a cross-attention network. By fusing features at different scales and incorporating attention-based mechanisms, the system enhanced the recognition of complex cracks and backgrounds, thereby improving both accuracy and robustness.
Although existing road defect detection methods have improved detection efficiency to a certain extent, they still face notable challenges—particularly in multi-scale feature extraction and the detection of small and irregular objects. YOLOv8, as a representative single-stage detection algorithm, achieves high-speed object detection due to its streamlined structure. However, this structural simplification also limits its capacity to accurately detect complex, multi-scale, and small-sized targets. In real-world road defect scenarios, the morphology, scale, and spatial distribution of defects vary significantly. These defects are often subtle, irregular in shape, or small in size, making them difficult to detect reliably—especially in low-resolution or cluttered environments. YOLOv8 struggles to extract sufficient feature information for such minor defects, which can result in missed detections or false positives. While YOLOv8 performs well in real-time detection tasks, its single-stage design inherently compromises the effectiveness of multi-scale feature representation. Specifically, when confronted with small-scale road defects such as cracks or potholes, the model’s limited capacity for contextual reasoning and cross-scale feature fusion diminishes its robustness. This limitation becomes particularly evident in complex pavement conditions where large and small defects coexist, often leading to inaccurate recognition and reduced detection reliability.
To address the aforementioned challenges, You Only Look Once with Spatial Slicing Convolution (SSC-YOLO) introduces a multi-scale channel feature fusion strategy, which aims to more effectively detect defects of varying sizes and morphologies by incorporating feature maps across different scales. Unlike traditional YOLO models, SSC-YOLO integrates Spatial Slicing Downsampling (SSD) and Multichannel Fusion Upsampling (MUP) into the YOLOv8 framework. These techniques jointly expand the model’s receptive field and enhance the retention of multi-scale feature information. SSD improves robustness by segmenting the input image into multiple spatial regions, allowing for progressive downsampling and multi-scale feature extraction. This approach reduces noise interference and preserves critical details, especially when detecting small or irregular defects such as micro-cracks and fine pits. By adapting to variations in defect size and complexity, SSD enhances detection accuracy and model stability. MUP, on the other hand, fuses features from multiple scales during the upsampling process to strengthen the interaction between shallow and deep feature representations. This fusion not only mitigates the multi-level information loss typically observed in traditional YOLO models, but also accelerates information flow across layers. As a result, MUP enhances the model’s adaptability to complex scenes while maintaining detection precision. Despite recent advances, many existing road defect detection models still struggle with complex or irregular defect shapes, particularly in accurately extracting features with high morphological variability. Traditional YOLO models, optimized for speed and efficiency, often sacrifice detailed feature representation—especially for small or elongated defects—due to their limited receptive field and simplified structure. This limitation leads to frequent misdetections or omissions in complex road environments. To overcome these issues, SSC-YOLO incorporates multi-scale convolution techniques, using convolutional kernels of various sizes to capture features across multiple scales. By leveraging large-kernel convolutions, the receptive field of the model is effectively expanded, allowing it to extract richer contextual information—particularly for large-scale defects. In contrast to single-scale convolutional operations, this multi-scale strategy allows the network to better adapt to the highly variable size and shape of pavement defects. Furthermore, SSC-YOLO enhances cross-layer information fusion to improve representational capacity. In traditional YOLO models, shallow features tend to capture fine-grained visual details, while deep features provide stronger semantic understanding. To leverage both, SSC-YOLO introduces a dedicated fusion mechanism that integrates shallow and deep features, enriching the model’s overall representation. This design enables the network to maintain sensitivity to local details while preserving global semantic coherence, thereby improving detection accuracy and robustness under complex conditions.
Related work
YOLOv8 structure
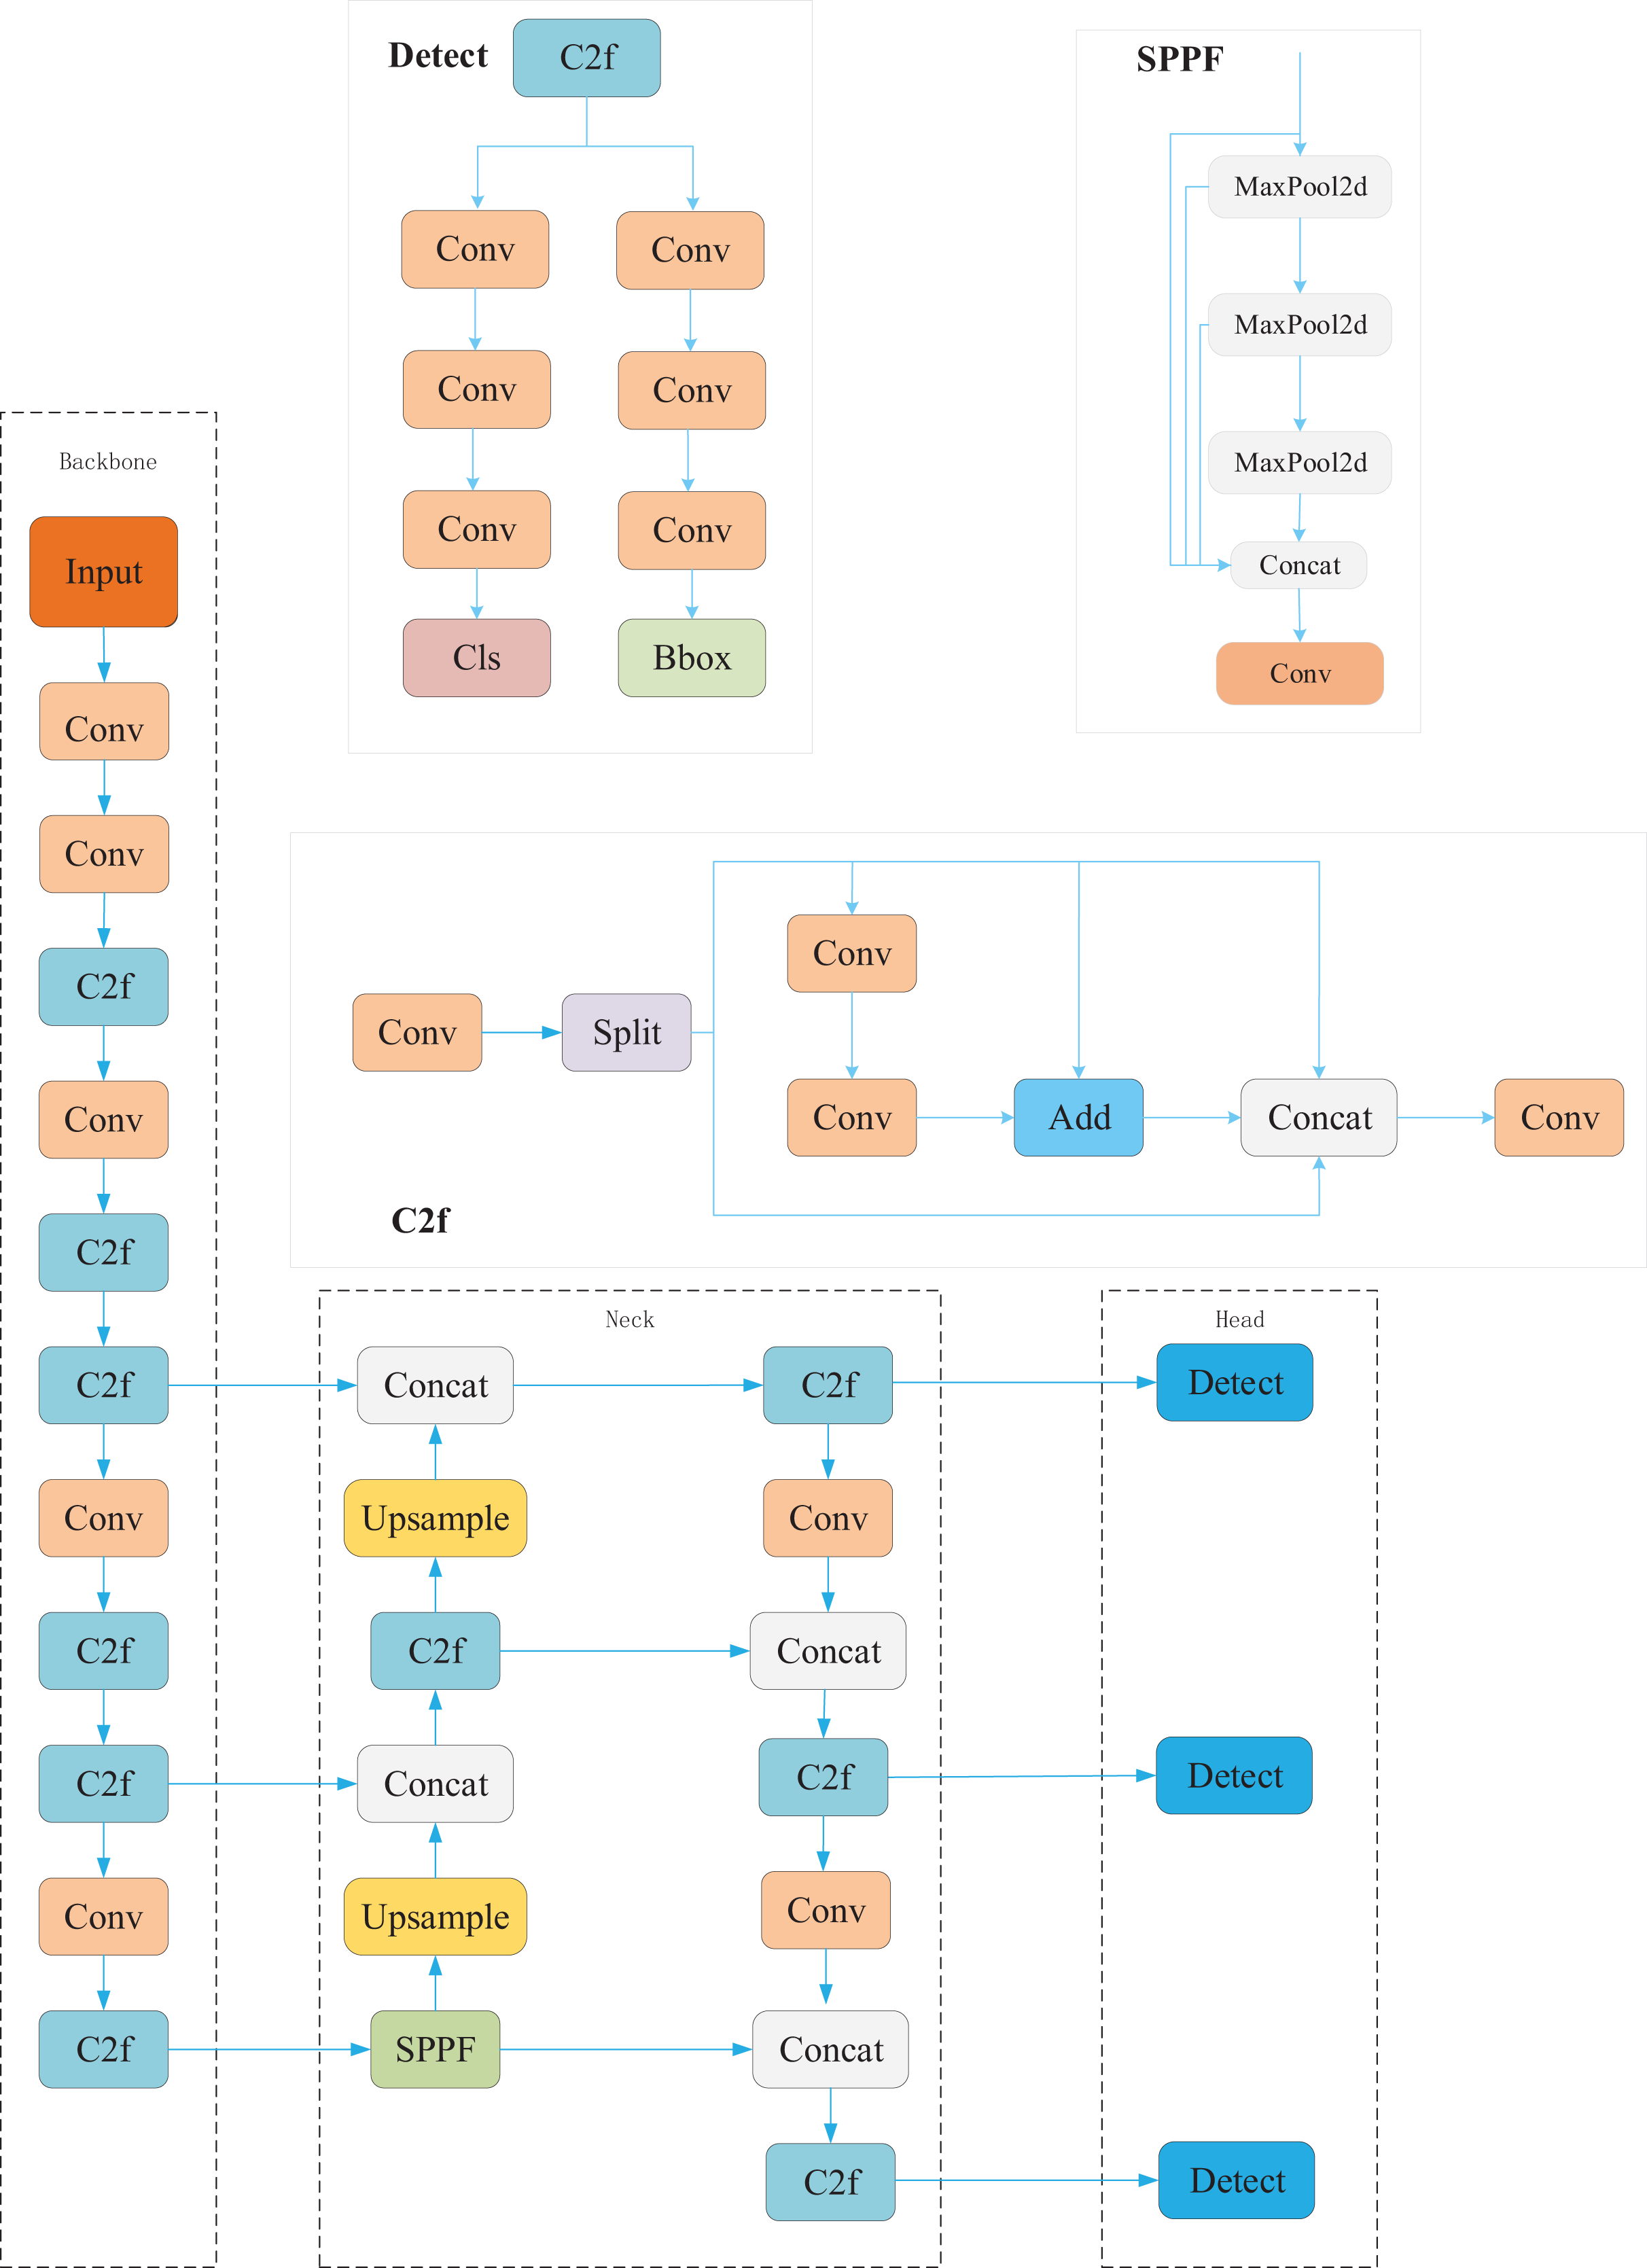
YOLOv8, the latest iteration in the YOLO series, achieves notable improvements in both detection accuracy and speed compared to its predecessor, YOLOv5, which remains widely adopted in industrial applications. The YOLOv8 architecture is composed of four main components: the input stage, the backbone network, the neck network, and the detection head. In the input stage, YOLOv8 incorporates techniques such as mosaic augmentation, adaptive anchor boxes, and grayscale padding to enhance the robustness and generalization of the model. The backbone network introduces the Crossover Fusion (C2f) and Spatial Pyramid Pooling Fast (SPPF) modules to improve feature extraction, particularly by enhancing gradient flow and the representational capacity of deep features. The neck network adopts a Path Aggregation Network (PAN) structure to strengthen multi-scale feature fusion, enabling more effective integration of semantic and spatial information. Moreover, YOLOv8 enhances prediction accuracy by decoupling classification and localization tasks in the detection head, allowing feature processing to be optimized independently for each subtask. The overall structure of YOLOv8 is illustrated in Fig. 1.
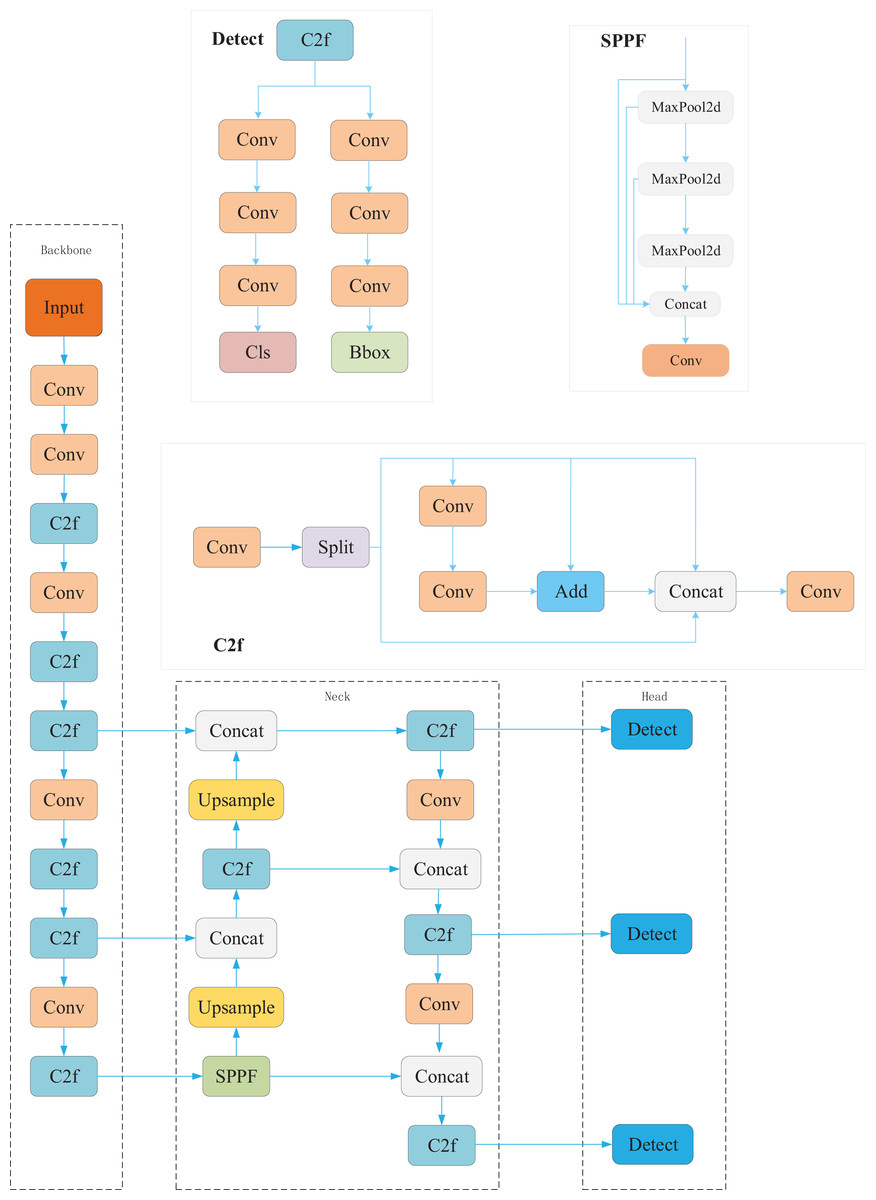
Figure 1: YOLOv8 structure.
Improved YOLOv8 (SSC-YOLO)
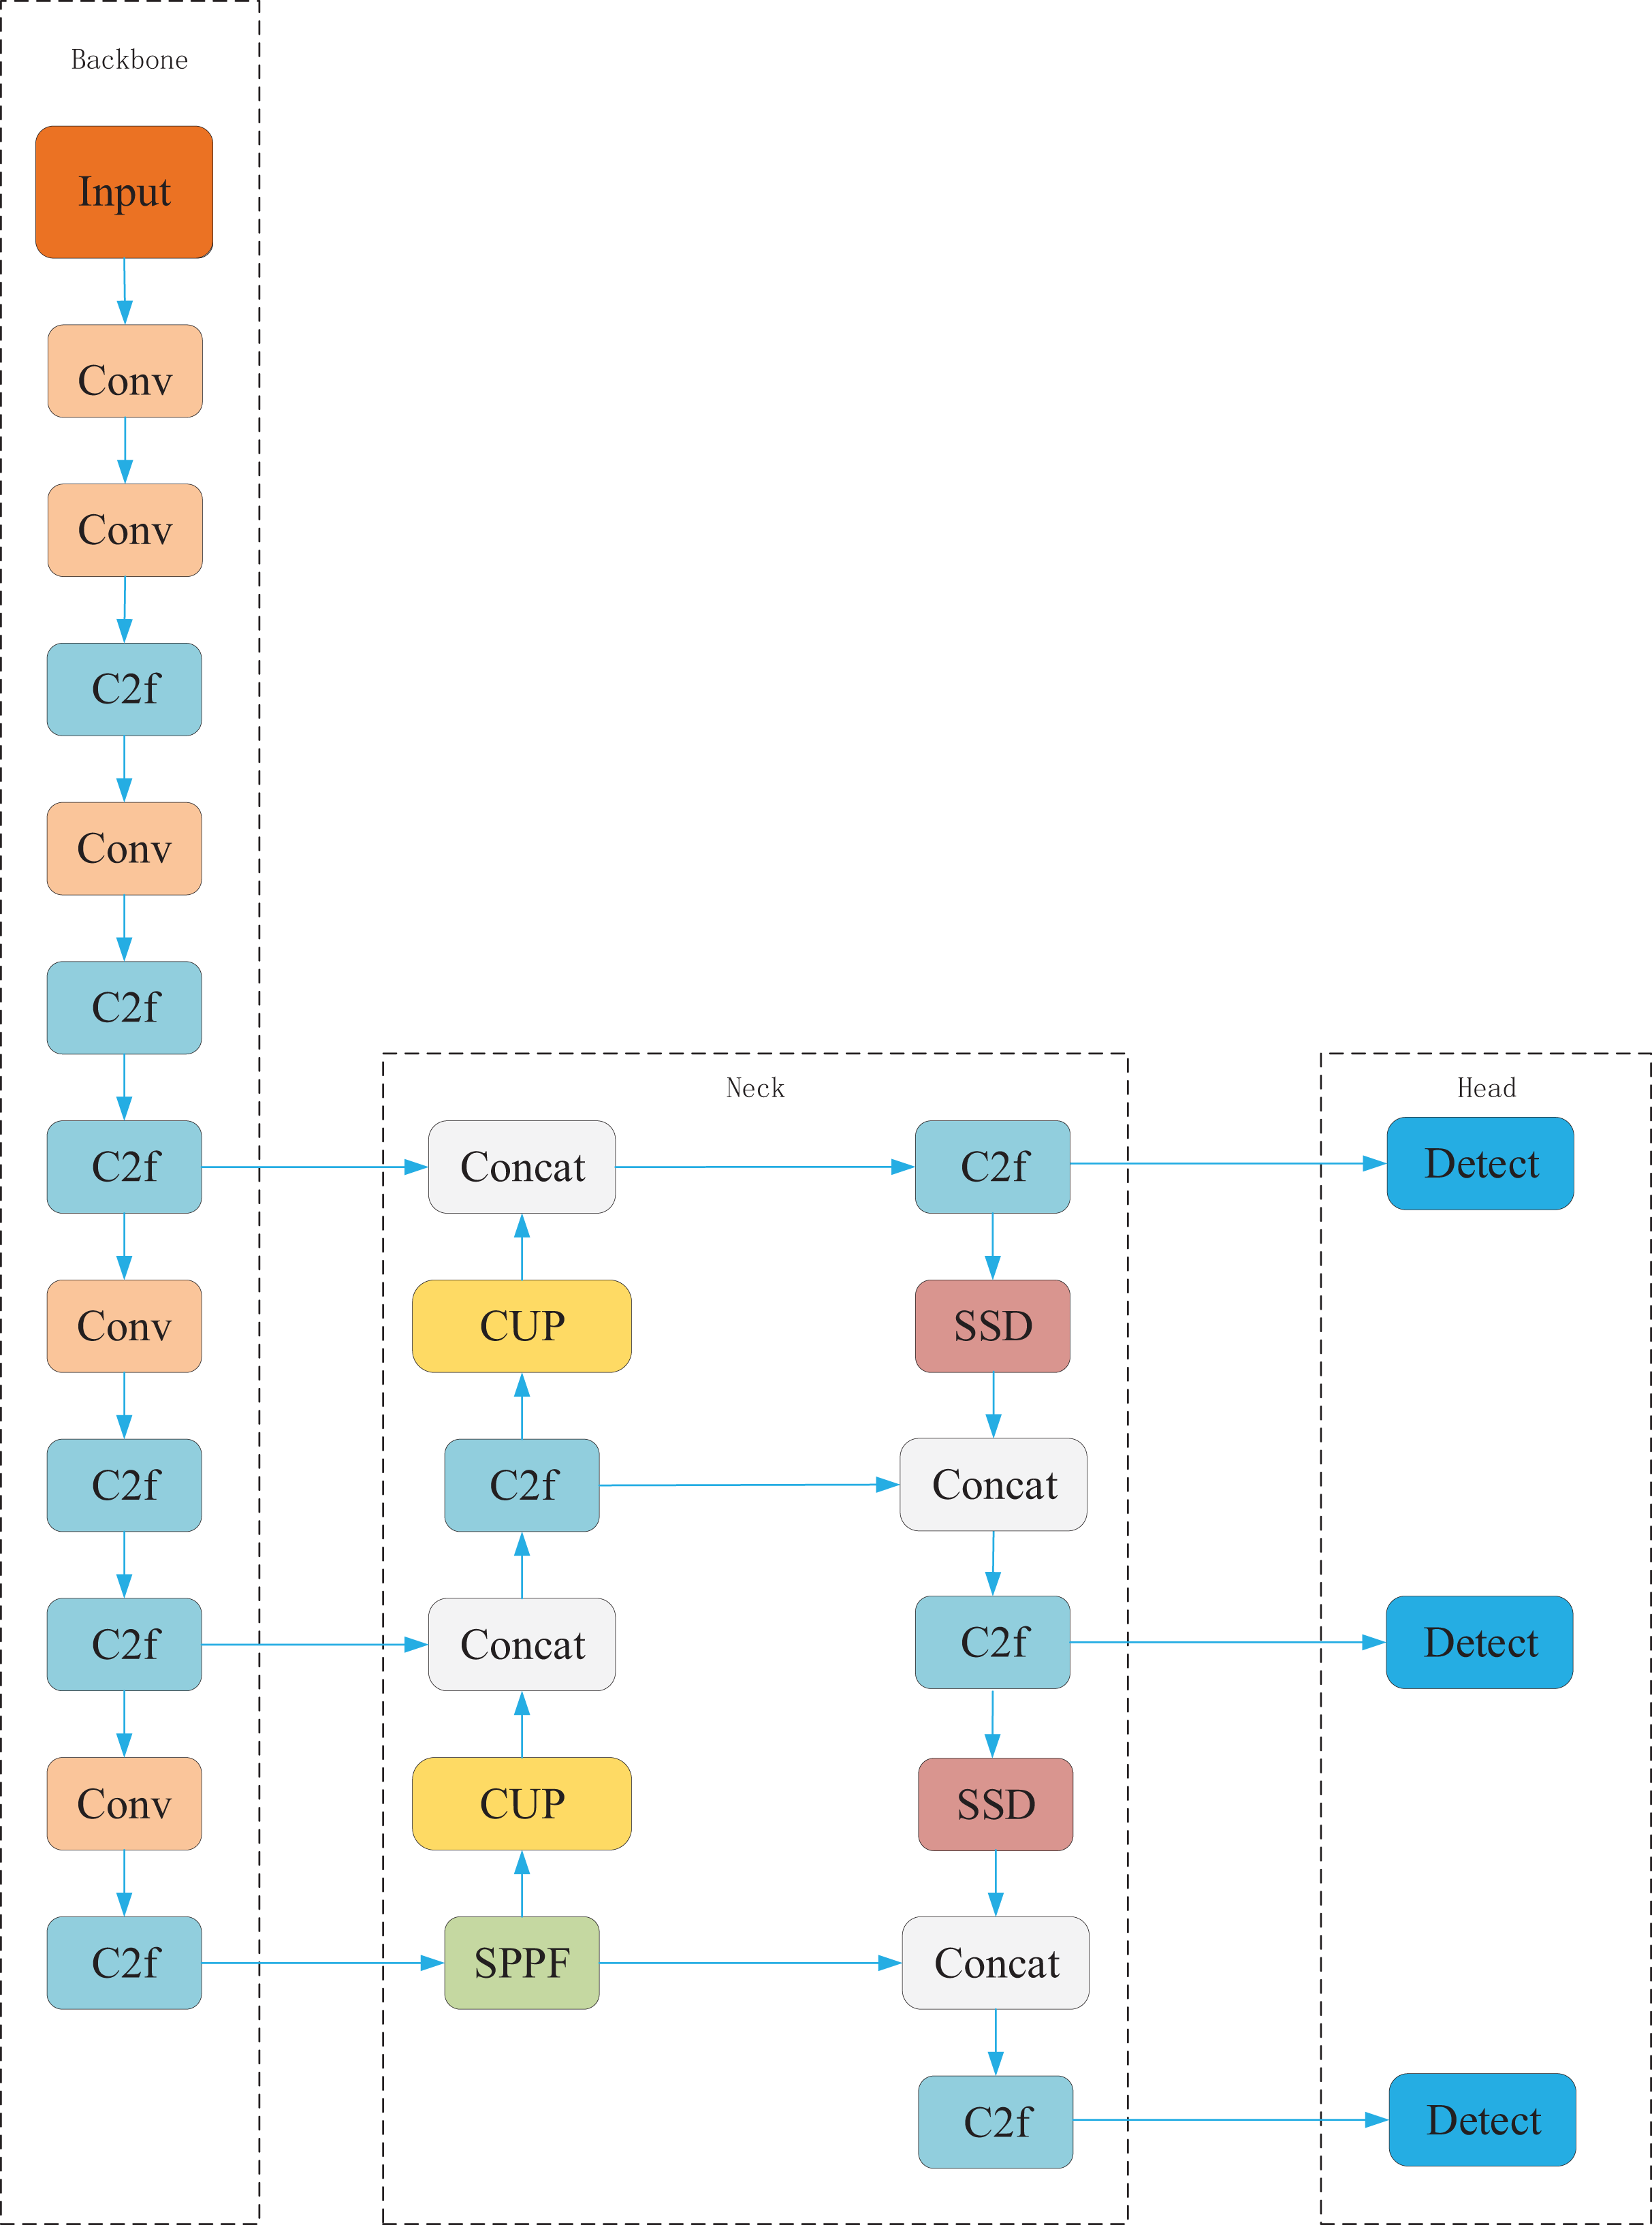
To further enhance pavement defect detection performance, we propose the SSC-YOLO model. Its overall architecture is illustrated in Fig. 2. The model comprises several interconnected modules, each serving a distinct role in the feature extraction and detection pipeline. The structure and interactions of these modules are described as follows. First, the traditional downsampling operation in YOLOv8 is replaced with the Spatial Slicing Downsampling (SSD) module. Unlike conventional convolutional downsampling, SSD performs spatial slicing to preserve more original feature information from the input image. This approach ensures that high-dimensional details are retained during feature extraction, providing richer and more accurate input for subsequent processing. Second, we introduce the Multichannel Fusion Upsampling (MUP) module in place of the standard upsampling layer. MUP enhances the receptive field and improves the model’s ability to capture shallow semantic information through multi-path fusion. This design enables better retention of fine-grained visual features, which is critical for accurately detecting small and irregular defects. Third, multi-scale convolution is incorporated to further improve feature extraction. By applying multiple convolution kernels of varying sizes, the model is able to extract features at different spatial resolutions. This strategy expands the effective receptive field and enhances robustness when detecting objects with diverse scales and shapes. Finally, to reduce model complexity while maintaining high detection accuracy, a parameter-sharing detection head is constructed using the Multi-scale Fusion Convolution (MFConv) module. This component performs both classification and localization using shared parameters, thereby reducing memory consumption and computational cost. In the full processing pipeline, the input image is first downsampled by SSD to extract low-dimensional features. These features are then refined by the MUP module, which enhances semantic representation and expands the receptive field. The resulting feature map passes through the multi-scale convolutional layer, where large-kernel convolutions capture diverse feature information. Finally, the processed feature maps are fed into the parameter-sharing detection head, which outputs the final detection results through efficient classification and localization. The role and function of each component within the SSC-YOLO architecture are summarized in Table 1.
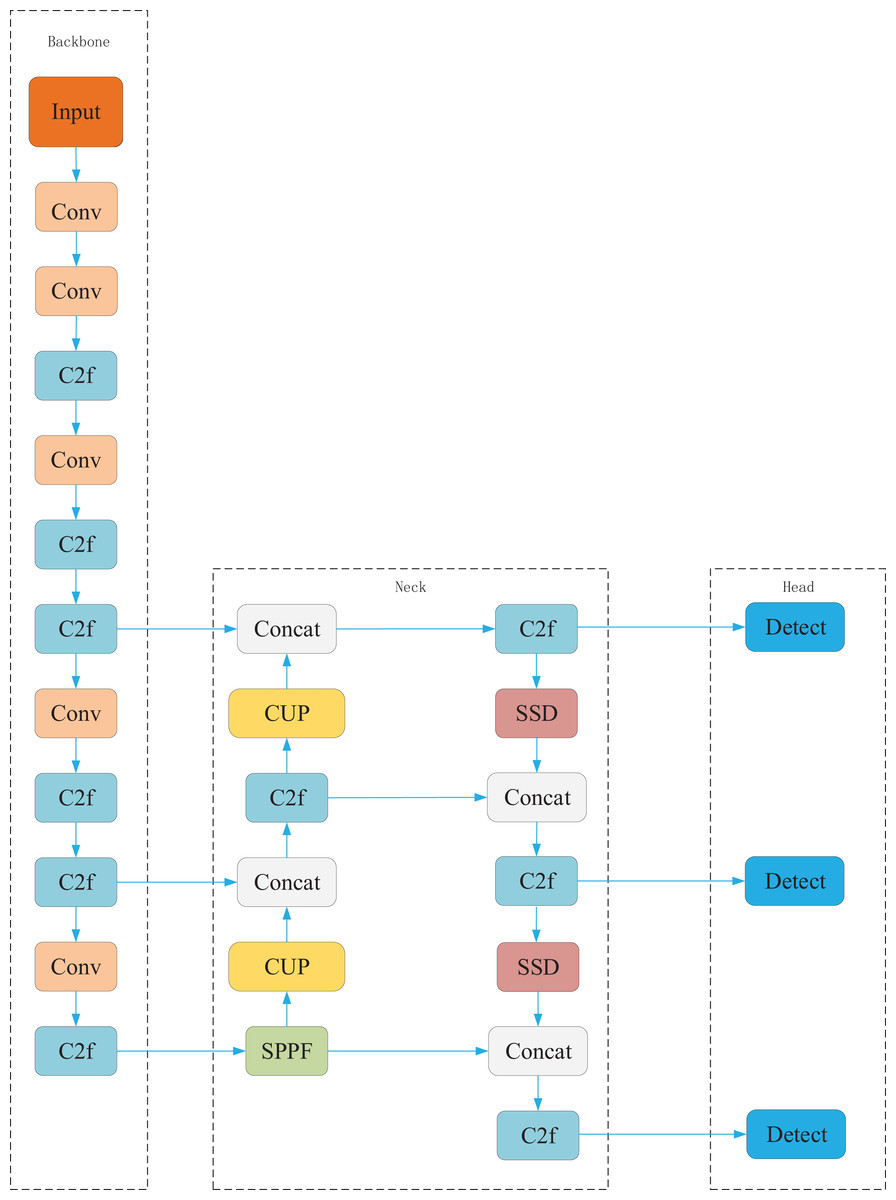
Figure 2: SSC-YOLO structure.
| Layer type | Purpose | Function |
|---|---|---|
| Convolutional Layer | Extract local features from the image | Feature extraction, capturing local information through convolution operations |
| Pooling Layer | Dimensionality reduction, reducing image size while retaining main features | Reduces computational complexity and feature map size, reduces overfitting |
| Spatial Slice Downsampling (SSD) | Alternative to traditional convolution downsampling, retains more original image features | Downsamples through a special slicing method, improves feature information retention |
| Multi-Channel Fusion Upsampling (MUP) | Enhance shallow semantic information, increase receptive field | Improves feature map resolution, captures more image details |
| Upsample | Expands receptive field, increases image resolution, captures finer image details | Enhances model robustness, improves adaptation to objects of varying sizes |
| MFConv Convolution | Increases detection accuracy through parameter sharing, reduces memory consumption | Increases detection accuracy and reduces model complexity |
| C2f (Crossover Fusion) | Achieves deep-shallow feature fusion, enhances multi-scale information flow | Fuses deep and shallow features, enhancing the model’s ability to perceive information at different scales |
| Concat (Concatenation Operation) | Concatenates feature maps from different scales for further processing | Enhances feature representation by concatenating different-scale feature maps, enabling the model to capture more information |
| SPPF (Spatial Pyramid Pooling Fusion) | Captures multi-scale spatial information, increases receptive field | Combines multi-scale information through different-scale pooling operations, improving detection performance and robustness |
| Detection Head | Combines classification and regression tasks, reduces memory consumption and computational complexity | Performs classification and localization in object detection tasks, reducing model complexity and computation while enhancing detection accuracy |
Methods
Spatial slicing downsampling (SSD)
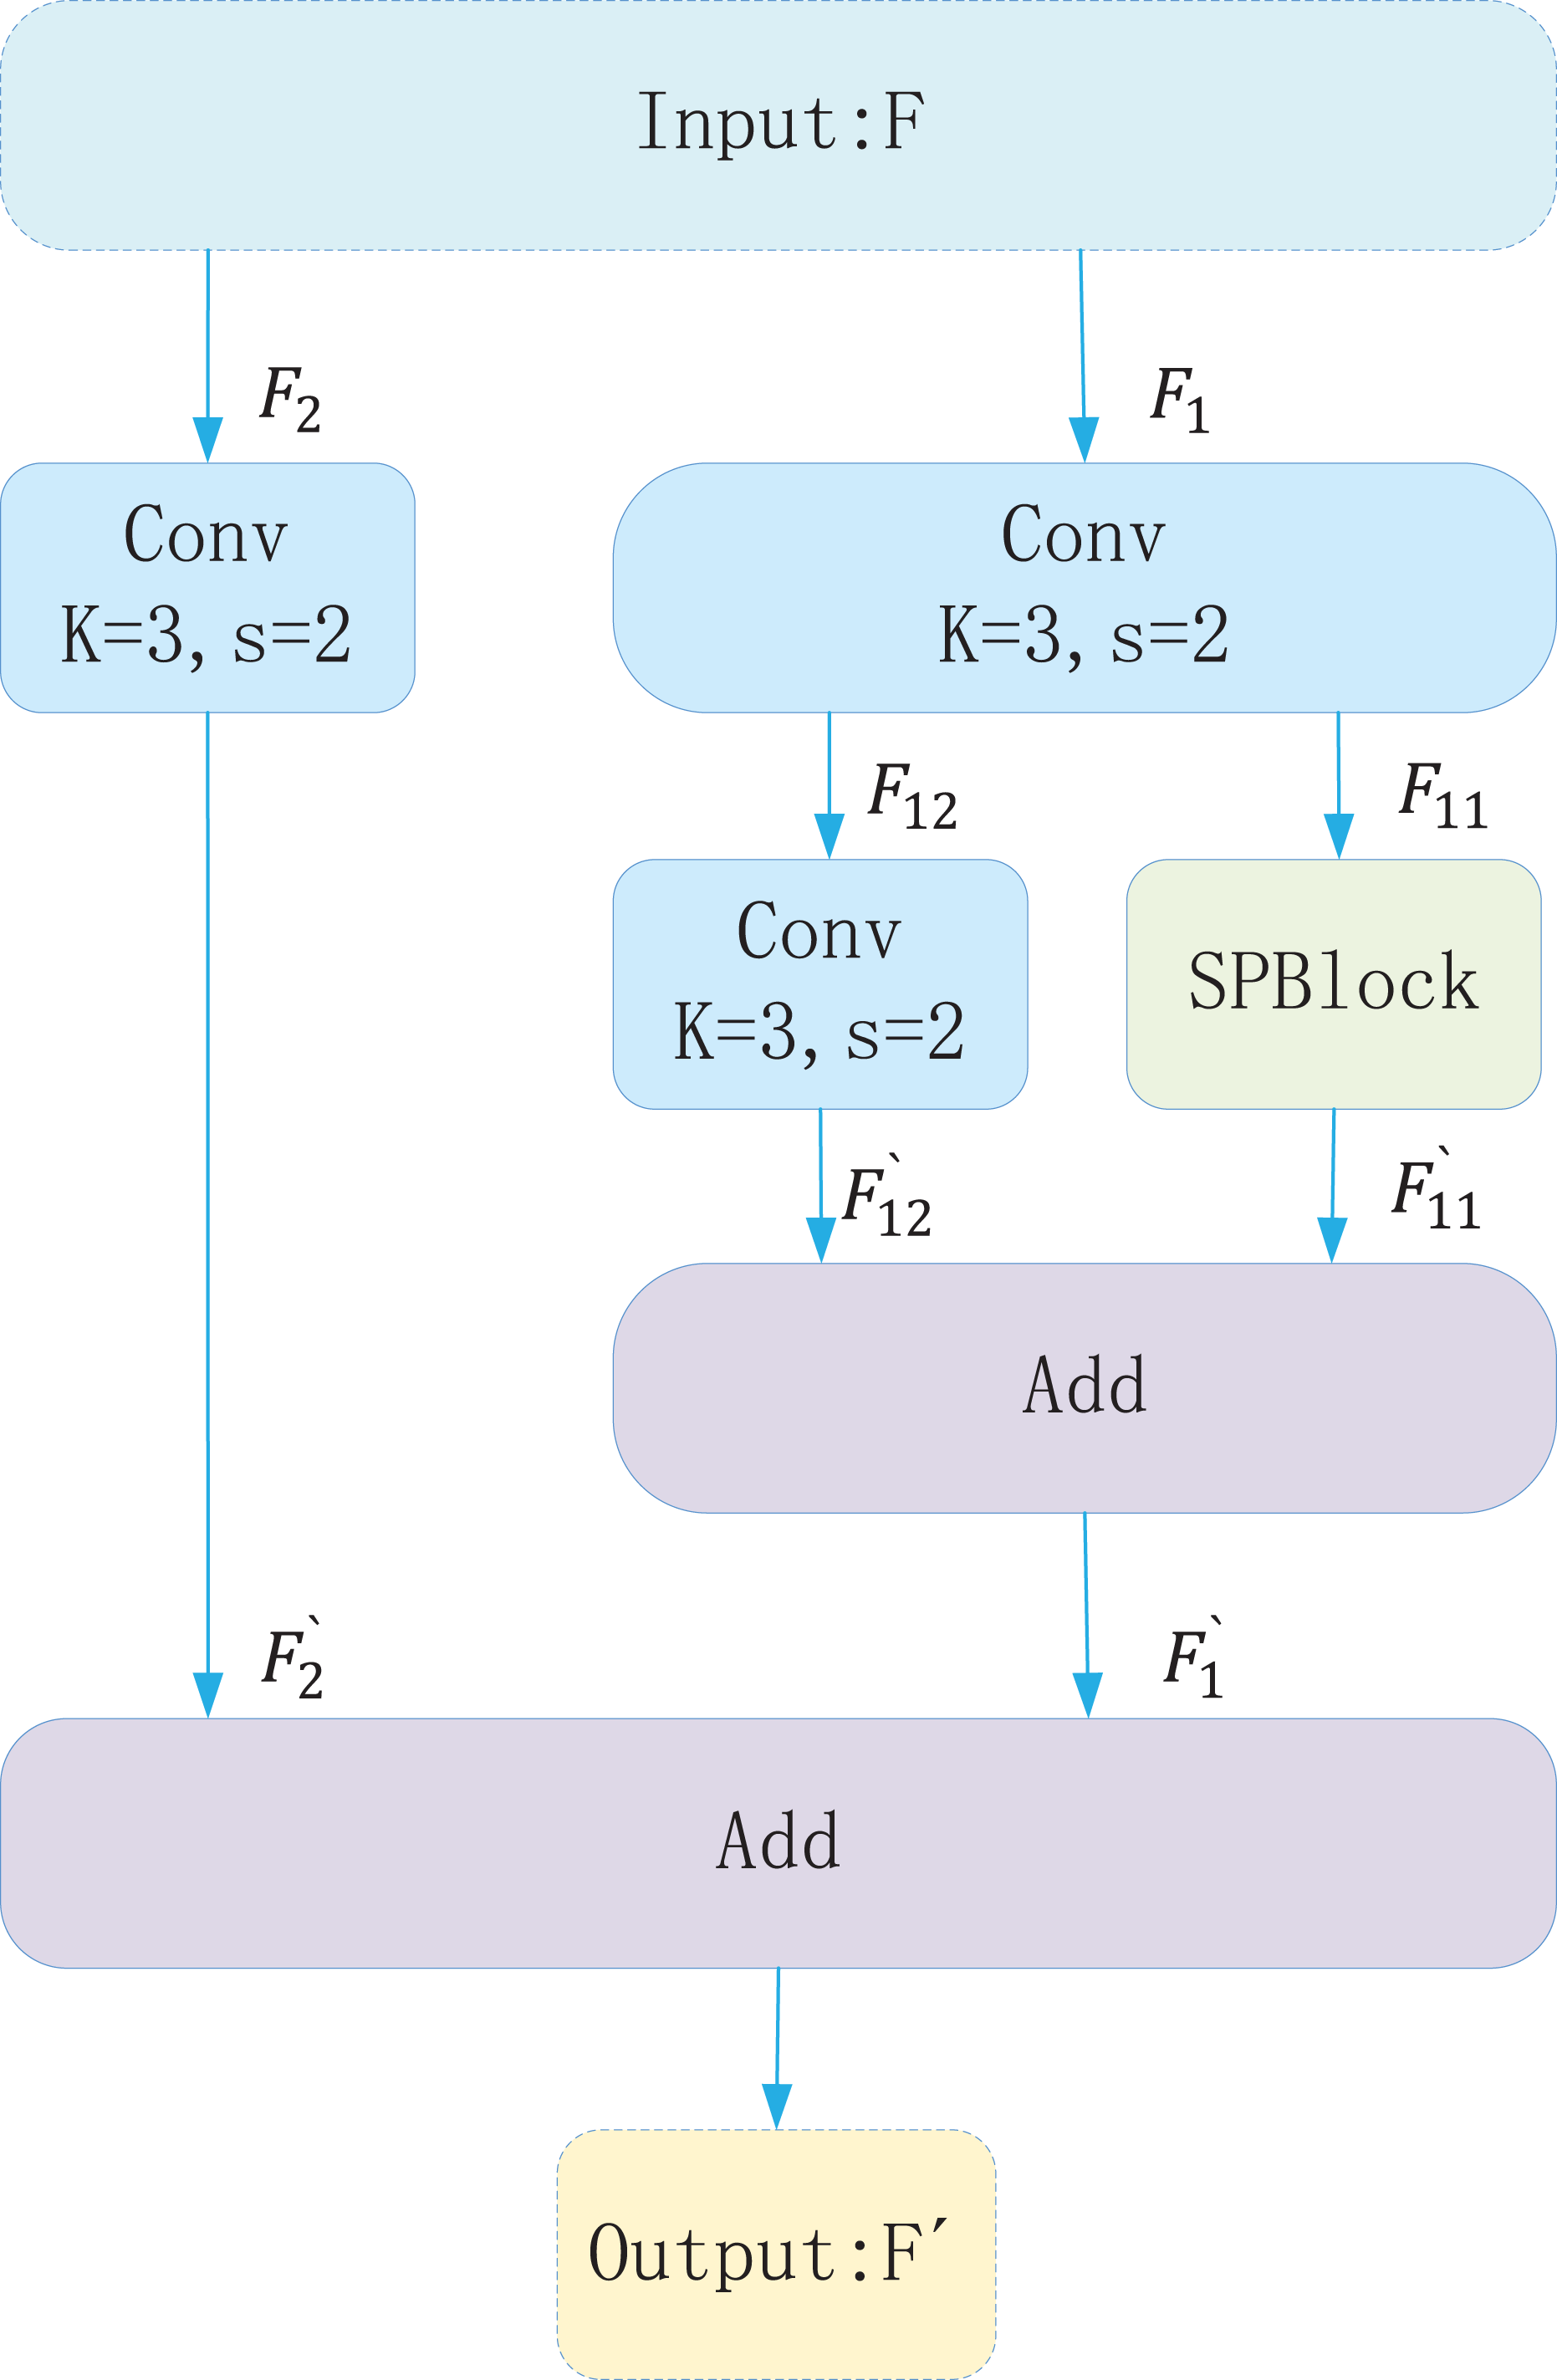
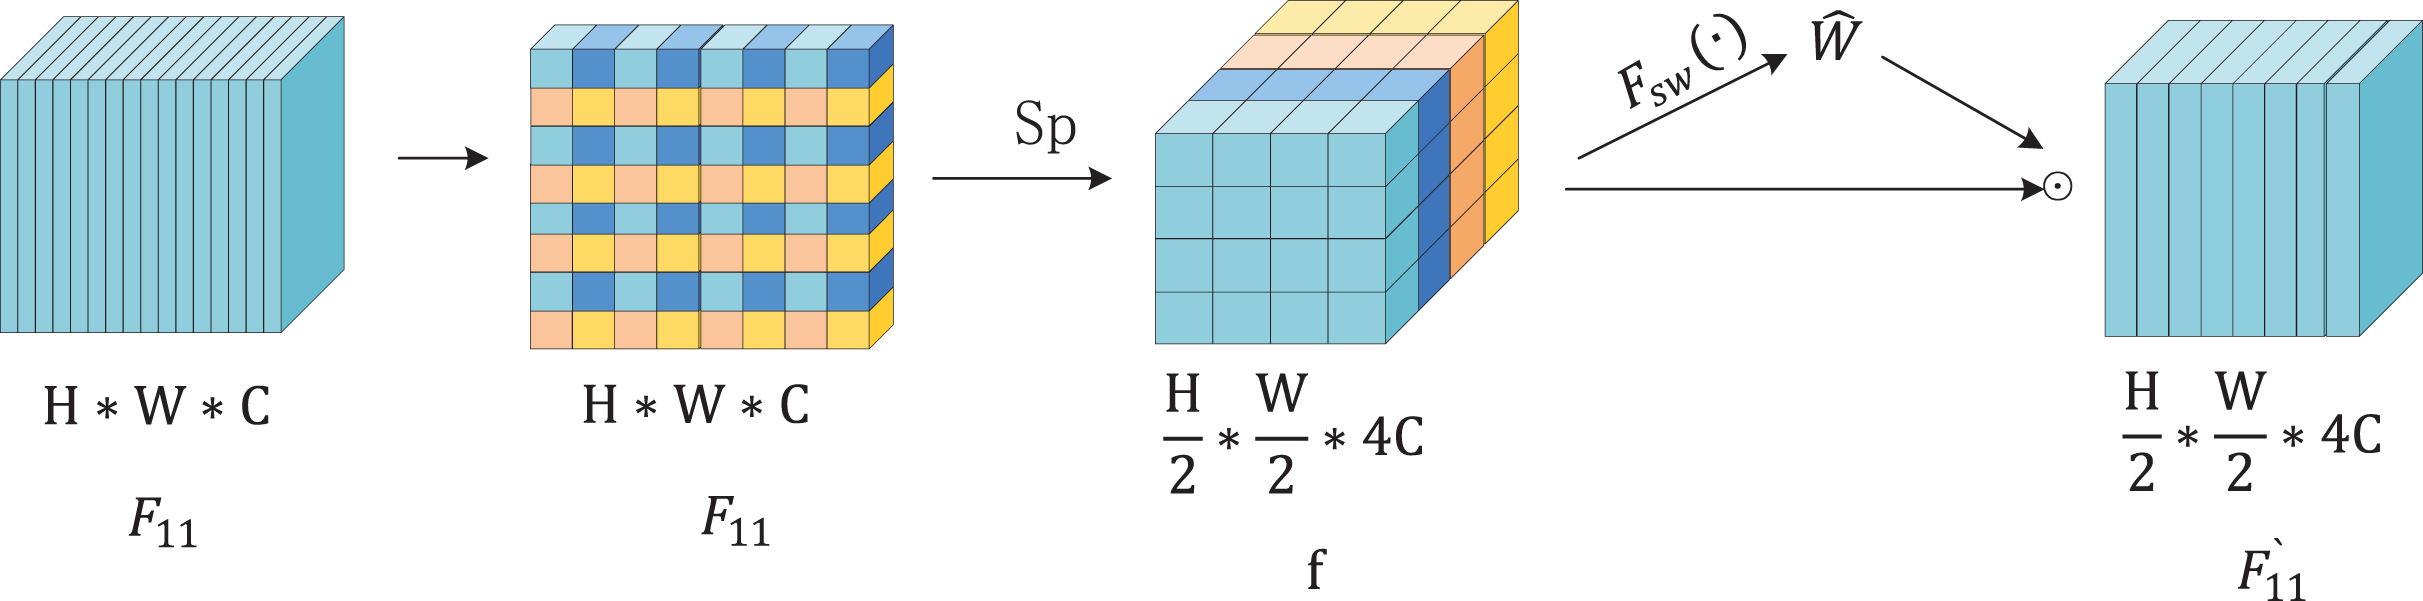
To detect objects of varying sizes effectively within a single image, YOLOv8 generates multi-scale feature maps via downsampling and upsampling operations that capture both shallow and deep semantic information. Shallow features, extracted by fewer convolutional layers, preserve high resolution and fine details. Deep features, obtained through multiple convolutional layers, provide a larger receptive field and richer global context. However, deep feature extraction can cause loss of detail, and YOLOv8’s downsampling convolution may underutilize shallow features. To mitigate these issues, the Spatial Slicing Downsampling (SSD) module is introduced as a replacement for the conventional downsampling convolution in YOLOv8. SSD enhances feature fusion across different scales. As shown in Fig. 3, the SSD module first applies a 3 × 3 convolution to the input feature map. The extracted features are then split into two branches: one is downsampled via the Spatial Pyramid Block (SPBlock), while the other is downsampled using a 3 × 3 convolution. The outputs of these branches are fused to produce the final feature map. Figure 4 depicts the SPBlock structure, which improves feature fusion by spatially slicing the feature map and calculating importance weights for each channel. This design allows the SSD module to better utilize shallow and intermediate features, improving both detection accuracy and efficiency.
(1)
(2)
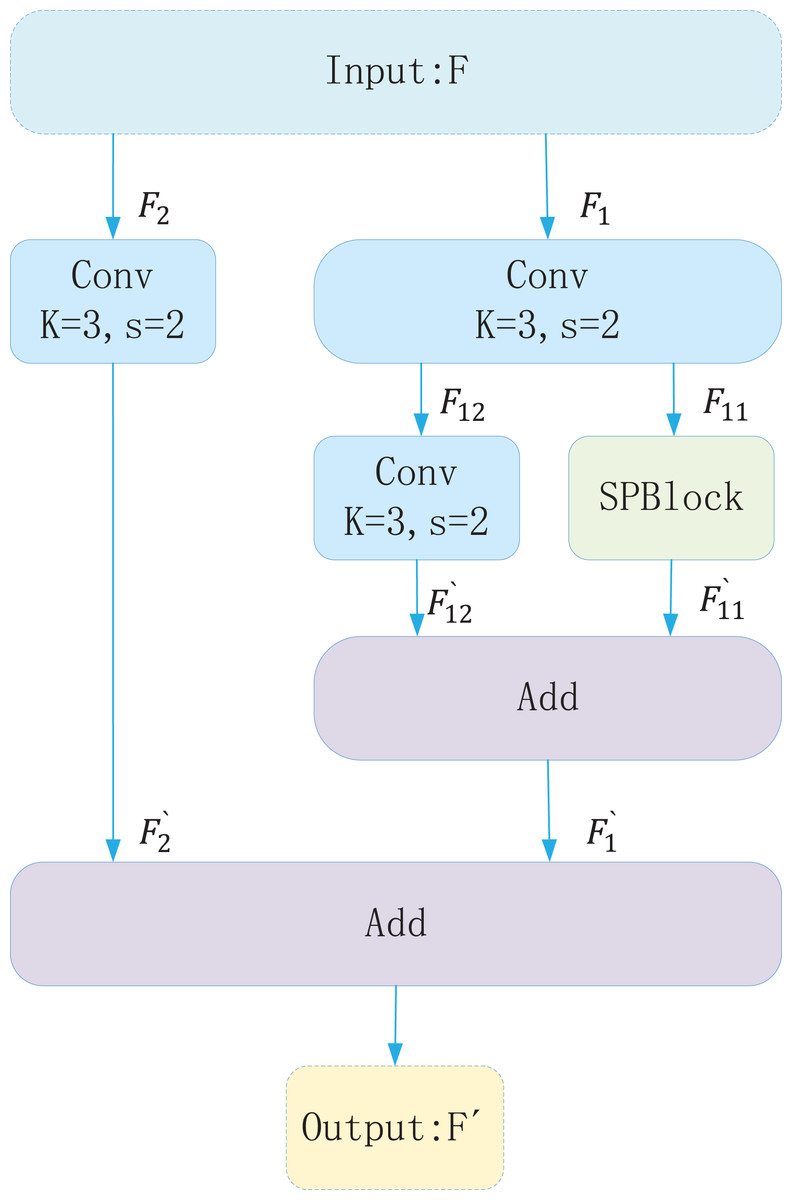
Figure 3: Structure of spatial slicing downsampling (SSD).
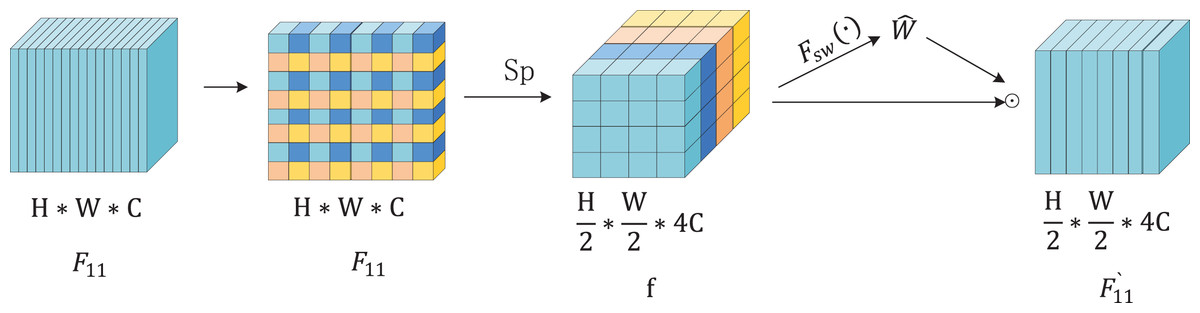
Figure 4: Structure of the SPBlock model.
Multi-channel fusion upsampling
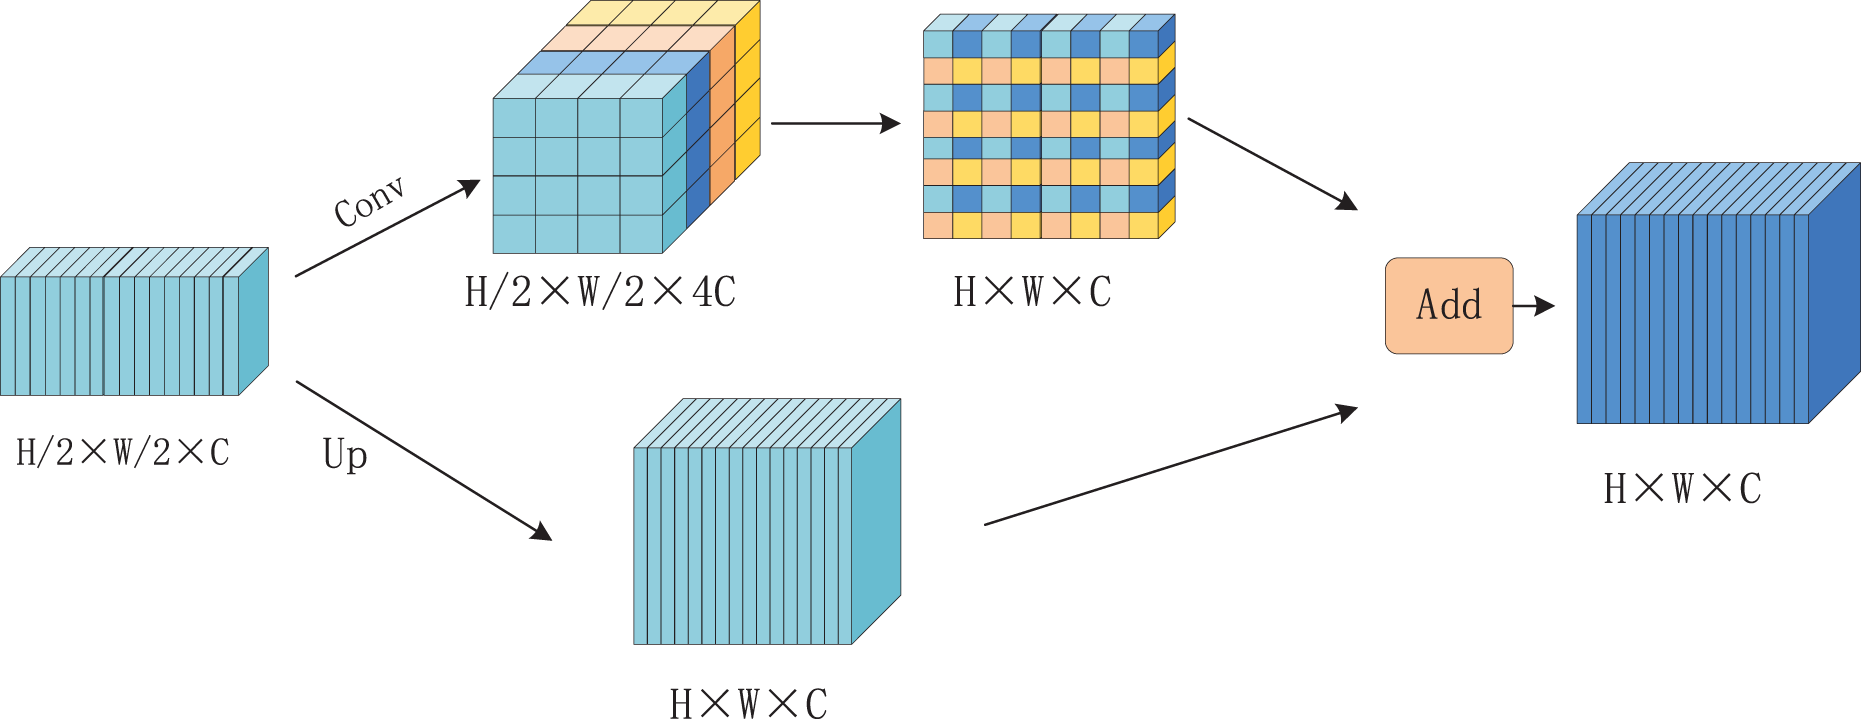
Up-sampling is a common technique used to increase image resolution, thereby expanding the field of view and enhancing feature utilization. However, traditional up-sampling methods often fail to fully preserve detailed information in feature maps, which can result in the loss of critical features. To address this limitation, a novel up-sampling module called Multichannel Fusion Upsampling (MUP) is proposed, inspired by the SSD module. MUP improves the retention of semantic information in the upsampled feature maps. As illustrated in Fig. 5, the MUP module operates in two steps. First, the input feature maps undergo a 1 × 1 convolution to increase the channel dimensions, quadrupling the number of channels. The expanded features are then spliced together. Simultaneously, the original input features are directly upsampled to produce another feature map. Finally, these two feature maps are element-wise summed to generate the output of the MUP module.
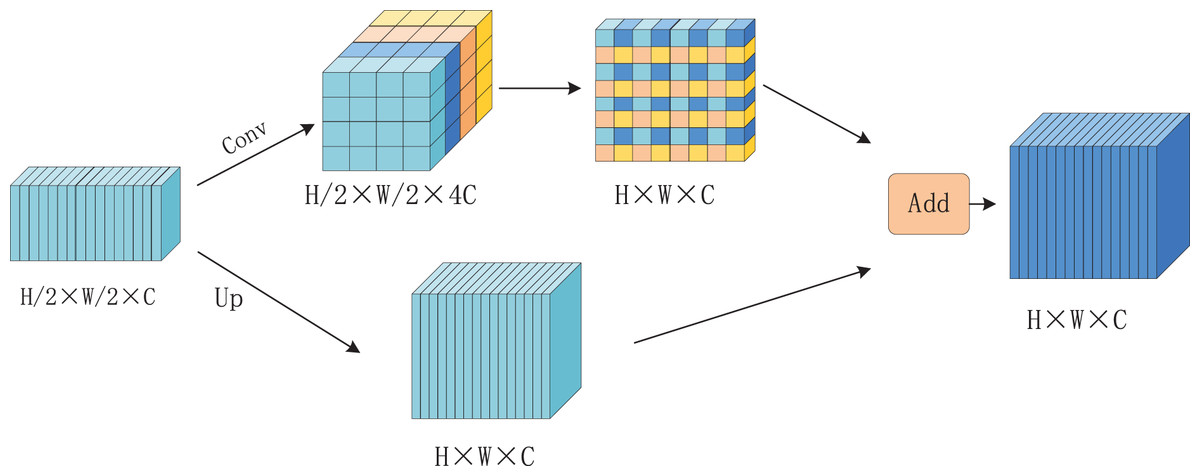
Figure 5: Multi-channel fusion upsampling (MUP) structure flowchart.
MFConv
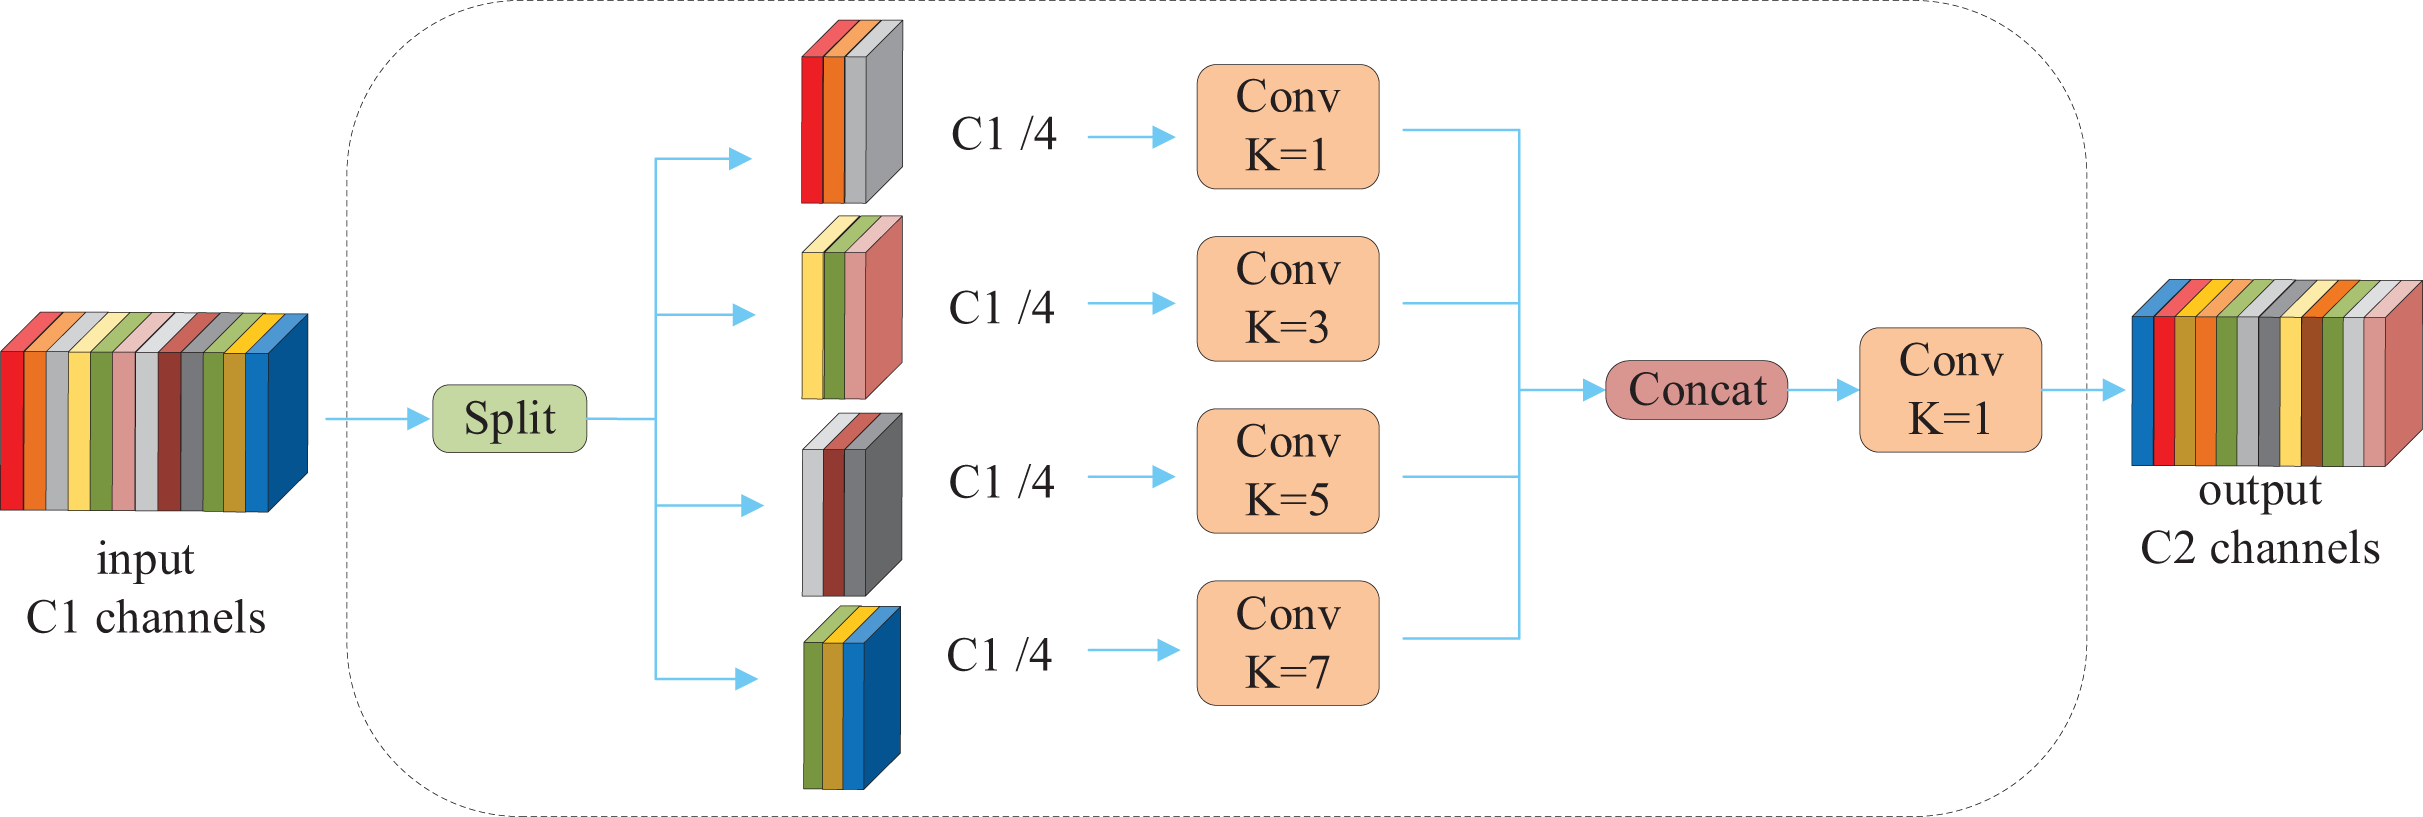
Convolutional kernels of varying sizes differ in their capacity to extract image features. Smaller kernels excel at capturing fine local details, while larger kernels encompass broader global features. However, the use of large convolutional kernels increases computational complexity, leading many models to avoid them and consequently neglect global feature extraction. To address this issue, the MFConv convolution module is proposed, with its structure depicted in Fig. 6. MFConv divides the input feature map channels into four groups and applies convolutional kernels of different sizes (1 × 1, 3 × 3, 5 × 5, and 7 × 7) to each group separately. The introduction of large kernels expands the receptive field and enhances the model’s ability to capture long-range dependencies. To ensure that features extracted by different kernels share the same spatial dimensions, bottleneck and anti-bottleneck operations are employed to adjust the features, aligning their size with that of the 3 × 3 convolution output. After concatenating the adjusted features, a 1 × 1 convolution is applied to unify the channel dimensions and facilitate information interaction across different scales. This design enables MFConv to simultaneously capture fine-grained local features and broad global features, thereby improving the model’s expressive power. To mitigate the increased parameter count caused by large kernels, MFConv incorporates grouped convolution inspired by ShuffleNet. This grouping reduces the number of parameters while maintaining computational efficiency.
(3) (4)
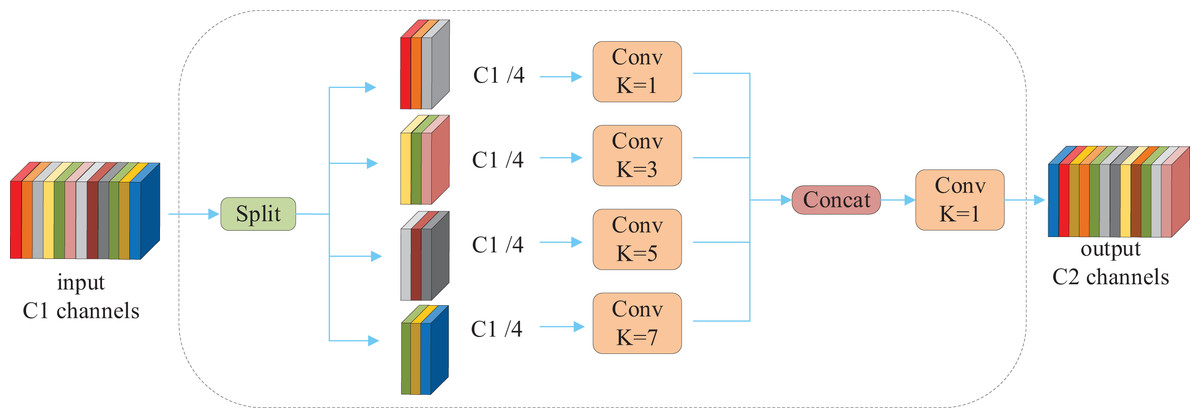
Figure 6: Structure of the MFConv multi-scale fusion convolution.
denotes the result after segmentation of input features.
Multi-scale shared decoupled detection header (MSDhead)
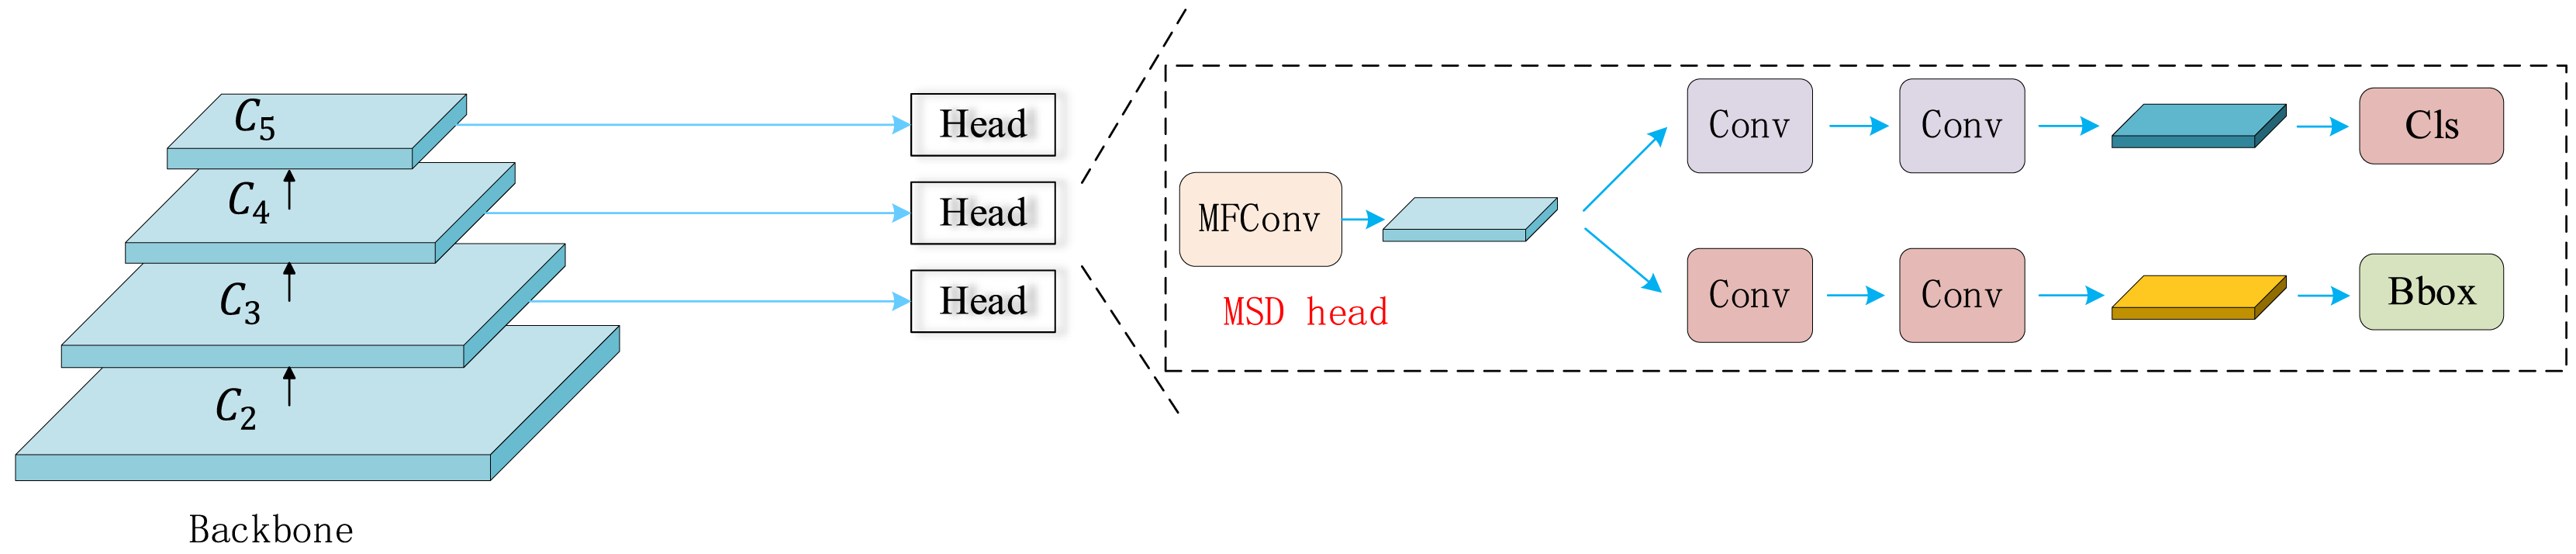
In the YOLO family, the detection head is primarily responsible for recognizing targets at multiple scales to capture multi-scale information from the input image. YOLOv8 introduces an improved detection head that decouples classification and localization tasks, using separate convolutional layers to extract features for each task. However, this design substantially increases the number of convolutional layers, resulting in higher model parameters and computational cost. To address this issue, we propose the Multi-scale shared decoupled detection header (MSDhead)—a multiscale shared convolutional detection head. The innovation of MSDHead lies in its parameter-sharing strategy, which effectively fuses feature representations for classification and localization tasks, thereby avoiding redundant computations and reducing memory usage. The architecture of MSDHead is illustrated in Fig. 7. Unlike traditional designs, MSDHead employs a shared convolutional head for both tasks, reducing the number of convolutional layers and significantly improving computational efficiency. Specifically, input features first pass through the MFConv module to capture multi-scale information. This is followed by a 3 × 3 convolution to extract high-level features. Finally, a 1 × 1 convolution is applied separately for classification and localization. By sharing convolutional parameters, MSDHead effectively lowers computational complexity and eliminates redundant operations, achieving a better balance between model performance and resource consumption.
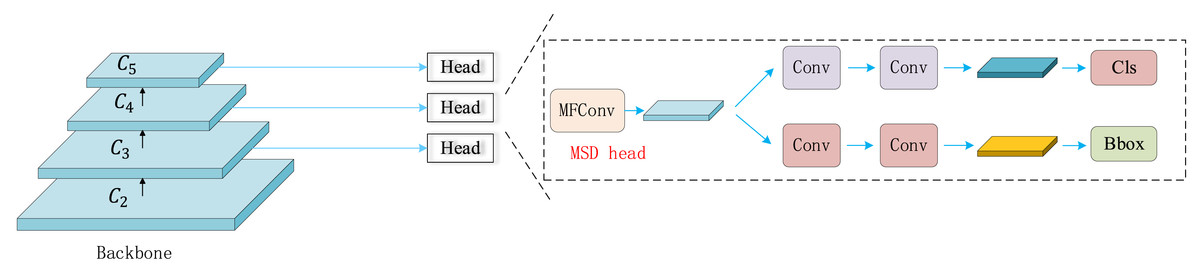
Figure 7: Structure of the MSDhHead.
The detection head of SSC-YOLO extracts distinct features for classification and localization through two separate convolutional layers. This decoupling enables the model to learn task-specific representations effectively. The corresponding loss function is presented in Eq. (5):
(5) where and are the branches of categorization and localization, respectively, c stands for class label, and B stands for bounding box. The specific expressions of and are shown in Eqs. (6) and (7), where and are the feature projection functions used for categorization and localization, and and are the last layers of categorization and localization, respectively, which decode the features into the categorization scores and bounding-box position information.
(6)
(7)
Experiment
Environment, assessment indicators, and hyperparameters
Experiments were conducted on Windows 10 using PyTorch 1.3.1, CUDA 12.2, and Python 3.9.13. The hardware included 16 GB of RAM and an NVIDIA GeForce RTX 3060 graphics card with 12 GB memory. Detailed experimental results are shown in Table 2.
| Name | Parameter |
|---|---|
| System | Windows 10 |
| Memory | 16G |
| Graphics | NVIDIA GeForce RTX 3060 |
| Framework | Pytorch1.13.1 |
| Python | 3.9.12 |
To ensure experiment consistency, all experiments were conducted under identical conditions. Evaluation metrics included P (precision), R (recall), AP, , , , and , and the expressions were as in Eqs. (8), (9), (10), (11):
(8)
(9)
(10)
(11)
To ensure experimental consistency, all evaluations were performed under identical conditions. The following metrics were used to assess the model’s performance: precision measures the proportion of true positive predictions among all positive predictions. It indicates how accurate the model is when predicting an object’s presence. High precision means few false positives. Recall (or sensitivity) measures the proportion of true positives among all actual positives in the dataset. It reflects the model’s ability to detect objects. High recall means most objects are correctly identified. Average precision (AP) summarizes the precision-recall curve into a single score, providing a comprehensive evaluation across different thresholds. calculates the average precision at an Intersection over Union (IoU) threshold of 0.5, a common benchmark for object detection. represents average precision at IoU of 0.75. computes the average precision across IoU thresholds from 0.5 to 0.95, reflecting robustness across varying detection accuracies. , , and evaluate average precision for small, medium, and large objects, respectively, highlighting performance across object sizes. Here, TP denotes true positives, FP false positives, and FN false negatives. mAP is the mean average precision across all classes.
In this study, hyperparameters were carefully designed and tuned to ensure reproducibility and optimize model performance. The initial learning rate was set to 0.01 (lr0 = 0.01), with a decay factor of 0.01 (lrf = 0.01). Momentum was set to 0.937, and weight decay to 0.0005, balancing convergence speed and preventing overfitting. A warm-up strategy of three epochs (warmup_epochs = 3.0) was applied, with calibrated loss weights to balance bounding box regression, classification, and pose detection tasks. For data augmentation, Hue, Saturation, Value (HSV) color-domain transformations and geometric transformations (such as rotation, translation, and scaling) were used. Mosaic enhancement (mosaic = 1.0) was also applied to increase data diversity. More complex methods like mixup and copy_paste were avoided. These hyperparameters were refined through multiple experimental iterations to improve model performance and generalization across datasets, ensuring stable and reproducible results.
Introduction to the dataset
To evaluate the effectiveness of the proposed improvements, we conducted ablation experiments on the PASCAL VOC 2007 and RDD2022 datasets. The VOC 2007 dataset contains 21,503 images across 20 categories. We applied data augmentation techniques (e.g., random rotation, flipping, and cropping) and Gaussian filtering for denoising. The dataset was split into 16,551 training and 4,952 validation images, with 5-fold cross-validation performed to enhance reliability. A fixed random seed (1234) ensured reproducibility. The RDD2022 dataset includes 47,420 road images from six countries, labeled with over 55,000 instances of road damage. As this study focuses on Chinese road conditions, only the 4,378 images from the China subset were used (see Fig. 8).
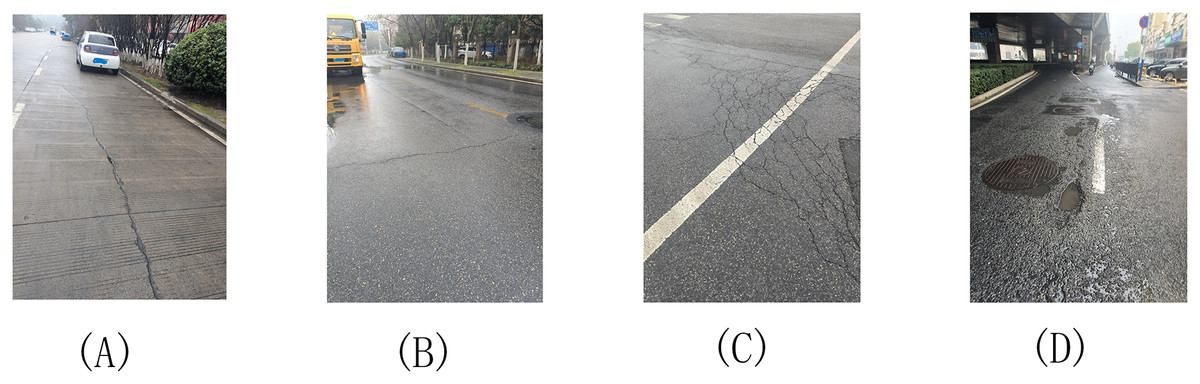
Figure 8: Defect types.
(A) Longitudinal cracks (D00), (B) Transverse cracks (D10), (C) Alligator cracks (D20), (D) Potholes (D40).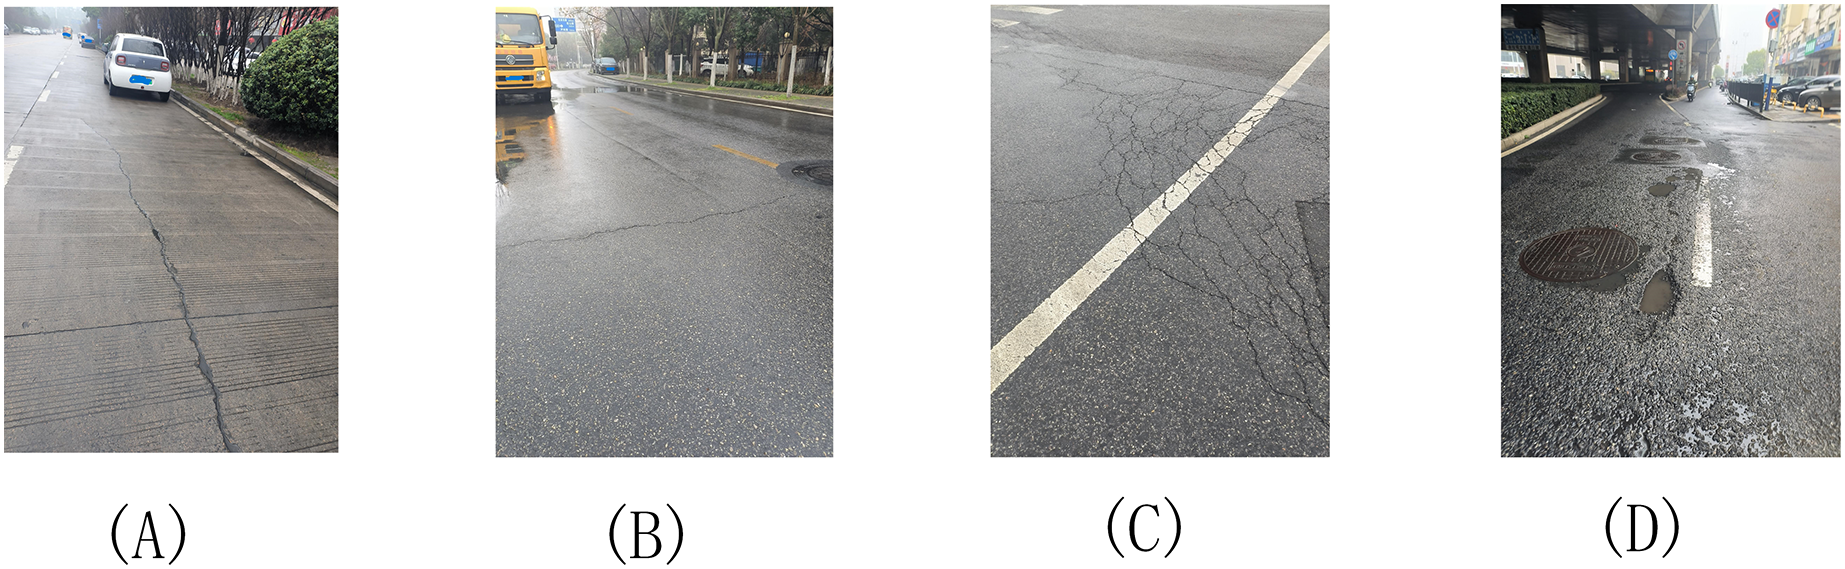
To evaluate the model’s generalization ability, the dataset was split into 80% training and 20% testing. Additionally, five-fold cross-validation was performed, where training and testing sets were randomly selected in each round to ensure evaluation stability and reliability. A fixed random seed (1234) was used to enhance reproducibility. The data processing workflow is illustrated in Fig. 9.

Figure 9: The flowchart for the processing of the data.
Post-processing steps
To improve the accuracy, consistency, and practical usability of the detection results, several post-processing steps were applied after the initial YOLOv8 output. These steps refine predictions, remove redundancy, and enhance robustness. First, Non-Maximum Suppression (NMS) was used to eliminate overlapping bounding boxes referring to the same defect. In dense pavement scenarios, NMS retains only the box with the highest confidence score, reducing false positives and improving localization accuracy. Second, a confidence threshold (e.g., 0.3) was set to filter out low-confidence detections, suppressing background noise and improving overall precision. Finally, all valid detections were saved in JSON format, including defect category, bounding box coordinates, confidence score, and image ID. Annotated images with labeled bounding boxes were also generated for visualization and performance assessment. Together, these post-processing steps enhance the reliability of the system and ensure that reported metrics reflect real-world applicability in pavement inspection tasks.
Comparison of the effect of different detection head
To further validate the lightweight design and performance of the proposed detection head, we conducted a comparative evaluation with several mainstream detection heads on the PASCAL VOC 2007 dataset. As shown in Tables 3 and 4, MSDhead exhibits significantly fewer parameters, lower computation, and smaller model size compared to YOLOv8 and Dynamic Head (DyHead) (Wang, Gao & Jia, 2024). Although its size is slightly larger than that of Large-Scale Convolutional Detection (LSCD) (Dai et al., 2021), MSDhead outperforms LSCD in detection accuracy, demonstrating its superior balance between model compactness and performance.
| Mold | Parame/MB | FLOPs/GB | Model size/MB |
|---|---|---|---|
| YOLOv8 | 11.48 | 8.1 | 6.0 |
| YOLOv8 + DyHead | 13.31 | 9.6 | 6.9 |
| YOLOv8 + LSCD | 9.02 | 6.5 | 4.7 |
| YOLOv8 + MSDHead | 11.13 | 6.4 | 5.8 |
| Mold | AR | ||||||
|---|---|---|---|---|---|---|---|
| YOLOv8 | 0.740 | 0.781 | 0.634 | 0.576 | 0.183 | 0.384 | 0.641 |
| YOLOv8 + DyHead | 0.759 | 0.806 | 0.661 | 0.604 | 0.282 | 0.410 | 0.678 |
| YOLOv8 + LSCD | 0.743 | 0.780 | 0.632 | 0.571 | 0.166 | 0.381 | 0.636 |
| YOLOv8 + MSDHead | 0.748 | 0.789 | 0.651 | 0.589 | 0.184 | 0.395 | 0.657 |
Ablation experiment
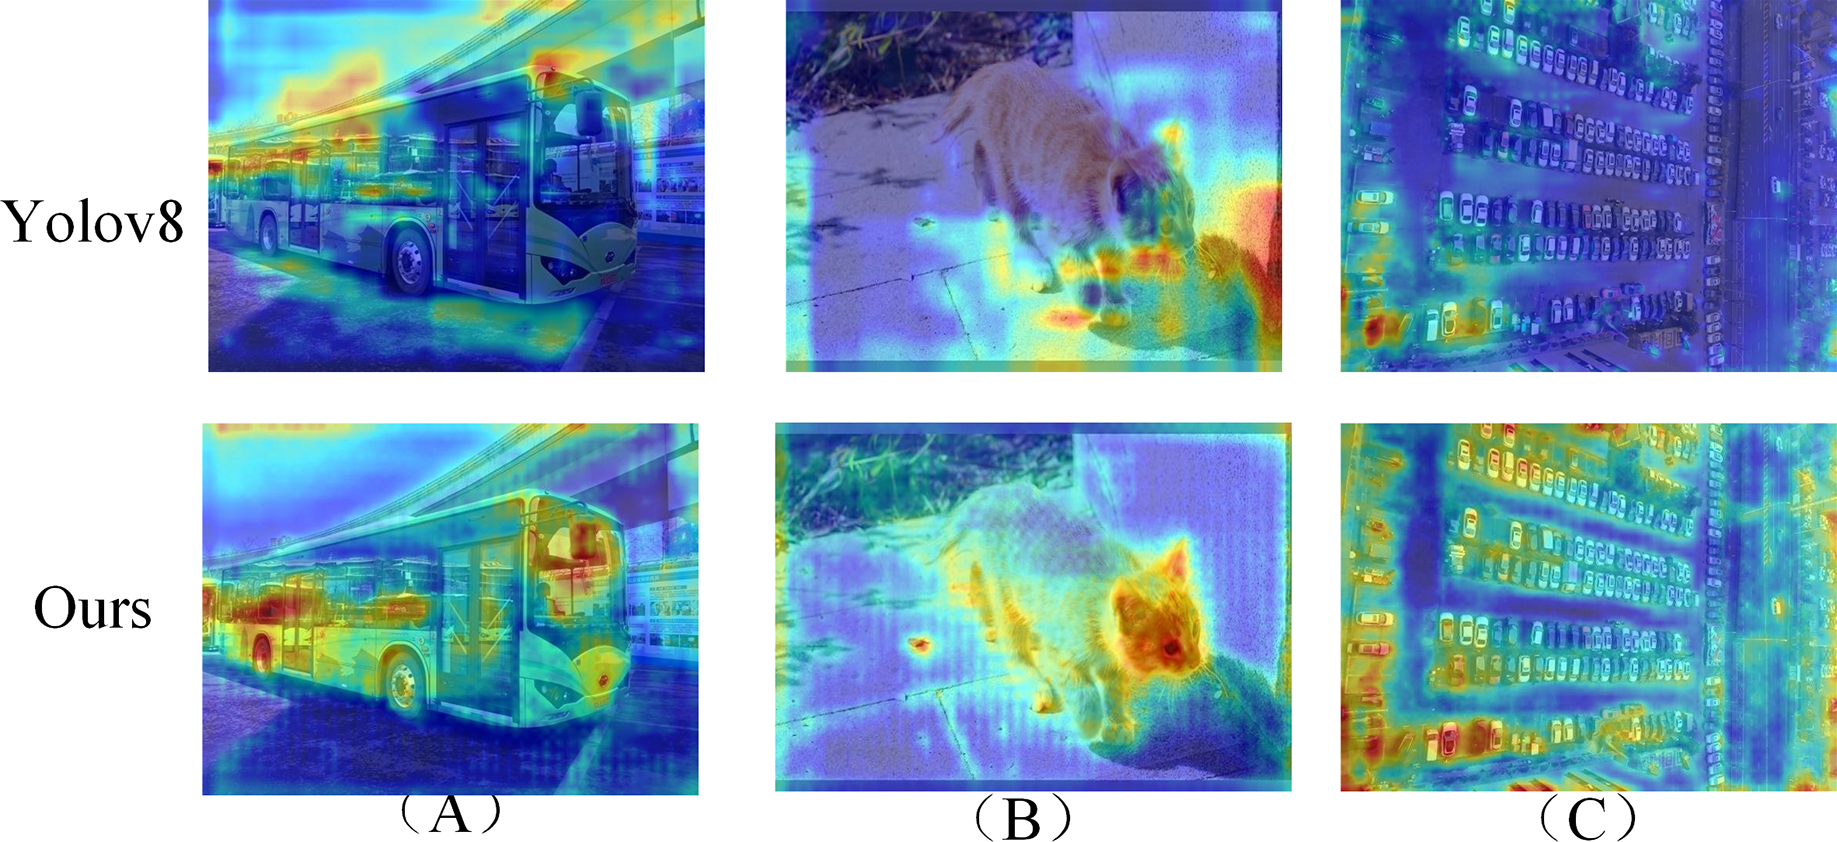
To evaluate the contribution of each module, ablation experiments were conducted on the PASCAL VOC 2007 dataset. As shown in Table 5, the proposed SSC-YOLO model outperformed the baseline YOLOv8 by 1.6%, 1.7%, 2.1%, 3.0%, 2.0%, and 3.2% in avarage recall (AR), , , , , and , respectively. These improvements demonstrate the model’s superior performance, particularly in large object detection and inference speed, owing to its enhanced feature extraction capabilities and optimized structure. To further validate feature learning effectiveness, feature visualization analysis was performed, as illustrated in Fig. 10. In (A), the model effectively focuses on relevant targets while suppressing background noise, improving overall detection precision. In (B), the extracted features provide a clearer and more complete outline of objects, contributing to better expressiveness and localization accuracy. In (C), SSC-YOLO demonstrates a clear advantage in detecting small objects compared to YOLOv8, highlighting the strength of its multi-scale feature extraction strategy. These results confirm that the integration of SSD, MUP, and multi-scale convolution modules enhances both the accuracy and robustness of the model, making it well-suited for detecting pavement defects across varying object sizes and complexities.
| Mold | AR | ||||||
|---|---|---|---|---|---|---|---|
| YOLOv8 | 0.740 | 0.781 | 0.634 | 0.576 | 0.183 | 0.384 | 0.641 |
| YOLOv8 + SSD | 0.758 | 0.793 | 0.660 | 0.599 | 0.191 | 0.470 | 0.669 |
| YOLOv8 + MUP | 0.747 | 0.793 | 0.654 | 0.591 | 0.186 | 0.401 | 0.657 |
| YOLOv8 + MFConv | 0.744 | 0.788 | 0.645 | 0.580 | 0.184 | 0.392 | 0.647 |
| YOLOv8 + MSDHead | 0.748 | 0.789 | 0.651 | 0.589 | 0.184 | 0.395 | 0.657 |
| SSC-YOLO | 0.761 | 0.803 | 0.663 | 0.608 | 0.213 | 0.409 | 0.678 |
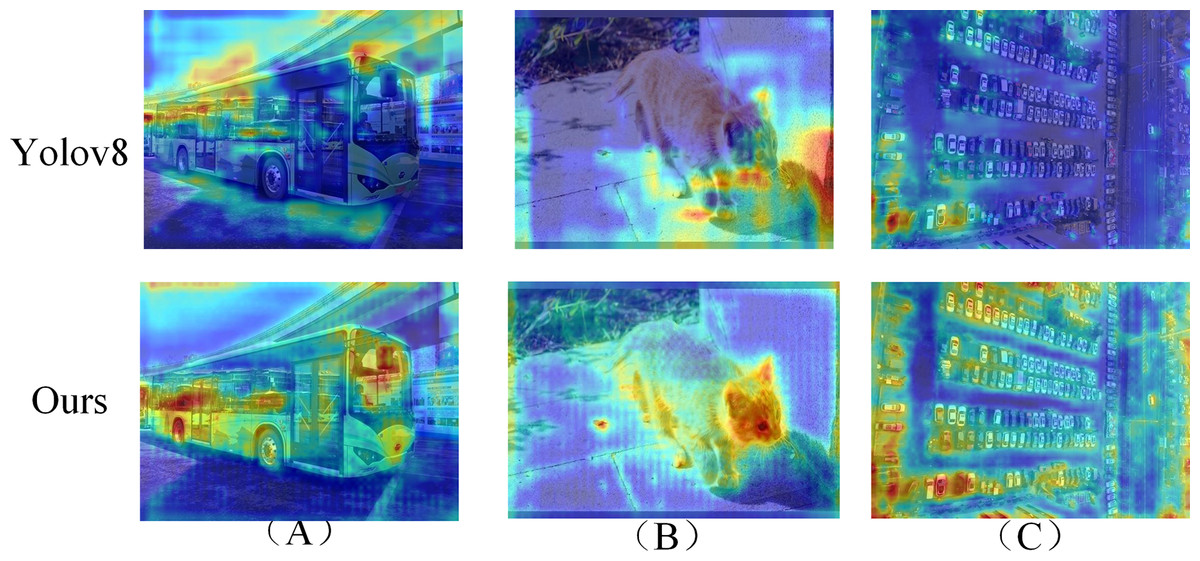
Figure 10: Comparison chart of feature extraction effect.
Comparative tests on different datasets
To evaluate the generalization ability of SSC-YOLO, comparative experiments were conducted on multiple datasets. As shown in Table 6, SSC-YOLO consistently outperformed other detection models on the PASCAL VOC 2007 benchmark across all evaluation metrics, particularly in AR and . However, its performance in recall and small object detection ( ) was slightly lower than that of the Pixel-wise Anchor Attention (PAA) (Kim & Lee, 2020) and Adaptive Training Sample Selection (ATSS) (Zhang et al., 2020) models. This can be attributed to the design differences: PAA employs a complex path aggregation mechanism that enhances small object recall through finer feature fusion, albeit at the cost of slower inference and higher computational overhead. Similarly, ATSS achieves better small object detection via advanced feature fusion and receptive field design, but its intricate structure results in a significant increase in inference time. In contrast, SSC-YOLO maintains a favorable balance between detection accuracy and real-time performance, making it more suitable for time-sensitive applications.
| Mold | AR | ||||||
|---|---|---|---|---|---|---|---|
| YOLOv8 | 0.740 | 0.781 | 0.634 | 0.576 | 0.183 | 0.384 | 0.641 |
| ATSS | 0.687 | 0.657 | 0.532 | 0.475 | 0.362 | 0.317 | 0.532 |
| FASTER-RCNN | 0.574 | 0.663 | 0.462 | 0.442 | 0.152 | 0.263 | 0.475 |
| RTMDET | 0.764 | 0.708 | 0.589 | 0.525 | 0.218 | 0.317 | 0.580 |
| TOOD | 0.701 | 0.697 | 0.574 | 0.519 | 0.229 | 0.331 | 0.571 |
| PAA | 0.857 | 0.737 | 0.602 | 0.541 | 0.215 | 0.400 | 0.589 |
| YOLOx | 0.677 | 0.790 | 0.614 | 0.549 | 0.260 | 0.402 | 0.593 |
| YOLOv9 SSC-YOLO | 0.761 | 0.803 | 0.663 | 0.608 | 0.213 | 0.409 | 0.678 |
To further validate the model’s performance, we conducted comparison experiments on the RDD2022 dataset, as shown in Table 7. The results confirm the superiority of SSC-YOLO in large object detection and inference speed. The integration of SSD downsampling and MUP upsampling improves training efficiency and mitigates gradient vanishing, while the multiscale shared decoupled detection head reduces parameter count and boosts speed via parameter sharing. The decoupled structure also enhances the model’s ability to focus on relevant features, thereby improving detection accuracy. However, SSC-YOLO performs slightly below Faster R-CNN and Real-Time Multi-scale Detector (RTMDet) (Lyu et al., 2022) for small and medium-sized objects. This can be attributed to the relatively lightweight architecture of SSC-YOLO, which may limit its ability to capture fine-grained details, especially when distinguishing small targets from complex backgrounds. In contrast, Faster R-CNN utilizes a two-stage detection process with high-resolution feature refinement and strong contextual modeling, making it particularly effective for small object detection. Similarly, RTMDet benefits from a more sophisticated backbone and multiscale processing, leading to better performance on medium-sized objects in cluttered scenes. Although SSC-YOLO incorporates multiscale feature fusion to enhance small-object handling, it still lags behind two-stage models in scenarios requiring high spatial resolution and detailed context. These results suggest that while SSC-YOLO excels in speed and large-object detection, further structural enhancements may be needed to improve performance on smaller targets.
| Mold | AR | ||||||
|---|---|---|---|---|---|---|---|
| YOLOv8 | 0.658 | 0.872 | 0.575 | 0.538 | 0.395 | 0.457 | 0.633 |
| ATSS | 0.591 | 0.739 | 0.381 | 0.399 | 0.431 | 0.392 | 0.458 |
| FASTER-RCNN | 0.564 | 0.813 | 0.453 | 0.451 | 0.464 | 0.388 | 0.555 |
| PAA | 0.624 | 0.770 | 0.477 | 0.440 | 0.475 | 0.383 | 0.557 |
| RTMDET | 0.618 | 0.875 | 0.487 | 0.483 | 0.424 | 0.481 | 0.556 |
| TOOD | 0.583 | 0.801 | 0.482 | 0.444 | 0.410 | 0.409 | 0.542 |
| YOLOx | 0.547 | 0.868 | 0.415 | 0.461 | 0.394 | 0.455 | 0.437 |
| YOLOv3 | 0.535 | 0.640 | 0.323 | 0.342 | 0.233 | 0.362 | 0.324 |
| YOLOv5 | 0.597 | 0.670 | 0.391 | 0.386 | 0.242 | 0.385 | 0.362 |
| YOLOv6 | 0.593 | 0.683 | 0.387 | 0.373 | 0.280 | 0.358 | 0.344 |
| SSC-YOLO | 0.671 | 0.883 | 0.552 | 0.545 | 0.435 | 0.471 | 0.640 |
Visualization of road defect detection results and analysis
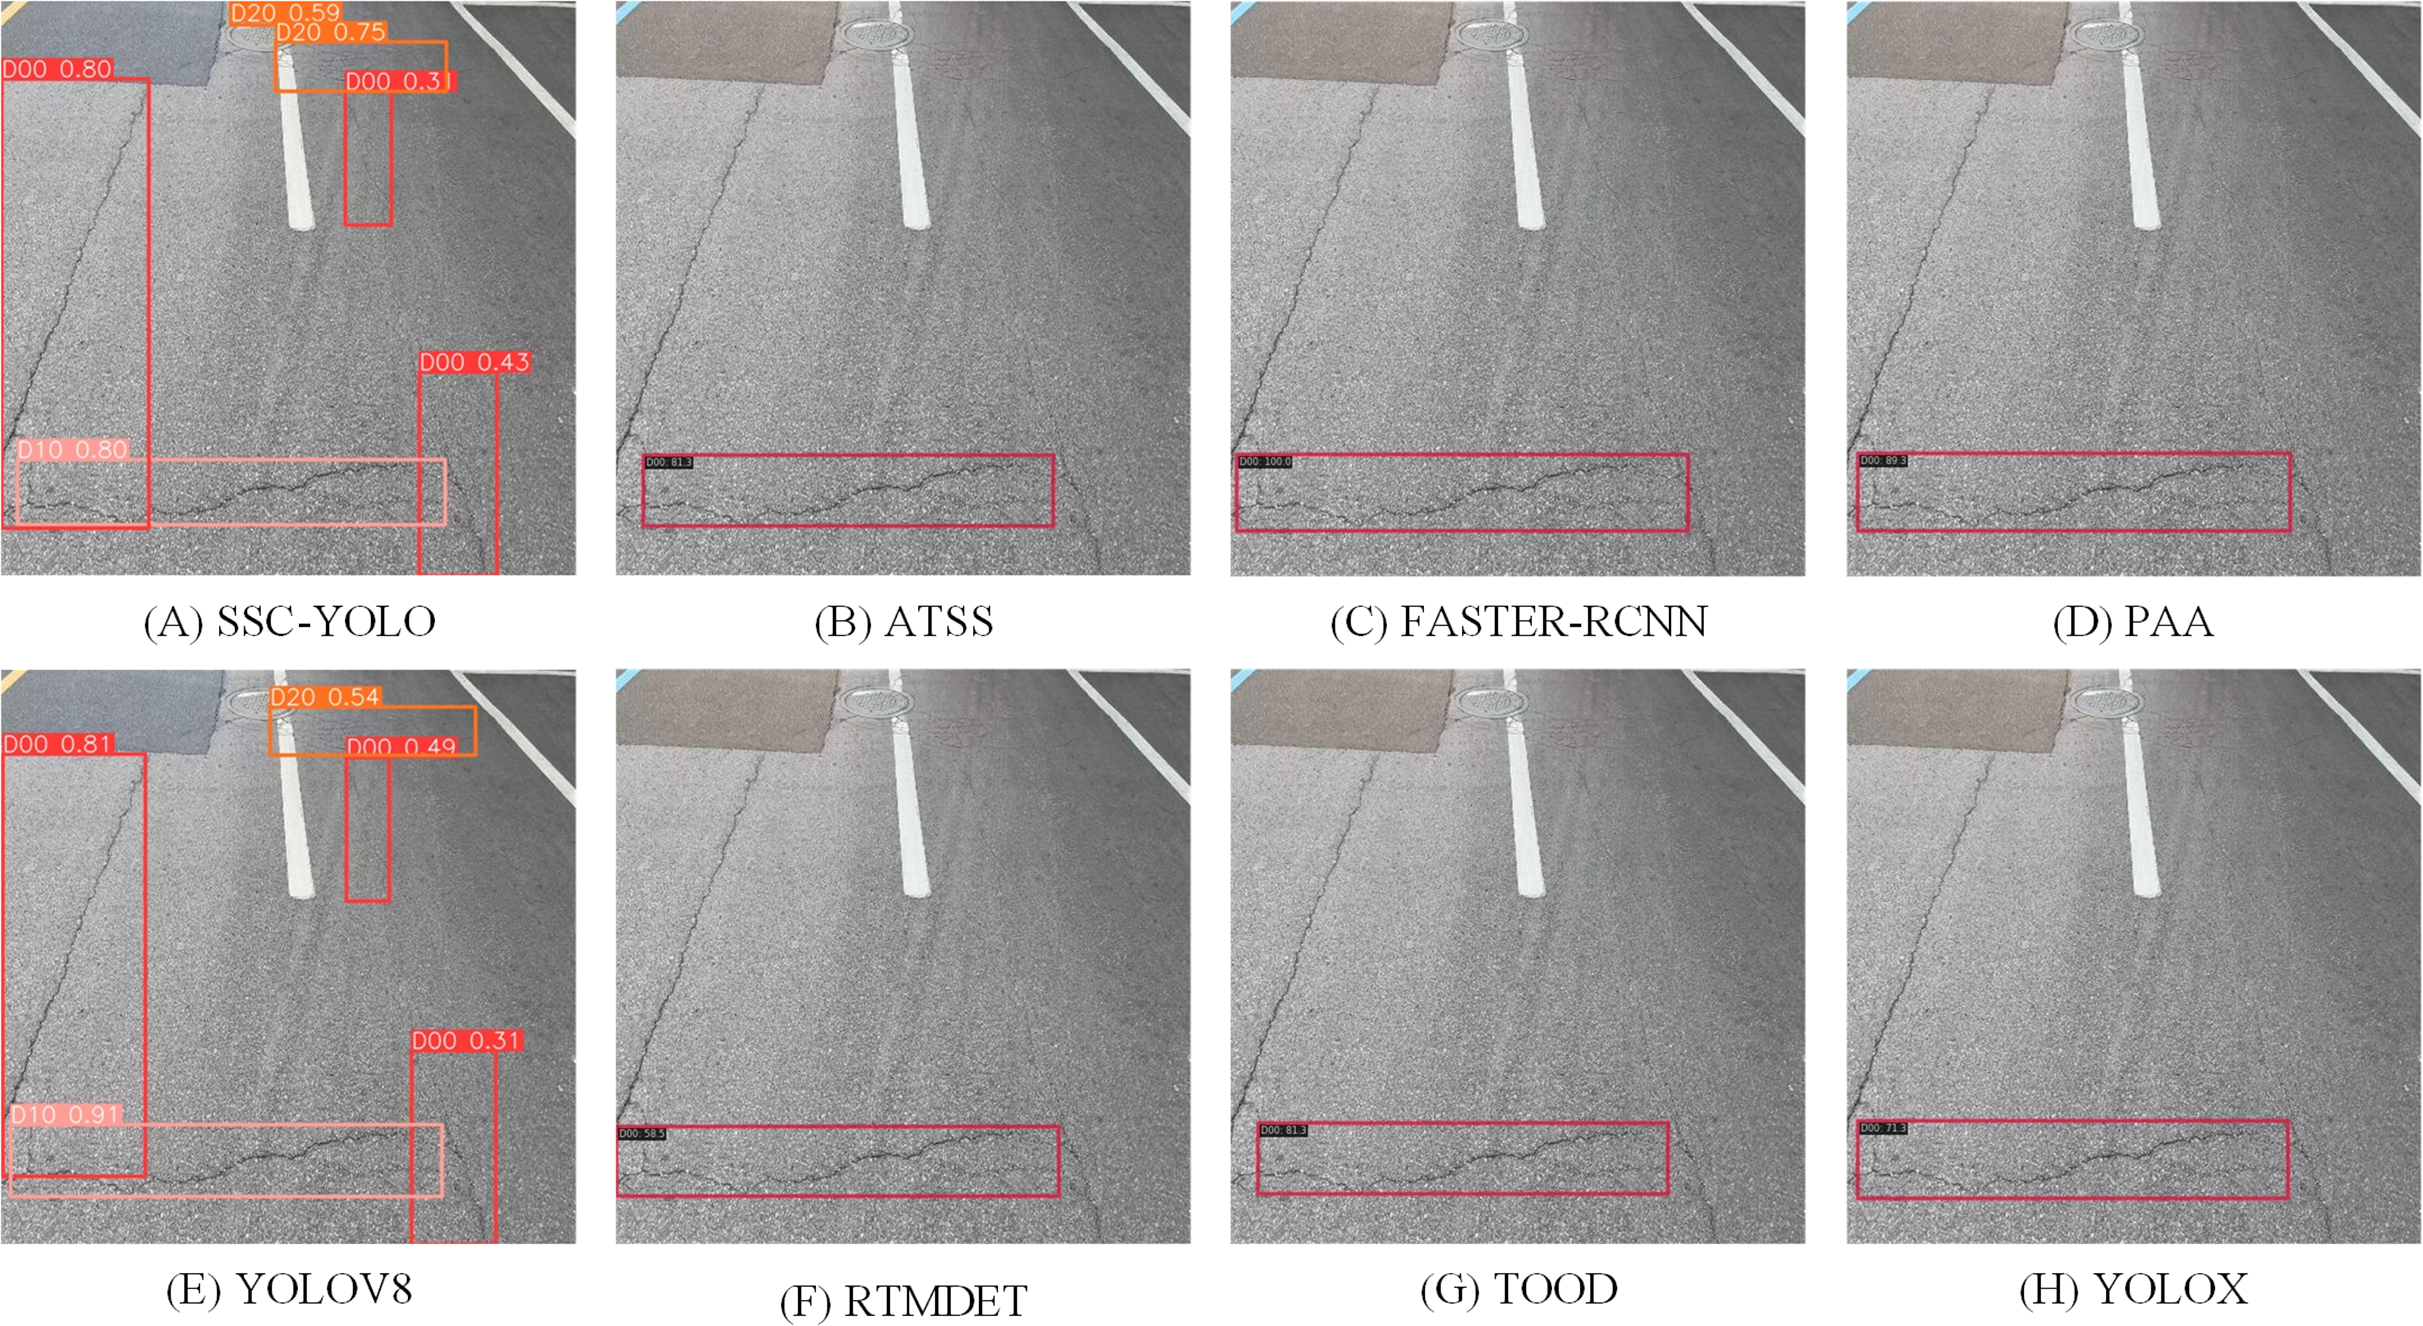
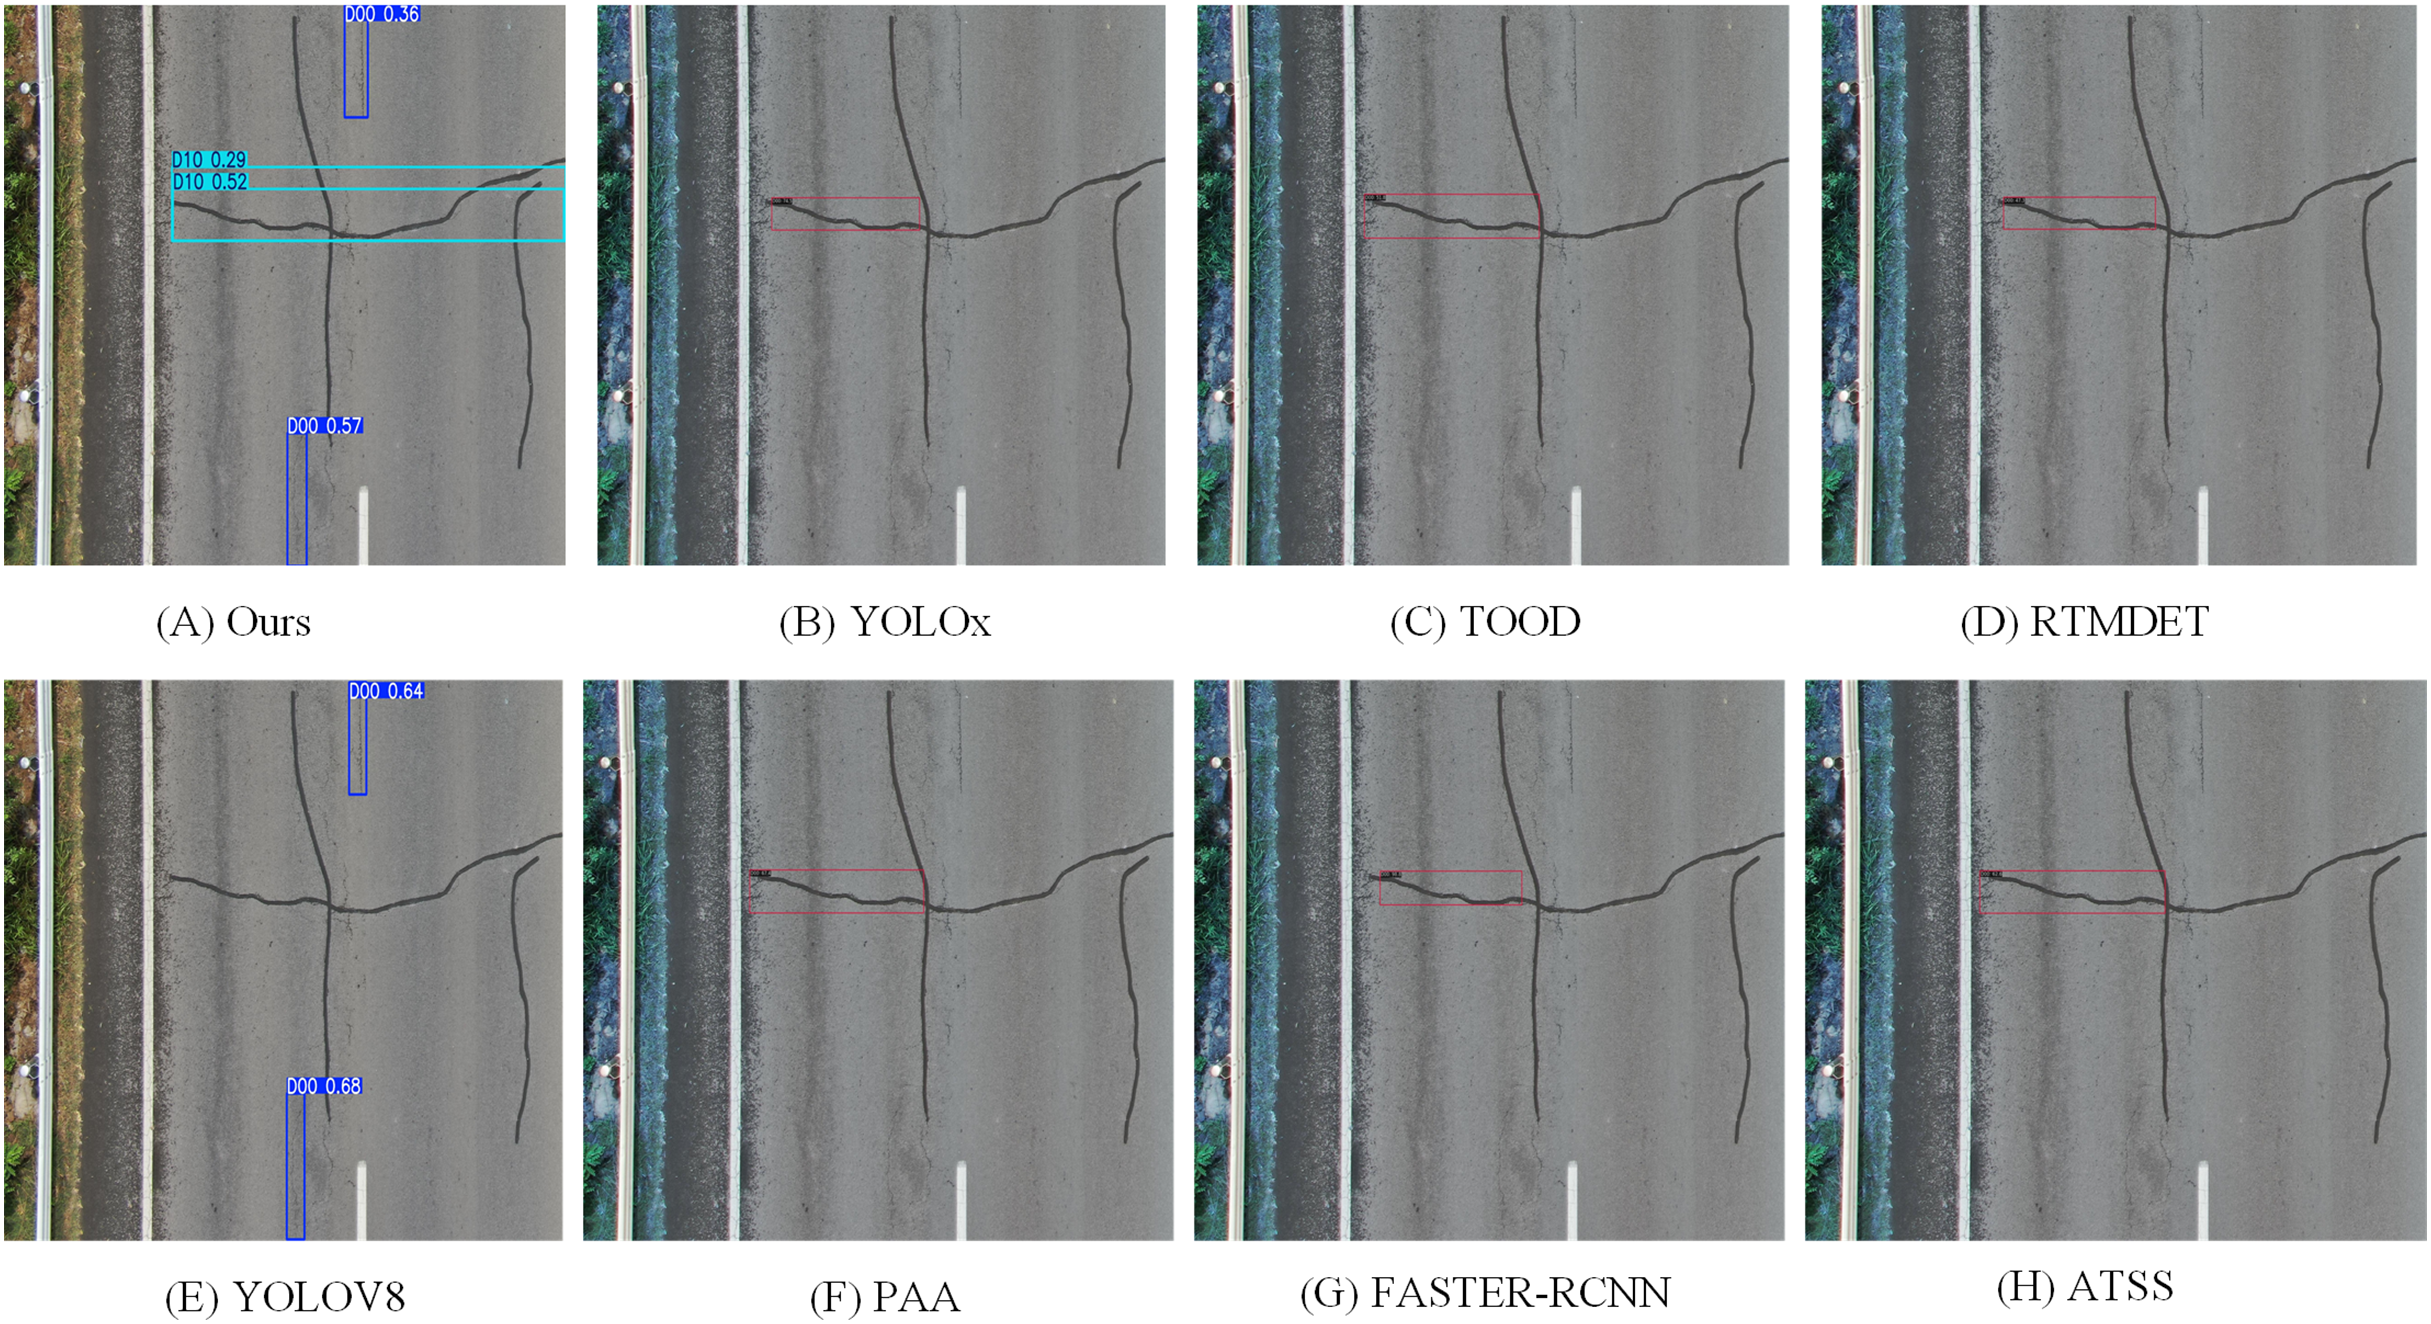
To assess the model’s practical detection capability, we conducted a visual comparison between SSC-YOLO and several mainstream detection models. As shown in Fig. 11, a sample image captured from a vehicle-mounted camera was used for evaluation. The results indicate that SSC-YOLO successfully identifies all road surface defects without omission, whereas the other models fail to detect all instances. Moreover, models such as YOLOv8 and Faster R-CNN exhibit redundant detections of the same defect, further highlighting SSC-YOLO’s superior precision and robustness. Figure 12 presents the detection results from a UAV perspective. While all models, including YOLOv8, fail to detect defects completely, and the PAA model shows repeated detections of the same defect, SSC-YOLO maintains accurate and efficient performance without false or missed detections. Combined with the results from the vehicle-mounted view, these findings demonstrate that SSC-YOLO consistently outperforms other models in detection accuracy, false positive suppression, and robustness across diverse scenarios, thereby reinforcing its effectiveness in real-world applications.
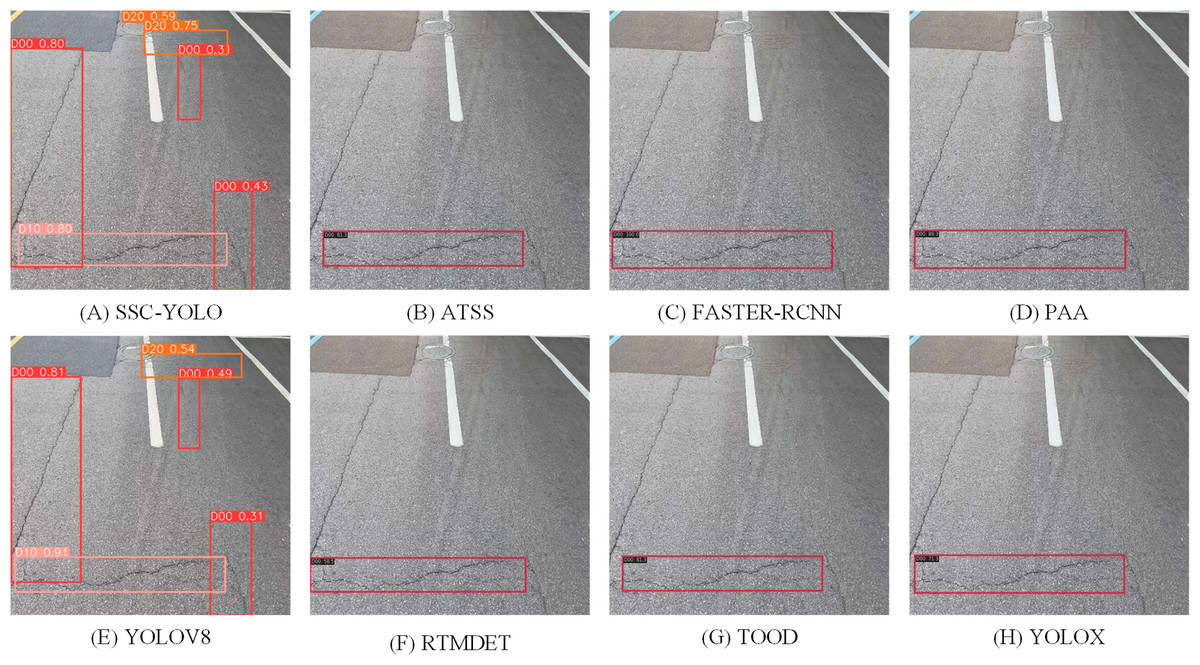
Figure 11: Visualization results of different detection models.
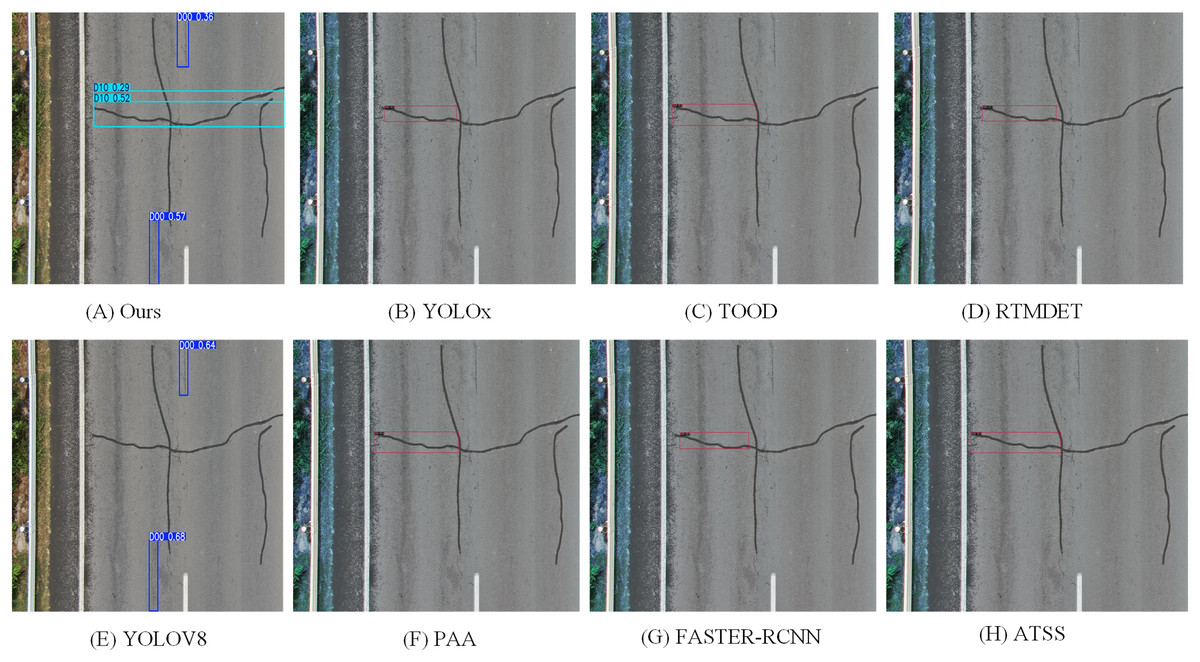
Figure 12: Visualization results of different detection models.
Materials and Methods
The source code is available at https://github.com/xioxiowang/SSC-YOLO.git, and the datasets can be accessed from https://github.com/sekilab/RoadDamageDetector.git. The PASCAL VOC 2007 dataset contains 21,503 images across 20 object categories, including 16,551 training images and 4,952 validation images. The RDD2022 dataset consists of 47,420 road images from six countries (Japan, India, the Czech Republic, Norway, the USA, and China), annotated with over 55,000 instances of four defect types: longitudinal cracks, transverse cracks, alligator cracks, and potholes. Given the focus on applications in China, only the 4,378 Chinese images from the RDD2022 dataset were used, with an 80:20 split for training and testing. To ensure data quality and improve model performance, the following preprocessing steps were applied to both datasets: Data cleaning: duplicate images were removed, and samples with missing annotations were discarded. Data augmentation: techniques such as rotation, flipping, scaling, and cropping were applied to enhance diversity and robustness. Dataset splitting: PASCAL VOC 2007 was divided into training and validation sets (80:20), while the selected Chinese subset of RDD2022 followed the same ratio. Normalization: all images were normalized to the [0, 1] pixel value range to accelerate model convergence. These steps ensured dataset integrity and contributed to more effective and stable model training.
Conclusions
To address traffic congestion and safety issues caused by pavement defects, this work significantly improves detection accuracy and model efficiency. The main contributions are summarized as follows:
(1) We propose a novel SSD downsampling method that better preserves original feature information, enabling more accurate extraction of semantic details and improving classification performance. (2) We introduce multi-scale convolution using large kernels to capture features at different scales, which expands the receptive field and enhances robustness in handling objects of varying sizes. (3) To reduce YOLOv8’s computational complexity, we design the MFConv module, which facilitates interaction between shallow and deep feature layers, strengthening the model’s ability to manage complex scenarios. (4) A parameter-sharing detection head is implemented, improving detection accuracy while reducing memory usage and overall model complexity.
Limitations
Despite the advancements, SSC-YOLO still faces some limitations that warrant further investigation. Its performance under varying lighting conditions and noisy environments remains a challenge, potentially affecting accuracy and robustness. Additional experiments are needed to evaluate and improve the model’s adaptability in real-world scenarios. Future research will focus on the following directions: (1) enhancing real-world performance by improving robustness in low-light and noisy conditions, and validating the model on practical pavement datasets. (2) Addressing deployment challenges, including reducing inference time and resource usage for large-scale autonomous inspection systems. (3) Improving detection robustness through advanced data augmentation and adversarial training methods.
By tackling these challenges, SSC-YOLO can be further optimized for real-time, large-scale pavement defect detection across diverse operational environments.