
Enhancing healthcare data privacy and interoperability with federated learning
- Published
- Accepted
- Received
- Academic Editor
- Ana Maguitman
- Subject Areas
- Artificial Intelligence, Cryptography, Data Mining and Machine Learning, Security and Privacy, Internet Of Things
- Keywords
- Artificial intelligence, Data interoperability, Federated learning, Internet of Things, Distributed & parallel computing, Emerging technologies, Scientific computing & simulation, Data science, Data mining & machine learning, Wearable sensors
- Copyright
- © 2025 Akhmetov et al.
- Licence
- This is an open access article distributed under the terms of the Creative Commons Attribution License, which permits using, remixing, and building upon the work non-commercially, as long as it is properly attributed. For attribution, the original author(s), title, publication source (PeerJ Computer Science) and either DOI or URL of the article must be cited.
- Cite this article
- 2025. Enhancing healthcare data privacy and interoperability with federated learning. PeerJ Computer Science 11:e2870 https://doi.org/10.7717/peerj-cs.2870
Abstract
This article explores the application of federated learning (FL) with the Fast Healthcare Interoperability Resources (FHIR) protocol to address the underutilization of the huge volumes of healthcare data generated by the digital health revolution, especially those from wearable sensors, due to privacy concerns and interoperability challenges. Despite advances in electronic medical records, mobile health applications, and wearable sensors, current digital health cannot fully exploit these data due to the lack of data analysis and exchange between heterogeneous systems. To address this gap, we present a novel converged platform combining FL and FHIR, which enables collaborative model training that preserves the privacy of wearable sensor data while promoting data standardization and interoperability. Unlike traditional centralized learning (CL) solutions that require data centralization, our platform uses local model learning, which naturally improves data privacy. Our empirical evaluation demonstrates that federated learning models perform as well as, or even numerically better than, centralized learning models in terms of classification accuracy, while also performing equally well in regression, as indicated by metrics such as accuracy, area under the curve (AUC), recall, and precision, among others, for classification, and mean absolute error (MAE), mean squared error (MSE), and root mean square error (RMSE) for regression. In addition, we developed an intuitive AutoML-powered web application that is FL and CL compatible to illustrate the feasibility of our platform for predictive modeling of physical activity and energy expenditure, while complying with FHIR data reporting standards. These results highlight the immense potential of our FHIR-integrated federated learning platform as a practical framework for future interoperable and privacy-preserving digital health ecosystems to optimize the use of connected health data.
Introduction
The digitalization of the modern world has led to major technological advances that impact various aspects of human life. Today, many devices are interconnected via the Internet in a network called the Internet of Things (IoT) (Aledhari et al., 2022). Connectivity not only improves functionality but also revolutionizes the way we interact with technology on a daily basis. These networks help solve many problems, with healthcare being a major sector requiring cutting-edge solutions and specific care (Famá, Faria & Portugal, 2022). The digitalization of healthcare opens immense opportunities for improving the quality of life through electronic mobile health applications, medical imaging, medical records, low-cost genetic sequencing, and the diffusion of sensors and wearable devices (Lehne et al., 2019; Gupta & Gupta, 2019). Combined with emerging technologies such as artificial intelligence (AI), big data analytics and cloud computing, this wealth of digital health data promises to improve the lives of millions of patients worldwide (Lehne et al., 2019). An individual can achieve digitalization of healthcare by using wearable devices that allow the user to measure their weight, calories, sleep, exercise, heart rate, body temperature, and other vital signs (White, Liang & Clarke, 2019; Pardamean et al., 2020; Sharma & Rani, 2021). Today, the wearable technology market is in a golden period, and therefore they are very economical (White, Liang & Clarke, 2019; Pardamean et al., 2020; Akdevelioglu, Hansen & Venkatesh, 2021). This has allowed many people interested in digitally tracking their health and behavior for personal improvement through self-tracking to form a community of enthusiasts known as the Quantified Self (QS) (White, Liang & Clarke, 2019; Akdevelioglu, Hansen & Venkatesh, 2021; Liang, 2022). This term generally encompasses anything that can be measured (Sharma & Rani, 2021). Recently, growing academic interest in machine learning has given rise to an interdisciplinary research field called personal informatics. This field necessitates the collaboration of various disciplines, encompassing consumer informatics, health informatics, ubiquitous computing, and human-computer interaction (HCI) (Liang, 2022).
Despite the rapid evolution of connected objects, analyzing large amounts of QS data remains a challenge. QS practice remains primarily focused on data collection, while data analysis is limited to basic visualization and correlation analysis (Liang, 2022). More effective use of a large amount of collected QS data requires machine learning (ML) algorithms (Sharma & Rani, 2021). However, a significant portion of medical data lacks interoperability. It is stored in isolated databases, hosted in incompatible systems, and enmeshed in proprietary software, making it difficult to share, analyze, and interpret. Current healthcare systems use varied data formats, individualized specifications, and unclear meanings. This hinders the development of technologies that rely on this data, such as machine learning, AI, and big data (Lehne et al., 2019; Xu et al., 2021). Therefore, data interoperability is essential to fully harness the capabilities of smart, interconnected healthcare, which has the potential to improve patient outcomes and reduce costs (Seneviratne, 2023).
Syntactic interoperability ensures that data from diverse sources, including sensors and wearable devices, follow a standard format, which is critical to facilitate seamless integration and analysis. Using standardized data formats through the adoption of protocols such as Fast Healthcare Interoperability Resources (FHIR), healthcare systems can share and use patient data more effectively. Such standardization allows machine learning models to receive and process precise and detailed datasets. The benefits of such interoperability extend beyond data integration; it also significantly enhances the predictive capabilities of ML algorithms as well as the scalability and reliability of Federated Learning (FL). This is because FL models can be trained on varied datasets from different institutions without infringing on data privacy. Syntactic interoperability is therefore at the heart of the successful deployment of machine learning and AI in healthcare, serving as the critical bridge between heterogeneous data sources and holistic, actionable intelligence.
This study compares FL and centralized learning (CL), leading to the development of a web application for predictive analysis of data from sensors and mobile devices, interoperable in a clinical setting. It involves the analysis of multiple datasets through the application of machine learning algorithms trained using federated and centralized methods. The results are evaluated using appropriate metrics to propose a solution that improves data interoperability. The main objectives of this research are to improve the ability of healthcare systems to effectively manage and analyze data, thereby improving the quality of care and operational efficiency through the integration of advanced AI technologies.
Our proposed system significantly improves the performance and privacy of wearable IoT sensors by adopting federated learning for decentralized processing. This approach avoids the centralization of sensitive data, thus improving privacy and interoperability. The main objective of our approach is to reduce the vulnerabilities associated with centralizing sensitive patient records for analytics. Furthermore, the proposed solution combines FL and FHIR to extract valuable insights from dispersed health data without centralizing all patient information. This is a key distinction from traditional centralized learning and a significant privacy improvement in the healthcare context. Additionally, it supports real-time applications that use both real and synthetic data, ensuring compliance with FHIR standards, which promotes more dynamic and secure interactions within health technology systems.
The main contributions of this study are summarized as follows: We developed and validated an innovative application that uses AutoML to train machine learning models on interoperable healthcare data, using both FL and CL. This advancement improves data privacy and interoperability within healthcare systems. Our study provides an in-depth comparative analysis of FL and CL, evaluating their performance and effectiveness. Furthermore, it presents an an intuitive tool for healthcare professionals to optimize and personalize patient care through cutting-edge AI technology.
The remainder of this article is organized into several sections for in-depth analysis. “Related Works” reviews the existing literature, focusing on key subtopics such as connected objects and IoT, Quantified Self, electronic medical records, and federated learning. “Methodology” details the programming stack used and describes the implementation process of the proposed solution. “Simulation Setup and Evaluation” presents the results, including a comparative analysis of the evaluation indicators of models trained with CL and FL. Finally, “Conclusion” summarizes the entire study, highlighting the critical need to address interoperability challenges in the healthcare sector through the application of FL, and also explores the implications for future research in this area.
Related works
This section covers several critical topics, including wearable devices and IoT, Quantified Self, electronic health records, and federated learning. There are a number of studies on the distributed intelligence in smart cities (Hashem et al., 2024) and healthcare using FL and FHIR (Naithani et al., 2024). Hashem et al. (2024) highlight the improvement in efficiency and functionality of smart cities by integrating distributed intelligence in IoT with a wide range of architectures, methodologies and applications. Similarly, Naithani et al. (2024) highlight the key challenges of implementing FL in healthcare, such as data heterogeneity, computational resources, and regulatory compliance. These technologies are fundamental to a comprehensive understanding of the problems to be solved and crucial to designing effective solutions.
Wearable devices and IoT
Just as the Internet and smartphones have transformed our lives, wearables and IoT devices are swiftly reshaping how we live (Lo, Ip & Yang, 2016). Today, individuals not only share photos of their activities but also detailed data such as heart rate metrics, step counts, and maps of their travel routes, all facilitated by wearable technology. Therefore, understanding the nature of IoT and wearable devices is crucial for exploring the extent of their potential applications.
Wearable biosensors, often referred to as “wearables,” represent a significant interdisciplinary effort within health services to harness mobile health (mHealth) technology for improved data collection, diagnosis, treatment monitoring, and enhanced health insights. These devices, now readily available as consumer products, are increasingly used to collect and analyze basic physiological data such as weight, calorie intake, exercise, sleep patterns, body temperature, and heart rate (White, Liang & Clarke, 2019; Pardamean et al., 2020; Sharma & Rani, 2021), and even more complex data like energy expenditure, arrhythmia, cardiovascular, continuous glucose monitoring, diabetes mellitus, and many more (Witt et al., 2019). Due to the complexity of the field, the topics researchers study vary significantly. Below, some of the applications of wearables are discussed.
Wearable health technology has been the focus of research in recent years. Witt et al. (2019) analyzes the algorithms used in popular wearable devices from 2014 to 2017, while in Dian, Vahidnia & Rahmati (2020) the authors surveys recent developments in wearable IoT. Another study Haleem et al. (2022) introduces Medical 4.0 as a significant advancement in healthcare, utilizing IoT in data collection and promoting patient-centred therapy. Pathak, Mukherjee & Misra (2023) develop SemBox, a wireless system that enhances interoperability among diverse wearable health monitoring devices. The authors of Ahmed et al. (2024) discuss the opportunities and challenges of the Internet of Medical Things (IoMT), highlighting the benefits of patient empowerment, healthcare collaboration, and data sharing. Fei & Ur-Rehman (2020) develop a low-power smart wristband that can monitor heart rate, count steps, and detect abnormal hand movements. A user-end program is also created for data analysis and presentation. In a study involving 46 participants (de la Casa Pérez et al., 2022), the Xiaomi Mi Band 4 fitness tracker is found to be accurate and precise in tracking step count and heart rate. Another study (Liang & Chapa Martell, 2018) shows that consumer sleep tracking devices such as Fitbit Charge 2 and Neuroon eye mask are good for non-clinical use, but not suitable for diagnosing sleep disorders.
Quantified-Self
Quantified-Self involves using technology to track various aspects of one’s life, such as biology, physical activity, behaviour, or environmental factors (Swan, 2013). The term ‘Quantified-Self’ was coined in 2007 by Wired writers Gary Wolf and Kevin Kelly, Kelly being the founder of the QS movement, a global community focused on self-tracking for gaining self-knowledge through data (Sharma & Rani, 2021; Akdevelioglu, Hansen & Venkatesh, 2021). Self-monitoring, measuring, and recording for self-improvement or reflection have historical roots, but the advent of digital technologies has sparked new interest and expanded the domains and applications of self-tracking. This subsection discusses the practical applications of the QS community and the potential impact it may have on improving mHealth.
Swan (2013) notes the rise of the QS movement, where individuals track various aspects of their well-being. The long-term vision is to optimize personal performance in real-time. QS encompasses quantitative and qualitative data and is evolving into a “qualified self” by tracking qualitative aspects and promoting behavior change. Another article discusses the rise of self-tracking applications and devices and how they can be used to improve personal productivity (White, Liang & Clarke, 2019). A netnographic study was conducted on the Fitbit user community to explore wearable tech’s impact on the quantified self (Akdevelioglu, Hansen & Venkatesh, 2021). The study uncovers social engagement mechanisms, such as empowering motivation and friendly rivalry, that are built on this foundation. Billis, Batziakas & Bamidis (2015) explore how seniors have integrated self-tracking, and how it can be a habitual practice. They developed a web application to visualize sensor data collected over 6 months in real-life settings. Almalki, Gray & Sanchez (2015) introduce the concept of the Personal Health Information Self-Quantification Systems (PHI-SQS) and systematically review data management processes in eleven self-quantification tools. The article suggests that self-quantification for personal health maintenance holds promise, but further research is needed to support its use in this context. Sharon (2017) studies how self-tracking devices can be used for individual health management and raise ethical concerns. The author suggests a practice-based theory for revealing diverse enactments of values by self-trackers within the QS community. Three novel recommendation methods for QS applications: Virtual Coach, Virtual Sleep Regulator, and Virtual Nurse are introduced in Erdeniz et al. (2020). The aim of these methods is to improve the health status of individuals through personalized exercise planning, considering medical history and intended health status for physical activity recommendation, and addressing sleep quality issues. Lastly, Pardamean et al. (2020) discuss recent literature on the use of wearable devices to promote physical activity, mental wellness, and health awareness.
Federated learning
Federated learning is a technological innovation in distributed learning, addressing growing concerns about data security in the era of big data. As an alternative to centralized deep learning frameworks, federated learning offers a privacy-friendly approach by avoiding large-scale data centralization. Compared to traditional machine learning solutions, federated learning allows machine learning models to be trained directly on devices. This is achieved through coordination between multiple devices, called FL clients, and a central server, called an FL aggregator, without the exchange of raw data. This approach is particularly crucial for protecting sensitive information (Yang et al., 2023).
Tyagi, Rajput & Pandey (2023) present a survey of FL, a decentralized solution for collaborative model training with data privacy guarantees. Another article (Xu et al., 2021) explains that FL can be an effective way of linking and analyzing private health data from different sources. The method can be used to solve the problems caused by privacy concerns in exchanging electronic health records among different organizations. In their work, Khan et al. (2024) propose Fed-Inforce-Fusion, a privacy-preserving FL-based Intrusion Detection System (IDS) for IoMT. The model utilizes reinforcement learning for finding relationships in medical data and federatively trains a composite IDS model on the nodes of a smart healthcare system (SHS). An FL approach to depression detection with the guarantee of patient data privacy is proposed in Gupta et al. (2022). The cluster-based model is an enhancement over conventional machine learning models and outperforms other collaborative learning approaches.
Interoperability of electronic health records
Electronic medical records (EMRs) have revolutionized the healthcare industry by establishing common standards for health data, making it easier to share. EMRs do not specify any standards, but rather standardize health information. Standardization is a prerequisite for interoperability—seamless communication between different applications without sacrificing data (Bhartiya, Mehrotra & Girdhar, 2016). EMRs consolidate patient data for efficient sharing, in accordance with ISO standards. To bridge the gap in data interoperability, various application standards, such as OpenEHR and Fast Healthcare Interoperability Resources (FHIR) (Famá, Faria & Portugal, 2022), play a vital role in IoT architectures in digital health. This subsection explores the various applications of EMRs and their importance.
Roehrs et al. (2019) propose a personal health record (PHR) interoperability model named OmniPHR that utilizes a standard ontology and AI with natural language processing (NLP) to achieve interoperability. The model is evaluated using a real database of anonymized patient records, demonstrating the feasibility of harmonizing data from various standards into a unified format. Another semantic ontology-based model that achieves interoperability in EHRs is proposed in Adel et al. (2022). The model unifies data formats, accommodating five healthcare data standards and allowing physicians to interact with diverse systems through a single interface. The integrated ontology facilitates improved patient care. Data from 68 oncology sites using five different EHR vendor products are analyzed in Bernstam et al. (2022) to quantify the interoperability of real-world EHR implementations concerning clinically relevant structured data. The results show that intra-EHR vendor interoperability is notably higher than intersystem interoperability, highlighting the lack of standardization for clinically relevant data. In Bhartiya, Mehrotra & Girdhar (2016), discuss the challenges of accessing and sharing EHR in team-based healthcare. They highlight issues related to privacy, data security, and interoperability caused by heterogeneity in EHR systems. The article identifies different approaches and challenges in achieving interoperability in EHR sharing. Evans (2016) analyzes the evolution of EHR from 1992 to 2015 and speculates on their expected state in the next 25 years. EHRs have been used for a long time, but technical, procedural, social, political, ethical, and security concerns overshadow their usage. Although current EHRs do not entirely meet the evolving needs of the healthcare landscape, emerging EHR technology will help establish international standards for interoperable applications, facilitating precision medicine and a learning health system. Daliya & Ramesh (2019) propose a hybrid approach to handle heterogeneous data from various sources in an IoT-based healthcare system. The approach extracts data meaning from diverse sources while ensuring uniformity in data format, contributing to enhanced data interoperability. Another study (Khalique, Khan & Nosheen, 2019) proposes a framework for managing public healthcare data based on standardized protocols. It utilizes EHR at basic health facilities, consolidates data from multiple sources, and incorporates contextual information using HL7 as an interoperability standard. Researchers from Italy developed a national IT platform for the interoperability of EHR systems (Silvestri et al., 2019). They introduce a Big Data architecture for EHR that offers valuable insights for healthcare professionals, patients, and decision-makers.
In contrast to earlier research, the current study stands out because it aims to achieve interoperability by employing FL architecture and EHR protocol. The proposed architecture functions not just with refined datasets but also with wearable devices.
Methodology
This section describes the design and implementation of the system, which includes data sources (agents), a FHIR server, a web user interface, and an FL server.
System design: centralized vs federated learning
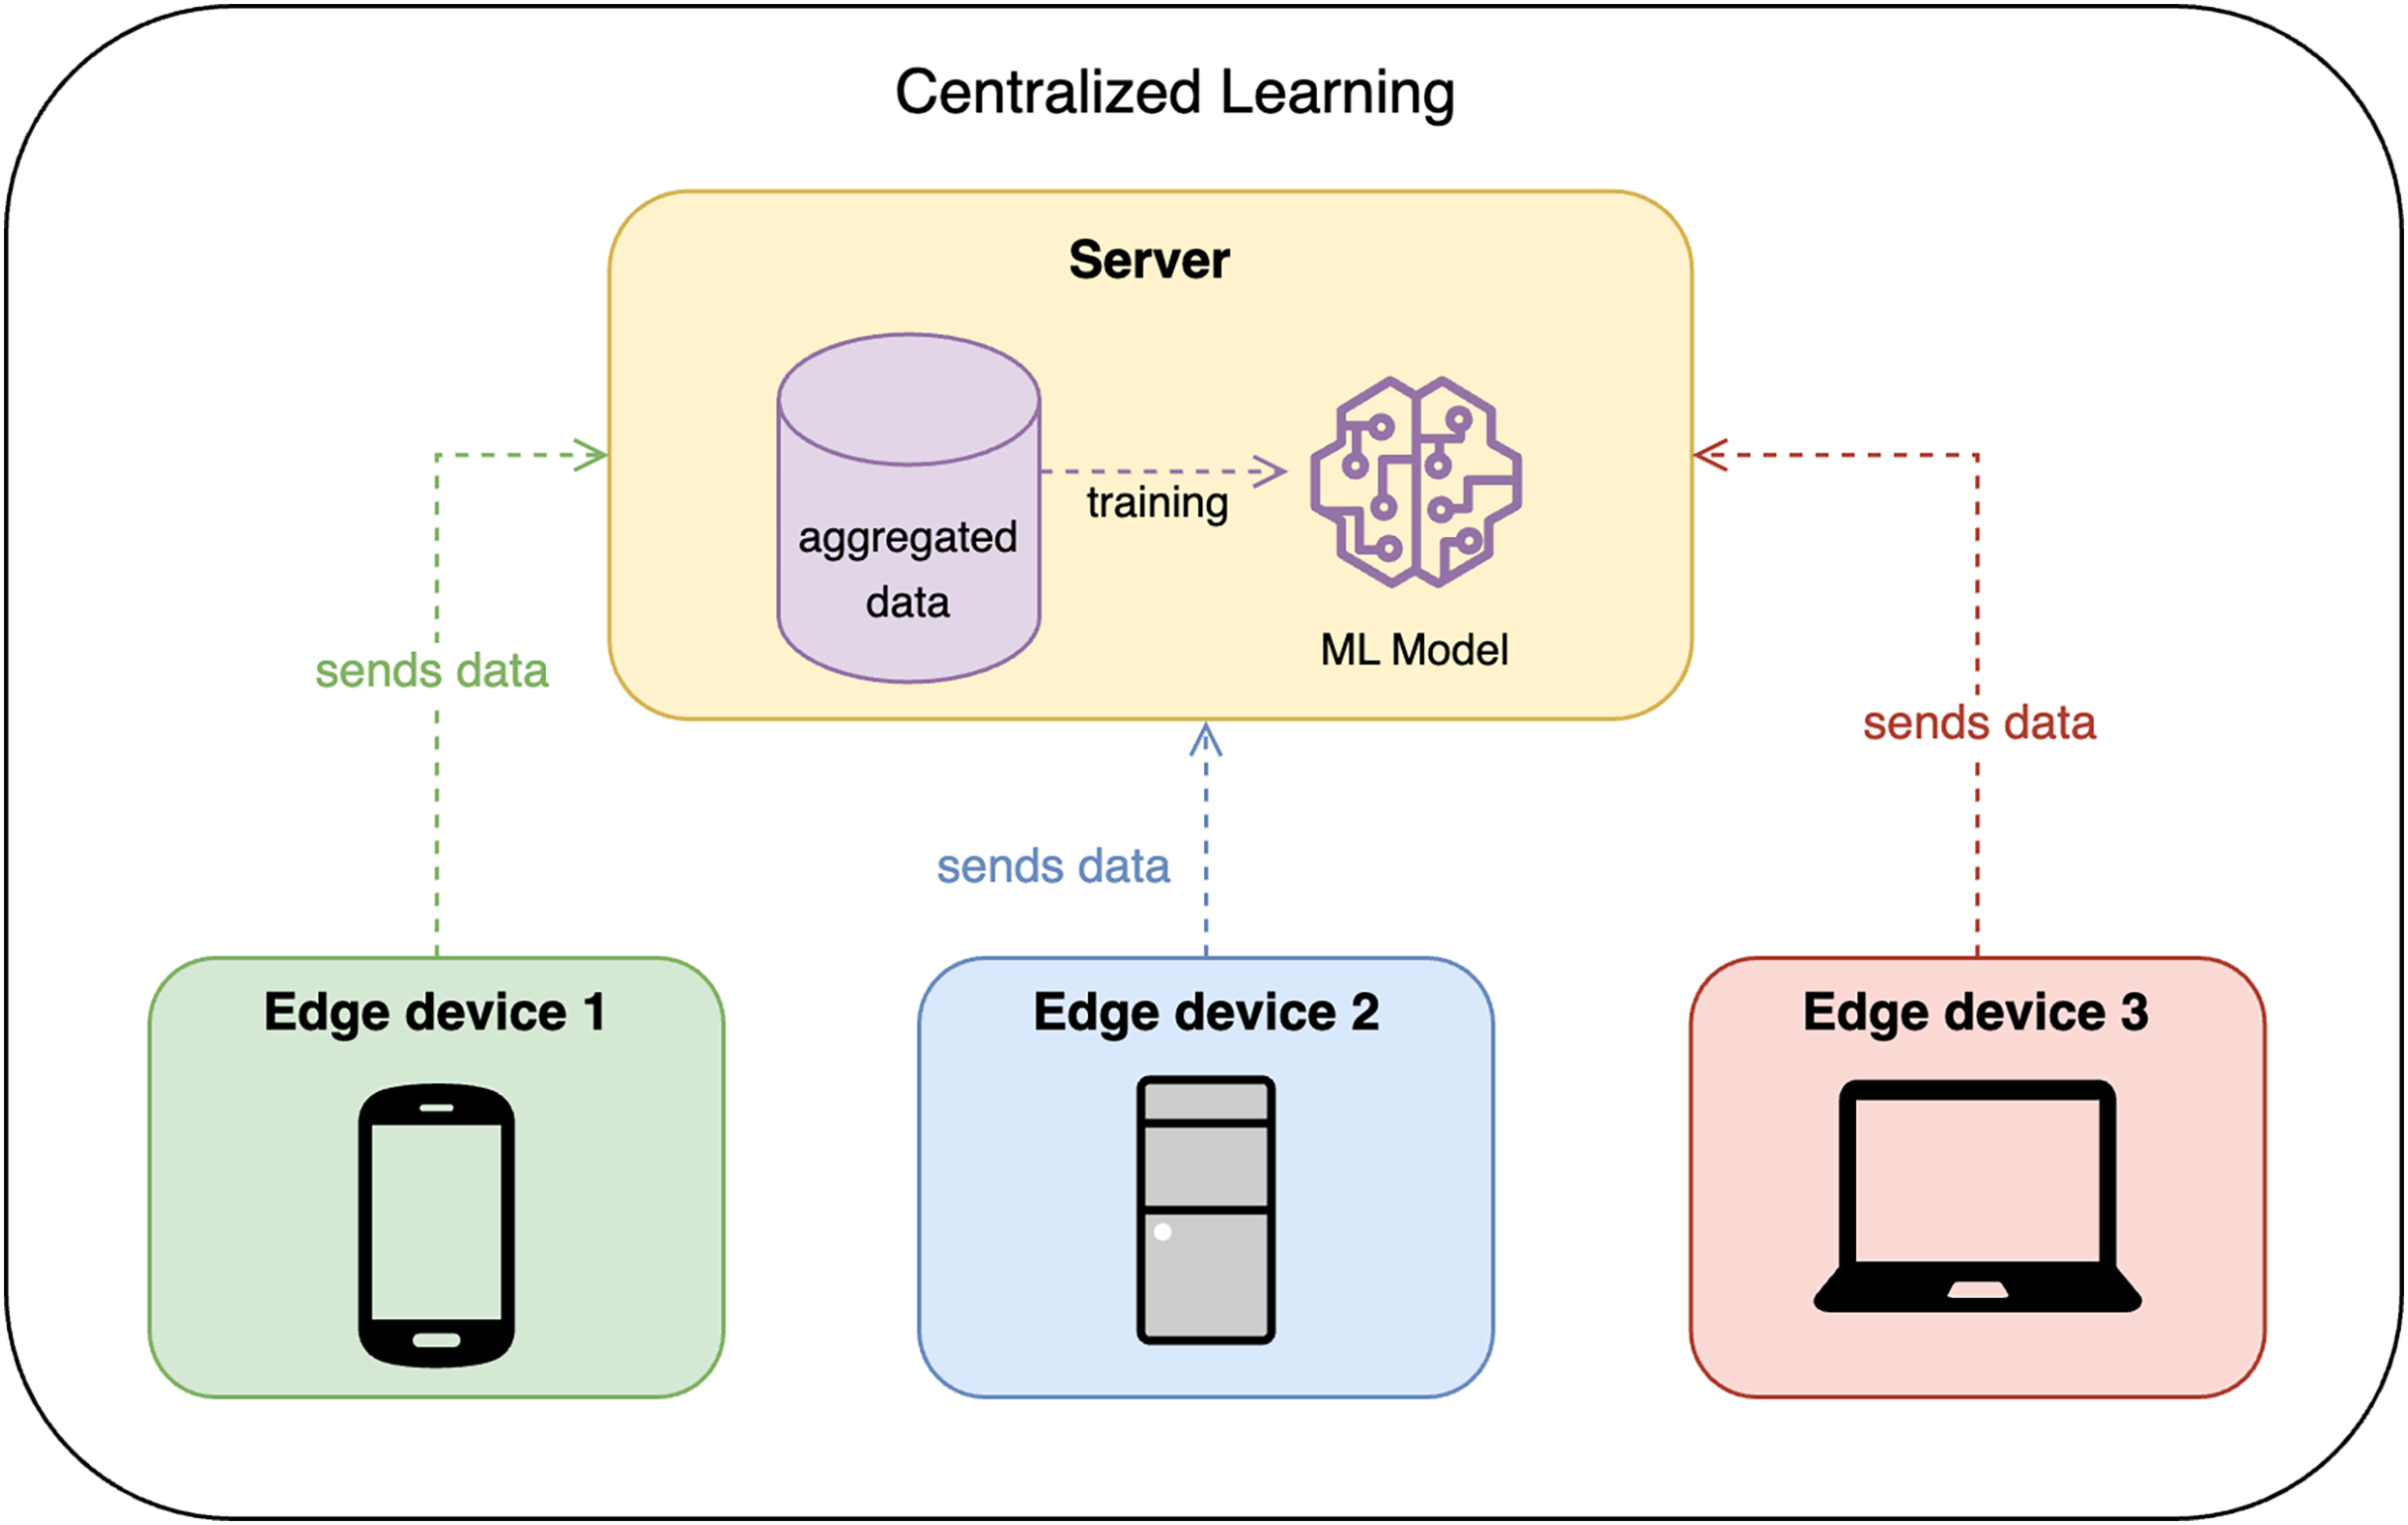
Traditionally, CL requires all edge devices to share their data with some centralized node or server, which then trains the model on the aggregated data. This approach is efficient but raises privacy concerns, as the data is centralized. Figure 1 shows the design of CL.
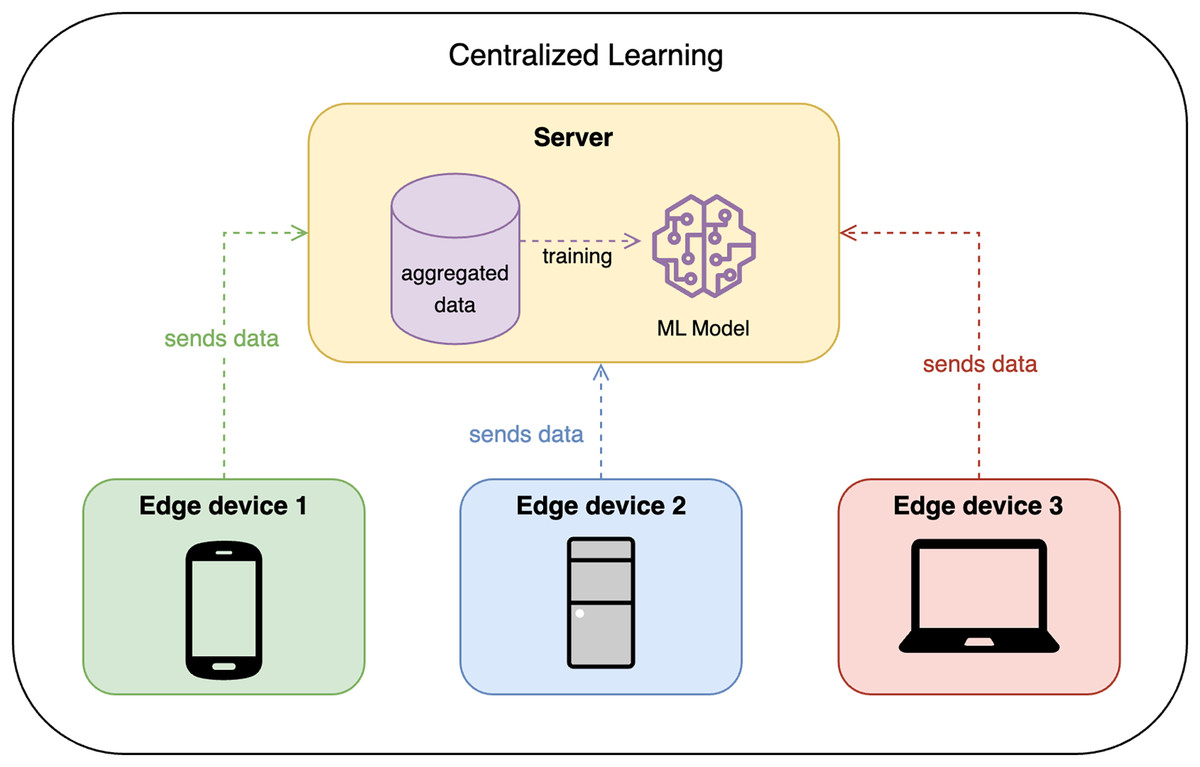
Figure 1: Centralized learning design.
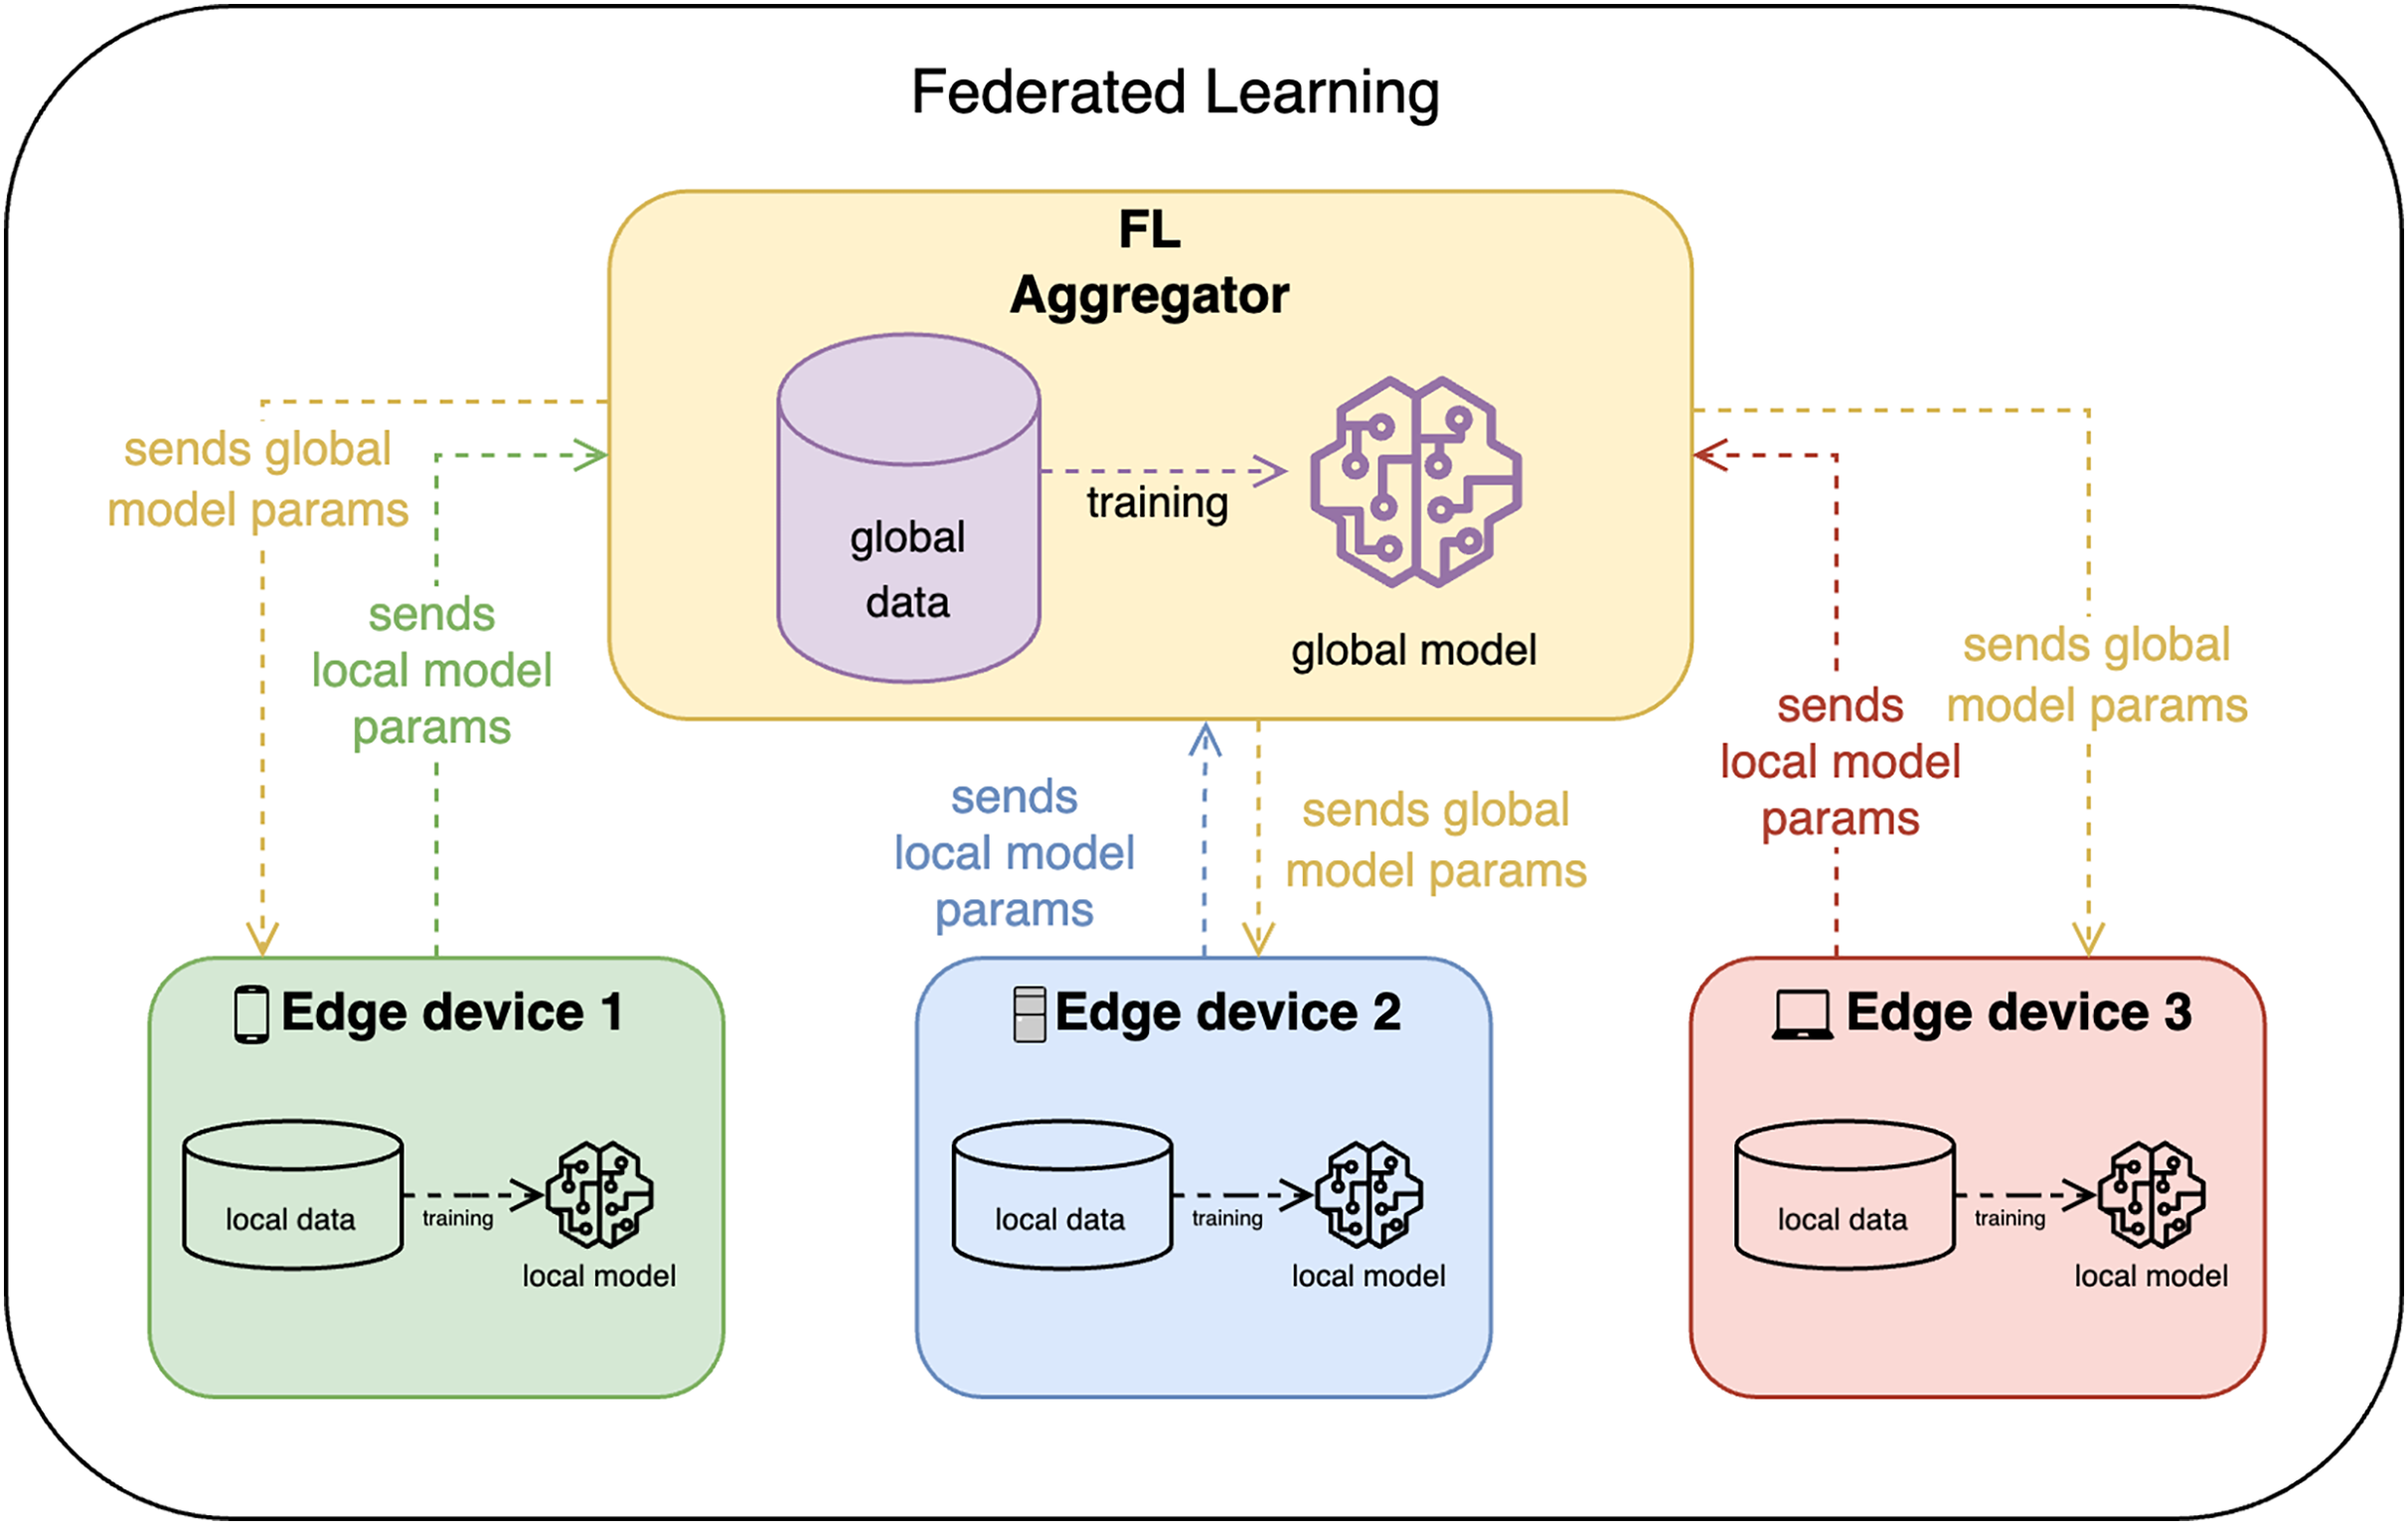
FL, on the other hand, allows edge devices to train the model locally and share only the model updates with the FL aggregator (or FL server) as shown in Fig. 2. The FL aggregator then takes these model parameters and aggregates them (e.g., by averaging), converging all updates in one global model, which is then again distributed among clients. This approach is more privacy-preserving, but it is more complex and may require more communication between devices.
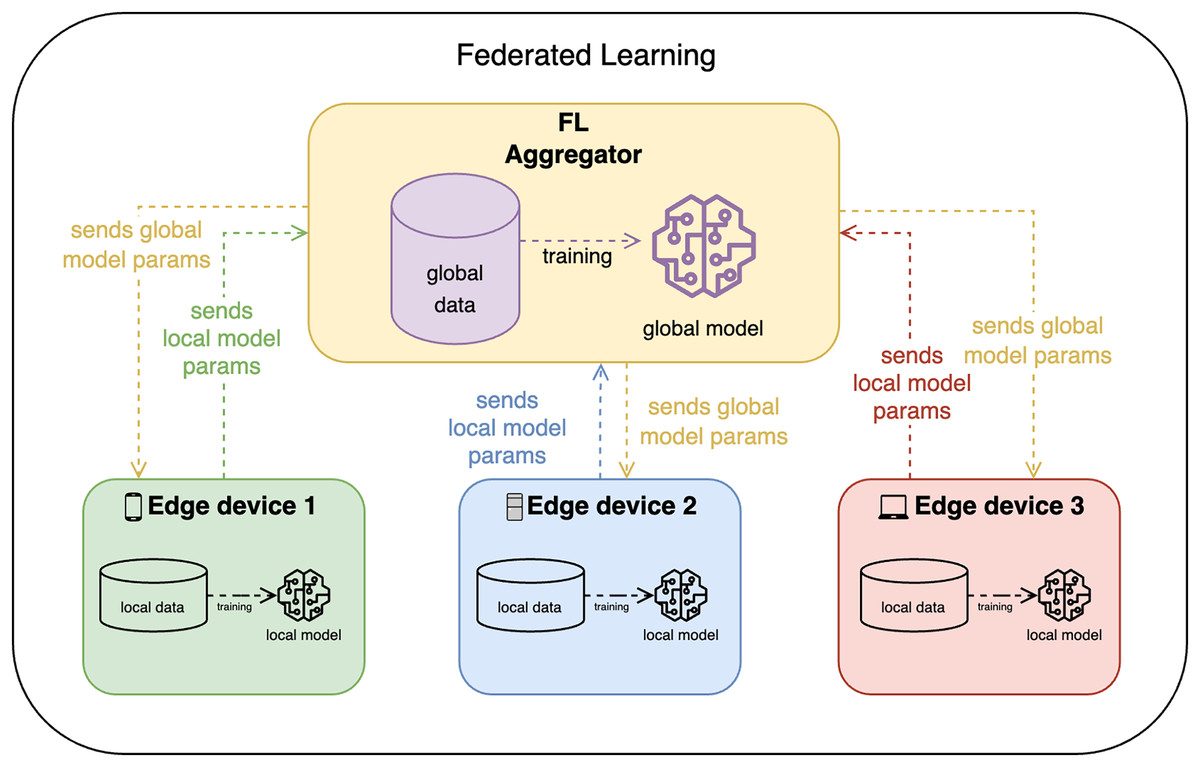
Figure 2: Federated learning design.
System implementation
The application adheres to free and open-source software (FOSS) principles, avoiding non-FOSS dependencies, and features a modular architecture with replaceable components. The proof-of-concept solution focuses on Mi Band and CSV file agents, is low-code, configurable, includes an understandable GUI, and supports supervised learning for classification and regression.
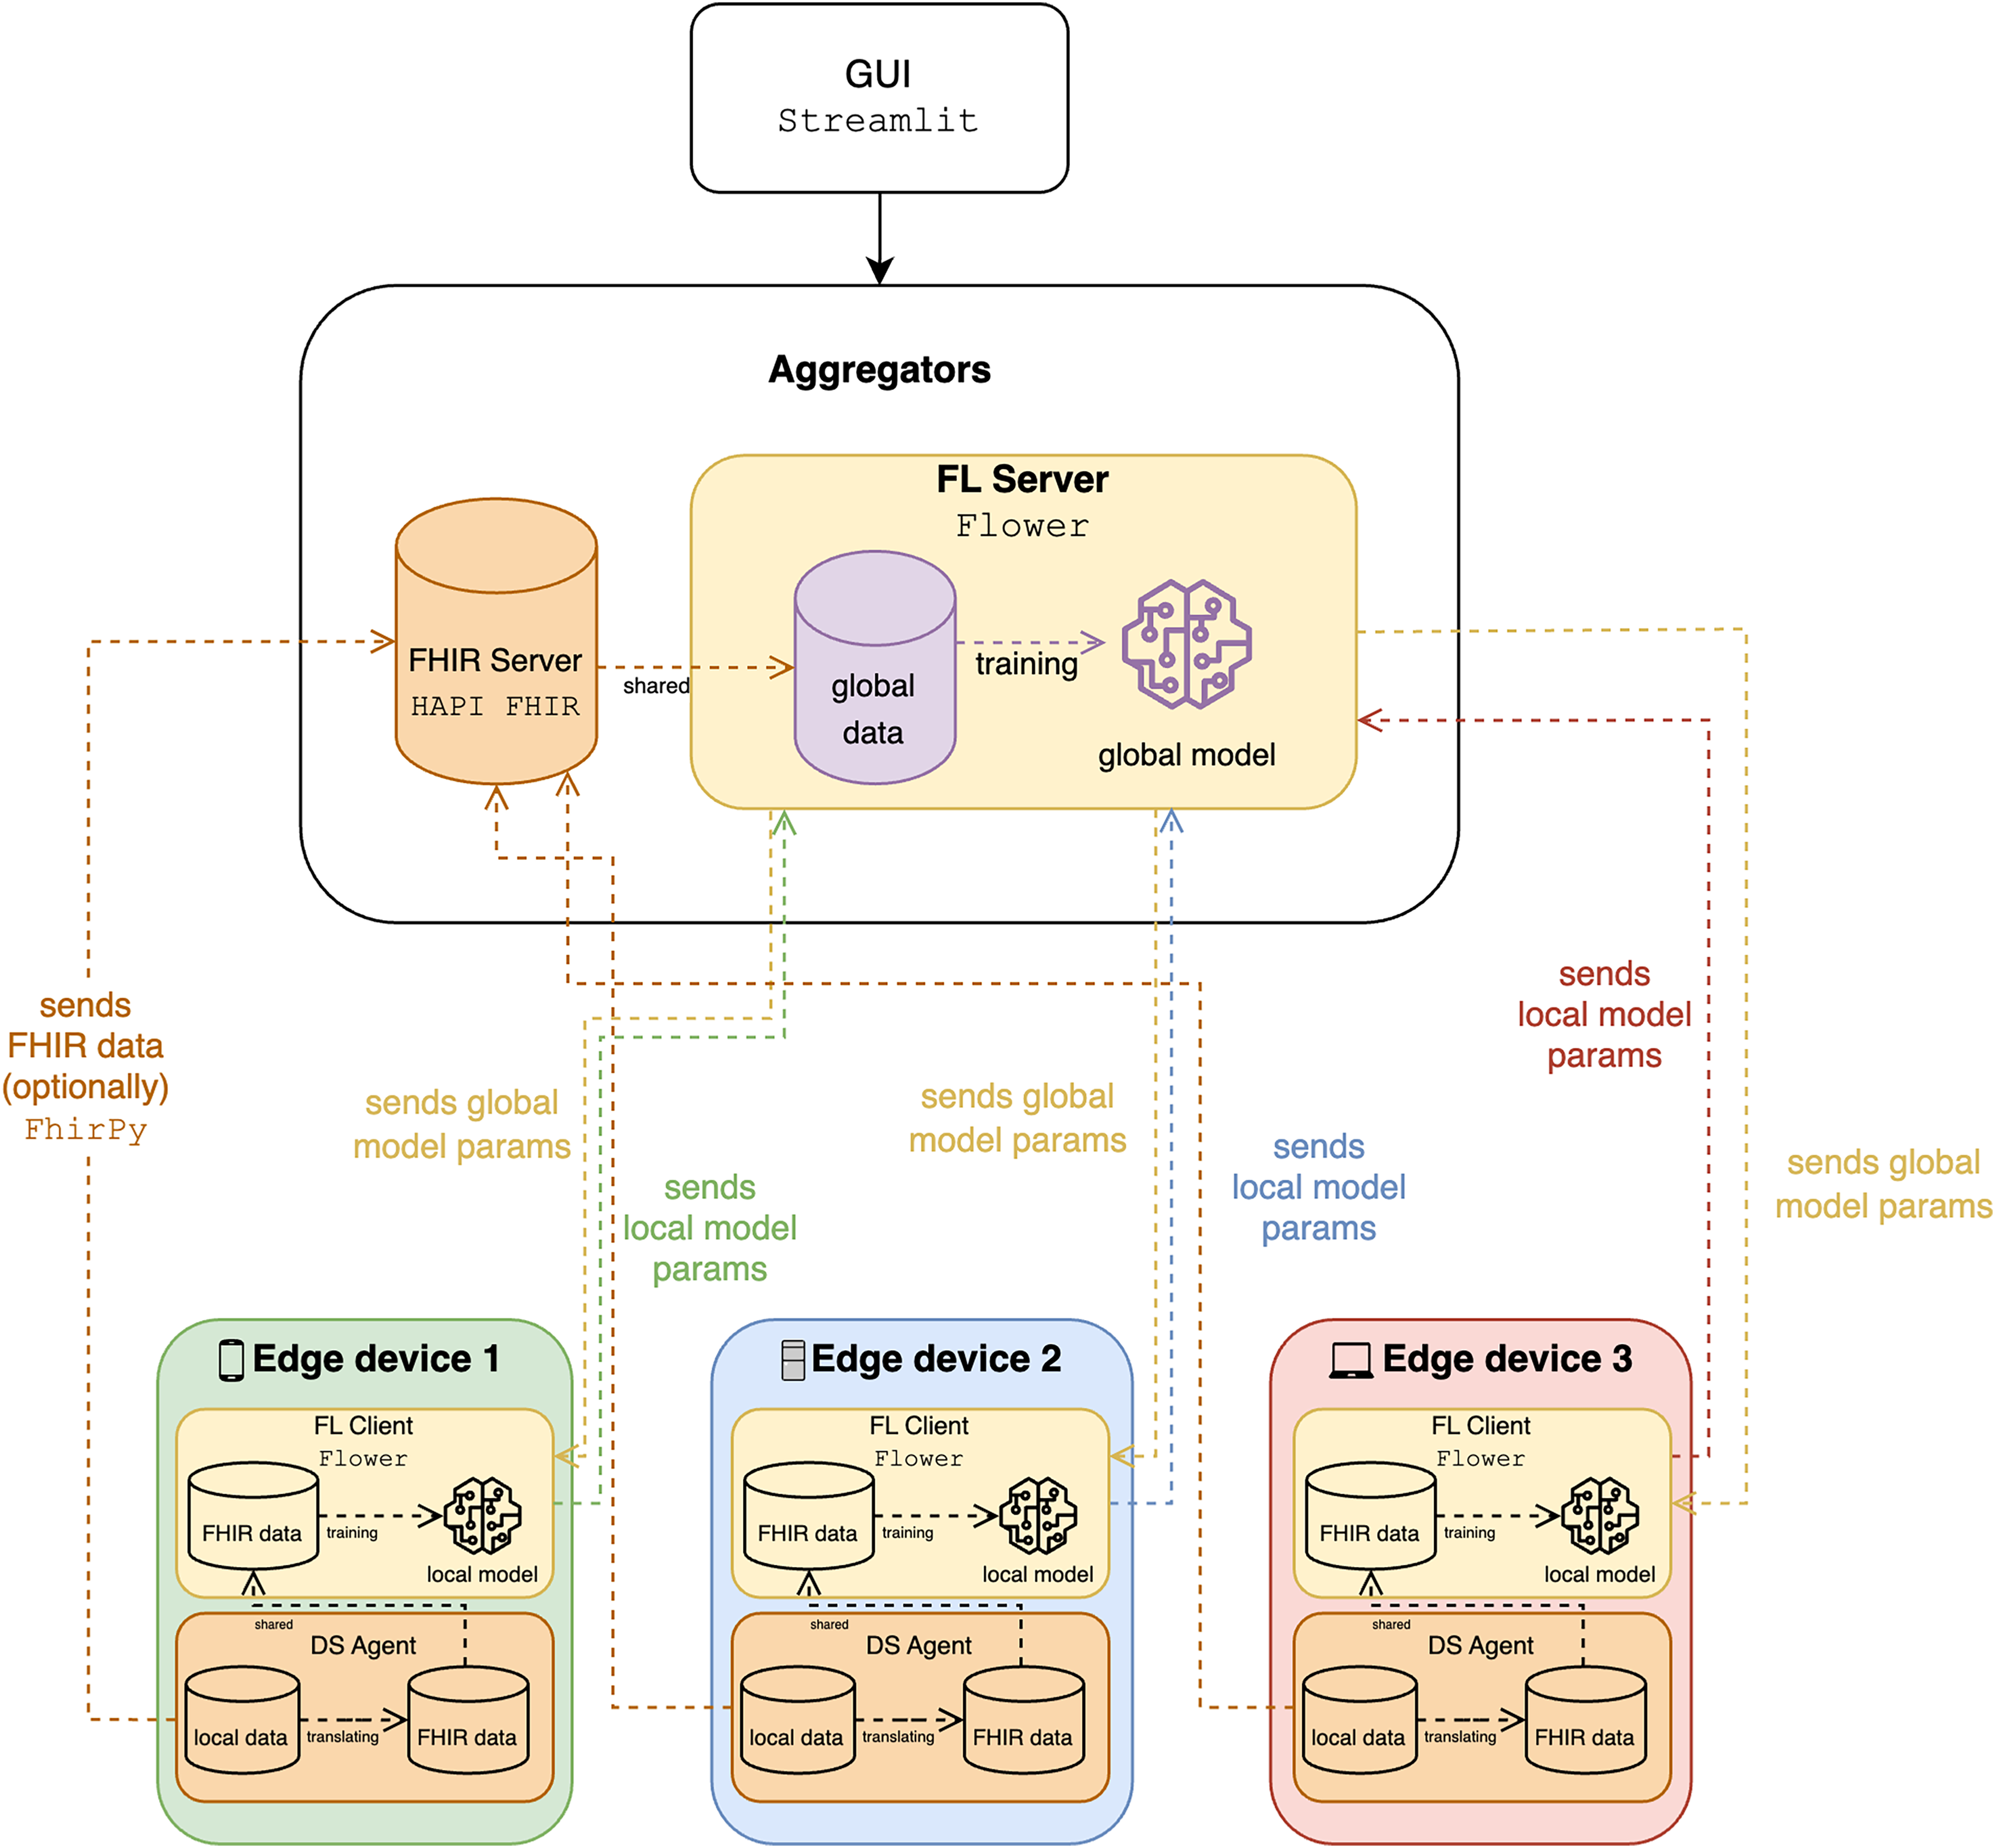
Figure 3 illustrates an FL system integrating FHIR for processing healthcare data, highlighting interactions between edge devices, the FL server, and the FHIR server. Each edge device, representing local systems like wearable devices, holds local data and models and includes an FL client for local model training, an FHIR client for managing data, and a data service (DS) agent for translating and managing data exchange. Currently, the mapping and translation specifications within the DS agents are implemented manually for each type of wearable data we integrate (e.g., steps, heart rate, sleep data). The FHIR server stores healthcare data using FHIR standards, while the FL server aggregates local model parameters from edge devices, trains a global model, and distributes global model parameters back to the edge devices. Data flows involve edge devices sending FHIR data to the FHIR server, using local data for training, and exchanging model parameters to ensure privacy and collective learning. The system ensures syntactic interoperability through FHIR, enabling seamless data exchange, and leverages FL to train models across institutions without sharing sensitive data, maintaining scalability and privacy. The integration of FHIR and FL facilitates effective data utilization, privacy preservation, and improved model accuracy, supported by a graphical user interface (GUI) for user interaction and monitoring. To have a more comprehensive analysis, we use classification to determine the activity, such as walking and running, whereas the speed and the calorie expenditure are quantified in regression.
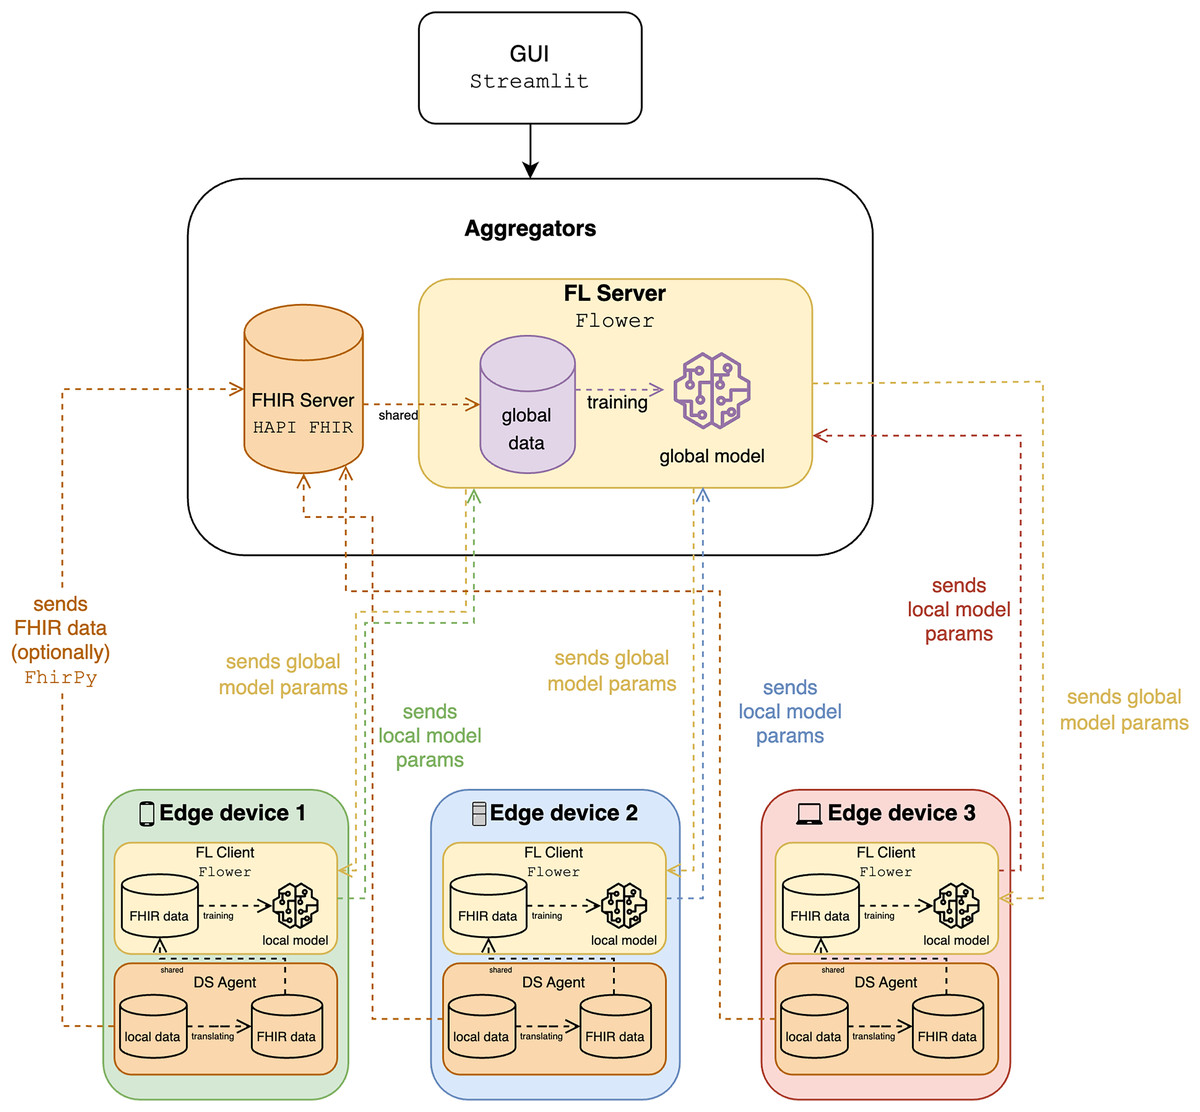
Figure 3: The diagram of the proposed solution.
Methodology for privacy and interoperability
The approach used on our platform to improve the privacy and interoperability of health information uses FL in combination with FHIR. This section describes the integration of the two technologies to achieve these goals.
Privacy preservation with federated learning
FL supports data privacy in our system. FL allows for local training of machine learning models from the original data (e.g., from connected objects). Importantly, sensitive data is not transmitted to a central server. Instead, model updates, such as weights or gradients, are transmitted to a central server, which averages the updates to generate a global model. This decentralized training process inherently eliminates the need for data centralization. Storing data at its source and not transmitting raw patient data between facilities significantly enhances data privacy.
Data interoperability with FHIR
To address interoperability challenges, our system uses the FHIR standard. FHIR provides a standardized and widely accepted model for the digital representation and transmission of health information. With FHIR, our system enables consistent interpretation and processing of health data from diverse sources, including wearable devices and disparate health systems. Our platform integrates the FHIR application by mapping all health data in the system to the standardized FHIR model. Data is stored and retrieved via the FHIR protocol, ensuring consistency and interoperability.
Integration of fast healthcare interoperability resources and federated learning
Our system provides seamless integration of FL and FHIR through a modular design. This integration is achieved through local agents running on devices (e.g., portable devices as FL clients). These agents have the following features:
FHIR client: Each agent has a FHIR client module that enforces all data management within the agent to meet FHIR standards.
Data service (DS) agent for FHIR translation: The DS agent is arguably the most crucial element, as it converts the device’s local data formats to the standardized FHIR format. This automatic data translation process translates local formats to FHIR standards, eliminating the need for manual translation on a case-by-case basis.
This tight integration of FHIR within our federated learning platform enables seamless data exchange and significantly improves interoperability between heterogeneous healthcare systems and wearable devices without losing the intrinsic privacy benefits of federated learning and minimizing the need for manual data intervention.
Dataset
Since the solution focuses only on two types of machine learning problems, classification and regression, we only focus on datasets suitable for both and retrieved by wearable devices.
Classification
For classification tasks, the dataset includes well-known datasets used to predict physical activities. These activities are classic classification tasks where the data is labeled, allowing for the training and evaluation of machine learning models.
Harvard’s Apple Watch dataset
The dataset (https://www.kaggle.com/datasets/aleespinosa/apple-watch-and-fitbit-data/data) from Harvard University’s research in Fuller et al. (2020) is utilized for solving classification problems. The research aims to investigate if commercial wearable devices can effectively forecast sitting, lying, and varying levels of physical activity. Scientists enlisted 46 volunteers, including 26 women, in a convenience sample to utilize three gadgets: a GENEActiv, an Apple Watch Series 2, and a Fitbit Charge HR2. The research shows that Apple Watch and Fitbit, popular wearable devices, can accurately predict the type of physical activity. The findings endorse the utilization of real-time data from Apple Watch and Fitbit with machine learning methods for large-scale classification of physical activity types among the general population. The Apple Watch dataset exhibits the following characteristics: 18 variables, 3,656 observations, no missing cells (0.0%) or duplicate rows (0.0%), a total size in memory of 514.2 KiB, comprising 16 numeric and two categorical variable types.
HARTH dataset
The HARTH dataset (https://www.kaggle.com/datasets/joebeachcapital/harth-dataset) (Logacjov et al., 2023) comprises 3-axial accelerometer data from 22 participants, with sensors placed on the thigh and lower back, recording acceleration in three dimensions at a high sampling rate for detailed motion tracking. The time-series data is accompanied by annotations of various activities and includes raw signals that allow for custom processing and feature extraction. Additionally, the dataset provides metadata on participant demographics and experiment protocols, supporting comprehensive analysis for human activity recognition research. The HARTH dataset exhibits the following characteristics: seven variables, 110,116 observations, no missing cells (0.0%) but a small number of duplicate rows (618, representing 0.6% of the data), a total size in memory of 5.9 MiB, and comprising seven numeric variable types.
Regression
For regression tasks, the dataset includes data to calculate calorie expenditure from physical activity data. These are continuous values, allowing models to predict numerical outcomes.
Mi band
Compared to classification, regression is much simpler. Regression models do not require specific target data (at a certain level). Thus, raw data from the device itself can be used without heavy data processing. The solution is tested using activity data from one of the author’s Mi Band 3, 4, and 7 devices. The models attempt to predict the number of calories burned during activity, which include steps, the walking distance, and the running distance. The Mi Band dataset exhibits the following characteristics: five variables, 2,454 observations, no missing cells (0.0%) or duplicate rows (0.0%), a total size in memory of 96.0 KiB, and comprising 1 DateTime and four numeric variable types.
DAT263x
To demonstrate the robustness of the results, it was decided to include another similar dataset, DAT263x. This dataset is mentioned in the EDX publication “Microsoft DAT263x Introduction to Artificial Intelligence (AI)” and is intended for use with Azure, which can be found on Kaggle (https://www.kaggle.com/datasets/fmendes/fmendesdat263xdemos). It contains gender, age, weight, height, duration, heart rate, body temperature, and calories burned from each participant during physical activity. The DAT263x dataset exhibits the following characteristics: eight variables, 12,000 observations, no missing cells (0.0%) but a minimal number of duplicate rows (1, representing less than 0.1% of the data), a total size in memory of 750.1 KiB, and comprising one categorical and seven numeric variable types.
Synthetic dataset
Since real data may be non-independent and identically distributed (non-IID), partitioning can strongly affect the results of CL and FL analyses. Therefore, it was decided to use the synthetic minority oversampling technique (SMOTE) to synthesize the data. Specifically, SMOTE and adaptive synthetic sampling (ADASYN) were chosen as practical methods to address potential class imbalance, a key characteristic of non-IID data, in our simulated FL environment. As shown in Chua, Sii & Ellyza Nohuddin (2022), these techniques can significantly improve the performance of different fitness data ML models when applied, providing a valuable starting point to mitigate non-IID effects. SMOTE is used to synthesize data for classification tasks. In this context, SMOTE allows balancing the class distribution within each client’s data partition before FL, thus aiming to create more robust local models despite possible non-IID class distributions across clients. ADASYN is used for regression problems, adaptively generating synthetic samples for the minority class and focusing on hard-to-learn examples. For the Mi Band dataset, ADASYN is applied to address potential imbalances in the distribution of the regression target variable (calorie expenditure) among customers in a non-IID setting. Although SMOTE and ADASYN are not exhaustive solutions to all non-IID challenges, they represent a pragmatic and effective initial strategy to mitigate class imbalance, a common manifestation of non-IID data in wearable sensor applications.
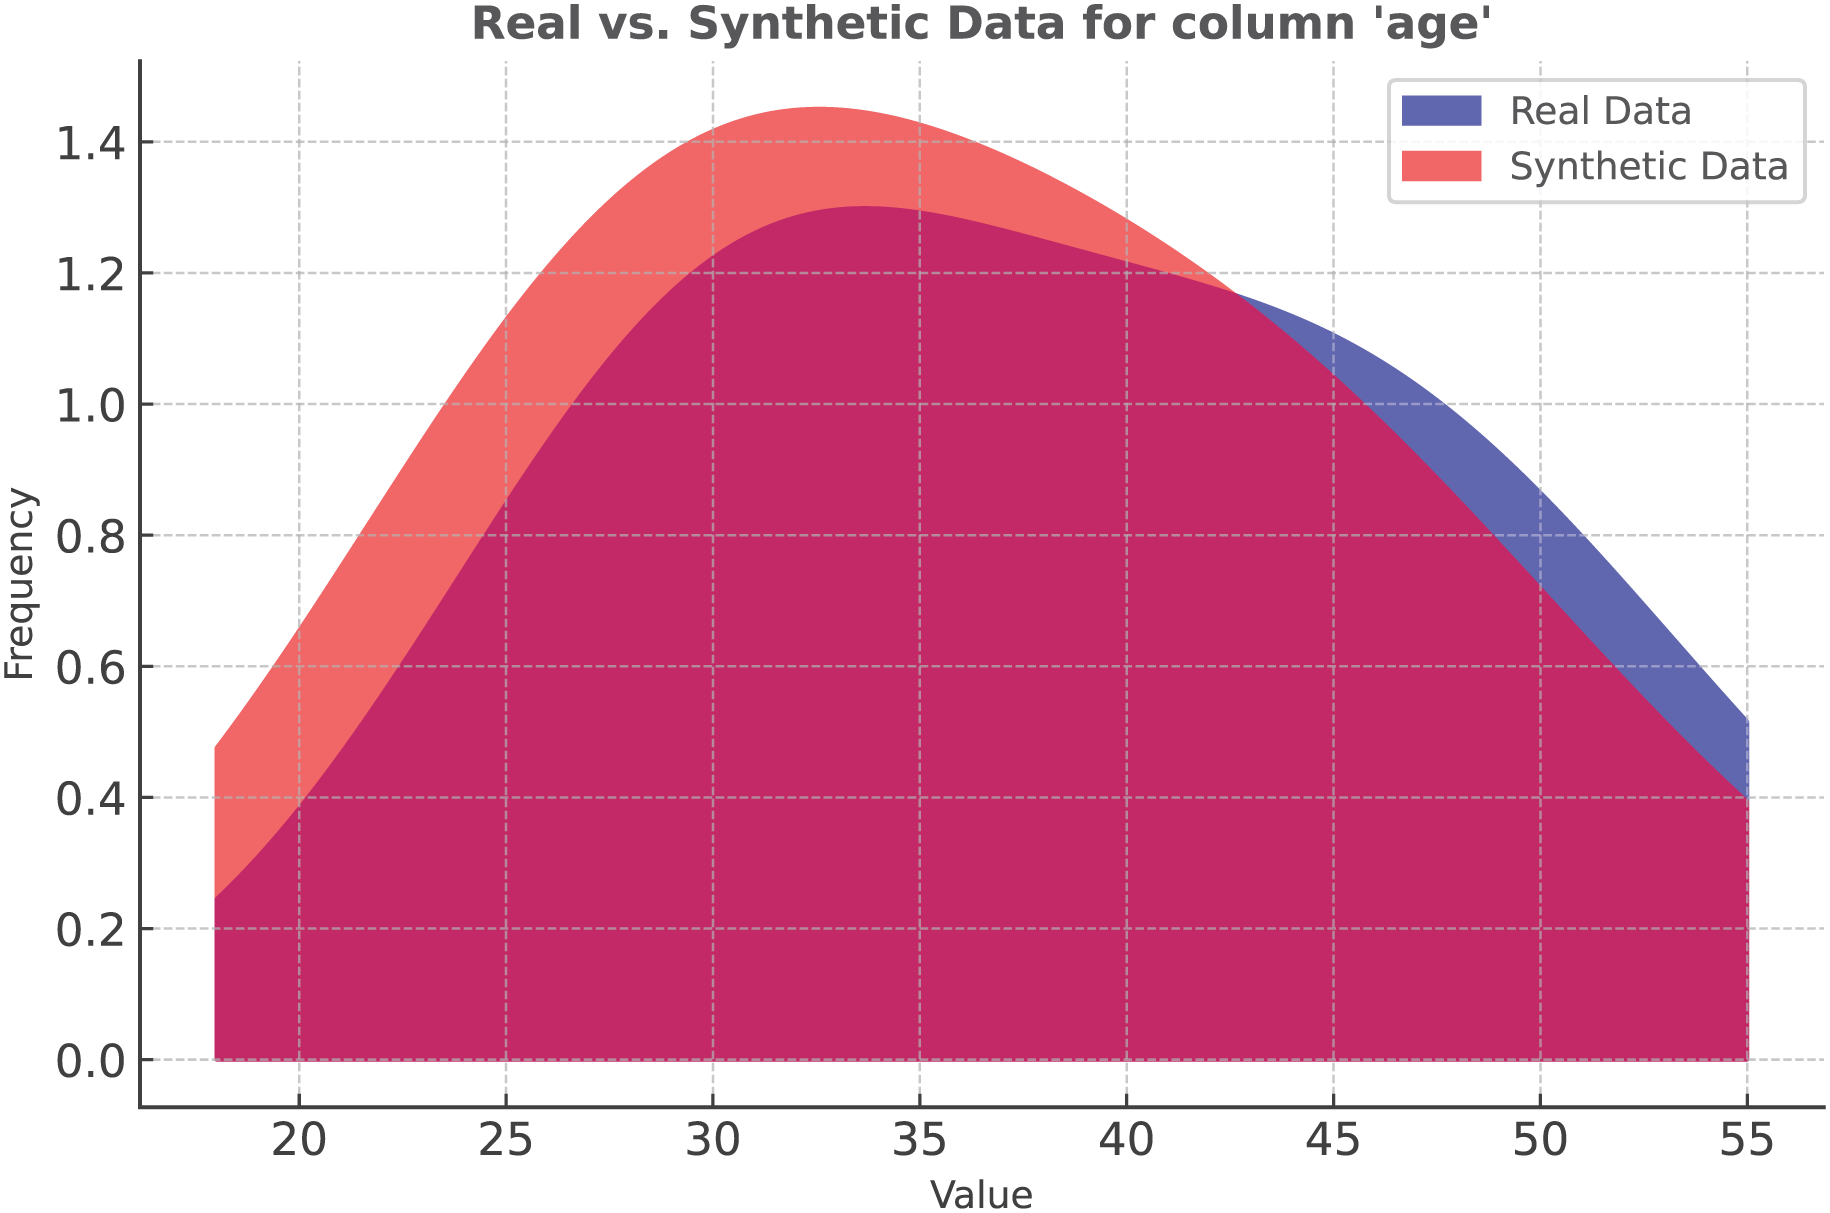
SMOTE is a commonly used method for dealing with imbalanced datasets by generating synthetic samples for the minority class. This technique involves creating new instances by interpolating between existing minority class samples. SMOTE identifies the nearest neighbors of each minority class instance and creates new synthetic examples by interpolating between these neighbors. These synthetic samples are designed to balance the class distribution, thus avoiding overfitting that can occur with standard oversampling methods.
In our study, we applied SMOTE to the Apple Watch dataset. Figure 4 represents the data distribution in the Age column. As the density plot shows, the synthetic and real data fit almost perfectly.
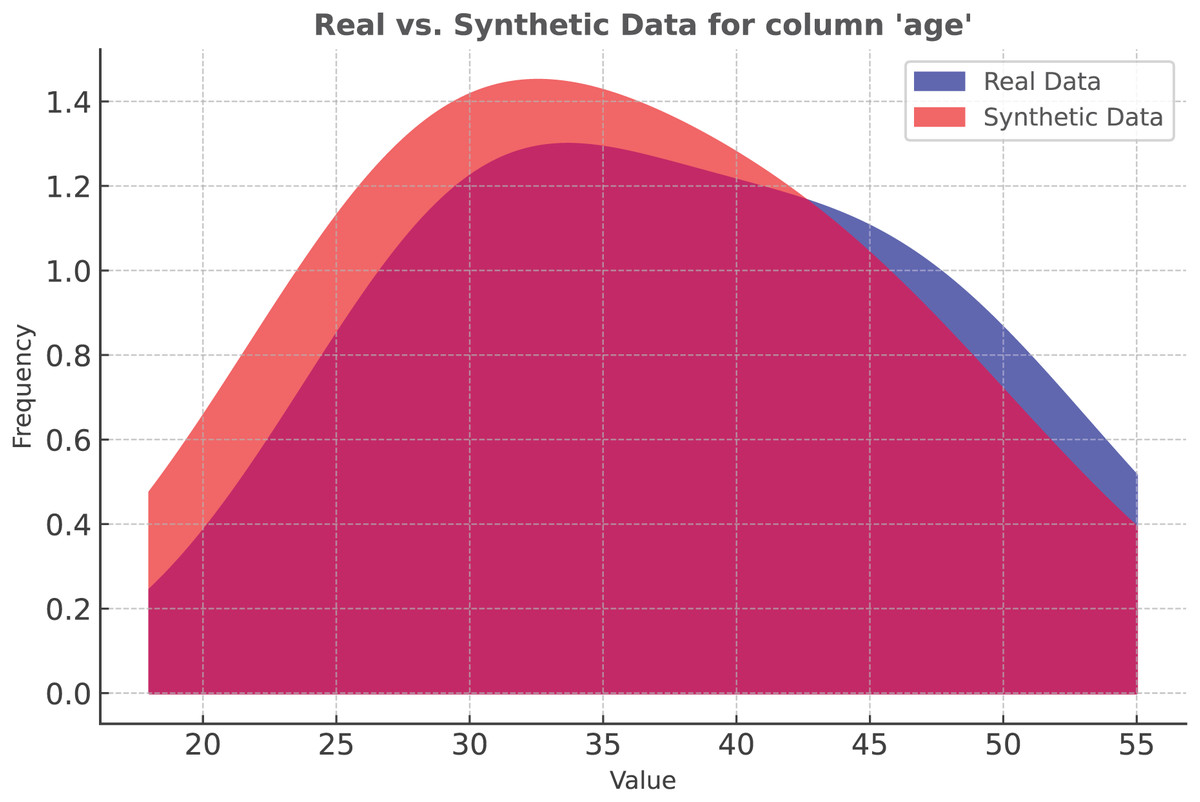
Figure 4: Classification: SMOTE vs real data distribution.
Unfortunately, SMOTE cannot be used in regression problems because the target column is not expressed by categorical values. Therefore, other oversampling techniques are tested. Among them, adaptive synthetic sampling (ADASYN) has proven to be the most suitable for real data. Therefore, ADASYN is used for the Mi Band dataset.
ADASYN is an algorithm used to mitigate the problem of unbalanced class distributions in machine learning. It works by adaptively generating synthetic samples, primarily for the minority class, focusing on the samples that are most difficult to learn. Unlike simple oversampling techniques that can replicate minority class data, ADASYN improves on this process by creating new synthetic data points that are similar, but not identical, to existing data. The number of synthetic samples generated for each minority class example is weighted based on how difficult that example was to learn, thus promoting better model generalization.
The adaptive nature of ADASYN makes it particularly useful in situations where some minority class examples are more difficult to classify than others. By generating more synthetic data for these complex examples, ADASYN results in a more balanced dataset, contributing to better performance in classification tasks.
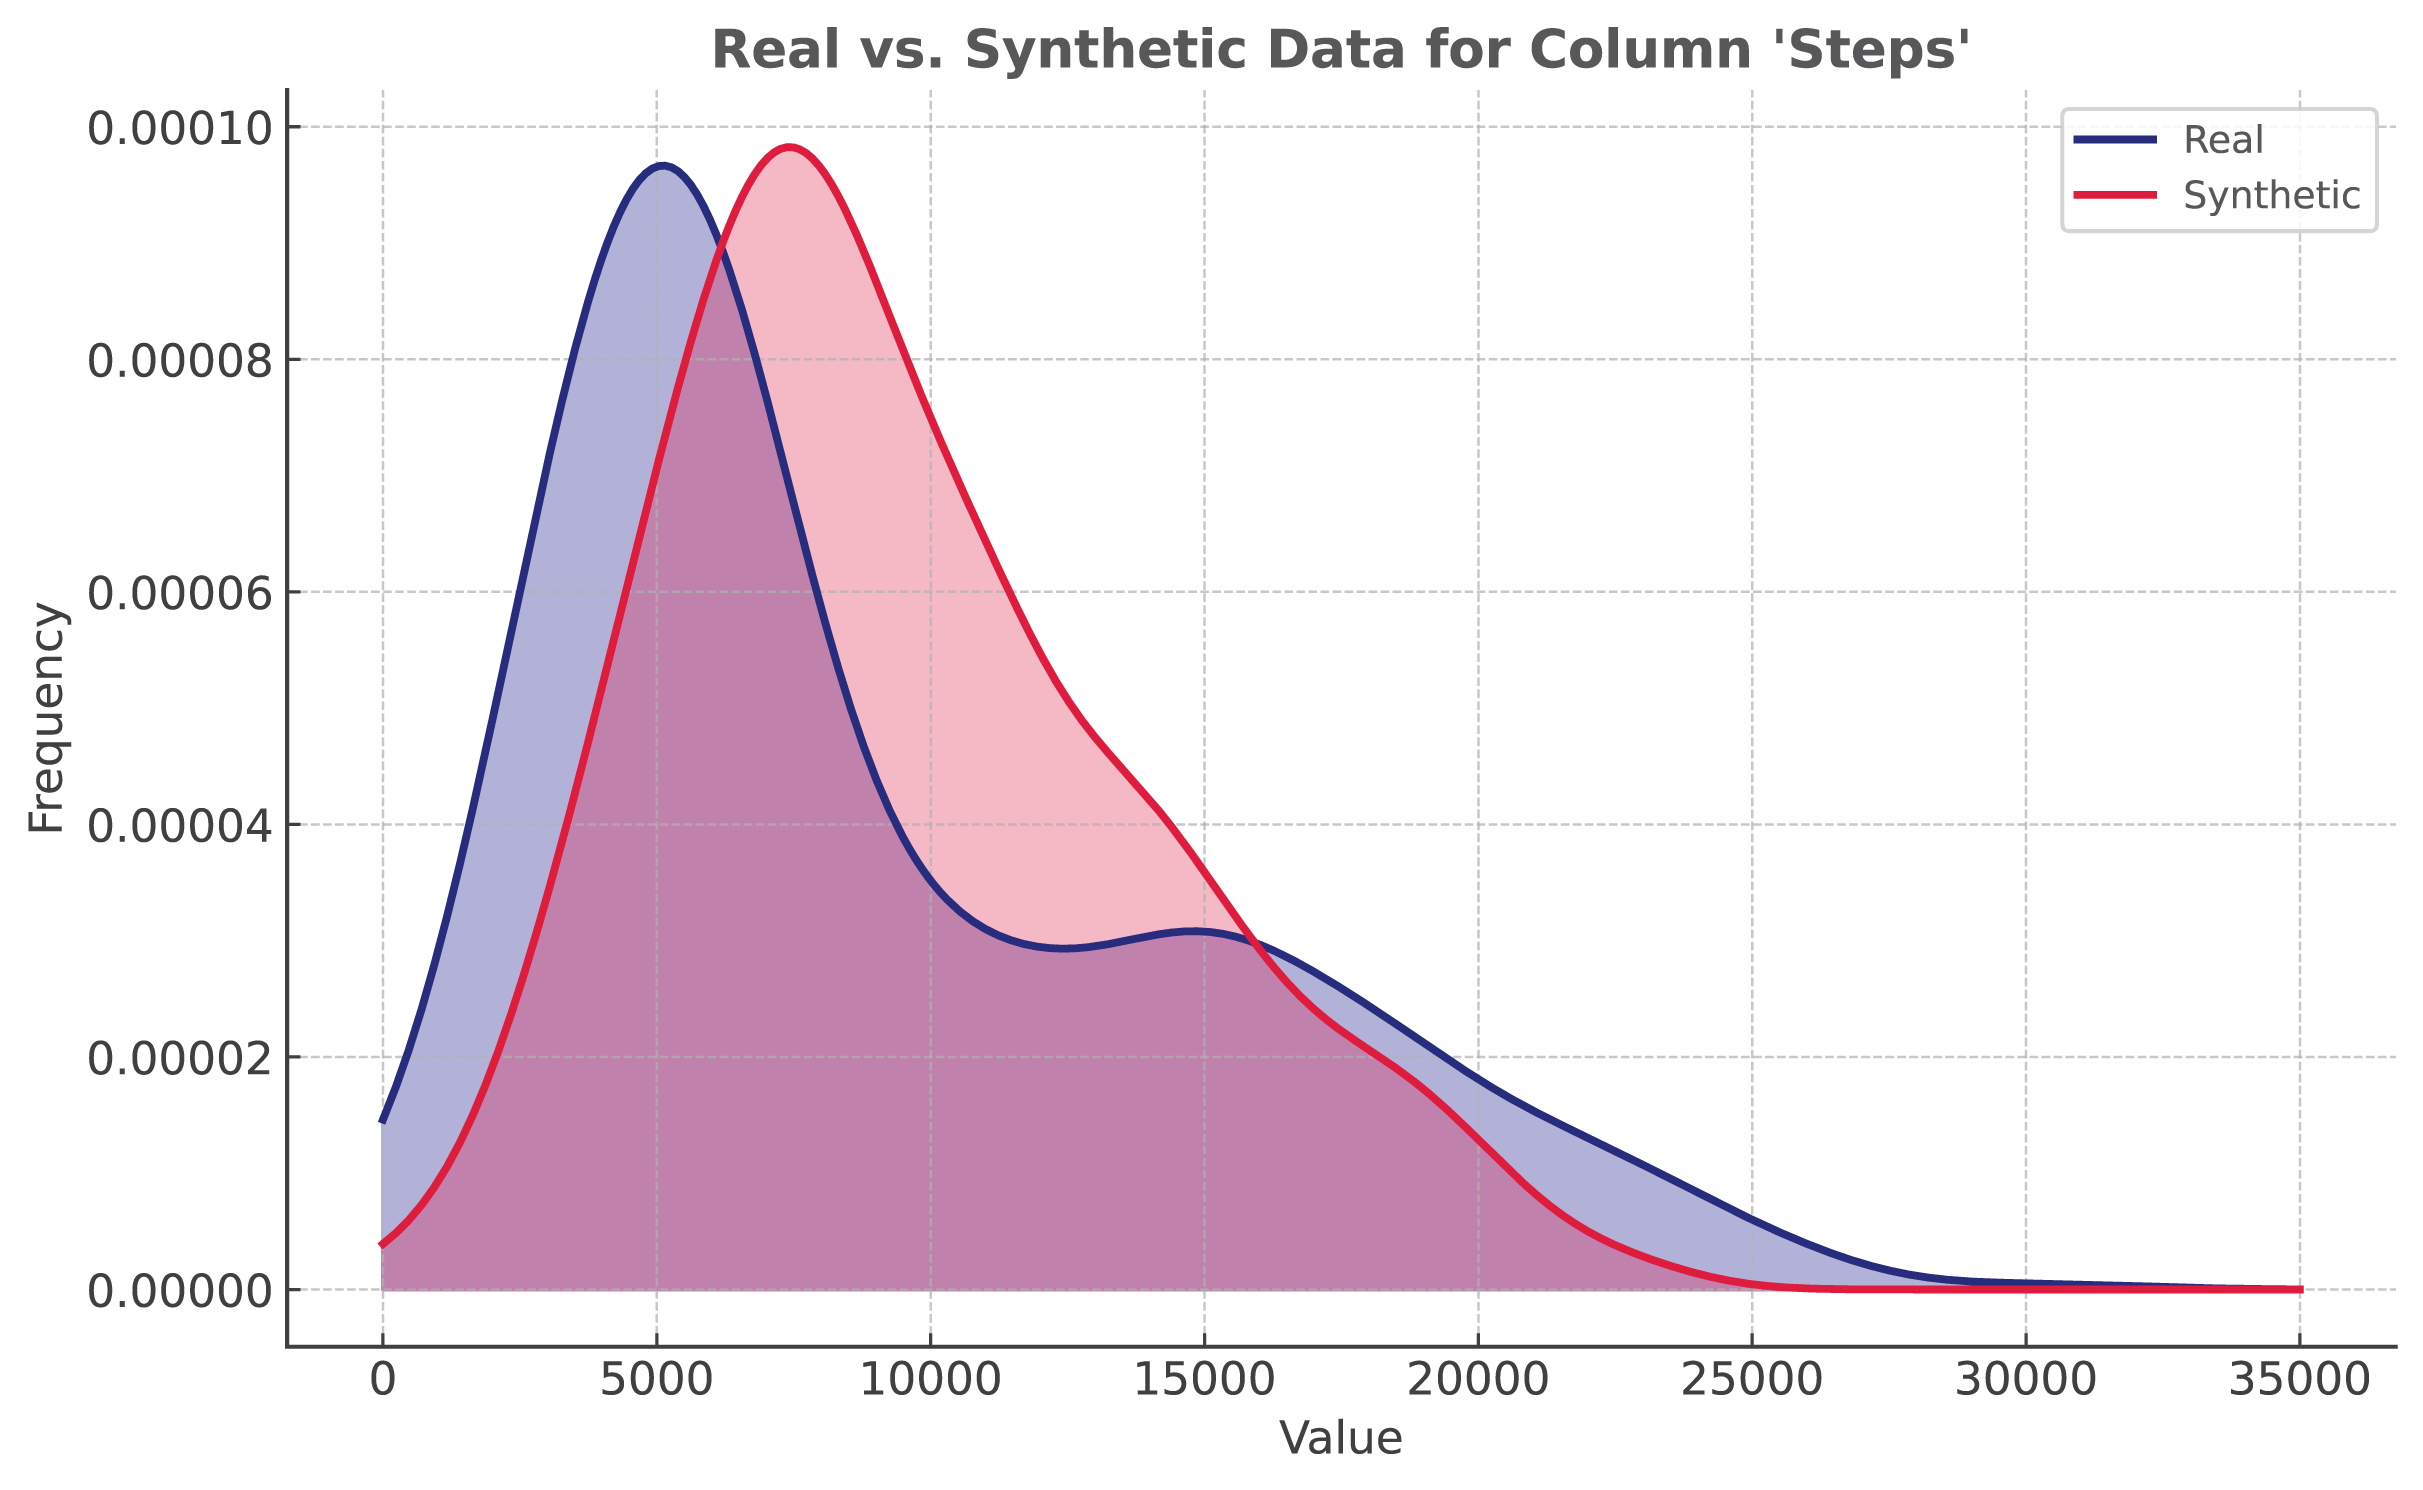
The proposed solution utilizes ADASYN implementation from ImbalancedLearningRegression library (Wu, Kunz & Branco, 2022). It is applied to the Mi Band dataset. As shown in Fig. 5, even though the distribution is not identical, synthetic data closely resembles the original data.
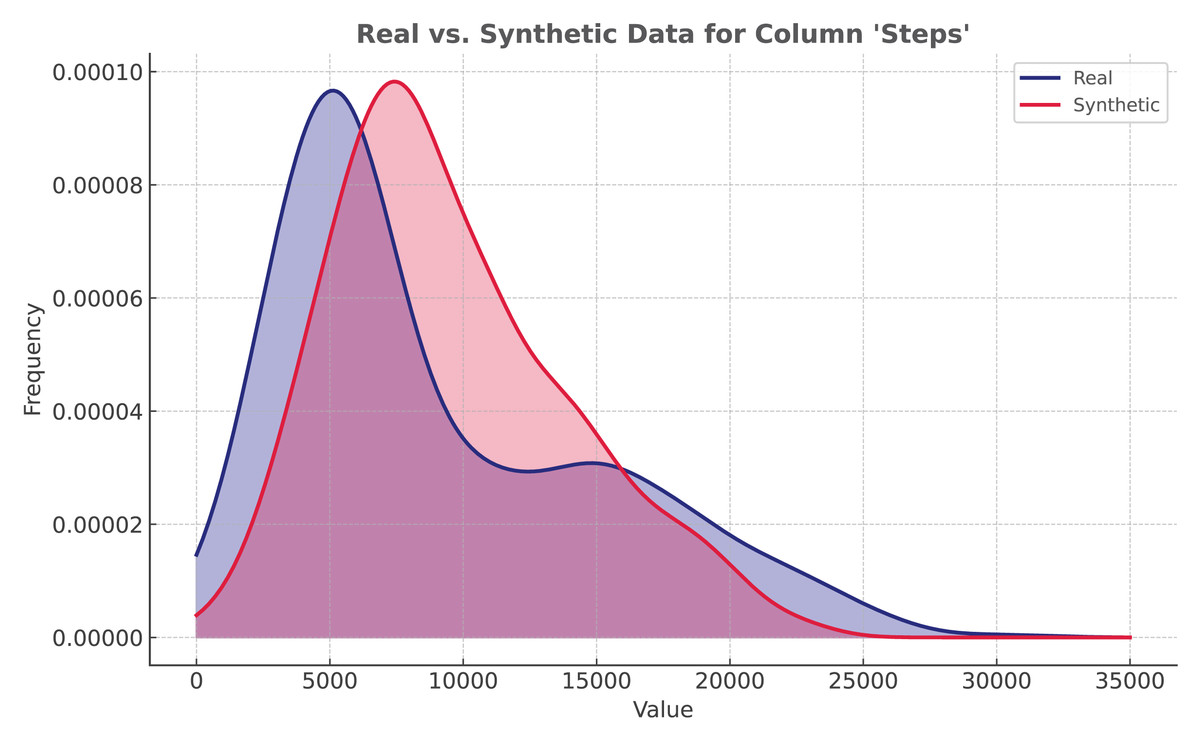
Figure 5: Regression: ADASYN vs real data distribution.
Simulation setup and evaluation
This section describes the simulation environment setup and the methods used to evaluate the performance of FL and CL. The setup details the hardware, software, and settings used, as well as the evaluation metrics applied to assess the model accuracy and efficiency.
Experiments setup
The proof-of-concept uses open-source, low-code technologies. The GUI is built with Streamlit, an open-source Python library, enabling straightforward code writing similar to Python scripts and integrating well with popular libraries like Pandas and PyCaret. The AutoML framework chosen is PyCaret, which simplifies model development with a simple API. Flower is the FL framework known for handling large-scale experiments and supporting diverse edge devices. For FHIR, HAPI FHIR is used for data sharing, with FhirPy as the lightweight client for RESTful API access. The source code is available on GitHub repository (https://gitfront.io/r/weeebdev/gnm1dXbMqiHh/auto-fl-fit) under the MIT license.
The experiments were conducted on a MacBook Pro 14 M1. The machine is powered by an 8-core Apple M1 Pro processor, including six performance cores and two efficiency cores, 16 GB of unified memory, and a 14-core GPU. It runs macOS Sonoma 14.3.
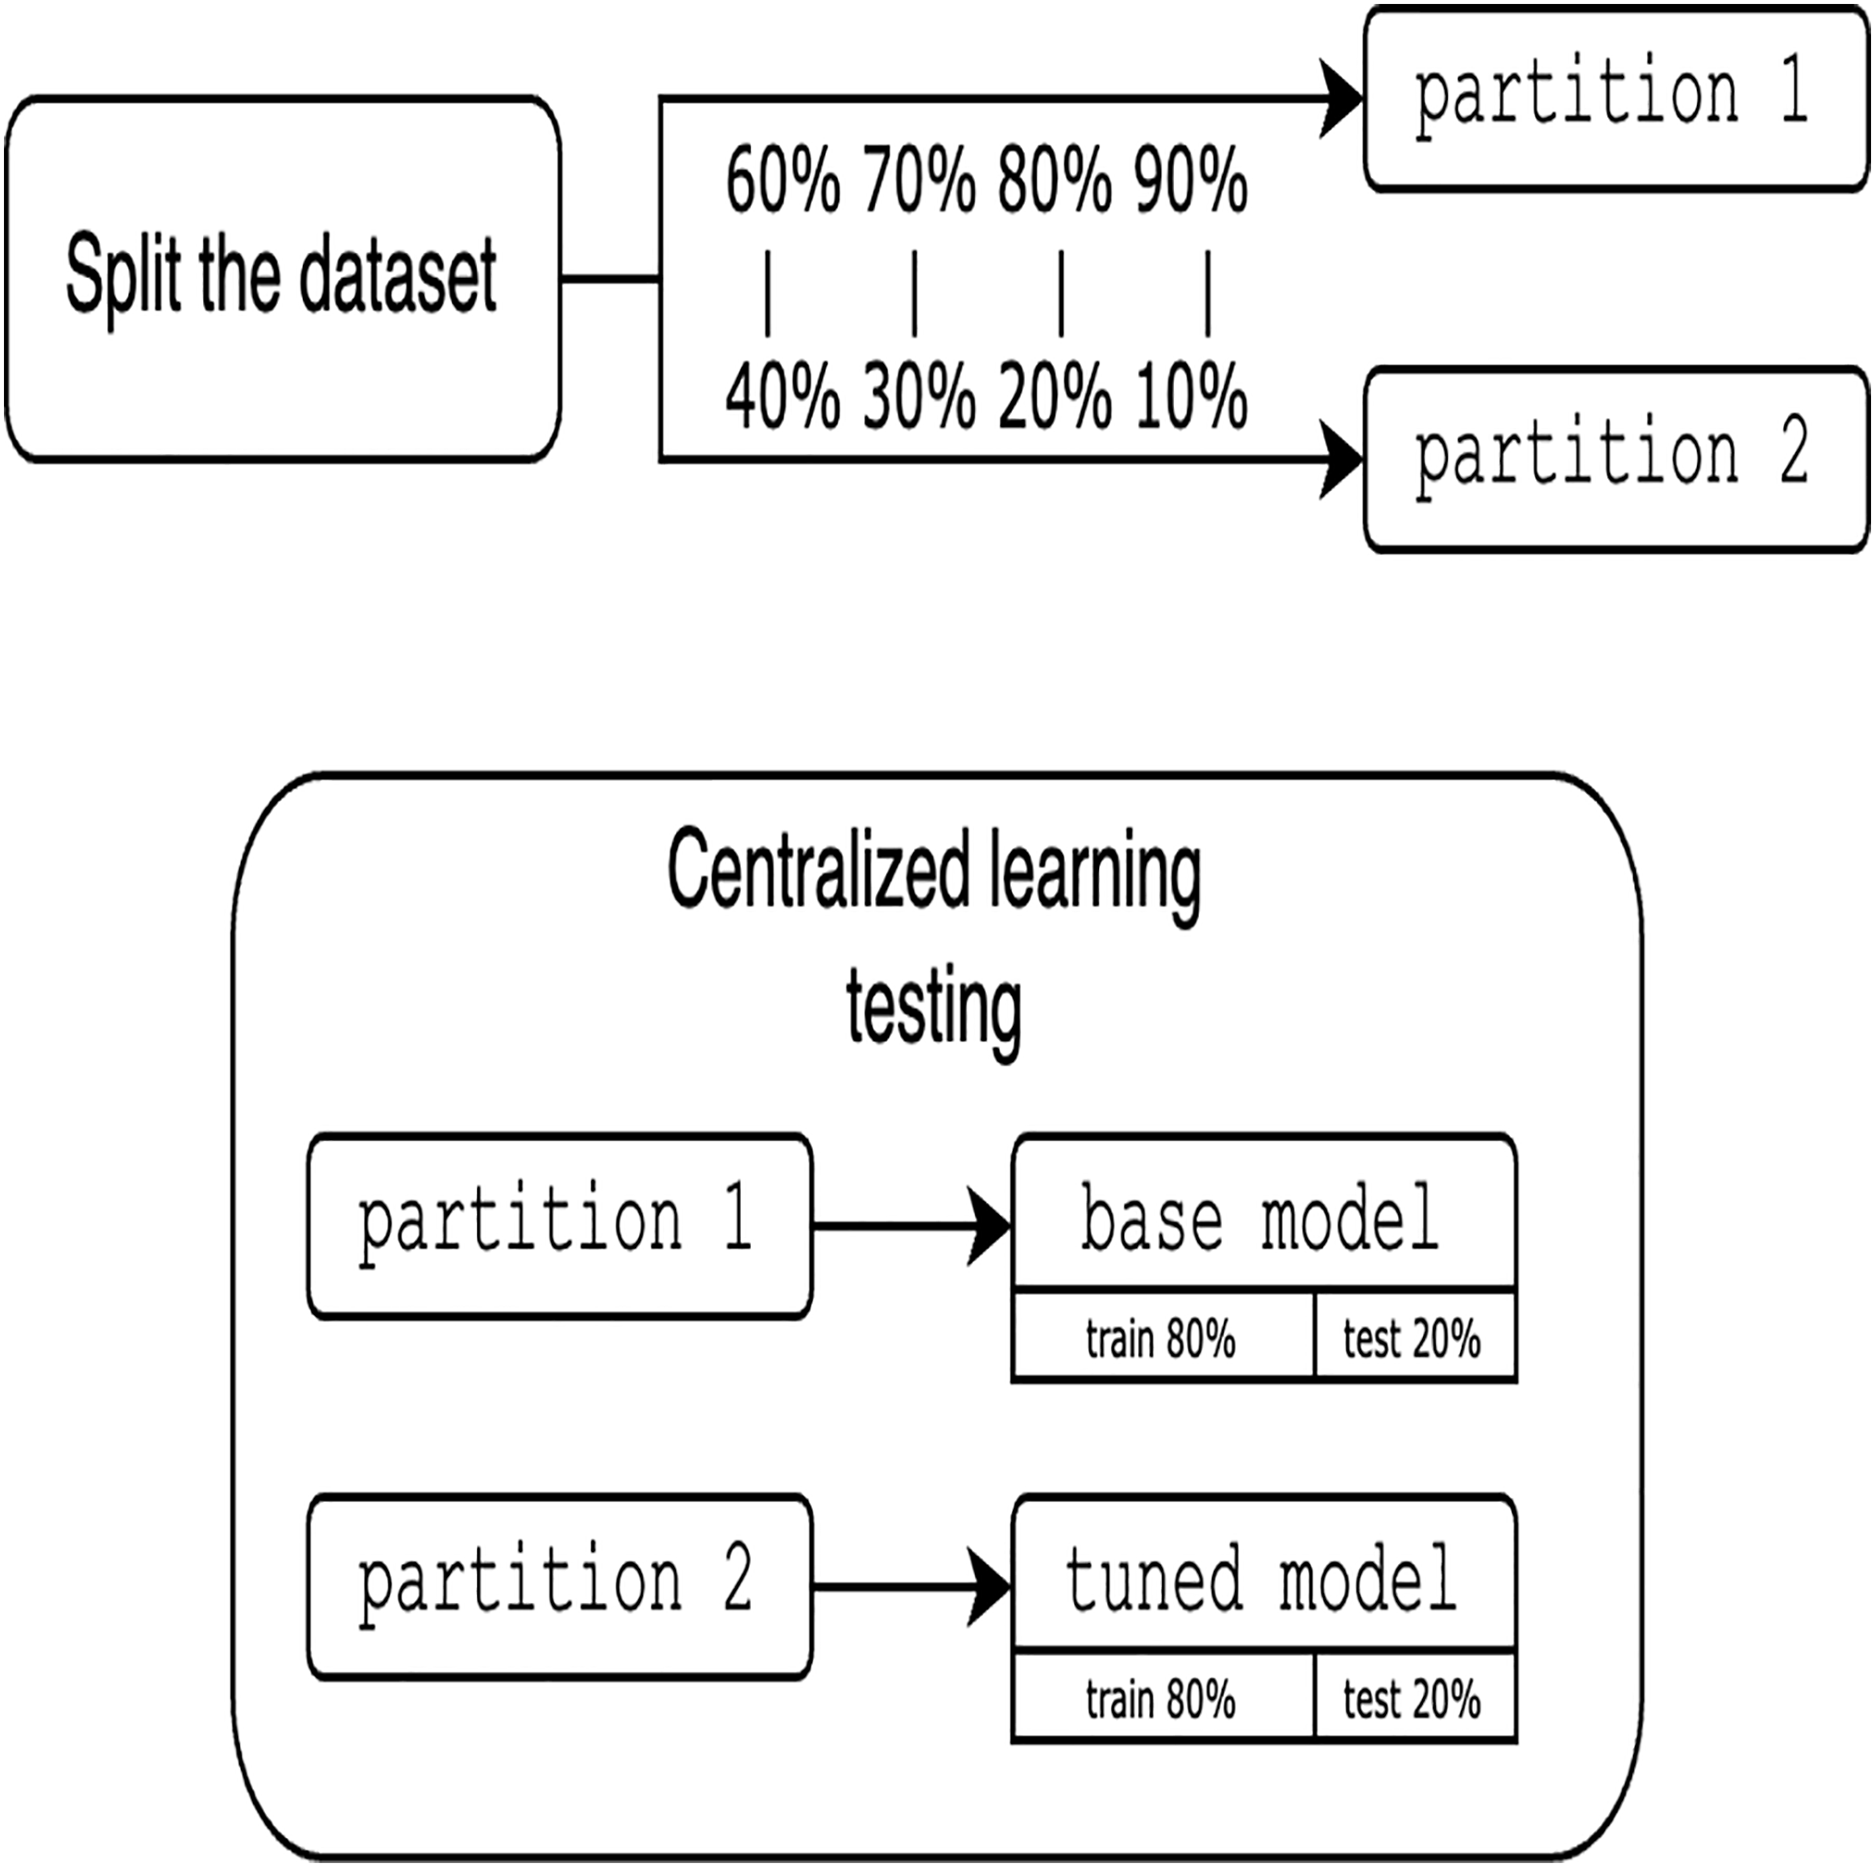
To avoid the complexity of network constraints (latency and bandwidth limitations), heterogeneity of devices with different computing resources, security challenges, and the overhead of a distributed environment, we prioritize local simulation, focused on validating the key features of the proposed approach (i.e., the feasibility of FHIR with FL). Local simulation also aims to ensure the reproducibility of this work. Since experiments are simulated locally using only one dataset, it is crucial to clarify the approach for partitioning the data. One of the main advantages of using a single dataset is that it allows us to rigorously establish and evaluate the proposed methodology and platform for FL integrated with FHIR. Moreover, the use of a single, well-characterized dataset allows us to systematically study the main performance characteristics of our approach and ensures the robustness of our experimental setup. Assessing the solution requires utilizing various partition proportions and considering different numbers of clients. To guarantee a fair comparison between centralized and FL models, the data is divided into pairs of 60%/40%, 70%/30%, 80%/20%, and 90%/10%, resulting in two distinct partitions. It is important to note that these partitioning proportions are used to assess the sensitivity of model performance to different volumes of training data and to simulate scenarios with varying degrees of data sparsity at each client. This approach allows us to explore the robustness of federated and centralized learning under different data availability conditions and to observe the effect of different proportions on the comparative performance of the two learning paradigms. The other major reason for these proportions is to provide a range of more balanced partitionings for highly imbalanced scenarios, which presents a range of data distribution challenges. The first partition is trained using traditional centralized techniques. The resultant model, termed base model is then tuned and tested with the second partition for the CL evaluation, as shown in Fig. 6.
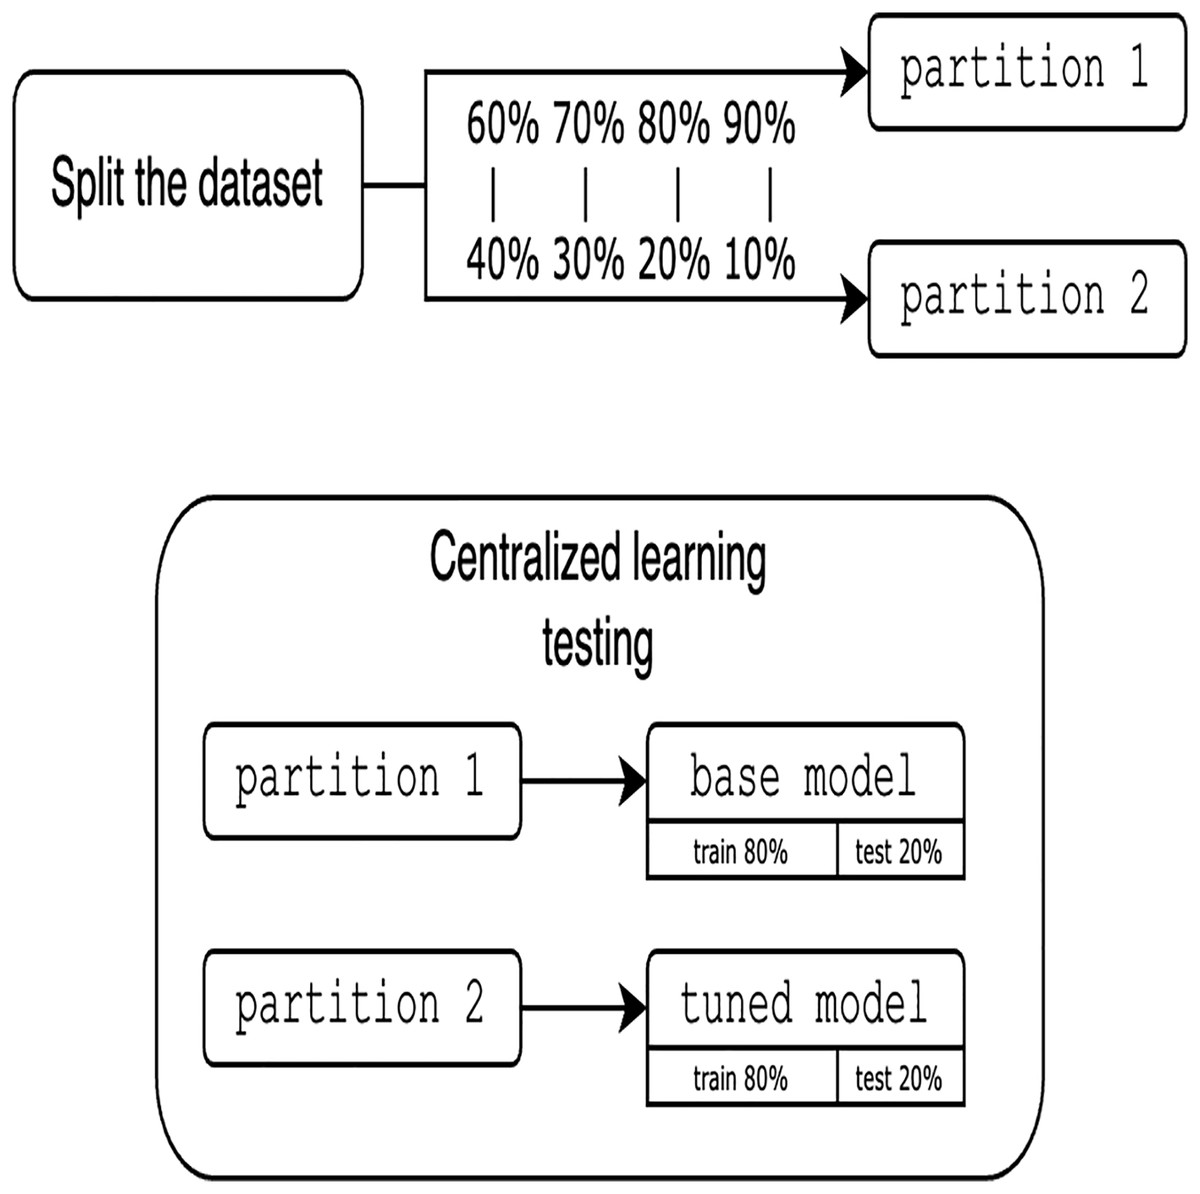
Figure 6: Evaluation of centralized learning.
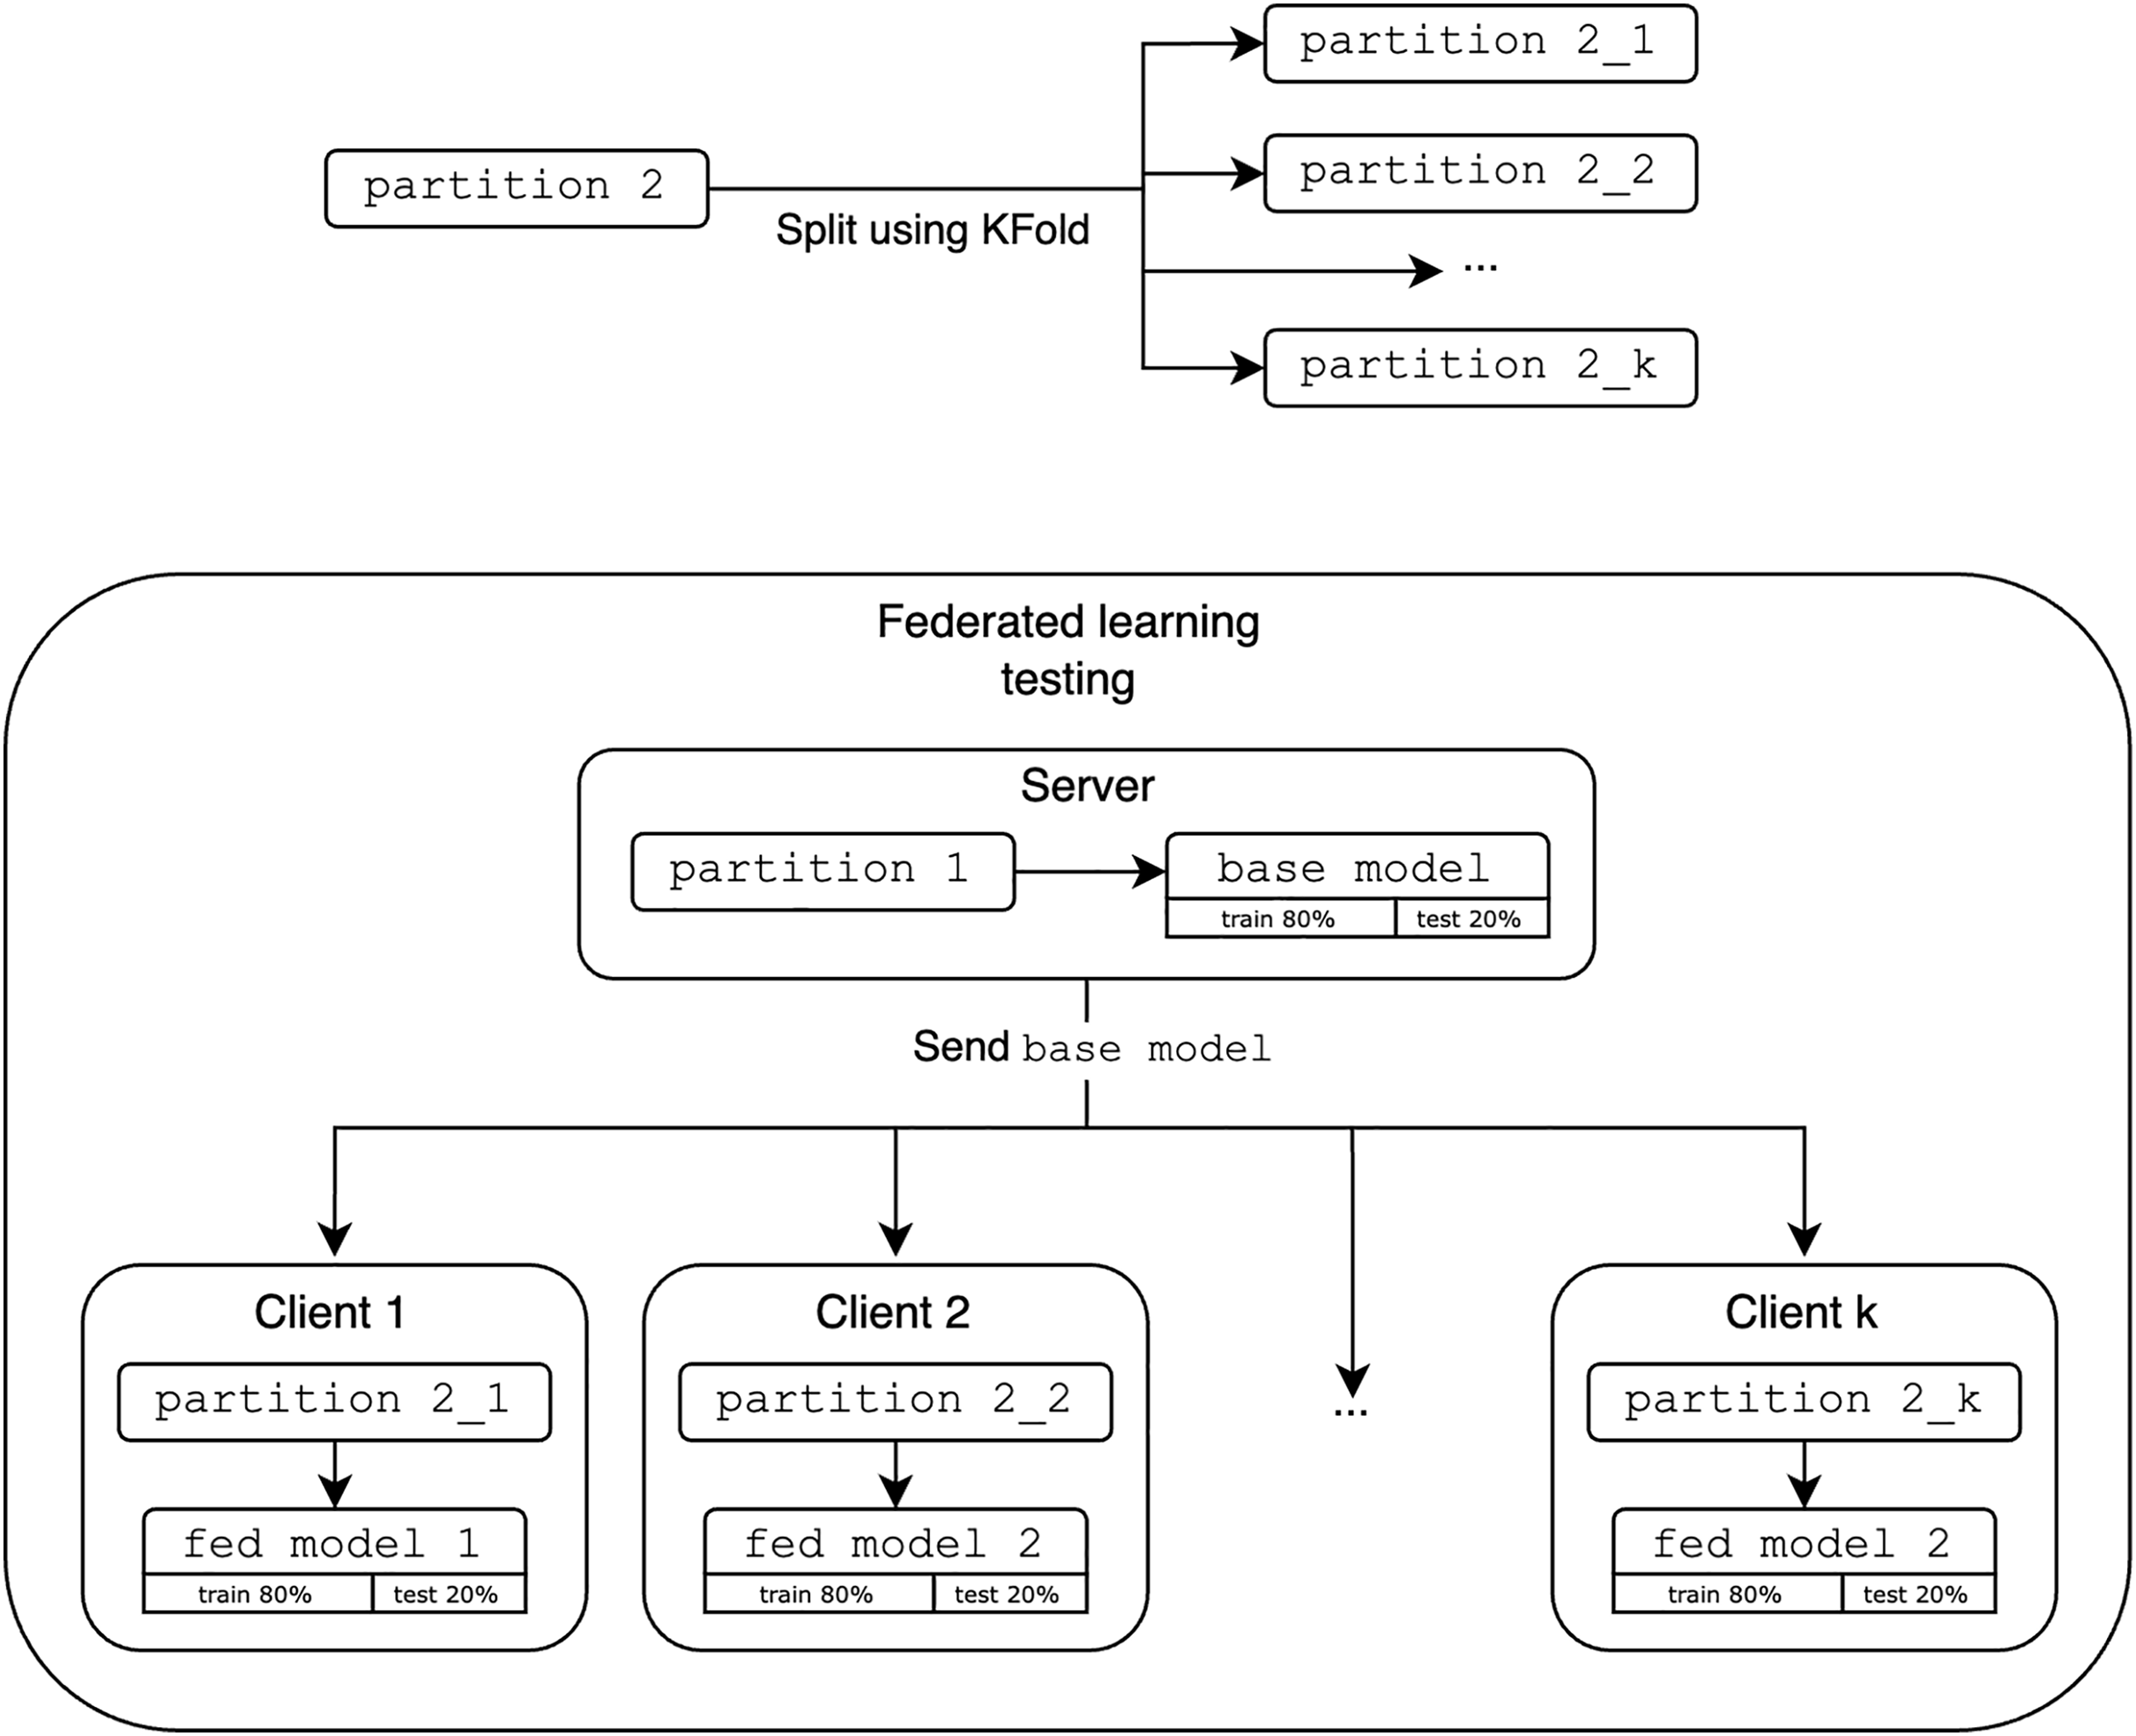
As shown in Fig. 7, the FL evaluation base model acts as the initial global model and is distributed to k clients. In this study, we use k clients as 2, 4 and 8 to demonstrate the fundamentals of FL in a simulated environment and observe the performance trends as the number of participating clients increases to provide meaningful insight into the system behavior with the different number of participating clients k. The second partition is then split using KFold (StratifiedKFold is excluded as it does not represent realistic scenarios where the data is not IID and may not reflect the entire dataset) and distributed among these k clients. Each client refines the global model with their new data fold. These results are aggregated and compared to the performance of the optimized centralized models.
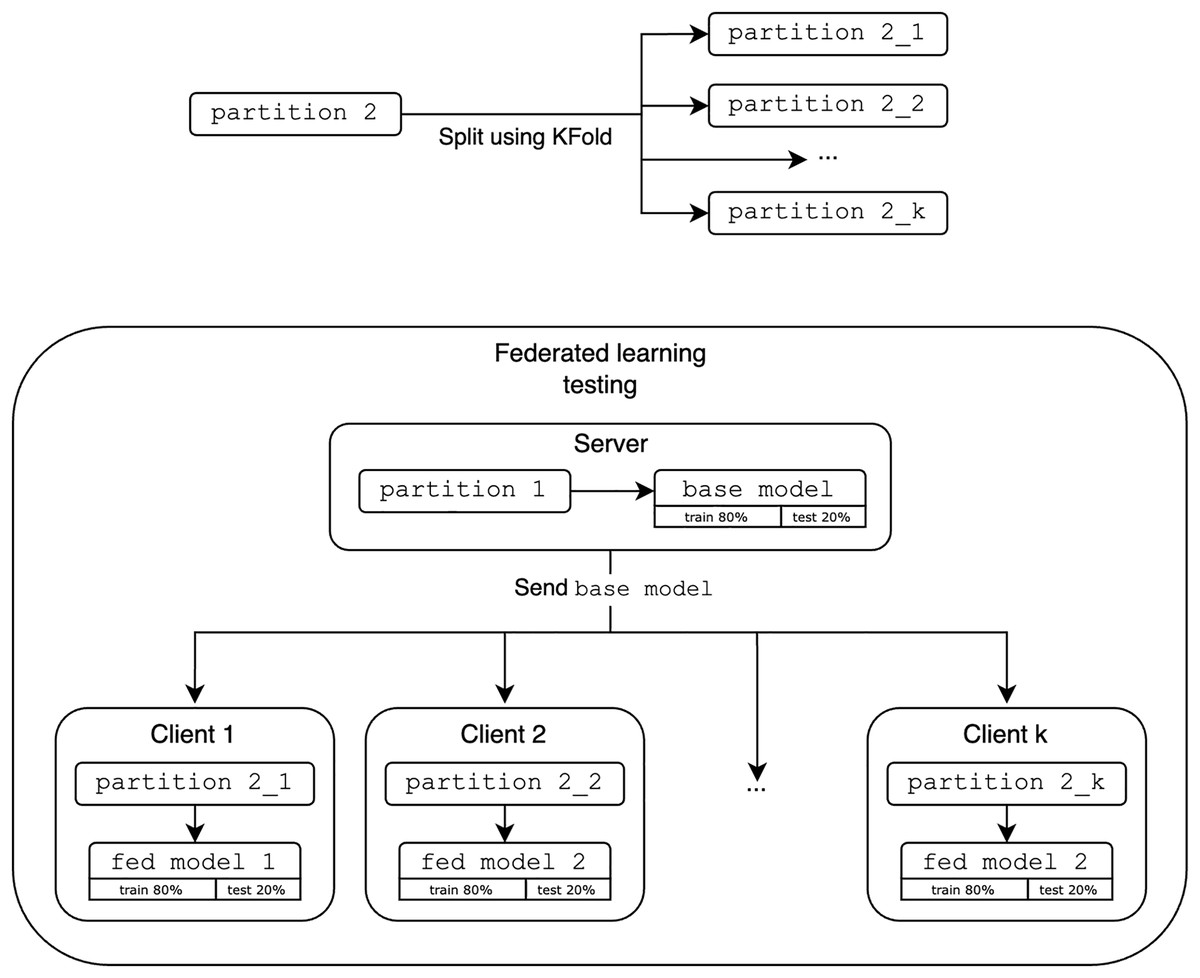
Figure 7: Evaluation of federated learning.
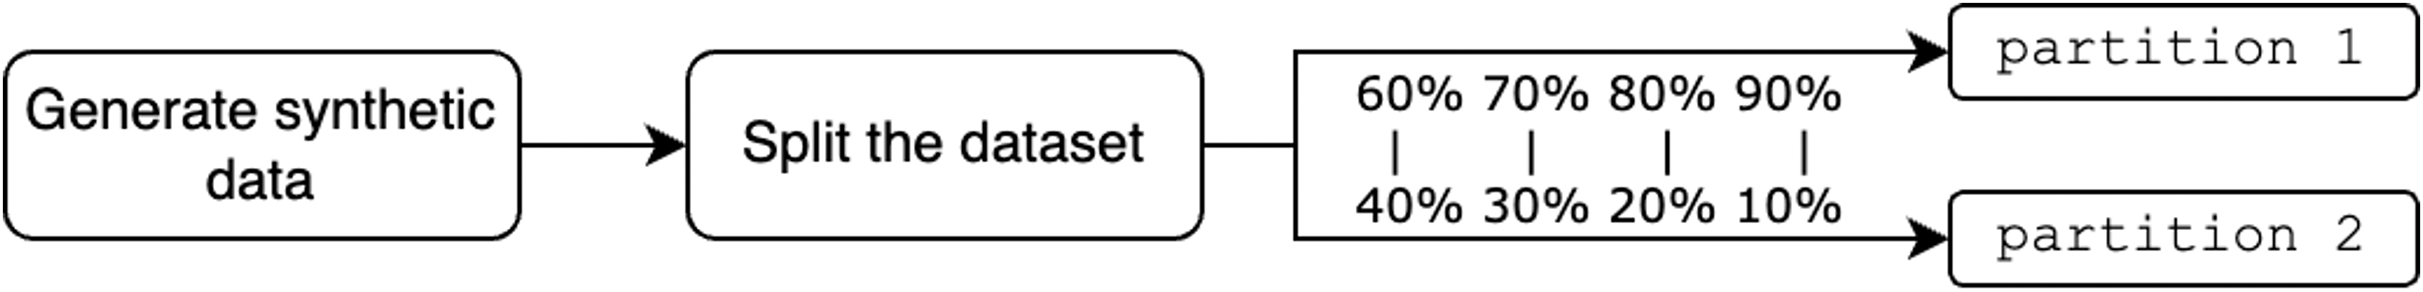
Regarding synthetic data, the evaluations are performed exactly as in CL and FL, but the initial dataset followed the synthetic data generation process as shown in Fig. 8.
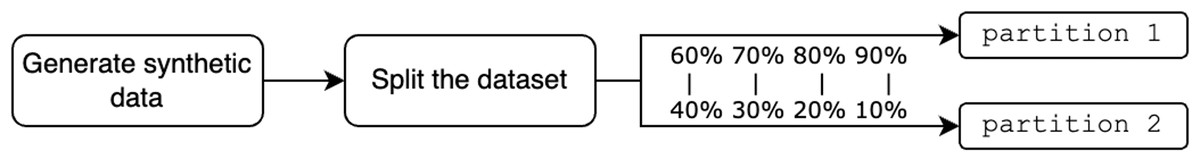
Figure 8: Generation of synthetic data.
Performance evaluation
Not all models can be trained in a federated manner since it depends on the support of incremental (or online) learning, such that the models are continually updated and trained as new data becomes available, without the need to retrain from scratch. PyCaret provides five such models: Extra Trees, LightGBM, Extreme Gradient Boosting, Random Forest, and CatBoost. Thus, the results are obtained using those models. Additionally, to simplify the representation of results, models are referred to by codenames instead of their full names. For example, et stands for Extra Trees, xgboost for Extreme Gradient Boosting, rf for Random Forest, lightgbm for LightGBM, and catboost for CatBoost. While the experiments are conducted on various data partitions, only the 80%/20% split is discussed here. Note, that in the upcoming figures, the x-axis represents the number of clients k and the y-axis represents the metric.
Classification
This subsection discusses the simulation results for classification experiments, using metrics described in Table 1 for evaluation. This table presents the key metrics for evaluating classification models. Accuracy indicates overall accuracy, precision and recall focus on the model’s ability to correctly identify positive cases, F1 score balances precision and recall, and kappa and Matthews correlation coefficient (MCC) measure agreement beyond chance. For a detailed explanation of these evaluation metrics, see Chua, Sii & Ellyza Nohuddin (2022).
| Metric | Formula |
|---|---|
| Accuracy | |
| Precision | |
| Recall | |
| F1 | |
| Log Loss | |
| Kappa | where is the observed agreement and is the expected agreement |
| MCC |
Apple Watch dataset
In the analysis of the Apple Watch dataset, the FL approach demonstrated compatible performance compared to CL across multiple evaluation metrics and data partitions. For instance, in the 80%/20% partition, the FL models consistently achieved higher F1-scores than their CL counterparts, with the Random Forest and CatBoost algorithms exhibiting an F1-score of 0.8168 and 0.76065 for FL vs. 0.7951 and 0.7277 for CL as shown in Table 2. Note that the values highlighted in bold represent the best results. Additionally, the FL approach exhibited higher MCC scores, as proven by the Extra Trees model’s MCC of 0.8233 for FL, outperforming the CL model’s MCC of 0.8196. Furthermore, the FL models’ advantage in accuracy, with the Extra Trees algorithm achieving 0.8750 accuracy for FL compared to 0.8503 for CL (k = 8). Lastly, the FL models’ performance matches their CL counterparts in terms of Kappa values, exemplified by the CatBoost model’s Kappa of 0.7699 (FL) vs. 0.6714 (CL).
| Type | Model | k | Accuracy | F1 | Kappa | MCC |
|---|---|---|---|---|---|---|
| CL | xgboost | 2 | 0.7823 | 0.7829 | 0.7371 | 0.7377 |
| FL | xgboost | 2 | 0.7905 | 0.7801 | 0.7471 | 0.7506 |
| CL | lightgbm | 2 | 0.7007 | 0.7029 | 0.6376 | 0.6383 |
| FL | lightgbm | 2 | 0.7095 | 0.6967 | 0.6493 | 0.6537 |
| CL | catboost | 2 | 0.7279 | 0.7277 | 0.6714 | 0.6715 |
| FL | catboost | 2 | 0.7635 | 0.7457 | 0.7142 | 0.7195 |
| CL | rf | 2 | 0.7959 | 0.7951 | 0.7532 | 0.7535 |
| FL | rf | 2 | 0.8176 | 0.8156 | 0.7789 | 0.7825 |
| CL | et | 2 | 0.8503 | 0.8518 | 0.8189 | 0.8196 |
| FL | et | 2 | 0.8244 | 0.8134 | 0.7878 | 0.7910 |
| CL | xgboost | 4 | 0.7823 | 0.7829 | 0.7371 | 0.7377 |
| FL | xgboost | 4 | 0.7770 | 0.7734 | 0.7293 | 0.7346 |
| CL | lightgbm | 4 | 0.7007 | 0.7029 | 0.6376 | 0.6383 |
| FL | lightgbm | 4 | 0.6892 | 0.6909 | 0.6215 | 0.6267 |
| CL | catboost | 4 | 0.7279 | 0.7277 | 0.6714 | 0.6715 |
| FL | catboost | 4 | 0.7635 | 0.7607 | 0.7123 | 0.7156 |
| CL | rf | 4 | 0.7959 | 0.7951 | 0.7532 | 0.7535 |
| FL | rf | 4 | 0.8176 | 0.8168 | 0.7785 | 0.7827 |
| CL | et | 4 | 0.8503 | 0.8518 | 0.8189 | 0.8196 |
| FL | et | 4 | 0.8514 | 0.852 | 0.8198 | 0.8233 |
| CL | xgboost | 8 | 0.7823 | 0.7829 | 0.7371 | 0.7377 |
| FL | xgboost | 8 | 0.7566 | 0.7467 | 0.7044 | 0.7158 |
| CL | lightgbm | 8 | 0.7007 | 0.7029 | 0.6376 | 0.6383 |
| FL | lightgbm | 8 | 0.7631 | 0.7516 | 0.711 | 0.7203 |
| CL | catboost | 8 | 0.7279 | 0.7277 | 0.6714 | 0.6715 |
| FL | catboost | 8 | 0.8092 | 0.8008 | 0.7671 | 0.7775 |
| CL | rf | 8 | 0.7959 | 0.7951 | 0.7532 | 0.7535 |
| FL | rf | 8 | 0.7961 | 0.7908 | 0.7516 | 0.7588 |
| CL | et | 8 | 0.8503 | 0.8518 | 0.8189 | 0.8196 |
| FL | et | 8 | 0.875 | 0.8694 | 0.8486 | 0.8571 |
Experiments on the Apple Watch dataset reveal that FL outperforms or matches CL in key metrics such as F1 score, MCC, accuracy, and Kappa values across various algorithms and data partitions, demonstrating its viability for processing wearable sensor data.
HARTH dataset
In the next experiment utilizing the HARTH dataset, FL models are being slightly outperformed by CL models in terms of F1-score across different models, but Random Forest and Extra Trees showed the best results achieving an F1-score of 0.92075 and 0.9222 compared to the CL model’s 0.9293 and 0.9287 as shown in Table 3. In the next experiment, FL models demonstrated analogous Kappa scores, particularly with the FL Random Forest and Extra Trees models scoring 0.89915 and 0.9028 against the CL model’s 0.9089 and 0.9089. Another experiment showed that FL models are compatible with CL in terms of accuracy, with the FL Extra Trees model reaching an accuracy of 0.93495 compared to the CL model’s 0.9397. Finally, FL models achieved similar MCC values, exemplified by the FL Random Forest model’s MCC of 0.905825 almost equal to the CL model’s 0.9105.
| Type | Model | k | Accuracy | F1 | Kappa | MCC |
|---|---|---|---|---|---|---|
| CL | xgboost | 2 | 0.9339 | 0.9263 | 0.9009 | 0.9020 |
| FL | xgboost | 2 | 0.9281 | 0.9203 | 0.8923 | 0.8933 |
| CL | lightgbm | 2 | 0.8547 | 0.8521 | 0.7863 | 0.7865 |
| FL | lightgbm | 2 | 0.7421 | 0.7450 | 0.6469 | 0.6581 |
| CL | catboost | 2 | 0.9339 | 0.9270 | 0.9011 | 0.9020 |
| FL | catboost | 2 | 0.9294 | 0.9218 | 0.8942 | 0.8952 |
| CL | rf | 2 | 0.9395 | 0.9293 | 0.9089 | 0.9105 |
| FL | rf | 2 | 0.9314 | 0.9207 | 0.8966 | 0.8982 |
| CL | et | 2 | 0.9397 | 0.9287 | 0.9089 | 0.9108 |
| FL | et | 2 | 0.9349 | 0.9222 | 0.9018 | 0.9038 |
| CL | xgboost | 4 | 0.9339 | 0.9263 | 0.9009 | 0.9020 |
| FL | xgboost | 4 | 0.9212 | 0.9140 | 0.8821 | 0.8829 |
| CL | lightgbm | 4 | 0.8547 | 0.8521 | 0.7863 | 0.7865 |
| FL | lightgbm | 4 | 0.7607 | 0.7617 | 0.6510 | 0.6528 |
| CL | catboost | 4 | 0.9339 | 0.9270 | 0.9011 | 0.9020 |
| FL | catboost | 4 | 0.9274 | 0.9197 | 0.8910 | 0.8921 |
| CL | rf | 4 | 0.9395 | 0.9293 | 0.9089 | 0.9105 |
| FL | rf | 4 | 0.9332 | 0.9214 | 0.8992 | 0.901 |
| CL | et | 4 | 0.9397 | 0.9287 | 0.9089 | 0.9108 |
| FL | et | 4 | 0.9357 | 0.9242 | 0.9028 | 0.9049 |
| CL | xgboost | 8 | 0.9339 | 0.9263 | 0.9009 | 0.9020 |
| FL | xgboost | 8 | 0.9198 | 0.9094 | 0.8791 | 0.8808 |
| CL | lightgbm | 8 | 0.8547 | 0.8521 | 0.7863 | 0.7865 |
| FL | lightgbm | 8 | 0.5807 | 0.5754 | 0.4213 | 0.4303 |
| CL | catboost | 8 | 0.9339 | 0.9270 | 0.9011 | 0.9020 |
| FL | catboost | 8 | 0.9263 | 0.9169 | 0.8890 | 0.8907 |
| CL | rf | 8 | 0.9395 | 0.9293 | 0.9089 | 0.9105 |
| FL | rf | 8 | 0.9363 | 0.9262 | 0.9039 | 0.9058 |
| CL | et | 8 | 0.9397 | 0.9287 | 0.9089 | 0.9108 |
| FL | et | 8 | 0.9367 | 0.9246 | 0.9042 | 0.9064 |
The experiment with the HARTH dataset shows that while FL slightly trails CL in F1-score, it maintains competitive performance in Kappa, accuracy, and MCC values, demonstrating the robustness and near-equivalence of FL in wearable sensor data analysis.
Regression
This subsection discusses the simulation results for regression experiments, using metrics described in Table 4 for evaluation. This table presents key metrics for evaluating regression models. Root mean square error (RMSE) and mean absolute error (MAE) measure the average magnitude of prediction errors. R-squared (R2) indicates the proportion of variance explained by the model, and mean absolute error (MAPE) expresses the error as a percentage.
| Metric | Formula |
|---|---|
| R2 | |
| MAE | |
| MSE | |
| RMSE | |
| MAPE | |
| MPE |
Mi Band dataset
Observing the Mi Band dataset results, it is unclear whether the results of FL models are comparable with CL models. Note that in terms of RMSE, MAE, and MAPE it is better to have lower values. In the first experiment, with emphasis on RMSE, the FL versions of Random Forest and Extra Trees performed notably better than the CL versions as shown in Table 5. When comparing the MAE, the FL model of Random Forest consistently shows better results with an MAE of 35.833938, which is much lower than the CL version’s MAE of 58.9688. When evaluating the R-squared metric, the FL version of Random Forest demonstrates a superior R-squared value of 0.84735, suggesting improved model fit and generalization abilities in comparison to the CL version’s R-squared of 0.5712. Finally, the FL versions of Random Forest and XGBoost surpass the CL version in terms of MAPE, with scores of 0.162725 and 0.289463 to 0.1808 and 0.299, respectively.
| Type | Model | k | MAE | MAPE | RMSE | R2 |
|---|---|---|---|---|---|---|
| CL | xgboost | 2 | 80.7234 | 0.2990 | 175.7207 | 0.3732 |
| FL | xgboost | 2 | 84.6606 | 0.2887 | 190.6013 | 0.1757 |
| CL | lightgbm | 2 | 56.2537 | 0.2494 | 102.3229 | 0.7875 |
| FL | lightgbm | 2 | 55.0917 | 0.2616 | 104.5867 | 0.7604 |
| CL | catboost | 2 | 59.5378 | 0.2006 | 133.4747 | 0.6384 |
| FL | catboost | 2 | 66.4891 | 0.2168 | 177.1278 | 0.2835 |
| CL | rf | 2 | 58.9688 | 0.1808 | 145.3486 | 0.5712 |
| FL | rf | 2 | 54.4051 | 0.1673 | 136.3432 | 0.5863 |
| CL | et | 2 | 60.8821 | 0.1798 | 178.1365 | 0.3559 |
| FL | et | 2 | 63.1281 | 0.1867 | 167.8168 | 0.3367 |
| CL | xgboost | 4 | 80.7234 | 0.2990 | 175.7207 | 0.3732 |
| FL | xgboost | 4 | 80.5563 | 0.2619 | 185.8783 | 0.0215 |
| CL | lightgbm | 4 | 56.2537 | 0.2494 | 102.3229 | 0.7875 |
| FL | lightgbm | 4 | 68.4518 | 0.3542 | 116.4871 | 0.7082 |
| CL | catboost | 4 | 59.5378 | 0.2006 | 133.4747 | 0.6384 |
| FL | catboost | 4 | 72.1597 | 0.2821 | 141.9439 | 0.6008 |
| CL | rf | 4 | 58.9688 | 0.1808 | 145.3486 | 0.5712 |
| FL | rf | 4 | 57.8445 | 0.1788 | 112.599 | 0.7283 |
| CL | et | 4 | 60.8821 | 0.1798 | 178.1365 | 0.3559 |
| FL | et | 4 | 69.8300 | 0.2215 | 131.7045 | 0.6446 |
| CL | xgboost | 8 | 80.7234 | 0.2990 | 175.7207 | 0.3732 |
| FL | xgboost | 8 | 68.2938 | 0.2895 | 137.1146 | 0.3150 |
| CL | lightgbm | 8 | 56.2537 | 0.2494 | 102.3229 | 0.7875 |
| FL | lightgbm | 8 | 45.2727 | 0.2716 | 68.7009 | 0.7929 |
| CL | catboost | 8 | 59.5378 | 0.2006 | 133.4747 | 0.6384 |
| FL | catboost | 8 | 48.6732 | 0.1928 | 87.6797 | 0.6603 |
| CL | rf | 8 | 58.9688 | 0.1808 | 145.3486 | 0.5712 |
| FL | rf | 8 | 35.8339 | 0.1627 | 62.9584 | 0.8474 |
| CL | et | 8 | 60.8821 | 0.1798 | 178.1365 | 0.3559 |
| FL | et | 8 | 44.2294 | 0.201 | 82.3557 | 0.7238 |
The analysis of the Mi Band dataset indicates that FL models generally outperform CL models in RMSE, MAE, R-squared, and MAPE metrics, showcasing their superior performance and efficiency in wearable sensor data processing.
DAT263x dataset
Based on the results for the DAT263x dataset, we observe that FL models generally outperform their CL counterparts across different partitions and evaluation metrics. Focusing on the RMSE, the FL model of Random Forest demonstrates better results than the CL as shown in Table 6. The same situation happens for MAE metric, only FL versions of Random Forest and Extra Trees may outperform CL, while the FL variant of CatBoost achieves an MAE of 0.4802, slightly higher than its CL counterpart’s MAE of 0.4466. Assessing the R-squared metric, the FL variant of Random Forest and Extra Trees exhibits an impressive R-squared value of 0.9982 and 0.998725, indicating better model fit and generalization capabilities compared to its CL counterparts. Lastly, focusing on the MAPE, the FL variants of Random Forest sometimes outperform their CL counterparts, achieving lower values of MAPE, while for other values of k, the results remain pretty equitable.
| Type | Model | k | MAE | MAPE | RMSE | R2 |
|---|---|---|---|---|---|---|
| CL | xgboost | 2 | 1.6568 | 0.0295 | 2.3841 | 0.9986 |
| FL | xgboost | 2 | 1.6566 | 0.0278 | 2.4216 | 0.9985 |
| CL | lightgbm | 2 | 1.1604 | 0.0237 | 1.6357 | 0.9993 |
| FL | lightgbm | 2 | 1.3611 | 0.0277 | 1.9127 | 0.999 |
| CL | catboost | 2 | 0.4466 | 0.0116 | 0.5867 | 0.9999 |
| FL | catboost | 2 | 0.4802 | 0.0126 | 0.6343 | 0.9999 |
| CL | rf | 2 | 1.7734 | 0.0285 | 2.7522 | 0.9981 |
| FL | rf | 2 | 1.703 | 0.0277 | 2.6049 | 0.9983 |
| CL | et | 2 | 1.5011 | 0.0234 | 2.3334 | 0.9987 |
| FL | et | 2 | 1.5064 | 0.024 | 2.3356 | 0.9986 |
| CL | xgboost | 4 | 1.6568 | 0.0295 | 2.3841 | 0.9986 |
| FL | xgboost | 4 | 1.7225 | 0.032 | 2.4611 | 0.9985 |
| CL | lightgbm | 4 | 1.1604 | 0.0237 | 1.6357 | 0.9993 |
| FL | lightgbm | 4 | 1.3370 | 0.0299 | 1.8577 | 0.9992 |
| CL | catboost | 4 | 0.4466 | 0.0116 | 0.5867 | 0.9999 |
| FL | catboost | 4 | 0.512 | 0.0159 | 0.7042 | 0.9999 |
| CL | rf | 4 | 1.7734 | 0.0285 | 2.7522 | 0.9981 |
| FL | rf | 4 | 1.7735 | 0.0312 | 2.7088 | 0.9982 |
| CL | et | 4 | 1.5011 | 0.0234 | 2.3334 | 0.9987 |
| FL | et | 4 | 1.4987 | 0.0257 | 2.2598 | 0.9987 |
| CL | xgboost | 8 | 1.6568 | 0.0295 | 2.3841 | 0.9986 |
| FL | xgboost | 8 | 1.8606 | 0.0327 | 2.6008 | 0.9983 |
| CL | lightgbm | 8 | 1.1604 | 0.0237 | 1.6357 | 0.9993 |
| FL | lightgbm | 8 | 1.4603 | 0.0283 | 1.9754 | 0.999 |
| CL | catboost | 8 | 0.4466 | 0.0116 | 0.5867 | 0.9999 |
| FL | catboost | 8 | 0.5355 | 0.0132 | 0.7166 | 0.9999 |
| CL | rf | 8 | 1.7734 | 0.0285 | 2.7522 | 0.9981 |
| FL | rf | 8 | 1.6954 | 0.0264 | 2.4565 | 0.9985 |
| CL | et | 8 | 1.5011 | 0.0234 | 2.3334 | 0.9987 |
| FL | et | 8 | 1.4682 | 0.0221 | 2.2063 | 0.9988 |
The results from the DAT263x dataset indicate that FL models tend to outperform CL models on most metrics, such as RMSE, MAE, R-squared, and MAPE, demonstrating their better model fit and generalization performance in processing wearable sensor data.
Synthetic datasets
The evaluation is also performed on synthetic data from Apple Watch shown in Table 7 and Mi Band datasets shown in Table 8. Performance on these synthetic data sets was found to be broadly similar to that of the real data, albeit with a slight drop-off. This drop-off in performance can be attributed to the inherent limitations of synthetic data, which do not model the complexities of real-world variability as well. Models learned on synthetic datasets therefore cannot generalize as much to new real-world configurations, leading to issues such as overfitting or poor generalization. This makes it difficult to use synthetic data for training robust models and requires great care when simulating data for model testing.
| Type | Model | k | Accuracy | F1 | Kappa | MCC |
|---|---|---|---|---|---|---|
| CL | xgboost | 2 | 0.8624 | 0.8626 | 0.8347 | 0.8357 |
| FL | xgboost | 2 | 0.8254 | 0.8240 | 0.7897 | 0.7903 |
| CL | lightgbm | 2 | 0.8598 | 0.8607 | 0.8316 | 0.8323 |
| FL | lightgbm | 2 | 0.7936 | 0.7914 | 0.7516 | 0.7522 |
| CL | catboost | 2 | 0.8704 | 0.8709 | 0.8443 | 0.8449 |
| FL | catboost | 2 | 0.8307 | 0.8304 | 0.7961 | 0.7970 |
| CL | rf | 2 | 0.8307 | 0.8304 | 0.7966 | 0.7971 |
| FL | rf | 2 | 0.8175 | 0.8163 | 0.7806 | 0.7816 |
| CL | et | 2 | 0.8333 | 0.8352 | 0.7999 | 0.8003 |
| FL | et | 2 | 0.8571 | 0.8569 | 0.8283 | 0.8291 |
| CL | xgboost | 8 | 0.8624 | 0.8626 | 0.8347 | 0.8357 |
| FL | xgboost | 8 | 0.7786 | 0.7779 | 0.7323 | 0.7364 |
| CL | lightgbm | 8 | 0.8598 | 0.8607 | 0.8316 | 0.8323 |
| FL | lightgbm | 8 | 0.7266 | 0.7238 | 0.6693 | 0.6722 |
| CL | catboost | 8 | 0.8704 | 0.8709 | 0.8443 | 0.8449 |
| FL | catboost | 8 | 0.7995 | 0.7985 | 0.7574 | 0.7618 |
| CL | rf | 8 | 0.8307 | 0.8304 | 0.7966 | 0.7971 |
| FL | rf | 8 | 0.8255 | 0.8235 | 0.7897 | 0.7947 |
| CL | et | 8 | 0.8333 | 0.8352 | 0.7999 | 0.8003 |
| FL | et | 8 | 0.8281 | 0.8259 | 0.7929 | 0.7964 |
| Type | Model | k | MAE | MAPE | RMSE | R2 |
|---|---|---|---|---|---|---|
| CL | xgboost | 2 | 61.0546 | 0.2505 | 111.8685 | 0.6926 |
| FL | xgboost | 2 | 61.2773 | 0.2709 | 113.4315 | 0.6851 |
| CL | lightgbm | 2 | 51.9401 | 0.2293 | 92.1887 | 0.7913 |
| FL | lightgbm | 2 | 54.9092 | 0.2253 | 96.0003 | 0.7660 |
| CL | catboost | 2 | 47.1213 | 0.1725 | 94.2360 | 0.7819 |
| FL | catboost | 2 | 56.4724 | 0.2162 | 132.6429 | 0.5359 |
| CL | rf | 2 | 51.3832 | 0.2004 | 103.1989 | 0.7384 |
| FL | rf | 2 | 51.8509 | 0.192 | 105.7146 | 0.7183 |
| CL | et | 2 | 55.2975 | 0.2249 | 105.8004 | 0.7251 |
| FL | et | 2 | 48.528 | 0.1739 | 97.7883 | 0.7513 |
| CL | xgboost | 8 | 61.0546 | 0.2505 | 111.8685 | 0.6926 |
| FL | xgboost | 8 | 65.8528 | 0.2936 | 116.7600 | 0.6813 |
| CL | lightgbm | 8 | 51.9401 | 0.2293 | 92.1887 | 0.7913 |
| FL | lightgbm | 8 | 58.0431 | 0.3915 | 98.2643 | 0.7832 |
| CL | catboost | 8 | 47.1213 | 0.1725 | 94.2360 | 0.7819 |
| FL | catboost | 8 | 49.5009 | 0.2178 | 95.9313 | 0.7838 |
| CL | rf | 8 | 51.3832 | 0.2004 | 103.1989 | 0.7384 |
| FL | rf | 8 | 48.9094 | 0.1706 | 98.8223 | 0.7783 |
| CL | et | 8 | 55.2975 | 0.2249 | 105.8004 | 0.7251 |
| FL | et | 8 | 51.9627 | 0.1757 | 99.5822 | 0.7653 |
Random Forest and Extra Trees (or Extremely Randomized Trees) are two ensemble learning methods that often produce robust outcomes and are frequently mentioned together due to their similarities and effectiveness. Both methods are based on constructing multiple decision trees, which collectively contribute to more stable and accurate predictions than a single tree could achieve.
The core reason behind their strong performance is their foundational approach, where both use an ensemble of decision trees to perform classification or regression tasks. However, they differ in how they sample the data used to build these trees. Extra Trees introduces additional randomness into the model by selecting random thresholds for each feature rather than searching for the best possible thresholds like Random Forest does. Random Forest, on the other hand, uses bootstrapping to create different subsets of the original data for training each tree, meaning each tree in a Random Forest model learns from a slightly different sample of the data points.
Together, these methods leverage the strengths of decision trees while mitigating their tendency toward overfitting through averaging, resulting in consistent and reliable predictions. This explains why Random Forest and Extra Trees are both popular and effective for a wide range of data science tasks.
Statistical significance testing
We performed Wilcoxon Signed-Rank tests to rigorously test for performance differences between FL and CL models. This nonparametric test was chosen because it is well-suited to comparing paired data without assuming a normal distribution of differences, making it appropriate for our performance metric comparisons. We employed one-sided test (alternative=‘greater’) to test whether FL demonstrated statistically significant performance improvement over CL for each measure. Our analysis revealed many examples where FL performed statistically significantly better. In the case of the Apple Watch dataset using the 60%/40% split and k = 4 clients, FL models performed significantly better on several measures of classification, i.e., recall, precision, F1-score, Kappa, and MCC (p < 0.05). In the case of the HARTH dataset using the 60%/40% split, FL demonstrated statistically significantly smaller values for Log Loss at both k = 2 and k = 8 (p < 0.05), which indicates better calibration in the models. Additionally, for the Mi Band dataset using the 60%/40% split, FL models achieved significantly smaller values for the error rates of MAE, MSE, and RMSE at k = 4, and for MSE at k = 8 (p < 0.05), which indicates smaller prediction error. In the case of the DAT263x dataset, significantly using the 70%/30% and 90%/10% splits, FL performed better than CL in all tests using statistically significant decreases in the measures of the errors MAE, MSE, RMSE, MAPE, root mean squared logarithmic error (RMSLE) using all the client configurations (p < 0.05). While these specific examples indicate statistically significant gains for FL, in some other combinations of measures and configurations, Wilcoxon Signed-Rank tests did not show statistically significant differences in performance between FL and CL and therefore indicate the same level of performance in these scenarios.
Combining classification and regression algorithms
The integration of classification and regression models provides a sophisticated analytical framework that could significantly enhance the usefulness of wearable technologies in health monitoring. By using classification models to determine the type of physical activity and regression models to quantify specific outcomes such as calorie expenditure, this approach creates a multi-layered analytical process that optimizes accuracy and personalization. In other words, classification determines activity (e.g., walking, running), while regression quantifies aspects like intensity or duration (e.g., calorie expenditure, speed). Integrating these two elements allows for a more comprehensive and nuanced analysis of the user’s behavior and physiological response, providing richer insights than each task alone. While empirical testing is beyond the scope of this work, this combination represents a logical step to fully exploit the analytical potential of our platform and cover a broader spectrum of real-world healthcare monitoring applications.
In the absence of a suitable dataset, we can only hypothesize a potential integration of classification and regression models. One solution would be to use the results of classification models as input data for regression models, effectively combining the strengths of both approaches. The pipeline could begin with a classification model, which would leverage sensor data from wearable devices and identify the type of physical activity being performed. This could be walking, running, cycling, or other exercises. Classification could be based on movement patterns such as speed, frequency, and pace. Once the activity is classified, it would provide valuable information to the regression model. It would be complemented by other parameters that may influence calorie expenditure, such as activity duration, heart rate, and environmental factors such as temperature or altitude. The regression model, based on this data, provides an estimate of calories burned. This model is not only tailored to the type of activity, but also takes into account individual differences such as age, weight and physical condition of users, making the estimation more personalized and accurate.
In addition to individual fitness and health monitoring, this approach can also be used in clinical practice, where accurate monitoring of physical activity and energy expenditure is crucial for patient care, such as in rehabilitation or chronic disease management. It can also be used in sports science, where analyzing individual data is essential for optimizing athletes’ performance and recovery.
Discussion
An intuitive application was designed and created, integrating AutoML technologies, to facilitate the training of machine learning models on interoperable datasets, using FL and CL methodologies. The application developed during this study was specifically designed for end users without specific technical expertise in machine learning who wish to use an intuitive and user-friendly interface that simplifies model development, improvement, and testing. Thanks to intuitive design principles and automation capabilities, it allows for the management of complex machine learning processes and functionalities without specific technical skills.
The application not only simplifies the complexity of model training but also offers robust support for managing various datasets and model parameters, improving the overall user experience. Thanks to its integration with AutoML, the platform automatically selects the best algorithms and tuning parameters based on the data, significantly reducing the barriers to efficient model development and deployment. This approach allows even novice users to achieve high-quality results, making sophisticated data analysis tools more accessible.
Additionally, the application’s environment encourages experimentation and continuous learning. Users can visualize the effects of their adjustments in real time, fostering a better understanding of machine learning processes and driving innovation. The application also includes features for advanced users, such as options to manually adjust or extend AutoML configurations, providing flexibility and control where needed.
Overall, this application represents a significant step forward in democratizing machine learning, making it accessible and manageable for users of varying skill levels while ensuring that the models produced are both powerful and relevant to the user’s specific needs. However, this study can be extended to multiple datasets, a wider range of partition proportions, and a larger number of customers to enhance generalizability and robustness in the future.
Overall, it can be said that FL has its advantages over CL. This study shows that FL not only equals CL but also outperforms it in some cases. Table 9 compares FL and CL across various features and aspects, highlighting the strengths of each approach. FL excels in preserving data privacy as it avoids central data collection, supports reduced data movement by training models locally, and offers model personalization based on local data characteristics. It is also highly scalable to a large number of users since the learning process is distributed across multiple nodes. Moreover, FL promotes decentralized data repositories and utilizes distributed and parallel computation, which can optimize bandwidth usage by transmitting only model updates instead of raw data.
| Feature/Aspect | FL | CL |
|---|---|---|
| Data privacy | ✓ | ✗ |
| Reduced data movement | ✓ | ✗ |
| Model personalization | ✓ | ✗ |
| Scalability to large number of users | ✓ | ✗ |
| Data repository is decentralized | ✓ | ✗ |
| Distributed and parallel computation | ✓ | ✗ |
| Bandwidth optimization | ✓ | ✗ |
| Easier to implement and manage | ✗ | ✓ |
| Consistent data quality | ✗ | ✓ |
| Simpler data access patterns | ✗ | ✓ |
| Consistent data aggregation | ✗ | ✓ |
| Streamlined model training process | ✗ | ✓ |
On the other hand, CL tends to be easier to implement and manage due to its centralized nature. It generally ensures consistent data quality, benefits from simpler access patterns to the centralized data repository, and provides uniform data distribution, which can lead to more stable model training. Additionally, CL can offer higher model training efficiency due to the centralized processing power and streamlined data handling.
Conclusion
This study demonstrated how FL can significantly improve the privacy and interoperability of wearable sensor data in the healthcare sector. The research focused on integrating FL with the Fast Healthcare Interoperability Resources (FHIR) standard to enable seamless and privacy-compliant data analysis across heterogeneous healthcare systems. A comprehensive comparison between FL and CL demonstrated that FL outperforms CL in many aspects, including privacy and comparable performance in terms of efficiency in predictive tasks. The web application created with tools such as Streamlit, PyCaret, and Flower effectively illustrates the practical implementation of FL in the healthcare sector. Although this study demonstrated the effectiveness of FL and FHIR in a local simulation environment, several important limitations need to be addressed by future research. One of the main ones is the reliance on a single dataset and local execution of experiments. Future work could strengthen this approach by integrating multiple heterogeneous datasets, thus more closely replicating a distributed environment, adapted to network constraints and device heterogeneity. This extension would allow for a more realistic capture of the challenges and potential inherent in deploying FL in diverse real-world environments. Furthermore, further exploration of alternative FL approaches, including more advanced cryptographic methods such as homomorphic encryption and differential privacy, would strengthen privacy protection without unnecessarily compromising data utility. Another important avenue of research concerns the development of adaptive learning algorithms capable of dynamically reacting to variations in data distribution or device activity, thus preserving the relevance and accuracy of models over time. Addressing these identified areas of improvement can be essential to make the FL-based healthcare system even more robust, secure, and ultimately feasible for large-scale deployment in heterogeneous medical applications.