
Sentiment analysis of pilgrims using CNN-LSTM deep learning approach
- Published
- Accepted
- Received
- Academic Editor
- Stefano Cirillo
- Subject Areas
- Artificial Intelligence, Natural Language and Speech, Text Mining, Sentiment Analysis, Neural Networks
- Keywords
- Sentiment analysis, Crowed management, Deep learning, Convolutional neural networks, Long short-term memory, Hajj
- Copyright
- © 2024 Alasmari et al.
- Licence
- This is an open access article distributed under the terms of the Creative Commons Attribution License, which permits using, remixing, and building upon the work non-commercially, as long as it is properly attributed. For attribution, the original author(s), title, publication source (PeerJ Computer Science) and either DOI or URL of the article must be cited.
- Cite this article
- 2024. Sentiment analysis of pilgrims using CNN-LSTM deep learning approach. PeerJ Computer Science 10:e2584 https://doi.org/10.7717/peerj-cs.2584
Abstract
Crowd management refers to the management and control of masses at specific locations. A Hajj gathering is an example. Hajj is the biggest gathering of Muslims worldwide. Over two million Muslims from all over the globe come annually to Makkah, Saudi Arabia. Authorities of Saudi Arabia strive to provide comfortable comprehensive services to pilgrims using the latest modern technologies. Recent studies have focused on camera scenes and live streaming to assess the count and monitor the behavior of the crowd. However, the opinions of the pilgrims and their feelings about their experience of Hajj are not well known, and the data on social media (SM) is limited. This paper provides a combination of Convolutional Neural Networks (CNN) and Long Short-Term Memory (LSTM) algorithms for sentiment analysis of pilgrims using a novel and specialized dataset, namely Catering-Hajj. The model is based on four CNN layers for local feature extraction after the One-Hot Encoder, and one LSTM layer to maintain long-term dependencies. The generated feature maps are passed to the SoftMax layer to classify final outputs. The proposed model is applied to a real case study of issues related to pre-prepared food at Hajj 1442. Started with collecting the dataset, extracting target attitudes, annotating the data correctly, and analyzing the positive, negative, and neutral attitudes of the pilgrims to this event. Our model is compared with a set of Machine Learning (ML) models including Support Vector Machine (SVM), Logistic Regression (LR), Decision Tree (DT), and Random Forest (RF), as well as CNN and LSTM models. The experimental results show that SVM, RF, and LSTM achieve the same rate of roughly 81%. LR and CNN achieve 79%, and DT achieves 71%. The proposed model outperforms other classifiers on our dataset by 92%.
Introduction
Crowd management and control are mandatory in many situations, owing to the need to safeguard human life. Ignoring the need for crowd management can result in massive disasters. People who gather in the same spot with a shared goal, purpose, or focus of attention are called a crowd. Many reasons could be given for the frequent occurrences of overcrowding during religious festivals or at holy sites, as well as at sporting events, concert events, political rallies, or transport stations. Crowd-related issues cause security, health, social, and physical problems, and sometimes they cause death.
From an urban planning perspective for smart cities, crowd abnormality detection and analysis are one of the most pivotal fields in crowd management such as crowded pedestrians, traffic, pollution, energy consumption, etc. It is possible to observe behavior abnormalities in crowds and the future scenarios of these situations to prevent them and make the best decision-making and planning. The ability to observe, detect, control, and predict the crowds’ behavior is a fundamental enabling driver to enhance the limitless possibilities of smart cities, leading to a better quality of life for individuals and communities. Advanced prediction for future expectations is an effective life-saving tool in many situations. Responding to critical notifications immediately is crucial in situations that involve sensitive reactions. For example, tracking the pandemic through urban areas may limit its spread away. Otherwise, a violation of crowd management can lead to dangerous outcomes for individuals that may result in a loss of lives or property. Furthermore, the trust and loyalty of individuals will be lost to organizations responsible for organizing the event in the future. As we have earlier proved in our review (Alasmari, Farooqi & Alotaibi, 2024) a lot of research on crowd management are still limited to using visual data that focuses absolutely on crowd scene analysis under the computer vision field.
Many people use social media (SM) applications for daily updates. SM platforms play an important role in influencing people’s opinions and attitudes. This social influence becomes apparent when an exciting local or global issue, phenomenon, or event occurs, such as The ‘Arab Spring’ in the Middle East and North Africa (MENA) region that took place from 2010 to 2012 (Khondker, 2011), the US presidential election in 2016 (Carlson, 2020), and political campaigns in the central State of Mexico (Sandoval-Almazan & Valle-Cruz, 2018), where protesters used various SM platforms to stir up popular anger and incite riots. Another example is the FIFA World Cup 2022 in Qatar (Dun et al., 2022), where Qatar’s nation-branding attempts to enhance soft power among the public were reflected in the images broadcast internationally before this popular sporting event began. For the annual carnivals held during Riyadh Season, the Snapchat platform has been utilized to conduct tourist event analysis to recognize crowd behavior as well as the preferences and impressions of the tourists (Alghamdi et al., 2020). Big data generated from SM allows researchers in the data analysis field to explore the behavior and abnormalities detection of individuals via their text content. Hence, this study emphasizes that big data may open other horizons in crowd management. Nevertheless, most of the existing works of crowd management does not pay attention to the textual data by big data on SM.
SM platforms let users easily communicate and exchange information, ideas, and interests with family, friends, and various communities. In addition, most organizations and businesses utilize SM platforms to market and promote their services and products; track customer concerns in areas such as tourism and cosmetics (Feizollah et al., 2019); market religious tourism (Khadijah, Novianti & Anwar, 2022) and online food (Ahmed et al., 2021); and predict the stock market (Garg & Tiwari, 2021). Furthermore, SM has attracted many research studies from diverse research communities in marketing and communication, psychology, sociology, and computer science (Pang & Lee, 2008). The Twitter platform is one of the most well-liked social media platforms in the world, especially in Arab countries. Twitter streams more than 500 million tweets daily and has more than 353 million active users, according to statistics from Statusbrew (Statusbrew blog, 2021). Exploiting this platform to investigate overcrowding issues is extremely promising.
Sentiment Analysis (SA, also known as opinion analysis or opinion mining) is one type of Natural Language Processing (NLP) technique that studies the behavior of human crowds based on text processing and analysis from the context of statements. These techniques automatically extract the users’ opinions of a particular product or service, analyzing a massive volume of data that ordinary analysis is unable to process easily (Fakieh et al., 2023). Sentiment analysis can be performed at many levels, such as sentence, document, and aspect levels (Kolkur, Dantal & Mahe, 2015; Balaji, Nagaraju & Haritha, 2017), however, it never crosses the boundaries of this knowledge. Most works in the Arabic language are limited, which suffer the unavailability of precision pre-processing libraries, besides the lack of dataset resources (Alayba et al., 2018) and its various. Due to the ambiguity of morphological complexities, several dialects (Alowaidi, Saleh & Abulnaja, 2017), and various contexts within the Arabic language. SA can be conducted with Deep Learning (DL) techniques, which are most convenient for huge amounts of labeled datasets with manual annotation (Ain et al., 2017).
DL is a type of Machine Learning (ML), which is one class of Artificial Intelligence (AI), and is often used in the NLP field, especially for opinion mining. DL is a Neural Network (NN) with three or more layers. Simply stated, NN simulates the human brain in its way of processing and analysis. It carries out the process of feature extraction from input data, then transforms the features to a new layer or feature space, and this process continues. Each layer obtains the input data from the output of the prior layer. The last output layer provides the classification results for the entered data. The most popular of the NN models is the Convolutional Neural Network (CNN), which is mostly utilized for image classification (Bhuiyan et al., 2022). Among them is a study of civil infrastructure to identify the structural damage by the CNN (Zhu & Tang, 2023). Recently, researchers have had success in integrating CNN with Long Short-Term Memory (LSTM) techniques in the field of text classification (Lai et al., 2015). LSTM is able to process entire sequences of data recurrently due to its feedback connections. Despite this, DL models are recurrently applied to English datasets. Arabic DL models are not getting as much consideration (Baly et al., 2017; Nassif et al., 2021; Zahidi, El Younoussi & Al-Amrani, 2021). Existing works rely on temporal and spatial features for extraction from SM platforms to monitor crowds in the context of city events (Abbasi et al., 2015; Krueger et al., 2019; Roy, Cebrian & Hasan, 2019; Duan, Zhai & Cheng, 2020; Redondo et al., 2020). Consequently, this study seeks to monitor and analyze the emotions of Hajj crowds through their textual data on the Twitter platform, and how crowds’ behavior is affected on the ground based on exciting SM issues, to help advance crowd management from the various levels of the urban planning of cities. Hence, improving the experience of Hajj services for pilgrims is a high priority for Hajj authorities and related sectors. The catering service in Mina for Hajj 1442 is presented as a case study in this work. The Hajj is an annual ritual by Muslims to Makkah, Saudi Arabia. Over two million pilgrims come from everywhere in the world to perform this rite, making it the largest religious pilgrimage in the world. Owing to the massive overcrowding of pilgrims in small geographic regions at Al-Masjid Al-Haram, Mina, Muzdalifa, and Arafat, the Hajj authorities seek to reduce the factors that lead to congestion to minimize or eliminate its risks.
This study aims to analyze pilgrims’ emotional characteristics through the 1442 H pilgrimage by predicting the directed opinion texts. Hajj authorities can benefit from that to detect weaknesses and inadequacies in its current services and present better-quality services later based on this contribution. Thus, reducing the field-based risks that may be caused by public issues on SM platforms. The study’s contributions will answer the following research questions:
-
1)
What are the most used techniques in urban planning of smart cities for monitoring crowds in prior works?
-
2)
What are the approaches used in crowd management works?
-
3)
What are the approaches used in Hajj crowd management works?
-
4)
What are the dataset types used in Hajj crowd management works?
This article presents a novel CNN-LSTM to classify the sentiment of pilgrims about prepared meals. The proposed CNN-LSTM model classifies emotions into three subclasses: Positive, Negative, and Natural. The dataset (Catering-Hajj) is used for the first time in this research. Methods of collection, selection, annotations, and analysis show that the dataset is highly reliable. The dataset contains 4,669 tweets with three classes: The Positive class has 1,519 tweets, the Negative class has 962 tweets, and the Natural class has 2,188 tweets. The tweets were captured from the Twitter platform during Hajj 1442 H. Our research contributions include:
A novel CNN-LSTM to classify the sentiments of pilgrims regarding the catering service at the holy sites in Mecca, Saudi Arabia, during Hajj 1442 H.
A new dataset collected from X (formerly Twitter), annotated and saved for use by the other researchers. Which expresses pilgrims’ opinions about catering services.
A comparison of our proposed model with other different classifiers, which highlights crowd behavior detection through their textual data for predicting future hazards in advance and reducing the potential field-based disasters.
The rest of the paper is organized as follows: Section 2 presents the related work. Section 3 describes the proposed model for solving the targeted problem, and section 4 explains the methodology used to analyze sentiment. Section 5 illustrates models used for comparison alongside our proposed model. Section 6 evaluates the proposed model and presents the experimental results. Section 7 discusses the results and mentions the limitations of the study. Lastly, section 8 concludes the study and offers suggestions for future research.
Related work
This section of the article reviews the studies that have analyzed data on SM from a crowd management viewpoint.
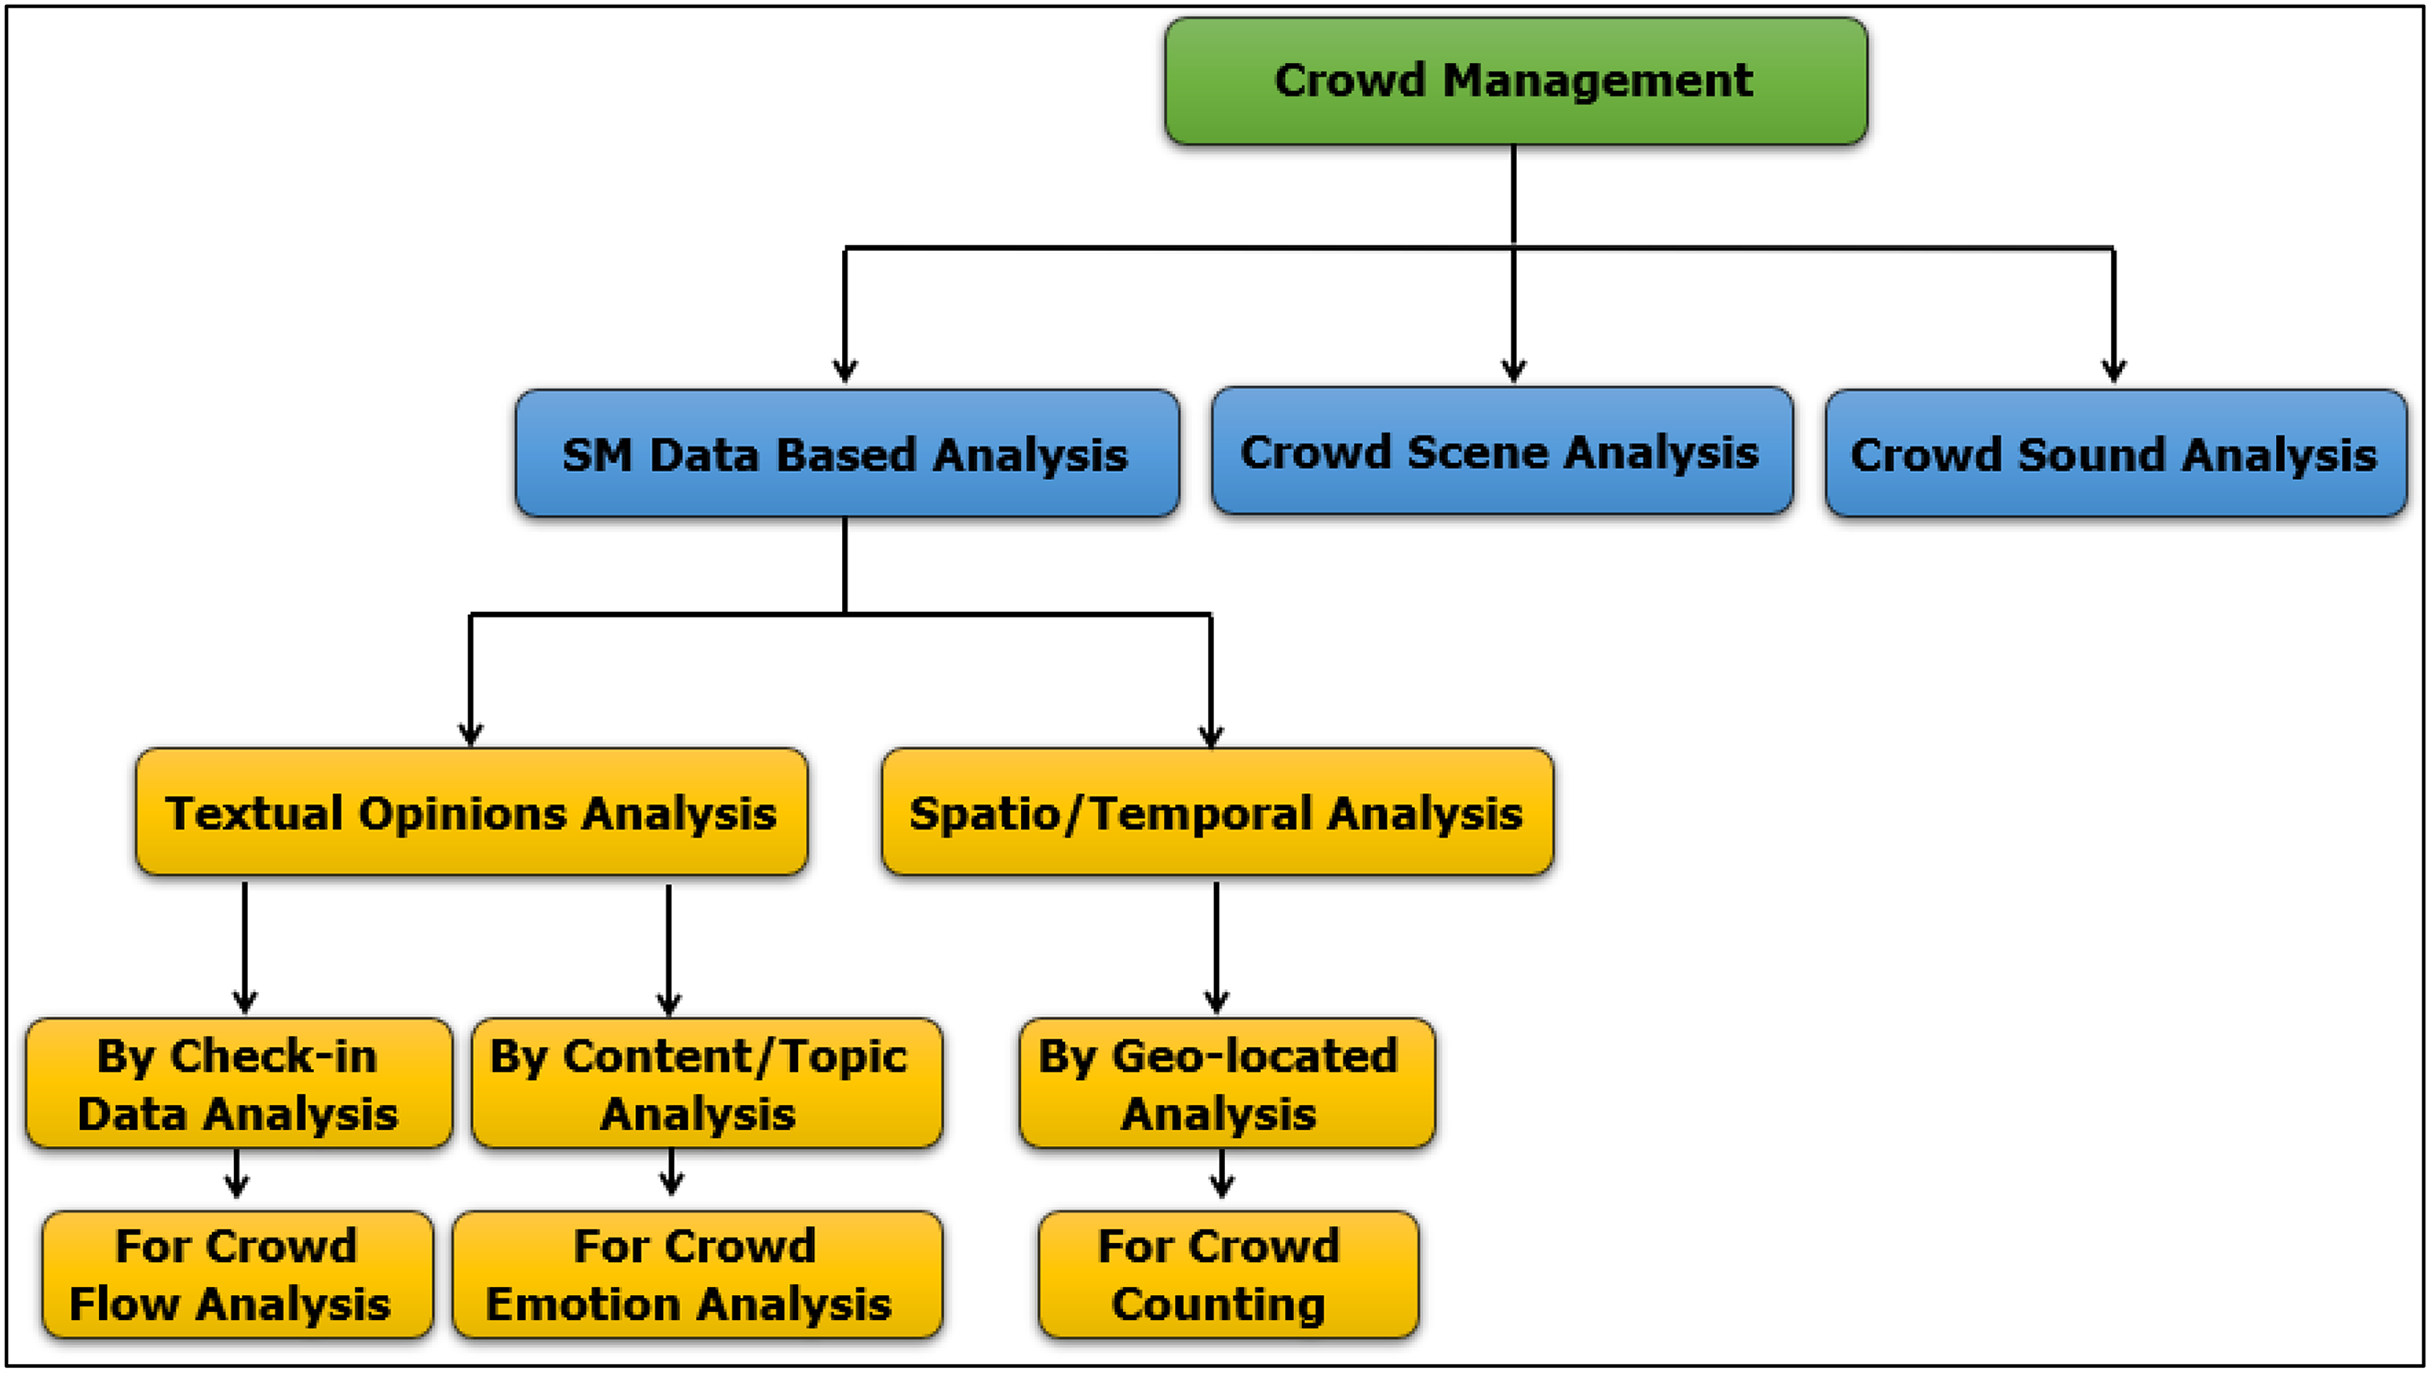
Currently, due to the massive growth of SM, billions of people around the globe now have the opportunity to freely express their opinions, beliefs, or feelings on whatever subject interests them, which amounts to every topic conceivable. This massive outpouring of sentiment provides an opportunity for social science researchers to study and understand the thoughts and opinions of individuals and communities on an unprecedented scale (Zafarani, Abbasi & Liu, 2014). Sentiment analysis is an intelligent technology that automatically extracts features from raw data and deduces valuable data. Many organizations, businesses, and sectors of government have thus abandoned traditional surveys and counted on reviews and discussions in networks of SM to gather information about user sentiment. To date, however, studies on crowd management have not exploited the opportunities of this big data field on SM. Instead, crowd management still relies on an analysis of images/videos that are captured from cameras or live streaming on Television (TV). Big data on SM opens other horizons in the management, control, and analysis of crowds: detecting normal and abnormal behavior, computing individual tracks, and counting people in a crowd are now possible (Riboni & Bettini, 2015). This range of capacity demonstrates how much information a crowd can generate, information that can be used to exert influence on a crowd and their behavior (Stieglitz et al., 2018). In continuation of our previous research, Alasmari, Farooqi & Alotaibi (2024) proposed a novel taxonomy of crowd management from an SM analysis perspective, as shown in Fig. 1.
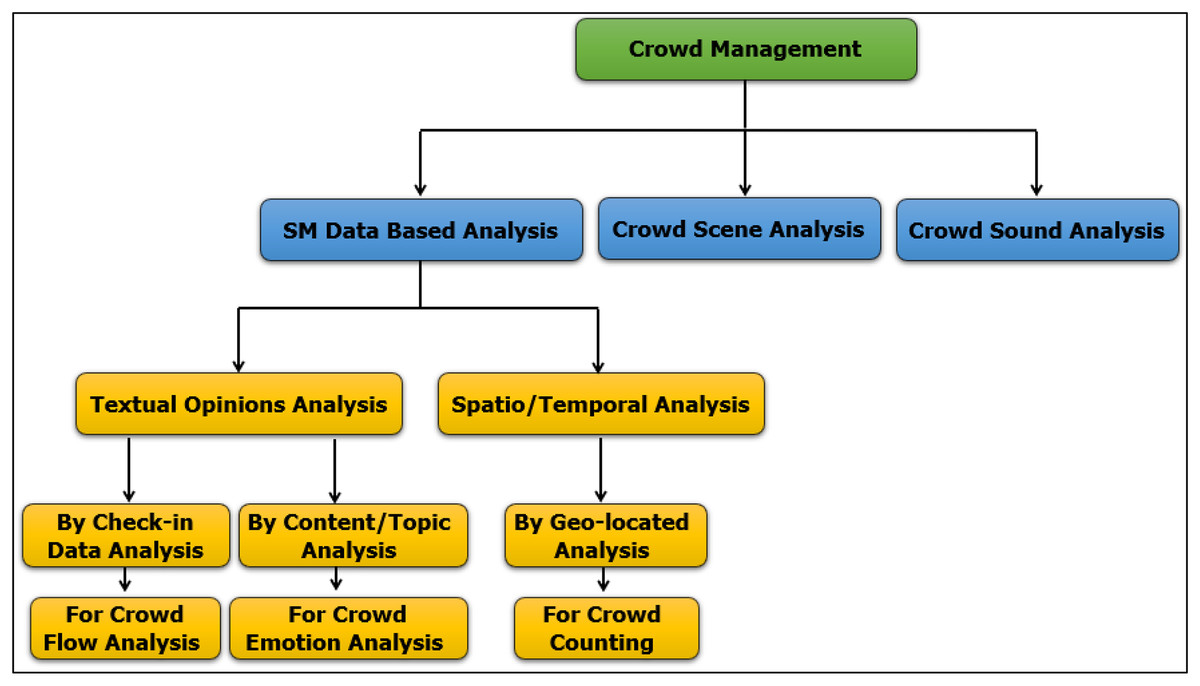
Figure 1: Crowd management from an SM analysis perspective.
Regarding SM’s data-based analysis, Redondo et al. (2020) proposed a hybrid model combining two approaches: clustering techniques and entropy analysis. The model observes the dynamic patterns of crowds. The authors collected geo-located data on Instagram, a Location-based Social Network (LBSN). LBSNs give two valuable pieces of information about users: the content of the posts and the location and trajectory of posting users. The authors selected the Density-Based Spatial Clustering of Applications with Noise (DBSCAN) algorithm for identifying 2 or 3 relevant clusters along a grid size of (7 × 7) cells in the city every 15 min. They then utilized an algorithm K-means to identify the groups of people. Lastly, they applied the estimation of Shannon entropy with a window of (W = 4). This hybrid model was able to detect anomalies in citizens’ behavior with less computational load and less complexity than a model using an LZ-based entropy estimator (Rodriguez-Carrion et al., 2015).
Duan, Zhai & Cheng (2020) investigated the reasons for a stampede on Shanghai New Year’s Eve in 2014. The authors developed a framework for topic modeling using the Latent Dirichlet Allocation (LDA) method. Check-in data were taken from the Weibo platform. JIEBA toolkit was used for Chinese text segmentation, whereas the GENSIM toolkit was used for fast implementation of the LDA method. In addition, the BosonNLP toolkit with the Weibo engine was used for annotation and training; this toolkit gives an Application Programming Interface (API) for sentiment analysis. In this study, geographical attributes directly reflected changes in crowd flow and behavior. Furthermore, the authors were able to detect people’s psychological states before and after accidents. However, this field still faces some challenges. In addition, Roy, Cebrian & Hasan (2019) used geo-located SM to analyze human mobility resilience to disaster events, which the proposed model can detect a catastrophic event from crowd movements, estimate the time of recovery and the extreme deviation from a constant state mobility pointer using Haversine displacement method, and then measure the values of transient loss and resilience using Bruneau’s method. Tyshchuk & Wallace (2018) addressed the deficiency of the abundant data on behaviors that occur in response to significant events by a framework for modeling a set of certain behaviors as expressed on social media using structural equations modeling and logistic regression.
The study of Xue et al. (2020) investigated the understanding behind Twitter users’ discourse and psychological reactions during the COVID-19 pandemic. Whereas the study of Osmani, Mohasefi & Gharehchopogh (2020) used extra attributes such as author, helpfulness, date, sentiment, and subtopic to identify the sentiment polarity by GIBBS sampling algorithm, which identifies some attributes have a higher effect than others, hence improving the evaluation results. In the same manner, Aldhubaib (2020), Shambour (2022), and Gutub, Shambour & Abu-Hashem (2023) have revealed how people view diverse circumstances and probable future behaviors during the COVID-19 pandemic in the Hajj season. The authors used CNN and LSTM models because their effectiveness and high performance. Albahar et al. (2023) studied the satisfaction indicators of pilgrims with the hospitality services of hotels during Hajj by using CNN-LSTM, which the data from booking.com used for hotel reviews. The model outperformed other classification models by 97%. Khan & AlGhamdi (2024) used an LSTM for the classification layer and the sum of squares error (SSE) loss function to increase the prediction accuracy for the model. The maximum mean accuracy of the proposed model is 85.65%. This classification model is part of a larger system, namely the Intelligent Pilgrim Service System (IPSS), which analyzes data and works with other ministries engaged in Hajj and Umrah operations to improve services for pilgrims. Alghamdi (2024) produced a comprehensive analysis of Arabic Hajj-related tweets and AI models over different years. The author highlights that the BERT model surpassed other models in accurately classifying impressions. Gandhi et al. (2021) trained two models (CNN and LSTM) and applied them to the IMDB dataset at first, then applied to the amount of Twitter data for predicting the sentimental classification. Alayba et al. (2018) integrated CNNs and LSTM to analyze Arabic sentiment on different datasets. Ombabi, Ouarda & Alimi (2020) produced a Arabic sentiment analysis using Deep CNN–LSTM Arabic-SA. This model is supported by FastText feature extraction as an input layer to learn semantic and syntactic information. Experiment results show the remarkable performance of model by 90.75%.
Öztürk & Ayvaz (2018) studied sentiment analysis during the Syrian refugee crisis. The authors used the TwitteR package to gather data from Twitter in the English and Turkish languages. They used the RSentiment package via R programming language, which includes an inclusive sentiment dictionary and provides a sentiment score. For the Turkish language, the authors developed a sentiment lexicon of 5,405 Turkish words. They validated the accuracy and reliability of the final sentiment scores by manually reviewing them. Finally, the total tweets were classified into three main clusters: Politics, War, and Humanitarian. This work did not identify the technical method used in clustering operations. Mahendhiran & Kannimuthu (2018) have identified the appearance of socio-demographic author traits or features. They proposed a Multimodal Sentiment Analysis (MSA) framework using a stacked Convolutional Network (CNN) based on k-max pooling combined with Bidirectional Long Short-Term Memory (BiLSTM). It has two hidden layers with 50 neurons for each layer. It used the Maxout parameter of the input vector and 80 epochs for data streaming. The proposed framework has achieved 96.07% accuracy. This method is efficient with short videos but did not confirm with long ones. In the same context, Arunkumar, Chandramathi & Kannimuthu (2019) proposed framework to assess Telemedicine Services using SA. The authors have deployed machine learning classifiers. The support vector machine (SVM) classifier with particle swarm optimization (SVM-PSO) has achieved the best ratio of 87.8%. This work did not address unstructured data from different sources. In the same context, Mahendhiran & Subramanian (2022) have been improved unstructured data based using concept-level semantic parsing. The proposed method shows performance with a prediction accuracy of 86.6%. In view of Elgamal (2016), the pre-processing step used tagging and part-of-speech (POS) for each word in a sentence. Afterward, it constructs a set of n-grams to improve the classification accuracy and used the Naïve Bayes classifier which achieved better results. Naeem et al. (2021) have proposed a method for the local market investment for the Pakistani business community based on a dataset that was collected from platforms Twitter and Forex. To confirm the reliability of the dataset, principal component analysis (PCA) and linear discriminant analysis (LDA) were applied, then they applied machine learning classifiers. The result of the simple logistic (SL) classifier shows the highest accuracy of 82.14%. Table 1 provides a summary of existing approaches. Our work aims to utilize a hybrid of two robust deep learning techniques (CNN-LSTM) for the analysis of pilgrims’ sentiments on SM about services provided in the catering sector during the Hajj season from a crowd management perspective to improve urban plans for crowded cities.
| Ref. | Approach name | Dataset name | Accuracy | Advantages | Disadvantages |
|---|---|---|---|---|---|
| Elgamal (2016) | Sentiment analysis methodology of Twitter data with an application on Hajj season | English tweets dataset | – | Naïve Bayes classifier achieved better results than SVM classifier. | The accuracy of the approach is not mentioned explicitly. |
| The pre-processing step uses tagging and POS for each word in a sentence. Afterward, it constructs a set of n-grams to improve the classification accuracy. | The paper did not clarify the technical method used in Crawling Twitter data. | ||||
| Öztürk & Ayvaz (2018) | A sentiment analysis model for the Syrian refugee crisis | Twitter dataset (Turkish and English Languages) | – | The work exploits big data on social media to study the opinions of the Turkish community regarding the Syrian refugee crisis. | The paper did not clarify the technical method used in clustering operations. |
| The work concentrates on the Twitter platform, the most popular platform in the community. | The paper did not analyze widespread languages in the community like Arabic or German owing to a lack of human resources experience. | ||||
| The work concentrates on the local language (Turkish) as well as the global language (English). | Many factors affect the opinions of people, such as news coverage and policies of governments; therefore, these opinions cannot be completely relied upon. | ||||
| The work utilizes packages of R languages for downloading Tweets (TwitteR) and an inclusive sentiment dictionary with sentiment scores (RSentiment). | The accuracy of the approach is not mentioned explicitly, but it shows the ratio difference in emotions between the Turkish tweets and English tweets toward Syrians and refugees. | ||||
| Mahendhiran & Kannimuthu (2018) | Deep learning techniques for polarity classification in multimodal sentiment analysis | ICT-YouTube dataset | 96.07% | The work proposed multimodal sentiment analysis (MSA) framework. | The ICT-YouTube dataset has little data, it just contains 47 videos. |
| The work enhances the visual sentiment analysis by deep learning algorithm (CNN- BiLSTM). | The length of the visual data is limited, which is 2 to 5 min. | ||||
| The MSA framework effectively distinguishes sentiment categorization of polarity ( positive, negative and neutral). | |||||
| The MSA framework achieves 96.07% accuracy. | |||||
| Alayba et al. (2018) | Arabic sentiment analysis using combined CNN-LSTM | Arabic health services dataset (Main-AHS and Sub-AHS), Ar-Twitter dataset, and Arabic sentiment tweets dataset (ASTD) | AHS of 94%, Sub-AHS of 95% | The work performs the effectiveness of using various levels of Arabic sentiment analysis. | – |
| The model uses Ch5gram-level and Word-level to produce better classification results. | |||||
| Tyshchuk & Wallace (2018) | Framework for modeling a set of certain behaviors as expressed on social media data | English tweets dataset | – | The framework identifies features of human behavior of dimensions and importance. | The accuracy of the approach is not mentioned explicitly. |
| The framework develops additional methods to capture all dimensions of identified features. | The users of social media do not exactly represent the population. | ||||
| The framework calculates the measures using developed methods. | |||||
| The work is to build a framework to predict based on various behaviors. | |||||
| Roy, Cebrian & Hasan (2019) | Measure mobility resilience during disaster events using geo-tagged data. | Geo-tagged tweets dataset | – | The study uses Bruneau’s method to calculate values of loss and resilience, and Haversine method to determine crowd movement disaster events. | The applied tools to build a model are not determined. |
| The datasets are large and collected from several types of digital repositories. | The model cannot explore disaster events less than 6 h long. | ||||
| Datasets do not provide enough pre-disaster data. | |||||
| Arunkumar, Chandramathi & Kannimuthu (2019) | Sentiment analysis-based framework for assessing internet telemedicine videos | Medical-videos YouTube dataset | 87.8% | The work presents how the utilization of medical video data. | The work doesn’t address unstructured data. |
| The dataset is big, it contains more than 1,000 text comments of medical from different medical videos of YouTube. | The particle swarm optimization (PSO) gives good accuracy. | ||||
| Osmani, Mohasefi & Gharehchopogh (2020) | Enriched latent Dirichlet allocation (LDA) for sentiment analysis | Amazonreviews dataset, multi-domain sentiment dataset | – | The study uses several features to identify the impact strength of words, hence improving the evaluation results. | The accuracy of the approach is not mentioned explicitly. |
| The proposed models outperformed the baseline models. | |||||
| The datasets are huge and varying, one dataset (containing Movie, Electronic, Automotive, Clothing, and Android) is taken from Amazon reviews and two datasets (product, reviewer, date, rating, text of the review, and helpfulness information) from the multi-domain sentiment dataset | |||||
| Xue et al. (2020) | Public discourse and sentiment during the COVID 19 pandemic: using latent Dirichlet allocation for topic modeling on Twitter | English tweets dataset | – | The study understands the psychological reactions for Twitter users using LDA model. | The accuracy of the approach is not mentioned explicitly. |
| The results are limited to a particular population due to the removal of non-English Tweets from the analysis. | |||||
| Ombabi, Ouarda & Alimi (2020) | Deep CNN–LSTM Arabic-SA to analyze Arabic sentiment | Corpus (Hotel, restaurant, movies, product, reviews, and LABR) | 90.75% | The model is supported by FastText feature extraction as an input layer, which its results are remarkable performance. | – |
| Redondo et al. (2020) | A hybrid model of LBSN data for detecting anomalies in crowd dynamics. | Geo-located data on Instagram | – | The work exploits geo-located data in Location-based Social Networks (LBSNs) on the Instagram platform. | The model did not handle the text in the posts. |
| The work utilizes the whole contents of the posts as well as the location and trajectory. | The model is unable to explore the places where unforeseen behavior is happening. | ||||
| The model detects anomalies in pedestrians’ behavior with less complexity and less computational load. | The research has been performed on narrow topics with limited behavioral aspects. | ||||
| The model provides the best results using clustering techniques (K-means algorithm) with entropy analysis by (Shannon entropy). | The accuracy of the approach is not mentioned explicitly. | ||||
| Duan, Zhai & Cheng (2020) | Framework for topic modeling using the LDA method. | Sina Weibo microblog check-in data | – | The work exploits geotagged social media data on the Weibo platform for analyzing population spatiotemporal activities in emergency cases. | The model did not handle the Weibo comments, user preferences, and relationship chain information; therefore, the model needs a more in-depth analysis of the event process. |
| The work utilizes geographic, check-in data, and blog content to detect crowds. | There are still challenges in estimating the population’s psychological status with high accuracy. | ||||
| The work concentrates on the Weibo platform, which is the most used in the Chinese community; in addition, the Weibo API provides social media data in real-time. | The accuracy of the approach is not mentioned explicitly, but it shows the variation level for emotions of the crowd before and after events. | ||||
| The paper explores the influence of the psychological states of people before and after an incident. | |||||
| The work reveals the assemblage case of the crowd in near-real time through the Weibo check-in data. | |||||
| The paper proves that multidimensional analyses of time, semantic features, and space can be applied to social media data. | |||||
| The paper proves that geotagged social media data can help government entities make the right decisions. | |||||
| Aldhubaib (2020) | Impressions of the community of Makkah on the Hajj by AI-based sentiment analyses (CNN-LSTM) | Questionnaire and Twitter datasets | – | This work uses traditional and modern methods to collect datasets. | The model of CNN and LSTM is not well explained. |
| The results of statistical data are detailed very well. | The optimized parameter values used in the model are not specified. | ||||
| The programming language used, tools, and libraries are not specified. | |||||
| The accuracy of the approach is not mentioned explicitly. | |||||
| Gandhi et al. (2021) | Sentiment analysis on Twitter and IMDI data by using CNN and LSTM. | Twitter and IMDB datasets | 87.74% of CNN and 88.02% of LSTM. | The study trained CNN and LSTM models independently and tested an amount of IMDB and Twitter data to predict the sentimental classification. | The model does not achieve an extremely high ratio. |
| Naeem et al. (2021) | Machine learning-based USD/PKR Exchange Rate Forecasting Using Sentiment Analysis of Twitter Data | Pakistani business community Twitter and Forex datasets | 82.14% | This work is the first that forecasts the exchange rate of the USD/PKR using sentiment analysis. | Their methodology is not clear. |
| The model advantages the Pakistani business community to investment. | The model does not achieve an extremely high ratio. | ||||
| The collection of data was based on the Forex platform of forex customized for finance-related, in addition, to related words from Twitter. | |||||
| Methods of principal component analysis (PCA) and linear discriminant analysis (LDA) were applied to confirm the reliability of the dataset | |||||
| Mahendhiran & Subramanian (2022) | CLSA-CapsNet: Dependency based concept level sentiment analysis for text | The hotel review dataset. | 86.6% | The work improves unstructured data based on concept-level semantic parsing from natural language text. | The model does not achieve an extremely high ratio. |
| Shambour (2022) | Analyzing and interpreting users’ feelings from inside and outside the Makkah community during COVID-19 pandemic. | Twitter and YouTube datasets | – | The work uses the CNN-LSTM model to learn about pilgrims’ and others’ opinions inside and outside the Makkah community. | The statistics of data are more detailed than the model. |
| The datasets are varied and big. | The accuracy of the approach is not mentioned explicitly. | ||||
| The study’s methodology is well-focused. | |||||
| Gutub, Shambour & Abu-Hashem (2023) | COVID-19 pandemic impact on people’s behaviors during the 2021 Hajj season by deep learning model. | Twitter dataset | – | The work provides a deep understanding of diverse circumstances and probable future behaviors of society’s individuals. | The paper did not clarify the details method to build a deep learning model. |
| The work provides findings that help decision-makers with greater insight into how probable future behaviors. | The statistics of data are more detailed than the model. | ||||
| The work uses a deep learning model for effectiveness and high performance. | The explanation of the model is inadequate. | ||||
| The method of integration of CNN and LSTM is not very clear. | |||||
| The optimized parameter values used in the model are not specified. | |||||
| The accuracy of the approach is not mentioned explicitly. | |||||
| Albahar et al. (2023) | Measurement of satisfaction indicators of pilgrims for the hospitality services using CNN-LSTM at Hajj. | Booking.com Dataset | 97% | The work provides a CNN-LSTM model to measure satisfaction indicators of pilgrims for hospitality services. | Several factors may influence the level of satisfaction of pilgrims such as hotel rating, previous experiences, quality services, and staff responsiveness cause the data streaming will change constantly, thus the stakeholders must be focused on pilgrims’ expectations from various sides. |
| The work provides valuable viewpoints for hospitality businesses to improve their services in the future. | |||||
| Khan & AlGhamdi (2024) | The integrated framework to improve services for pilgrims using LSTM. | Twitter Facebook and Instagram datasets | 85.65%. | The intelligent Pilgrim service system (IPSS) framework is integrated and connects several departments to improve services for pilgrims. | Data from Facebook and Instagram are limited. |
| The authors use the sum of squares error (SSE) loss function to increase the prediction accuracy for the model | |||||
| Alghamdi (2024) | A comprehensive analysis of Arabic Hajj-related tweets and AI models over different years | Twitter dataset | 93.8% | The work results provide valuable insights for Hajj authorities to help decision-making, responses, and interventions based on the evolving impressions of the public. | – |
Proposed method
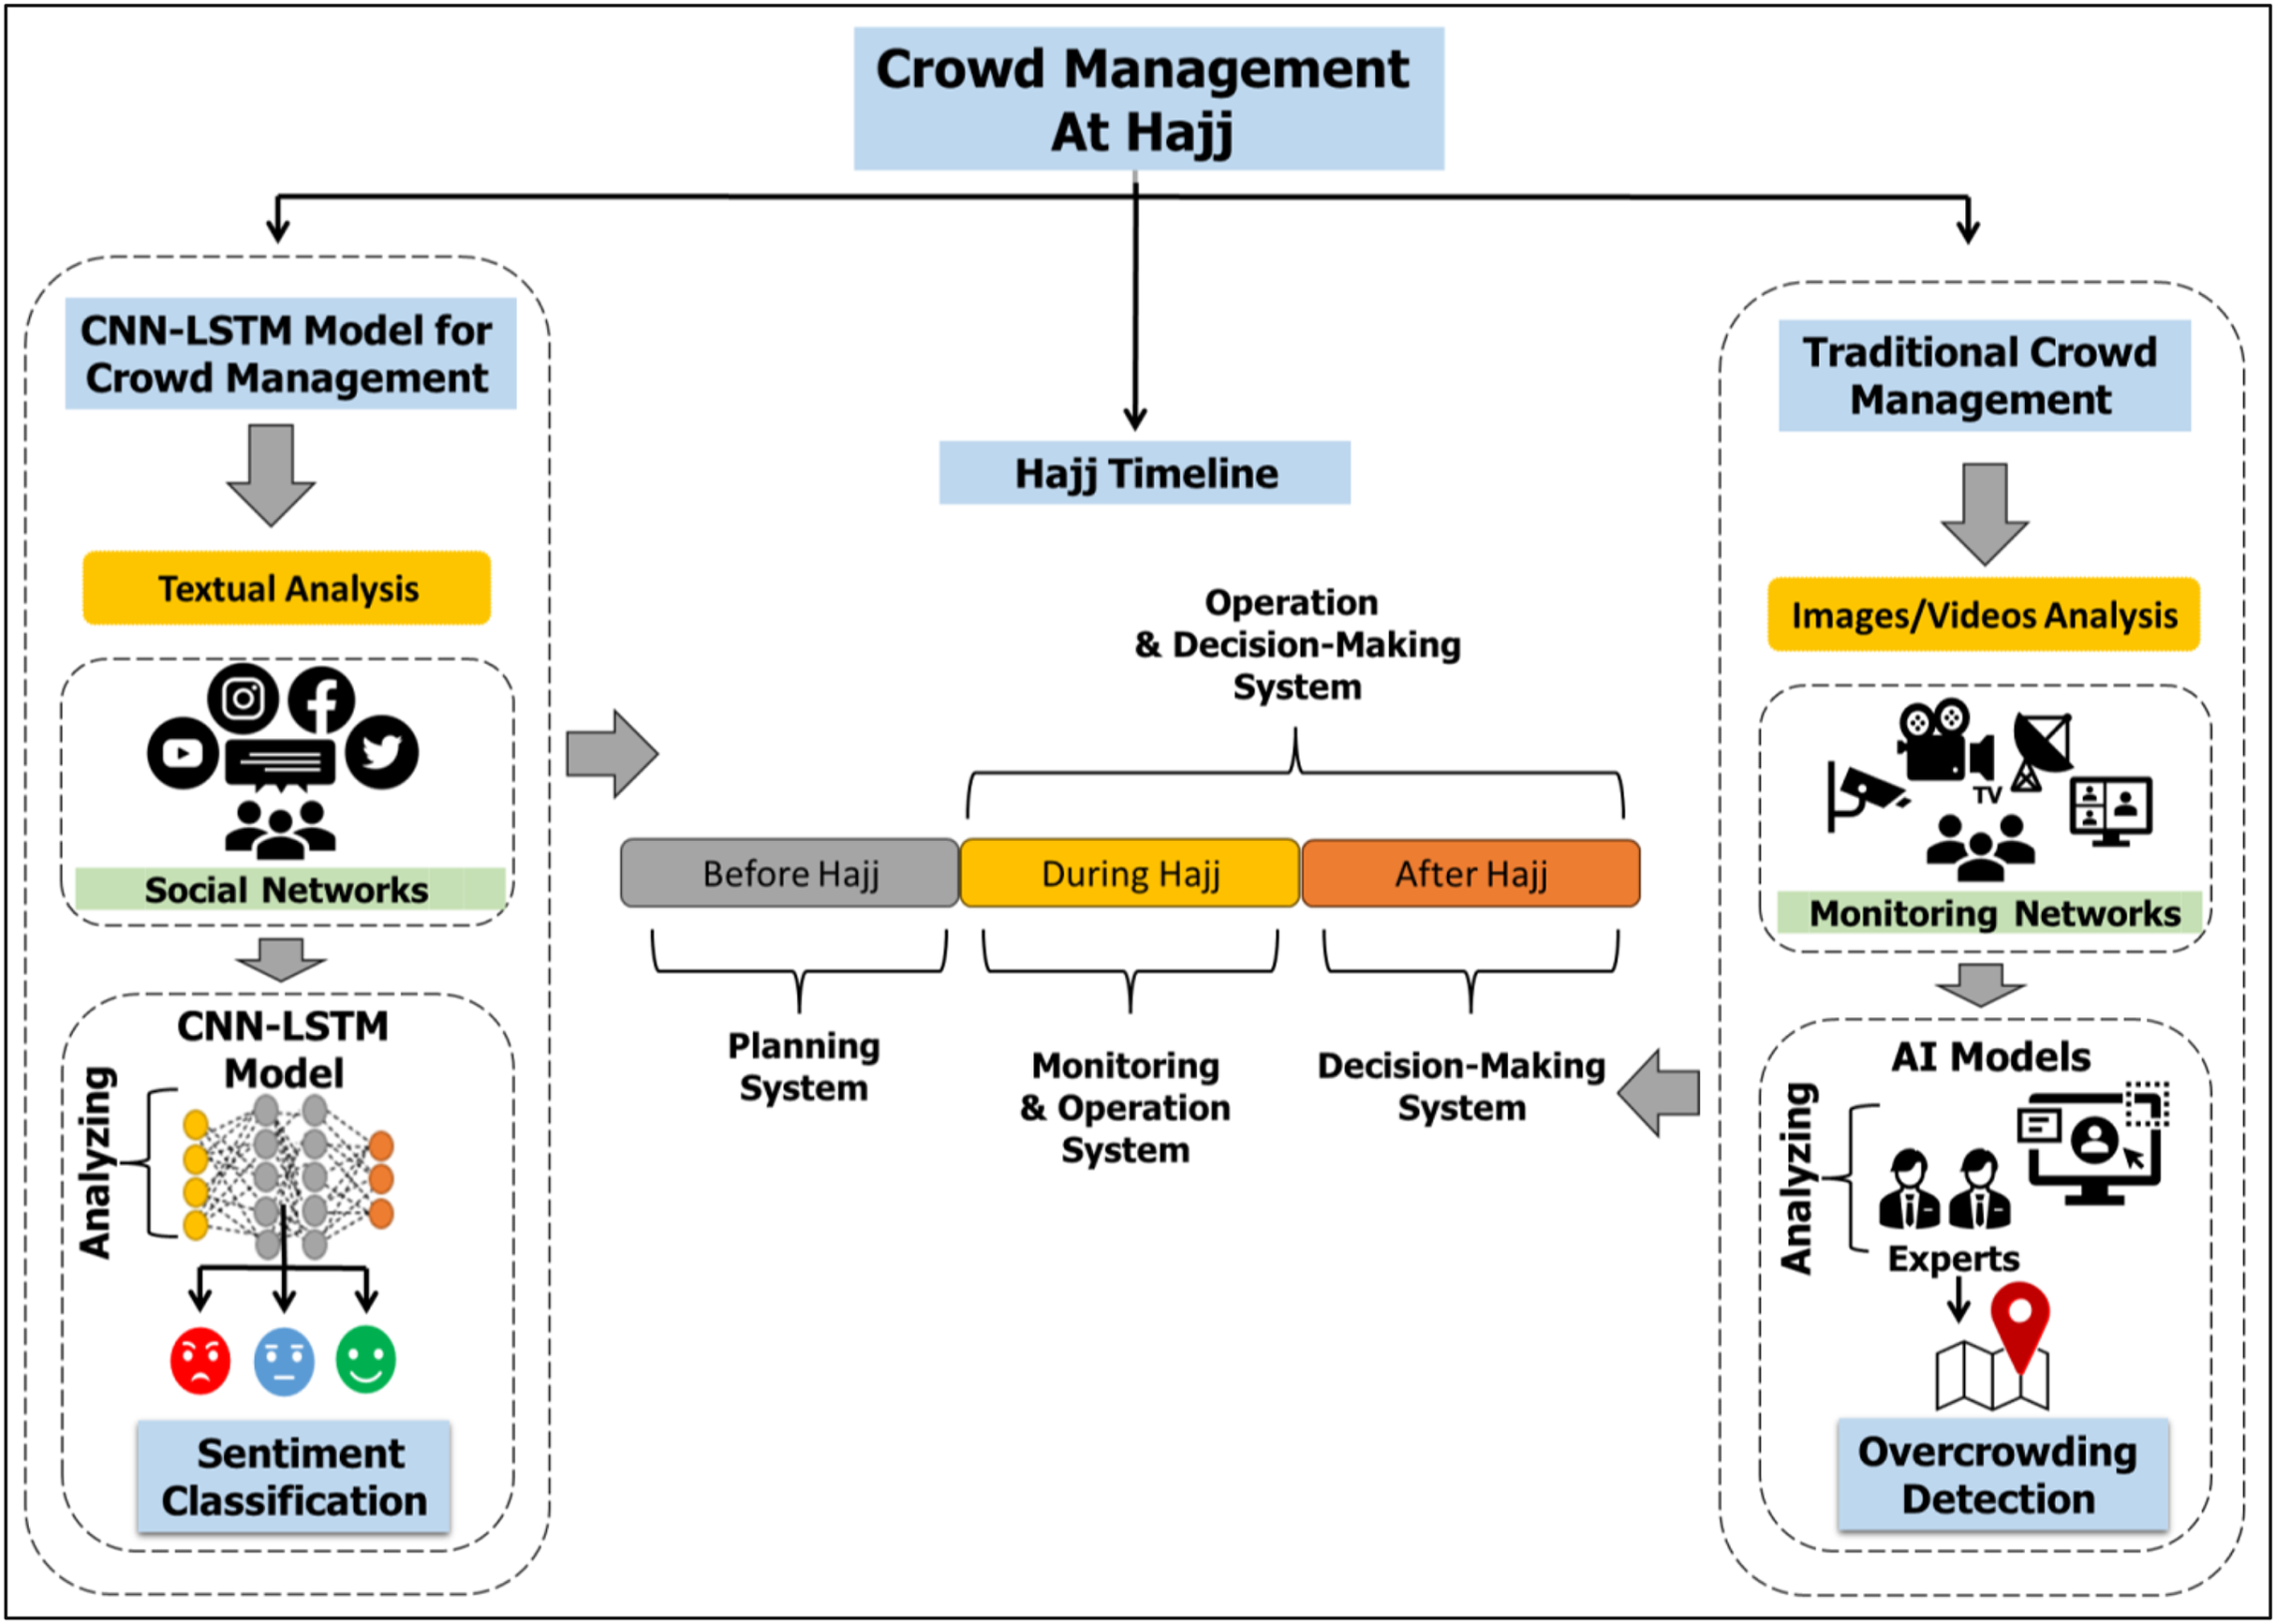
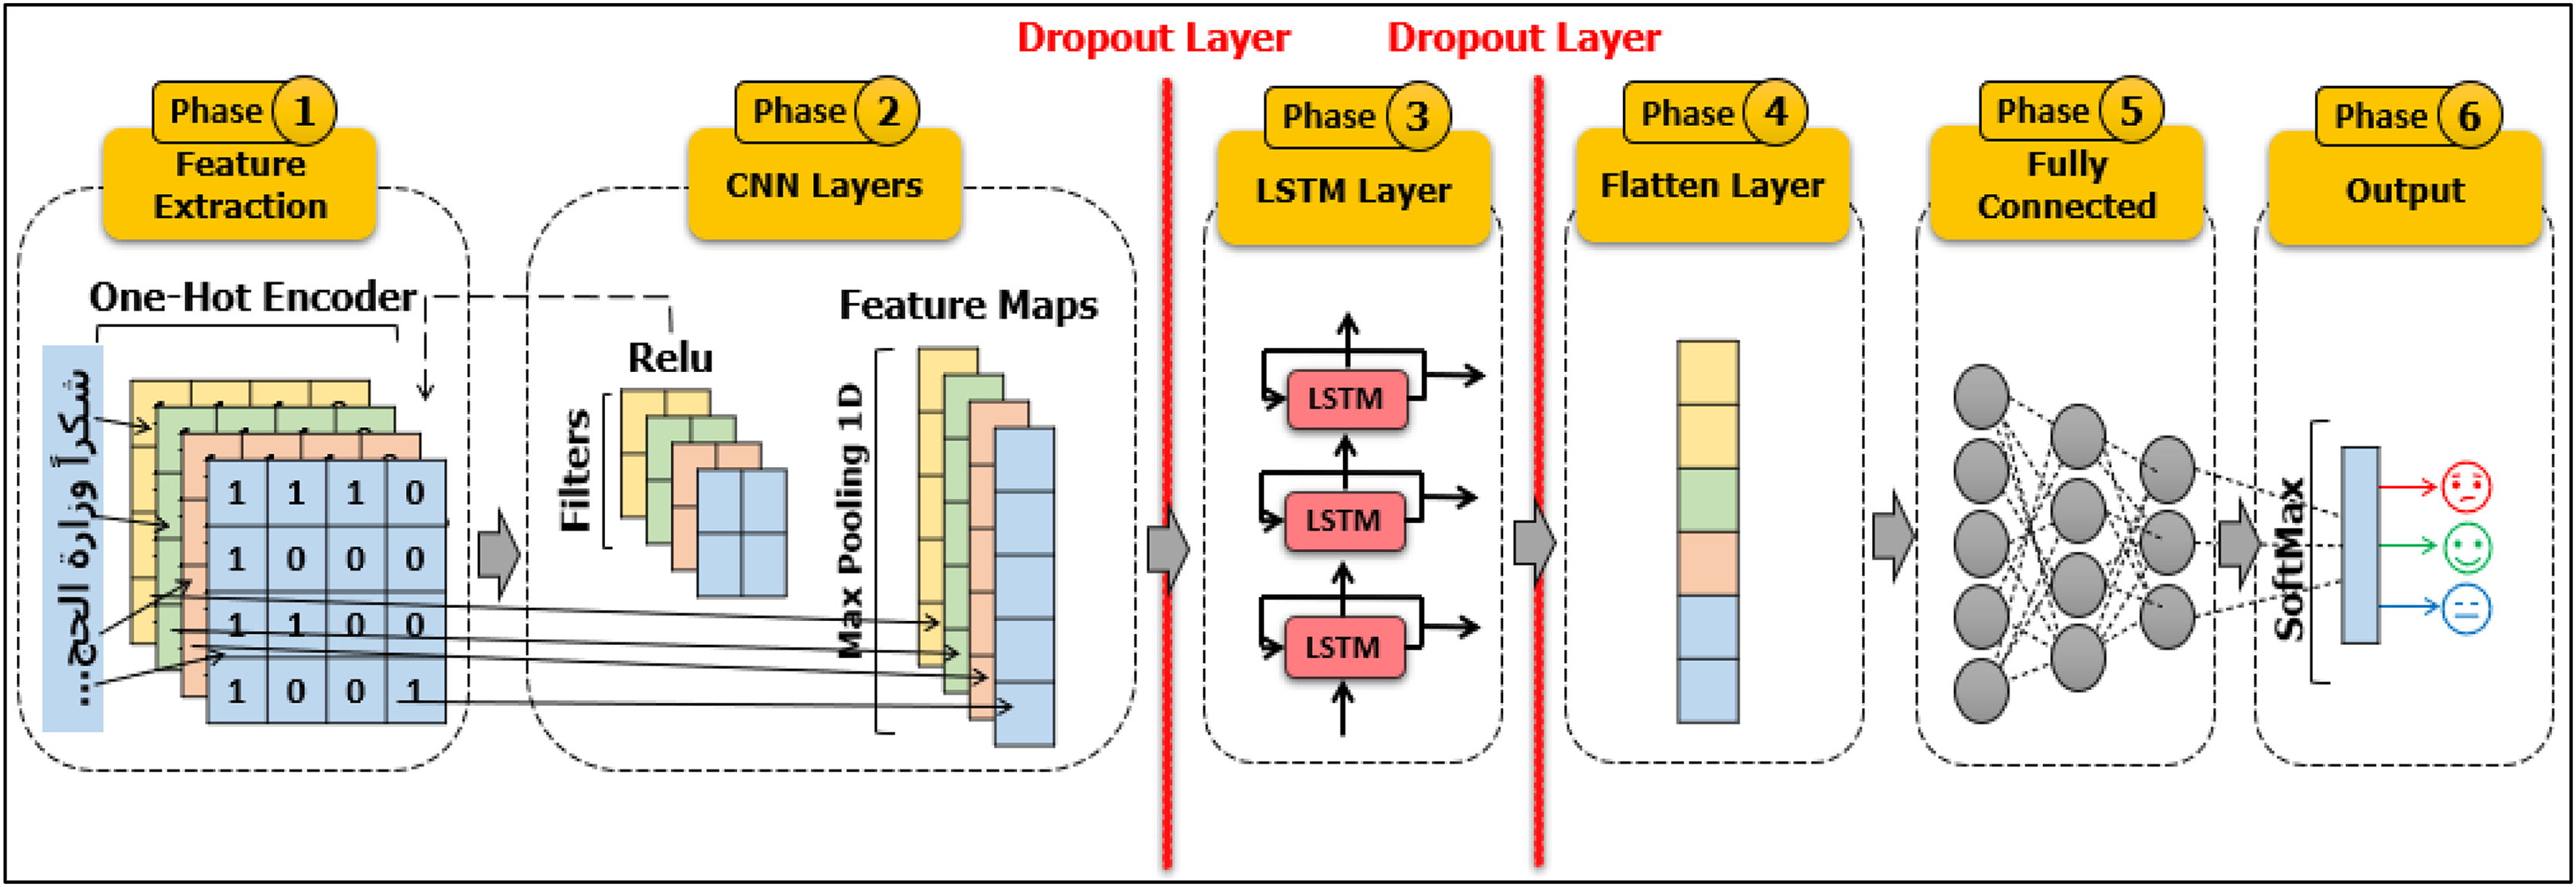
The proposed research integrates the crowd management field and the big data field to exploit the powers of wasted data on SM applications. This study seeks to discover the strengths and weaknesses of services provided during Hajj. The proposed model using CNN-LSTM algorithms classifies the sentiments or opinions of pilgrims. Figure 2 demonstrates a general idea of this research. Our target concern is the issue of catering (prepared food) during holy days in the Hajj season for the year 1442 AH (2021 AD). Figure 3 summarizes the main steps of the study. Our CNN-LSTM classifier has several layers. The filter is applied to produce a feature map on the input data. Then, the greatest value is determined by the max pooling layer for each feature map. The feeding forward neural networks are done by the fully connected layer. Thus, the model will produce three classes of the sentiments. A detailed explanation of the hybrid model is presented in “Data Classification (CNN-LSTM)”.
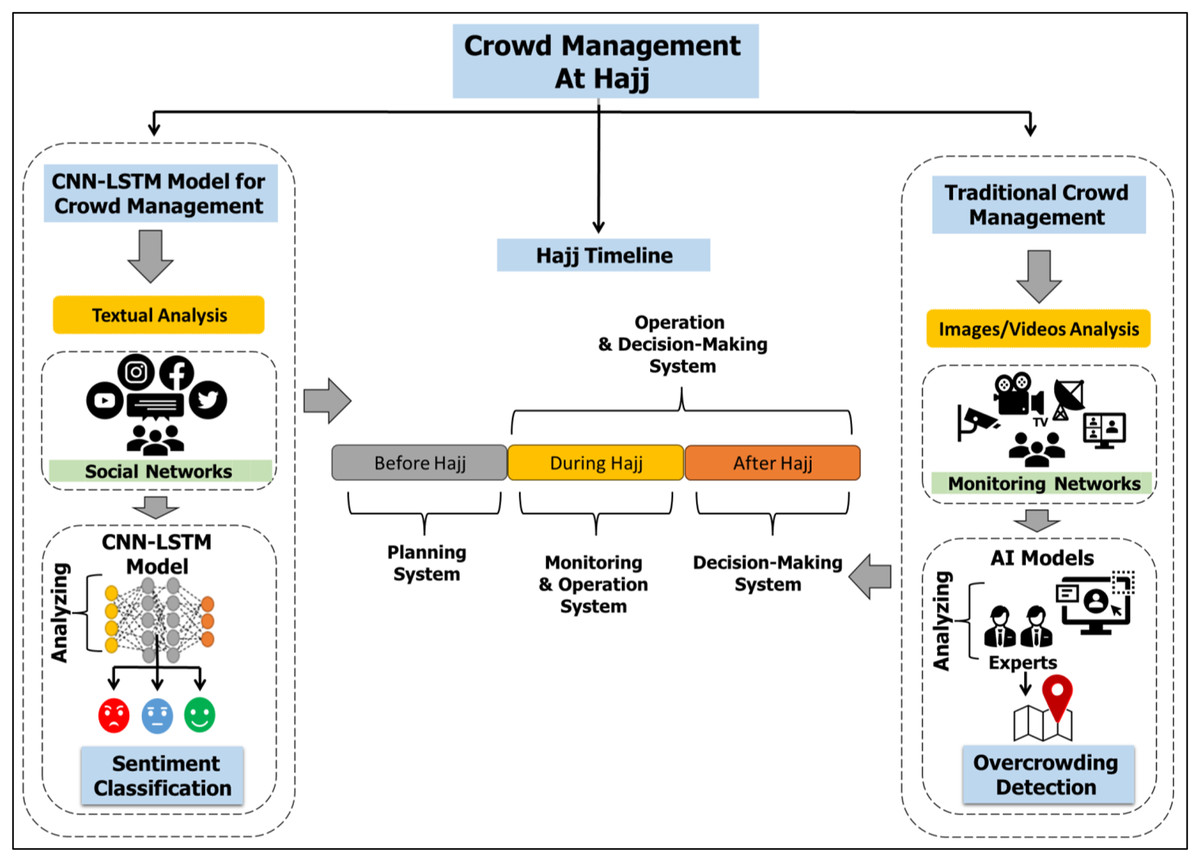
Figure 2: The general ideas of our study.
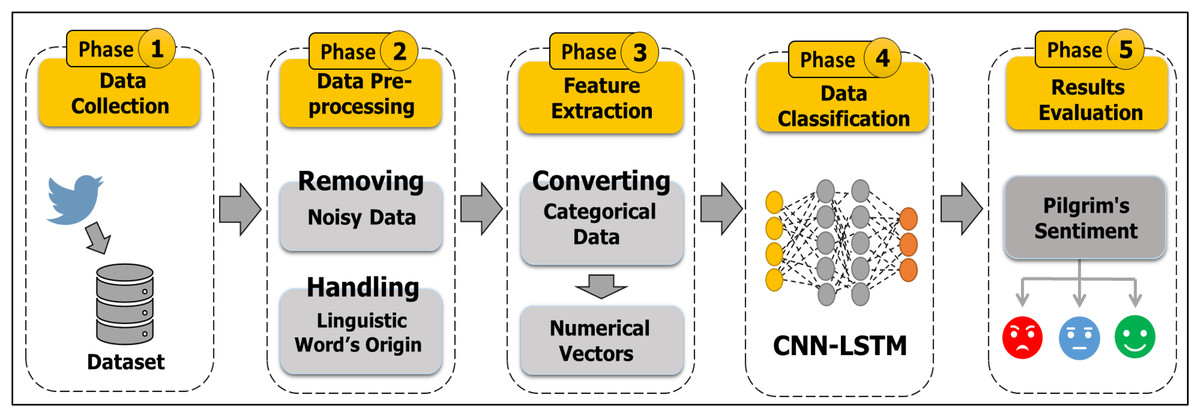
Figure 3: Methodological steps of the study.
Methodology
This section presents our methodology which consists of four main phases: Phase 1 describes the processes of standards selection, data collection, and the creation of a Twitter API Application. Phase 2 describes the process of dataset annotation. Phase 3 describes the process of cleaning the dataset from unwanted information and extracting the required data fields. Phase 4 describes the processes of data classification by using CNN-LSTM algorithms, as shown in Fig. 3. Our proposed methodology uses various Python functions, tools, and libraries, which are clarified in the following subsections.
Umm AlQura University granted Ethical approval to carry out the study for a master’s degree (2691304144312/58356).
Data collection
To collect our dataset, we used numerous hashtags and keywords to obtain relevant tweets about the catering and the costs of the Hajj campaigns. They included the following: 
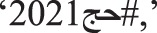 etc. Table 2 shows the meanings of the Arabic words. Only tweets in the Arabic language were considered in the queries. All tweets and replies were included. Quote, tweets, retweets to tweets, user information, and mentions were excluded. Tweets were collected from the 1–13 Dhu al-Hijja, 1442 Hijri (11th–23rd July 2021). Dhu al-Hijja is the 12th month of the Islamic calendar, called the Hijri calendar. After collecting tweets, we saved extracted tweets in Comma-Separated Values (CSV) format.
| Points | Description |
|---|---|
| Problem: | The meal providers (Hajj campaigners) violated the guidelines provided by the pre-packaged frozen meal manufacturer (Saudi Airlines Catering) for storing prepared foods and serving them to pilgrims. In addition, campaign prices increased. |
| Place of issue: | Mina in Mecca |
| Goals: | Evaluation of quality of catering services and prepared food in holy places. |
| Solutions: | Gathering of pilgrims’ data to study their emotions, sentiments, and experience about provided catering services. |
| Platform: | |
| Keywords/Hashtags: | 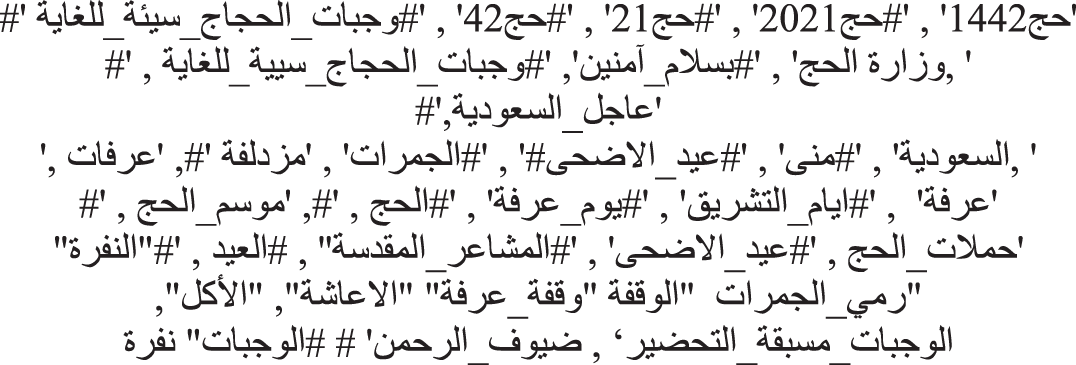 |
| Period/Year: | 1–13 Dhu al-Hijja, 1442 Hijri (11th–23rd July 2021). |
| Tweets language: | Arabic |
| Type of data: | Text |
| Size of dataset: | 9,832 Tweets |
| Type of annotation: | Manually |
| Dataset link: | https://www.kaggle.com/datasets/aishaalasmari/cateringhajj/data |
| Type of pre-processing: | Removal of URLs, usernames, hashtags, mentions, non-Arabic words, punctuation, and stop words; application of normalization. |
| Classifier model | Hybrid deep learning (CNN-LSTM) |
To apply our specific criteria, we used the Twitter API v2 (Twitter’s Application Programming Interface for Academic Research Access). Twitter API v2 includes access to full-archive search, collects 10 million Tweets per month, and has advanced search operators. Developers and academic researchers need to complete an application for academic research and obtain approval on it from Twitter Inc. to acquire access to this premium resource. A Python library called Tweepy was applied to access Twitter API v2. Tweepy is an open-source tool that provides smooth and transparent access to the endpoints of Twitter. This tool also helps to stream a high volume of Tweets in real-time based on specific search queries such as #hashtags, keywords, location, @username, mentions, etc. Algorithm 1 shows the code that was applied in the tweets collection process. Line 1 imports the related libraries such as “Tweepy” to handle Twitter API functions, as well as the “os” library to handle file saving. Line 2 consists in configuration and authenticating the connection with Twitter API v2; determining related queries/hashtags/topics, start time, and end time for collecting tweets; and determining the path and type (CSV) of the file. Line 3 processes the collected data and saves it on d2. Finally, the total number of collected tweets for the raw dataset (11,697) is obtained in this phase.
| Input: Twitter API v2 key and access token |
| Output: A set of data related topic of “Catering-Hajj” |
| 1. Initialize: import libraries (Twp, os) |
| 2. do: Configuration of connection with Twitter API v2 |
| d1 = Twp.Client (Access Token) |
| Determining queries, start_time, end_time, |
| os.file_name(path) |
| 3. d2 = file_name(d1.data) |
| 4. End |
Data annotation (Labeling)
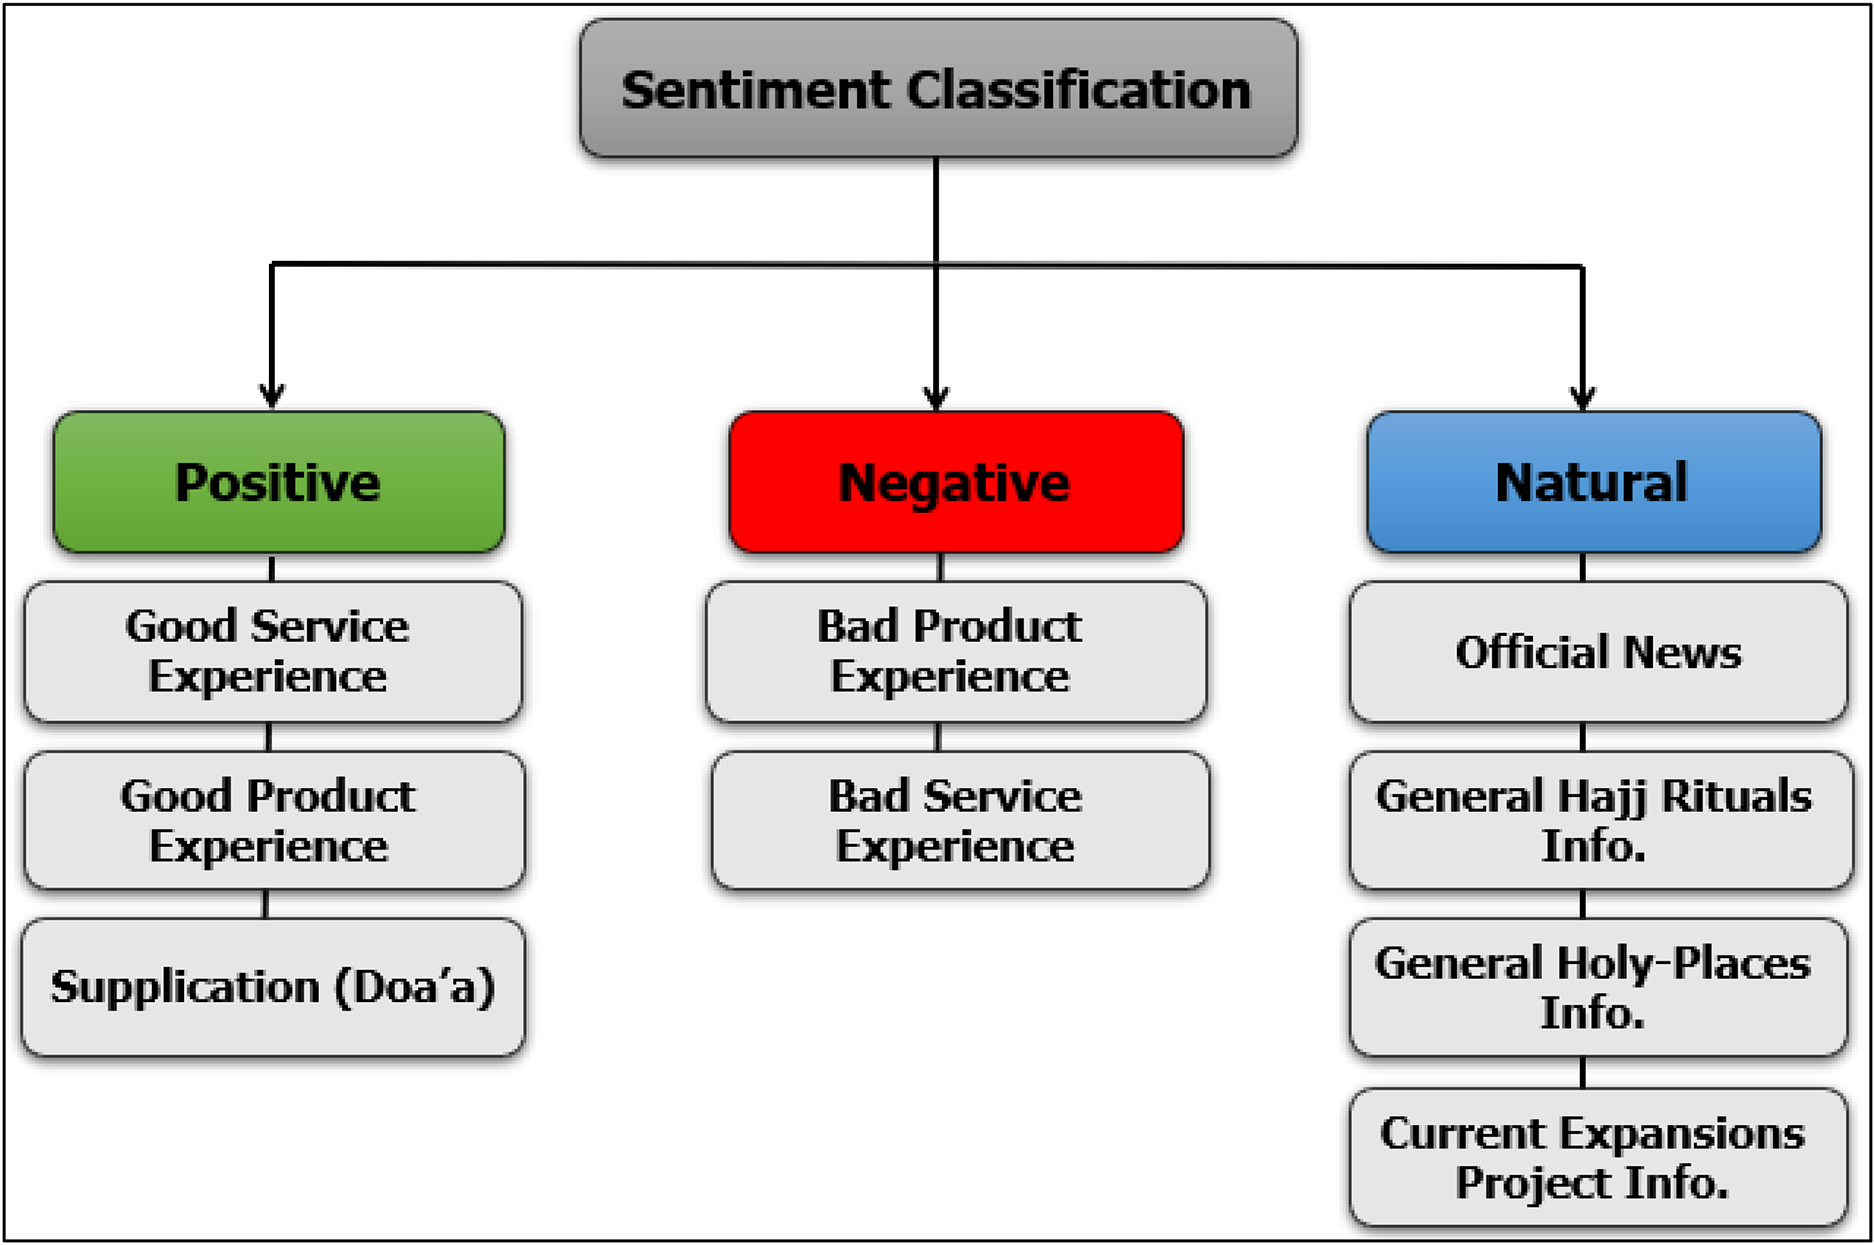
Data must be annotated (i.e., labeled) and prepared before its entrance into the training stage. To our knowledge, no existing annotated dataset is available for Hajj and pilgrims’ data. Labeling of tweets was performed manually according to the classification of emotions shown in Fig. 4. Tweets classified as Natural impressions included the following: official news (such as the official statements of the Ministry of Hajj and Umrah, Ministry of Health, Ministry of the Interior, and any official sectors participating); public information about Hajj rituals that describe ritual worship, such as a description of throwing the three Jamarat and so on; and information about holy places such as the current grand mosque and holy place expansion projects. Tweets containing a description of a good experience of any services/products and supplications (Doa’a) during Hajj were manually labeled as Positive impressions, whereas those describing a bad experience were flagged as Negative impressions. Table 3 presents tweets that used hashtags of Hajj; tweets whose content did not pertain to Hajj rituals were excluded. Additionally, duplicate tweets (1821) were discovered and removed by using the Pandas library before beginning the labeling process.
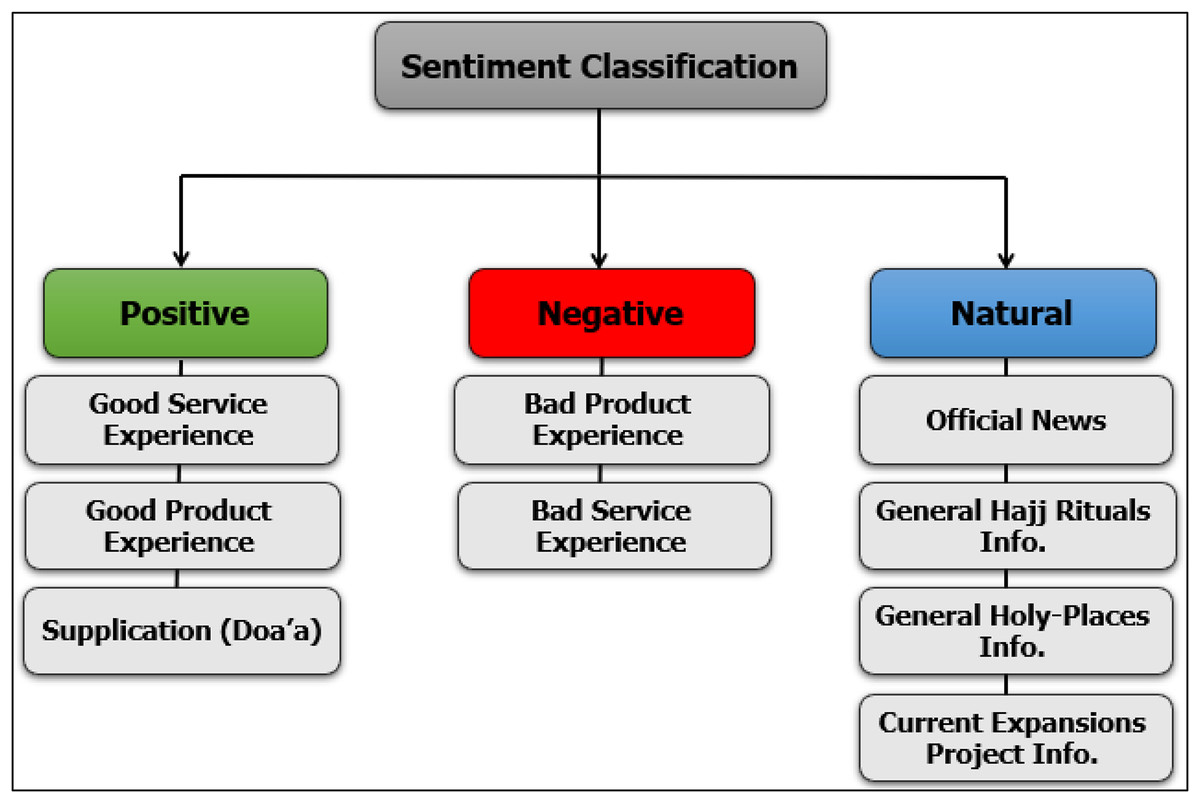
Figure 4: Sentiment classification of positive, negative, and natural impressions.
| No. | Arabic keywords/Hashtags | English translation |
|---|---|---|
| 1 | حج1442# | Hajj1442 |
| 2 | حج42# | Hajj42 |
| 3 | حج2021# | Hajj2021 |
| 4 | حج21# | Hajj21 |
| 5 | #وجبات_الحجاج_سيئة_للغاية , #جبات_الحجاج_سيية_للغاية | Pilgrims’ meals are very bad |
| 6 | #الوجبات_مسبقة_التحضير | Pre-prepared meals |
| 7 | #الوجبات | Meals |
| 8 | #الاكل | Foods |
| 9 | #حملات_الحج | Hajj companies |
| 10 | #الاعاشة | Catering |
| 11 | #وزارة الحج | Ministry of Hajj |
| 12 | #بسلام_آمنين | In peace and security |
| 13 | #موسم_الحج | Hajj season |
| 14 | #العيد | Eid |
| 15 | #عيد_الاضحى | Al-Adha Eid |
| 16 | #أيام التشريق | Days of Al-Tashreeq |
| 17 | #المشاعر_المقدسة | Holy places |
| 18 | #منى | Mina |
| 19 | #عرفة , #عرفات | Day of Arafah/Arafat |
| 20 | #الوقفة , #وقفة_عرفة | Day of the Standing at Arafah |
| 21 | #مزدلفة | Muzdalifah |
| 22 | #رمي_الجمرات , #الجمرات | Jamarat |
| 23 | #النفرة | Nafrah |
| 24 | #ضيوف_الرحمن | Guests of Allah |
| 25 | #عاجل_السعودية | Ajel News |
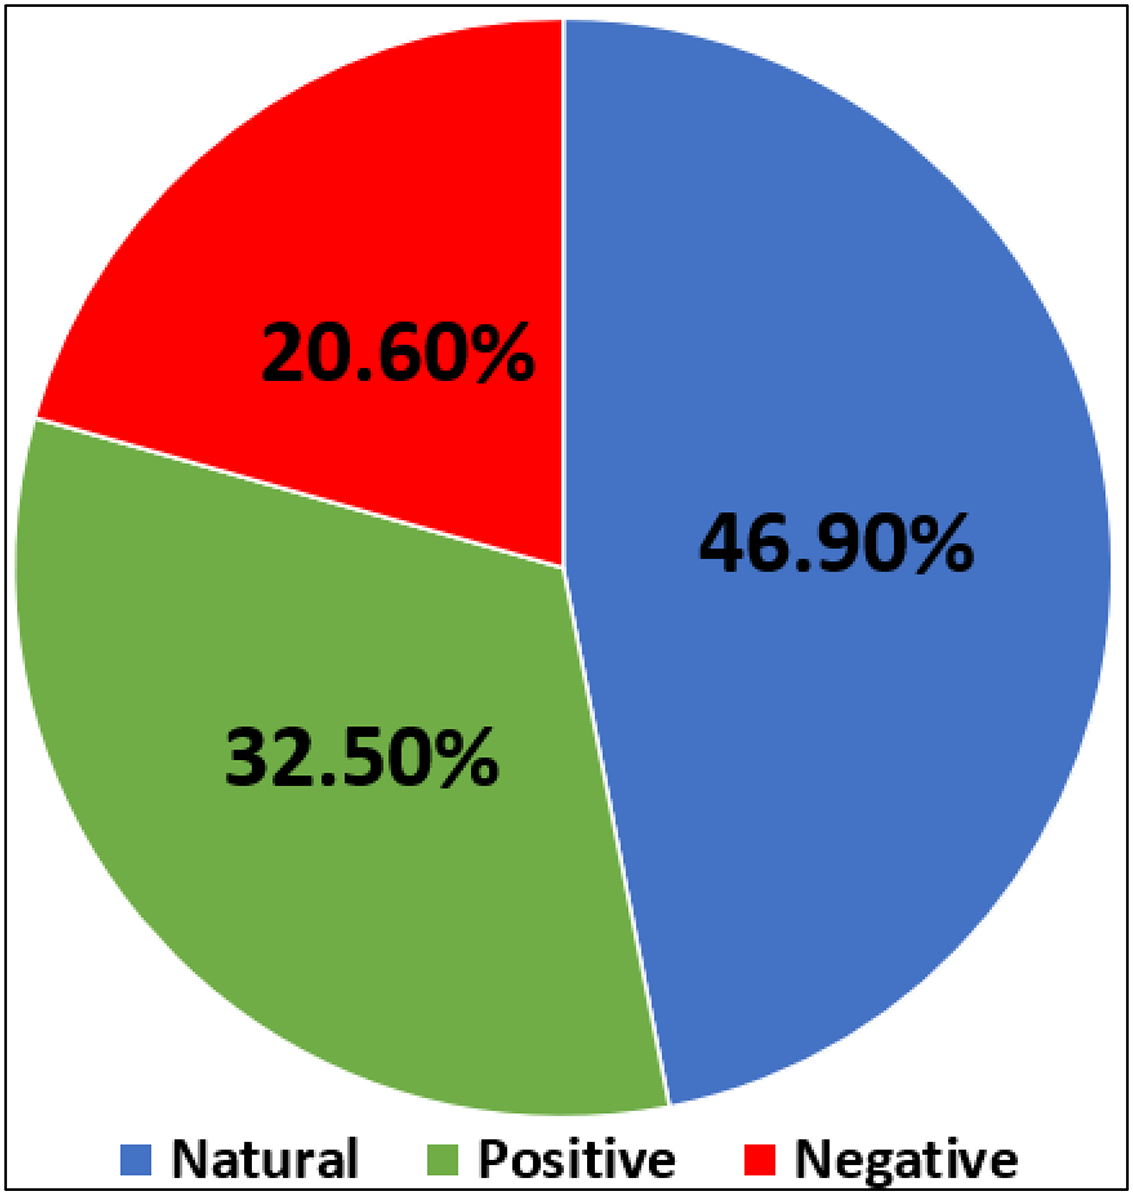
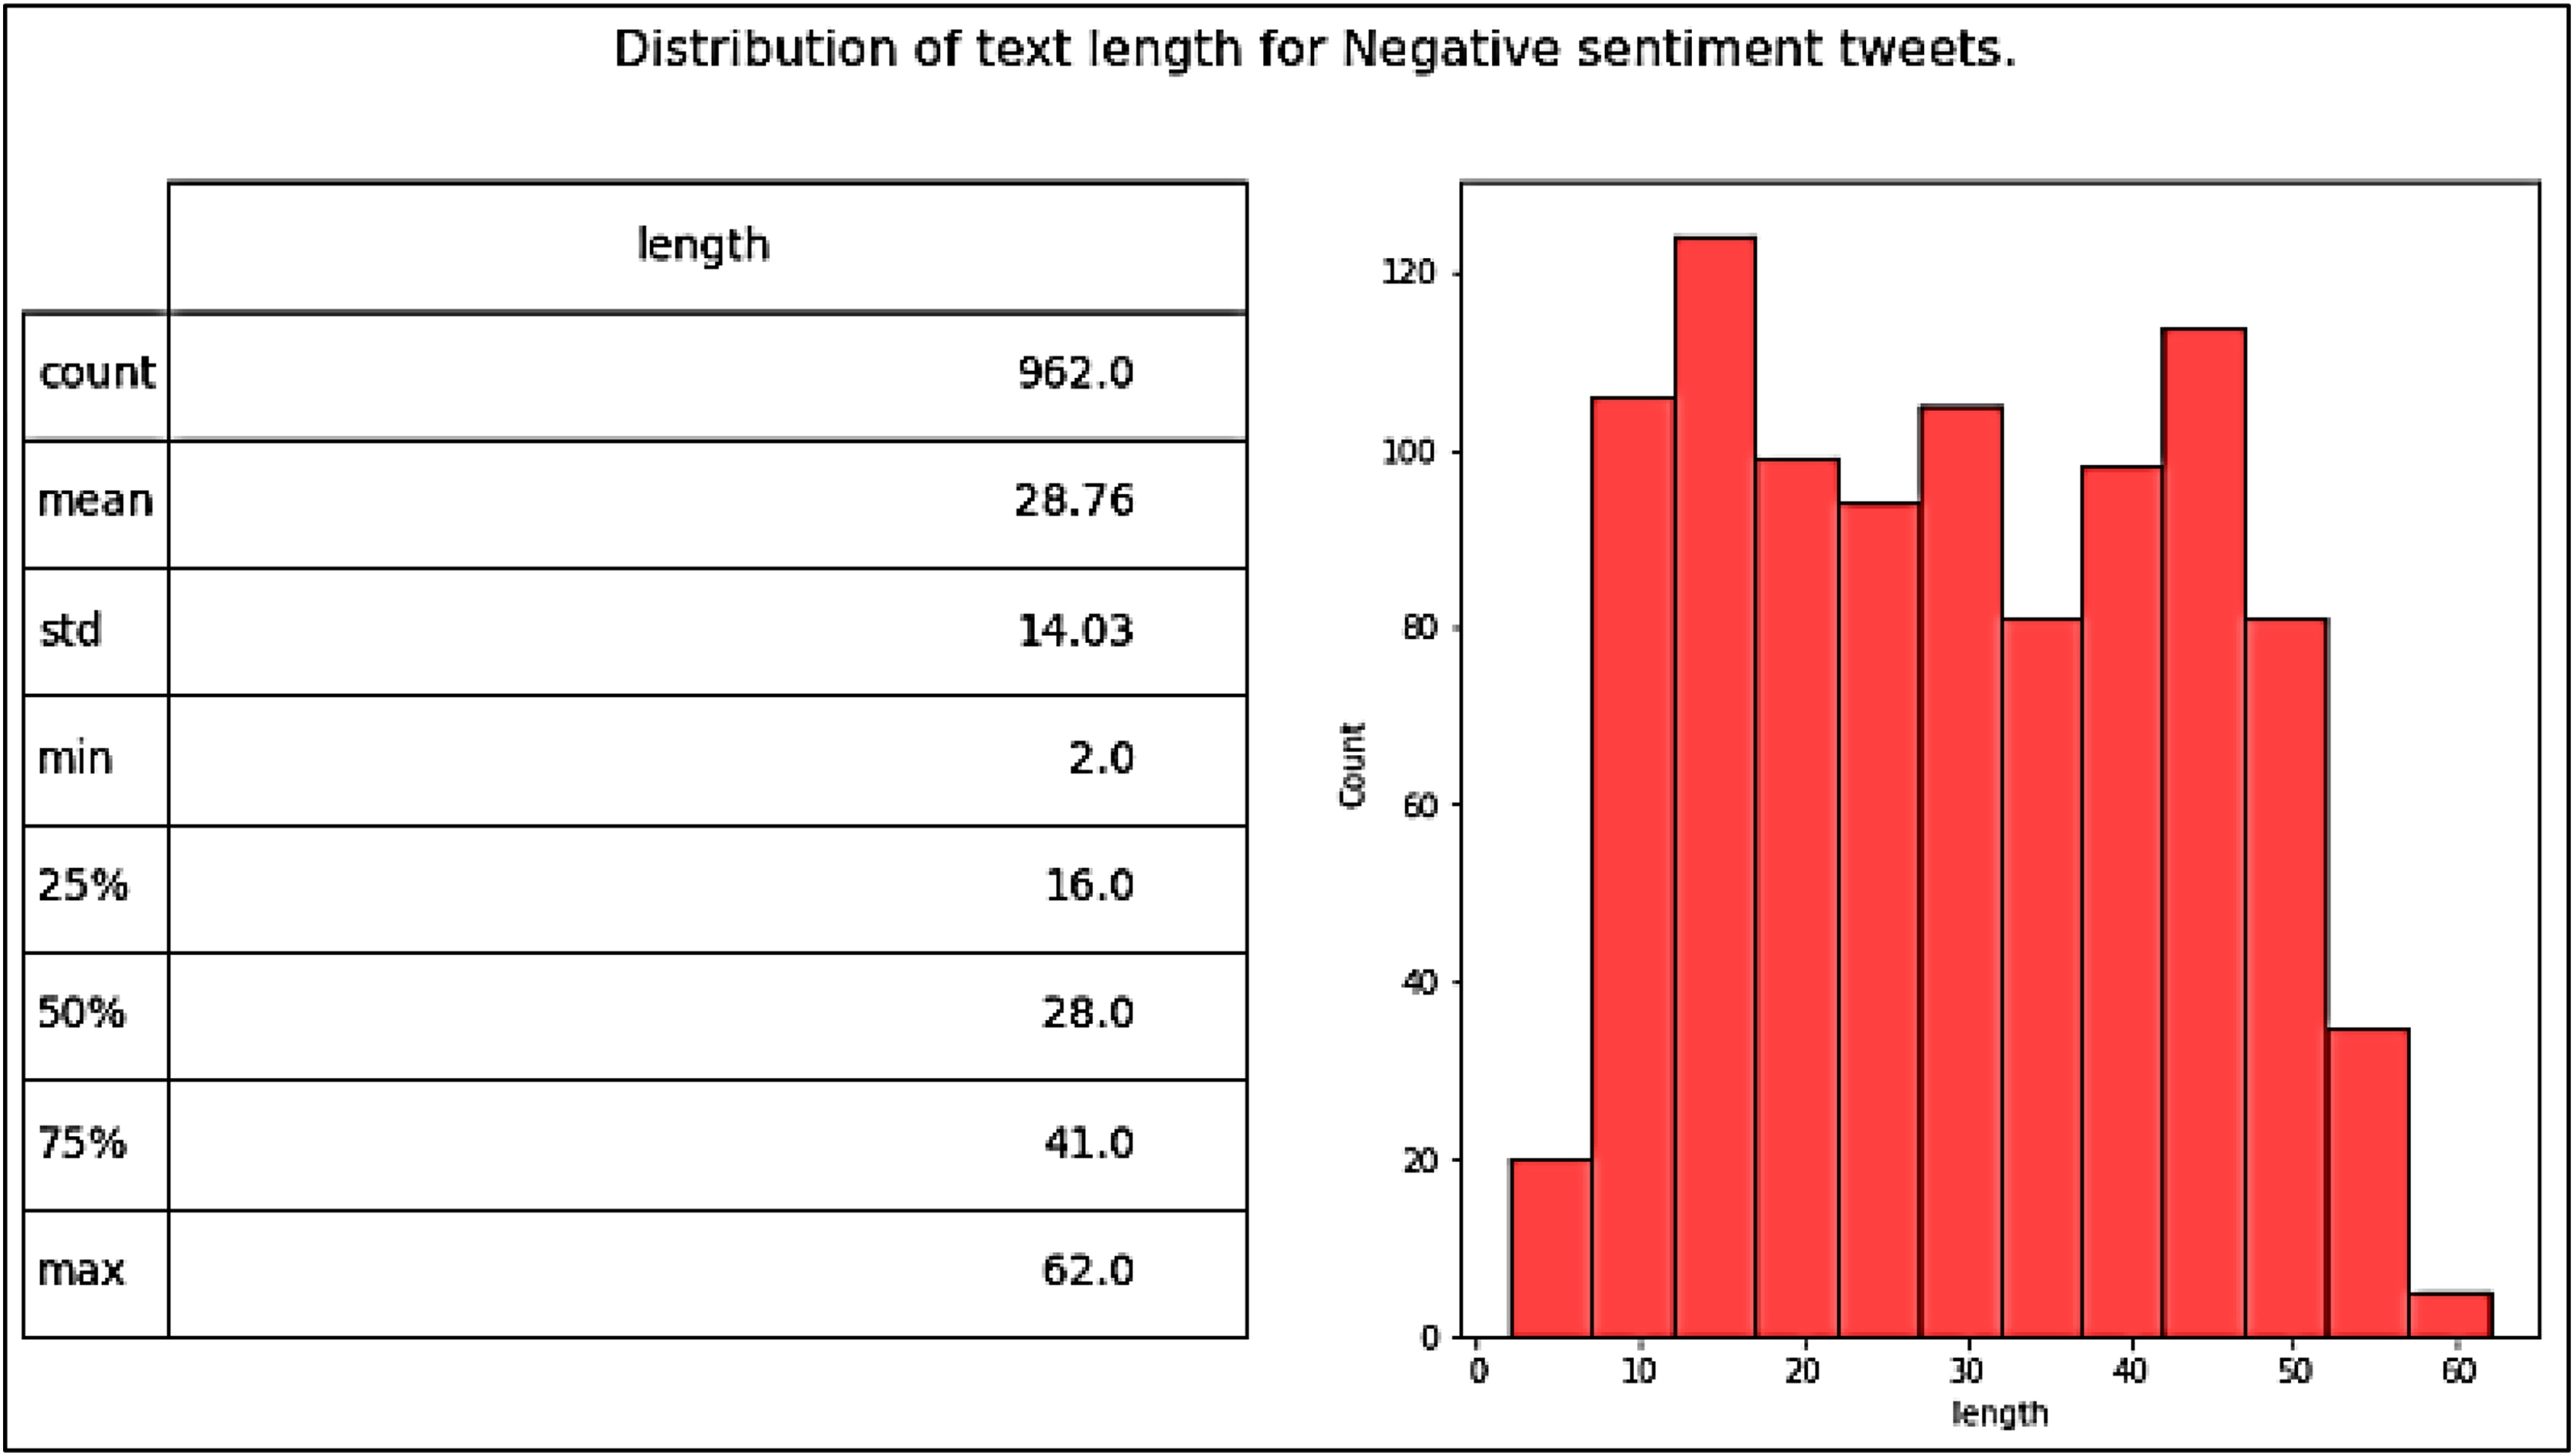
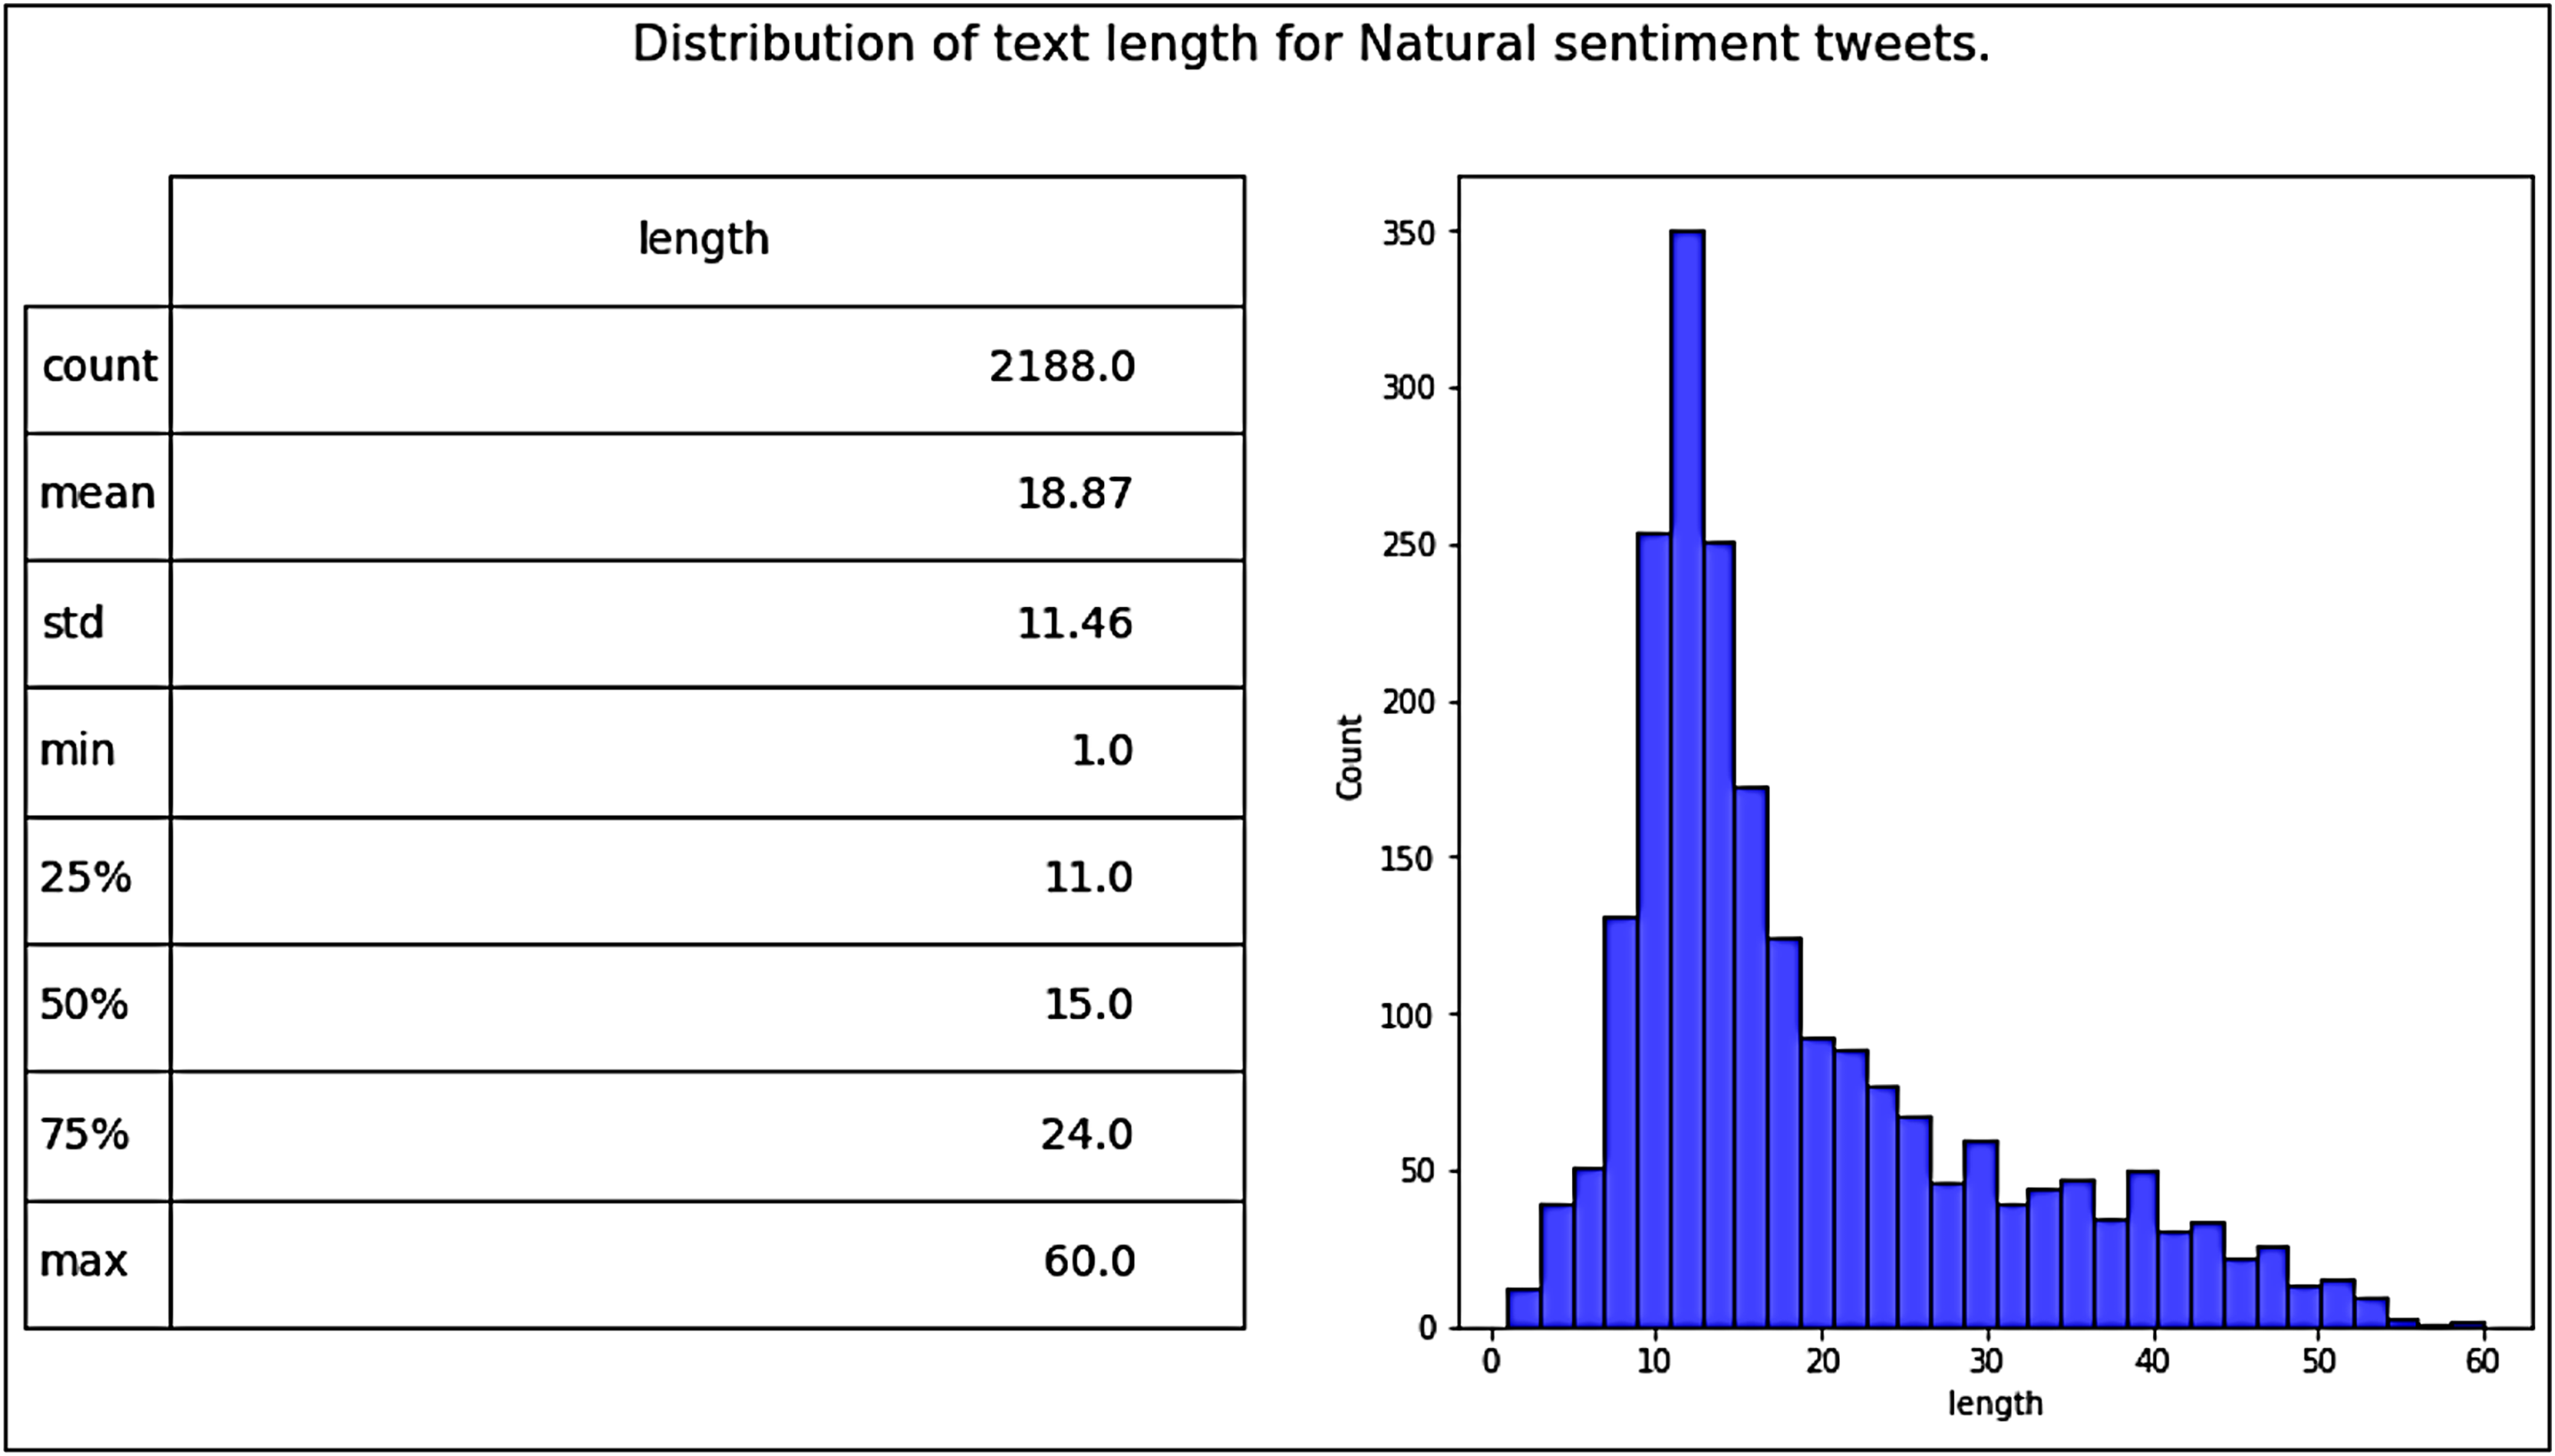
Consequently, in this phase a total of 4,669 tweets for the catering dataset were annotated, as displayed in Fig. 5. Of this total, 1,519 were labeled Positive, 962 were labeled Negative, and 2,188 were labeled Natural. In addition, 5,164 unrelated tweets that used Hajj hashtags were excluded from the dataset. Table 4 displays an example of tweets with different sentiment classes.
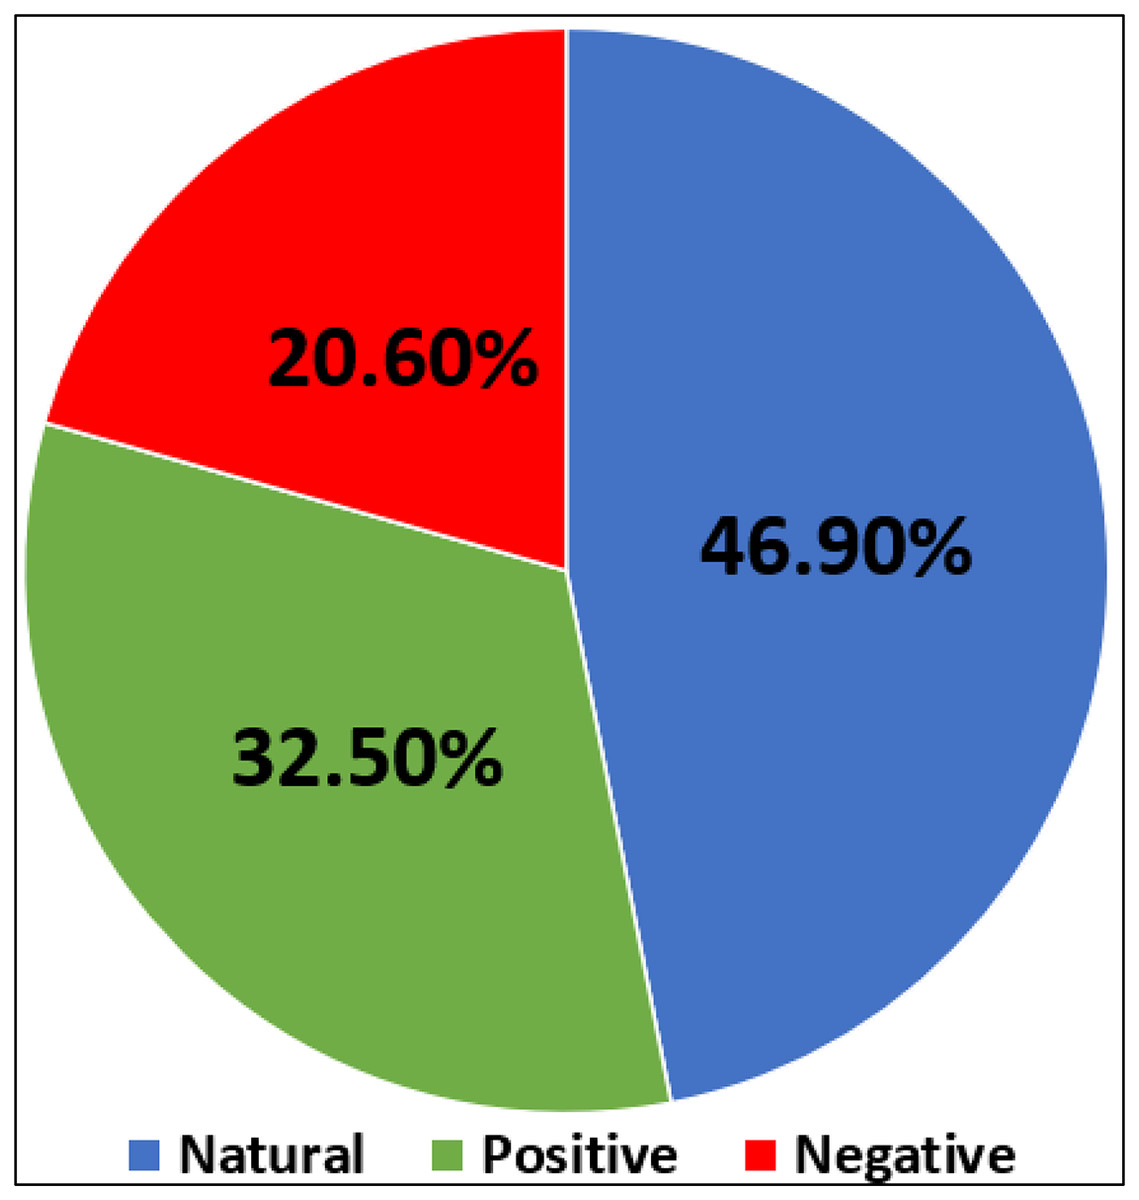
Figure 5: Number of natural, negative, and positive impressions in our dataset.
| Sentiment | Tweet | English translation |
|---|---|---|
| Positive |  |
Praise be to God for the completeness  Thank you, Ministry of Hajj, thank you, the government of king Salman, the Hajj is more than a wonderful organization; high-level precautions in light of the Corona pandemic. Thank you, Ministry of Hajj, thank you, the government of king Salman, the Hajj is more than a wonderful organization; high-level precautions in light of the Corona pandemic. |
| Negative |  |
Bad food, please hold the perpetrator accountable. |
| Natural |  |
The supplication for the oneness of God. |
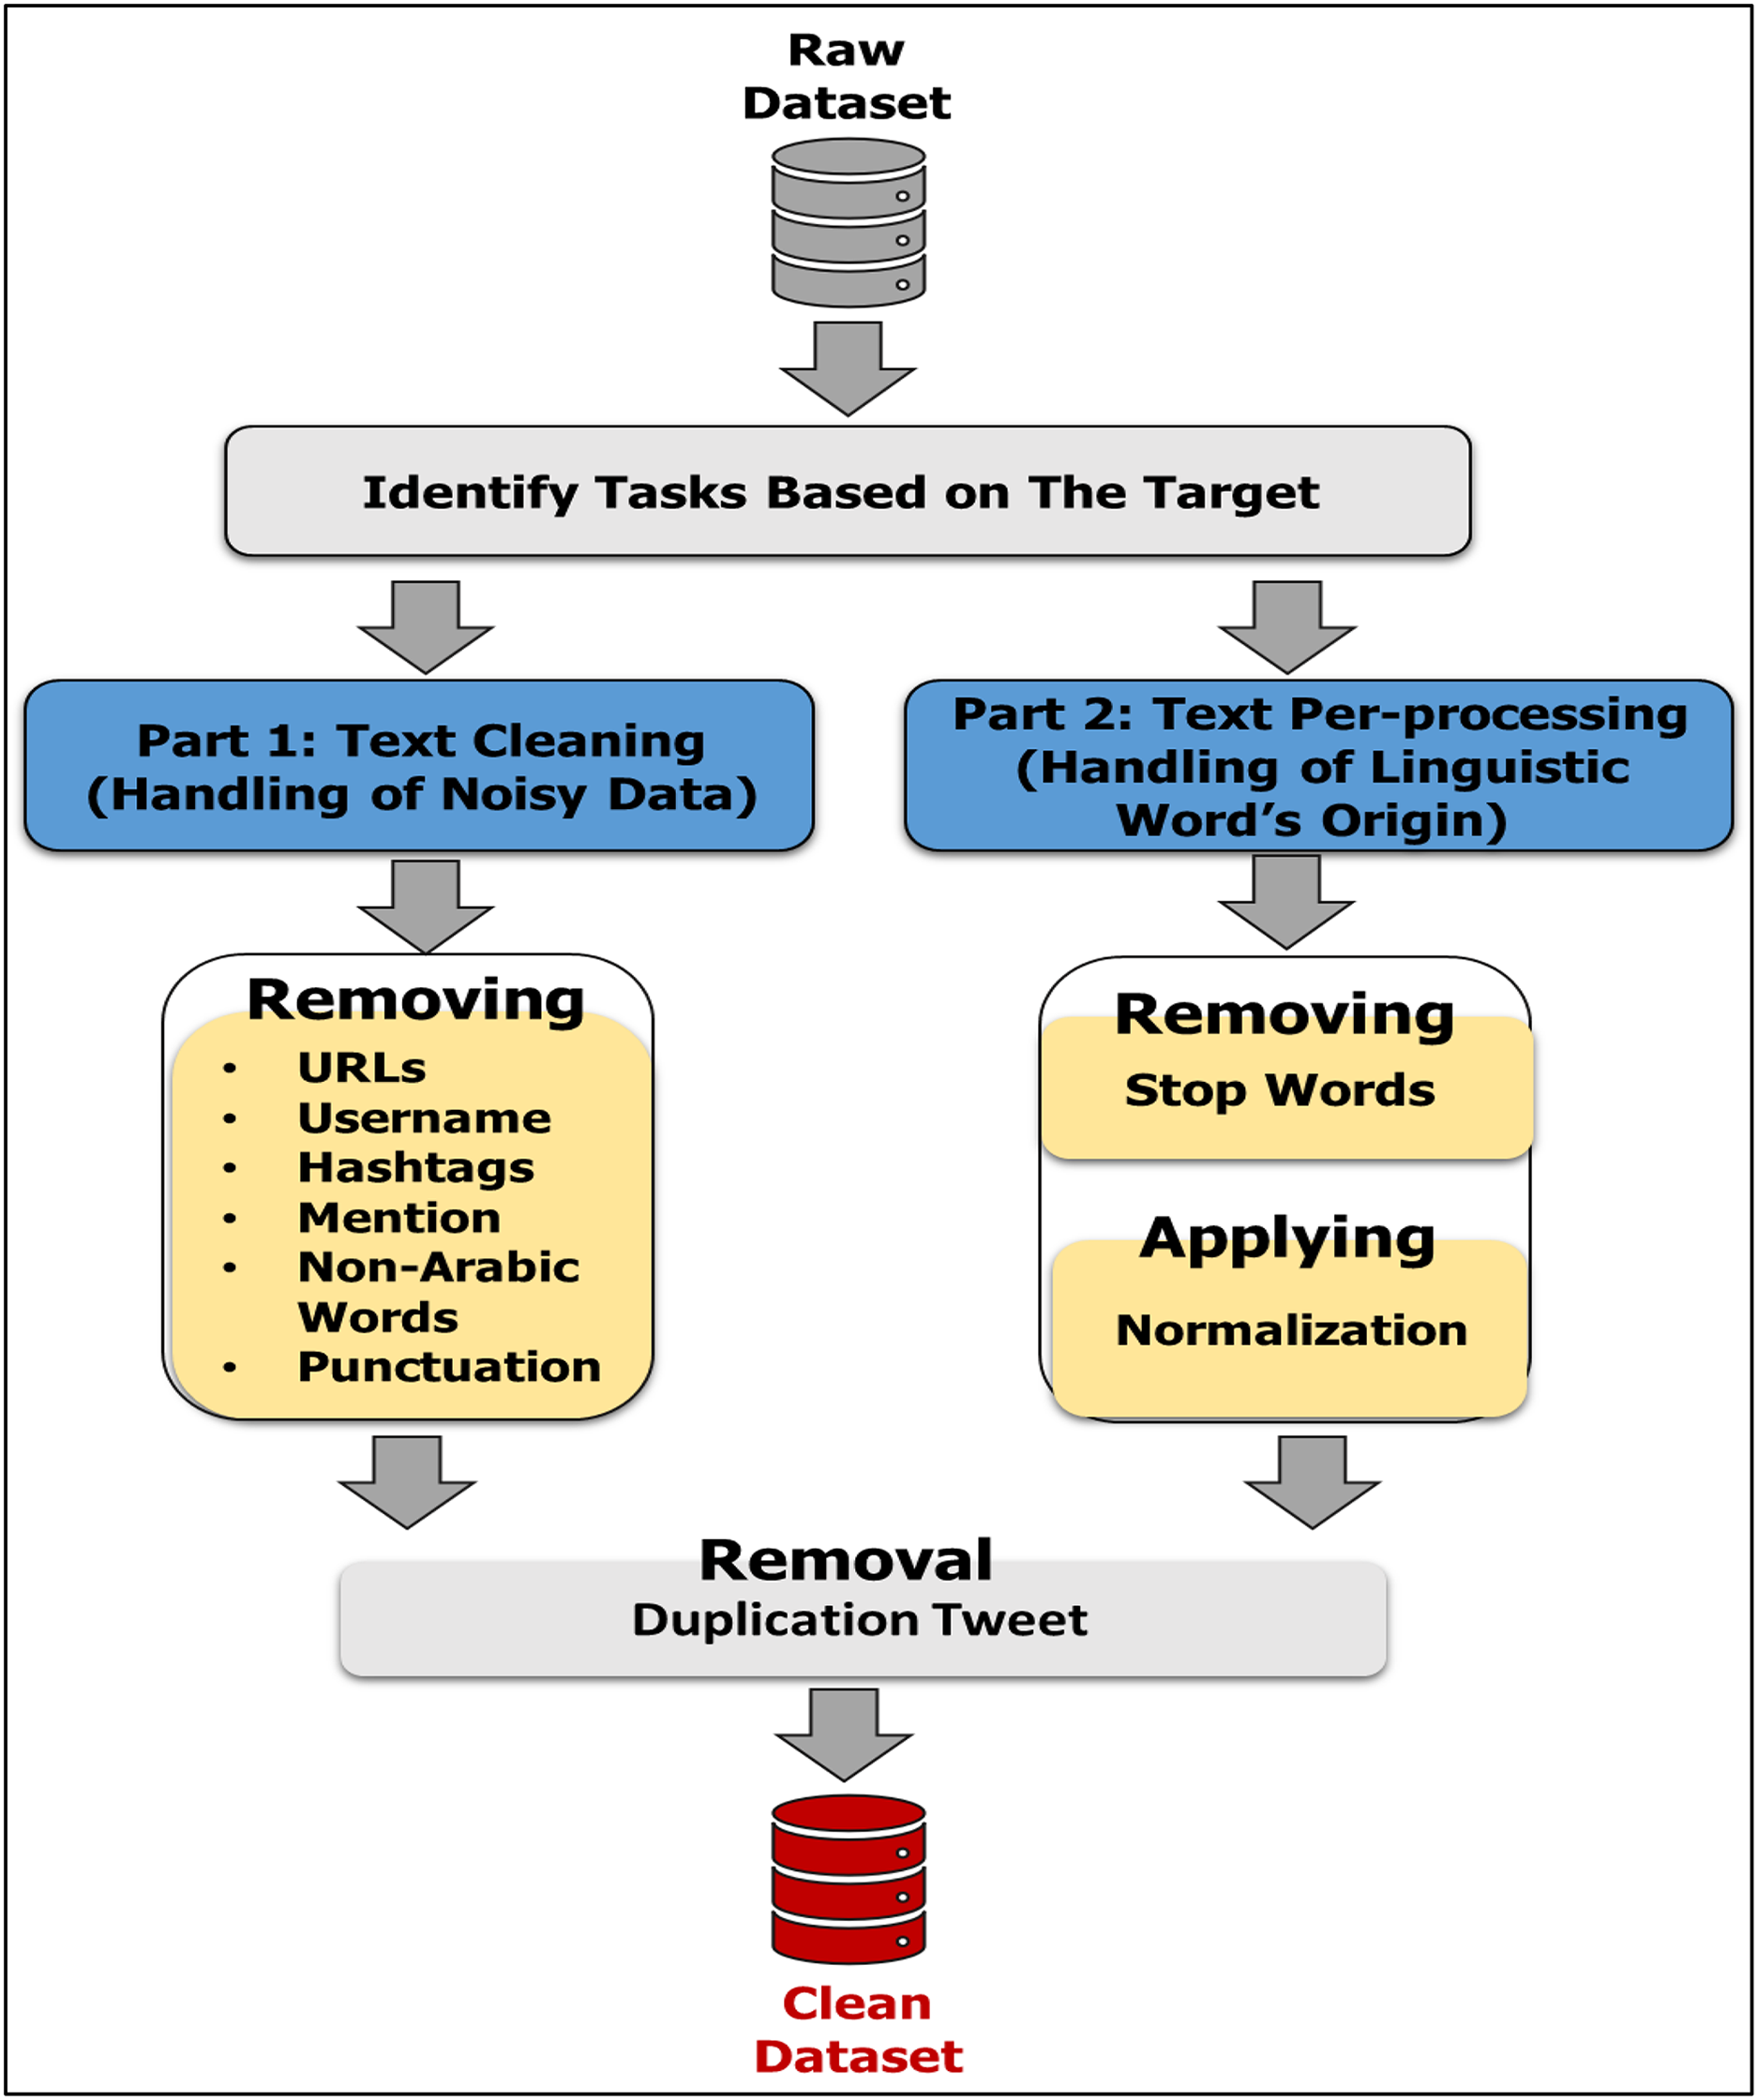
Data preprocessing
Data pre-processing also called (data cleaning) is an important step in any machine learning algorithm, including both supervised and unsupervised learning algorithms. The process is especially important with unstructured data such as textual data. There are many different types of textual data preprocessing tasks: stemming; lemmatization; lower casing; removal of stop words, punctuations, frequent words, rare words, emojis, emoticons, Uniform Resource Locator (URLs), and HyperText Markup Language (HTML) tags; chat words conversion; spelling correction; conversion of emoticons to words; and conversion of emojis to words. These are common tasks of textual data preprocessing. However, data preprocessing is the basic task. In sentiment analysis, we need to know the implied semantics of the meanings of words. In our work, the pre-processing stage includes two parts: Part 1 is Text Cleaning, which concerns the removal of noise from the dataset, i.e., URLs (links), usernames, hashtags, mentions, non-Arabic words, punctuation, and emojis. After the dataset is cleaned, the duplication function is performed again to guarantee that there are no similar texts. Part 2 is Text Preprocessing, which handles the origin of linguistic words. It involves the removal of stop words and the application of normalization. Figure 6 shows these sequential stages.
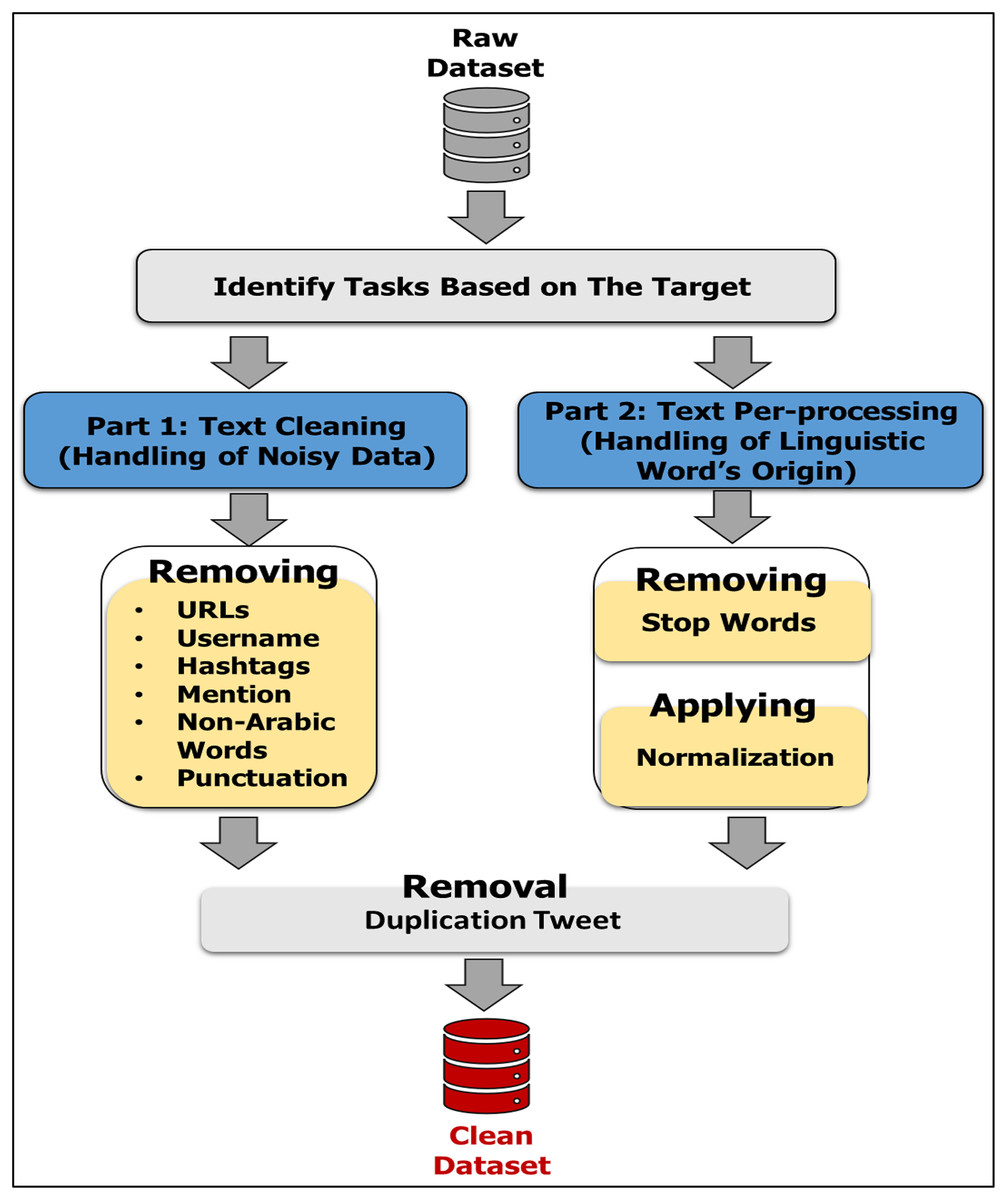
Figure 6: Steps of data pre-processing.
Part 1: text cleaning
Removal of hashtags/usernames/mentions: A hashtag is a common way for people to categorize and share conversations on hot trends or particular topics. A mention refers to the user’s inclusion in the tweet. A username indicates the user’s ID on social networks. Hashtags use the sign #, and the sign @ is in front of keyword usernames and mentions. These marks do not affect the concept of texts when deleting them. The “re” library is used to delete these marks.
Removal of Non-Arabic words: The content of posts/tweets is in multi-languages; non-Arabic words are ignored due to our focus on Arabic responses in this study. In addition, we have utilized the “re” library to deal with the deletion of various languages.
Removal of URLs/HTTP: URLs are links or references to a location on the web; however, they do not carry much valuable information that may be helpful for emotional analysis purposes. Thus, the types of URLs (like HTTP, HTTPS, and WWW) are removed from the tweets to improve their content. We use the (re) library, which provides regular expression matching operations.
Removal of Punctuation: Certain punctuation marks are removed to obtain a text standardization process that will help to treat expressions with and without these marks in the same way (e.g., “مرحبا”, Hello, and “!مرحبا”, Hello!). Python includes the following punctuation symbols: !"#$%\’()&+*,-./:;<=>?@[\\]_^{|}~`. However, the punctuation list is used to eliminate them under our use case. The (re) library is used to deal with ignored punctuation.
Removal of Duplication: When completing steps, the duplication function is carried out again to ensure that there are no similar texts after the elimination of noisy data.
Part 2: text preprocessing
-
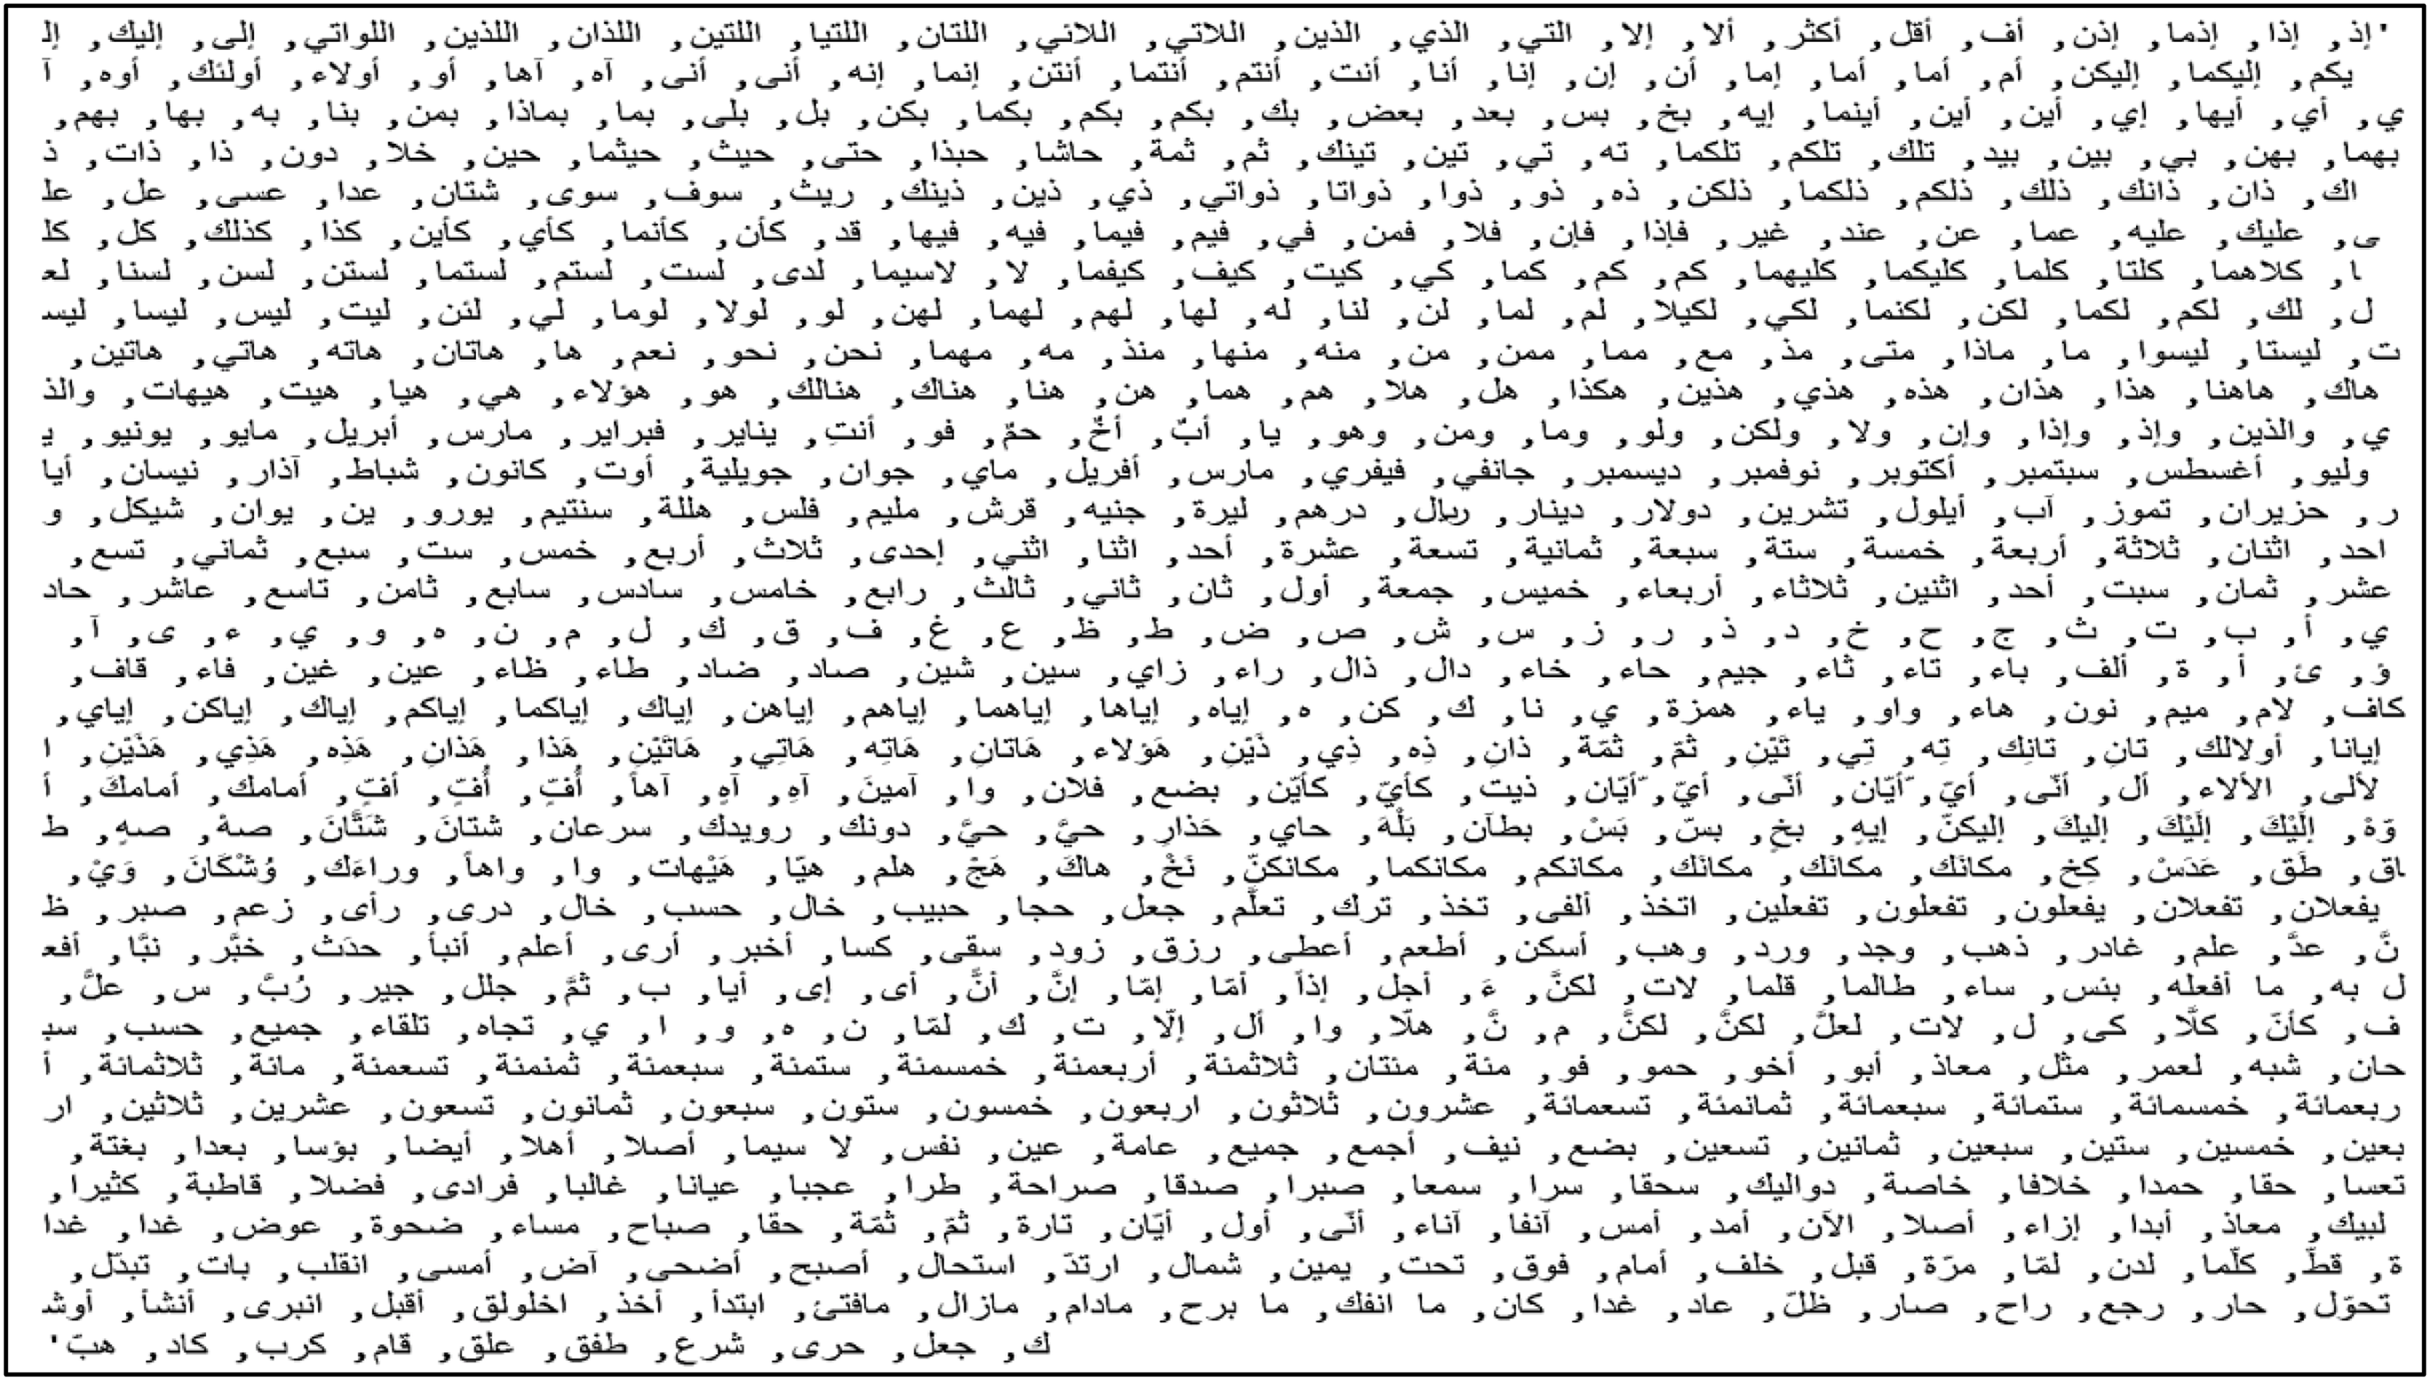
Removal of stop words: A major task of preprocessing data is filtering out unwanted words such as أما, إذا, التي, الذي. The purpose of this elimination is that these words do not affect the meaning of the text when discarded; thus, they take up space in our database and consume a massive amount of processing time. Natural Language Toolkit (NLTK) Library has a list of Arabic stop words, which are presented in Fig. 7.
-
Apply normalization: The aim of normalizing text is to set related tokens together. Depending on our use case, we do not need all of the normalization techniques, only those functions that are suitable for the Arabic language and our dataset. The function unifies the orthography of the “alif” letter (أآإا to ا), hamzas (ئ, ء, ؤ), and the “ha” letter (ه ,ة ,هـ). Moreover, it eliminates the duplication of letters from words such as الحجاااااج, which is reduced to الحجاج. Algorithm 2 describes an operation of data preprocessing that we have used in our work. Line 1 imports the related libraries. For example, “p” indicates “pandas” to handle the data file, and “r” indicates “regular expression” to handle various marks, stop words, and the NLTK in addressing the Arabic language. Line 2 removes all mentions and hashtags signs (@/#). Line 3 removes all non-Arabic words, and line 4 removes URL marks. Line 5 removes punctuation signs, and line 6 removes duplication Tweets after cleaning operations are finished. Lines 7 and 8 remove Arabic stop words in the NLTK library. Line 9 is used to apply normalization to Arabic words. Finally, Lines 10–12 apply all classes on our dataset by importing the function apply().
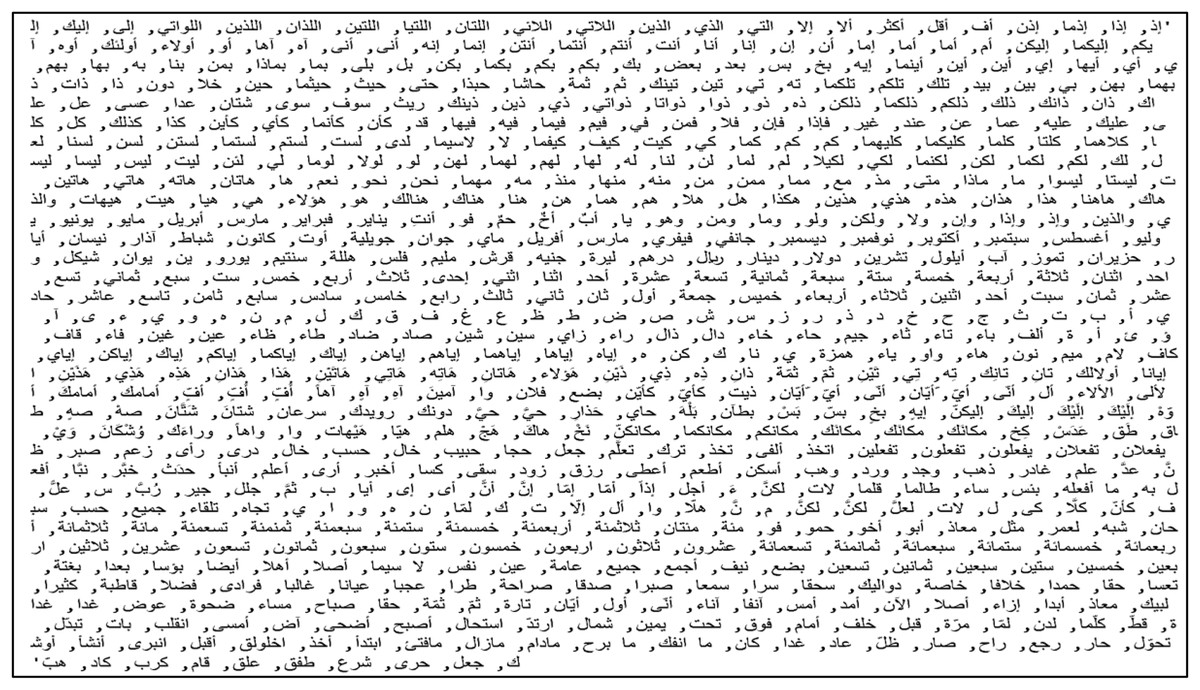
Figure 7: Arabic stop words list stored in NLTK library.
| Input: A set of data related topic of “Catering-Hajj” as a raw dataset |
| Output: clean dataset |
| 1. Initialize: import libraries (p, r, stopwords, nltk) |
| 2. Class1: Removing_hashtag_mention (d2): |
| d2= r.remove(‘@, #[A-Za-z-0-9]’) |
| 3. Class2: Removing_non_arabic (d2): |
| d2= r.remove(‘A-Za-z’) |
| 4. Class3: Removing_URL (d2): |
| d2= r.remove(‘http, https. www’) |
| 5. Class4: Removing_punctuations (d2): |
| d2= r.remove (‘sympols’, d2) + replace (“ ,” ) |
| 6. Removing duplication Tweets by |
| d2.drop() = True |
| 7. Downloading stopwords(Arabic) by |
| 8. Class5: Removing_stopwords (d2): |
| For words in str (d2).split() if words not in stopw |
| Return (d2) |
| End For |
| 9. Class6: Apply_normalization (d2): |
| d2= r.remove (‘Arabic Letters’, d2) |
| 10. Return (d2) |
| 11. Applying all classes on dataset (d2) by |
| d3 = d2.apply(Removing_hashtag_mention, |
| Removing_hashtag_mention, Removing_URL, Removing_punctuations, |
| Removing_stopwords, Apply_normalization) |
| 12. End |
Feature extraction
A tokenizer is a process that divides a stream of characters into individual tokens/words. This process is implemented after preprocessing data. The tokens/words are then indexed or vectorized. For feature extraction, the One-Hot Encoder is performed. It is one method of converting categorical data to numerical vectors to prepare the data for a model and obtain a better prediction for classification. This encoding method is simple and for this reason, it is widely used in NNs. CNN-LSTM model cannot turn directly on textual data. Data should be in numeric form. One item is assigned to 1 and all other items are assigned to 0s, which the one-hot encoding employs a sparse vector. The vector is a 1 × N vector (matrix), 1 cell is represented uniquely identifies a word, while the rest of the cells consist of 0 values. The One-Hot Encoder preserves the unique information of each category. It ensures that the algorithm does not suppose any ordinal or sequential relationship among the categories. In other words, categories are represented independently. Thus, the One-Hot Encoder avoids introducing unpremeditated biases based on the sequence of categories.
Data classification (CNN-LSTM)
This model merges two robust neural networks; CNN and LSTM. The LSTM has a good algorithmic performance in terms of handling text, especially with opinions analysis, and the convolution layers in the CNN are considered a strong addition to our model by allowing extraction of the maximum number of features from the dataset. The output of CNN becomes the input of LSTM. Hence, this hybrid model retains the consecutive order of the data in both directions.
Convolutional neural network
The Convolutional Neural Network (CNN/ConvNet) is a class of DL, as illustrated in Fig. 8. CNN uses a multilayer perceptron for the least possible preprocessing. The CNN technique was originally constructed for the processing of video scenes and images in the computer vision domain. However, CNNs give effective results for text classification (LeCun, Bengio & Hinton, 2015; Jaderberg et al., 2016). In 2015, Lai et al. (2015) were the first to attempt the integration of CNN-LSTM techniques in the field of text classification. Since then, there has been much success in broadening the horizon of CNN-RNN techniques in this field.
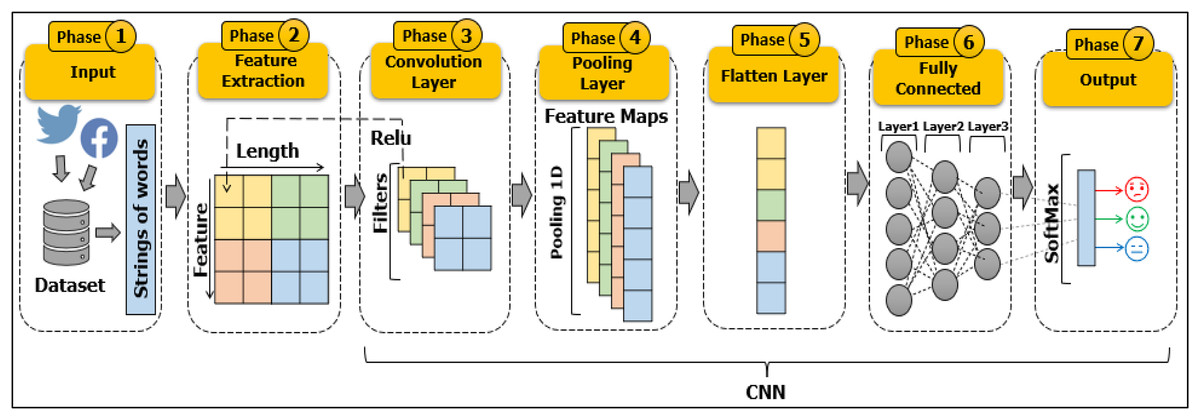
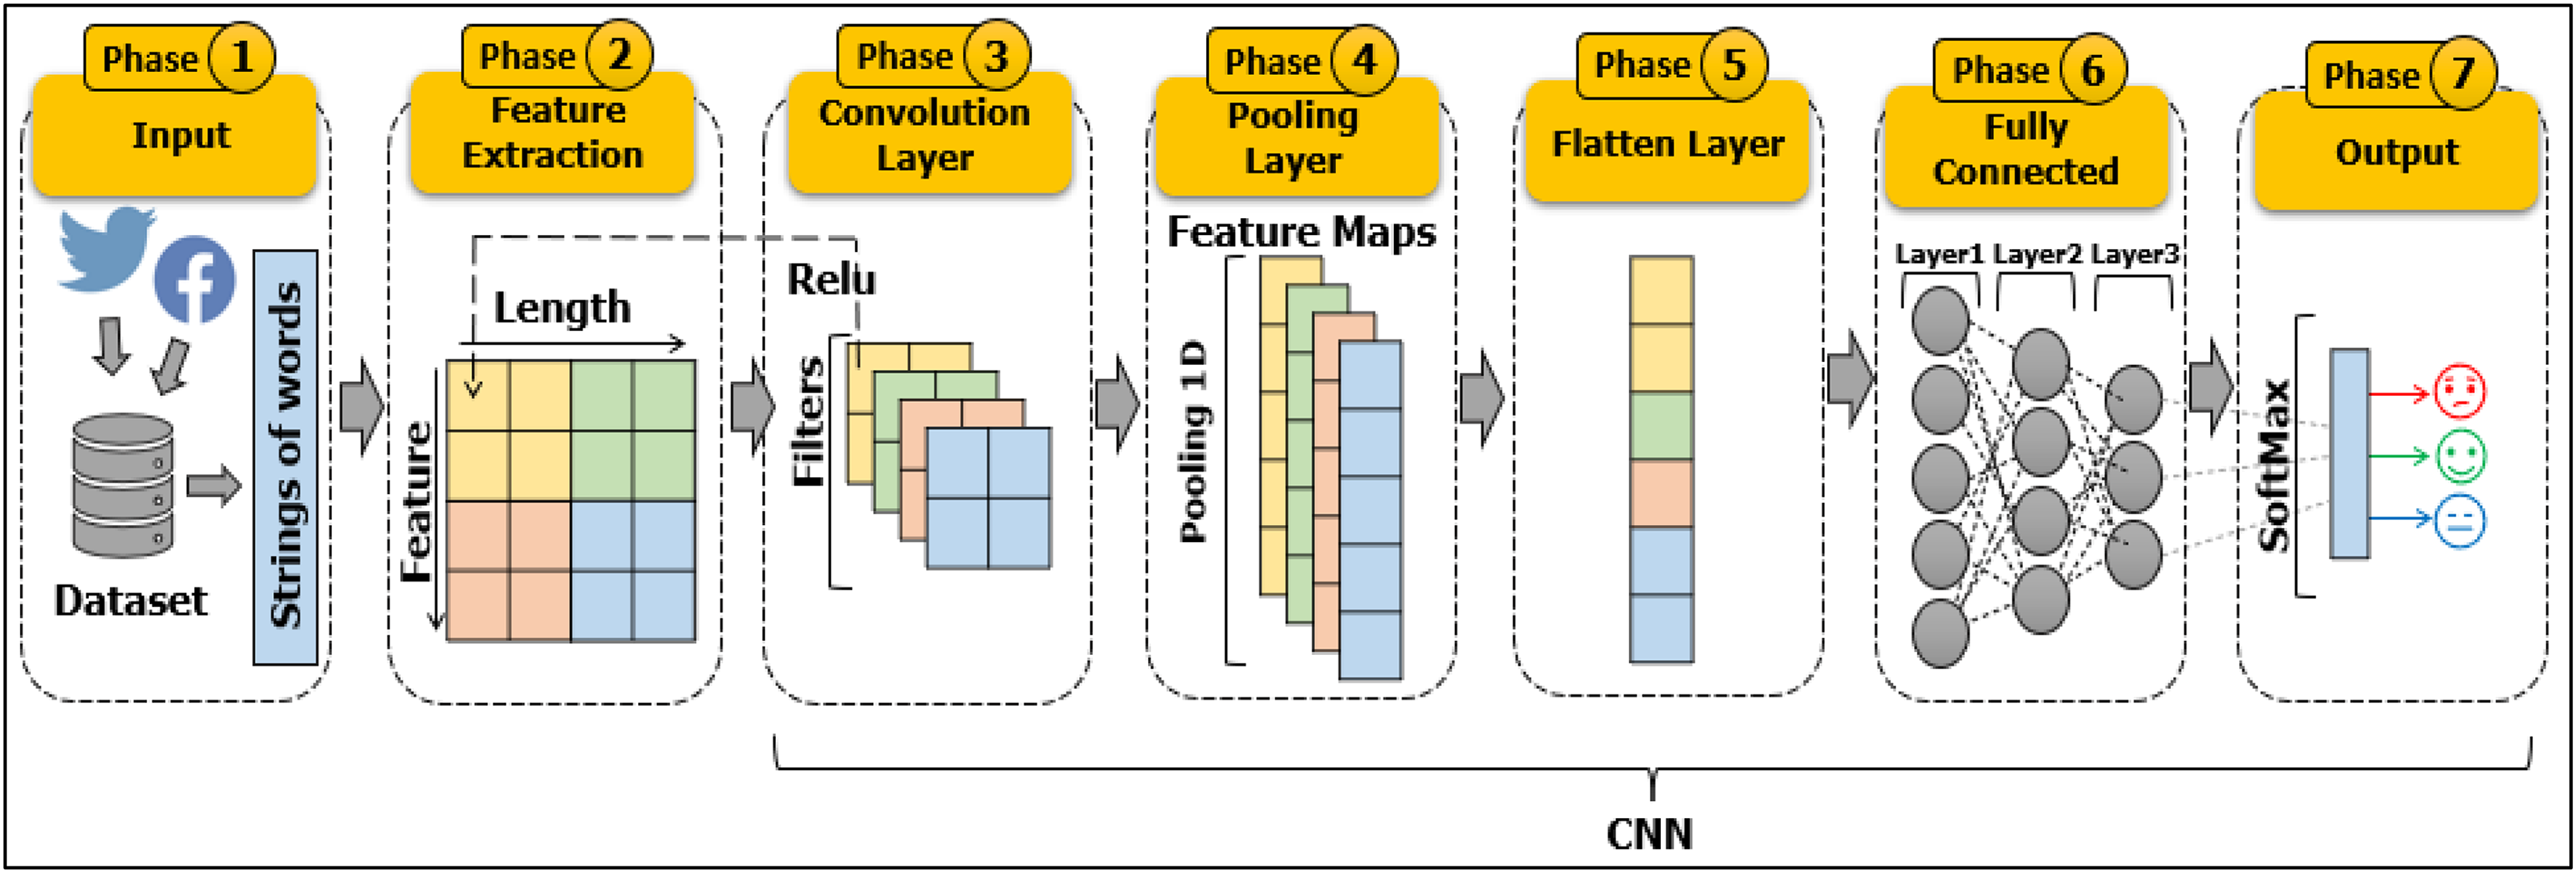
Figure 8: Architecture of CNN for text classification.
In an image classification context, an image tensor is convolved with filters (also called kernels) at sets of size d × d, which means two dimensions of convolution (2D-convolution) in the convolution layer. It is also a called feature map as it can be stacked to give several filters on the input. Pooling is used to reduce the computational complexity of the size of the outputs for each layer in the network. Various techniques of pooling are applied to perform this task while preserving important attributes (Scherer, Müller & Behnke, 2010). However, when CNNs are adopted for text classification, a one-dimensional (1D-convolution) array representation should be used for the text in the convolution layer as well as for the pooling operation (1D-pooling). When converting categorical data to numerical vectors in the feature extraction phase. We will get matrices of vectors representing texts. The dot product of vectors might produce zero even when they belong to the same category by One-Hot Encoder, while if they find similarities between those embedded words, then this encoder will be able to find the interrelation of words for a particular category. Then, in the CNN phase. The filter slides over these vector matrices to find convolutions, then, the Max pooling layer reduces the complexity and computation for dimensional matrices.
The architecture of CNN for text classification problems consists of three main layers: the convolution layer, the pooling layer, and the fully connected layer. The convolution layer carries out feature extraction from the text with the assistance of various filters. The Rectified Linear Unit (ReLU) function is applied as the intermediate process between the convolution layer and the pooling layer. In the pooling layer, the pooling operation reduces the dimensions of the features to reduce the computational workforce in every layer and present the features in the text more effectively. The fully connected layer, which is the last layer, is a fully artificial neuron network that demonstrates the features of the text and the target category labels. Thus, when a new text is added to the CNN model as an input, it passes through previous layers to arrive at the output, where training is complete. The CNN performs the prediction category probability (Yadav & Vishwakarma, 2020). Figure 8 represents a visual concept of a CNN model taking the text as an input and implementing operations through all layers to predict the class of the text.
Long short-term memory
The Long Short-Term Memory (LSTM) neural network is the most popular model among Recurrent Neural Networks (RNNs). The RNN is a type of neural network first introduced in the 1980s (Rumelhart, Hinton & Williams, 1986; Werbos, 1988). The structure of the RNN includes an input layer, one or more hidden middle layers, and an output layer. The RNN is based on the concept of the classical feed-forward neural network (FNN) (Hornik, Stinchcombe & White, 1989) and has a feedback loop for sequences of inputs. The outputs are granted as new input to the previous neurons based on new input values (Rumelhart, Hinton & Williams, 1986). The values of output depend on the input at the current time (t) at any neuron network (t + 1). In addition, the input data should be standardized. This recurrent flow adds dynamism to the network model and is known as a memory network model (Staudemeyer & Morris, 2019). RNNs have been shown successful for sequential data. The simplest conception of RNNs shows one input layer, one recurrent hidden middle layer, and one output layer expanded into a full network, where Xt are the input values in the input layer at time step t, and ht is the output value in the output layer at time step t. RNNs utilize a common backpropagation algorithm to adjust weight matrices and calculate gradients in Artificial Neural Network (ANN) during the training process of data.
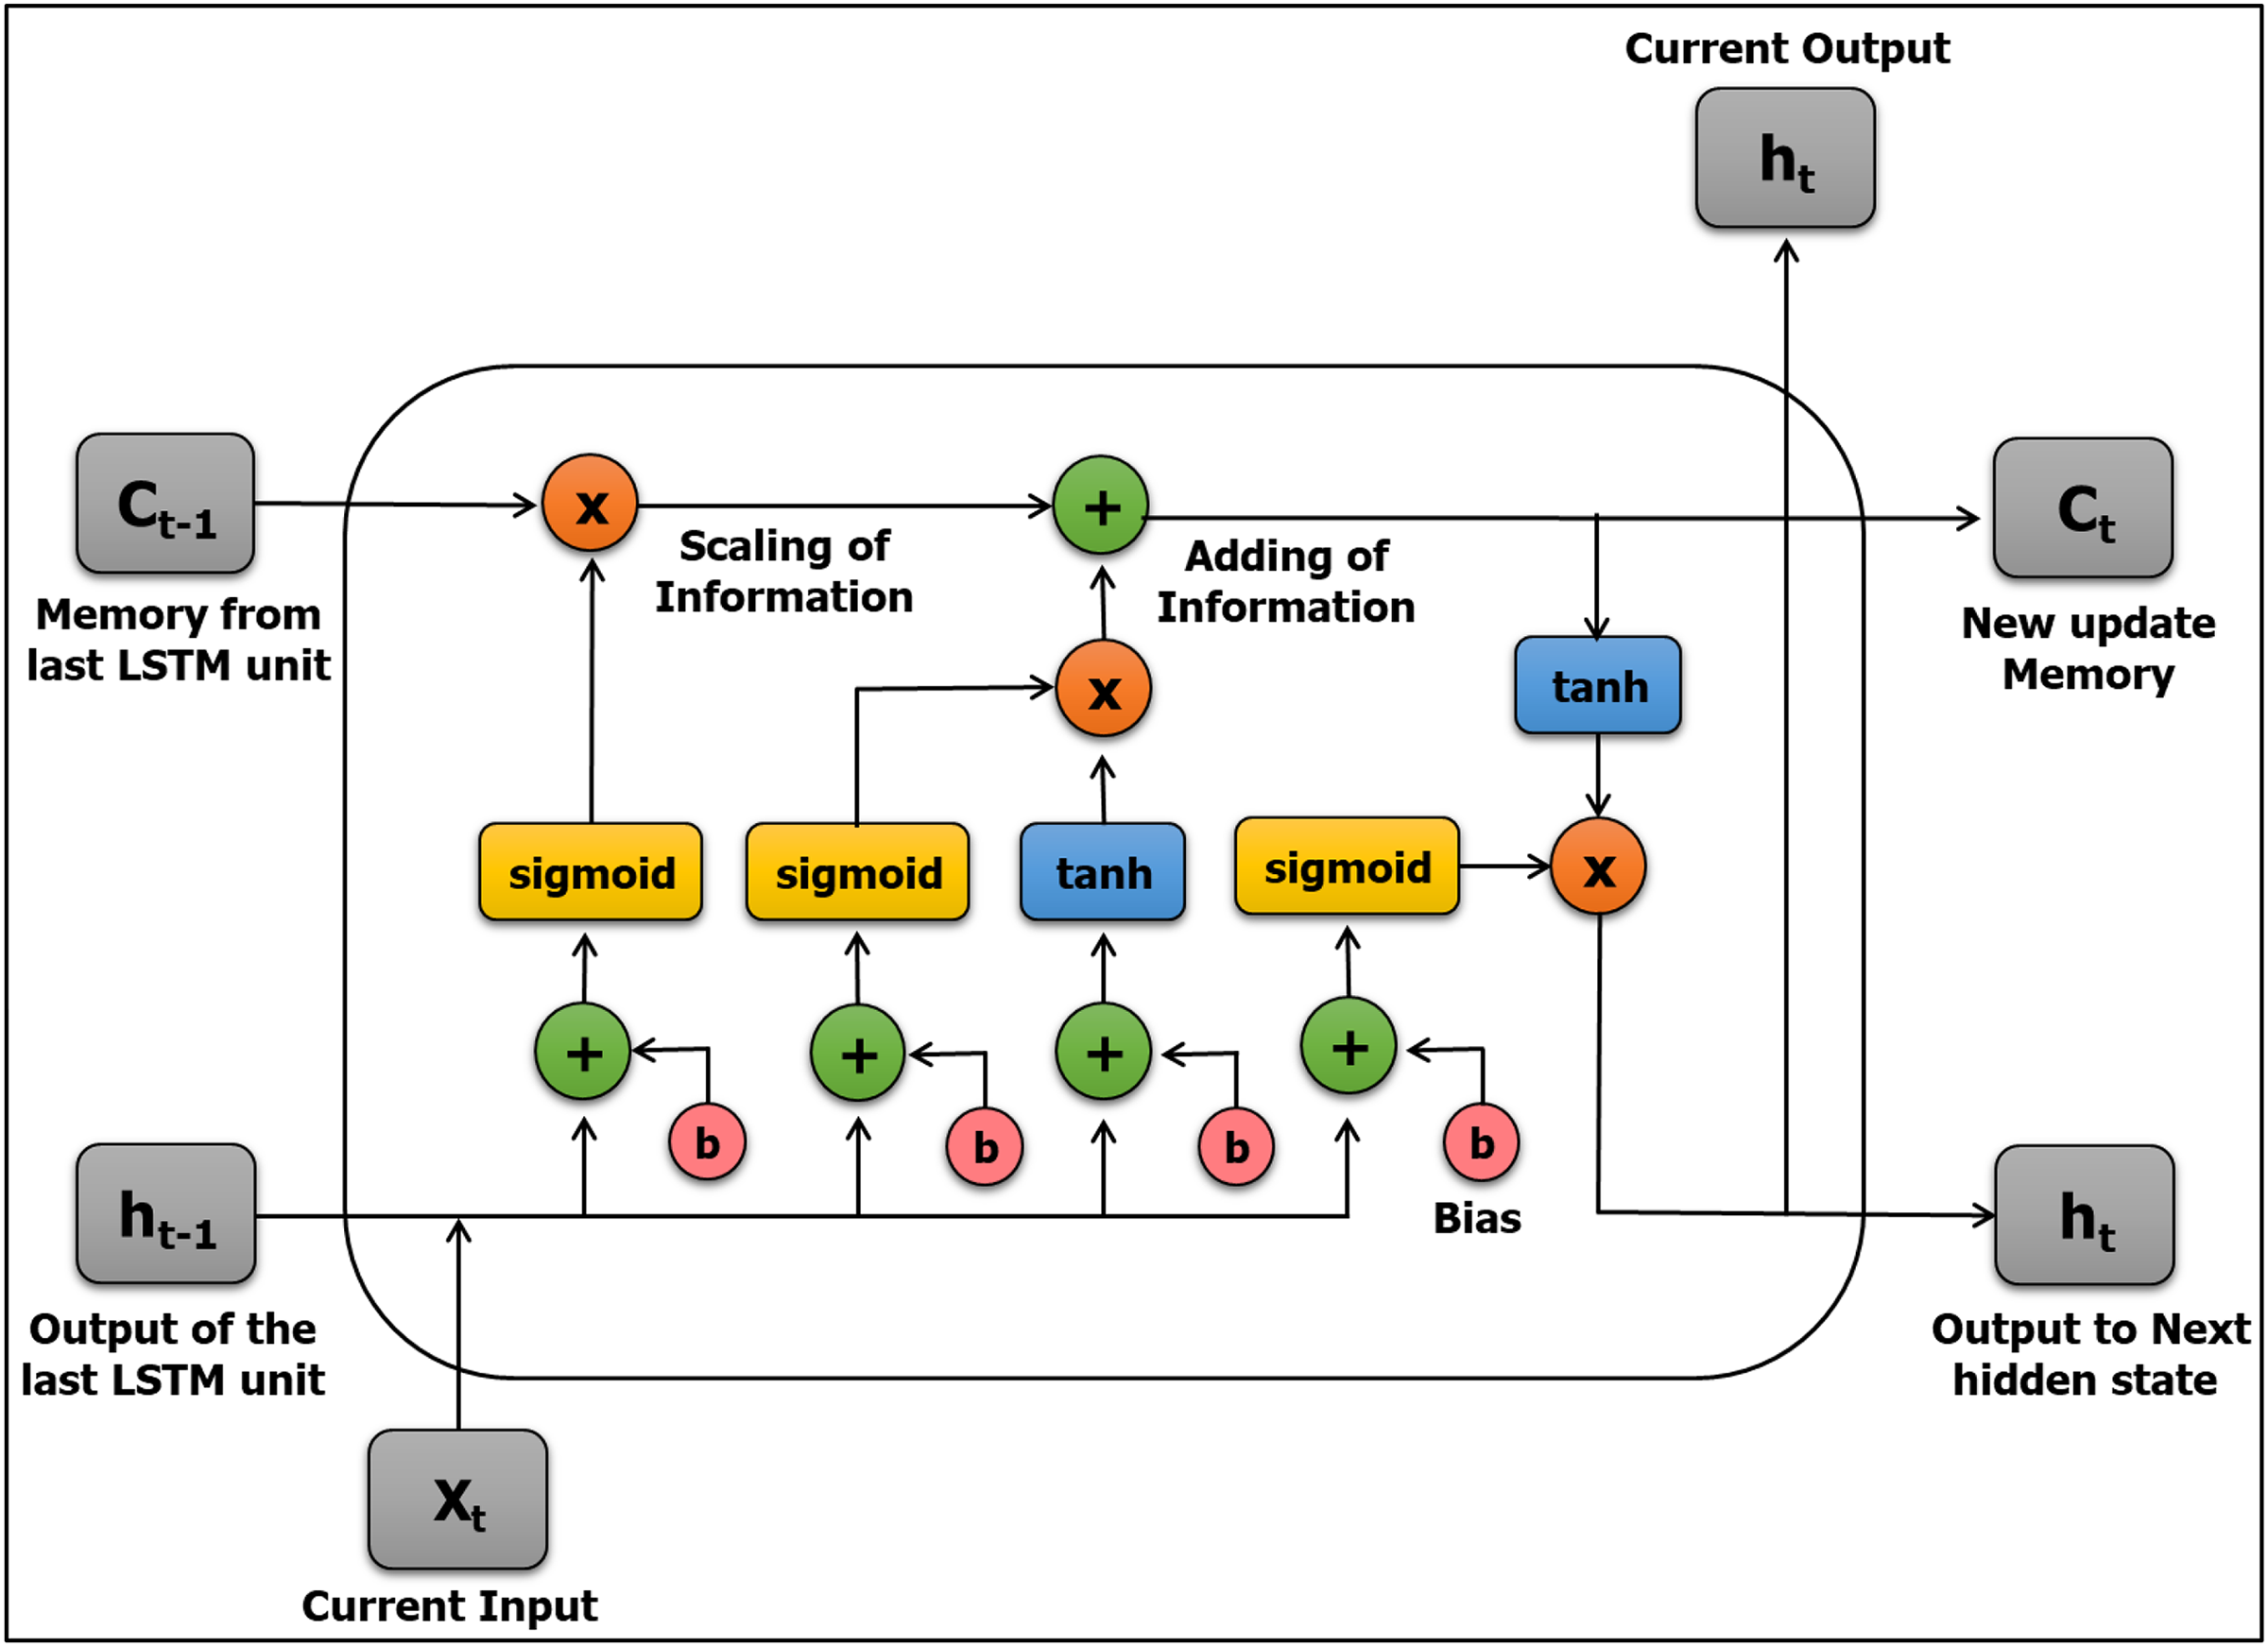
The LSTM is a widely used RNN network architecture developed by Hochreiter & Schmidhuber (1997). The LSTM is considered to be a well-developed and improved version of RNNs. The LSTM evolved to eliminate the gradient problem and to remedy drawbacks and problems of the standard RNN network architecture by adding additional developments per cell (module) (Hochreiter, 1998; Cho et al., 2014). The LSTM has two powerful features that make it a distinctive model: learning long-term dependencies and recalling and remembering information for lengthy periods in its default mode (Schäfer, Udluft & Zimmermann, 2006). Figure 9 explains the structure of the LSTM neural network.

Figure 9: The structure of the LSTM neural network.
The model is structured in the form of a chain and includes four layers with a unique procedure of communication comprised of blocks of memory called “cells.” The cell state and the hidden state are transferred to the next cell. The state of a cell determines the main sequence of data flow, allowing the data to stream forward basically without modification. Sigmoid gates are worked to add or remove data from the cell state. A gate is analogous to a series of matrix operations or a layer and includes various individual weights. LSTMs employ the gates to dominate the memorizing process to avoid the long-term dependency problem. In the construction of an LSTM network, the first step is to identify information that is undesired and will be deleted from the cell in that step. This process of inclusion and exclusion of data is determined via the sigmoid function, which takes the outputs of the last LSTM unit (ht − 1) at time t − 1, as well as the present input (Xt) at time t. Furthermore, the sigmoid function has another role: it eliminates any part from the old output that should be omitted through the forget gate (ft); where “ft” is a vector corresponding to each number in the cell state (Ct − 1) and has values of 0 to 1.
The next step aims to update information that is obtained from the new input (Xt) in the cell state after it has passed two layers for decoding and storing the information that will be updated. The first layer is the sigmoid function, which decides whether the novel information should be ignored or updated (0 or 1). The second layer is the Hyperbolic Tangent (tanh) function, which grants weights (−1 to 1) to the values passed. The new cell state is then updated by multiplying the two values, and this new update (or memory) is then added to the old memory (Ct − 1), resulting in Ct.
(1)
(2)
(3) where Ct − 1 and Ct indicate the cell states; t – 1 and t indicate time; b and W indicate bias and weight matrices of the cell state, respectively; and the σ symbol refers to the sigmoid function.
In the last step, the values of the output (ht) will depend on the output cell state (Ot) after filtering the information. This processing occurs in two stages, First, the layer works with the sigmoid function to decide which parts of the cell state make it to the output. Second, the sigmoid gate (Ot) output is multiplied by novel values that range between −1 and 1, which were previously created via the “tanh” function from the cell state (Ct).
(4)
(5) where, bo and Wo refer to bias and weight matrices of the output gate, respectively. The proposed work focuses on sentiment analysis of pilgrims’ opinions using a novel hybrid model, namely CNN-LSTM. Figure 10 shows the architecture of our proposed model.
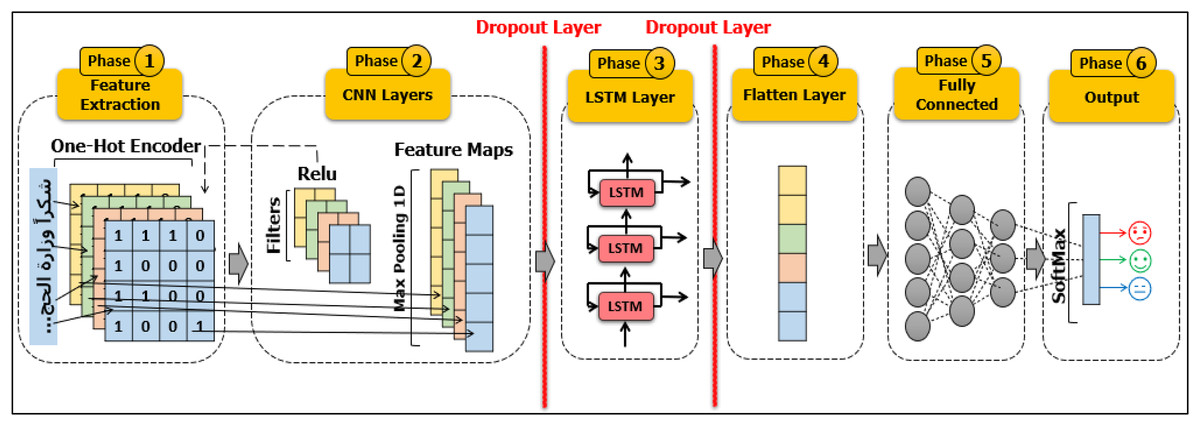
Figure 10: The architecture of our proposed model CNN-LSTM.
It has several layers, including the input layer, convolution layer, max pooling layer, flatten layer, dropout layer, fully connected layer, and output layer. After going through previous stages of feature extraction, outputs become the first inputs to the classification model. The input data passes via a convolution layer and is carried out on the input data using a filter to produce a feature map. The second layer is the max pooling layer, which determines the biggest value in each feature map per patch. To prevent overfitting, the dropout layer is performed. The fully connected layer is the operation that feeds forward neural networks; the results from the last pooling layer are flattened and data is fed into this layer. Lastly, the output of the model allocates the sentiments into three classes: positive, negative, or natural.
Evaluation and experimental results
This section of the article begins by presenting the training and testing datasets, experimental environment, parameter settings, and models for comparison. Subsequently, the experimental results and evaluation are given, including the Accuracy, Precision, Recall, and F1 scores on the testing data of our model and the other six comparison models.
Dataset
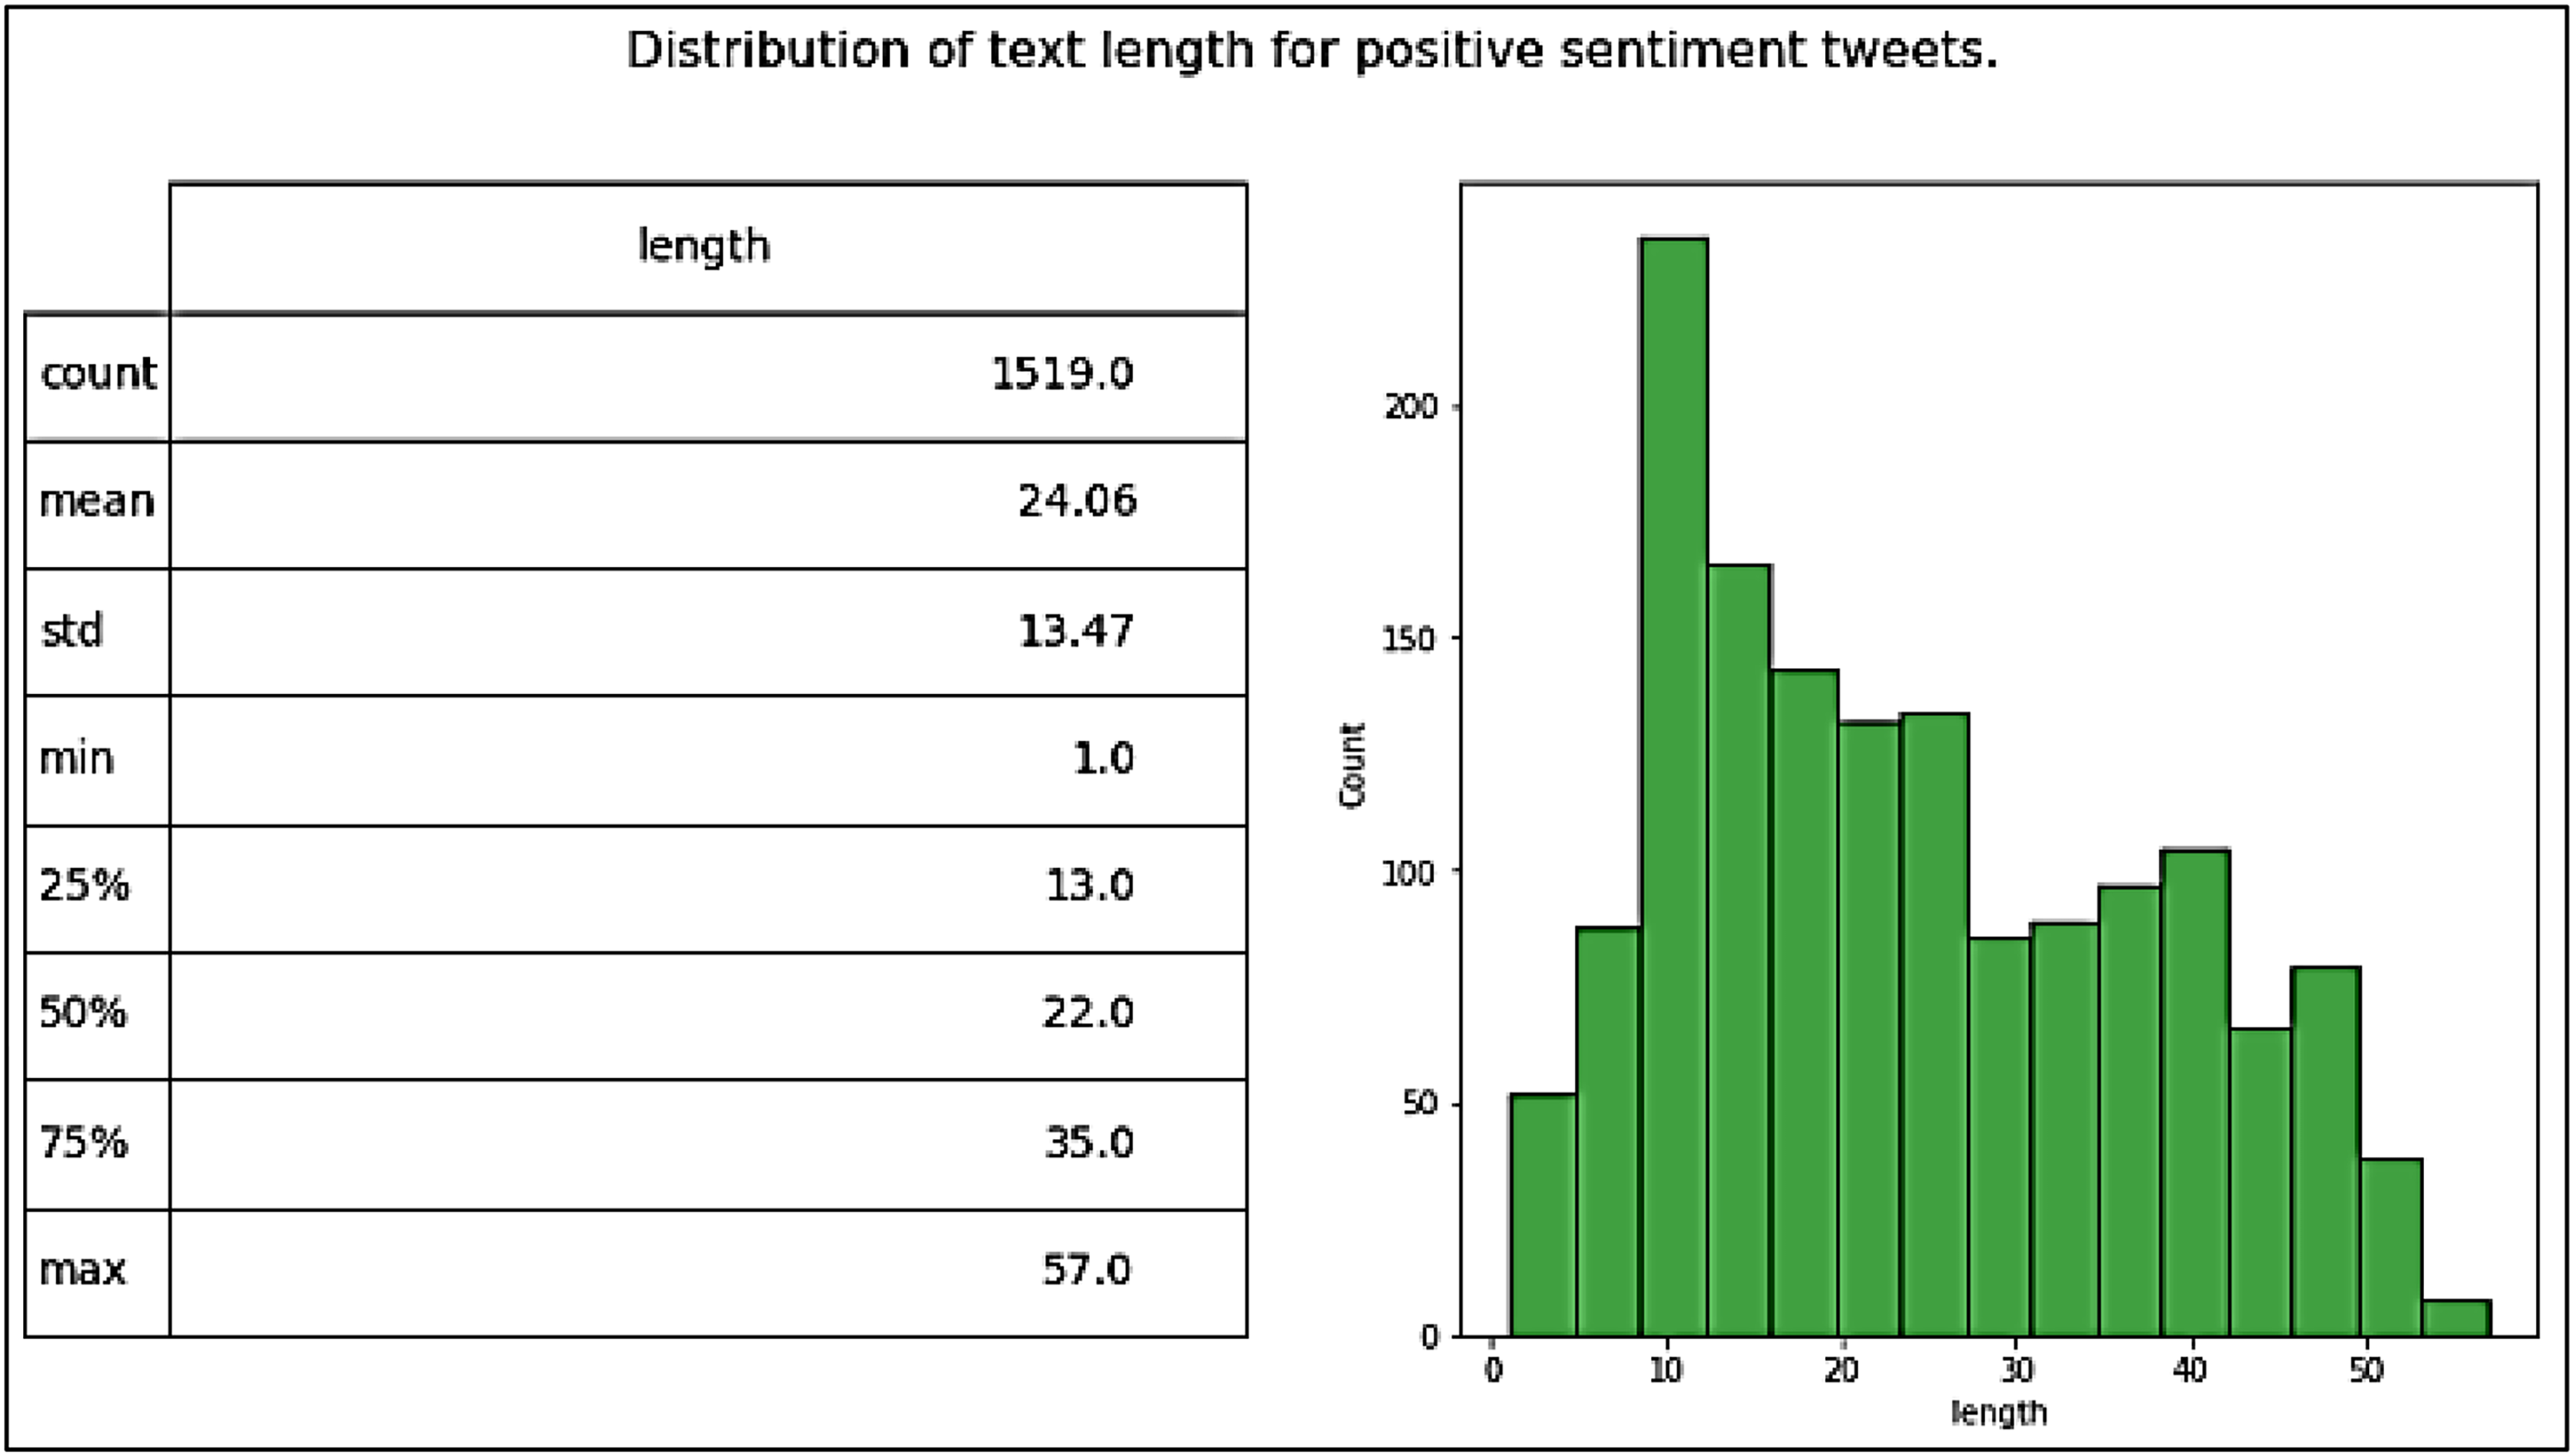
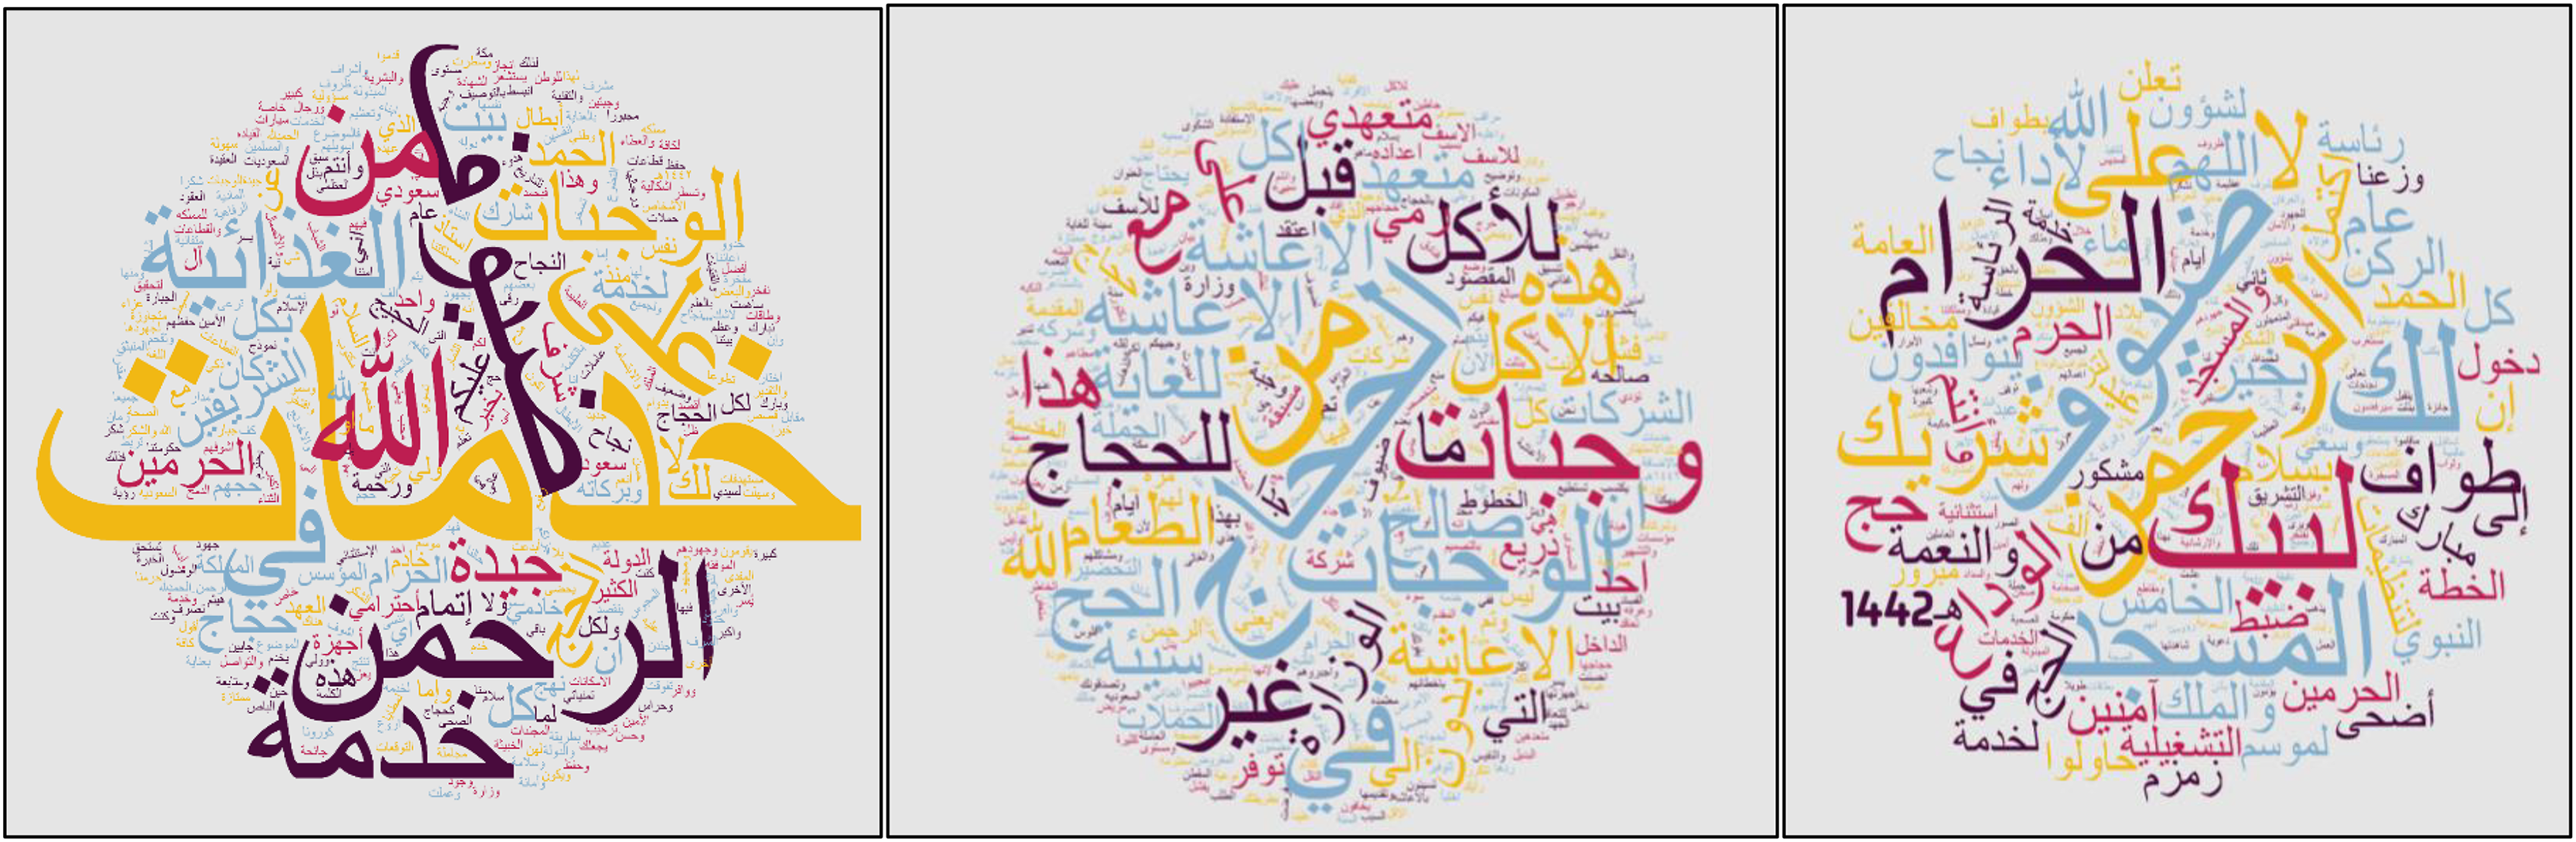
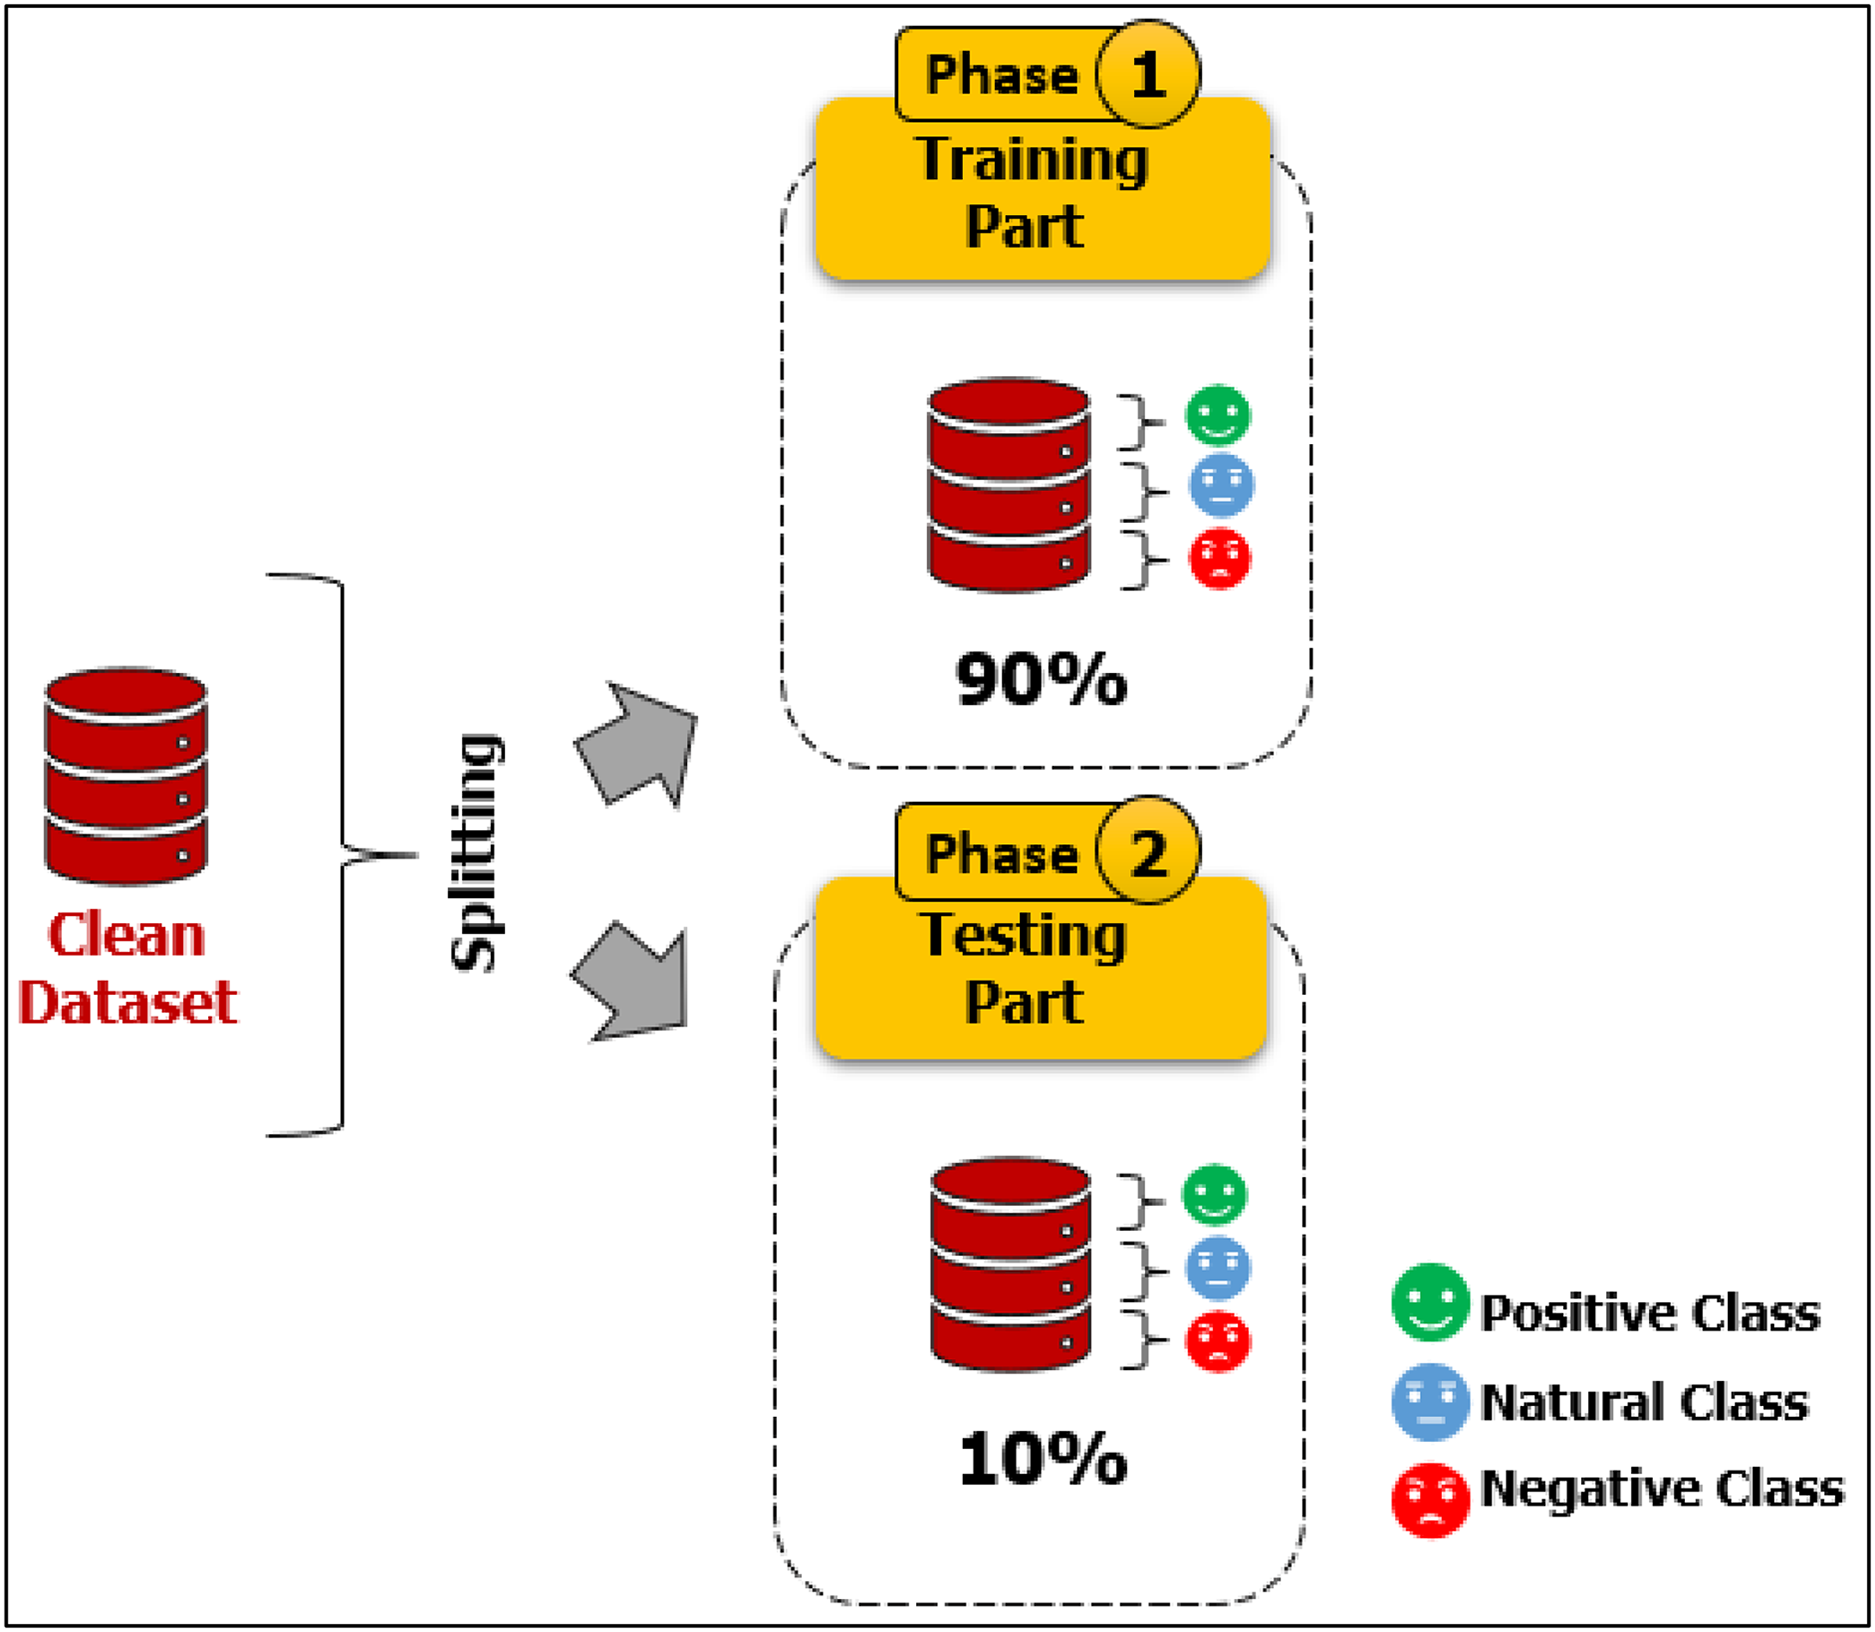
Our dataset, namely Catering-Hajj, was used to evaluate the performance of all classification models. After all processing stages on the data were completed, the Catering-Hajj dataset contained 4,669 tweets: 1,519 were Positive labels (as shown in Fig. 11), 962 were Negative labels (as shown in Fig. 12), and 2,188 were Natural labels (as shown in Fig. 13). The word cloud was applied to datasets to aid the precise analysis process for words. Word cloud demonstrates how issues can be easily identified through observations of the most frequently mentioned terms of each class. The positive issues are shown in Fig. 14A, the negative issues are shown in Fig. 14B, and the natural issues are shown in Fig. 14C. The results presented in the word cloud signify the religious spirituality about the Hajj season, and provided services, especially food-related issues. In general, this representation illustrates how vividly the sentiment analysis approach depicts Hajj’s social, religious, and service-level situation. Moreover, the significant sentiment analysis approach validates its helps understand the overall perspective of an event during a particular time, in an efficient manner. The dataset was divided into two sections for training and testing. The “test size” of the dataset was 0.2, distributed as follows: 3,735 samples for model training and 934 samples for model testing. This is known as a Train Test Split validation process. It is a model validation procedure used to evaluate the accuracy of machine learning models, which allows us to simulate how a model would execute on new/unseen data. Based on the performance of a model on unseen data during the testing stage, it was clear to us whether the model is overfitting, underfitting, or well-generalized. The scikit-learn package was used to perform the validation process by train_test_split function. It shuffles the sample of dataset before splitting it. Then, the dataset is split into two parts; a training set and a testing set, which consists of random sampling for the training part of about 90%, and the remaining 10% for the testing part. Figure 15 shows dataset splitting for training and testing parts. However, considering that there is no constant optimal percentage to determine the splitting value. This depends on data size and tuning experimental configurations to arrive at the appropriate percentage.
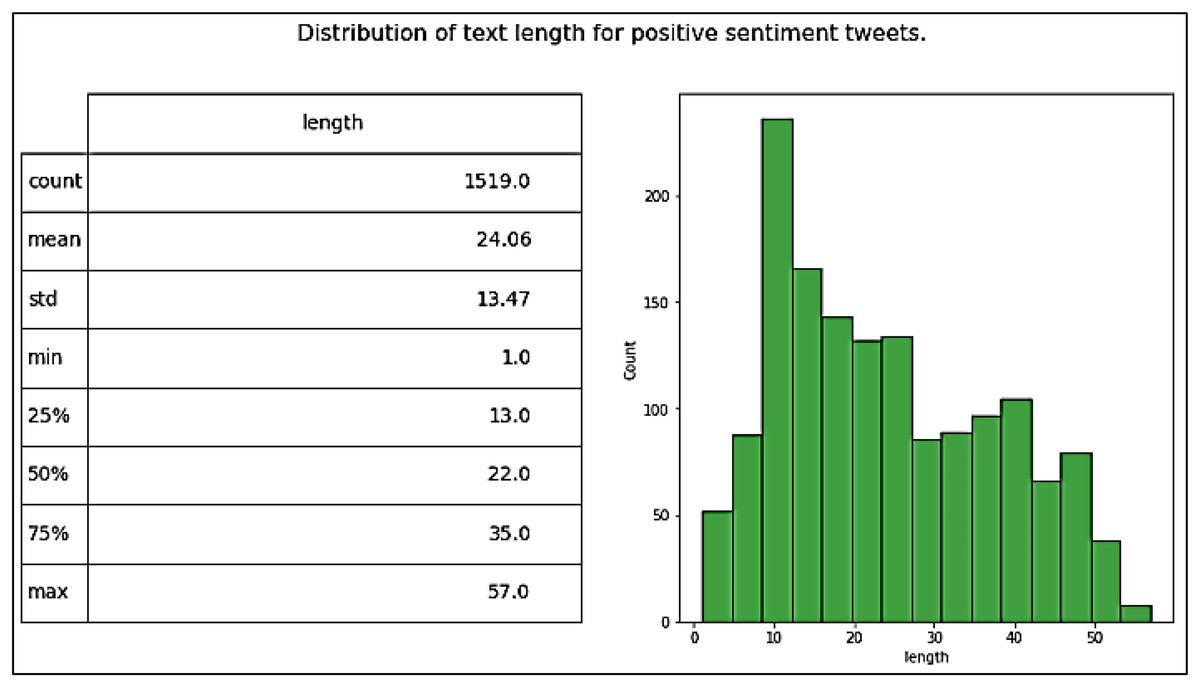
Figure 11: Distribution of tweet length for positive tweets.
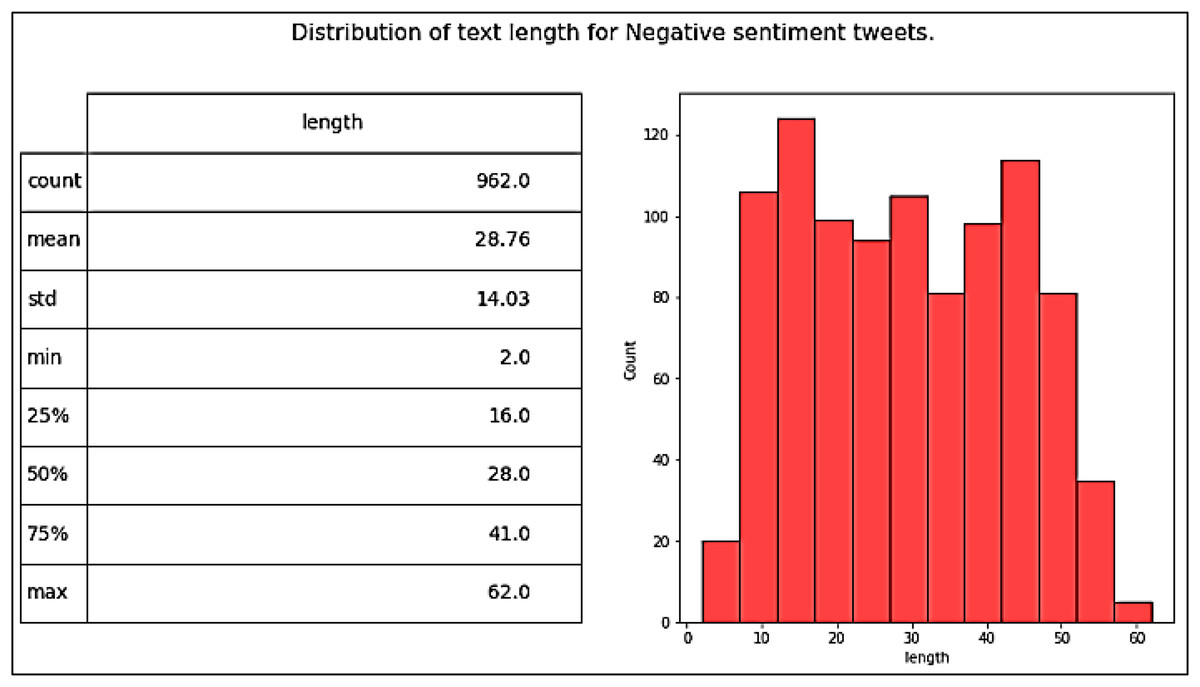
Figure 12: Distribution of tweet length for negative tweets.
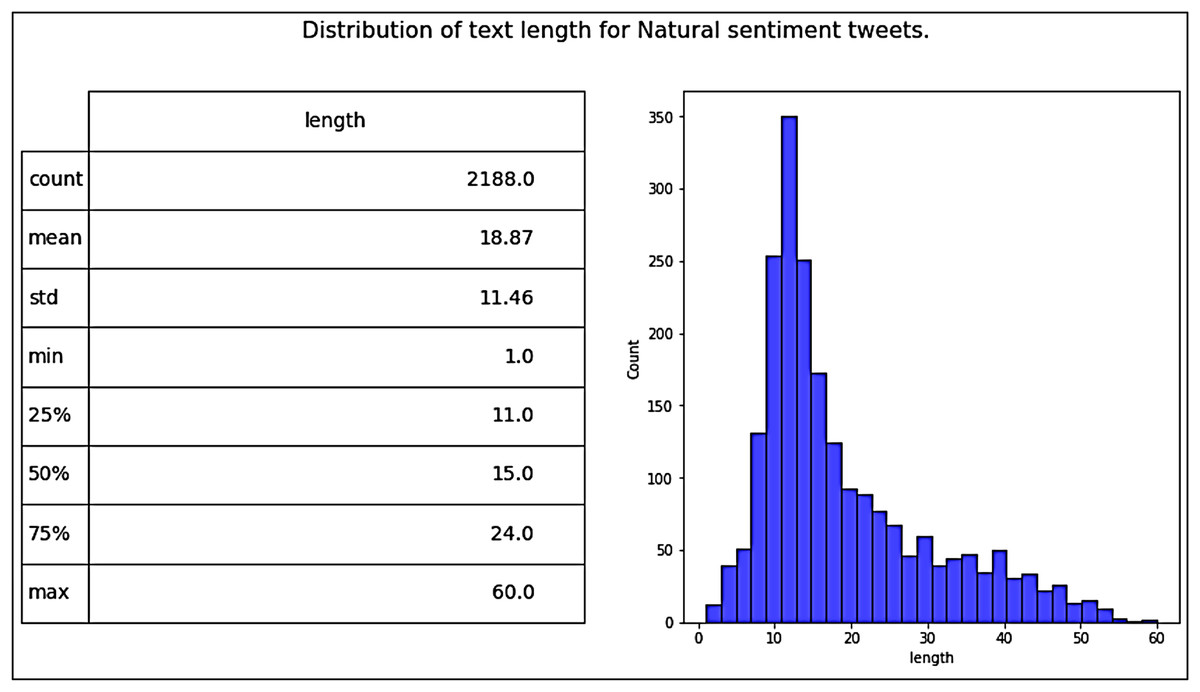
Figure 13: Distribution of tweet length for natural tweets.

Figure 14: (A) The word cloud of positive tweets, (B) the word cloud of negative tweets, (C) the word cloud of natural tweets.
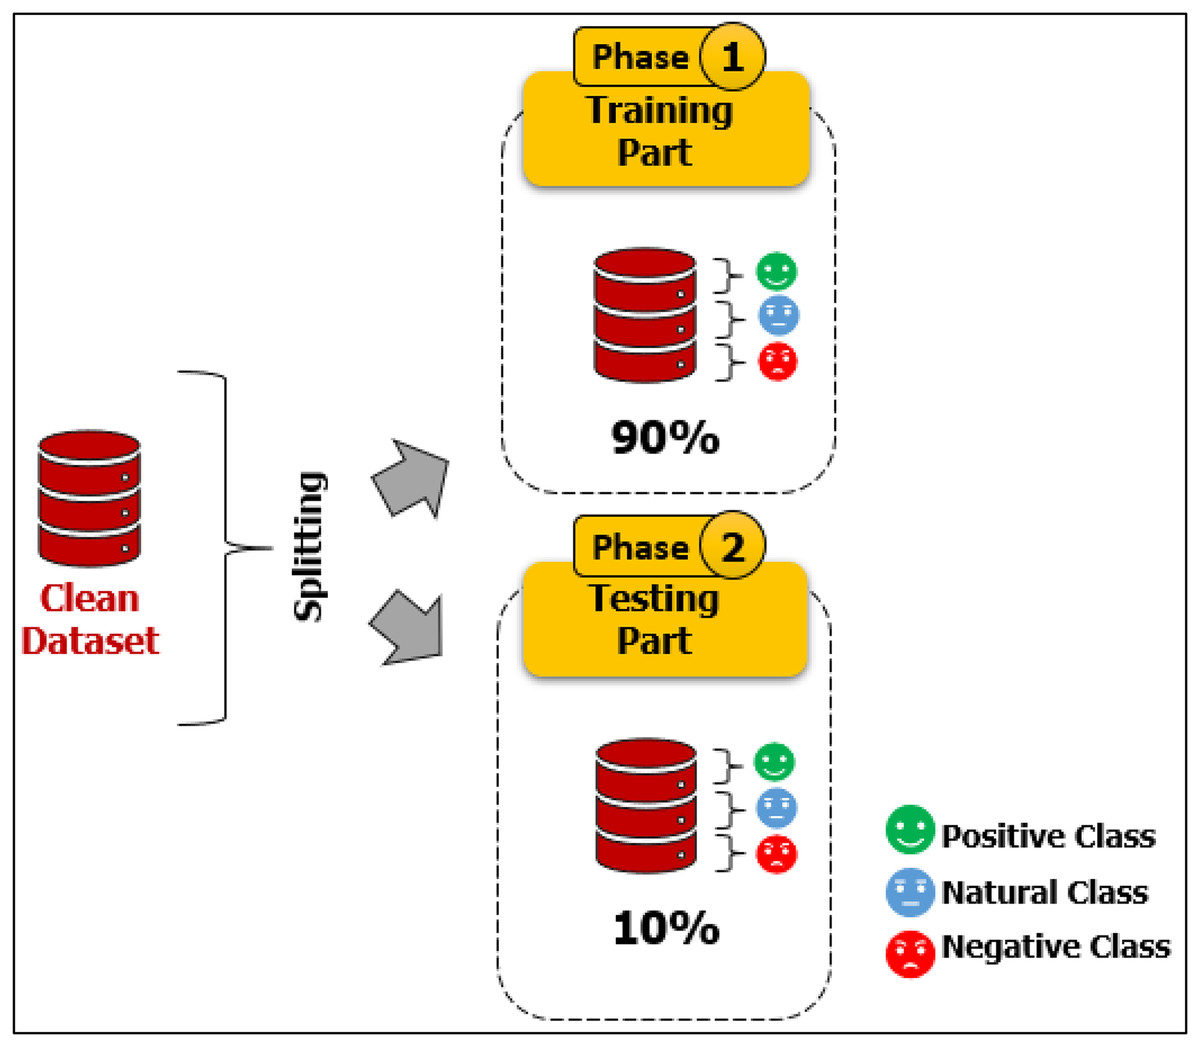
Figure 15: Dataset splitting for training and testing parts.
Metrics
To evaluate the results, several common performance metrics are calculated from the confusion matrix, including Accuracy, Precision, Recall, and F1 score. Their meanings are described below:
Accuracy measure: the total assessment of the number of positive and negative samples of the category labels accurately predicted for each category. The calculation of the Accuracy equation is:
(6)
Recall measure (R): Also known as Sensitivity or True Positive Rate (TPR), it is the average return of the correct labels, correctly classified for each category. The calculation of the Recall equation is:
(7)
Precision measure (P): also referred to as Positive Predictive Value (PPV), it is the total assessment of the category labels accurately predicted for each category. The calculation of the Precision equation is:
(8)
F1 score measure (F1): also called the F-measure, it combines recall and precision metrics, i.e., the harmonic average of recall and precision values. The calculation of the F1 score equation is:
(9)
The calculation of equations for these performances metrics is important and relies on the number of correct/incorrect samples of actual classes and predicted classes for the confusion matrix. The confusion matrix is also known as an error matrix. It is a table layout that allows description and visualization of the performance of machine learning and deep learning algorithms for the classification models. The confusion matrix is for a multi-class scenario (three classes in our study). The actual class is represented in each row of the matrix, whereas the predicted class is represented in each column, or vice versa, as is also apparent in the literature (Powers, 2020). Meanings of the terms True Positive (TP), True Negative (TN), False Positive (FP), and False Negative (FN) in the confusion matrix are described below:
TP: indicates the number of samples where the actual class label is correct and the predicted class label is positive.
TN: indicates the number of samples where the actual class label is correct and the predicted class label is negative.
FP: indicates the number of instances where the actual class label is incorrect and the predicted class label is positive.
FN: indicates the number of instances where the actual class label is incorrect and the predicted class label is negative.
Experimental environment
Table 5 summarizes the experimental environment, namely, the specifications of software and hardware. Several libraries of Python were utilized to build the proposed model for sentiment analysis of pilgrims during the Hajj season and the comparison models.
| Hardware/Software | Specification | Advantage |
|---|---|---|
| CPU | Intel® Core™ i7-8650U CPU 1.90GHz 2.11GHz | The processor performs better in benchmarks, games, and other applications. |
| GPU | NVidia K80 GPU | It has higher performance and speed-up compared to other latest CPUs; thus, it is best for running data analytics applications based on deep learning. |
| System memory | 64 GB | It refers to the maximum memory capacity supported by the processor. |
| Operating system | Windows10 | It has improved features and an easy-to-use package. |
| Development environment | Kaggle notebook | It is a cloud computational environment. |
| It can use GPU-integrated Kaggle notebooks. | ||
| It is a huge data science and artificial intelligence community. | ||
| Ease of importing and handling tools, packages, and datasets. | ||
| It supports dealing with two super program languages in deep learning (Python and R). | ||
| Programming language | Python3.5 | It is a high-level programming language. |
| Easy to read, write and learn. | ||
| It supports extensive libraries. | ||
| It is highly efficient. | ||
| It has super text-processing capabilities. | ||
| Machine learning engine | TensorFlow, os, sys, warnings | It supports for the CPU or GPU environment. |
| Deep learning framework | Keras, | It is one of the most ideal software frameworks. |
| It is a high-level neural network API. | ||
| Deep learning toolkits | Scikit-Learn | It is a superior tool for exploring, transforming, and classifying data. |
| It has simplicity and consistency, and user-friendly API. | ||
| Data preprocessing | Pandas, NumPy, NLTK, PyArabic, ArabicStopWords, re, string, Tashaphyne, regex, | They have a set of features like powerful data manipulation and analysis capabilities, efficiency, simplicity, flexibility, and usability. |
| Feature extraction | One-Hot Encoder. | It converts categorical value to numerical value. |
| Classification packages (CNN/LSTM) | TfidfVectorizer, CountVectorizer, train_test_split, KFold, pad_sequences, Sequential, Model, Input, Dense, Embedding, Conv1D, MaxPool1D, Dropout, SimpleRNN, LSTM, MaxPooling1D, BatchNormalization, Bidirectional, GlobalMaxPool1D, Flatten, sequence, optimizers.Adam, callback. | It supports processing high-dimensional data by neural convolution layers. |
| It is best the algorithms for improving performance in making predictions. | ||
| Comparison models (Supervised Machine Learning) | GridSearchCV, RandomForestClassifier, LogisticRegression, DecisionTreeClassifier, RandomForestClassifier | They are techniques of machine learning that use labeled datasets to train models for predicting specific values. |
| Evaluation (Confusion Matrix) | accuracy_score, confusion_matrix, classification_report, f1_score, Pipeline, SVC | It is a table that evaluates the performance of a classification model. |
| Visualization toolkits | Matplotlib, Seaborn | It supports various forms of data representation. |
| It provides high-quality graphs. | ||
| It is easy to use. | ||
| Saving toolkits | Pickle | It is easy to use. |
| It provides an Object-State Preservation |
Parameter settings
This section presents strategies used to tune parameter values utilized in the experimental configurations of each machine learning models and proposed model, with the results calculated accordingly.
Default parameter settings
Firstly, several primary experiments were performed for each machine learning model using the default values of the hyperparameters. The default values of the scikit learn package were used. Besides, the proposed model was experimented with using default values that shown in Table 6. Table 7 contains a tabular representation of the results of each model. The primary results show that the proposed model outperformed the other models by 84%. Whereas Support Vector Machine and Random Forest yielded slightly higher accuracy than Logistic Regression and Decision Tree when default tuning for our dataset.
| Parameters | Default values | Optimized value |
|---|---|---|
| Epochs | 5, 6, 10, 20, and 30 | 3 |
| Batch size | 5 | 5 |
| Kernel size | 3 and 4 | 3 |
| Activation function | Relu, Softmax, and tanh | Relu, Softmax, and tanh |
| Conv1D | 2 and 6 | 4 |
| LSTM | 1 | 1 |
| Recurrent dropout | 0.1 | 0.1 |
| Dropout | 0.5 | 0.2 |
| Pool size | 2 | 2 |
| Filters | 128 | 32 |
| Optimizer | Adam | Adam |
| Loss function | Categorical cross entropy | Categorical cross entropy |
| Feature extraction | One-hot encoding | One-hot encoding |
| Model | Label 0: Natural | Label 1: Negative | Label 2: Positive | Accuracy | ||||||
|---|---|---|---|---|---|---|---|---|---|---|
| P | R | F1- | P | R | F1- | P | R | F1- | ||
| Logistic regression | 0.78 | 0.80 | 0.79 | 0.87 | 0.88 | 0.87 | 0.77 | 0.73 | 0.74 | 0.79 |
| Decision tree | 0.70 | 0.71 | 0.70 | 0.76 | 0.74 | 0.74 | 0.68 | 0.68 | 0.68 | 0.71 |
| Support vector machine | 0.81 | 0.80 | 0.80 | 0.86 | 0.89 | 0.87 | 0.77 | 0.76 | 0.76 | 0.81 |
| Random forest | 0.82 | 0.81 | 0.81 | 0.81 | 0.90 | 0.85 | 0.80 | 0.76 | 0.77 | 0.81 |
| Proposed model | 0.81 | 0.78 | 0.79 | 0.85 | 0.87 | 0.86 | 0.86 | 0.88 | 0.87 | 0.84 |
Optimal parameter settings
Secondly, Many experiments were performed to obtain the optimal parameter values for the effectiveness of the proposed model (CNN–LSTM). Table 6 presents optimal parameter values used in our proposed model. Since the dataset is categorical values, it is difficult to the model operation. Hence, the initial process is the extraction of features by One-Hot Encoding. In order to convert categorical data to produce a numerical vector with a length equal to the number of classes in the dataset. The convolution layers (Conv) are 4, in the (Conv1) layer, the matrices’ size is first converted to 64 × 64. There are 32 convolutional filters with a size of 3 × 3 in each layer. In first pooling layer (Pool1), the textual data is converted to 64 × 64 × 32. The maximum pooling (Max Pooling function) is used, and window size with a size of 2 × 2. In the (Conv2, Conv3, and Conv4) layers, the textual data is converted to 32 × 32 × 32, and it contains the same parameter for a number of filters and its size. Also, layer of (Pool2, Pool3, and Pool4) performs the same previous role. The feature matrix to 64 × 64 is adjusted by the fully connected layer, and each step of the time holds one row as the input to the last layer, it is LSTM. The LSTM layer is 1 layer; its neuron number is set to 128. Lastly, the results of classification are obtained through SoftMax function. The optimization function is chosen Adam optimizer. It is selected for reducing the training loss. the Loss Function rate of this network is set to Categorical Cross Entropy. The result of hidden layers (Conv1–Conv4) and fully connected layer use ReLU activation function, which ReLU(x) = max(0,x). The batch size is 5. A dropout layer is added with a parameter of 0.2 to prevent overfitting. Overfitting is an undesirable deep-learning behavior that occurs when the model does well on the training data but does not perform precisely on the test data. The time complexity takes to execute each process of the proposed approach is illustrated in Table 8.
| Process | Time complexity (S) |
|---|---|
| Installing Arabic-Stopwords library | 17.756 s |
| Installing Transformers library | 13.999 s |
| Installing Tashaphyne library | 14.39 s |
| Installing PyArabic library | 13.963 s |
| Installing and preparing preprocessing/classification packages environment (nltk, re, regex, pandas, string, numpy, os, sys, warnings libraries, seaborn, matplotlib, sklearn, TfidfVectorizer, CountVectorizer, train_test_split, GridSearchCV, RandomForestClassifier, LogisticRegression, DecisionTreeClassifier, RandomForestClassifier, accuracy_score, confusion_matrix, classification_report, f1_score, Pipeline, SVC, pickle) | 1.784 s |
| Reading and converting into known format of dataset | 0.109 s |
| Definitions of preprocessing environment | 0.026 s |
| Removing Arabic stop words | 1.403 s |
| Removing non-Arabic | 0.077 s |
| Normalize Arabic | 0.808 s |
| Removing hashtags and mentions | 0.03 s |
| Removing URLs | 0.036 s |
| Removing punctuations | 0.172 s |
| Removing duplication | 0.021 s |
| Testing after finishing the preprocessing stage | 0.01 s |
| One-hot encoder | 0.012 s |
| Splitting dataset for train and test (train_test_split) | 0.057 s |
| Tokenizing | 8.825 s |
| Installing and preparing CNN/LSTM classification packages environment (tensorflow, keras, pad_sequences, Sequential, Model, Input, Dense, Embedding, Conv1D, MaxPool1D, Dropout, SimpleRNN, LSTM, MaxPooling1D, BatchNormalization, Bidirectional, GlobalMaxPool1D, Flatten, sequence, optimizers.Adam, callback) | 0.473 s |
| Constructing proposed model | 0.714 s |
| Training of proposed model | 676.959 s |
| Constructing of model evaluate (Testing) | 0.013 s |
| Testing of proposed model | 1.545 s |
| Save model (pickle) | 0.358 s |
Comparison models
To comparatively assess the proposed model performance against other deep learning and supervised classification methods, we examined six classifiers on our dataset utilizing the same training-test split in all cases. SVM (Boser, Guyon & Vapnik, 1992), LR (Cox & Snell, 2018), DT (Quinlan, 1986), and RF (Breiman, 1999) are methods of supervised machine learning, whereas CNN (Jaderberg et al., 2016) and LSTM (Werbos, 1988) are methods of deep learning. The Python libraries have been executed on the comparison models with the default configuration for each of them. Table 9 shows the models that were used for comparison alongside our proposed model.
| # | Classifier | Type |
|---|---|---|
| 1 | Support vectors machine | Machine learning |
| 2 | Logistic regression | Machine learning |
| 3 | Decision tree | Machine learning |
| 4 | Random forest | Machine learning |
| 5 | CNN | Deep learning |
| 6 | LSTM | Deep learning |
| 7 | Proposed model (CNN-LSTM) | Hybrid deep learning |
Deep learning models have an astonishing potential to predict ideal values that assist decision-making for stakeholders. One of the challenges that are facing computerized models is algorithmic bias (Norori et al., 2021). Most of these models need huge datasets to train and learn. If the training data is misrepresentative of the emotions, intelligent models are prone to reinforcing this bias, which can lead to incorrect predictions, fatal outcomes, and lack of generalization. To prevent potential bias problems, the authors are based on resolute procedures at the data cleaning (Data Annotation) and data preprocessing (Data Preprocessing) stage. The lack of diverse datasets is one of the main sources of bias, therefore, the authors used numerous keywords and hashtags to acquire the relevant tweets as shown in Table 3. Moreover, researchers can also impute irrational biases and unconscious judgments into their research by annotating the data incorrectly. To avoid these concerns, the authors identified strict criteria to classify the tweets into three classes as shown in Fig. 4, which they appointed one author for the annotating process and others for the reviewing process to validate data labeling. The Intelligent models may be biased by inaccurate data preprocessing or incomplete design for the model. If these concerns are not addressed before the training stage, DL models might fail to deliver precision prediction for data. For these reasons, data preprocessing is an important stage in sentiment analysis models. The noisy data was excluded such as URLs, punctuations, non-Arabic words, hashtags, usernames, and mentions, which will confuse the model during the training process. Furthermore, linguistic word’s origins were treated, which the removal of these words does not affect the meaning of the text, thus minimizing the time complexity because they take up space memory and consume a massive amount during running. Figure 6 shows these sequential stages.
Ablation study
The ablation experiments on our proposed model besides machine learning models others. Part of the preprocessing was removed, then the dataset was entered into the models with partially addressing. The preprocessing stage helps to dispose of unwanted data, making the classification of models more efficient, reducing misinformation productions, and improving reliability. Figure 16 shows that the performance of models decreases when they are partially addressed before the training stage. All experimental metrics have given an average improvement. However, our proposed model demonstrates relatively good effectiveness.
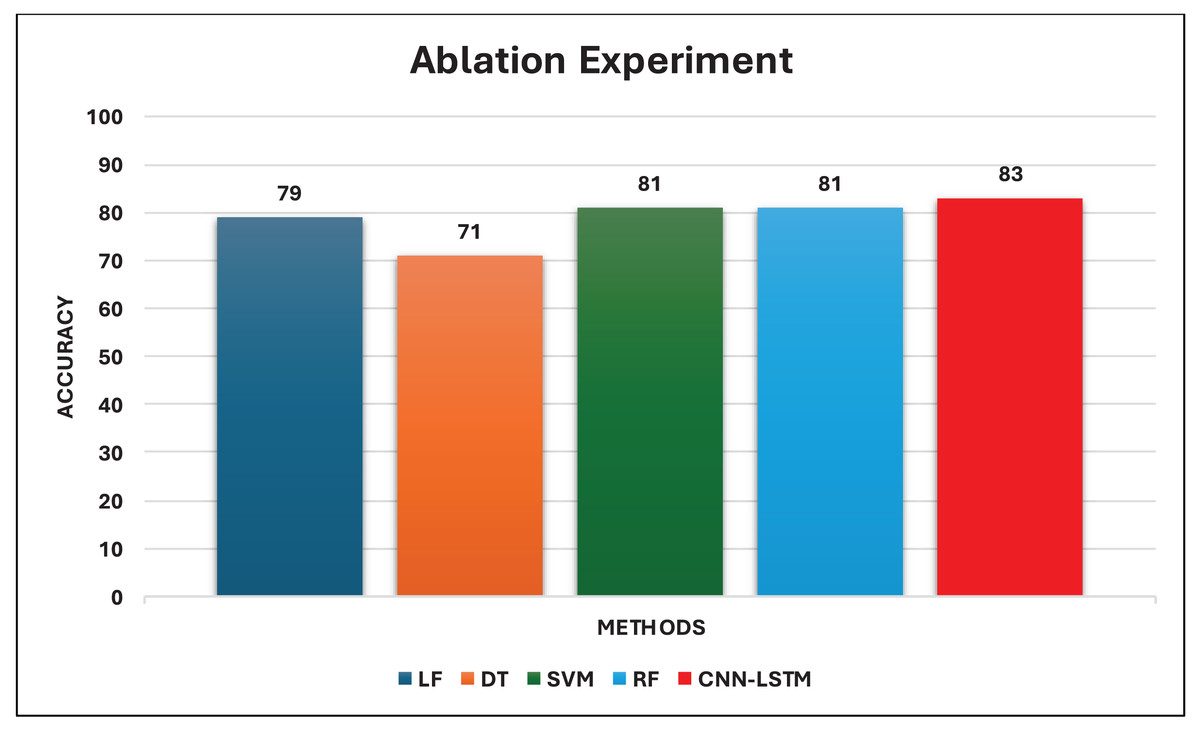
Figure 16: Experimental results of ablation study.
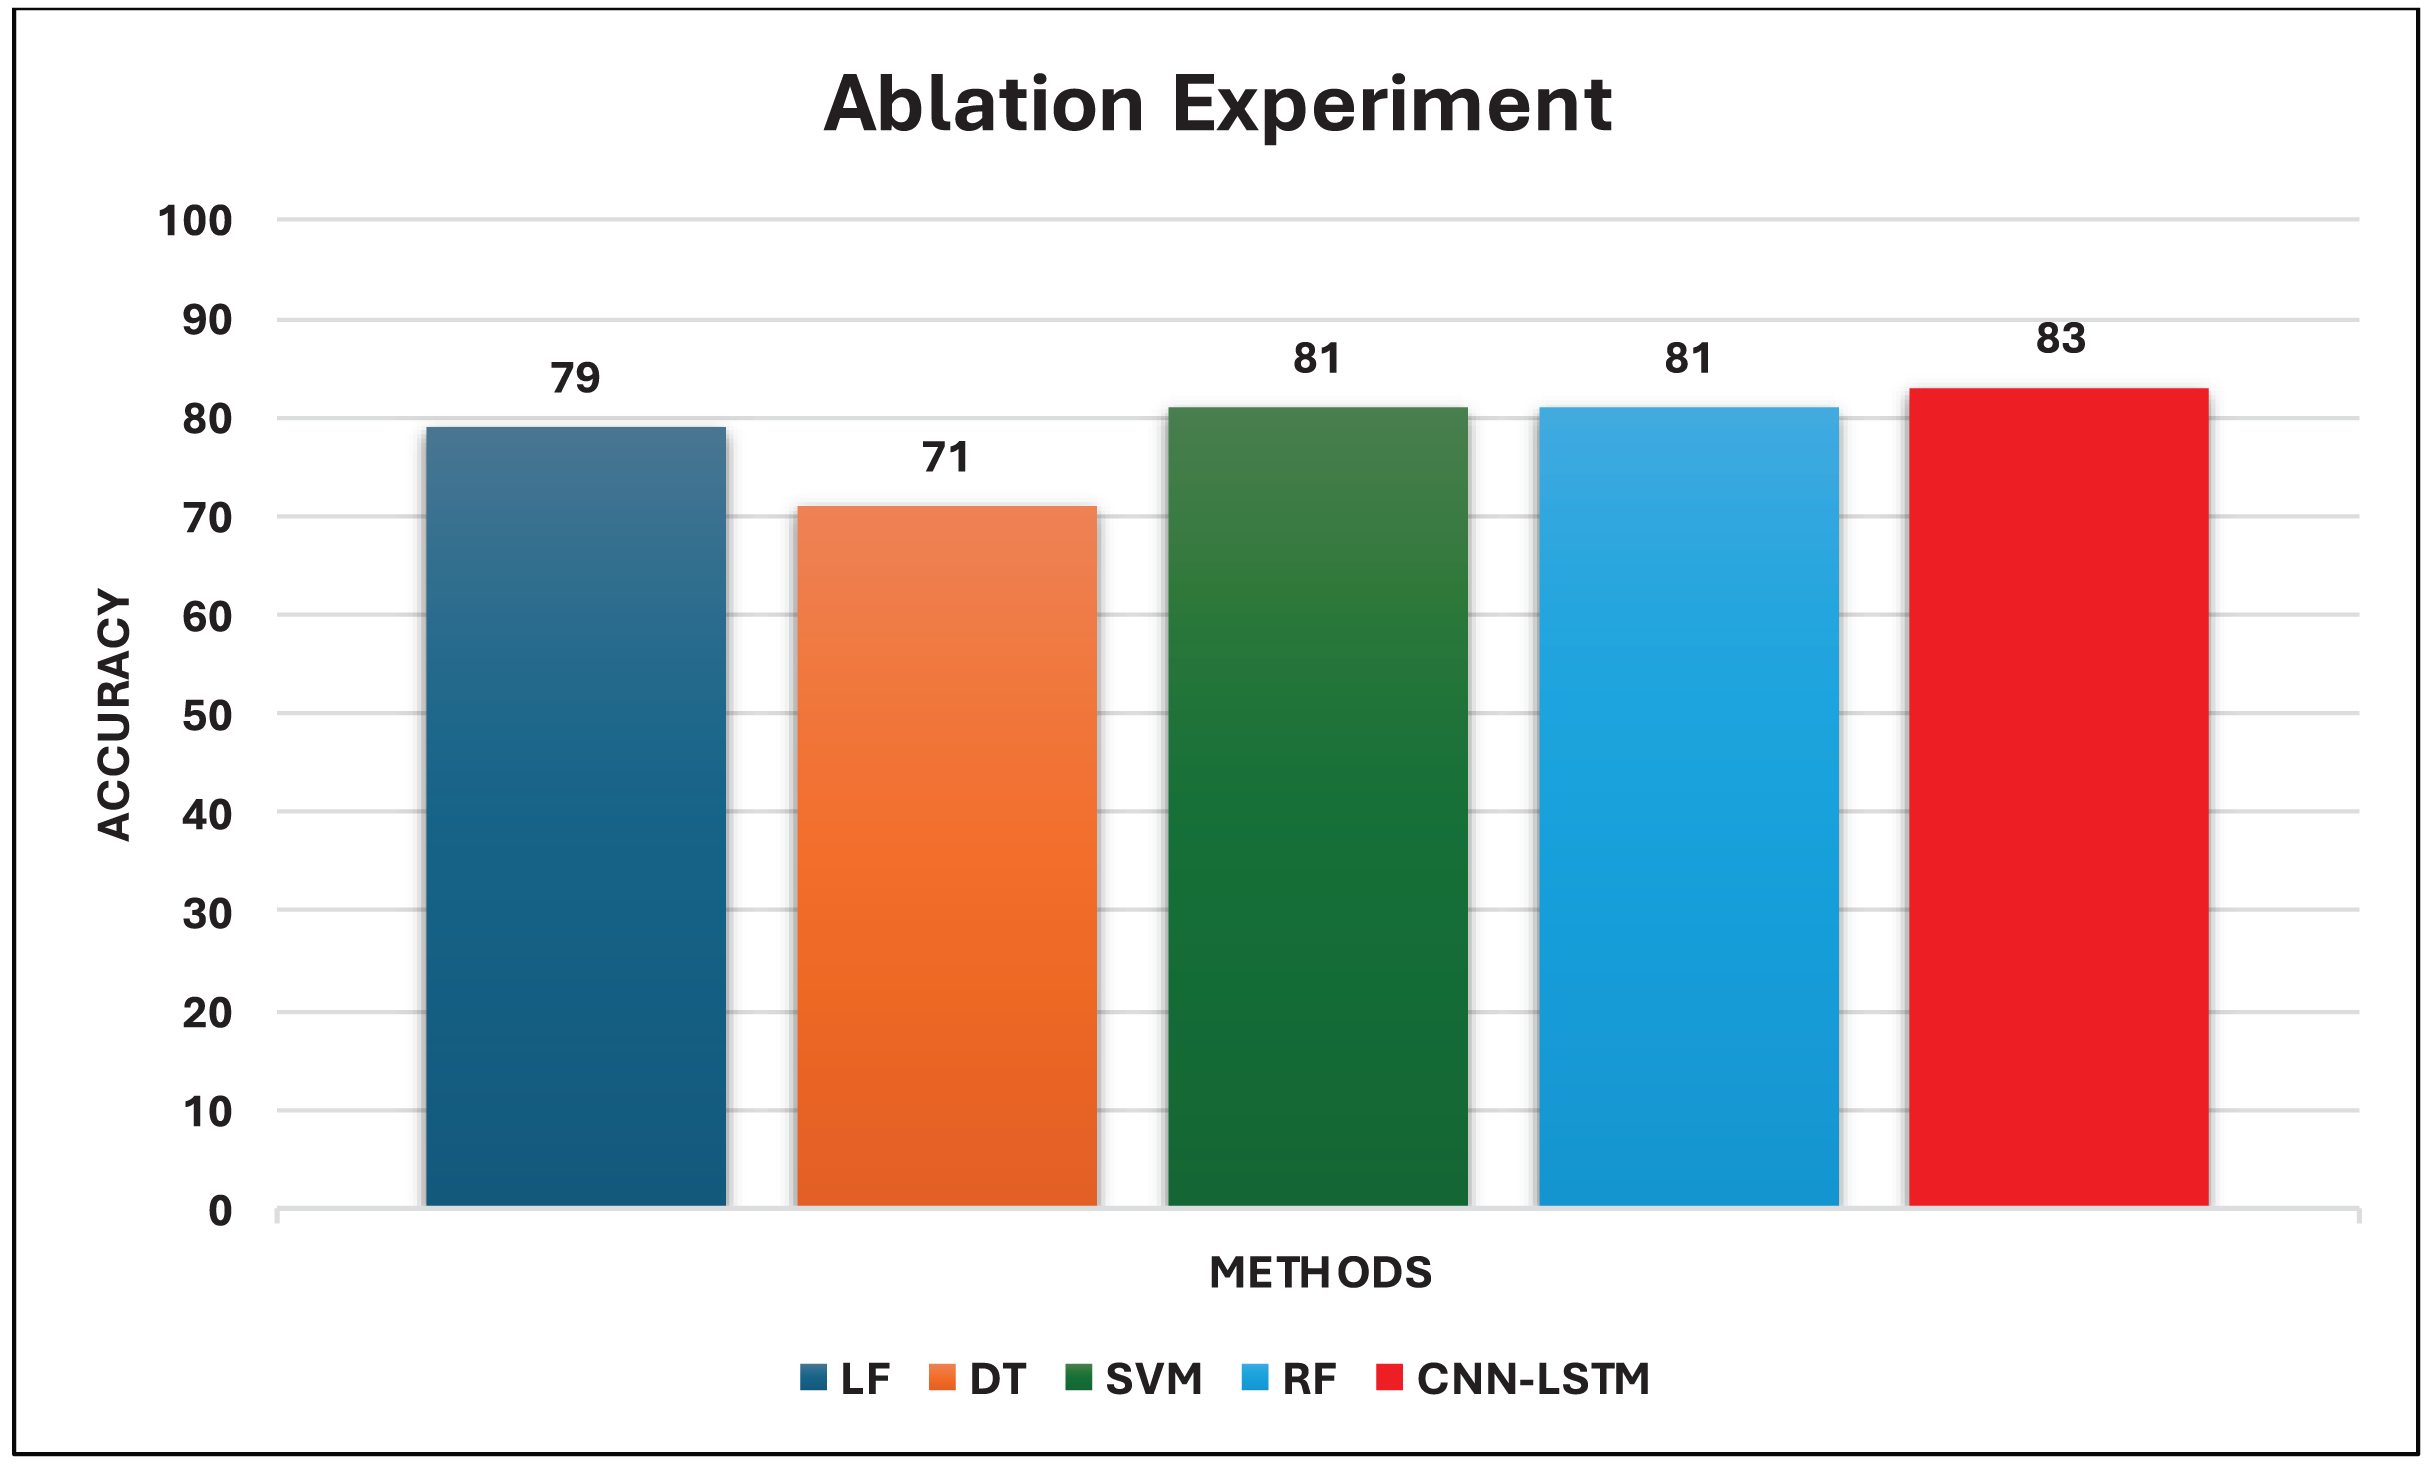
Evaluation and comparison of classification accuracy
All the models were tested on the Catering-Hajj dataset using the same data pre-processing algorithm as well as the same data set, divided into training and testing data. Figure 17 shows the precision measures, which indicate that the values of the overall methods are relatively stable and range from 70% to 85%. The sentiment classification effects of CNN regarding the Positive Class are poor compared with other methods. When CNN and LSTM are utilized for classification modeling, precision reaches about 93% with the Positive Class.
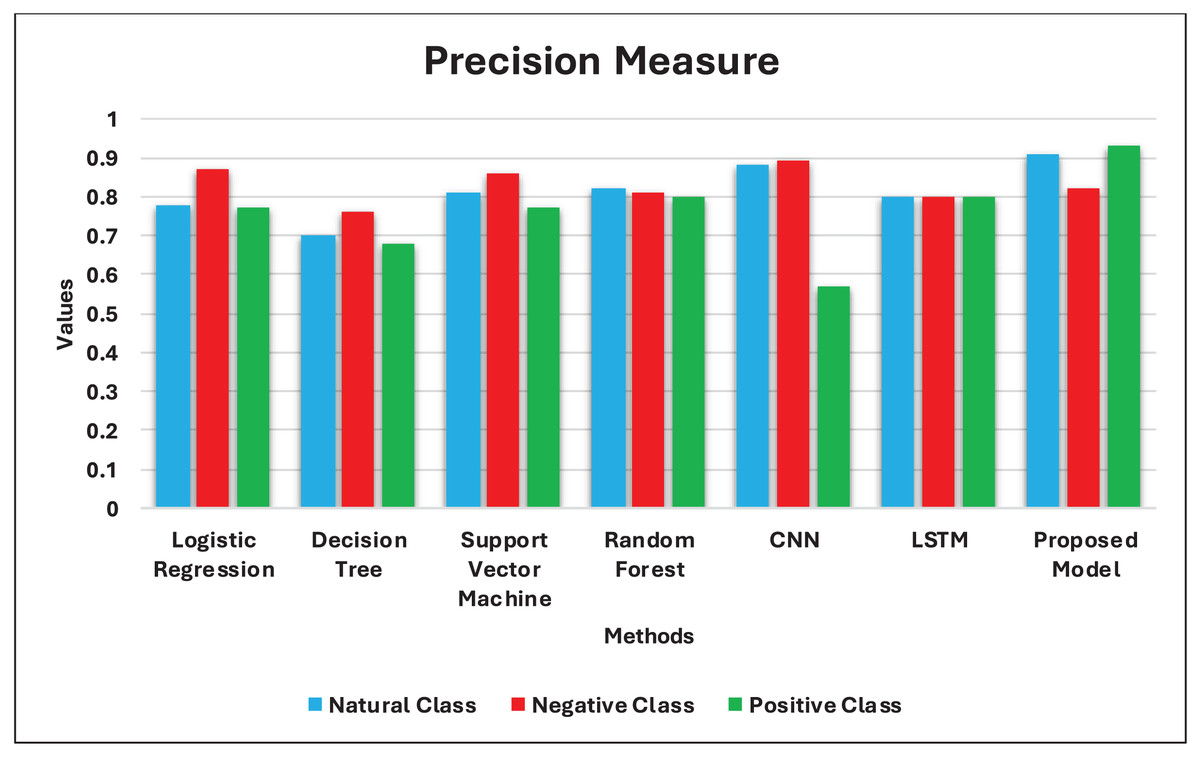
Figure 17: Experimental results of precision measures.
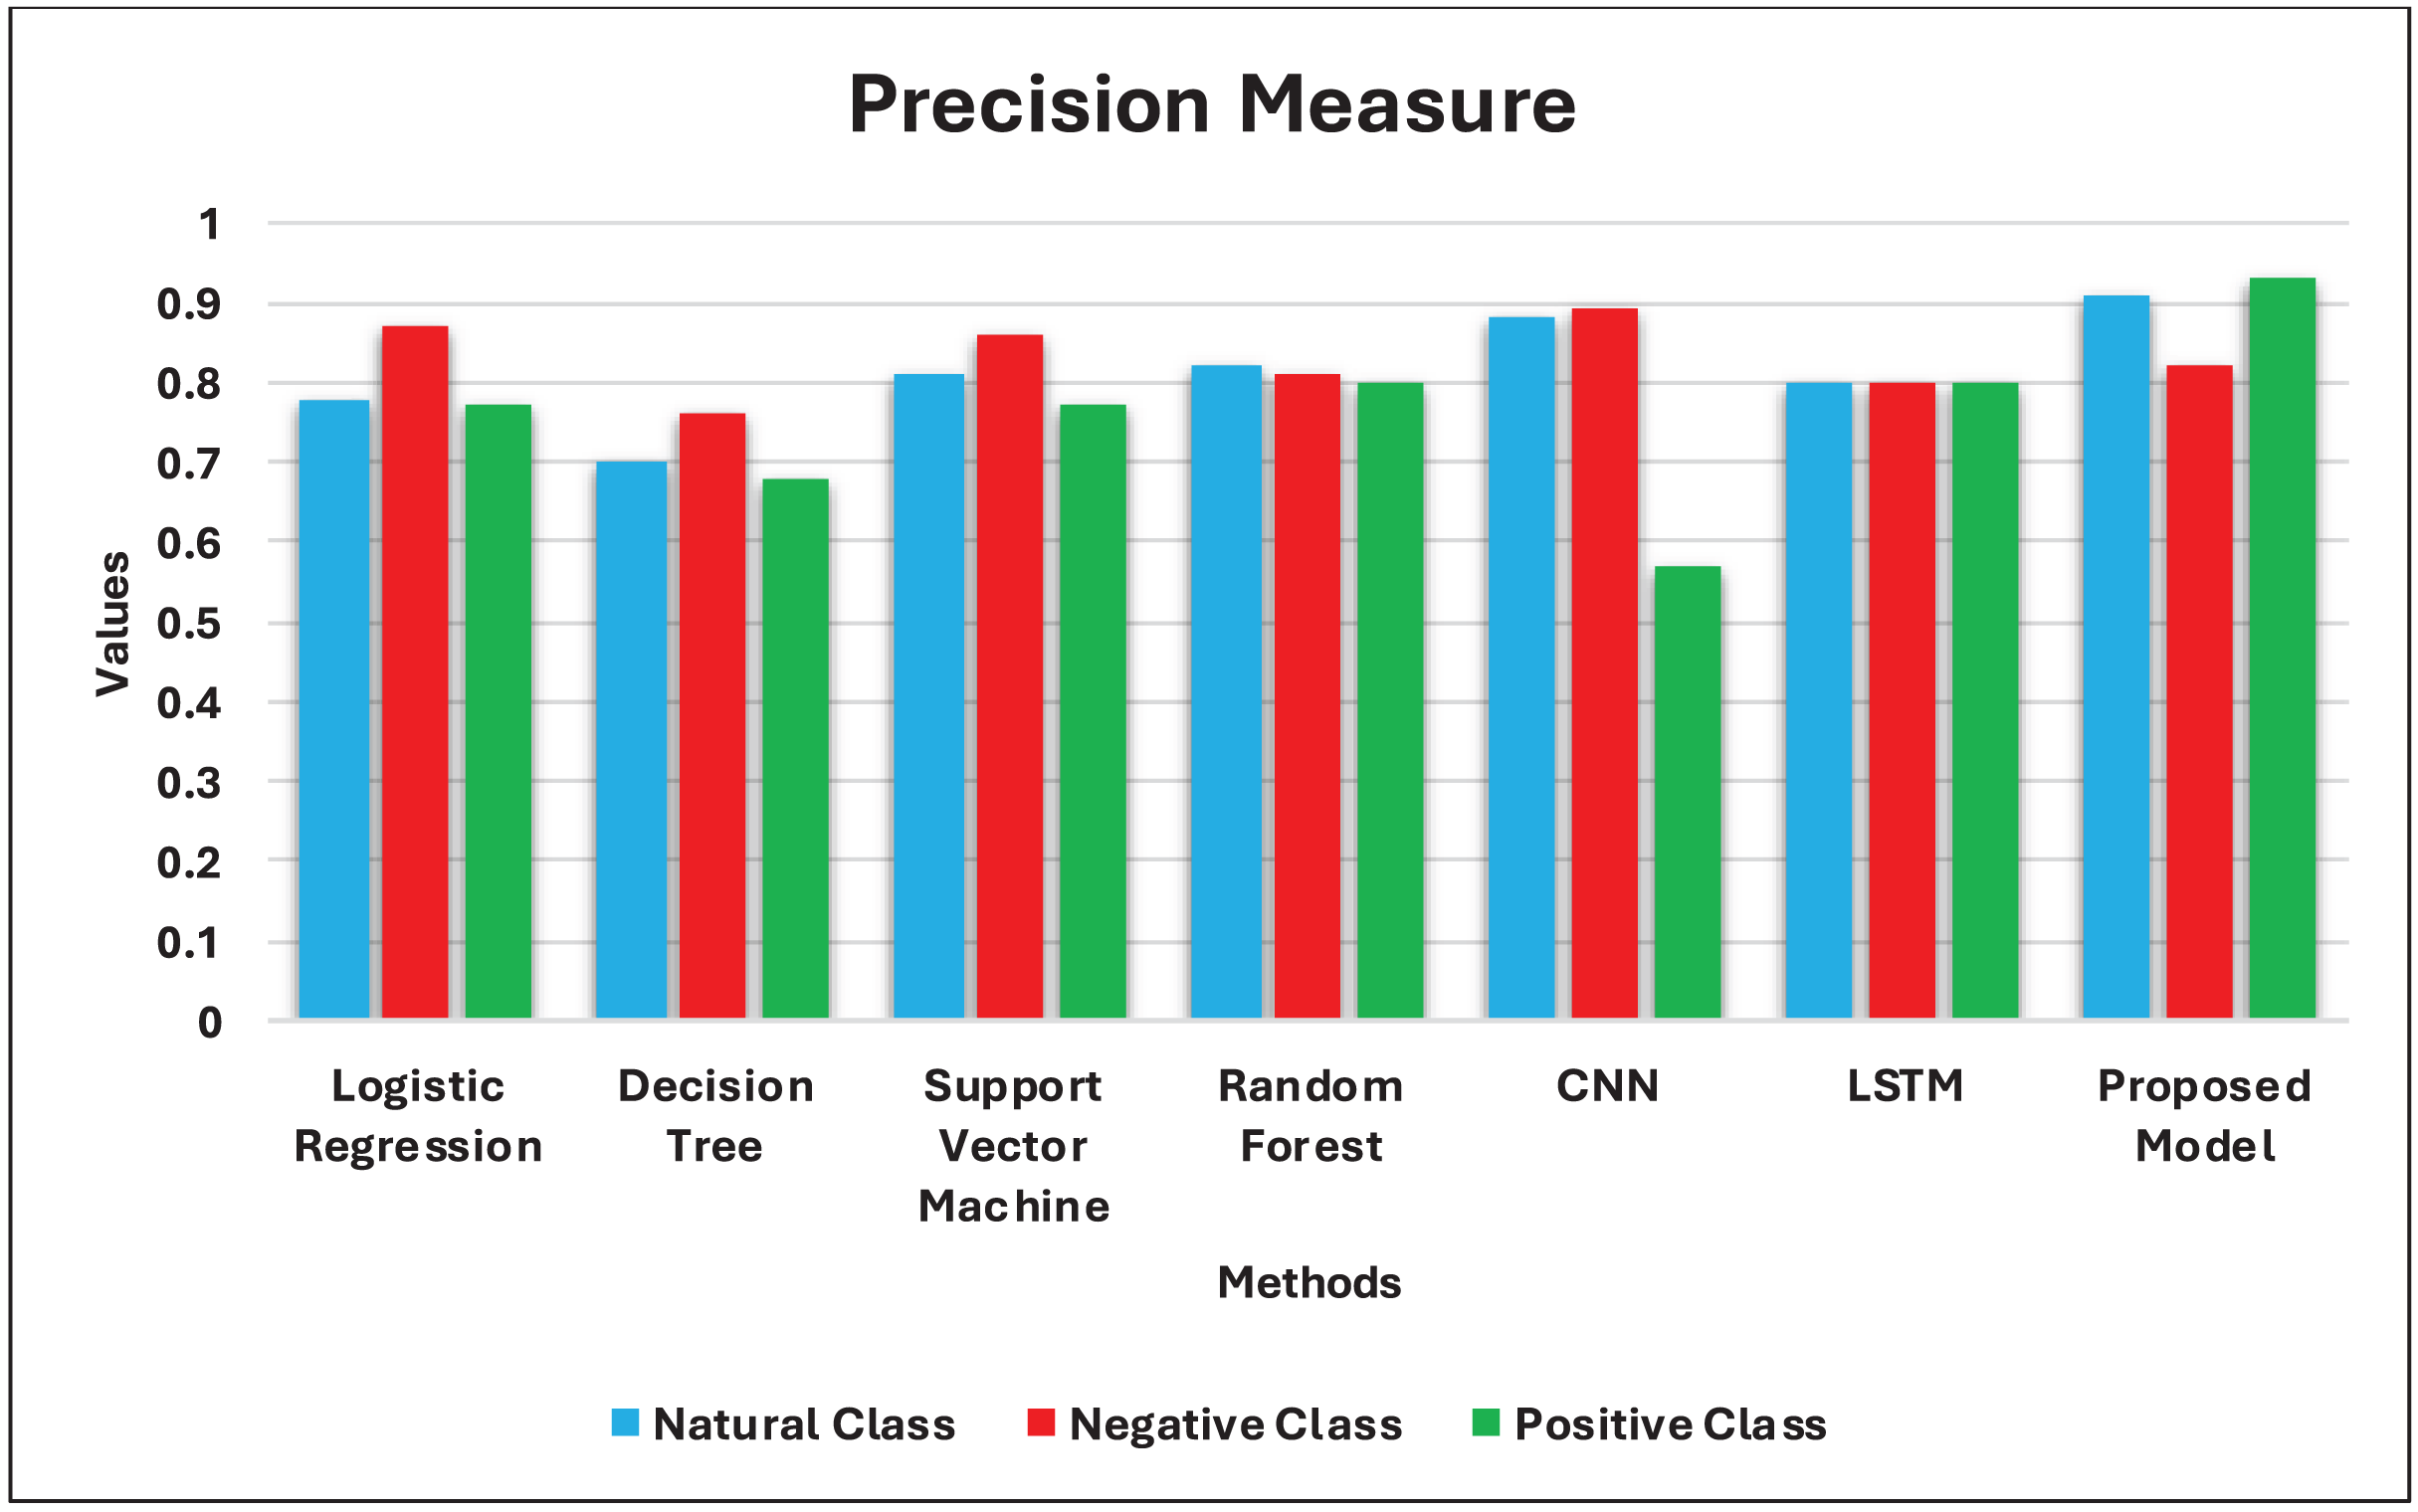
Figure 18 shows the recall measures in our study. It can be seen that the results of the overall methods vary. The proposed method reaches 0.95%, LR reaches 0.88%, DT reaches 0.74%, SVM reaches 0.89%, RF reaches 0.90%, CNN reaches 0.82%, and LSTM reaches 0.80% in the best cases among all three classes. The CNN achieves 0.65% with the Negative Class, which is lower than results using other comparison methods, because the CNN method is mainly utilized for image processing (Zhou et al., 2019); thus its performance is poorer when dealing with the sequence problem.
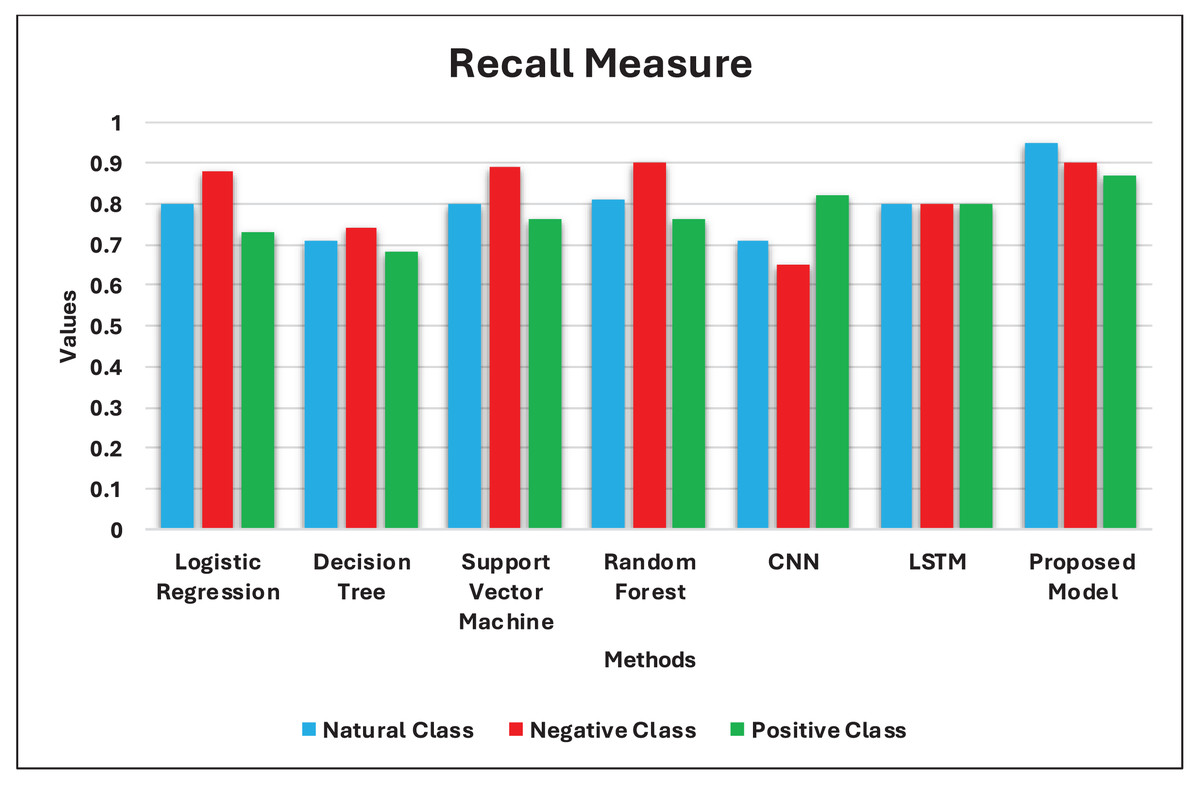
Figure 18: Experimental results of recall measures.
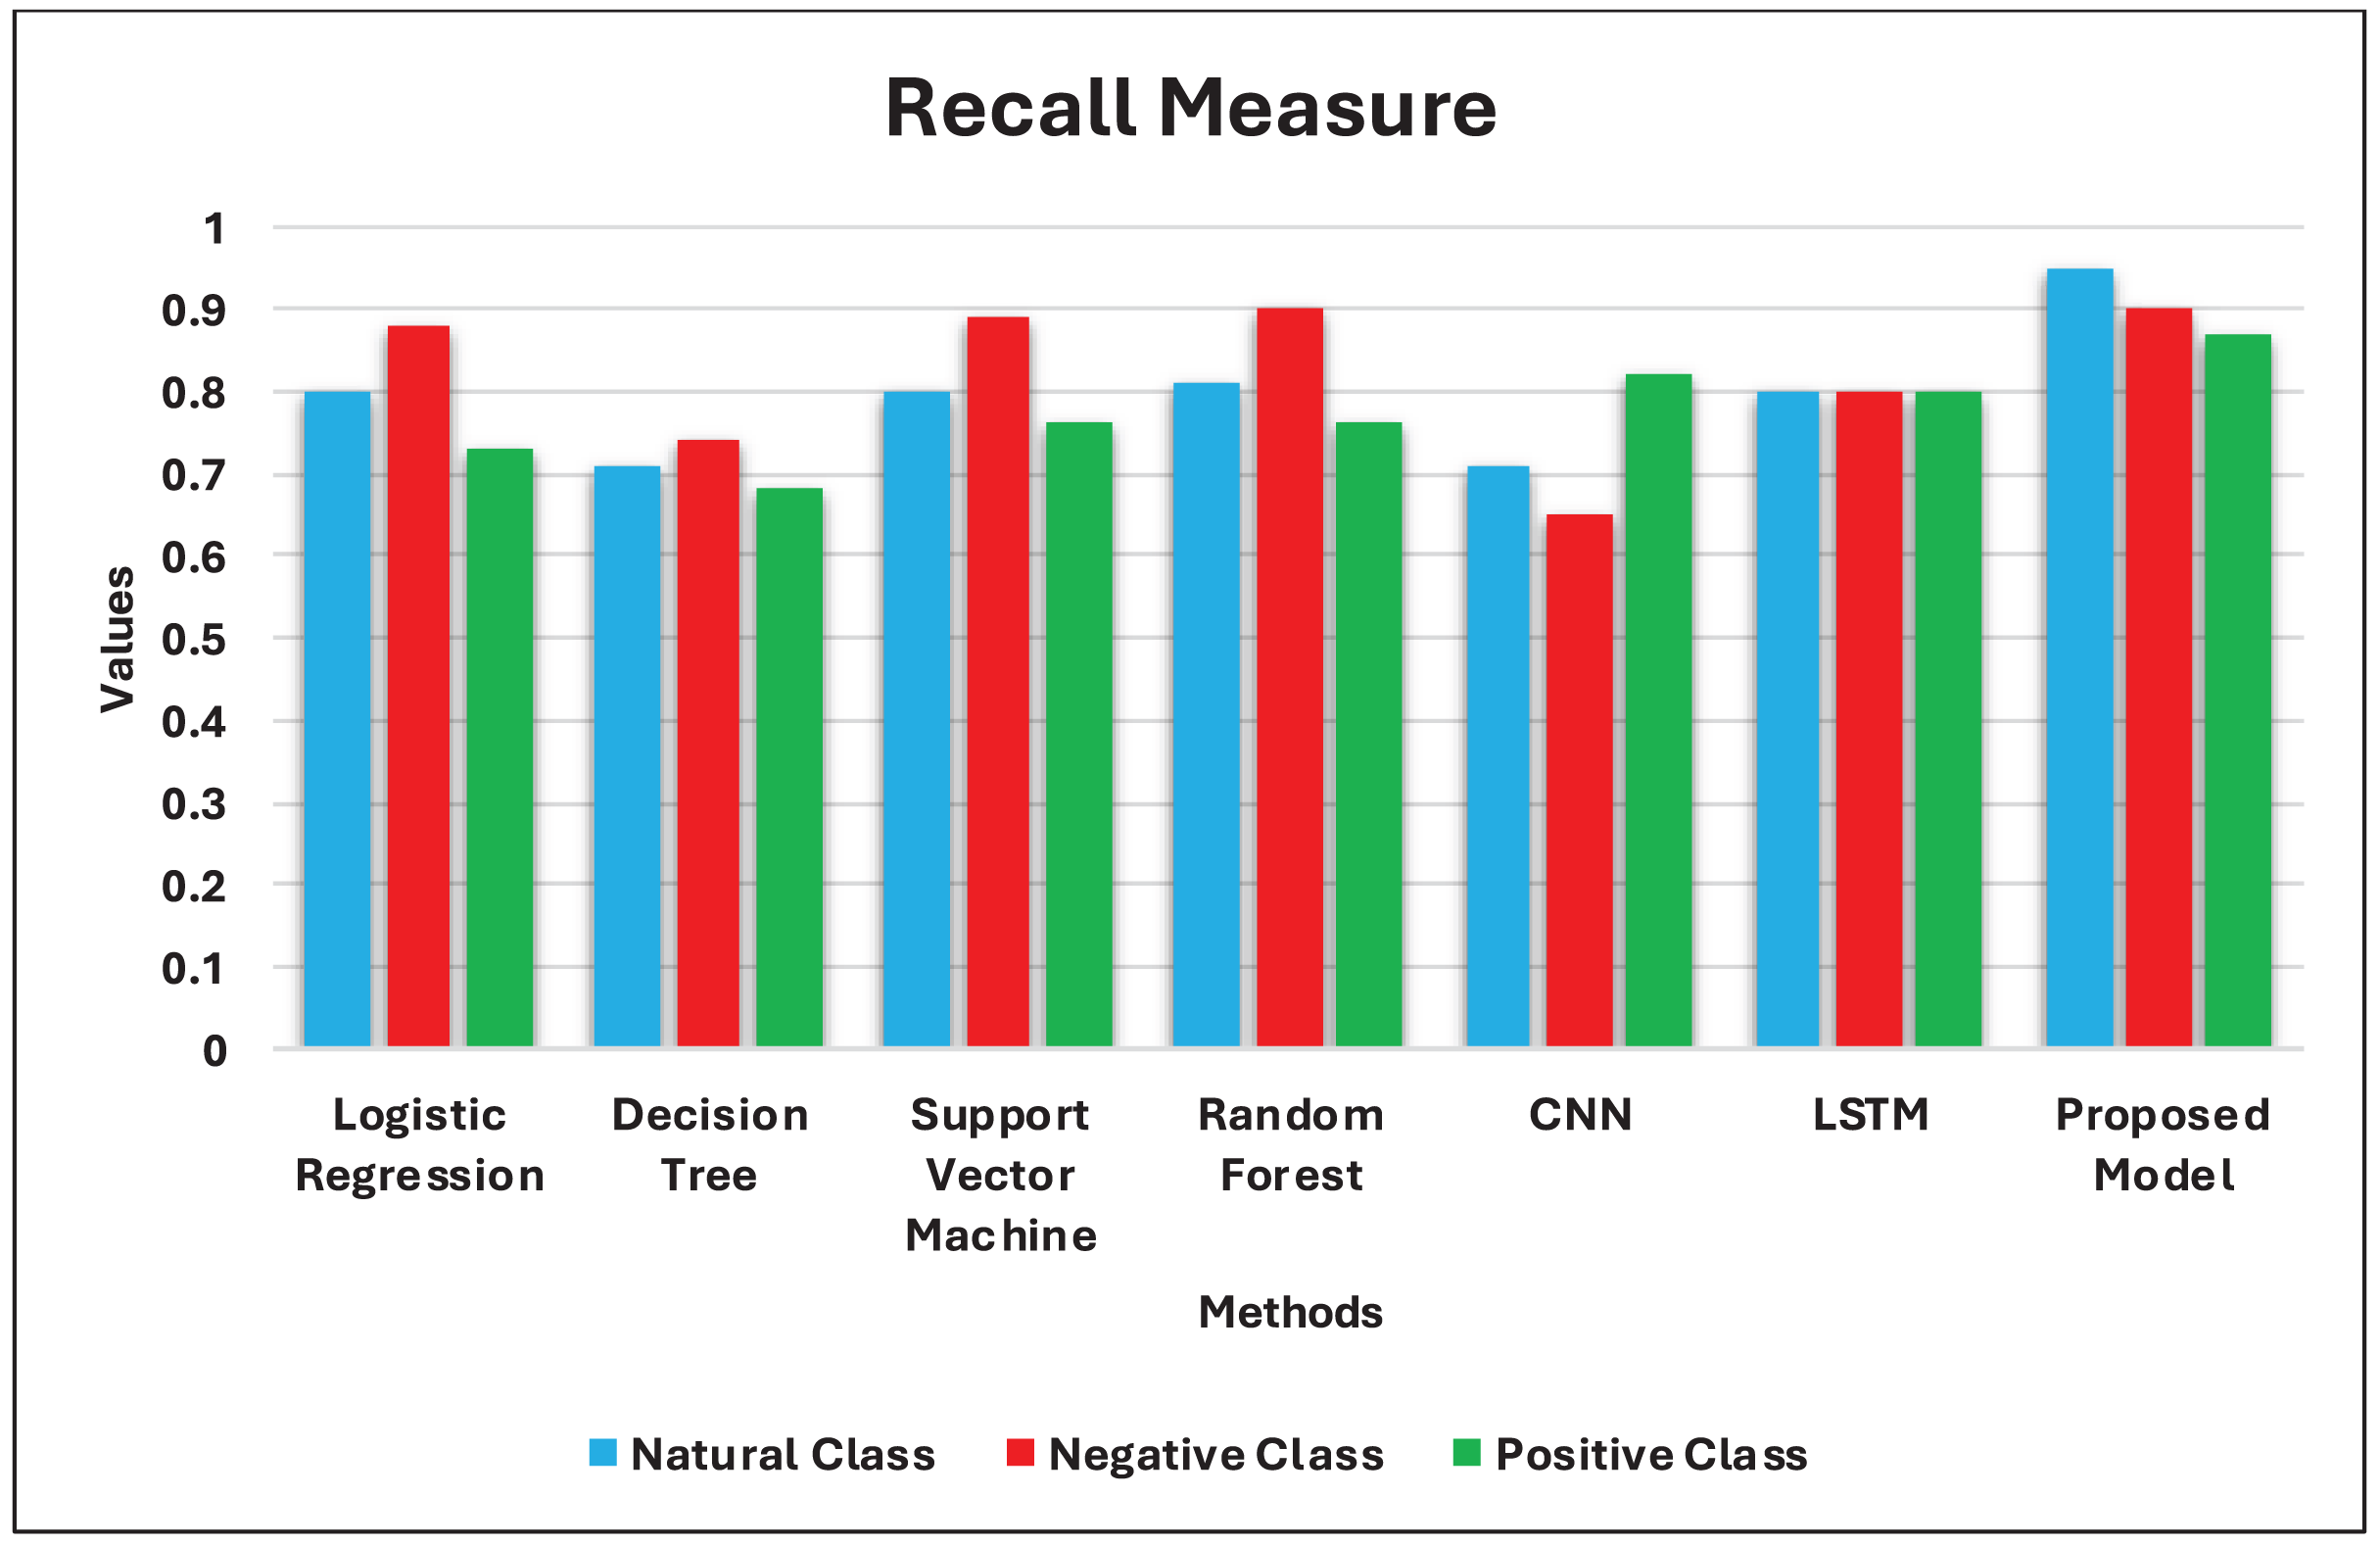
Figure 19 shows the results of our proposed method performing better on our dataset with an F1-score, achieving 0.93%. The outputs of the other methods ranged from 0.71% to 0.87%.
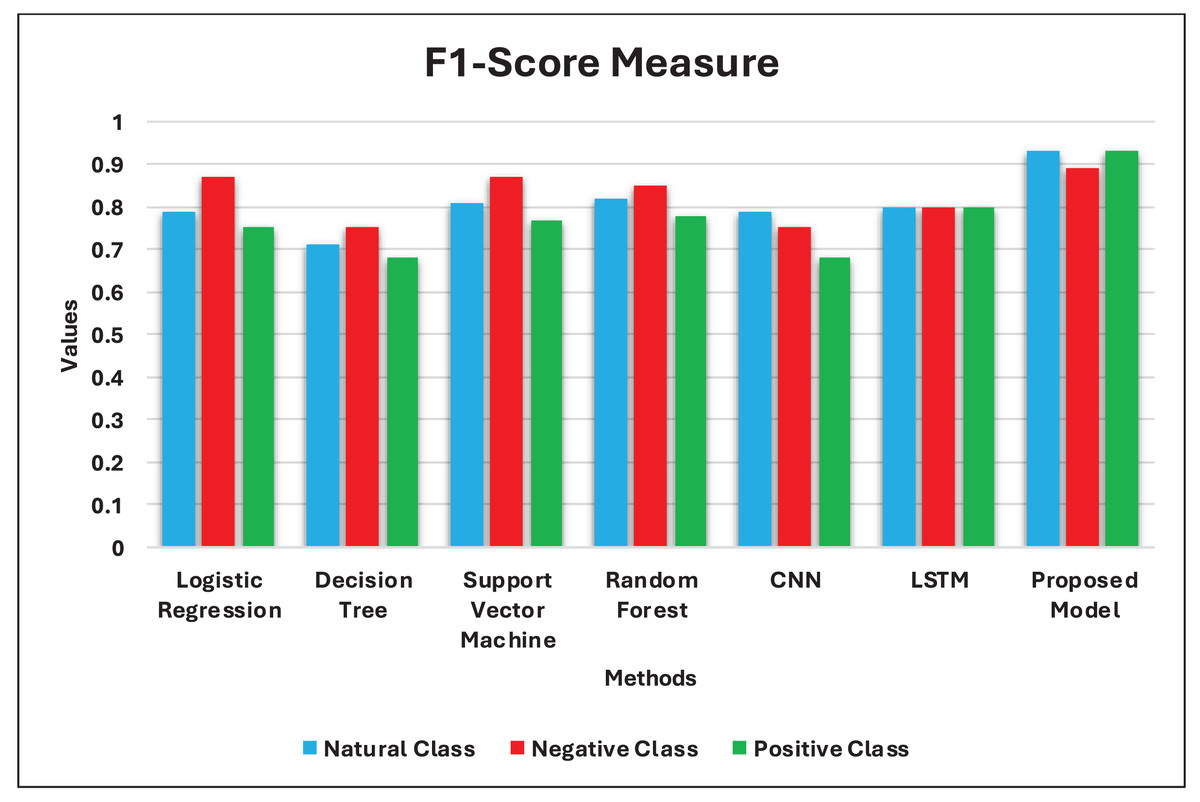
Figure 19: Experimental results of F1-score measures.
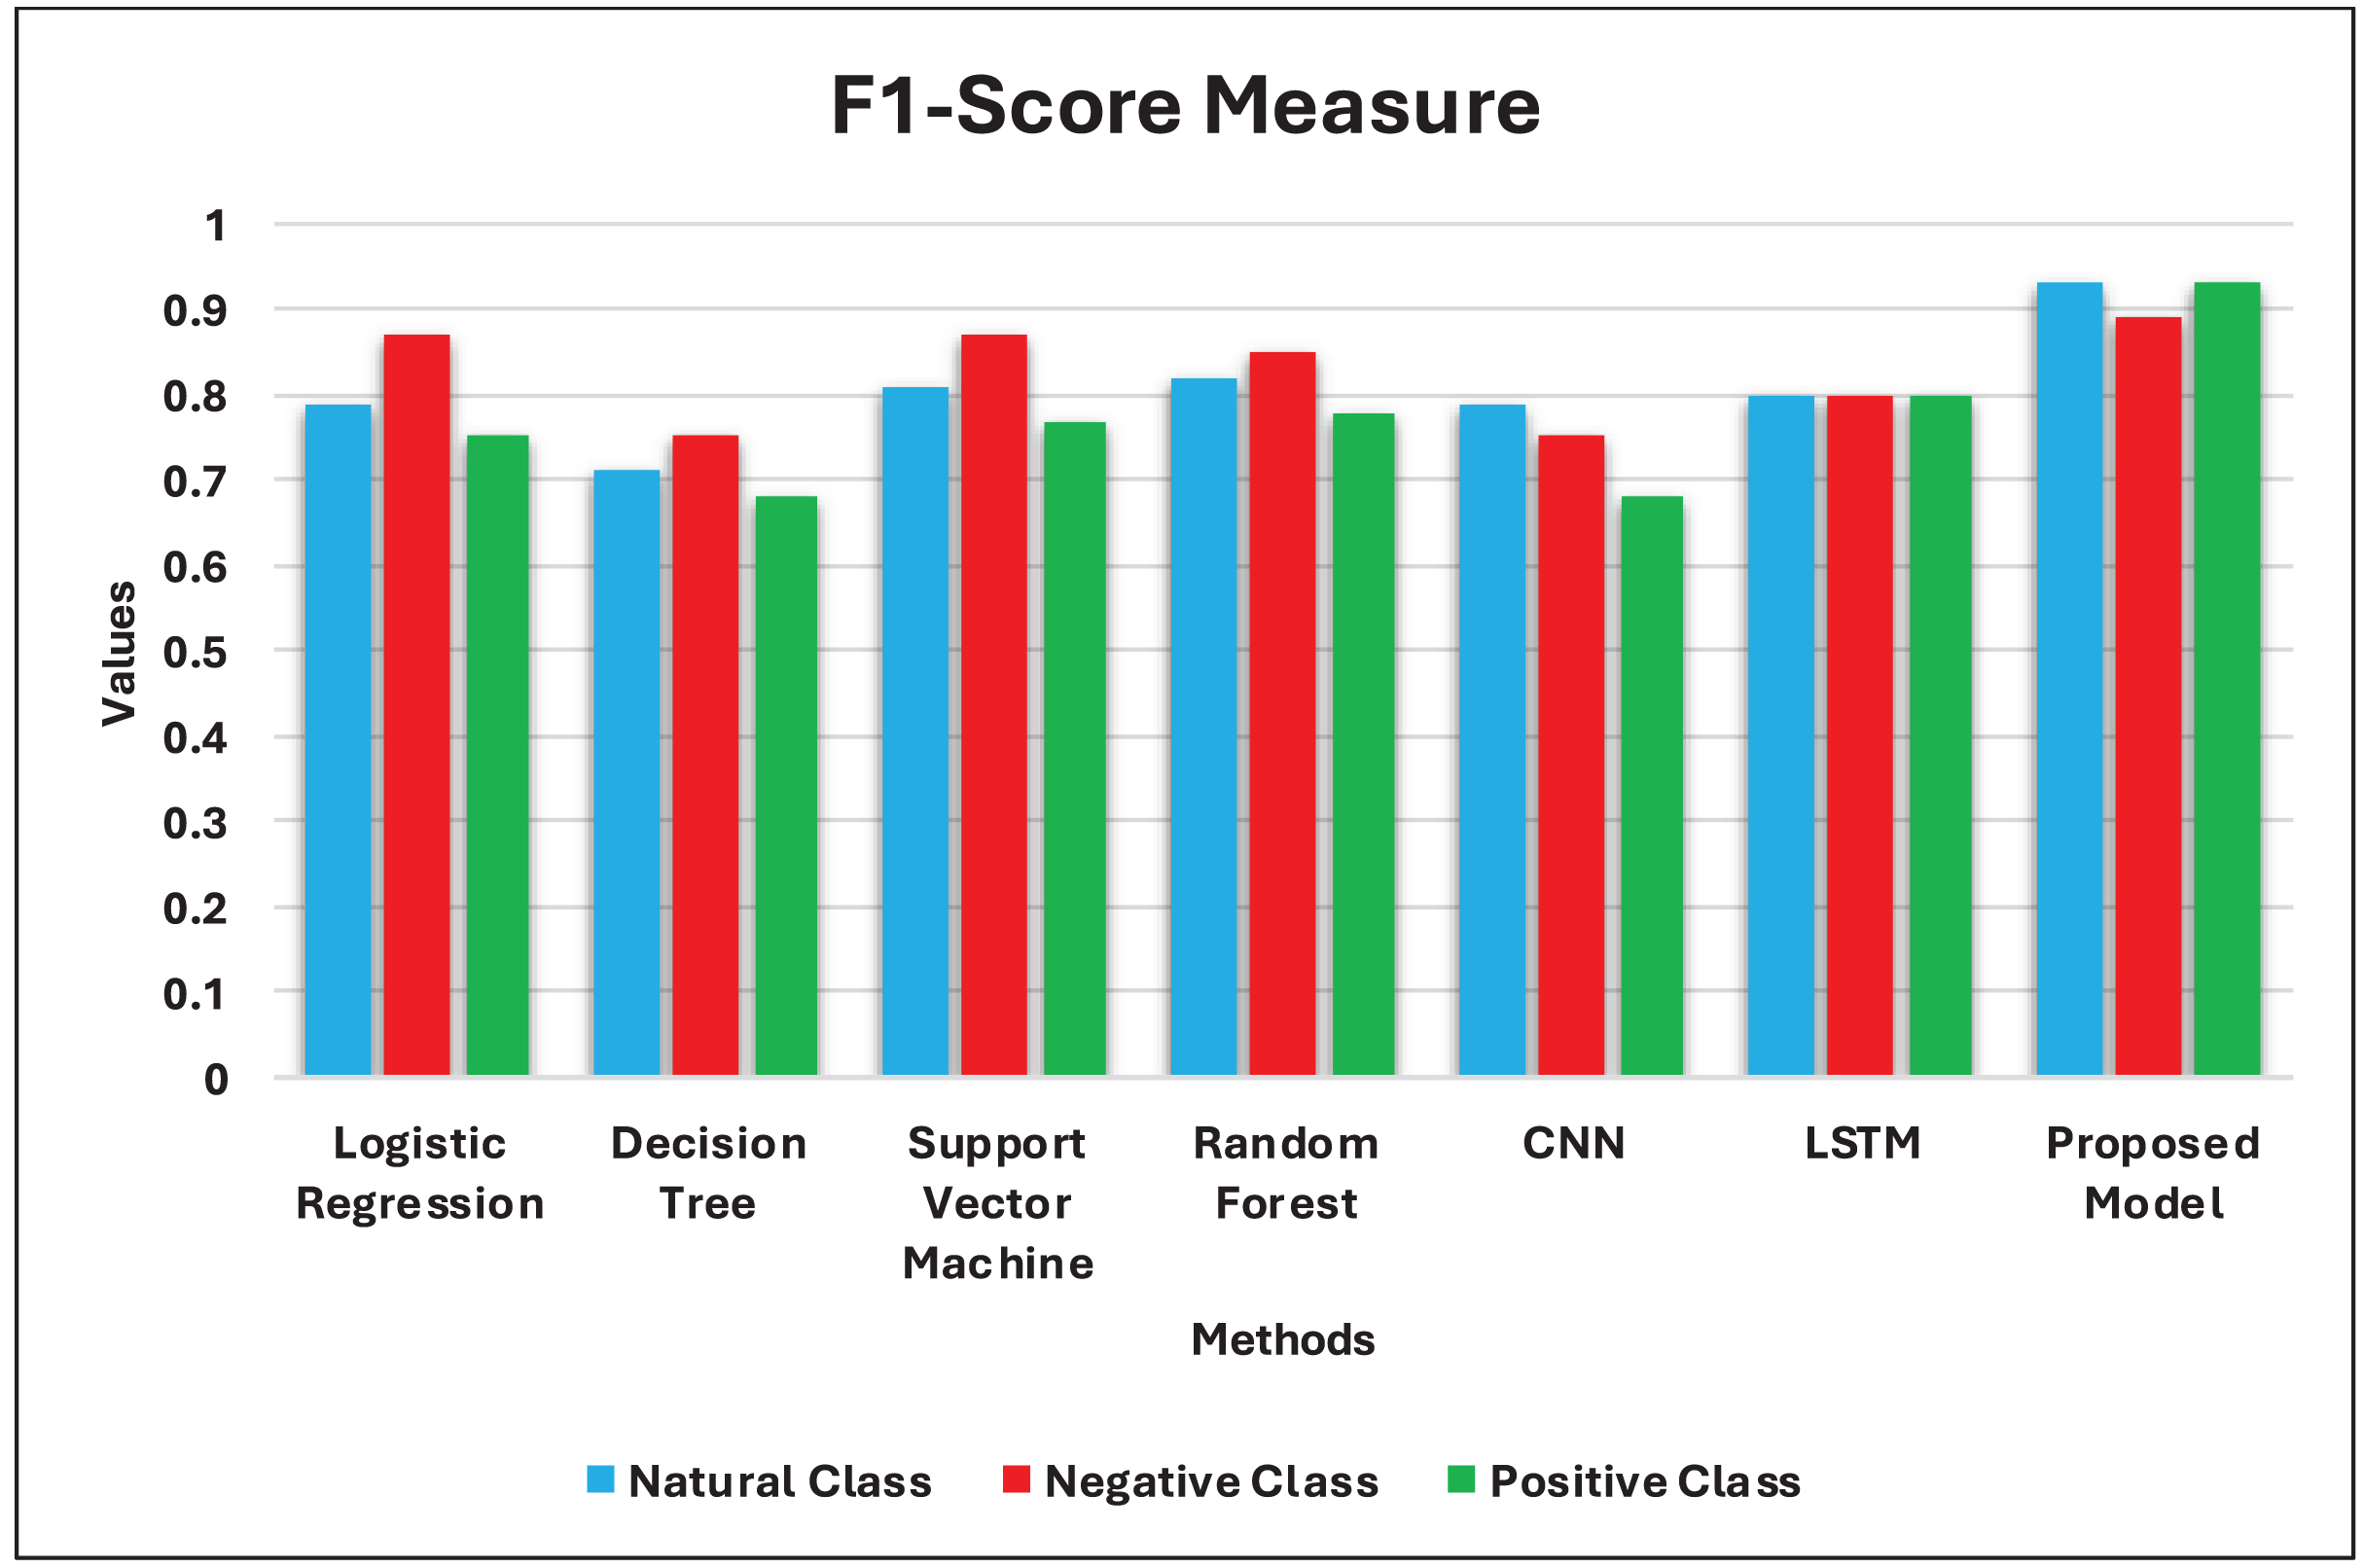
Figure 20 shows that the accuracy of the comparison models ranged from 0.71% to 0.81%. The proposed hybrid model achieved the best results for sentiment classification in all three classes in this research.
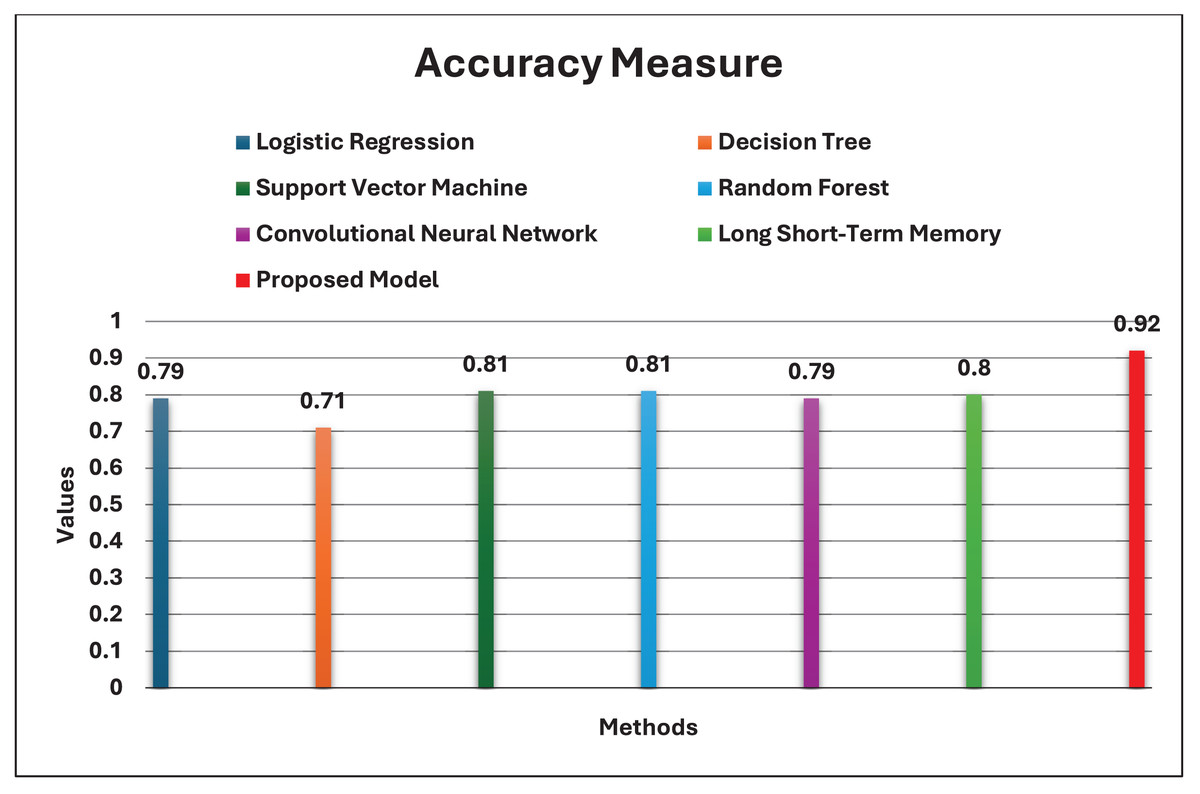
Figure 20: Experimental results of accuracy measures.
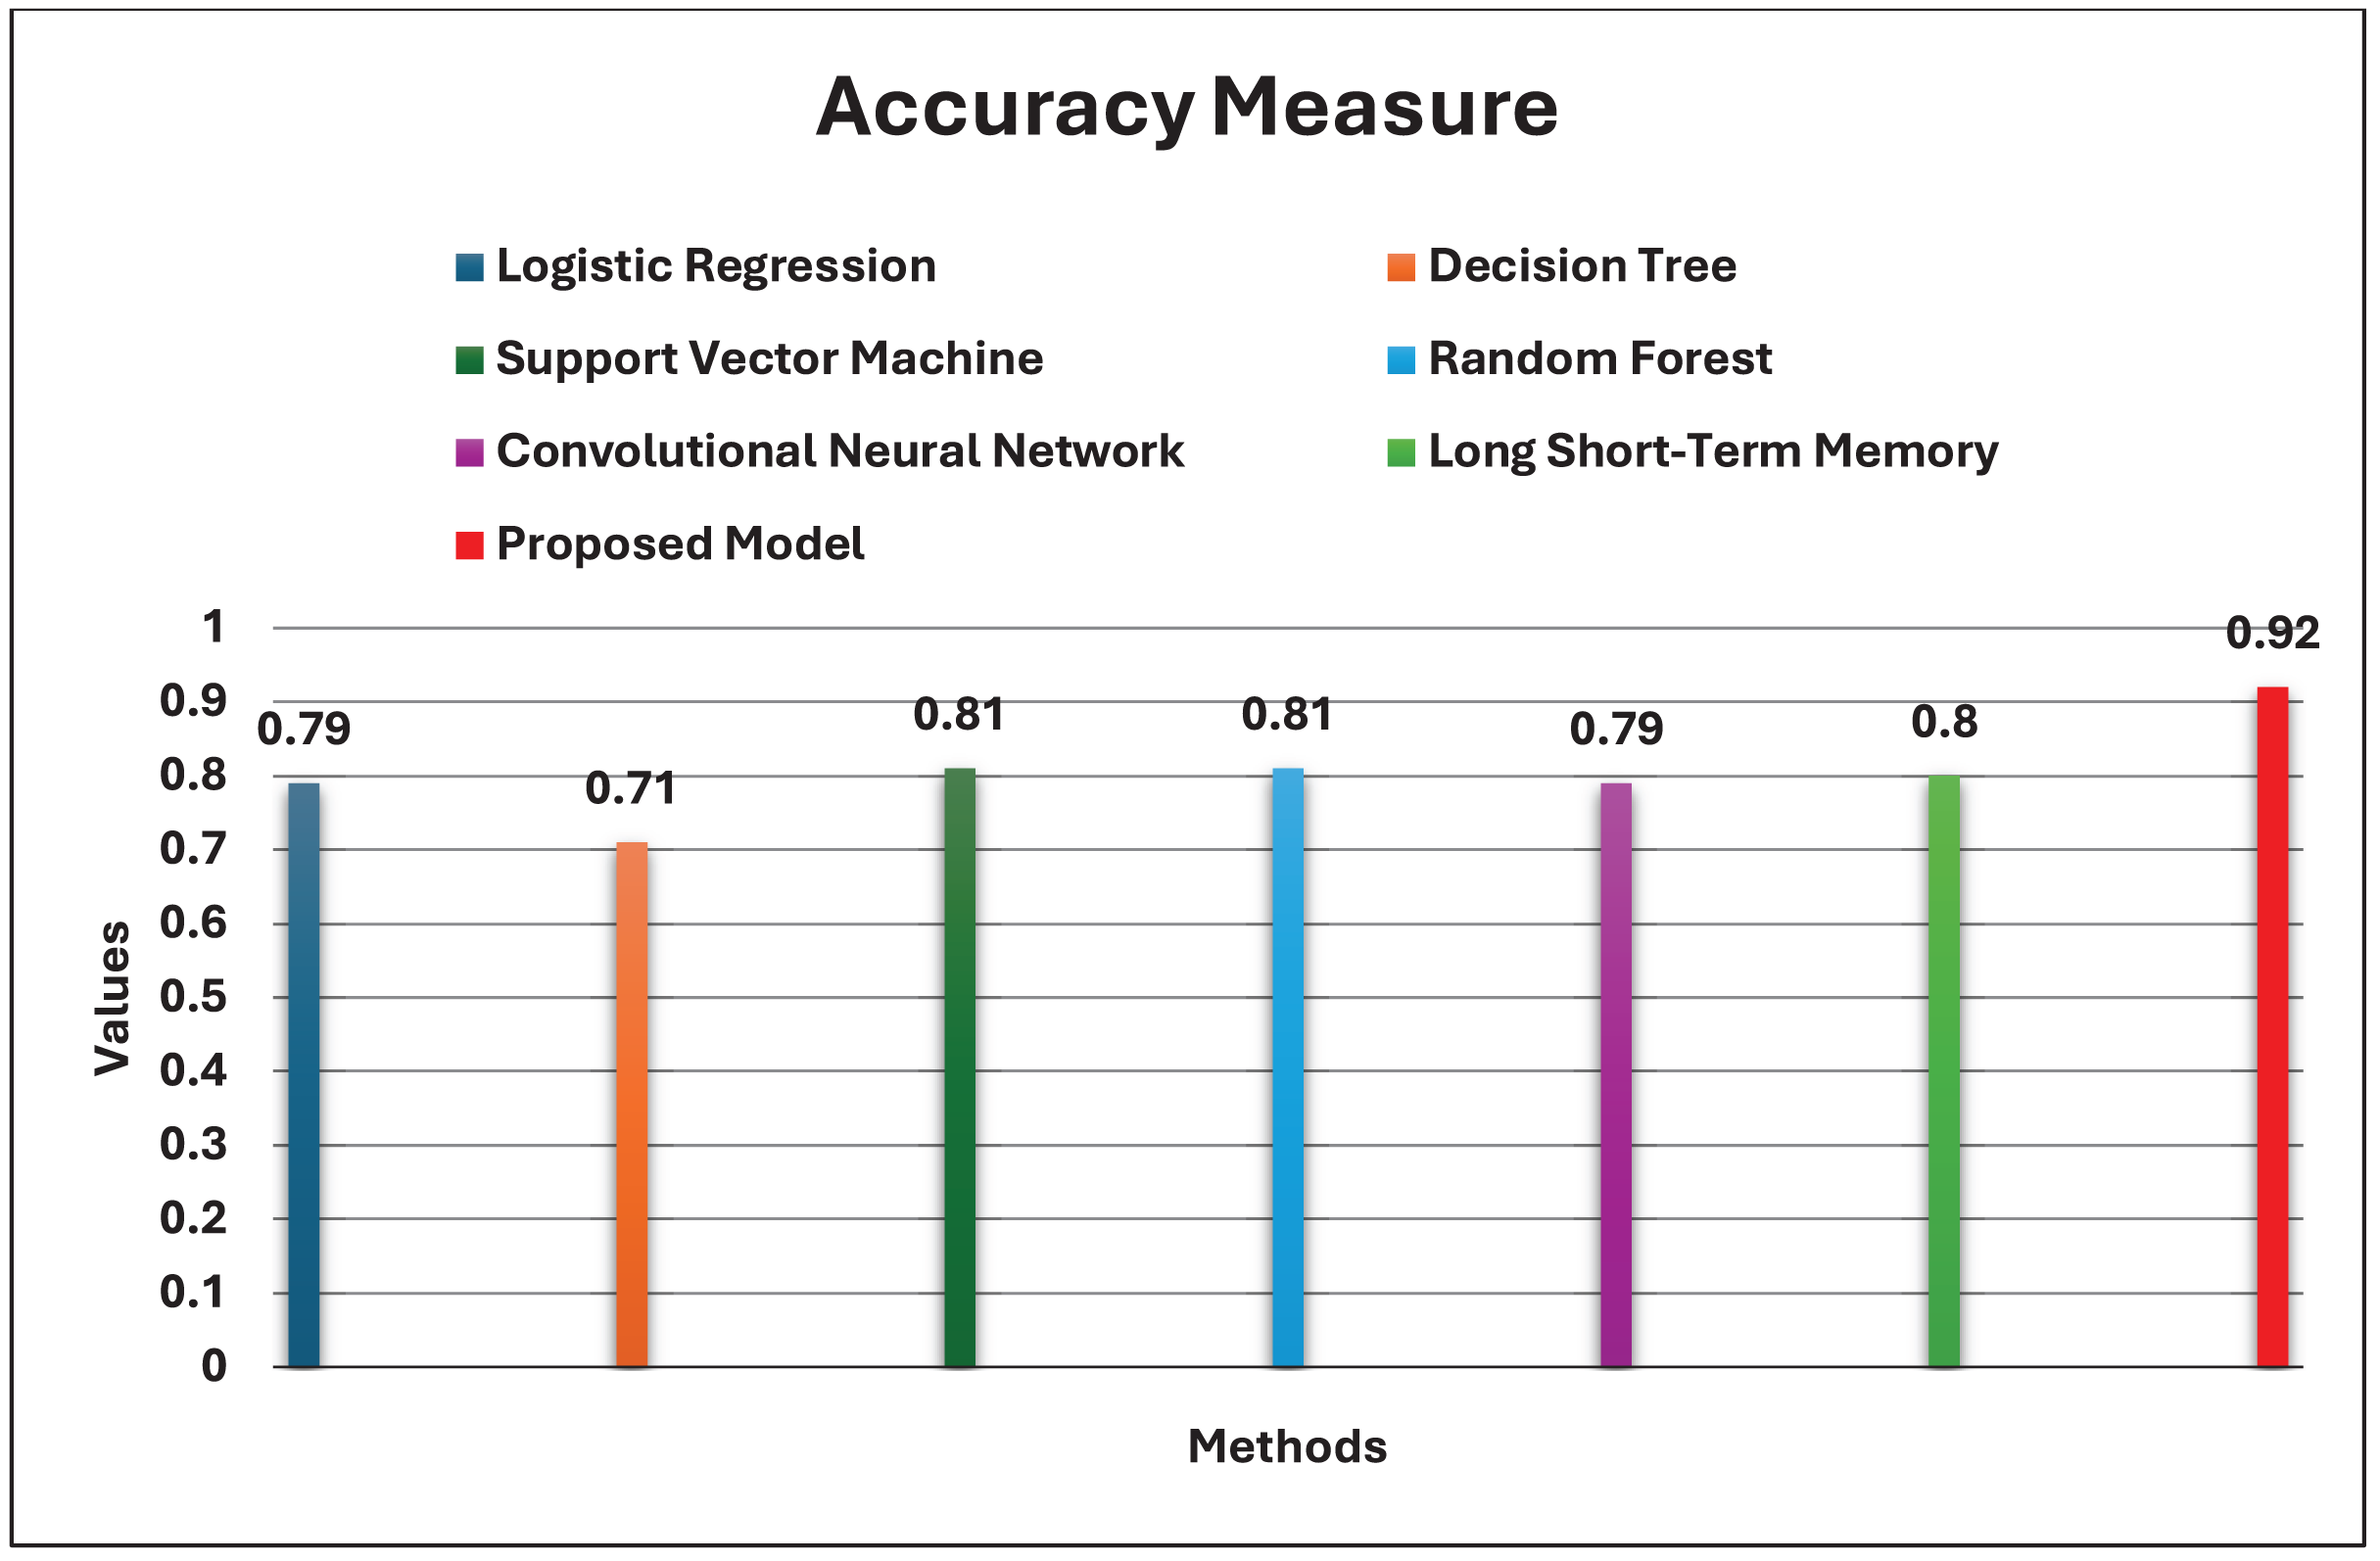
Table 10 reports the experimental results of all models based on the metrics used in this research. It can be noted that the performance of our proposed model outperforms the other models.
| Model | Label 0: Natural | Label 1: Negative | Label 2: Positive | Accuracy | ||||||
|---|---|---|---|---|---|---|---|---|---|---|
| P | R | F1- | P | R | F1- | P | R | F1- | ||
| Logistic regression | 0.78 | 0.80 | 0.79 | 0.87 | 0.88 | 0.87 | 0.77 | 0.73 | 0.75 | 0.79 |
| Decision tree | 0.70 | 0.71 | 0.71 | 0.76 | 0.74 | 0.75 | 0.68 | 0.68 | 0.68 | 0.71 |
| Support vector machine | 0.81 | 0.80 | 0.81 | 0.86 | 0.89 | 0.87 | 0.77 | 0.76 | 0.77 | 0.81 |
| Random forest | 0.82 | 0.81 | 0.82 | 0.81 | 0.90 | 0.85 | 0.80 | 0.76 | 0.78 | 0.81 |
| CNN | 0.88 | 0.71 | 0.79 | 0.89 | 0.65 | 0.75 | 0.57 | 0.82 | 0.68 | 0.79 |
| LSTM | 0.80 | 0.80 | 0.80 | 0.80 | 0.80 | 0.80 | 0.80 | 0.80 | 0.80 | 0.80 |
| Proposed model | 0.91 | 0.95 | 0.93 | 0.82 | 0.90 | 0.89 | 0.93 | 0.87 | 0.93 | 0.92 |
Machine learning methods achieve results similar to deep learning methods. DT and LR are slightly poorer than RF and SVM, which represent machine learning methods. In addition, RF and SVM are slightly better than CNN and LSTM methods. Our proposed model achieved the highest accuracy improvement of 92%. All models in our dataset have the same hyperparameters. The accuracy of the models changes with the number of dynamic routing iterations since dynamic routing cannot completely learn the features of data. When iterations (epochs) are more than 3, overfitting may occur, which will reduce the accuracy of the model’s performance. The overall accuracy increased by 11–21% in terms of CNN-LSTM compared with ML models. It can be noted that CNN and LSTM separately did not give any high improvement. CNN-LSTM is better than them, owing to CNN-LSTM take for the long-term dependency on the text. When the experimental result of our model is compared with the related recently conducted state-of-the-art studies. We find that our proposed model outperformed the model of Mahendhiran & Subramanian (2022) with a ratio of 5% even with their use of a semantic parsing enhancer to address unstructured data, Arunkumar, Chandramathi & Kannimuthu (2019) with a ratio of 6%, and Naeem et al. (2021) with a ratio of 10%. This is due to the effectiveness of CNN-LSTM algorithms in dealing with the semantic meaning of people’s emotions. In Khan & AlGhamdi (2024), the authors used CNN-LSTM algorithms with the Sum of Squares Error (SSE) as a loss function, which they claim to improve the accuracy of their model. Nevertheless, the model does not attain an extremely high ratio of 85.65%. In contrast, our model attains 92% with Categorical Cross Entropy as a loss function.
The Hajj works of Aldhubaib (2020), Shambour (2022), Albahar et al. (2023), Gutub, Shambour & Abu-Hashem (2023), Alghamdi (2024), Khan & AlGhamdi (2024) produced perfect DL models with high precision and high efficiency for sentiment analysis of pilgrims about provided Hajj services. However, they do not offer deep insights to understand how related these textual analyses are with actual practices and behavior in the crowds’ events. Table 11 shows the deep aspects of these works besides our work.
| Research | Model | Aspects of work | ||||
|---|---|---|---|---|---|---|
| Emotional analysis | Satisfaction-level evaluation for Hajj services | Crowd management | Urban plan | Decision-making for stockholders | ||
| Elgamal (2016) | Naïve Bayes & SVM | √ | × | × | × | × |
| Aldhubaib (2020) | CNN-LSTM | √ | × | × | × | √ |
| Shambour (2022) | CNN-LSTM | √ | × | × | × | × |
| Gutub, Shambour & Abu-Hashem (2023) | CNN-LSTM | √ | × | × | × | √ |
| Albahar et al. (2023) | CNN-LSTM | √ | √ | × | × | √ |
| Khan & AlGhamdi (2024) | LSTM | √ | √ | × | × | √ |
| Alghamdi (2024) | CNN-LSTM | √ | √ | × | × | √ |
| Our proposed model | CNN-LSTM | √ | √ | √ | √ | √ |
This research is based on CNN-LSTM technologies that have been used in crowd management generally. Integrating crowd management events around the world and the research of big data works helped us to present this proposed model for exploiting the powers of wasted data on SM applications. The Hajj season is divided into three phases. The planning phase of Hajj crowd management is finished before the start of Hajj next season. Then, monitoring and operation phases are performed during the Hajj. At the end of the Hajj season and the completion of rituals, the analysis and evaluation are done about the passed-off event to avoid mistakes in the next season as showed in the timeline of Hajj in the Fig. 2. Traditional crowd management has several necessary requirements regarding equipment that should be installed everywhere, such as cameras, screens of live streaming, and a dashboard for process control. These need more experts for analysis, monitoring, and maintenance. Thus, it requires a larger budget starting from the planning phase until after the end of the season. This drives us to explore better methods continually in order to address crowd management needs, leading to improving the quality of services and positively affecting pilgrims. Streaming data over SM is massive and fast, and they can be generated in various forms, e.g., text, number, photo, video, and audio. Owing to the nature of big data, the traditional management and control crowd tools have failed to provide efficient services even in simple queries. Intelligent models outperform traditional models in exploration, availability, and utilization. Table 12 demonstrates the different requirements for crowd management of traditional and CNN-LSTM model.
| Requirements | CNN-LSTM model for crowd management | Traditional crowd management |
|---|---|---|
| Equipment | No need for hardware/equipment |
|
| Expert | No experts to analyze crowd data manually. |
|
| Data type | Only textual datasets | Multiple visual datasets (images/video) |
| Budget | Low Budget | High budget for equipment/Experts/operation processes. |
| Decision-making system (Time) | Advanced decision-making (Before The Accident) | Delayed decision-making (After The Accident) |
The limitations of this study may affect the results of the proposed model slightly. The sentiment analysis became extensively challenging owing to the language’s complex morphology, understanding of what was behind meanings, intricate nuances in expressing opinions, right-to-left script and versa, varying dialects, and slang language abbreviations. Moreover, Twitter users are not representative of the opinions of pilgrims and reactions about existing issues completely, owing they are not indicative of the whole pilgrims. Certainly, pilgrims use other social media applications to express their emotions and opinions. Thus, the comprehensiveness of the data from multiple sources is essential for ensuring the precision of datasets. Additionally, the study is limited to examining the Hajj catering provided to pilgrims during 1442, which the collected data does not give more information about the costs of Hajj campaigns. Therefore, the study needs to expand and vary in gathering ways, to ensure to arrive at each pilgrim. Owing to the existing dataset can give only three emotional outcomes (positive, negative, and natural), the work is based on the analysis of emotions from three aspects at the moment. In the future, we plan to expand the model to categorize the opinions into many more classes.
Conclusion and future work
Detection of the behavior and orientations of the crowd during the Hajj season by textual data is a challenging task. This article proposes a deep learning model based on combined (CNN-LSTM) algorithms. Our model can effectively analyze pilgrims’ textual data on the Twitter platform. This research has taken low-quality pre-prepared food at Hajj 1442 as a case study. A dataset for Catering-Hajj is provided for the first time. The experimental results confirm that our proposed model outperforms other models by a rate of 92%. A comparison of the performance of various machine learning and deep learning methods proved the advantage of our proposed model with a dataset. We expect the Catering-Hajj dataset to become a necessary standard for measuring the quality of the food in the next Hajj seasons besides the deep hybrid model. At the same time, the proposed model has some limitations. Considering the complexity of the Arabic language, it includes various dialects, many examples of jargon with different meanings, and special abbreviations. This work does not deal with the problems that may have resulted. In every tweet, however, each word was processed with the same importance. Another limitation is that there are tweets containing both positive and negative emotions, which may have resulted in wrong classifications. Lastly, the dataset used in this work was not very large. Deep learning models have shown a high level of performance on massive datasets. We expect that solutions for these limitations are to deal with the tools customized to the Arabic language, and, the looking at the previous related works that they contributed to this side, and we are trying to improve. Moreover, using the proper methods to classify datasets with a balanced ratio among categories.
This study does not only provide a novel research idea for crowd behavior prediction but also opens new horizons for scholars to exploit textual data to close neglected gaps for crowd monitoring in smart cities. In future work, we plan to improve the proposed model increase the convolution layers and use effective optimal methods to capture local features of data such as (word2Vec, GloVe, fastText). We aim to improve the existing model, study more technical modalities, and address the challenges faced by Arabic texts. Moreover, we intend to expand the studies of Hajj, focusing especially on exploiting big data in SM to investigate the behavior of pilgrims. We intend to prepare a dataset customized to describe the experiences of pilgrims about regularly run round-trip flights and other provided services in airports. We will evaluate the quality of transportation, airport, and shipping services at Jeddah and Madina airports during the Hajj season in order to reduce violating delays of trips.