
Towards an automated classification phase in the software maintenance process using decision tree
- Published
- Accepted
- Received
- Academic Editor
- Antonio Jesus Diaz-Honrubia
- Subject Areas
- Artificial Intelligence, Software Engineering
- Keywords
- Decision tree, Machine learning, Maintenance request, Software engineering, Software maintenance
- Copyright
- © 2024 Alturki and Almoaiqel
- Licence
- This is an open access article distributed under the terms of the Creative Commons Attribution License, which permits using, remixing, and building upon the work non-commercially, as long as it is properly attributed. For attribution, the original author(s), title, publication source (PeerJ Computer Science) and either DOI or URL of the article must be cited.
- Cite this article
- 2024. Towards an automated classification phase in the software maintenance process using decision tree. PeerJ Computer Science 10:e2228 https://doi.org/10.7717/peerj-cs.2228
Abstract
The software maintenance process is costly, accounting for up to 70% of the total cost in the software development life cycle (SDLC). The difficulty of maintaining software increases with its size and complexity, requiring significant time and effort. One way to alleviate these costs is to automate parts of the maintenance process. This research focuses on the automation of the classification phase using decision trees (DT) to sort, rank, and accept/reject maintenance requests (MRs) for mobile applications. Our dataset consisted of 1,656 MRs. We found that DTs could automate sorting and accepting/rejecting MRs with accuracies of 71.08% and 64.15%, respectively, though ranking accuracy was lower at 50%. While DTs can reduce costs, effort, and time, human verification is still necessary.
Introduction
Software engineering aims to produce reliable, maintainable, and high-quality software within a specified timeframe. One phase in the SDLC is the maintenance phase, which is both costly and time-consuming. Software maintenance involves correcting and improving software after its release (Baqais, Alshayeb & Baig, 2013; Sharawat, 2012). It is essential for the continued use of software, as neglected software becomes obsolete (Stojanov & Stojanov, 2016). Maintenance can account for up to 70% of project costs (Ikram et al., 2020). As software increases in size and complexity, maintenance becomes more challenging.
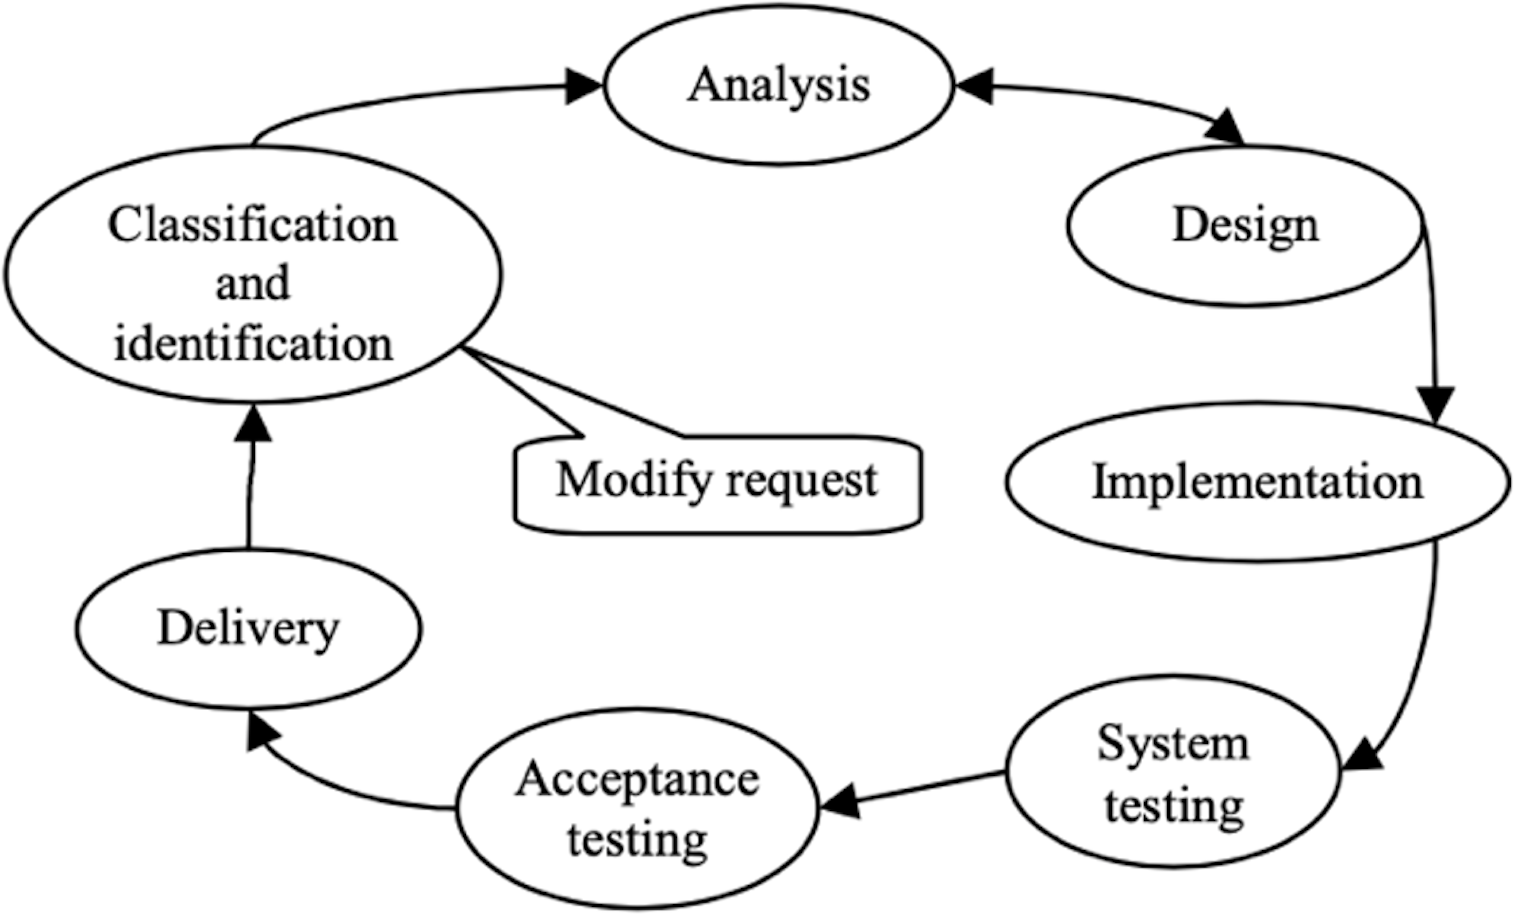
Automating parts of the maintenance phase can reduce associated costs, time, and effort. The IEEE model outlines seven phases in the software maintenance life cycle (SMLC), beginning with classification. This phase involves receiving requests, assigning maintenance types, priorities, and unique numbers. Subsequent phases include analysis, design, implementation, testing, acceptance testing, and delivery, as shown in Fig. 1 (Ren et al., 2011). Our study focuses on the classification phase, which involves collecting MRs, sorting them by type, ranking them by priority and severity, and deciding on acceptance or rejection. We evaluate the applicability and accuracy of DTs for this purpose (Jo, 2021).
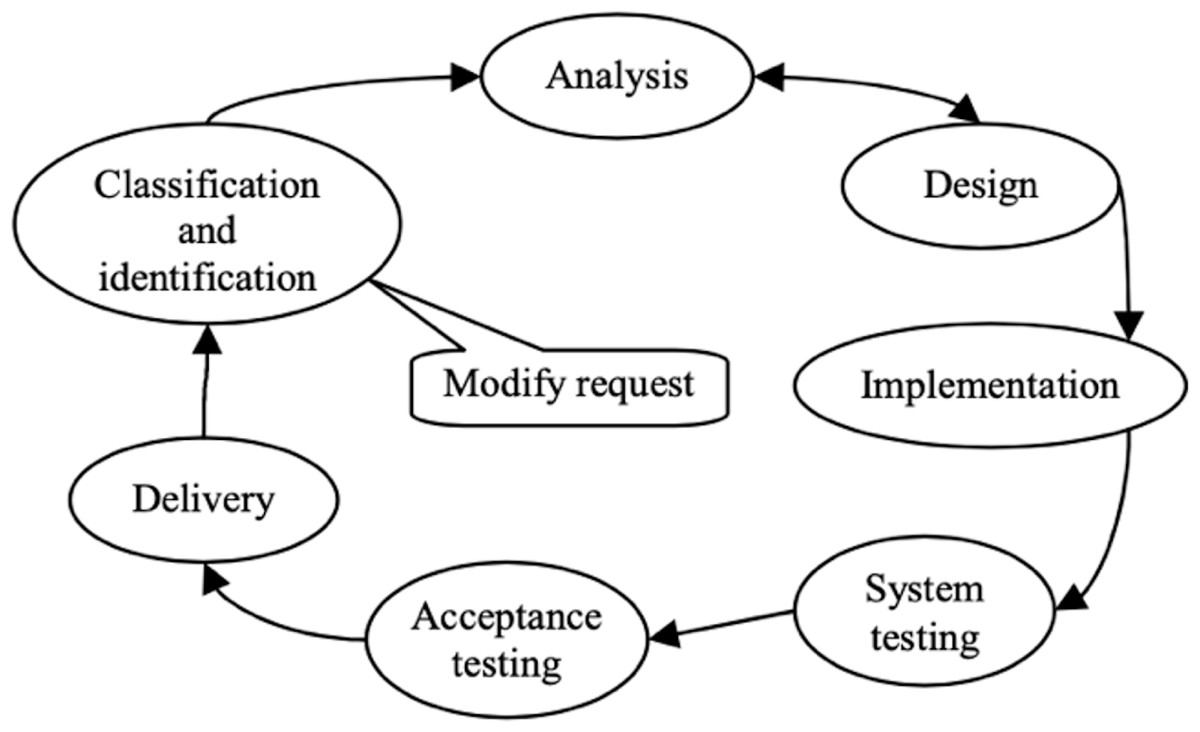
Figure 1: IEEE software maintenance life cycle model.
Most research has focused on sorting, severity, priority, or acceptance/rejection of MRs using various machine learning techniques such as support vector machines (SVM), random forest (RF), linear SVC, KNN, naive Bayes (NB), and logistic regression. However, no research has comprehensively automated all activities in the classification phase. Our research aims to fill this gap by using DTs for sorting MRs based on maintenance types (corrective, adaptive, and perfective), ranking them by severity and priority, and deciding on acceptance or rejection. We focus on mobile applications, given their current prominence and need for rapid maintenance (Phetrungnapha & Senivongse, 2019).
This research addresses the following question: Is the DT learning technique suitable for sorting, ranking, and accepting/rejecting MRs with acceptable accuracy? Our study contributes to solving significant problems in the software maintenance process, such as reducing time, effort, and cost, and speeding up the maintenance process. Automating the classification process allows maintenance teams to focus on other phases, reduces human intervention, and directs future research toward further automation in the SMLC.
This article is divided into literature review, methodology, data collection, data processing, feature extraction, decision tree, experimental results, discussion, and conclusion.
Literature Review
Sorting maintenance requests
Machine learning techniques have been used to sort and categorize MRs. Phetrungnapha & Senivongse (2019) developed an approach to categorize user reviews into feature requests or bug reports using several machine learning techniques, including DT, linear SVC, KNN, NB, logistic regression, and ensemble methods. Ciurumelea, Panichella & Gall (2018) introduced the AUREA tool to help developers analyze user feedback and plan maintenance activities. Ekanata & Budi (2018) used machine learning to categorize user reviews automatically, finding logistic regression to be the most effective. Levin & Yehudai (2017) classified commitments in maintenance activities using J48, GBM, and RF, achieving an accuracy of 76%.
Otoom, Al-jdaeh Hammad & Hammad (2019) built a classifier to distinguish software bug reports into corrective or perfective reports using keyword frequency and classification algorithms, achieving an average accuracy of 93.1% with SVM. Pandey et al. (2017) analyzed bug reports using various algorithms, including RF and SVM, finding high performance with RFs and SVMs. Ahmed, Bawany & Shamsi (2021) introduced the CaPBug framework, using NLP and machine learning to classify and prioritize error reports, achieving class prediction accuracy of 88.78% with RF.
Ranking maintenance requests
Researchers have also addressed ranking MRs using machine learning techniques. Srewuttanapitikul & Muengchaisri (2016) proposed prioritizing software flaws based on severity, priority, and user reports. Guzman, Ibrahim & Glinz (2017) surveyed researchers and practitioners to rank and prioritize tweets for software development. Ekanayake (2021) proposed using the RAKE algorithm for keyword extraction and NB, DT, and logistic regression for prioritizing error reports. Alenezi & Banitaan (2013) predicted bug priority using DTs, NB, and RF, concluding that DTs and RFs outperformed NB.
Researchers have explored various machine learning techniques for ranking maintenance requests based on severity and priority. Srewuttanapitikul & Muengchaisri (2016) suggested using a natural language processing approach combined with an analytic hierarchy process to prioritize MRs by severity, priority, and the number of users reporting the same defect. Guzman, Ibrahim & Glinz (2017) conducted a survey of 84 software engineering practitioners to rank tweets for software development, emphasizing the importance of audience-based requirements engineering. Ahmed, Bawany & Shamsi (2021) introduced the CaPBug framework, which uses natural language processing and machine learning to classify and prioritize error reports into six categories and five priority levels. The CaPBug framework achieved class prediction accuracy of 88.78% with the RF classifier and priority prediction accuracy of 90.43%.
Ekanayake (2021) proposed a model using the RAKE algorithm to extract keywords from error reports, converting them into attributes for prioritizing MRs with NB, DT, and logistic regression. The model achieved logistic regression accuracy of 0.86, with DT and NB accuracies of 0.81 and 0.79, respectively. Alenezi & Banitaan (2013) suggested using machine learning algorithms to predict bug priority, concluding that DTs and RFs outperformed NB. Tian et al. (2015) proposed a multi-factor analysis approach for predicting bug report priority, achieving a relative improvement of 209% in the average F-measure. Umer, Liu & Sultan (2018) introduced an emotion-based approach for predicting bug report priority using natural language processing to identify emotional words and a supervised machine learning classifier. Their approach outperformed the latest technologies, improving the F-measure by more than 6%. Ramay et al. (2019) proposed a deep neural network-based approach for predicting bug report severity, which outperformed existing methods and improved the F-measure by 7.90%.
Accepting/rejecting maintenance requests
Various machine learning techniques have been used to predict the acceptance or rejection of MRs. Nizamani et al. (2018) proposed a NB polynomial approach for this task, achieving an accuracy of 89.25%. Umer, Liu & Sultan (2019) used sentiment analysis to predict approval, achieving 77.90% accuracy. Cheng et al. (2021) used deep learning for approval prediction, achieving 90.56% accuracy. Nyamawe et al. (2020) recommended refactorings based on feature requests, achieving 83.19% accuracy. Nizamani et al. (2018) proposed a NB polynomial approach for predicting the acceptance or rejection of improvement requests, using data from Bugzilla. Their method achieved an accuracy of 89.25%. Umer, Liu & Sultan (2019) developed a sentiment-based approach to predict the approval of enhancement reports, achieving 77.90% accuracy and a significant improvement in the F-measure to 74.53%.
Cheng et al. (2021) proposed a deep learning approach to predict the approval of enhancement reports, achieving 90.56% accuracy, 80.10% recall, and 85.01% F-measure. Nafees & Rehman (2021) used SVM for predicting the acceptance or rejection of improvement reports, comparing it with logistic regression and multinomial NB. Their study found that SVM outperformed other algorithms with high accuracy. Nyamawe et al. (2020) suggested a machine learning approach for predicting software refactorings based on feature requests, achieving 83.19% accuracy. Arshad et al. (2021) proposed a deep learning technique for predicting the resolution of enhancement reports, using Word2Vec and a deep learning classifier to learn semantic and grammatical relations between words. Their approach enhanced performance and demonstrated effective prediction accuracy.
Methodology
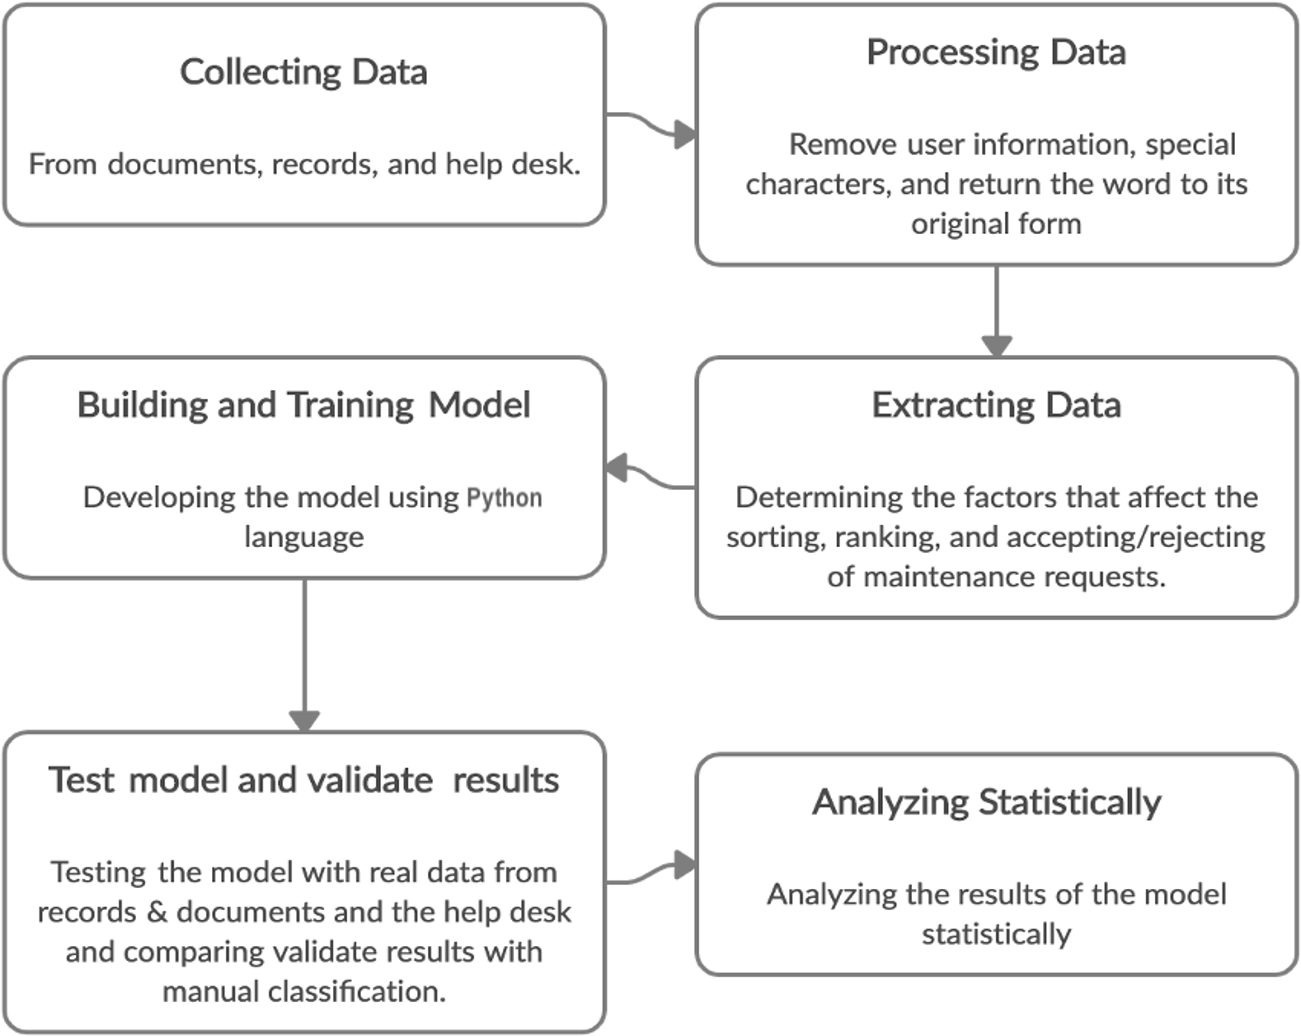
We used an experimental methodology, collecting data from records, documents, and help desk services of mobile applications. Statistical analysis was used to evaluate the efficiency of DTs for sorting, ranking, and deciding on MRs. The stages included data collection, data processing, feature extraction, model building, testing, and analysis, as shown in Fig. 2.
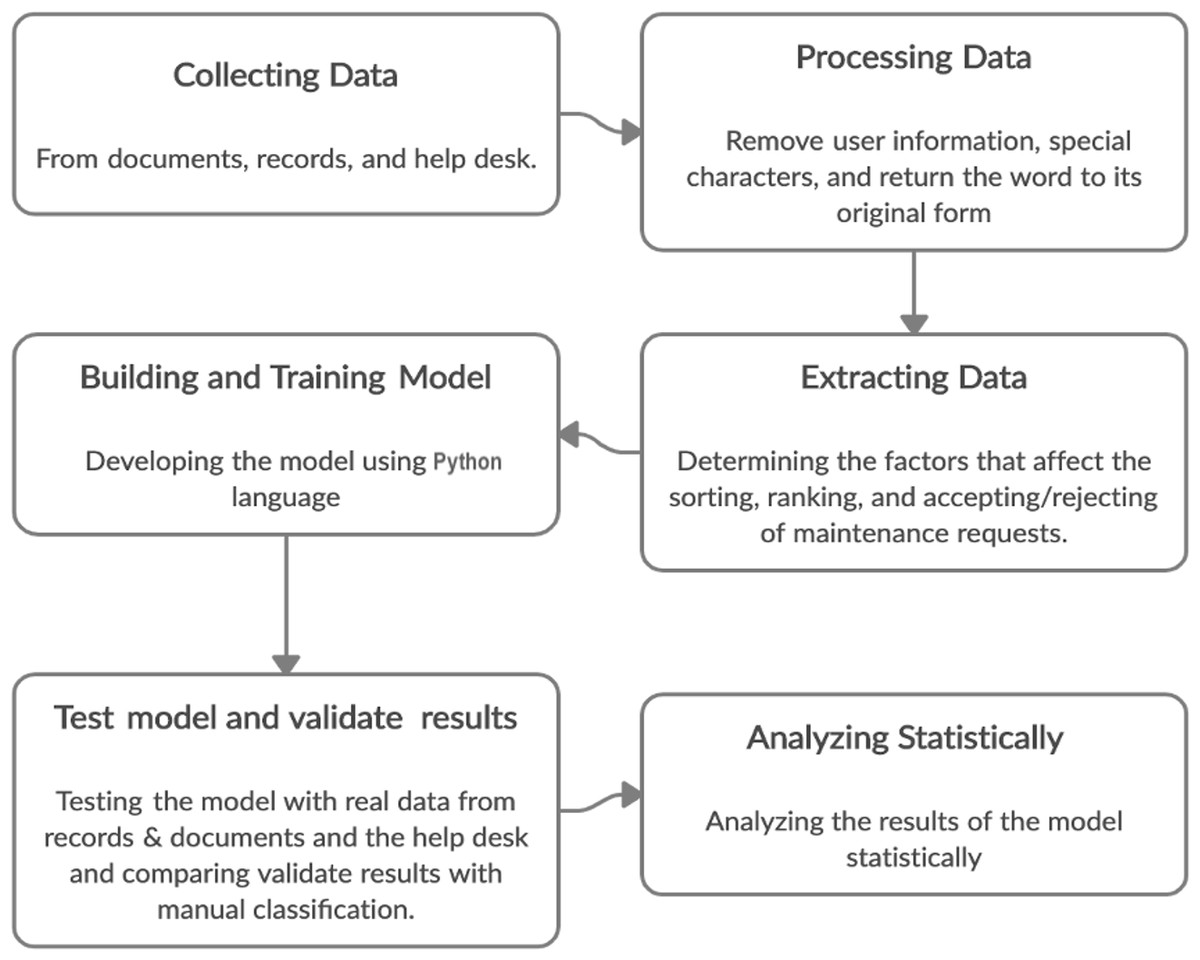
Figure 2: Stages of methodology.
Collecting data
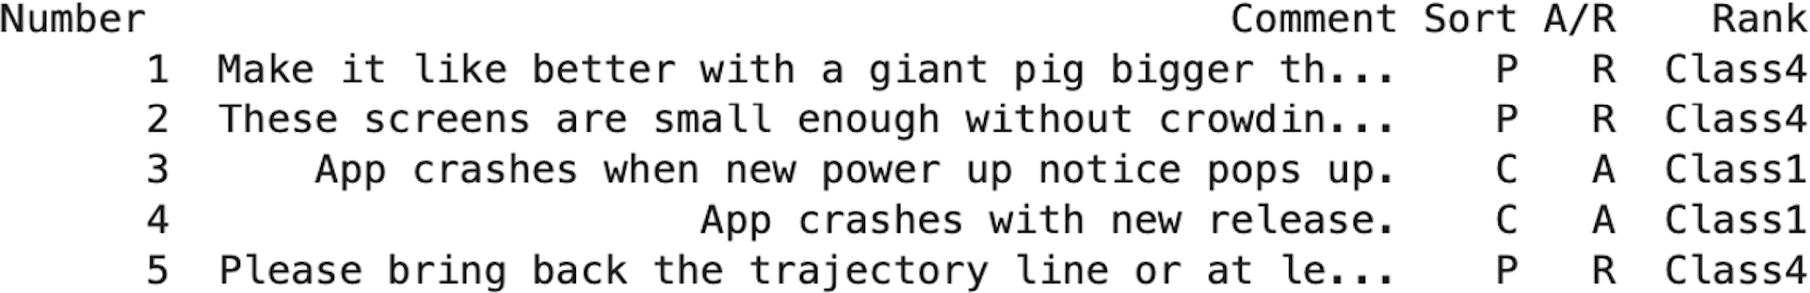
To collect data, we contacted several researchers and developers, seeking a dataset consisting of MR texts and their sorting, ranking, and acceptance/rejection classes. Unfortunately, we did not find a suitable dataset. Therefore, we turned to online data collection sites, such as Mendeley Data, which provide datasets used in scientific research. We used two datasets: the Commit dataset from Levin & Yehudai (2017) and the Pan dataset from Al-Hawari, Najadat & Shatnawi (2021). The Commit dataset classifies MRs as perfective, adaptive, and corrective, while the Pan dataset categorizes user reviews into problem discovery, feature request, information seeking, and information giving. We reclassified the Pan dataset to match the Commit dataset’s categories. The final dataset consisted of 1,656 MRs, as shown in Fig. 3. The demography of MRs is shown in Table 1. We split the dataset into 80% for training and 20% for testing, following common recommendations (Joseph, 2022; Rácz, Bajusz & Héberger, 2021).
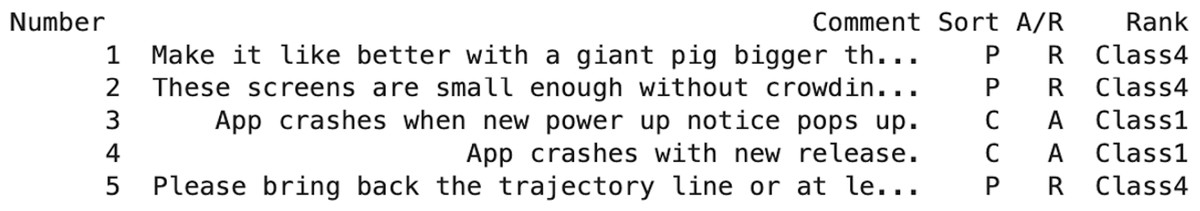
Figure 3: Dataset Excel file.
| MRs | Classes | Number of commits | Percentage |
|---|---|---|---|
| Sorting | Corrective | 818 | 50% |
| Perfective | 486 | 29% | |
| Adaptive | 352 | 21% | |
| Ranking | Class 1 very important (Critical Severity and High Priority) | 346 | 21% |
| Class 2 (Critical Severity and Medium Priority) or (Normal Severity and High Priority) | 230 | 14% | |
| Class 3 (Critical Severity and Low Priority) or (Normal Severity and Medium Priority) | 421 | 25% | |
| Class 4 Not important (Normal Severity and Low Priority) | 659 | 40% | |
| Accepting or Rejecting | Accept | 1,060 | 64% |
| Reject | 596 | 36% |
Processing data
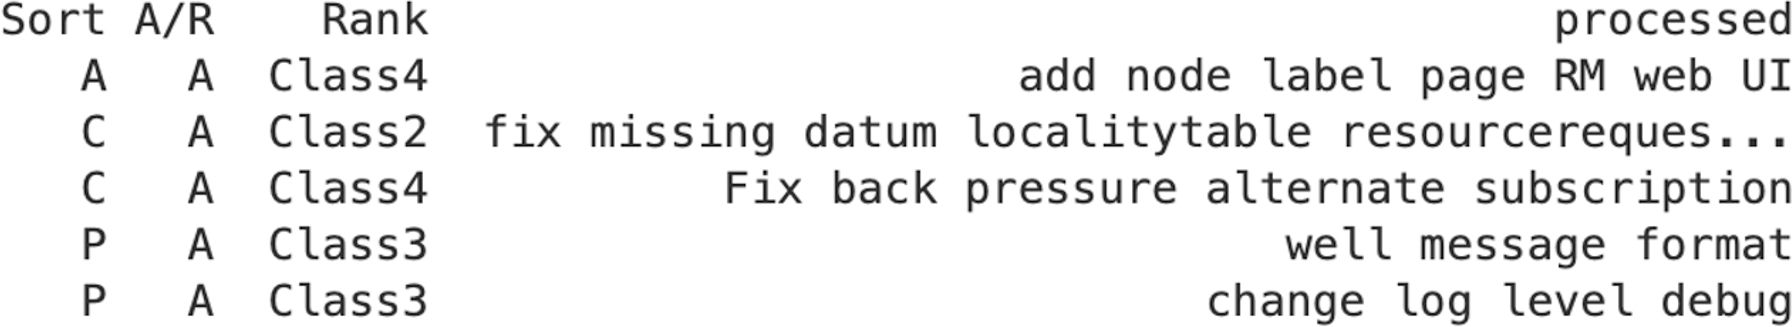
Before applying DTs, we processed the natural language to convert unstructured data into structured data. We removed links, user/application information, numbers, stop words, and punctuation. We then applied lemmatization to retrieve words in their normalized form, as shown in Fig. 4 (Razno, 2019; Korenius et al., 2004). The Natural Language Tool Kit (NLTK) library was used for lemmatization (Bird, 2006).
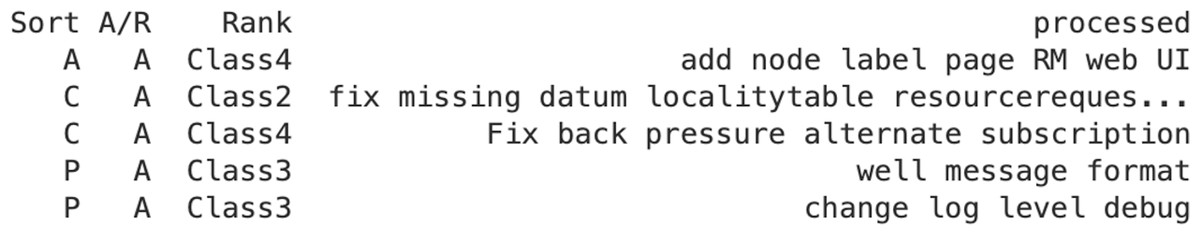
Figure 4: The dataset after process natural language.
Extracting features
We used the term frequency-inverse document frequency (TF-IDF) technique for text feature extraction, which measures document relationships (Zhang, Zhou & Yao, 2020; Qaiser & Ali, 2018). The TF-IDF vectorizer library was used to extract features from the processed dataset.
Decision tree
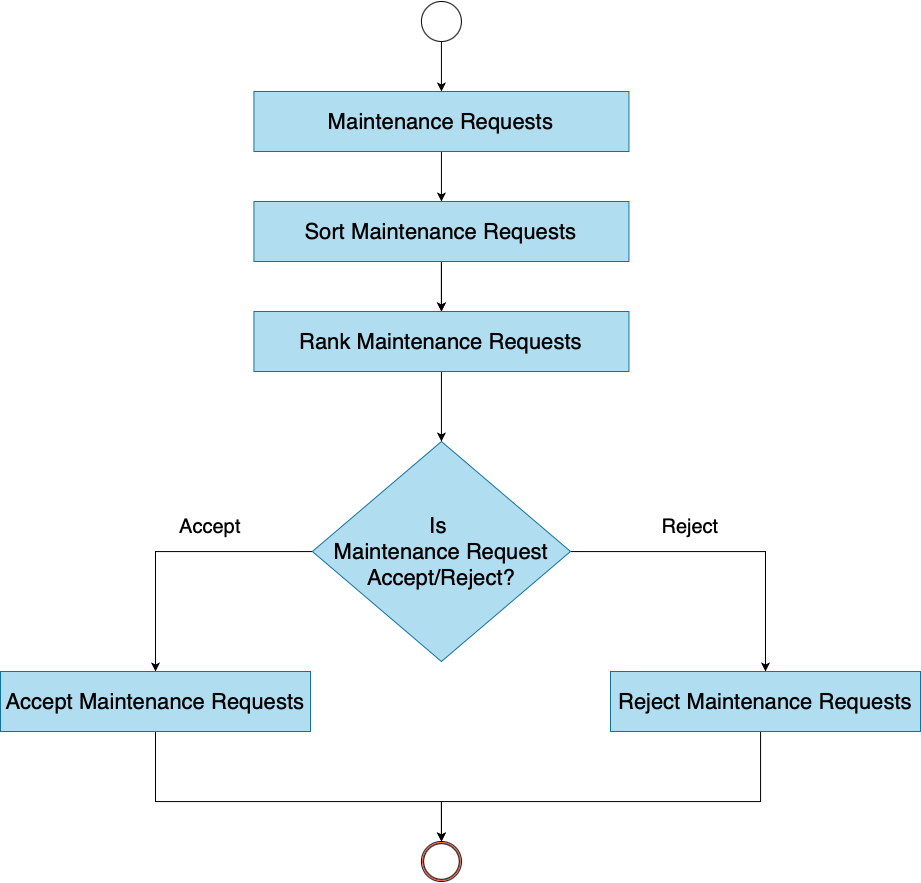
We developed the DT using Python, which is suitable for machine learning and AI. We used the Scikit-learn library for supervised learning algorithms and statistical analysis (Pedregosa et al., 2011). The dataset was divided into 80% for training and 20% for testing. The DT was trained to sort, rank, and accept/reject MRs. We used the fit() method to train the model, taking the result of feature extraction (TF-IDF) and the desired column in the trained dataset. The workflow of the implemented DT is shown in the Fig. 5. The DT classified MRs into three classes: perfective, corrective, and adaptive. The model was trained for ranking MRs based on severity and priority and for accepting/rejecting MRs.
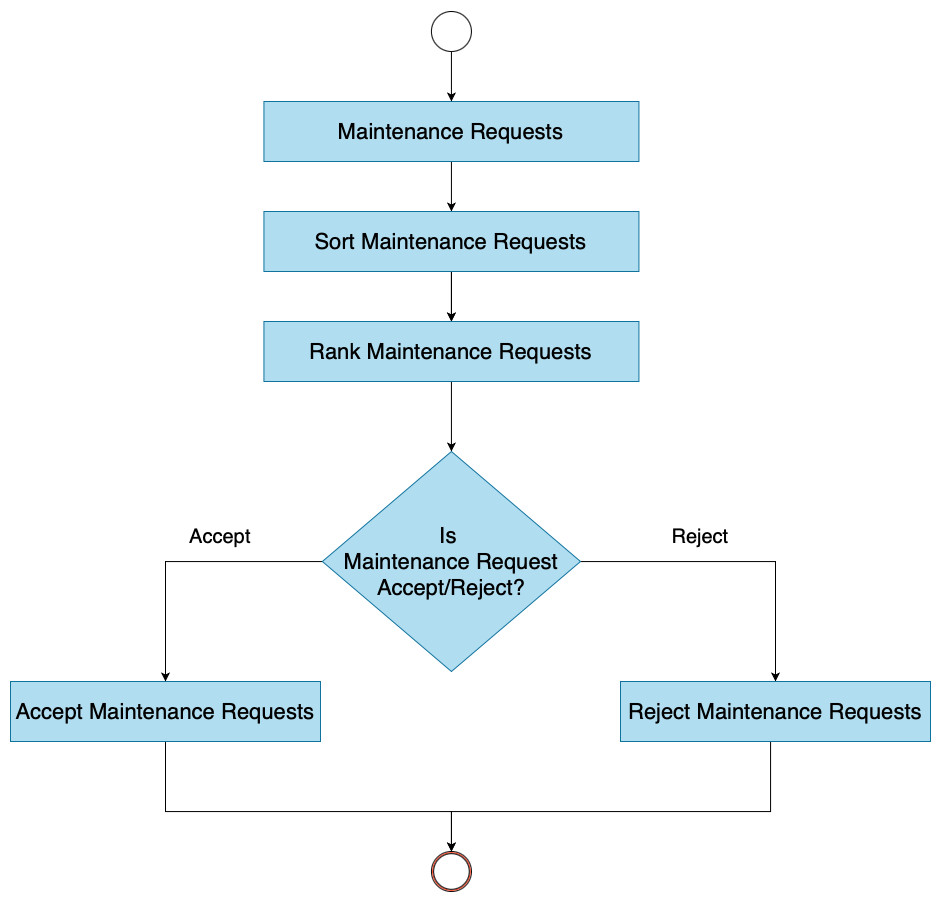
Figure 5: Workflow of decision tree.
Results
In this section, we present the results of applying DT to classification, divided into three subsections: sorting, ranking, and accepting/rejecting MRs.
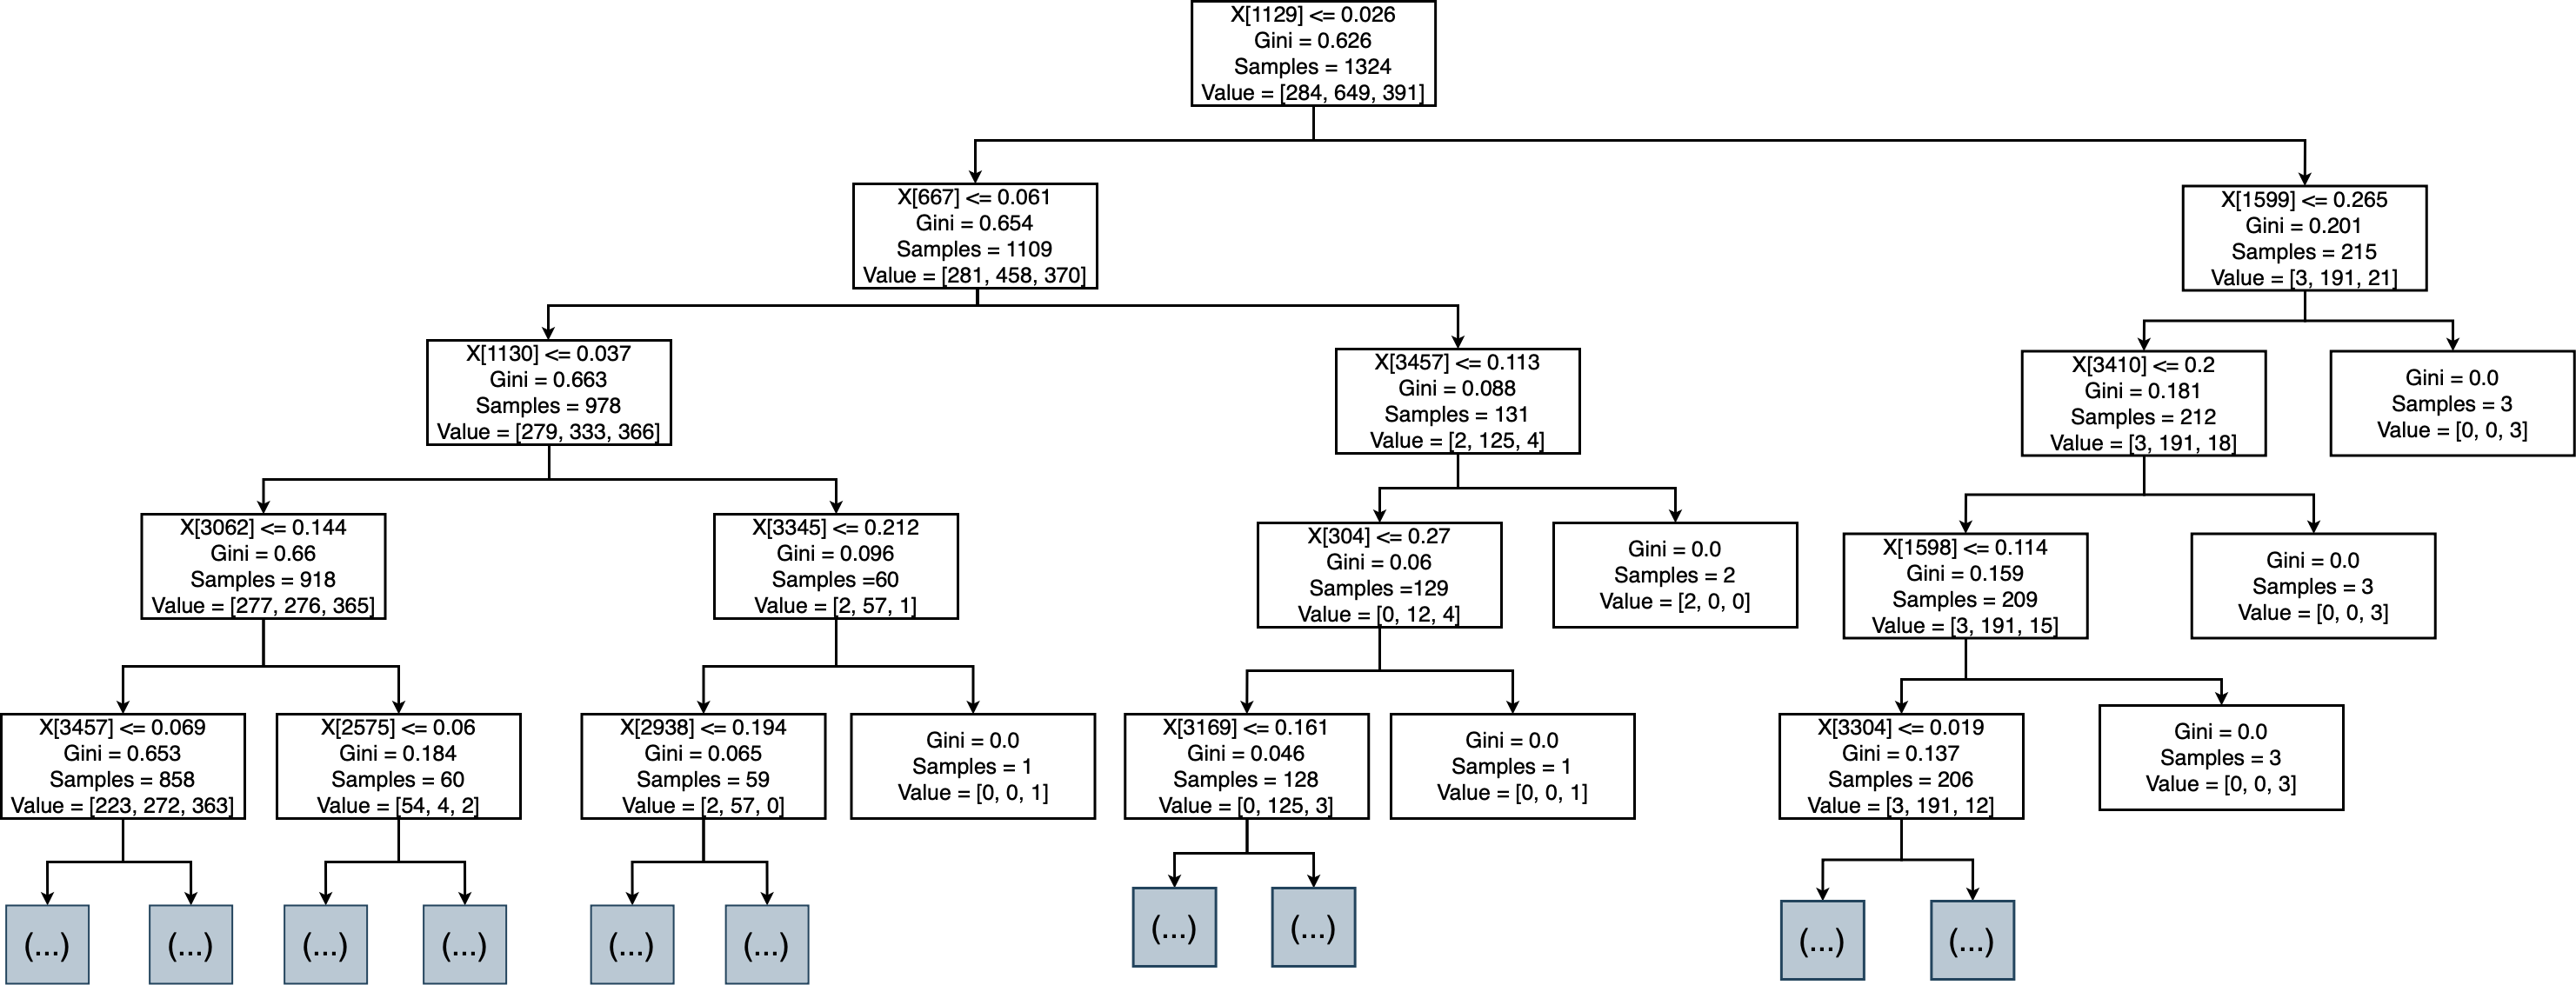
Result of sorting MRs
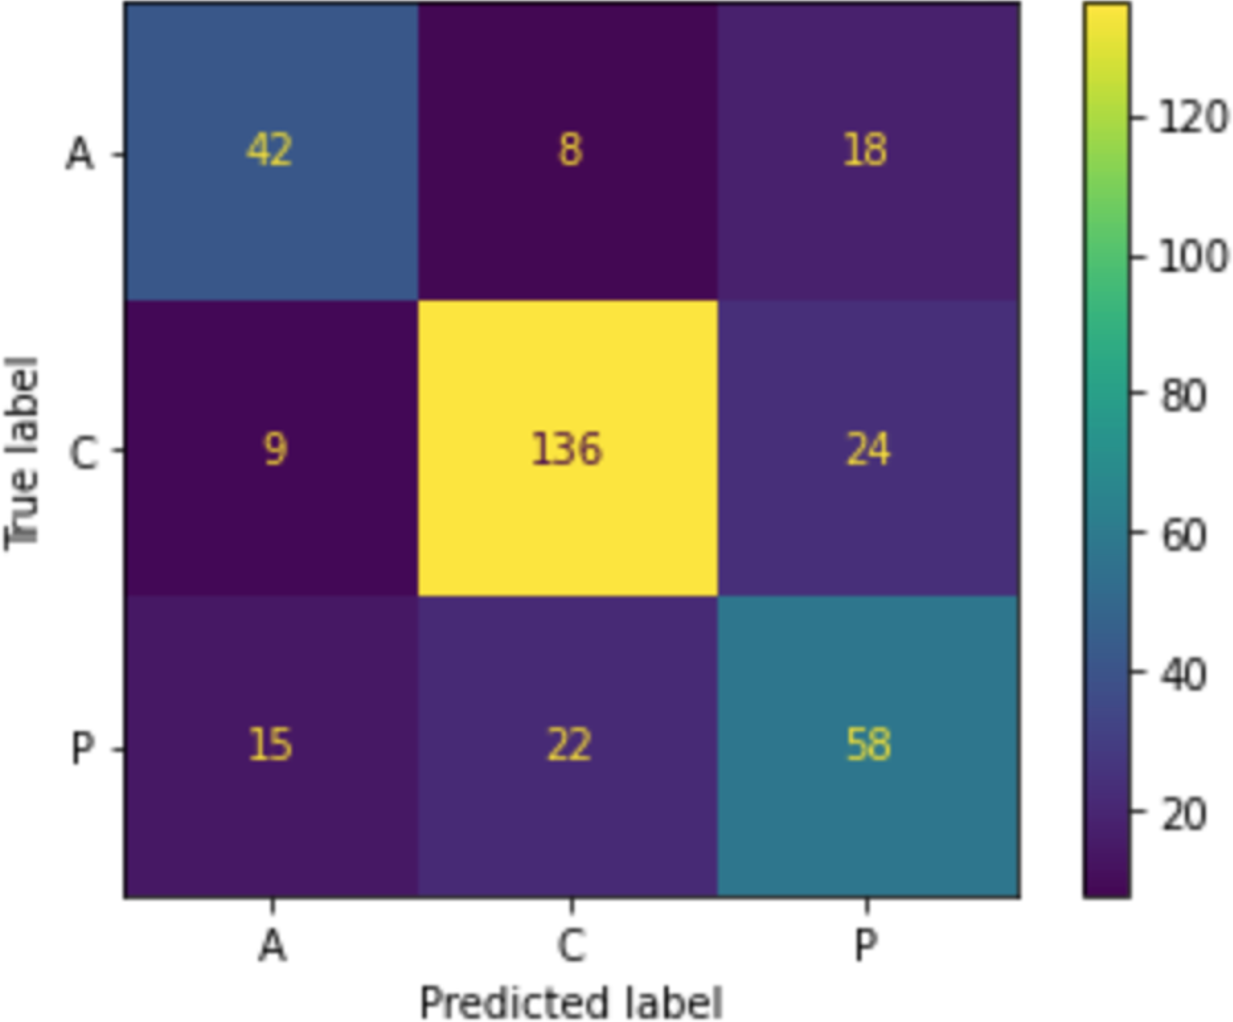
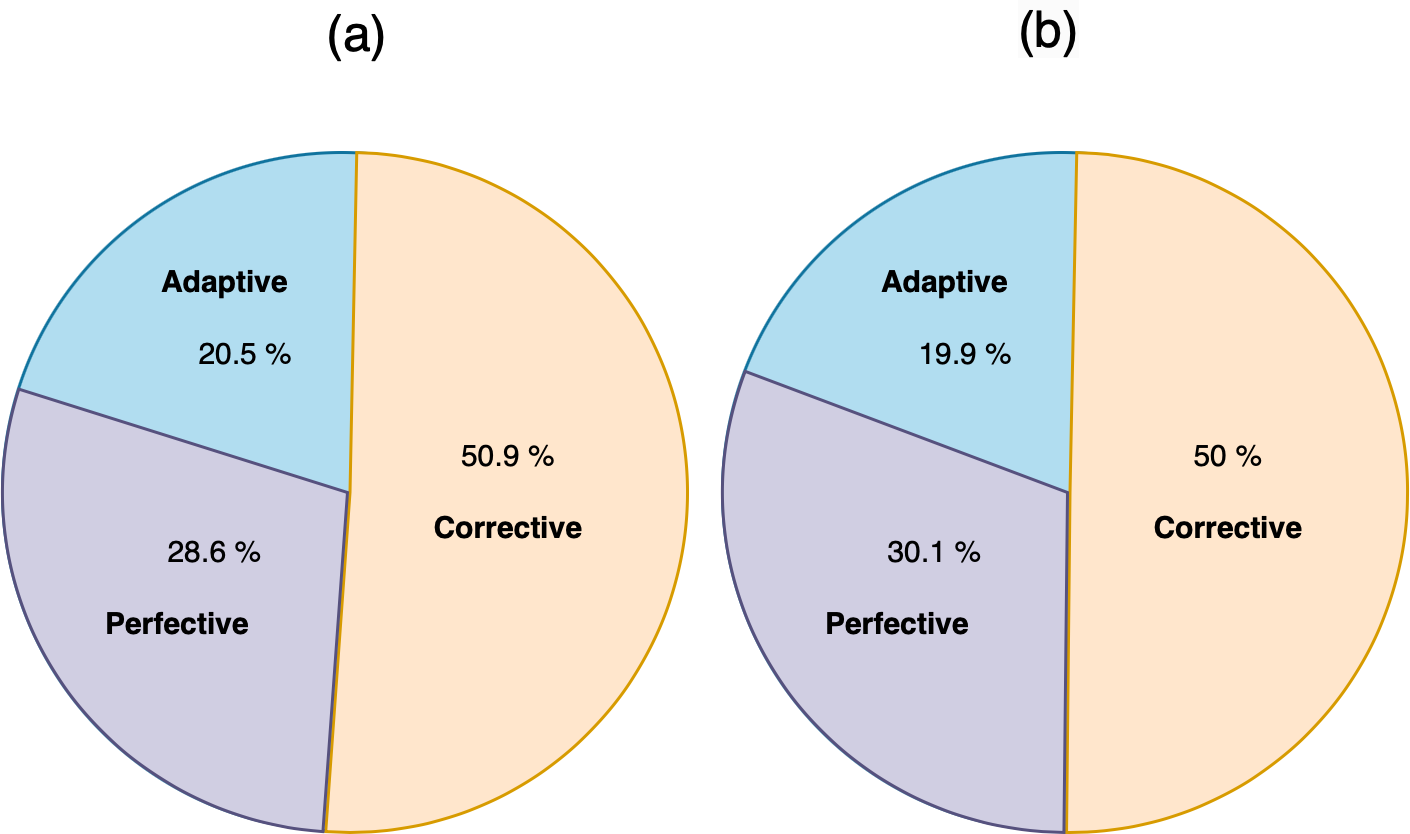
When we applied the DT to sort MRs, as shown in Fig. 6, the accuracy was 71.08%, precision was 71.1%, and recall was 71.1%. The confusion matrix of sorting MRs is represented in Fig. 7. By using actual and predicted values, we found that 42 MRs were correctly classified as adaptive, 136 as corrective, and 58 as perfective. The adaptive class represented 20.5% of the actual and 19.9% of the predicted classes, the perfective class represented 28.6% of the actual and 30.1% of the predicted classes, and the corrective class represented 50.9% of the actual and 50% of the predicted classes, as shown in Fig. 8.
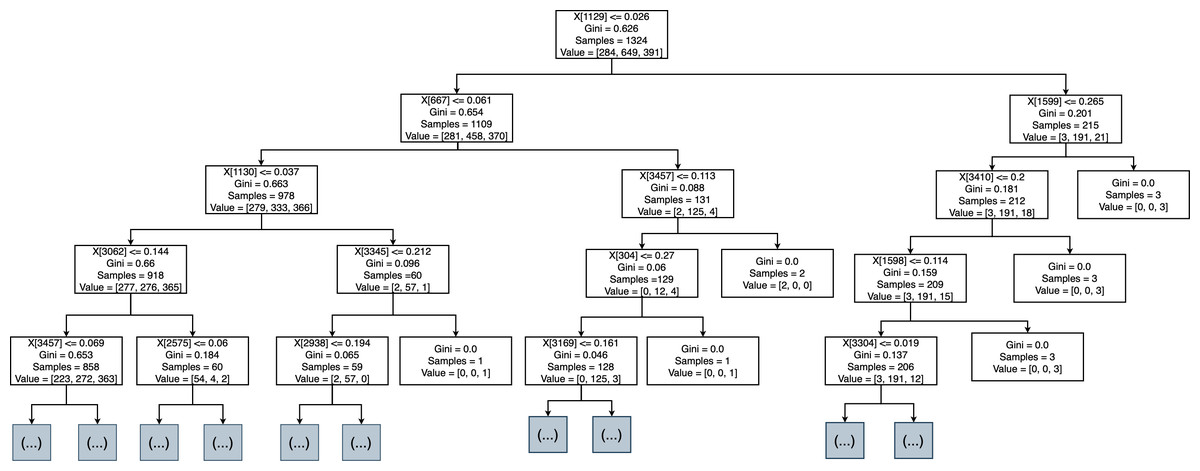
Figure 6: Decision tree of sort MR.
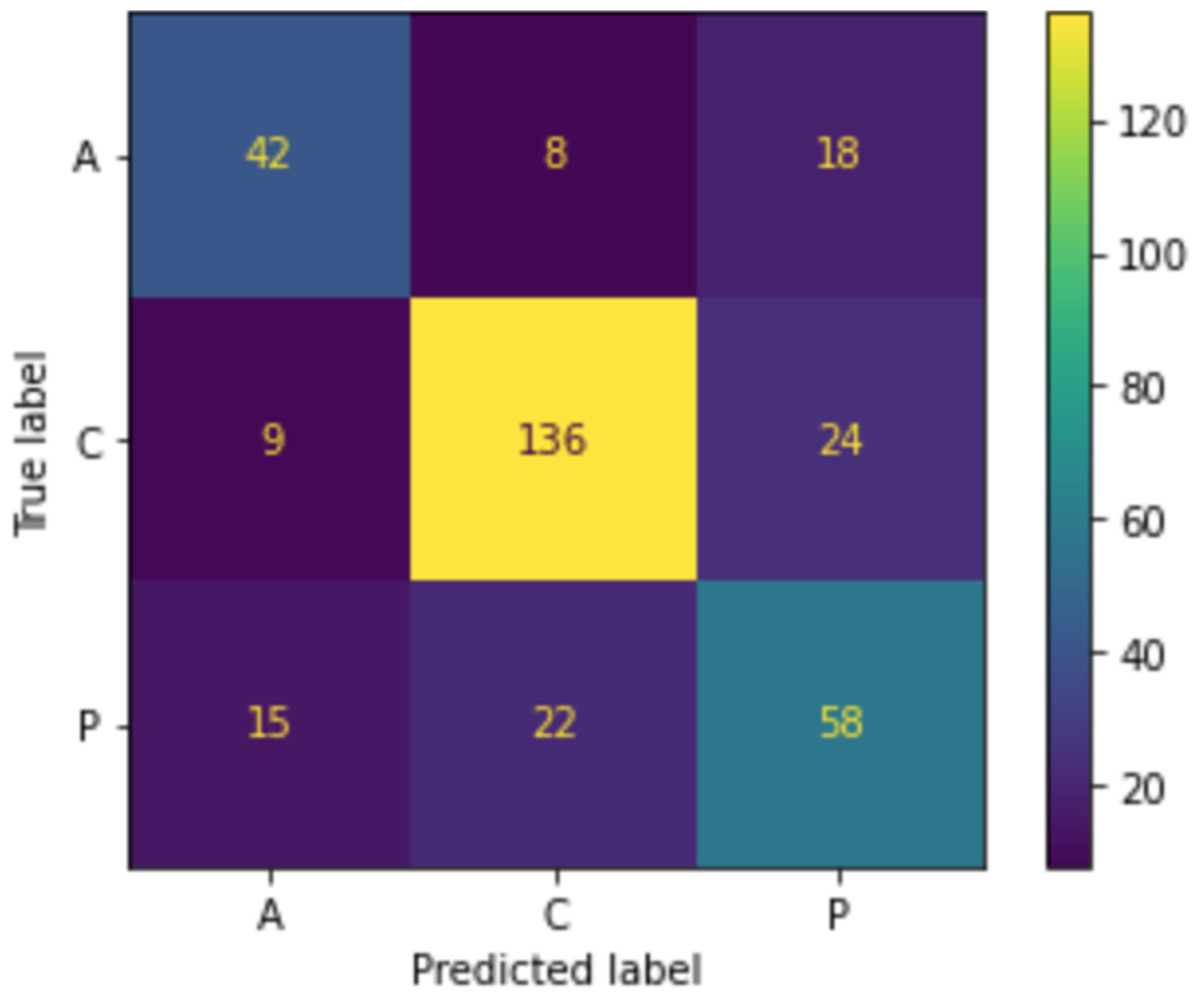
Figure 7: Confusion matrix of sorting MR.
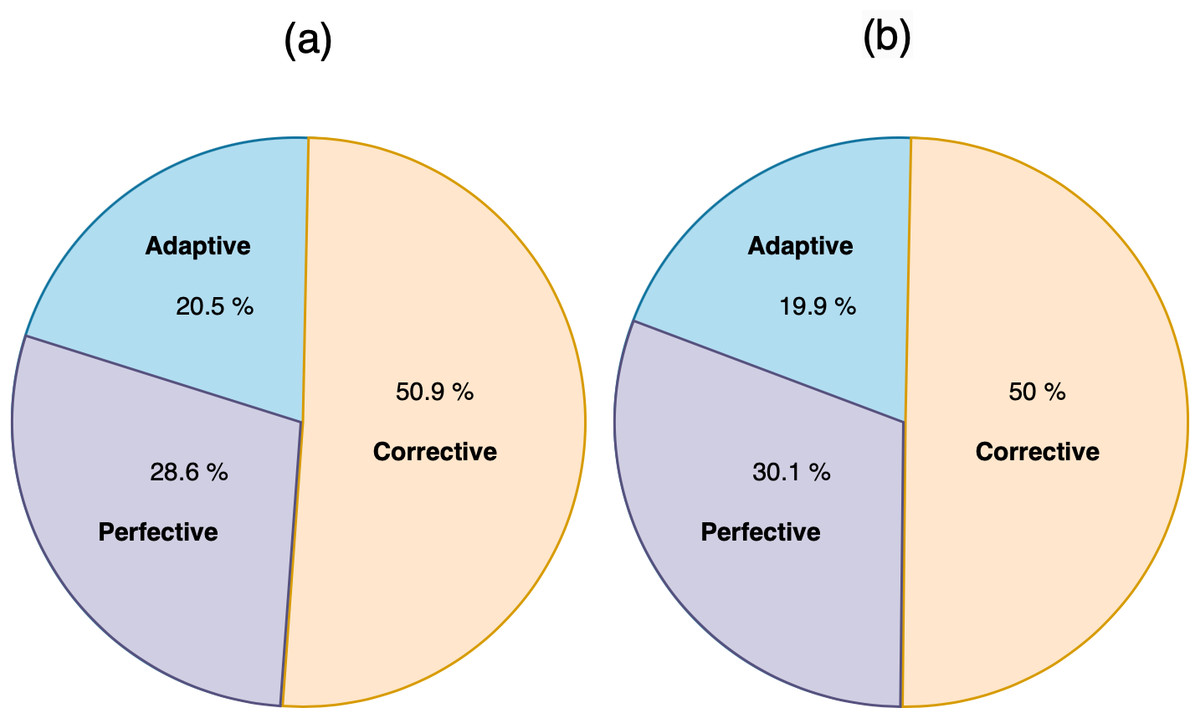
Figure 8: (A) The actual classes of sort MR. (B) The prediction classes of sort MR.
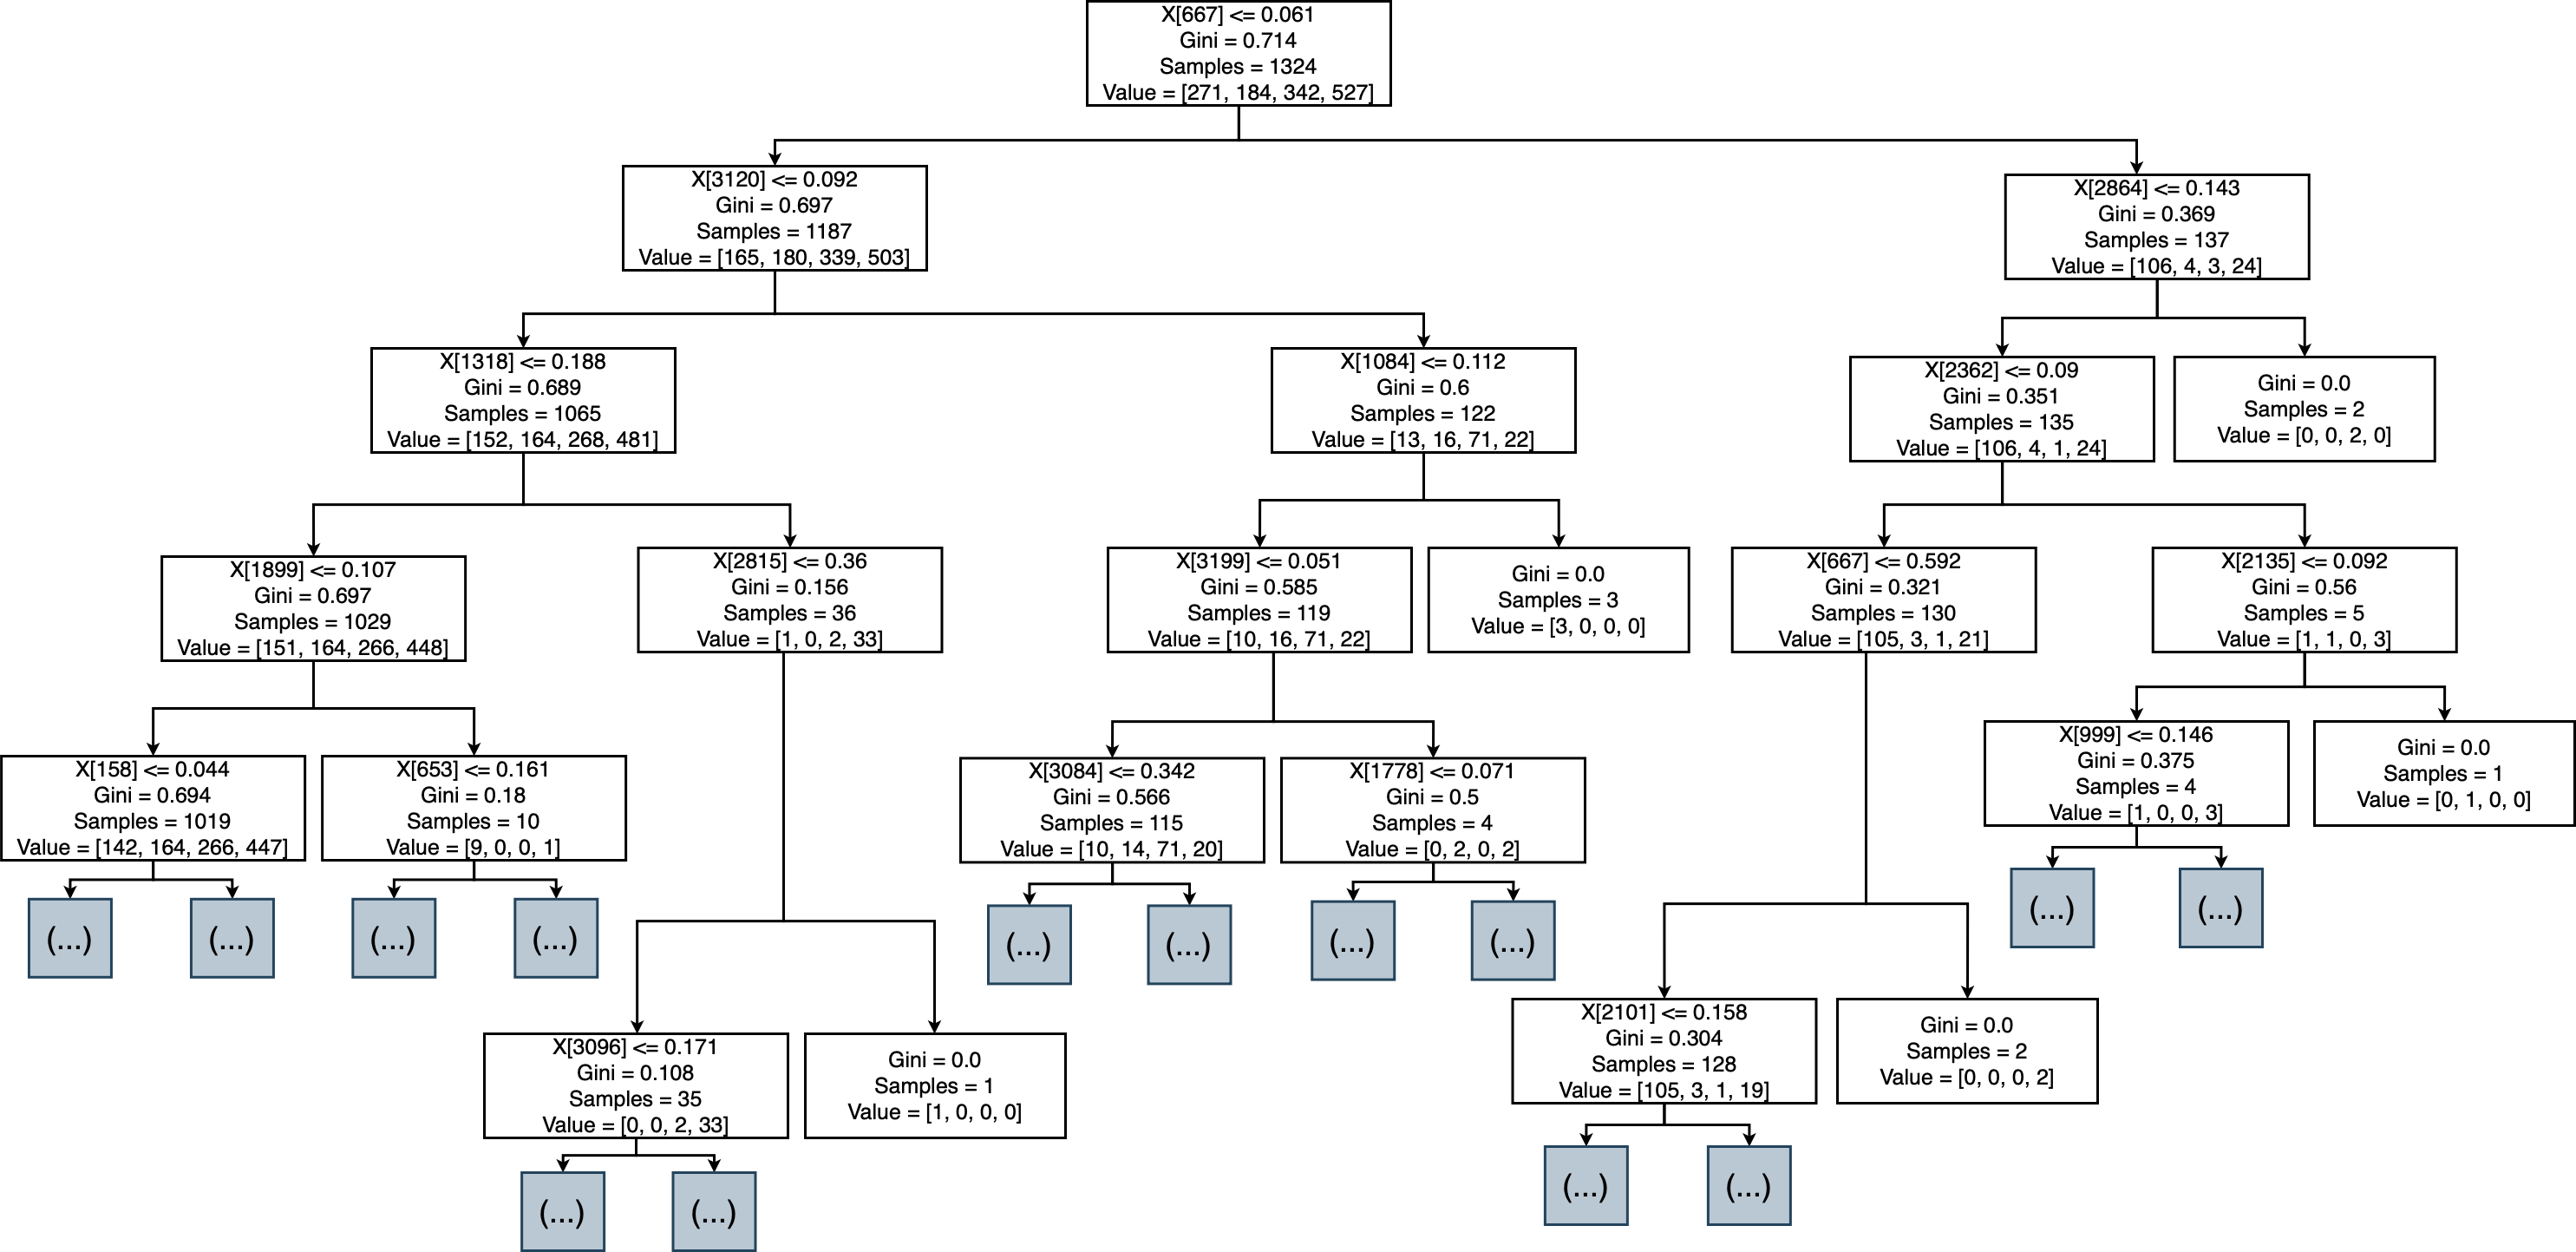
Result of ranking MRs
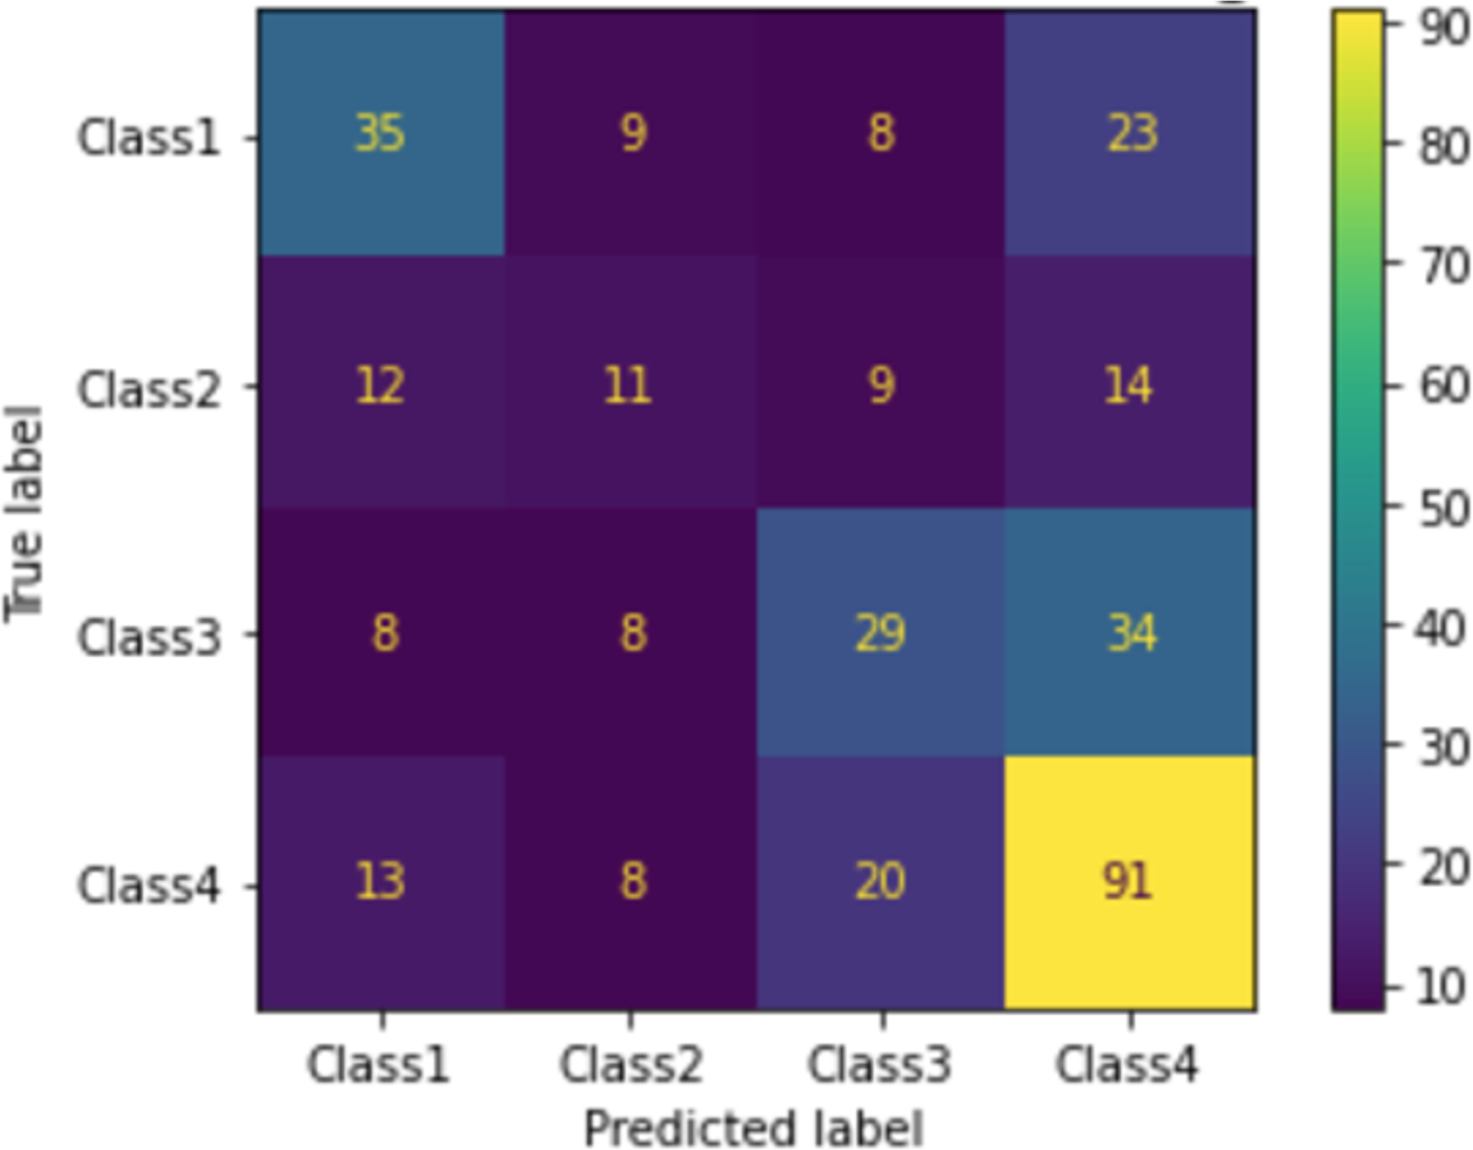
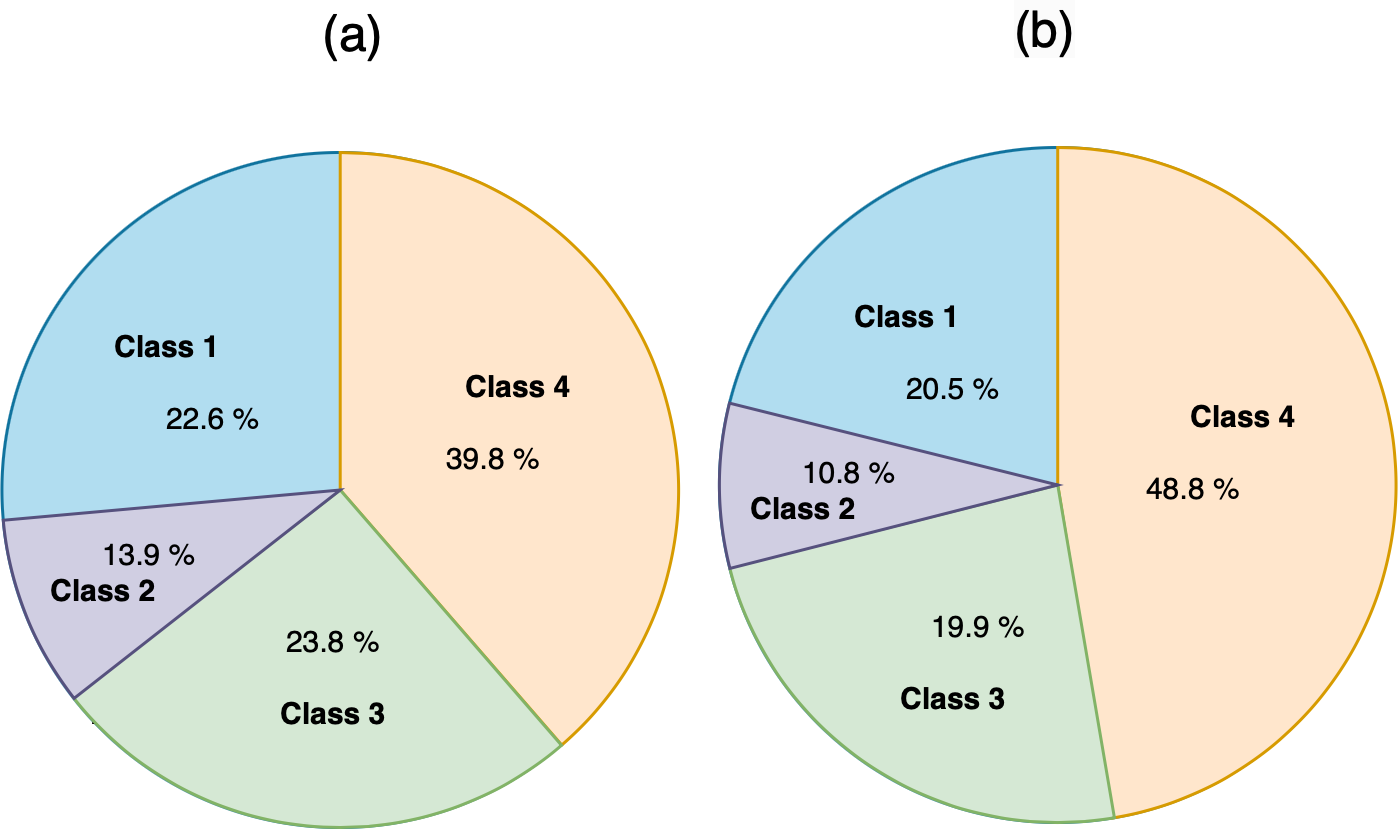
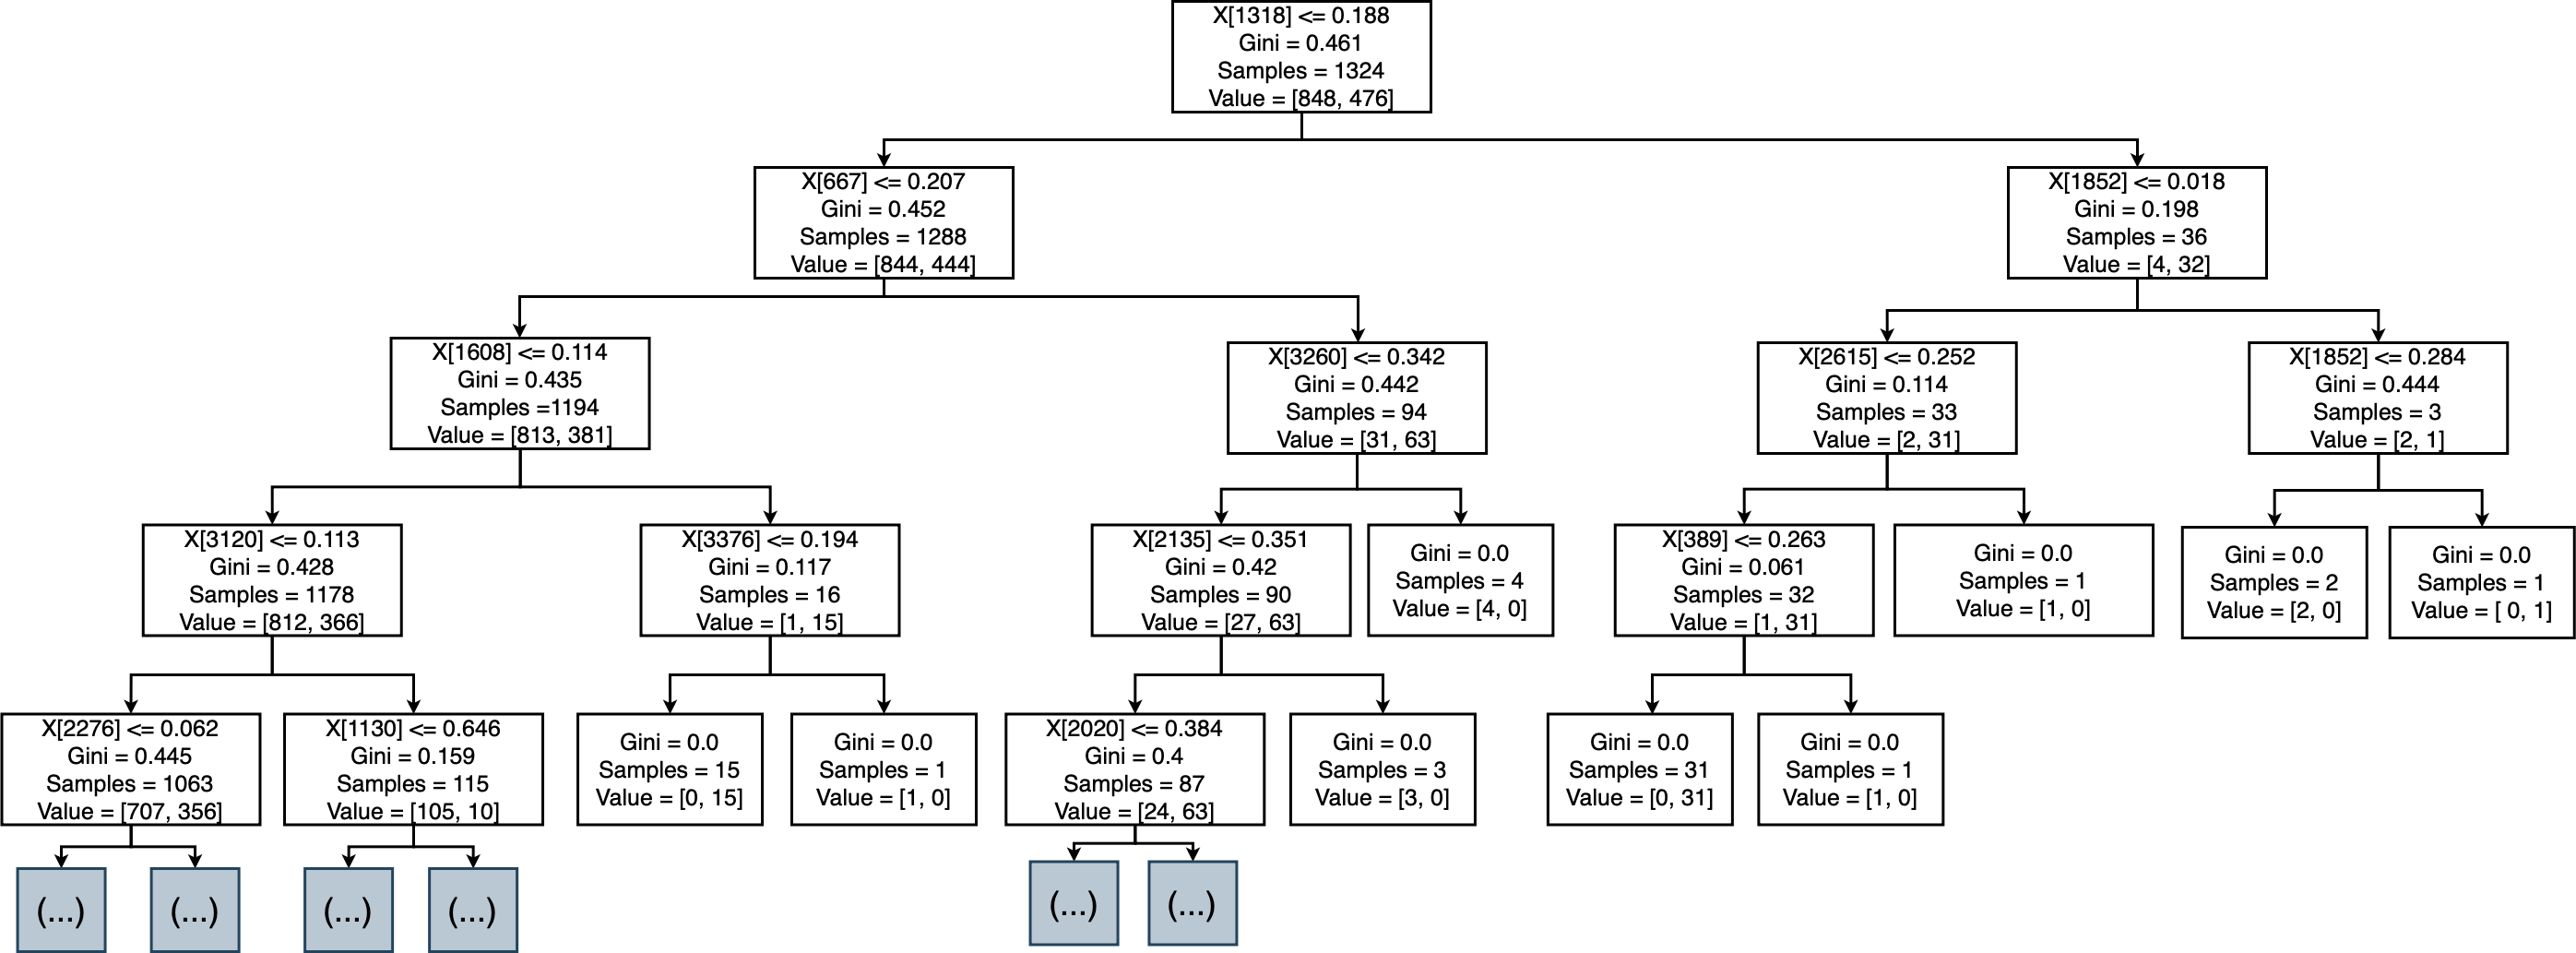
When we applied the DT to rank MRs, as shown in Fig. 9, the accuracy was 50%, precision was 50%, and recall was 50%. The confusion matrix of ranking MRs is shown in Fig. 10. Using actual and predicted values, we obtained 35 MRs correctly classified as class 1, 11 as class 2, 29 as class 3, and 91 as class 4. Class 1 represented 22.6% of actual and 20.5% of predicted classes, class 2 represented 13.9% of actual and 10.8% of predicted classes, class 3 represented 23.8% of actual and 19.9% of predicted classes, and class 4 represented 39.8% of actual and 48.8% of predicted classes, as shown in Fig. 11.
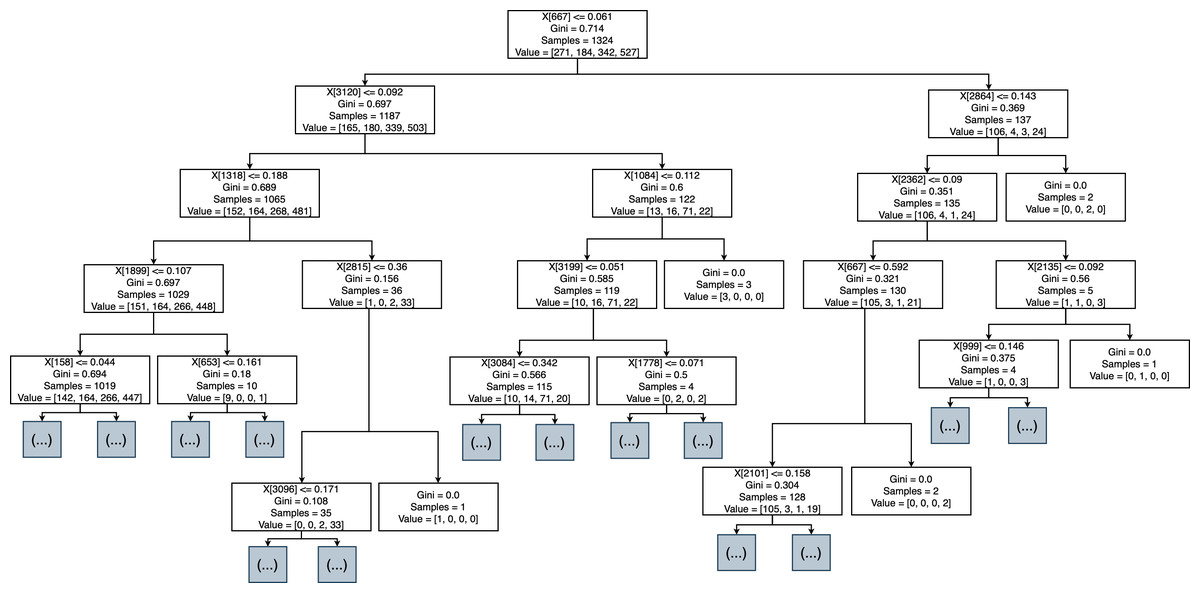
Figure 9: Decision tree of rank MR.
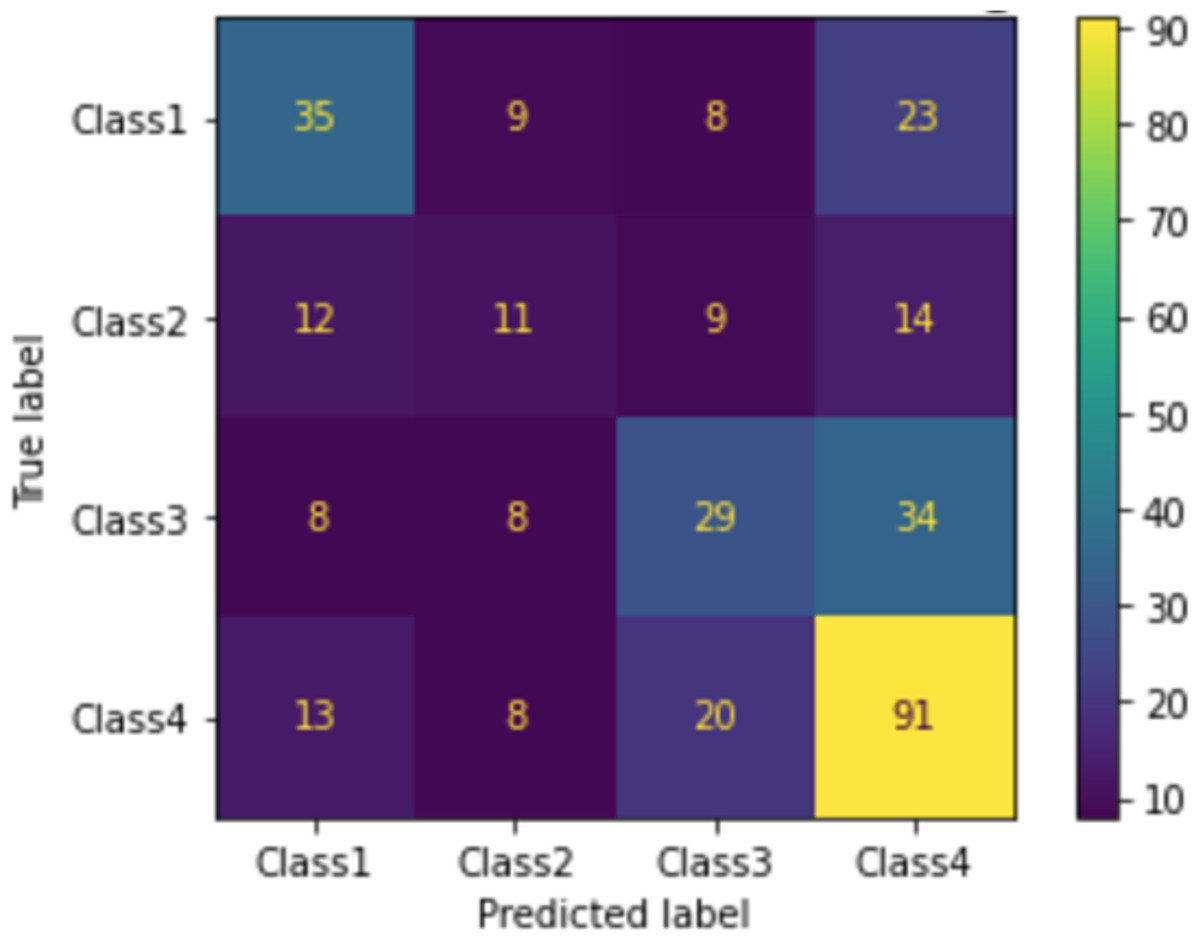
Figure 10: Confusion matrix of ranking MR.
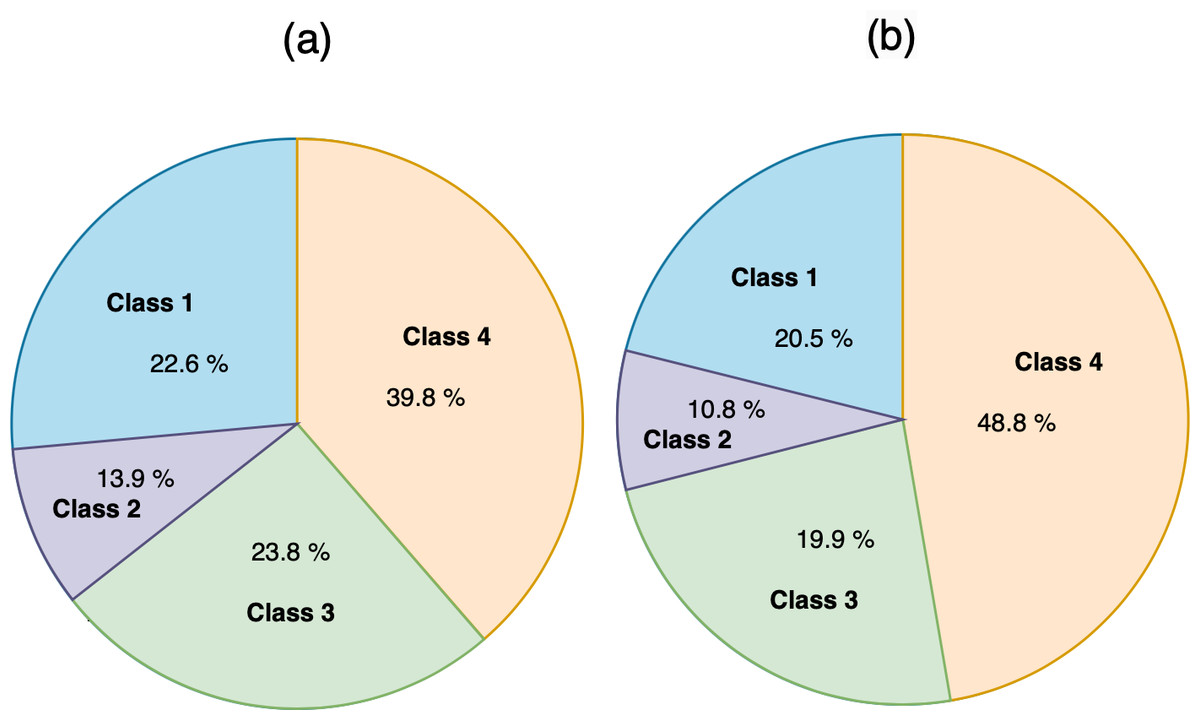
Figure 11: (A) The actual classes of rank MR. (B) The predicted classes of rank MR.
Result of accepting/rejecting MRs
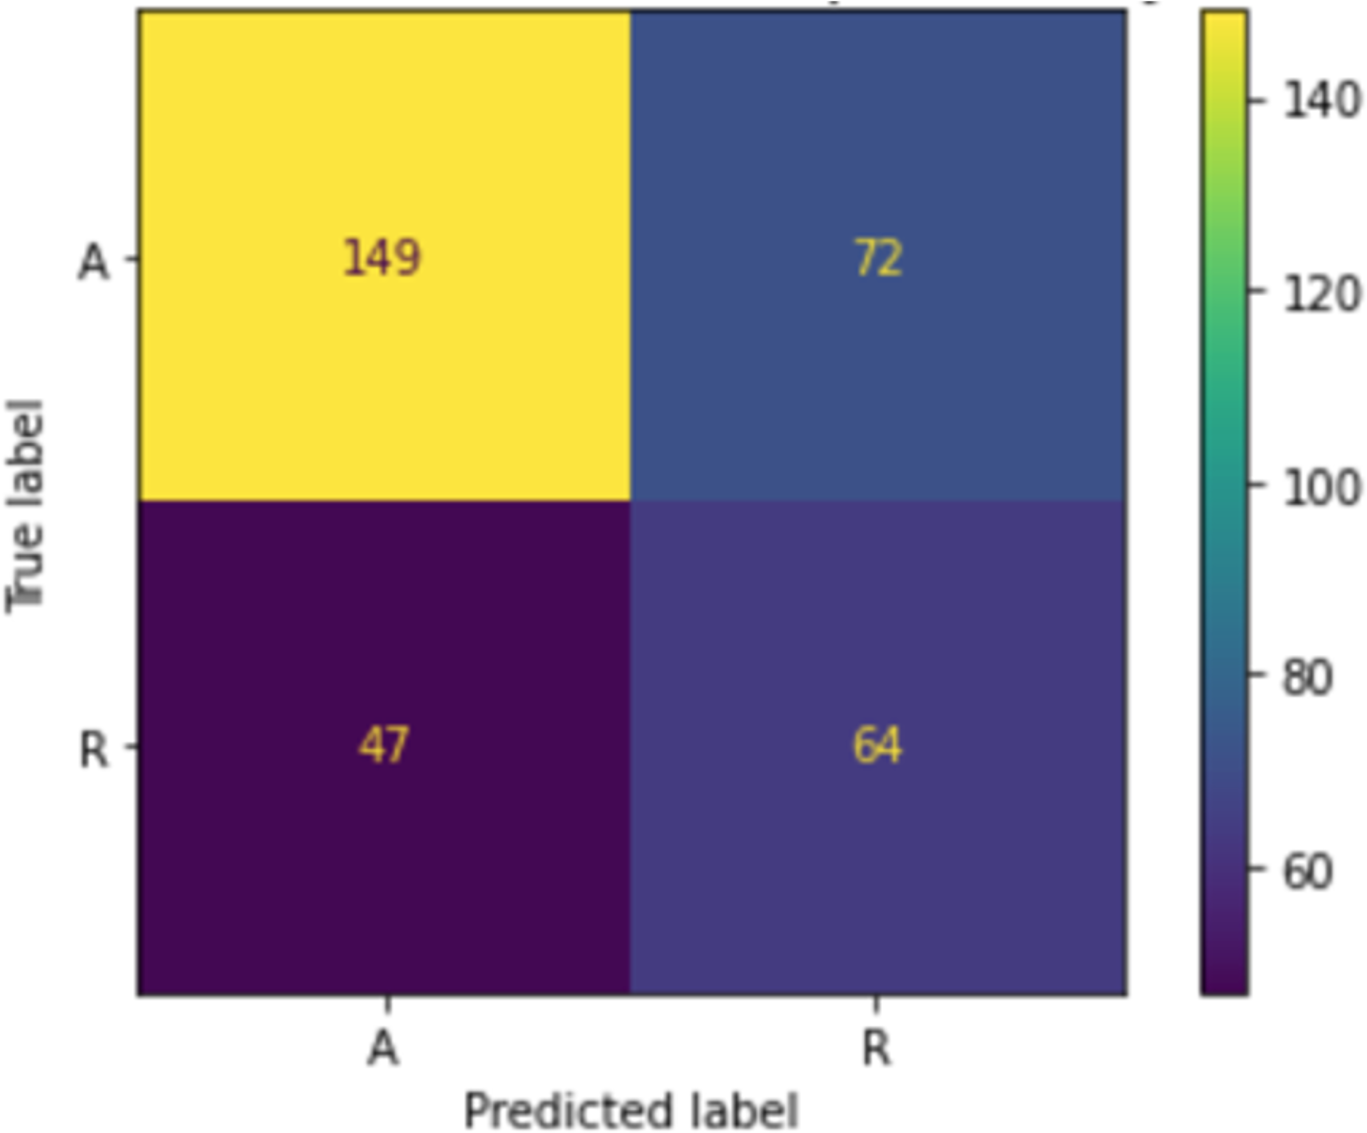
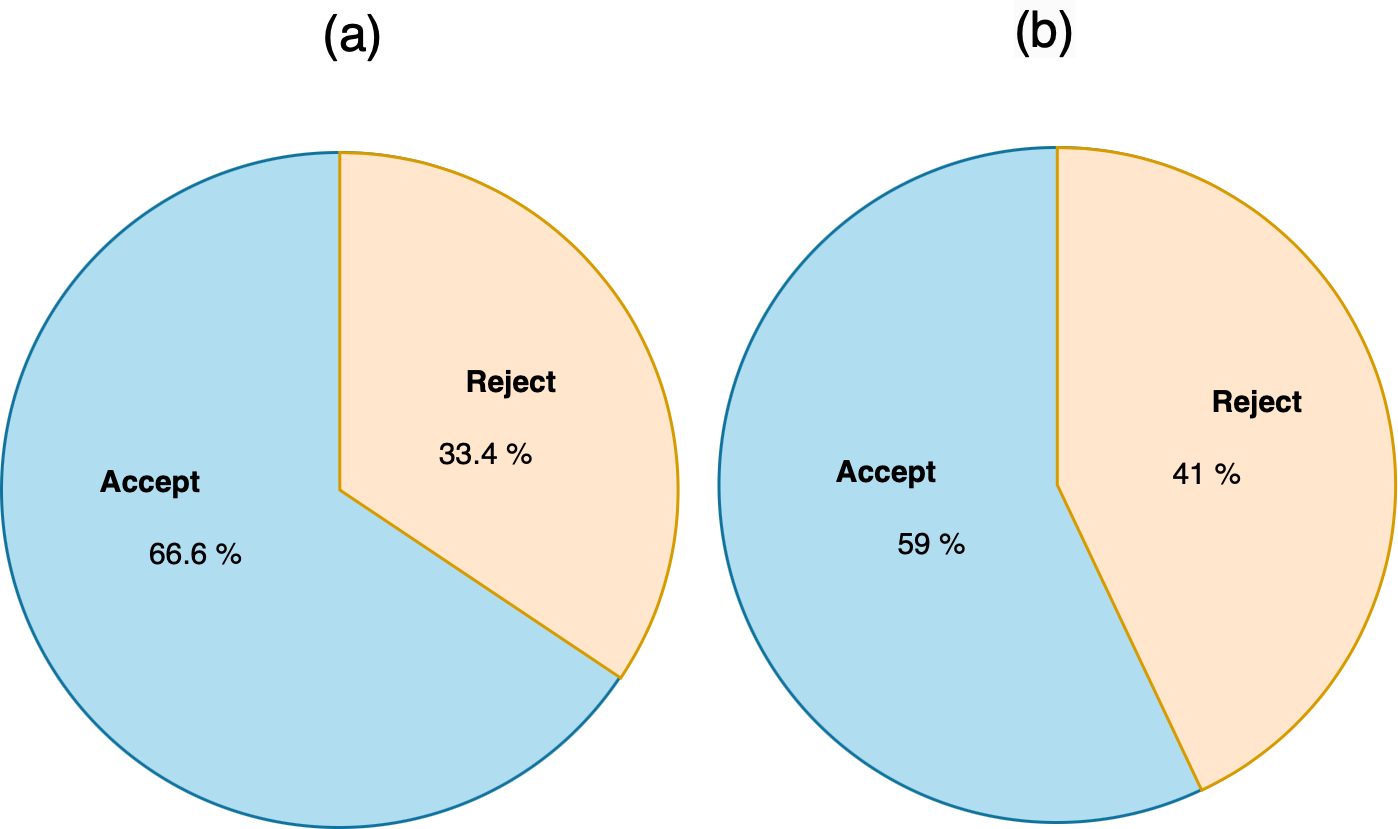
When we applied the DT to accept or reject MRs, as shown in Fig. 12, the accuracy was 64.15%, precision was 64.2%, and recall was 64.2%. The confusion matrix of accepting or rejecting MRs is shown in Fig. 13. By using actual and predicted values, we obtained 149 accepted MRs and 64 rejected MRs. The accepted MRs represented 66.6% of the actual and 59% of the predicted classes, while the rejected MRs represented 33.4% of the actual and 41% of the predicted classes, as shown in Fig. 14.
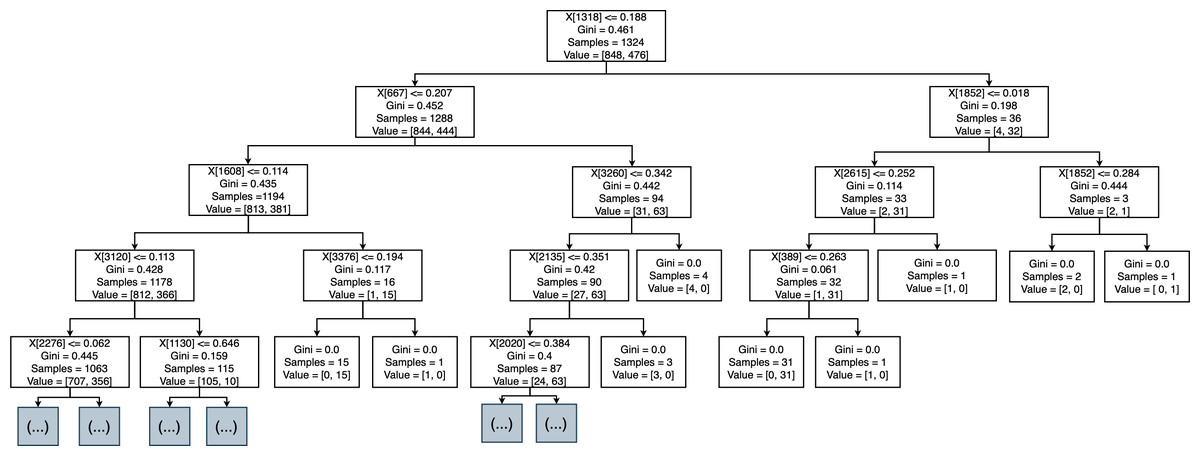
Figure 12: Decision tree of accept or reject MR.
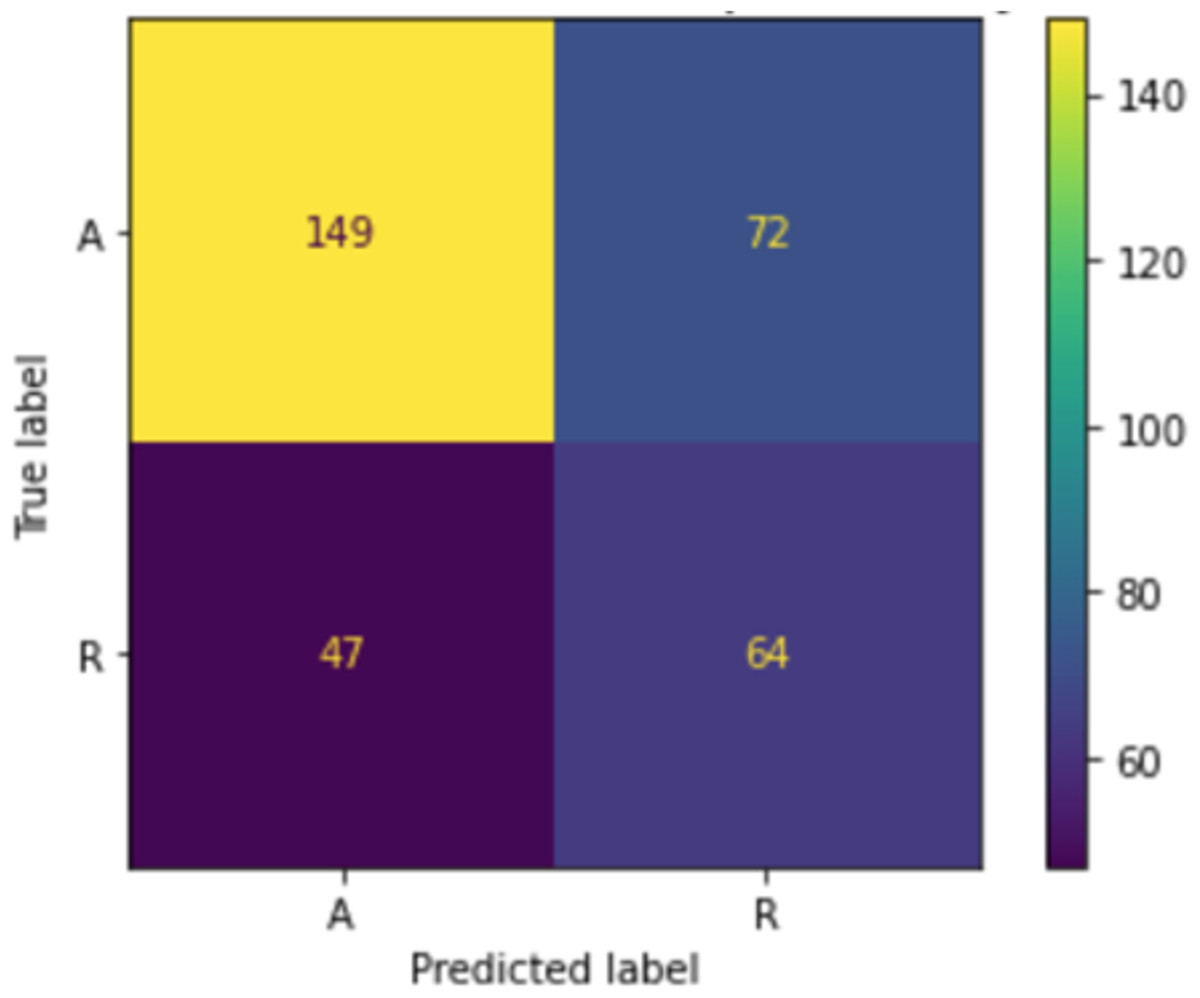
Figure 13: Confusion matrix of accepting or rejecting MR.
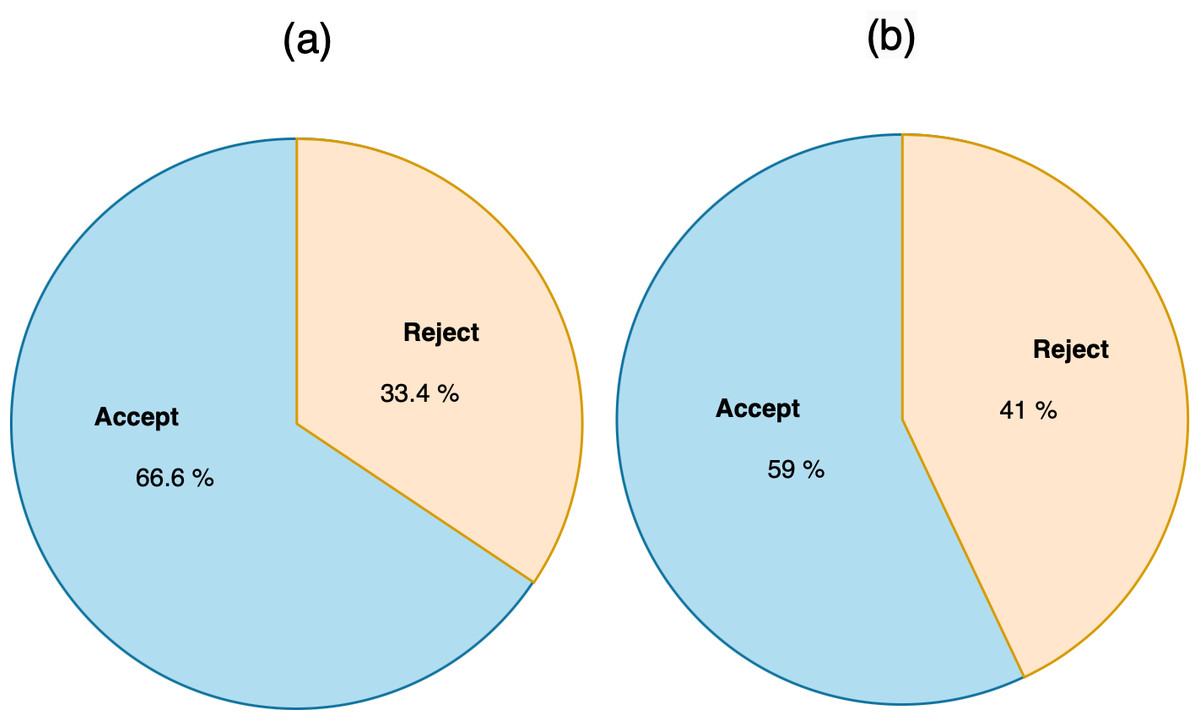
Figure 14: (A) The actual classes of accept reject MR. (B) The predicted classes of accept or reject MR.
Discussion
The purpose of this research was to evaluate the suitability and accuracy of the DT technique for automating the sorting, ranking, and acceptance/rejection of MRs. The experimental results indicate that DTs can be applied to sort and accept/reject MRs with acceptable accuracy, but their ranking accuracy is lower. The sorting accuracy was 71.08%, while the ranking accuracy was 50%, and the acceptance/rejection accuracy was 64.15%. In sorting MRs using DT, 236 out of 332 MRs were correctly classified, while the rest were incorrectly classified. In ranking MRs using DT, 166 out of 332 MRs were correctly classified, while the rest were incorrectly classified. In accepting/rejecting MRs using DT, 213 out of 332 MRs were correctly classified, while the rest were incorrectly classified.
Our research aligns with other studies, such as Srewuttanapitikul & Muengchaisri (2016), who found that DT accuracy is acceptable for sorting MRs in the classification phase. Previous studies have reported sorting accuracy ranging from 63% to 88.78% (Ahmed, Bawany & Shamsi, 2021). Comparing our sorting accuracy of 71.08% with Levin & Yehudai (2017), who reported 76% accuracy and 63% kappa accuracy, shows that our results are within an acceptable range. However, the ranking accuracy in our study is lower than previous studies, which reported accuracy between 70% and 90.43% (Ahmed, Bawany & Shamsi, 2021; Srewuttanapitikul & Muengchaisri, 2016). The acceptance/rejection accuracy in our study is 64.15%, lower than the reported accuracy of 77.90% to 90.56% in previous studies (Nizamani et al., 2018; Umer, Liu & Sultan, 2019; Cheng et al., 2021).
The lower ranking accuracy might be due to the characteristics of the training dataset, which significantly influence the classification results. The performance of DTs decreases with an increase in the number of features and categories (Pal & Mather, 2003). Our study’s weaknesses include the broad scope of the dataset, which spans different applications. Applying the model to a specific application might yield more accurate results. Future studies should consider additional factors influencing the acceptance/rejection of MRs, such as resources, costs, and time.
Conclusions
This study aimed to evaluate the suitability and accuracy of DTs for automating the classification phases of software maintenance. Our results indicate that DTs can effectively automate sorting and acceptance/rejection of MRs, though the ranking accuracy is lower. In our research, we processed and classified 1,656 MRs using the TF-IDF feature extraction technique and applied DTs for sorting, ranking, and acceptance/rejection. The sorting and acceptance/rejection accuracies were acceptable, but the ranking accuracy was inadequate. Future research should extend the study to include preventive maintenance, explore different techniques for classification, and consider additional factors such as budget, resources, and time for acceptance/rejection. Moreover, applying the research to other languages, such as Arabic, could be beneficial.