

How are topics born? Understanding the research dynamics preceding the emergence of new areas
- Published
- Accepted
- Received
- Academic Editor
- Filippo Menczer
- Subject Areas
- Artificial Intelligence, Data Science, Digital Libraries
- Keywords
- Scholarly data, Topic emergence detection, Empirical study, Research trend detection, Topic discovery, Digital libraries
- Copyright
- © 2017 Salatino et al.
- Licence
- This is an open access article distributed under the terms of the Creative Commons Attribution License, which permits unrestricted use, distribution, reproduction and adaptation in any medium and for any purpose provided that it is properly attributed. For attribution, the original author(s), title, publication source (PeerJ Computer Science) and either DOI or URL of the article must be cited.
- Cite this article
- 2017. How are topics born? Understanding the research dynamics preceding the emergence of new areas. PeerJ Computer Science 3:e119 https://doi.org/10.7717/peerj-cs.119
Abstract
The ability to promptly recognise new research trends is strategic for many stakeholders, including universities, institutional funding bodies, academic publishers and companies. While the literature describes several approaches which aim to identify the emergence of new research topics early in their lifecycle, these rely on the assumption that the topic in question is already associated with a number of publications and consistently referred to by a community of researchers. Hence, detecting the emergence of a new research area at an embryonic stage, i.e., before the topic has been consistently labelled by a community of researchers and associated with a number of publications, is still an open challenge. In this paper, we begin to address this challenge by performing a study of the dynamics preceding the creation of new topics. This study indicates that the emergence of a new topic is anticipated by a significant increase in the pace of collaboration between relevant research areas, which can be seen as the ‘parents’ of the new topic. These initial findings (i) confirm our hypothesis that it is possible in principle to detect the emergence of a new topic at the embryonic stage, (ii) provide new empirical evidence supporting relevant theories in Philosophy of Science, and also (iii) suggest that new topics tend to emerge in an environment in which weakly interconnected research areas begin to cross-fertilise.
Introduction
Early awareness of the emergence of new research topics can bring significant benefits to anybody involved in the research environment. Academic publishers and editors can exploit this knowledge and offer the most up to date and interesting contents. Researchers may not only be interested in new trends related to their areas but may also find it very useful to be alerted about significant new research developments in general. Institutional funding bodies and companies also need to be regularly updated on how the research landscape is evolving, so that they can make early decisions about critical investments. Considering the growth rate of research publications (Larsen & Von Ins, 2010), keeping up with novel trends is a challenge even for expert researchers. Traditional methods, such as the manual exploration of publications in significant conferences and journals, are no longer viable. This has led to the emergence of several approaches capable of detecting novel topics and research trends (Bolelli, Ertekin & Giles, 2009; Duvvuru, Kamarthi & Sultornsanee, 2012; He et al., 2009; Wu, Venkatramanan & Chiu, 2016). However, all of these approaches focus on topics that are already associated with a number of publications and consistently referred to by a community of researchers. This limitation hinders the ability of stakeholders to anticipate and react promptly to new developments in the research landscape.
Hence, there is a need for novel methods capable of identifying the appearance of new topics at a very early stage, assessing their potential and forecasting their trajectory. To this end, we need first to achieve a better understanding of the dynamics underlying the creation of new topics and then investigate whether such understanding can be exploited to develop computationally effective methods, which are capable of detecting the emergence of new topics at a very early stage.
The field of Philosophy of Science offers a number of interesting theories about the emergence of new topics Kuhn (2012) theorised that science evolves through paradigm shifts. According to him, scientific work is performed within a set of paradigms and when these paradigms cannot cope with certain problems, there is a paradigm shift that can lead to the emergence of a new scientific discipline. This happens often through the creation of novel scientific collaborations. In this context, Becher & Trowler (2001) explained that, even if science proceeds towards more specific disciplines, and thus researchers in different communities become less compatible, they are still inclined to collaborate for mutual benefit. Herrera, Roberts & Gulbahce (2010), Sun et al. (2013) and Nowotny, Scott & Gibbons (2013) suggested that the development of new topics is encouraged by the cross-fertilisation of established research areas and recognised that multidisciplinary approaches foster new developments and innovative thinking. Sun et al. (2013) and Osborne, Scavo & Motta (2014) provided empirical evidence to these theories by analysing the social dynamics of researchers and their effects on the formation and life-cycle of research communities and topics.
According to these theories, when a new scientific area emerges, it goes through two main phases. In the initial phase a group of scientists agree on some basic tenets, build a conceptual framework and begin to establish a new scientific community. Afterwards, the area enters a recognised phase, in which a substantial number of authors become active in the area, producing and disseminating results (Couvalis, 1997).
Inspired by these theories, we hypothesize the existence of an even earlier phase, which we name embryonic phase, in which a topic has not yet been explicitly labelled and recognized by a research community, but it is already taking shape, as evidenced by the fact that researchers from a variety of fields are forming new collaborations and producing new work, starting to define the challenges and the paradigms associated with the emerging new area.
We also hypothesize that it could be possible to detect topics at this stage by analysing the dynamics of already established topics. In this context, we use the term dynamics to refer to the significant trends associated with a topic, including the interactions between topics and those between entities linked to these topics, such as publications, authors, venues. For example, the sudden appearance of some publications concerning a combination of previously uncorrelated topics may suggest that some pioneer researchers are investigating new possibilities and maybe shaping a new emerging area. In the same way, as pointed out by Salatino (2015), we can hypothesize a wide array of relevant patterns of activity, which could anticipate the creation of a new research area. These may include a new collaboration between two or more research communities (Osborne, Scavo & Motta, 2014), the creation of interdisciplinary workshops, a rise in the number of experts working on a certain combination of topics, a significant change in the vocabulary associated with relevant topics (Cano Basave, Osborne & Salatino, 2016), and so on.
In this paper we present a study that aims to uncover key elements associated with the research dynamics preceding the creation of novel topics, thus providing initial evidence to support our hypotheses. In particular, our study provides evidence that the emergence of a novel research topic can be anticipated by a significant increase in the pace of collaboration between relevant research areas, which can be seen as the ‘parents’ of the new topic.
Our study was performed on a sample of three million publications in the 2000–2010 interval. It was conducted by comparing the sections of the co-occurrence graphs where new topics are about to emerge with a control group of subgraphs associated with established topics. These graphs were analysed by using two novel approaches that integrate both statistics and semantics. We found that the pace of collaboration and the density measured in the sections of the network that will give rise to a new topic are significantly higher than those in the control group. These findings support our hypothesis about the existence of an embryonic phase and also yield new empirical evidence consistent with the aforementioned theories in Philosophy of Science. In addition, the identified dynamics could be used as the starting point for developing new automatic methods, which could detect the emergence of a new research topic well before this becomes explicitly recognised and established.
The study presented in this paper is an extension of the work by Salatino & Motta (2016). The new contributions of this paper are: (1) a larger sample including 75 debutant topics and 100 established ones, (2) a new technique for measuring the density of the topic graph, (3) a more exhaustive statistical analysis, including a comparison of the different approaches, (4) a revised state of the art, and (5) a more comprehensive discussion of the findings.
The rest of the paper is organized as follows. We first review the literature regarding the early detection of topics, pointing out the existing gaps. We then describe the experimental approach used for the study, present the results and discuss their implications. Finally, we summarize the main conclusions and outline future directions of research.
Related Work
Topic detection and tracking is a task that has drawn much attention in recent years and has been applied to a variety of scenarios, such as social networks (Cataldi, Di Caro & Schifanella, 2010; Mathioudakis & Koudas, 2010), blogs (Gruhl et al., 2004; Oka, Abe & Kato, 2006), emails (Morinaga & Yamanishi, 2004) and scientific literature (Bolelli, Ertekin & Giles, 2009; Decker et al., 2007; Erten et al., 2004; Lv et al., 2011; Osborne, Scavo & Motta, 2014; Sun, Ding & Lin, 2016; Tseng et al., 2009).
The literature presents several works on research trend detection, which can be characterised either by the way they define a topic or the techniques they use detect it (Salatino (2015). Blei, Ng & Jordan, (2003) have developed the well-known Latent Dirichlet Allocation (LDA), an unsupervised learning method to extract topics from a corpus, which models topics as a multinomial distribution over words. Since its introduction, LDA has been extended and adapted to several applications. For example, Blei & Lafferty (2006) have introduced the Correlated Topic Model using the logistic normal distribution instead of the Dirichlet one, to address the issue that LDA fails to model correlations between topics. Griffiths et al. (2004) have developed the hierarchical LDA, where topics are grouped together in a hierarchy. Further extensions incorporate other kinds of research metadata. For example, Rosen-Zvi et al. (2004) present the Author-Topic Model (ATM), which includes authorship information and associates each topic to a multinomial distribution over words and each author to a multinomial distribution over topics. Bolelli, Ertekin & Giles (2009) introduce the Segmented Author-Topic model which extends ATM by adding the temporal ordering of documents to address the problem of topic evolution. In addition, Chang & Blei (2010) have developed the relational topic model which combines LDA and the network structure of documents to model topics. Similarly, He et al. (2009) have combined LDA and citation networks in order to address the problem of topic evolution. Their approach detects topics in independent subsets of a corpus and leverages citations to connect topics in different time frames. In a similar way, Morinaga & Yamanishi (2004) employ a probabilistic model called Finite Mixture Model to represent the structure of topics and analyse the changes in time of the extracted components to track emerging topics. However, their evaluation rests on an email corpus, thus it is not clear how it would perform on scientific corpus. A general issue affecting this kind of approaches is that it is not always easy to associate clearly identifiable research areas to the resulting topic models.
In addition to LDA, the Natural Language Processing (NLP) community have proposed a variety of tools for identifying topics. For example, Chavalarias & Cointet (2013) used CorText Manager to extract a list of 2000 n-grams representing the most salient terms from a corpus and derived a co-occurrence matrix on which they performed clustering analysis to discover patterns in the evolution of science Jo, Lagoze & Giles (2007) developed an approach that correlates the distribution of terms extracted from a text with the distribution of the citation graphs related to publications containing these terms. Their work assumes that if a term is relevant to a topic, documents containing that term will have a stronger connection than randomly selected ones. This approach is not suitable for topics in their very early stage since it takes time for the citation network of a term to become tightly connected.
Duvvuru et al. (2013) have analysed the network of co-occurring keywords in a scholarly corpus and monitored the evolution in time of the link weights, to detect research trends and emerging research areas. However, as Osborne & Motta (2012) pointed out, keywords tend to be noisy and do not always represent research topics—in many cases different keywords even refer to the same topic. For example, Osborne, Scavo & Motta (2014) showed that a semantic characterisation of research topics yields better results than keywords for the detection of research communities. To cope with this problem, some approaches rely on taxonomies of topics. For example, Decker et al. (2007) matched a corpus of research papers to a taxonomy of topics based on the most significant words found in titles and abstracts, and analysed the changes in the number of publications associated with such topics. Similarly, Erten et al. (2004) adopted the ACM Digital Library taxonomy for analysing the evolution of topic graphs and monitoring research trends. However, human crafted taxonomies tend to evolve slowly and, in a fast-changing research field, such as Computer Science (Pham, Klamma & Jarke, 2011), it is important to rely on constantly updated taxonomies. For this reason, in our experiment we adopted an ontology of Computer Science automatically generated and regularly updated by the Klink-2 algorithm developed by Osborne & Motta (2015).
In brief, the literature comprises a wide collection of approaches for detecting research trends. However, they focus on already recognised topics, which are either already associated with recognized label or, in the case of probabilistic topics models, with a set of terms that have previously appeared in a good number of publications. Detecting research trends at an embryonic stage remains an open challenge.
Materials and Methods
The aim of this study was to measure the association between the emergence of a new topic and the increase of the pace of collaboration and density previously observed in the co-occurrence graphs of related topics. To this end, we represent topics and their relationships in a certain time frame as a graph in which nodes are topics and edges represent their co-occurrences in a sample of publications. This is a common representation for investigating topic dynamics (Boyack, Klavans & Börner, 2005; Leydesdorff, 2007; Newman, 2001). In the following we will refer to it as topic graph or topic network. We analysed 75 topics that debuted in the 2000–2010 period using 100 established topics as a control group.
In our previous work (Salatino & Motta, 2016), we conducted a similar analysis on a smaller sample. The sample analysed in this paper was selected by iteratively adding new topics until we reached data saturation (Fusch & Ness, 2015), i.e., the results of the analysis did not vary significantly with the inclusion of new data points.
In the following sections, we will describe the dataset, the semantically enhanced topic graph, and the methods used to measure the pace of collaboration and the density of the subgraphs.
The raw data and the results of this study are available at https://osf.io/bd8ex/.
Semantic enhanced topic network
We use as dataset the metadata describing three million papers in the field of Computer Science from a dump of the well-known Scopus dataset (https://www.elsevier.com/solutions/scopus). In this dataset each paper is associated to a number of keywords that can be used to build the topic graph. However, as pointed out in Osborne & Motta (2012), the use of keywords as proxies for topics suffers from a number of problems: some keywords do not represent topics (e.g., case study) and multiple keywords can refer to the same topic (e.g., ontology mapping and ontology matching).
The literature offers several methods for characterizing research topics. Probabilistic topic models, such as LDA, are very popular solutions, which however are most effective in scenarios where fuzzy classification is acceptable, there is no good domain knowledge and it is not important for users to understand the rationale of a classification. However, these tenets do not apply to this study. Furthermore, it is not easy to label the topics produced by a probabilistic topic model with specific and distinct research areas. Conversely, in this study it is important to be able to associate topics with well-established research areas.
A second approach, used by several digital libraries and publishers is tagging publications with categories from a pre-determined taxonomy of topic. Some examples include the ACM computing classification system (http://www.acm.org/publications/class-2012), the Springer Nature classification (http://www.nature.com/subjects), Scopus subject areas (https://www.elsevier.com/solutions/scopus/content), and the Microsoft Academic Search classification (http://academic.research.microsoft.com/). This solution has the advantage of producing sound topics, agreed upon by a committee of experts. However, these taxonomies suffer from a number of issues. First, building large-scale taxonomies requires a sizable number of experts and it is an expensive and time-consuming process. Hence, they are seldom updated and grow obsolete very quickly. For example, the 2012 version of the ACM classification was finalized fourteen years after the previous version. In addition, these taxonomies are very coarse-grained and usually contain general fields rather than fine-grained research topics.
We addressed these issues by characterizing our topics according to the Computer Science Ontology (CSO) produced by Klink-2 (Osborne & Motta, 2015), which describes the relationships between more than 15,000 research areas extracted from a corpus of 16 million publications. Klink-2 is an algorithm that is able to generate very granular ontologies and update them regularly by analysing keywords and their relationships with research papers, authors, venues, and organizations, and by taking advantage of multiple knowledge sources available on the web. Klink-2 is currently integrated in the Rexplore system (Osborne, Motta & Mulholland, 2013), a platform for exploring and making sense of scholarly data, which provides semantic-aware analytics.
We used the CSO ontology to semantically enhance the co-occurrence graphs by removing all keywords that did not refer to research areas and by aggregating keywords representing the same concept, i.e., keywords linked by a relatedEquivalent relationship in the ontology (Osborne, Motta & Mulholland, 2013). For example, we aggregated keywords such as “semantic web”, “semantic web technology” and “semantic web technologies” in a single semantic topic and we assigned it to all publications associated with these keywords.
We built sixteen topic networks representing topic co-occurrences in the 1995–2010 timeframe. Each network is a fully weighted graph Gyear = (Vyear, Eyear), in which V is the set of topics while E is the set of links representing the topic co-occurrences. The node weight represents the number of publications in which a topic appears in a year, while the link weight is equal to the number of publications in which two topics co-occur in the same year.
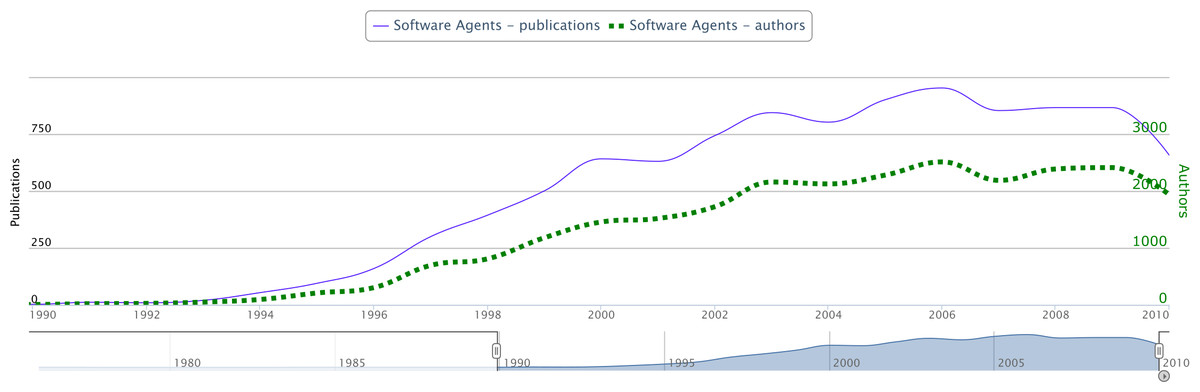
Figure 1: Evolution of the topic Software Agents in terms of number of authors and number of publications per year.
The chart has been produced using the Rexplore system.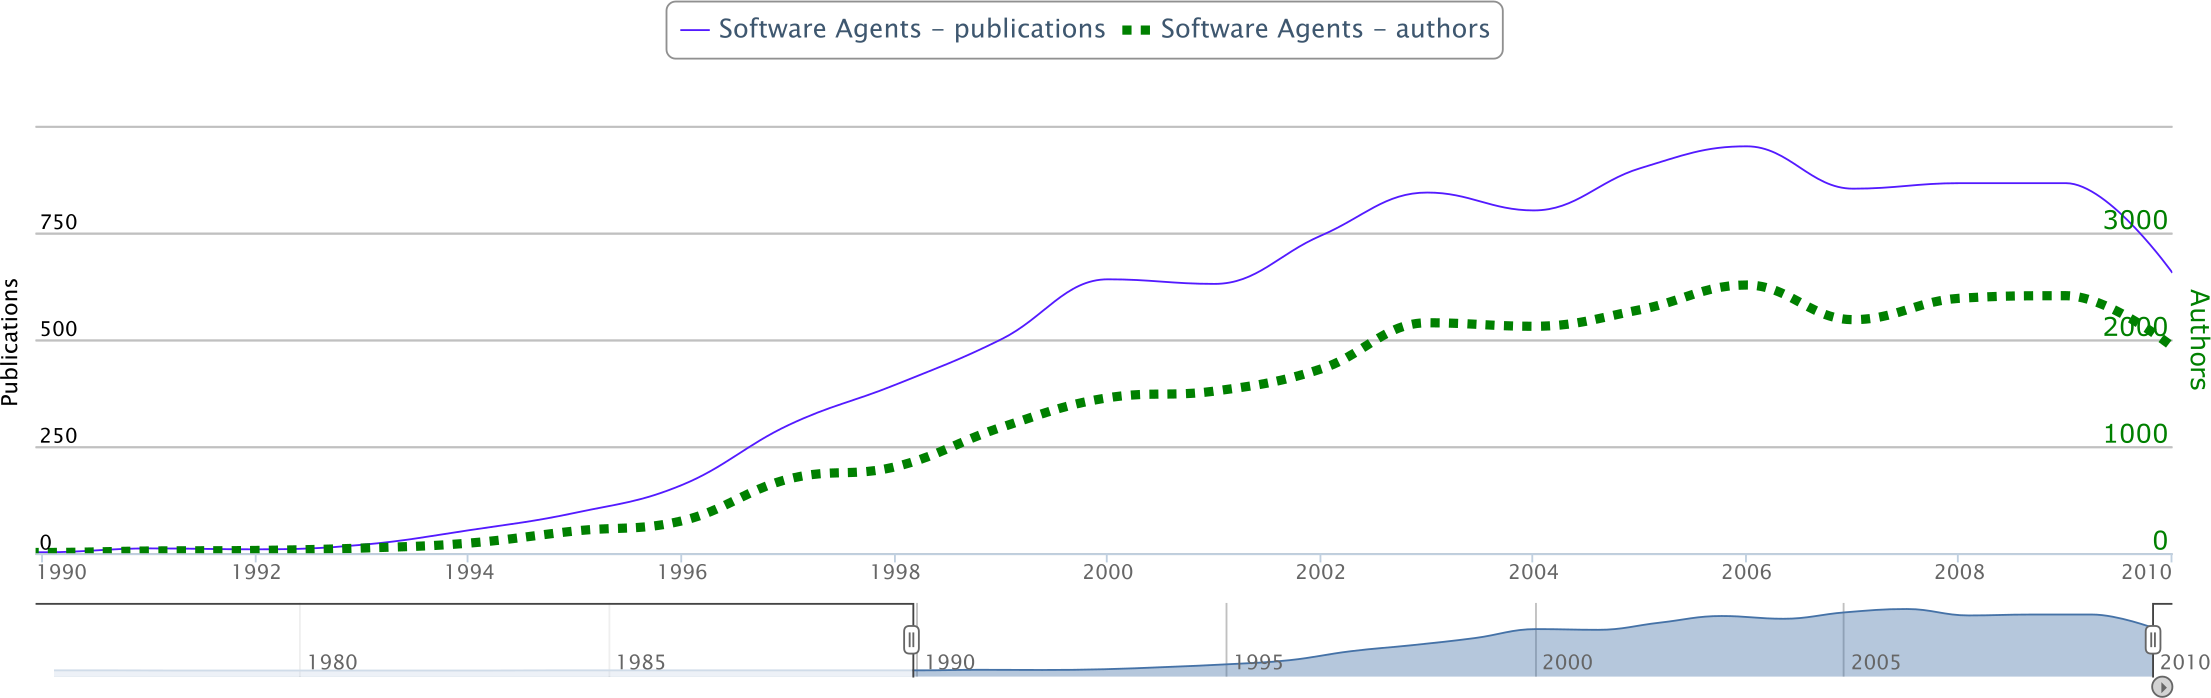
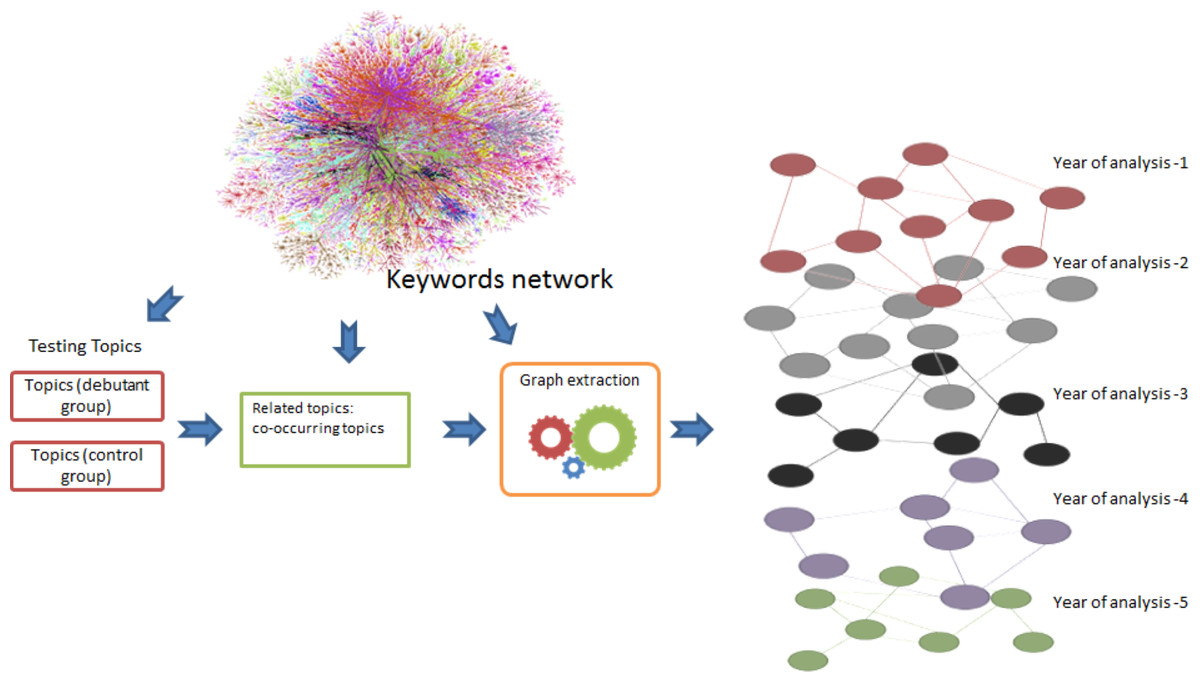
Figure 2: Workflow representing all the steps for the selection phase.
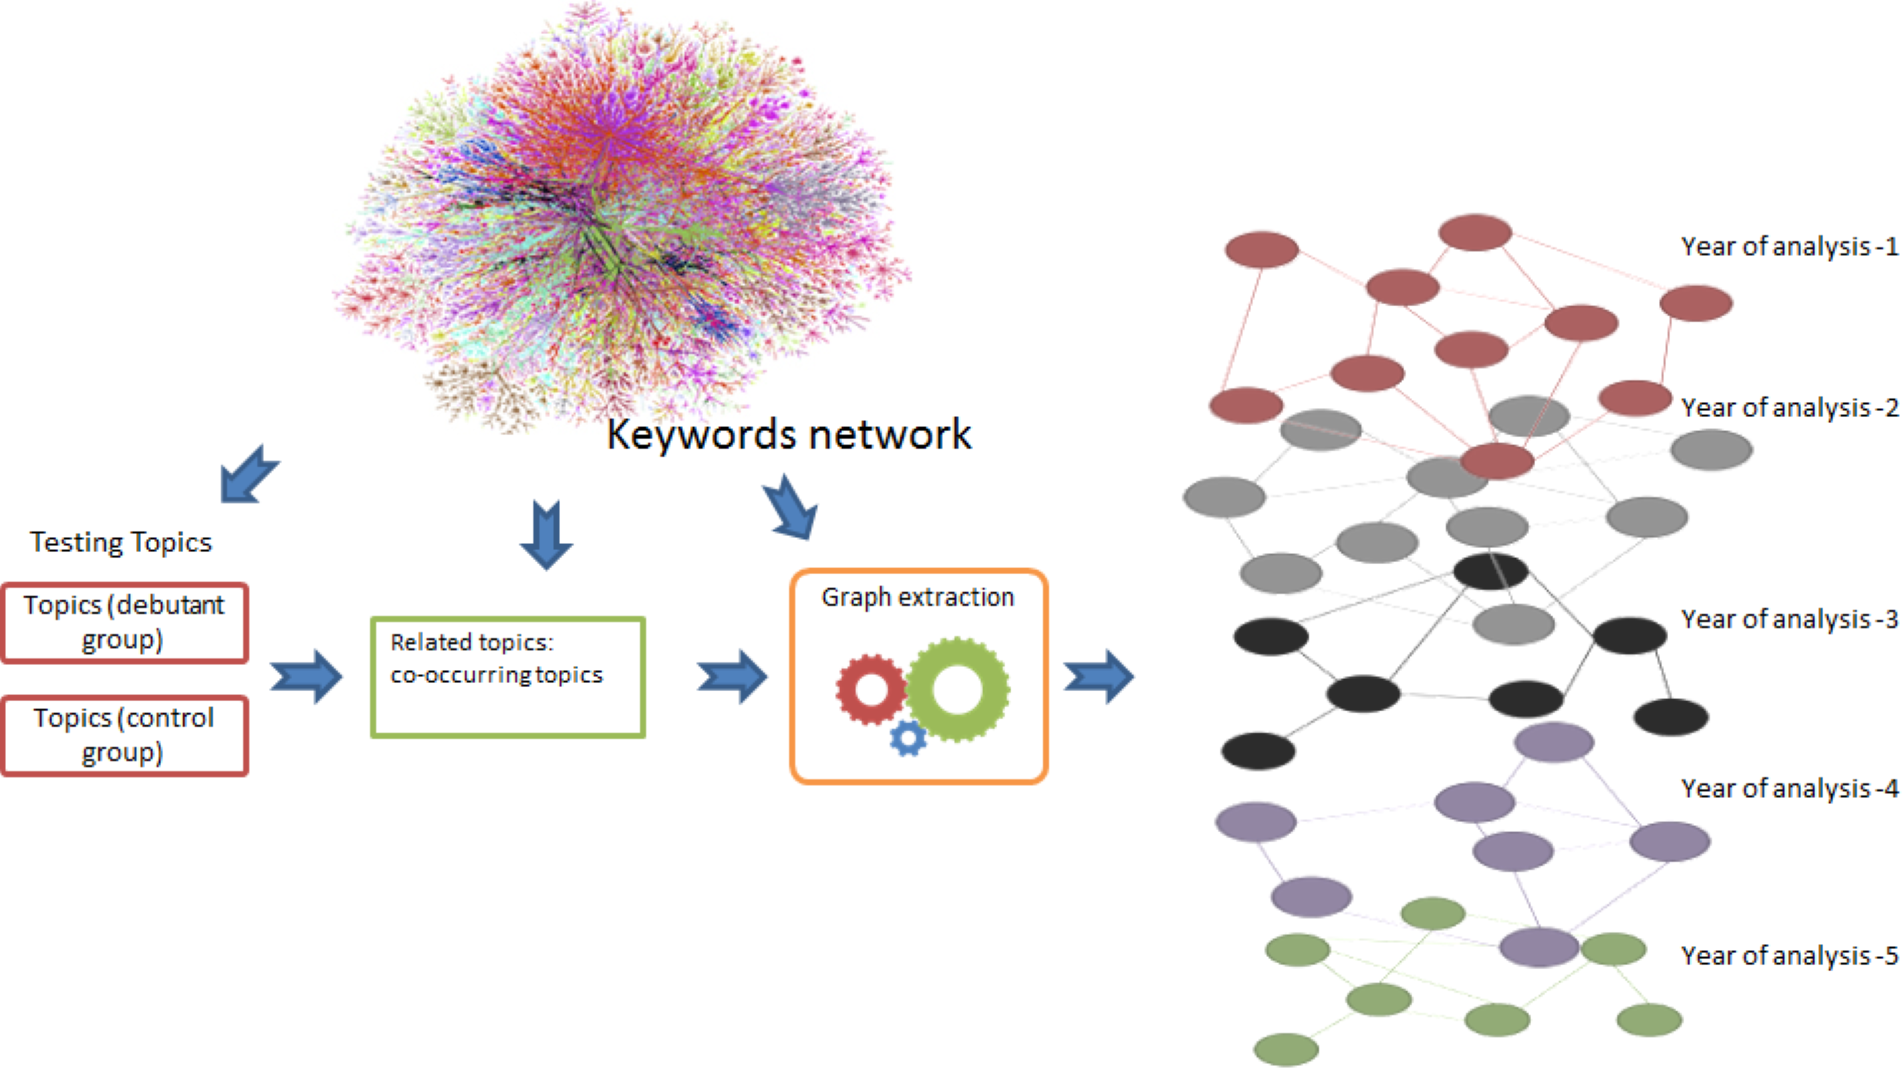
Graph selection
We randomly selected 75 topics that debuted in the period between 2000 and 2010 as treatment group (also referred to as debutant group). A topic debuts in the year in which its label first appears in a research paper. The control group (also referred to as non-debutant group), was obtained by selecting 100 well-established topics. We considered a topic as well-established if: (i) it debuted before 2000, (ii) it appears in the CSO Ontology, (iii) it is associated each year with a substantial and consistent number of publications. As an example, Fig. 1 shows the evolution through time of the well-established topic Software Agents, in terms of number of active authors and publications. The figure shows that the topic made its debut in 1993 and in the year 2000 reached a rate of over 500 publications per year with more than 1,500 authors working on it. It can thus be considered established in the context of our study.
We assume that a new topic will continue to collaborate with the topics that contributed to its creation for a certain time after its debut. This assumption was discussed and tested in a previous study (Osborne & Motta, 2012), where it was used to find historical subsumption links between research areas. Hence, as summarized in Fig. 2, for each debutant topic we extracted the portion of topic network containing its n most co-occurring topics from the year of debut until nowadays and analysed their activity in the five years preceding the year of debut. Since we want to analyse how the dimension of these subgraphs influences the results, we tested different values of n (20, 40, and 60). For example, if a topic A made its debut in 2003, the portion of network containing its most co-occurring topics is analysed in the 1998–2002 timeframe. We repeated the same procedure on the topics in the control group, assigning them a random year of analysis within the decade 2000–2010.
In the previous study (Salatino & Motta, 2016), we selected 50 established topics and assigned a random year of analysis to each of them. For this study, we randomly assigned each established topic to two consecutive years within the decade 2000–2010, with the consequence of doubling the control group, thus reducing noise and smoothing the resulting measures.
In brief, the selection phase associates to each topic in the treatment and control groups (also referred as input topics) a graph: (1) This graph corresponds to the co-occurrence network of a debutant topic in the five years prior to its emergence (or year of analysis for non-debutant topics). In particular, each year corresponds to the sub-graphs: (2) in which is the set of most co-occurring topics in a year and is the set of edges linking the nodes in the set.
The graphs associated to the debutant topics included 1,357 unique topics, while the ones associated to the control group included 1,060 topics.
Graph analysis
We assess the dynamics in the graphs with two main approaches: clique-based and triad-based. The first transforms the graph in 3-cliques, associates to each of them a measure reflecting the increase in collaboration between relevant topics and then averages the results over all 3-cliques. The second measures the increase in the topic graph density using the triad census technique (Davis & Leinhardt, 1967). In the following two sections we describe both methods in details.
Clique-based method
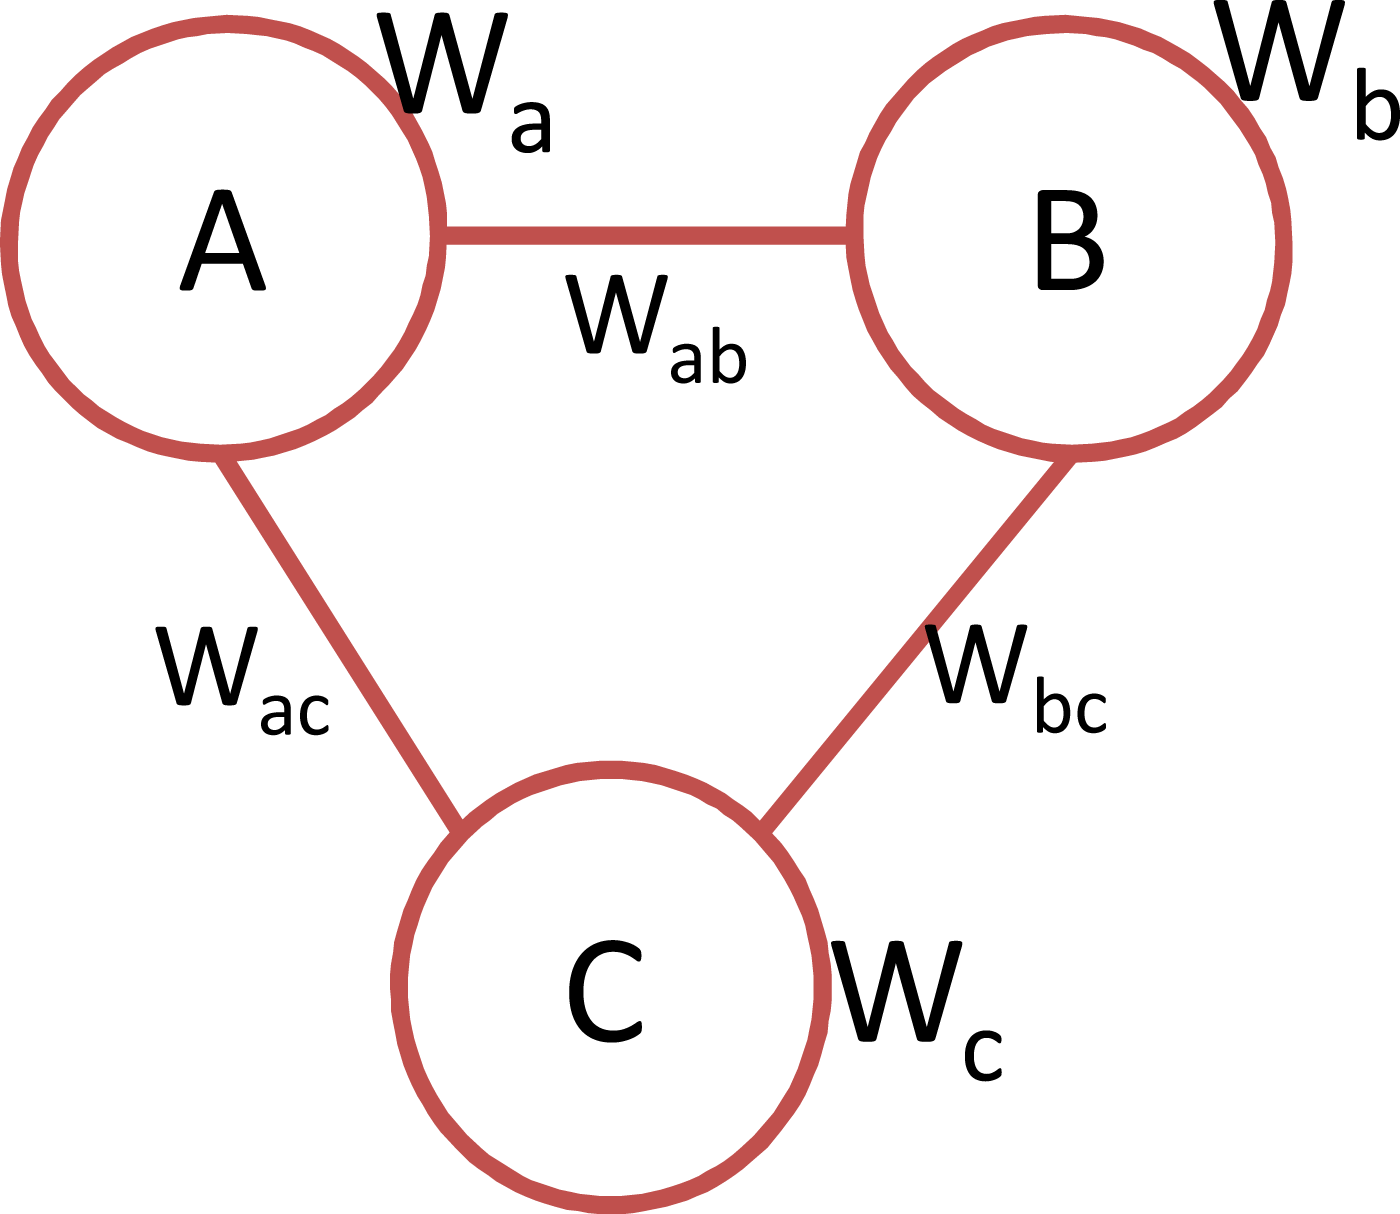
We measure the collaboration pace of a graph by analysing the diachronic activity of triangles of collaborating topics. To this end, we first extract all 3-cliques from the five sub-graphs associated to each topic under analysis. A 3-clique, as shown in Fig. 3, is a complete sub-graph of order three in which all nodes are connected to one another and is employed for modelling small groups of entities close to each other (Luce & Perry, 1949).
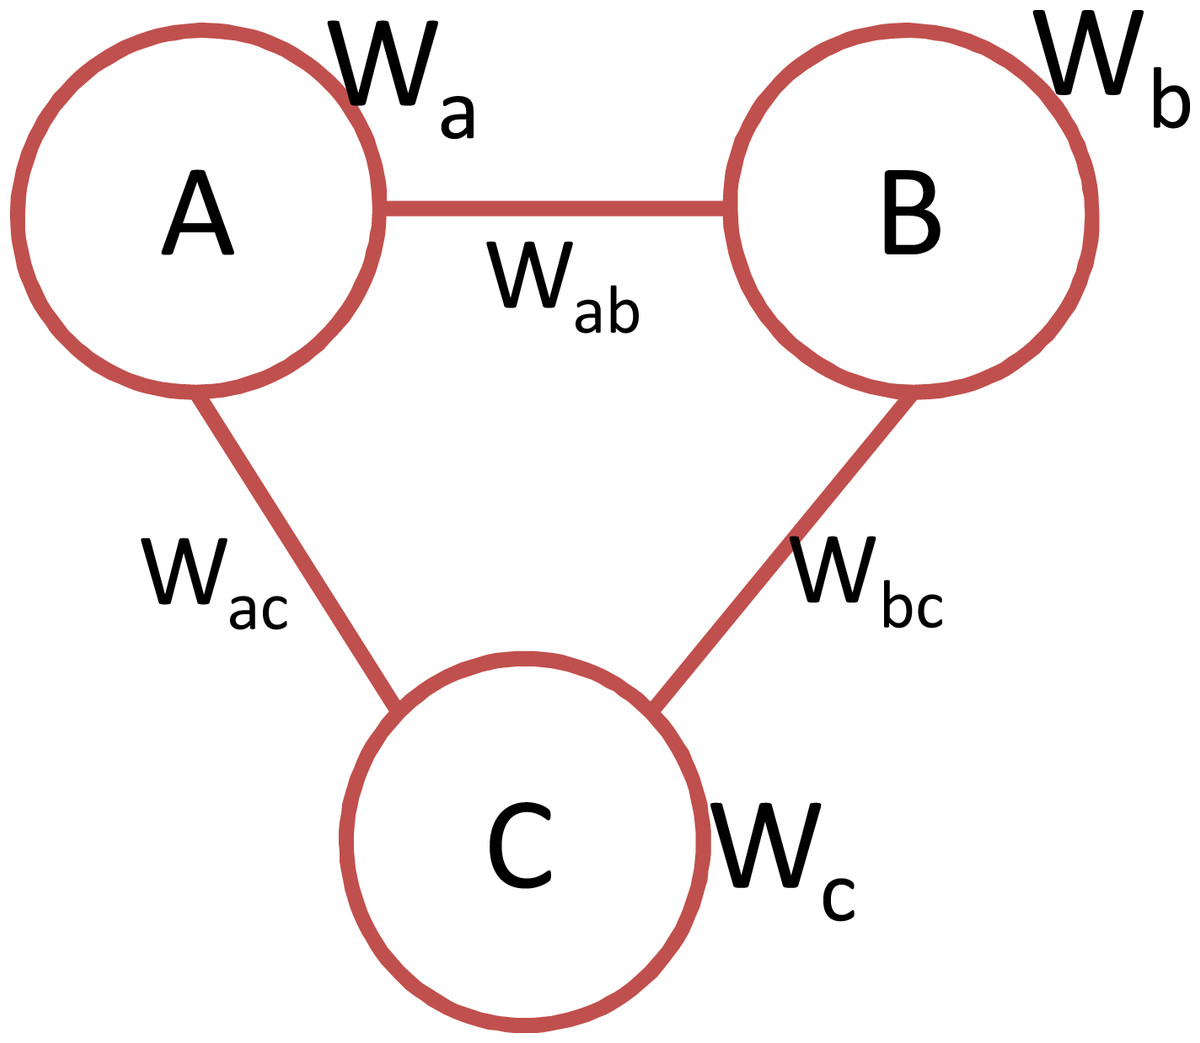
Figure 3: An instance of a 3-clique containing node and link weights.
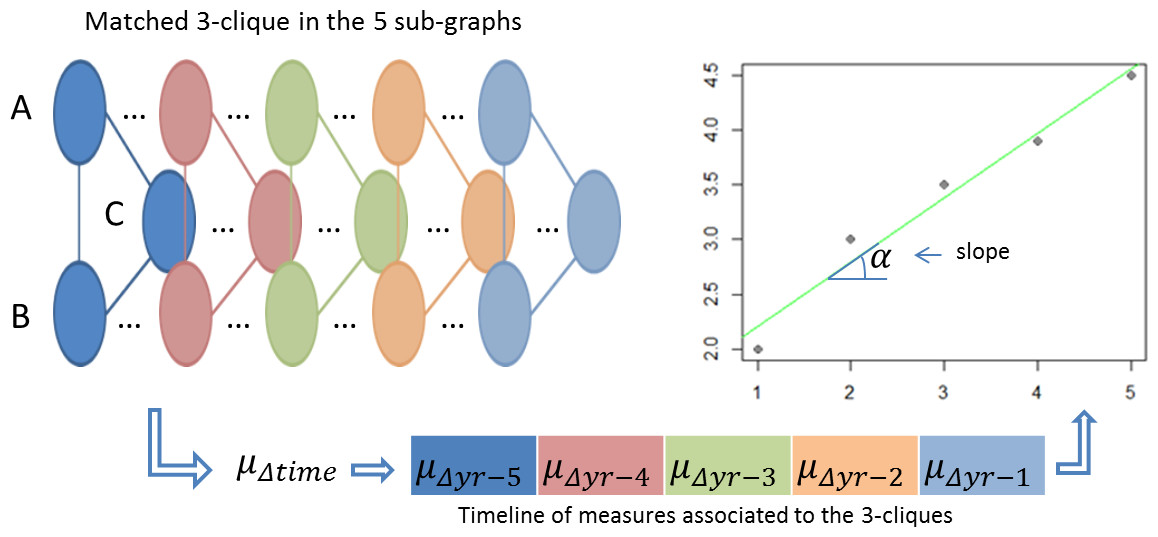
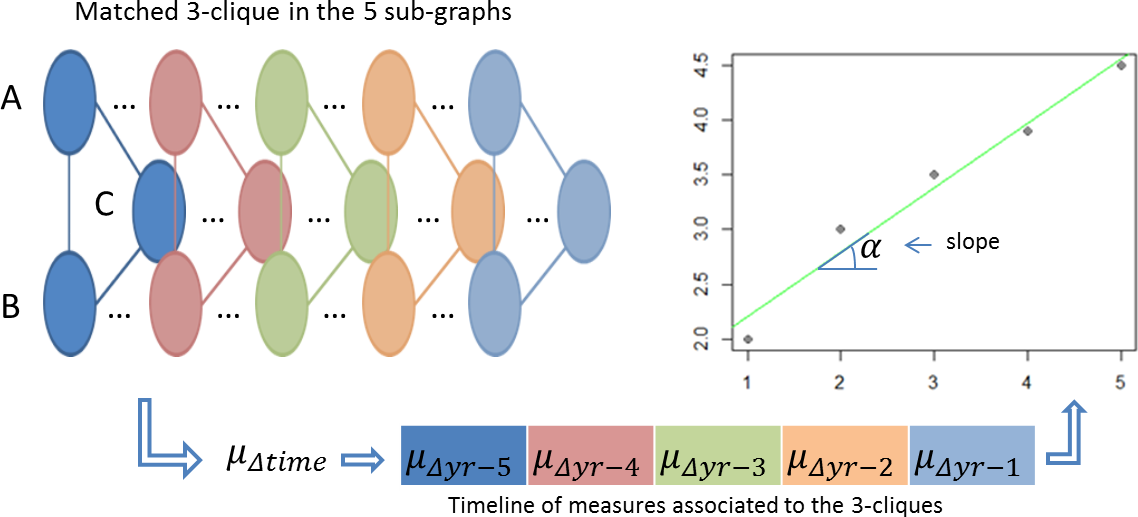
Figure 4: Main steps of the analysis phase.
To study the dynamics preceding the debut of each topic, we analyse the evolution of the same 3-clique in subsequent years. Figure 4 summarizes the process. Considering a 3-clique having nodes , we quantify its collaboration index μΔ in a year by taking into account both node weights and link weights . (3)
The index μΔ is computed by aggregating the three coefficients μA−B, μB−C and μC−A as illustrated by Eq. (3). The strength of collaboration μx−y between two nodes of the topic network, x and y, is computed as the mean of the conditional probabilities and P(x|y), where P(y|x) is the probability that a publication associated with a topic x will be associated also with a topic y in a certain year. The advantage of using conditional probabilities instead of the number of co-occurrences is that the value μx−y is normalised with respect to the number of publications associated to each topic. Finally, μΔ is computed as the mean of the strengths of collaboration of the three links in a 3-clique. This solution was adopted after testing alternative approaches during the preliminary evaluation, as discussed in the Results section.
The evolution of the 3-clique collaboration pace can be represented as a timeline of values in which each year is associated with its collaboration pace, as in Eq. (4). We assess the increase of the collaboration pace in the period under analysis by computing the slope of the linear regression of these values. (4) Initially, we tried to determine the increase in the collaboration pace exhibited by a clique by simply taking the difference between the first and last values of the timeline (μΔyr−5 − μΔyr−1). However, this method ignores the other values in the timeline and can thus neglect important information. For this reason, we applied instead the linear interpolation method on the five measures using the least-squares approximation to determine the linear regression of the time series f(x) = a⋅x + b. The slope a is then used to assess the increase of collaboration in a clique. When a is positive, the degree of collaboration between the topics in the clique is increasing over time, while, when it is negative, the number and intensity of collaborations are decreasing.
Finally, the collaboration pace of each sub-graph is measured by computing the mean of all slopes associated with the 3-cliques.
To summarize, for each input topic we select a subgraph of related topics in the five years preceding the year of debut (or analysis for topics in the control group). We then extract the 3-cliques and associate each of them with a vector representing the evolution of their pace of collaboration. The trend of each clique is computed as the angular coefficient of the linear regression of these values. Finally, the increase in the pace of collaboration of a subgraph is obtained by averaging these values.
Triad-based method
The triad-based method employs the triad census (Davis & Leinhardt, 1967) to measure the change of topology and the increasing density of the subgraphs during the five year period. The triad census of an undirected graph, also referred to as global 3-profiles, is a four-dimensional vector representing the frequencies of the four isomorphism classes of triad, as shown in Fig. 5.
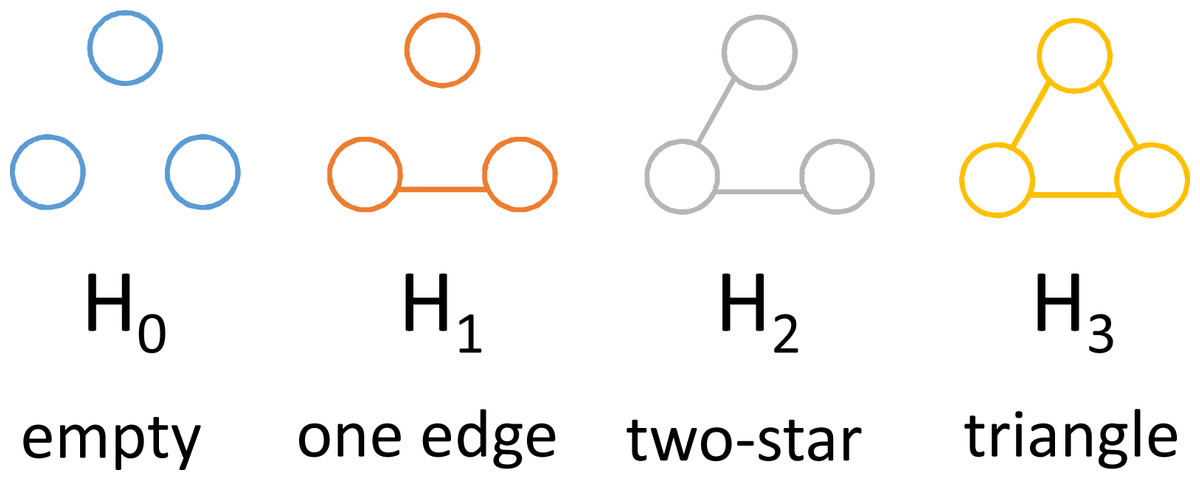
Figure 5: The four isomorphism classes of triad.
The triad census counts the frequencies of Hi in the input graph.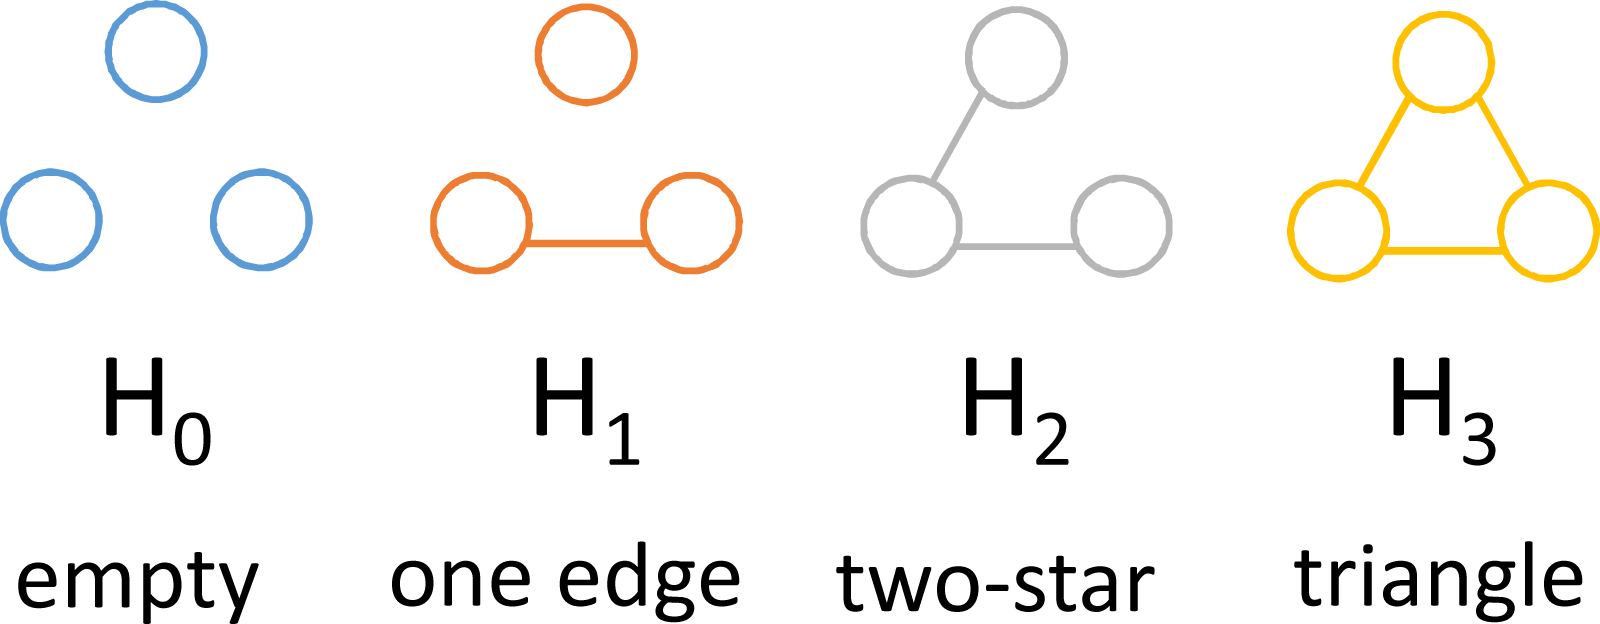
The triad census summarises structural information in networks and is useful to analyse structural properties in social networks. It has been applied to several scenarios, such as identifying spam (Kamaliha et al., 2008; O’Callaghan et al., 2012), comparing networks (Pržulj, 2007), and analysing social networks (Faust, 2010; Ugander, Backstrom & Kleinberg, 2013).
In this study, we use triad census to describe all the sub-graphs associated to a input topic in terms of frequencies of Hi (see Fig. 5) and we then evaluate how the frequencies of empties (H0), one edges (H1), two-stars (H2) and triangles (H3) change in time. Figure 5 illustrates the four classes of triads for an undirected graph in the case of topic networks. An increase in the number of triangles suggests the appearance of new collaboration clusters among previously distant topics.
In contrast with the 3-cliques approach, the triad census does not consider the weight of the links, but only their existence. Hence, it is useful to assess how the inclusion of links with different strengths affects the analysis. To this end, we performed three experiments in which we considered only links associated with more than 3, 10 and 20 topic co-occurrences.
We initially perform the triad census over the five graphs associated to each input topic. For example, Table 1 shows the results of the triad census over the five sub-graphs associated with the debutant topic Artificial Bee Colonies.
| Graph | H0 | H1 | H2 | H3 |
|---|---|---|---|---|
| 446 | 790 | 807 | 882 | |
| 443 | 854 | 915 | 1,064 | |
| 125 | 486 | 967 | 1698 | |
| 100 | 410 | 908 | 1,858 | |
| 68 | 486 | 849 | 2251 |
Next, we check whether the co-occurrence graph is becoming denser by analysing the change of frequencies associated with Hi (see Fig. 6). We first calculate the percentage growth of each Hi (Eq. (5)) and then compute their weighted summation ( Eq. (6)). We label the resulting metric the growth index. We empirically tested other solutions for aggregating the various contributions (e.g., considering only H3, summing the values, weighting the sum in a variety of ways) and found that this definition of growth index provides the best discrimination between the two classes of graphs. (5) (6)
The growth index takes into account the contributions from H1, H2 and H3. Although, the number of triangles (H3) can by itself be a fair indicator of the density, previous studies showed that all four classes of triads are useful for computing network properties, including transitivity, intransitivity and density (Faust, 2010; Holland & Leinhardt, 1976). Taking into consideration only H3 might fail to detect some subtler cases, characterized for example by a contemporary increase of H2 and decrease of H1.

Figure 6: Development in time of the frequencies of Hi in the network related to the emergence of “Artificial Bee Colonies”.
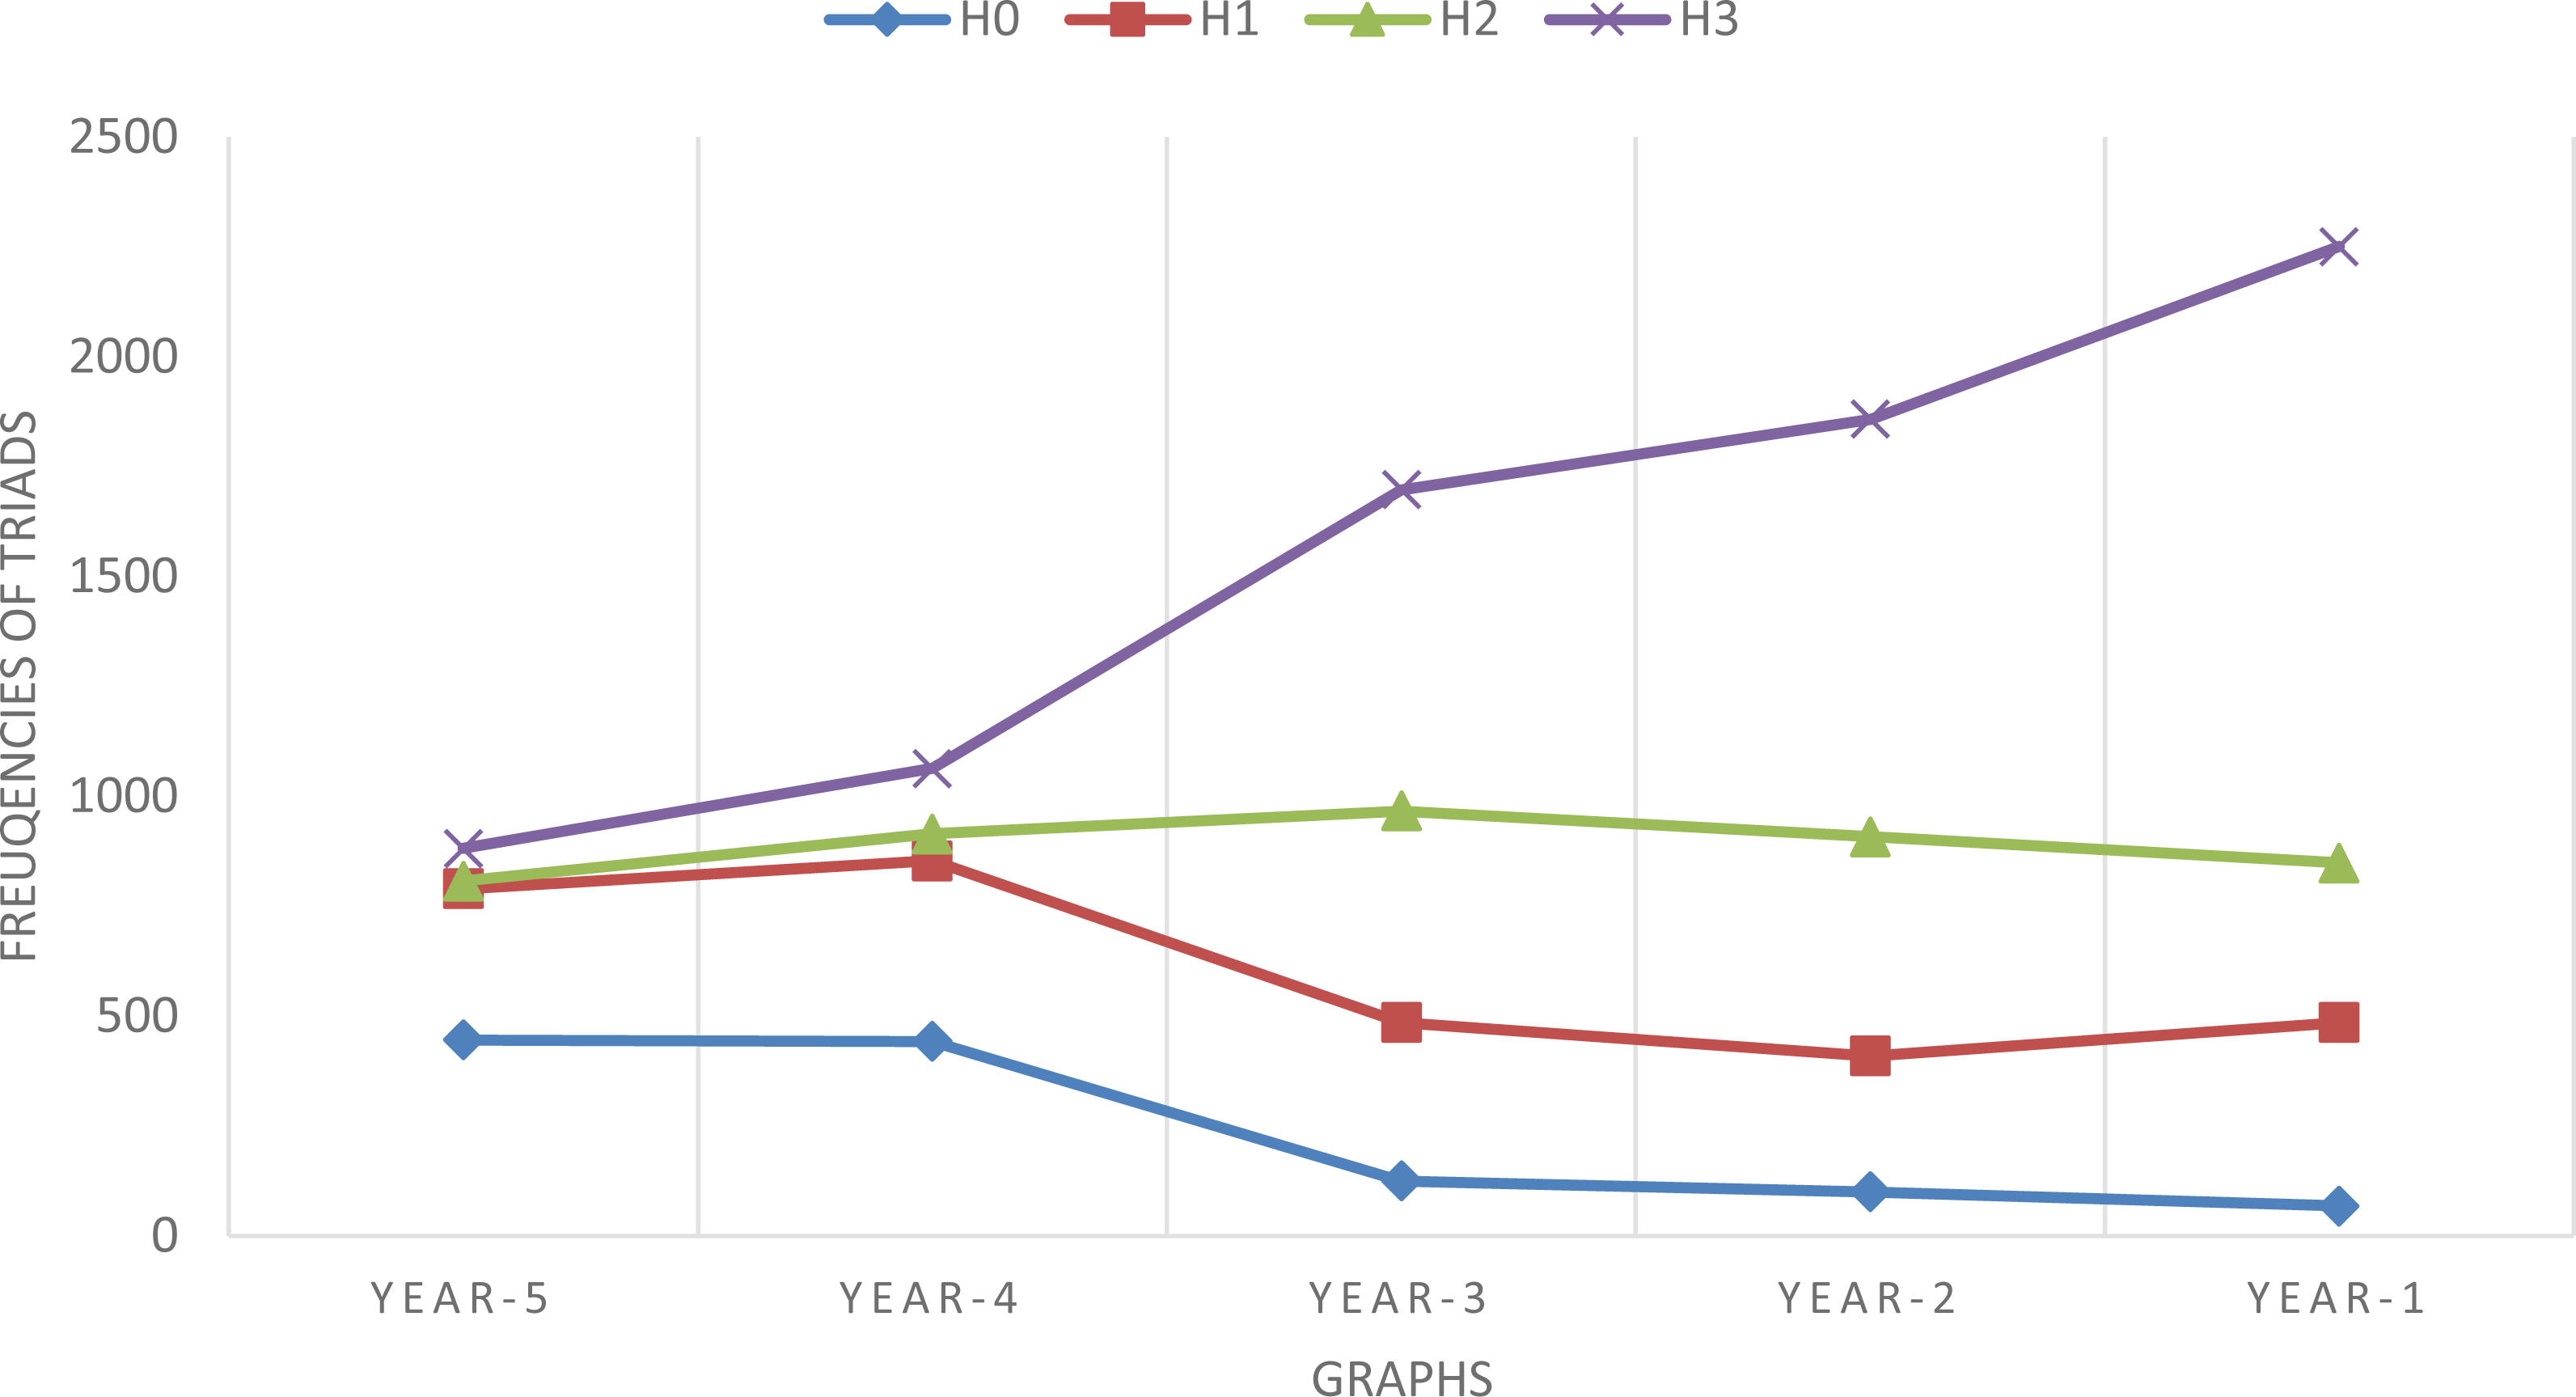
To summarize, the triad-based method receives the same input as the clique-based method. For each of the five subgraphs associated to a topic, we perform the triad census obtaining the different frequencies, Hi, in different years. We then analyse them diachronically to quantify the increase in density.
Results
In this section we report the results obtained by analysing the debutant and control groups using the previously discussed methods. We will describe:
-
The preliminary evaluation performed on a reduced dataset for assessing the metrics used in the clique-based method;
-
The full study using the clique-based method;
-
The full study using the triad-based method.
Preliminary evaluation with alternative clique-based methods
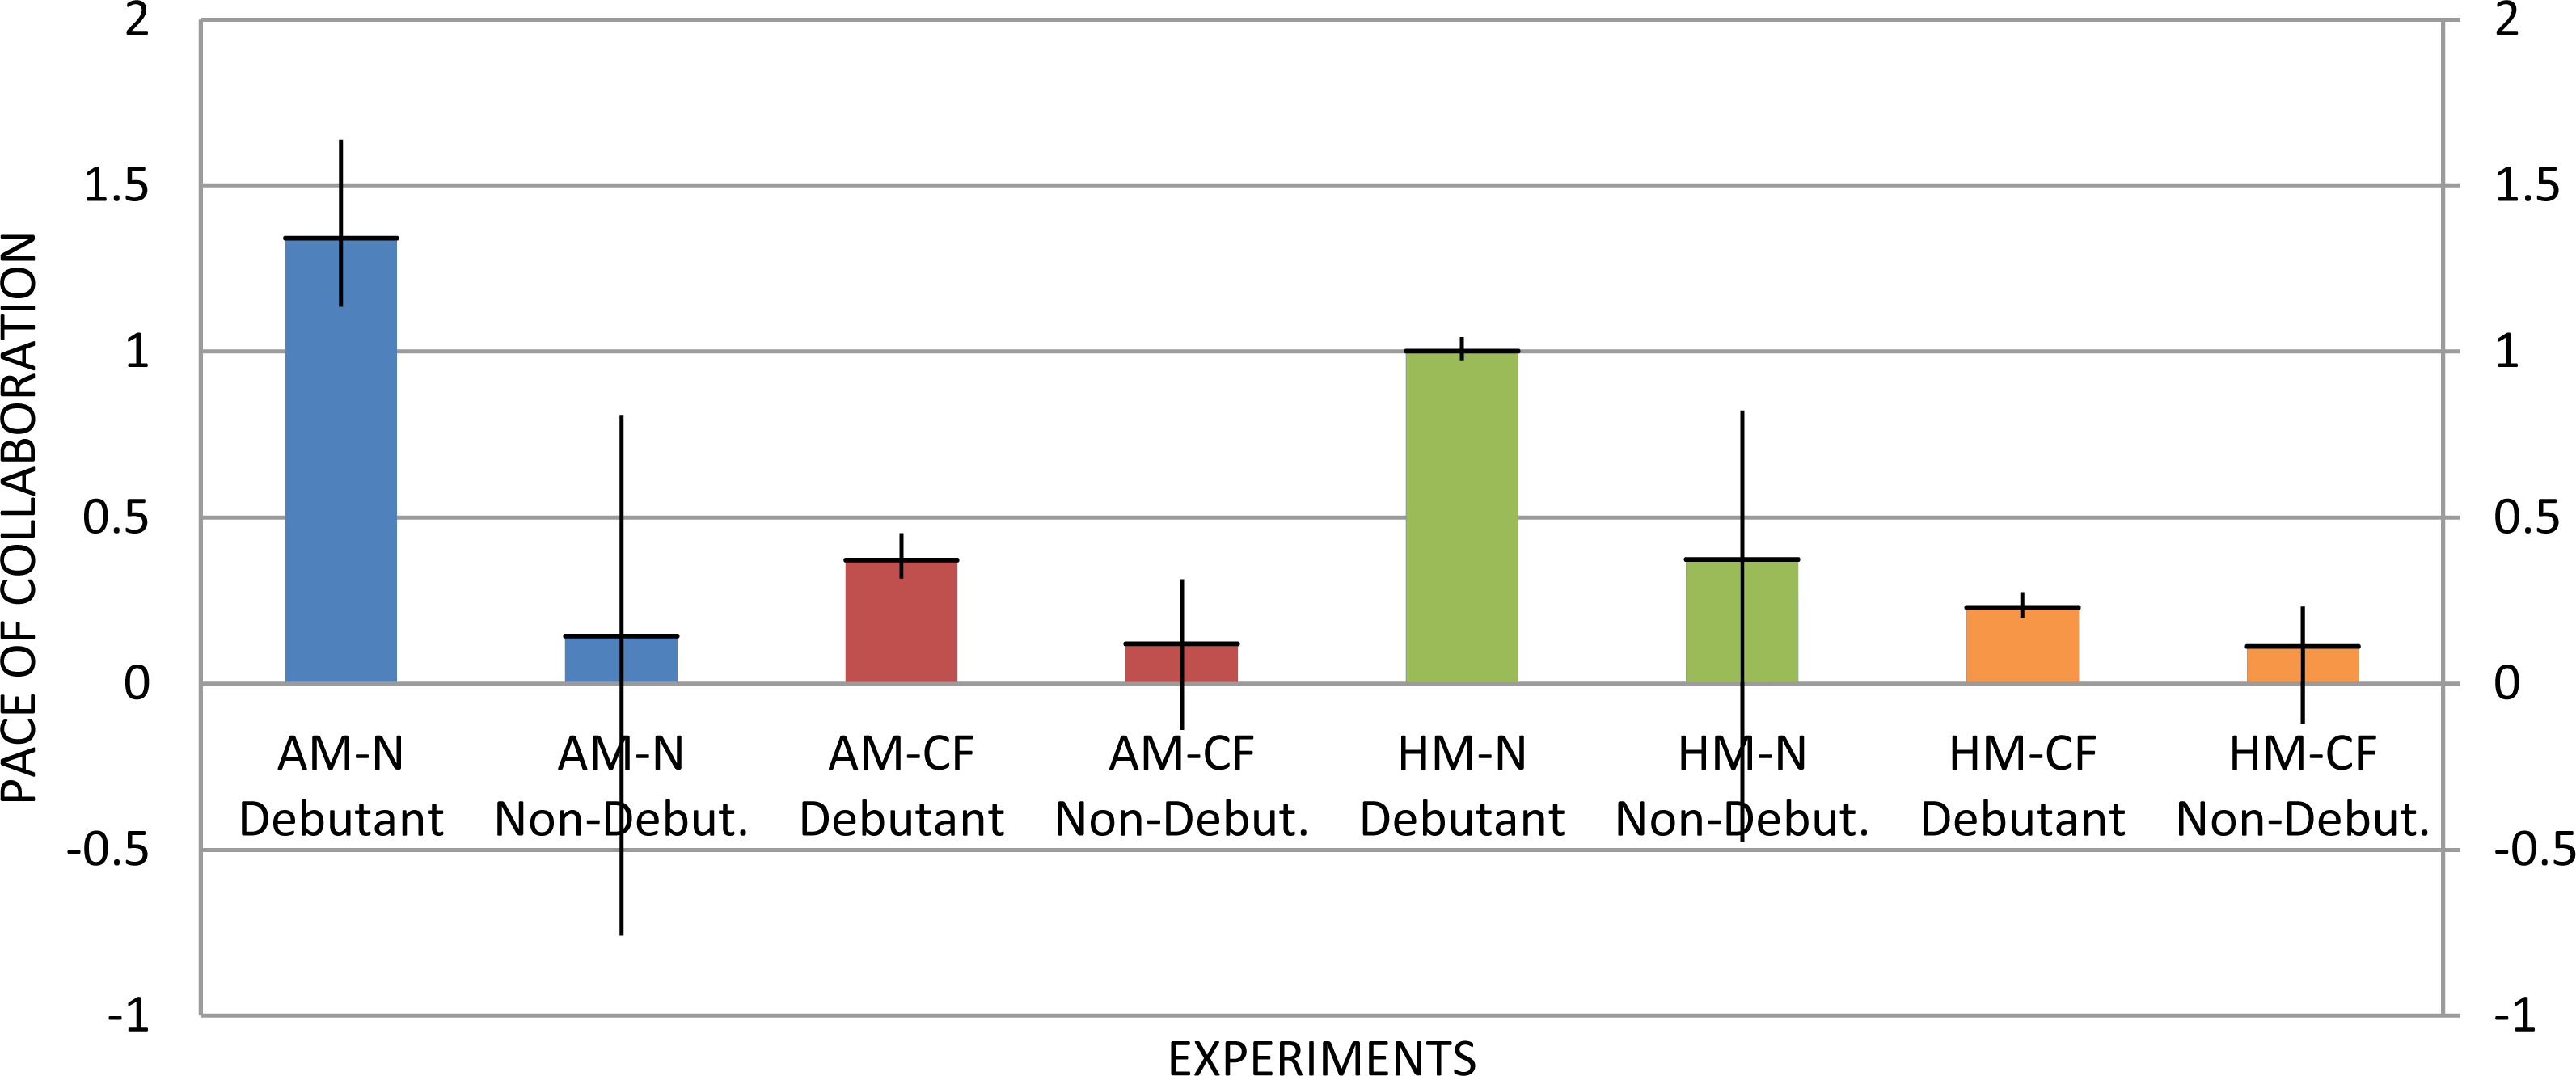
We conducted a preliminary evaluation aiming at choosing the most effective clique-based method for assessing the pace of collaboration. This test focused on the subgraph of the 20 most co-occurring topics associated with the topic Semantic Web (debuting in 2001) and Cloud Computing (2006) versus a control group of 20 subgraphs associated to a group of non-debutant topics. We tested on this dataset two techniques to compute the weight of a clique (harmonic mean and arithmetic mean) and two methods to evaluate its trend (computing the difference between the first and the last values and linear regression). Hence, we evaluated the following four approaches:
-
AM-N, which uses the arithmetic mean and the difference between first and last value;
-
AM-CF, which uses the arithmetic mean and the linear regression coefficient;
-
HM-N, which uses the harmonic mean and the difference between first and last value;
-
HM-CF, which uses the harmonic mean and the linear regression coefficient.
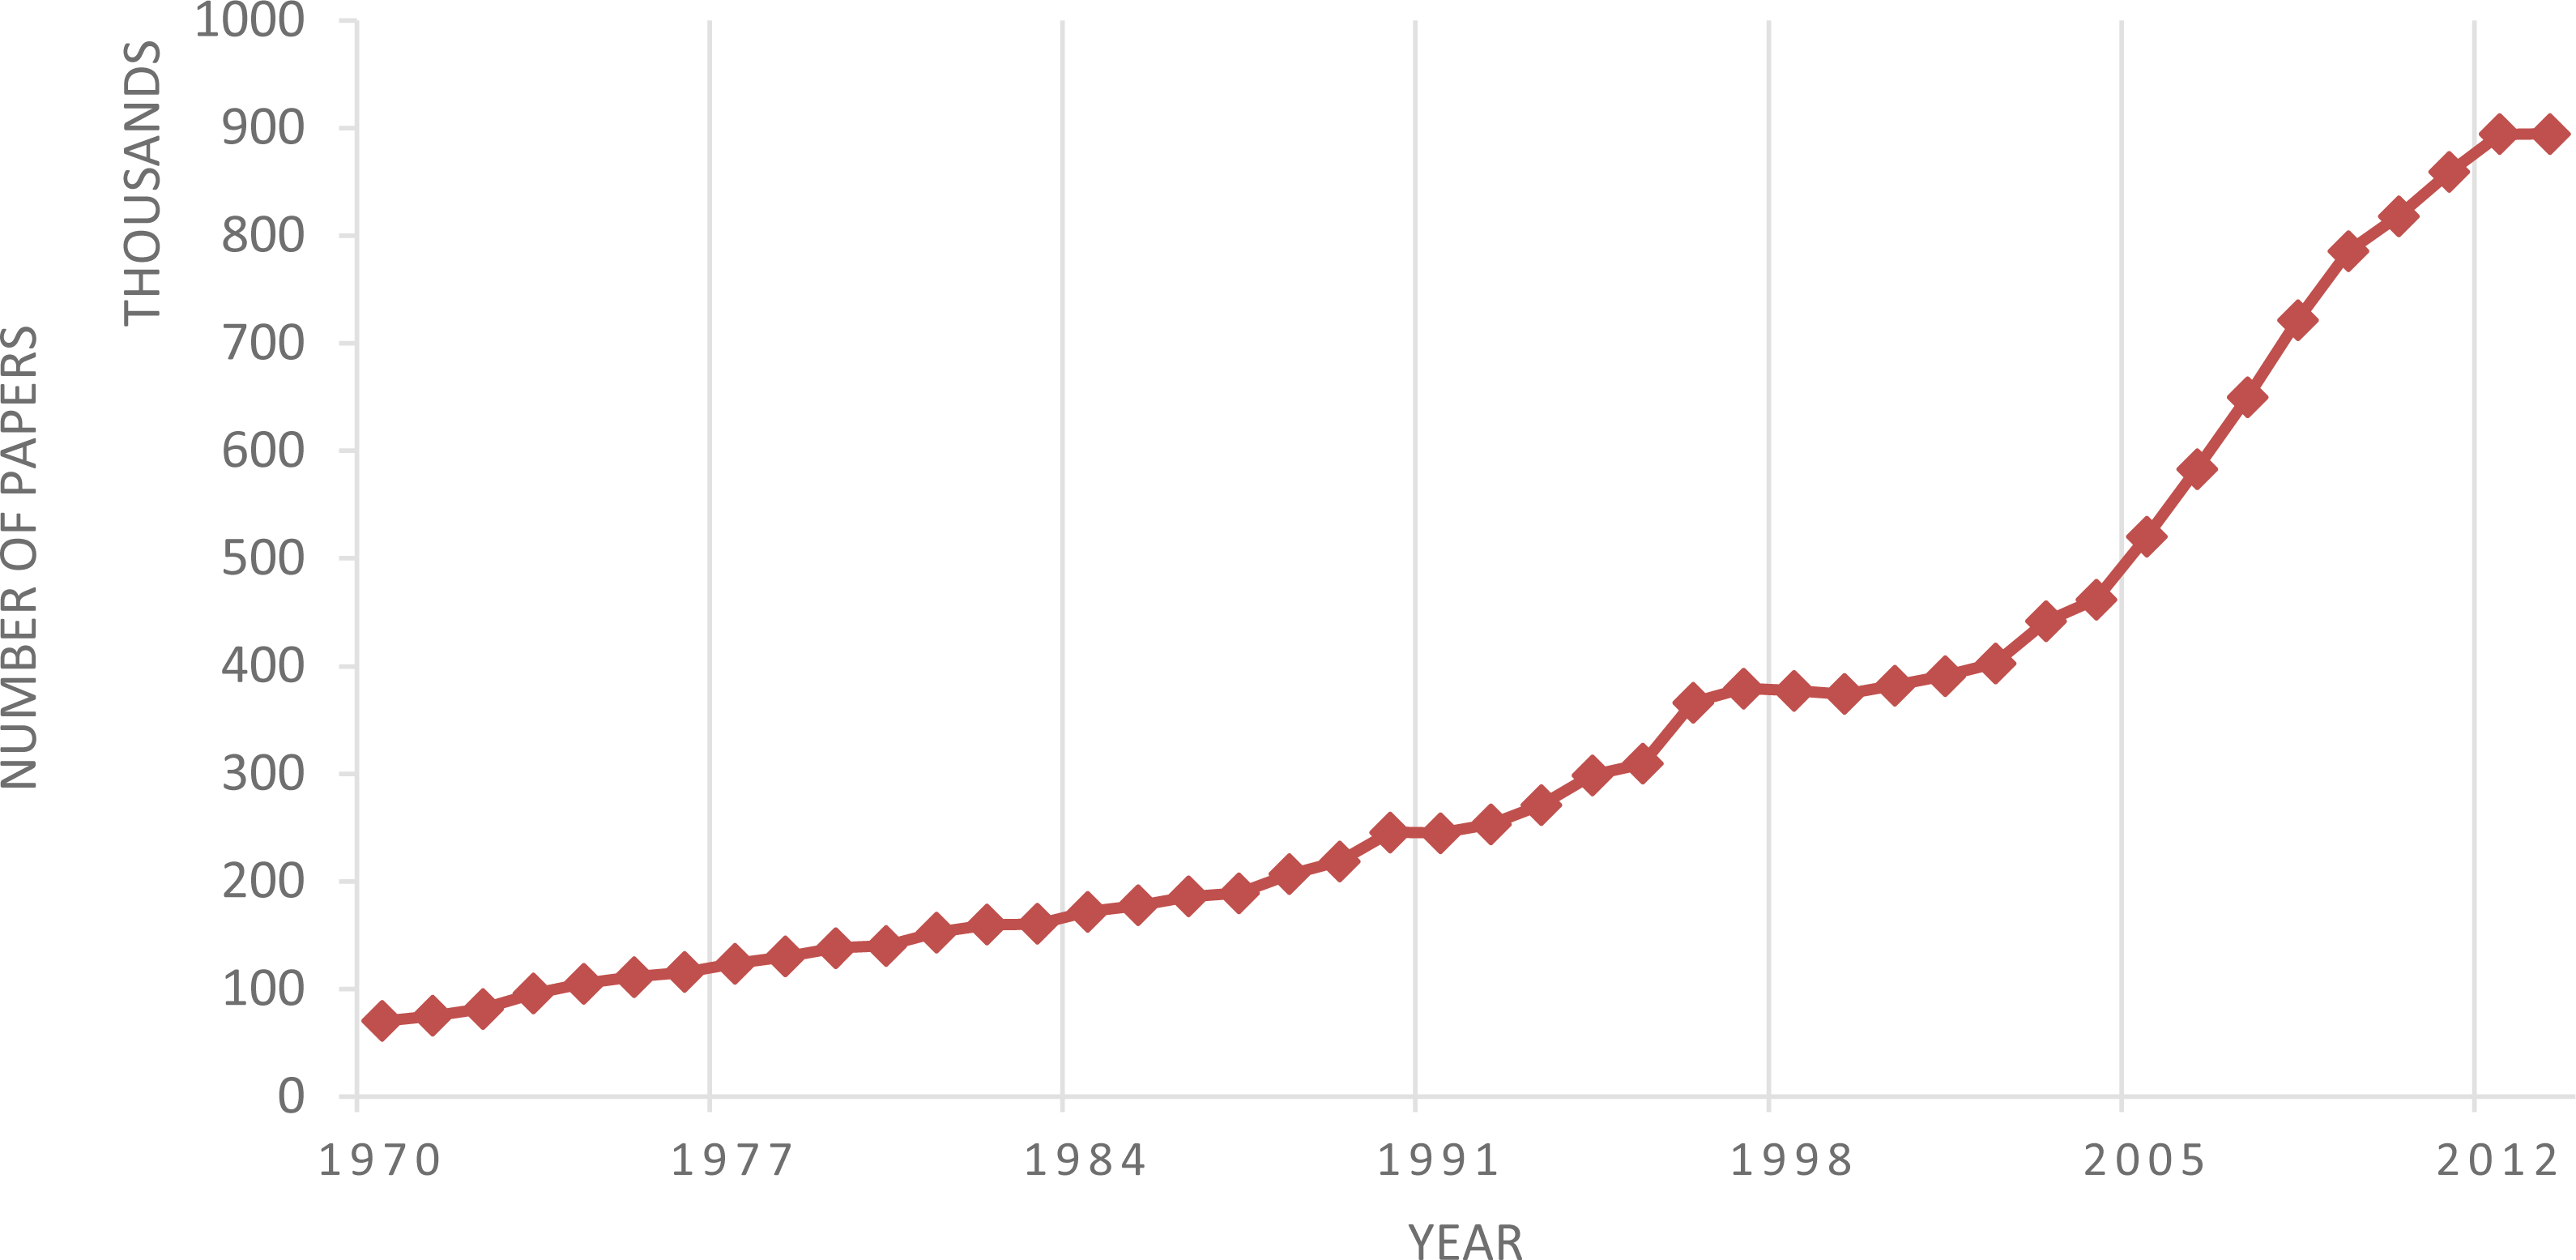
Figure 7 illustrates the average pace of collaboration for the sub-graphs associated with each topic according to these methods and the range of their values (thin vertical line). The results support the initial hypothesis: the pace of collaboration of the cliques within the portion of network associated with the emergence of new topics is positive and higher than the ones of the control group. Interestingly, the pace of collaboration of the control group is also slightly positive. Further analysis revealed that this behaviour is probably caused by the fact that the topic network becomes denser and noisier in time. Figure 8 confirms this intuition illustrating the fast growth of the number of publications per year in the dataset during the time window 1970–2013.
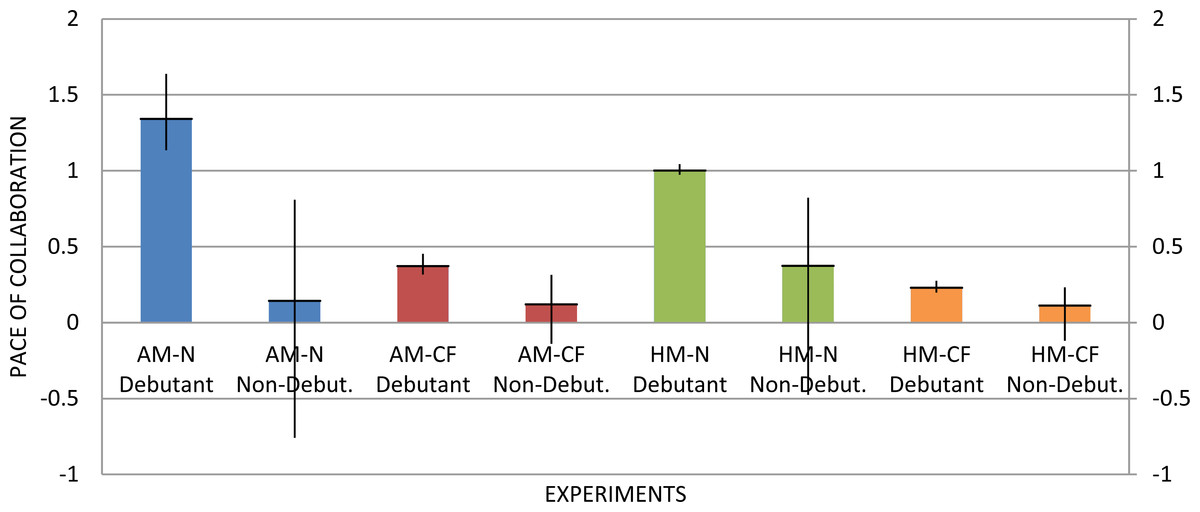
Figure 7: Overall directions of the sub-graphs related to input topics in both debutant and control group with all four approaches.
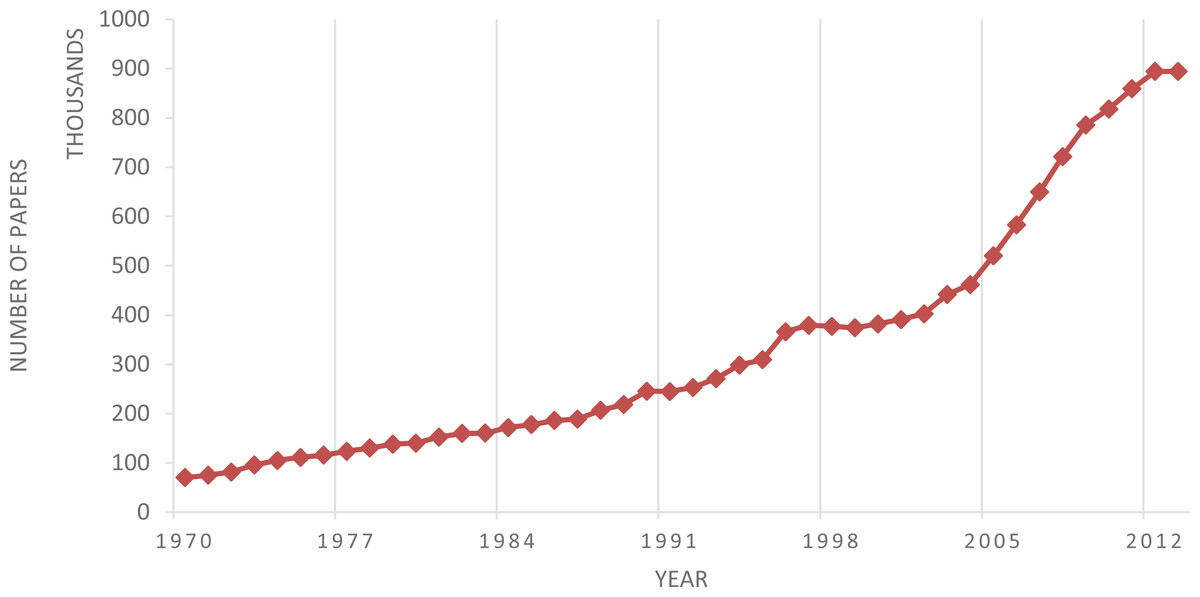
Figure 8: Number of papers each year in the period 1970–2013 in the dataset under analysis.
The approaches based on the simple difference (AM-N and HM-N) exhibit the larger gaps between the two groups in terms of average pace of collaboration. However, the ranges of values overlap, making it harder to assess if a certain sub-group is incubating a novel topic. The same applies to AM-CF. HM-CF performs better and, even if the values slightly overlap when averaging the pace over different years, they do not when considering single years. Indeed, analysing the two ranges separately in 2001 and 2006 (see Fig. 9), we can see that the overall collaboration paces of the debutant topics (DB) are always significantly higher than the control group (NDB).
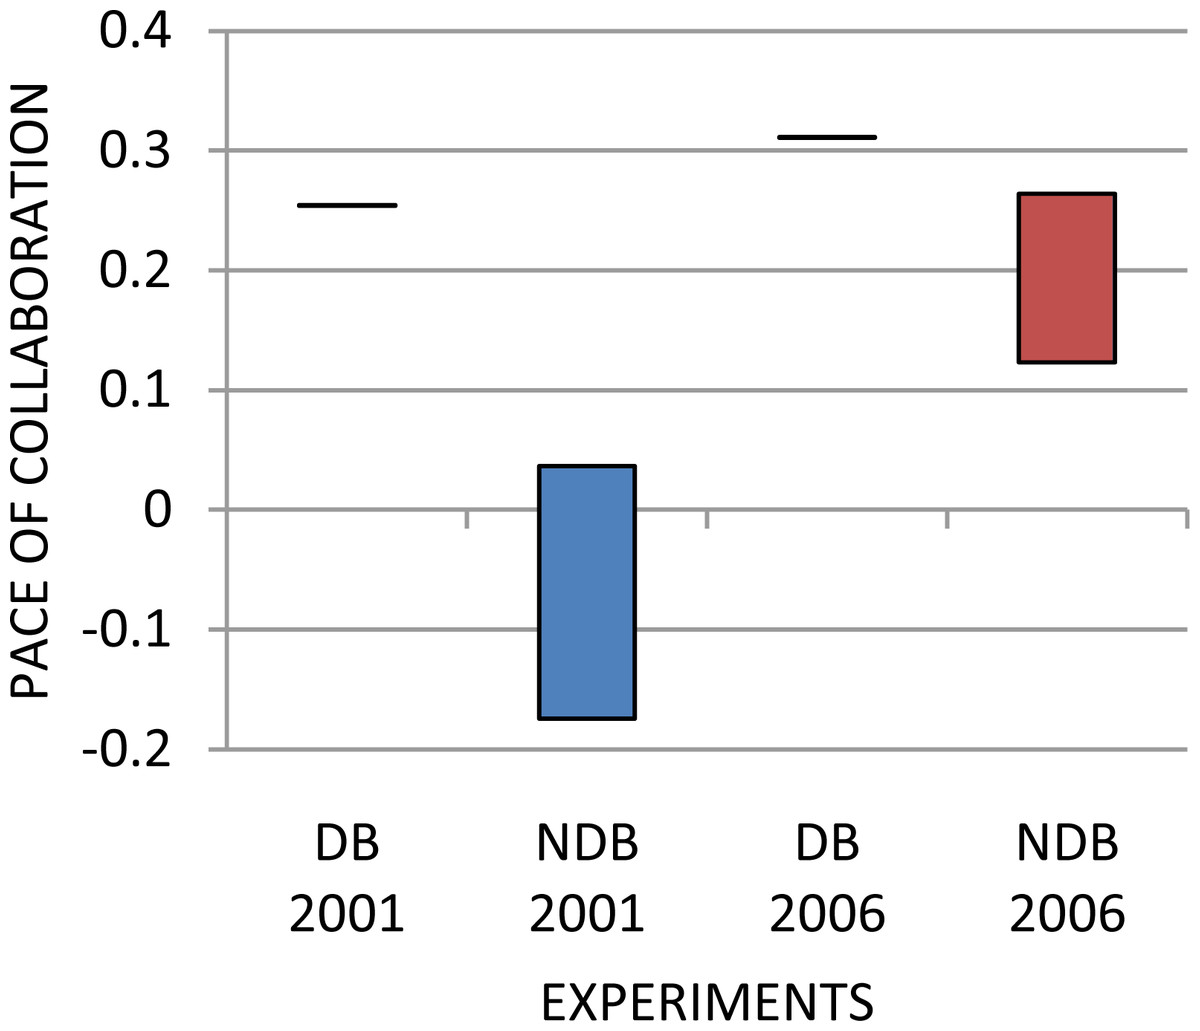
Figure 9: Overall directions of the sub-graphs related to input topics in both debutant and control group in HM-CF approach.
With the null hypothesis: “The differences in the pace of collaboration between the debutant topics and topics in the control group result purely from chance”, we ran Student’s t-test on the sample of data provided by the HM-CF approach, to verify whether the two groups belong to different populations. The test yielded p < 0.0001, which allowedt us to reject the null hypothesis that the differences between the two distributions were due to random variations.1 Based on this result, we could further confirm that the HM-CF approach performs better compared to the other approaches. For this reason, we selected the combination of harmonic mean and linear regression as the approach for the full study using the clique-based method.
The results of HM-CF give interesting insights on the creation of some well-known research topics. Tables 2 and 3 list the cliques that exhibited a steeper slope for Semantic Web and Cloud Computing. We can see that Semantic Web was anticipated in the 1996–2001 timeframe by a significant increase in collaboration of the World Wide Web area with topics such as, Information Retrieval, Artificial Intelligence, and Knowledge Based Systems. This is consistent with the initial vision of the semantic web, defined in the 2001 by the seminal work of Berners-Lee, Hendler & Lassila (2001). Similarly, Cloud Computing was anticipated by an increase in the collaboration between topics such as, Grid Computing, Web Services, Distributed Computer Systems and Internet. This suggests that our approach can be used both for forecasting the emergence of new topics in distinct subsections of the topic network and also for identifying the topics that gave rise to a research area.
| Topic 1 | Topic 2 | Topic 3 | Slope |
|---|---|---|---|
| World Wide Web | Information retrieval | Search engines | 2.529 |
| World Wide Web | User interfaces | Artificial intelligence | 1.12 |
| World Wide Web | Artificial intelligence | Knowledge representation | 0.974 |
| World Wide Web | Knowledge based systems | Artificial intelligence | 0.850 |
| World Wide Web | Information retrieval | Knowledge representation | 0.803 |
| Topic 1 | Topic 2 | Topic 3 | Slope |
|---|---|---|---|
| Grid computing | Distributed computer systems | Web services | 1.208 |
| Web services | Information management | Information technology | 1.094 |
| Grid computing | Distributed computer systems | Quality of service | 1.036 |
| Internet | Quality of service | Web services | 0.951 |
| Web services | Distributed computer systems | Information management | 0.949 |
Clique-based method study
We applied the clique-based methods on the subgraphs associated to topics in the treatment and control groups. Figure 10 reports the results obtained by using subgraphs composed by the 20, 40 and 60 topics with the highest co-occurrence. Each bar shows the mean value of the average pace of collaboration for the debutant (DB) and non-debutant (NDB) topics. As before, the pace computed in the portion of the network related to debutant topics is higher than the corresponding pace for the control group.
Since the pace of collaboration shows significant changes within the period considered, we studied its behaviour across the 2000–2010 interval. Figures 11A– 11C, show the average yearly collaboration pace when considering the 20, 40 and 60 most co-occurring topics. In all cases the collaboration pace for the debutant topics is higher than the one for the control group. We can also notice that in the last five years the overall pace of collaboration suffered a fall for both debutant and non-debutant topics. This may be due to the fact that the topic network became denser and noisier in the final years of the interval. Moreover, the most recent debutant topics often have an underdeveloped network of co-occurrences, which may result in a suboptimal selection of the group of topics to be analysed in the previous years. Therefore, simply selecting the 20 most co-occurring topics may not allow us to highlight the real dynamics preceding the creation of a new topic.
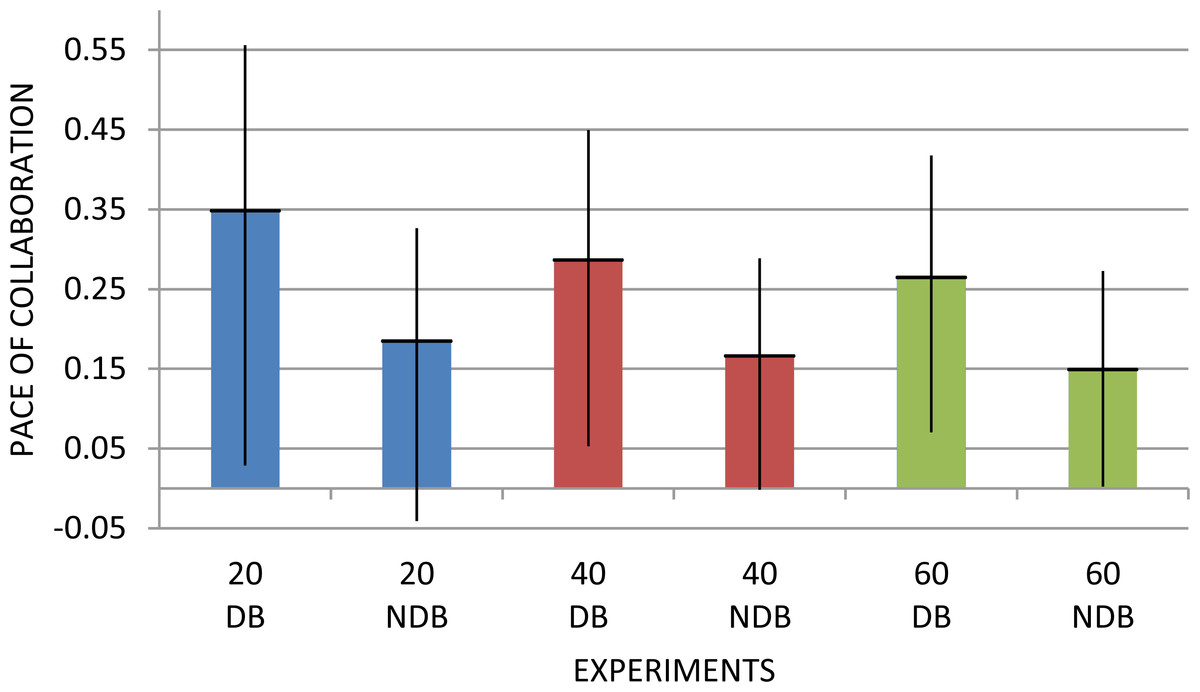
Figure 10: Average collaboration pace of the sub-graphs associated to the treatment (DB) and control group (NDB), when selecting the 20, 40 and 60 most co-occurring topics.
The thin vertical lines represent the ranges of values.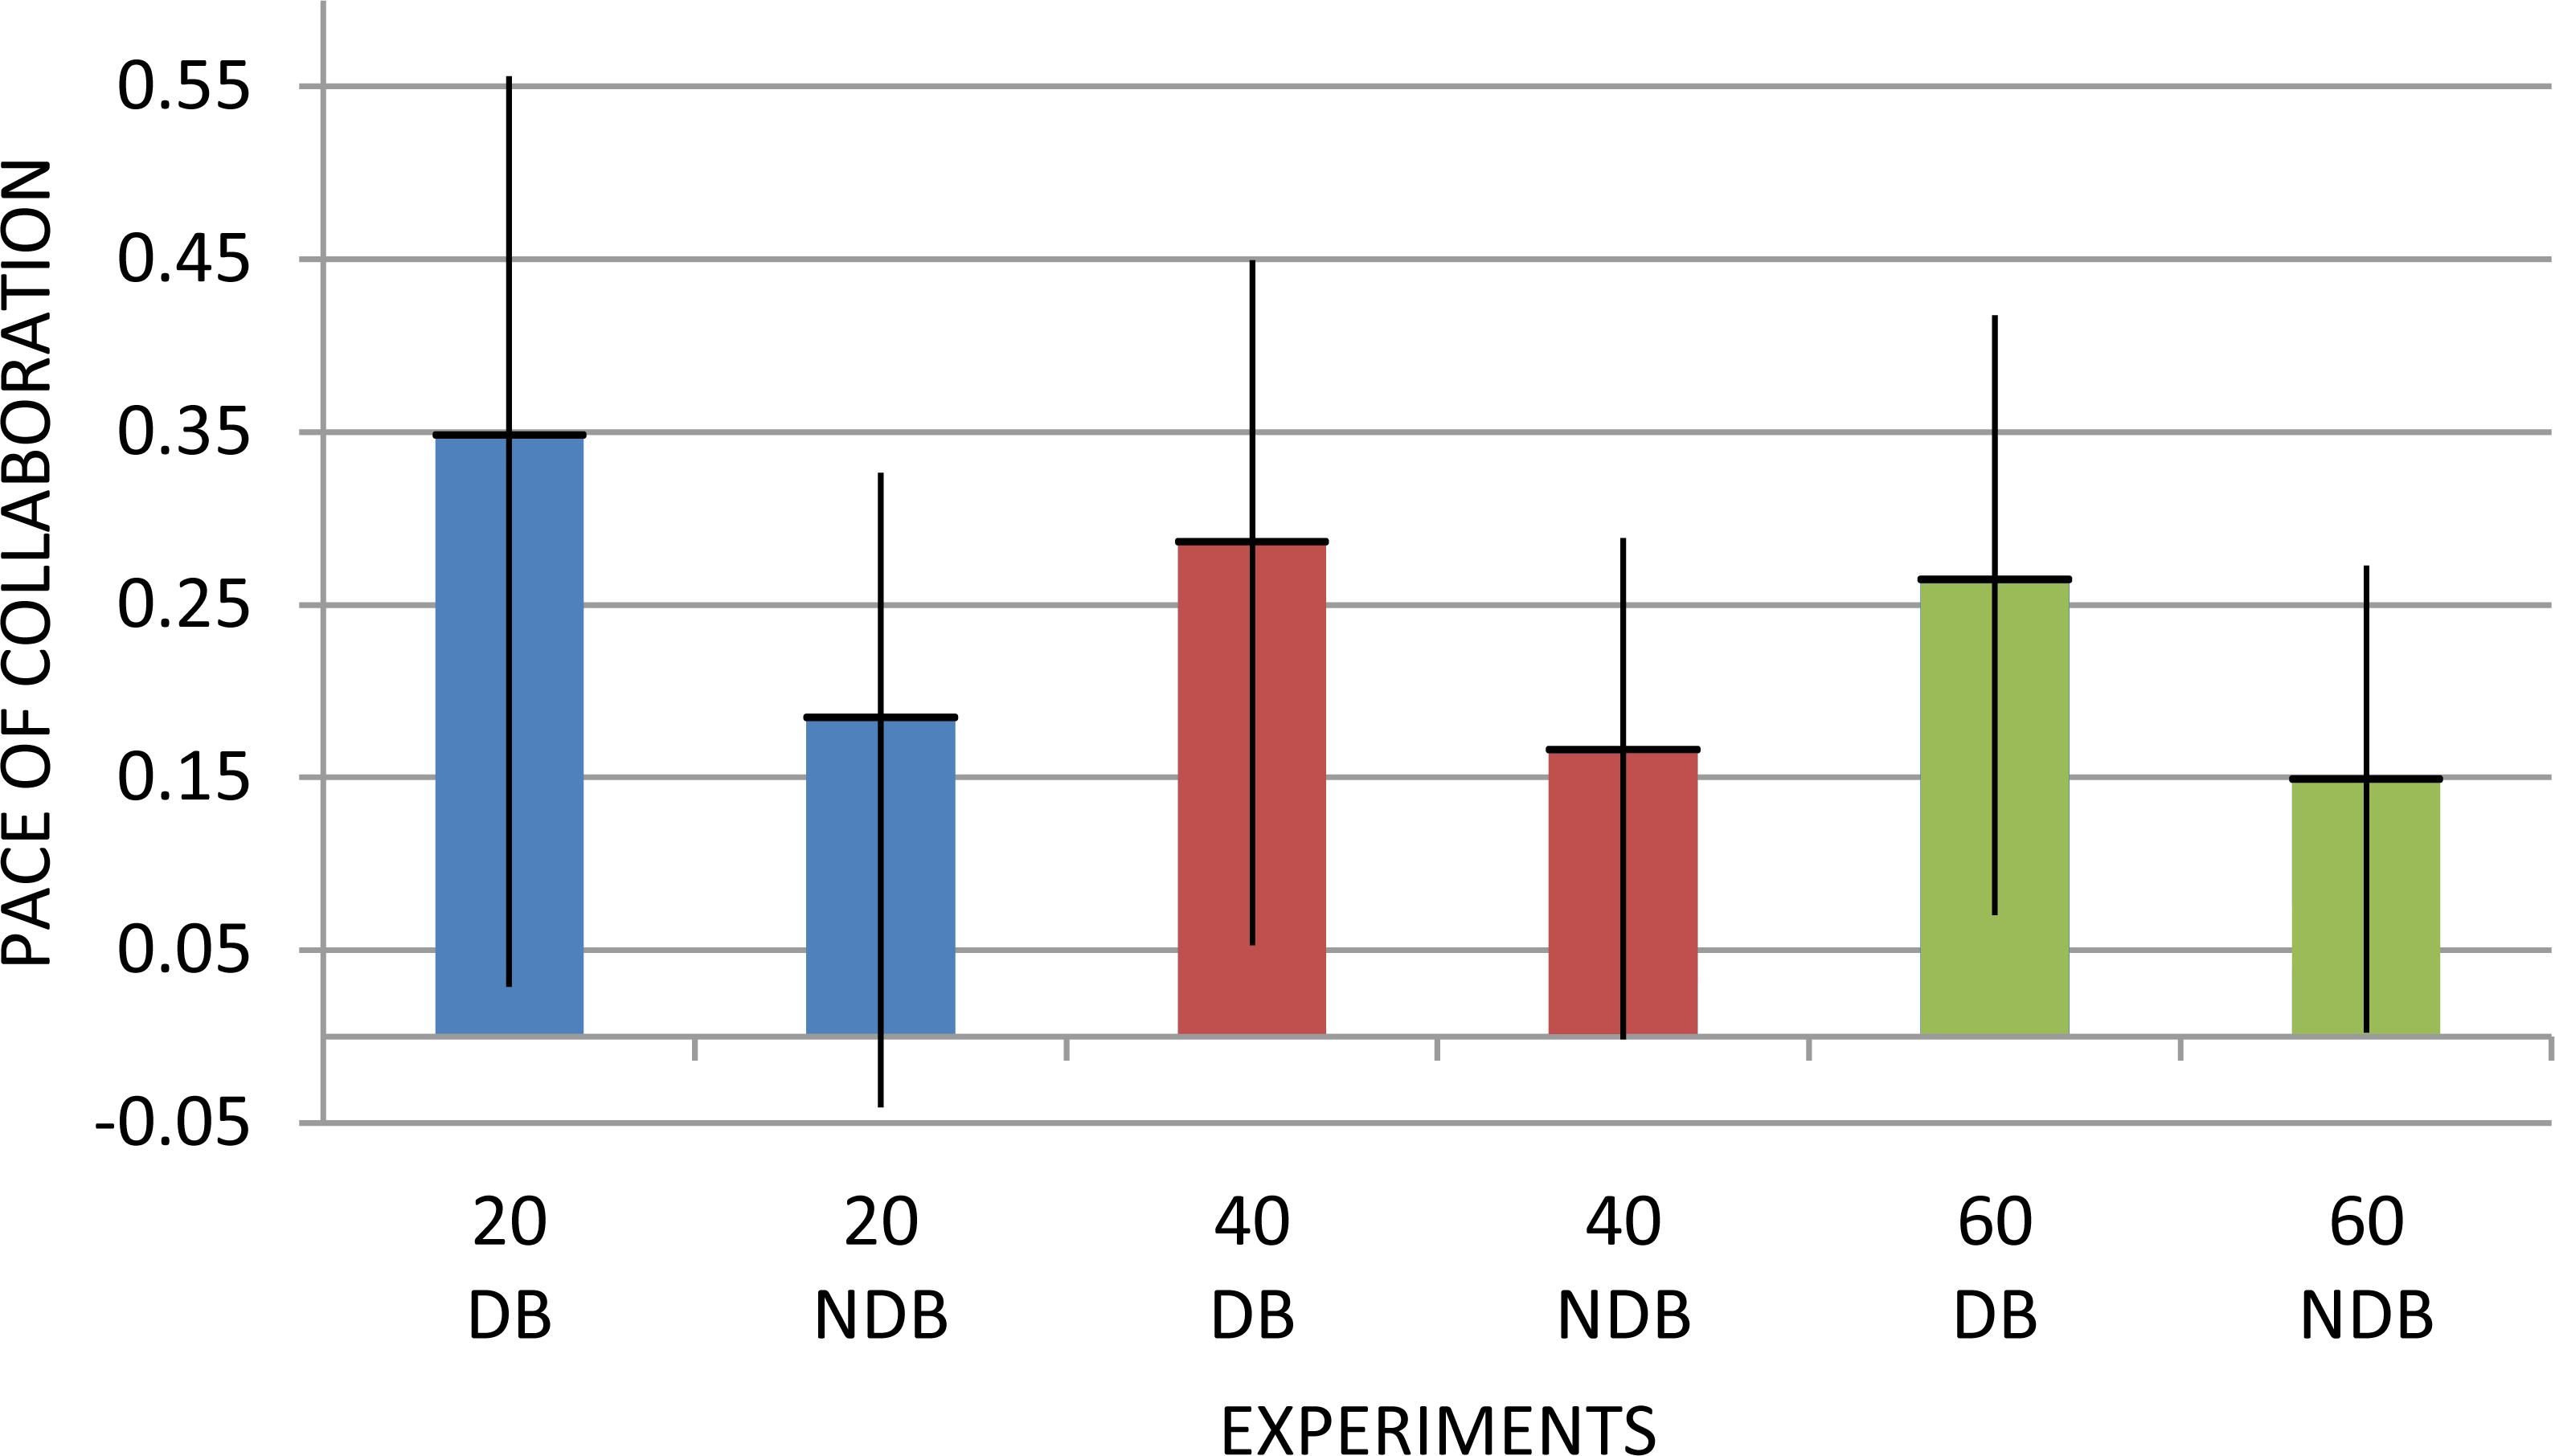
Table 4 compares the collaboration pace of 24 debutant topics with the collaboration pace of the control group in the same year. We can see how the appearance of a good number of well-known topics, which emerged in the last decade, was anticipated by the dynamics of the topic network. The Student’s t-test confirmed that the debutant and established topics do not belong to the same population (p < 0.0001). The results of the t-test also suggest that the experiment involving the 60 most co-occurring topics, represented in Fig. 11C, provides a better discrimination of debutant topics from non-debutant ones. For the sake of completeness, in Table 5 we report the p-values yielded by each experiment.
In conclusion, the results confirm that the portions of the topic network in which a novel topic will eventually appear exhibit a measurable fingerprint, in terms of increased collaboration pace, well before the topic is recognized and labelled by researchers.
Triad-based method study
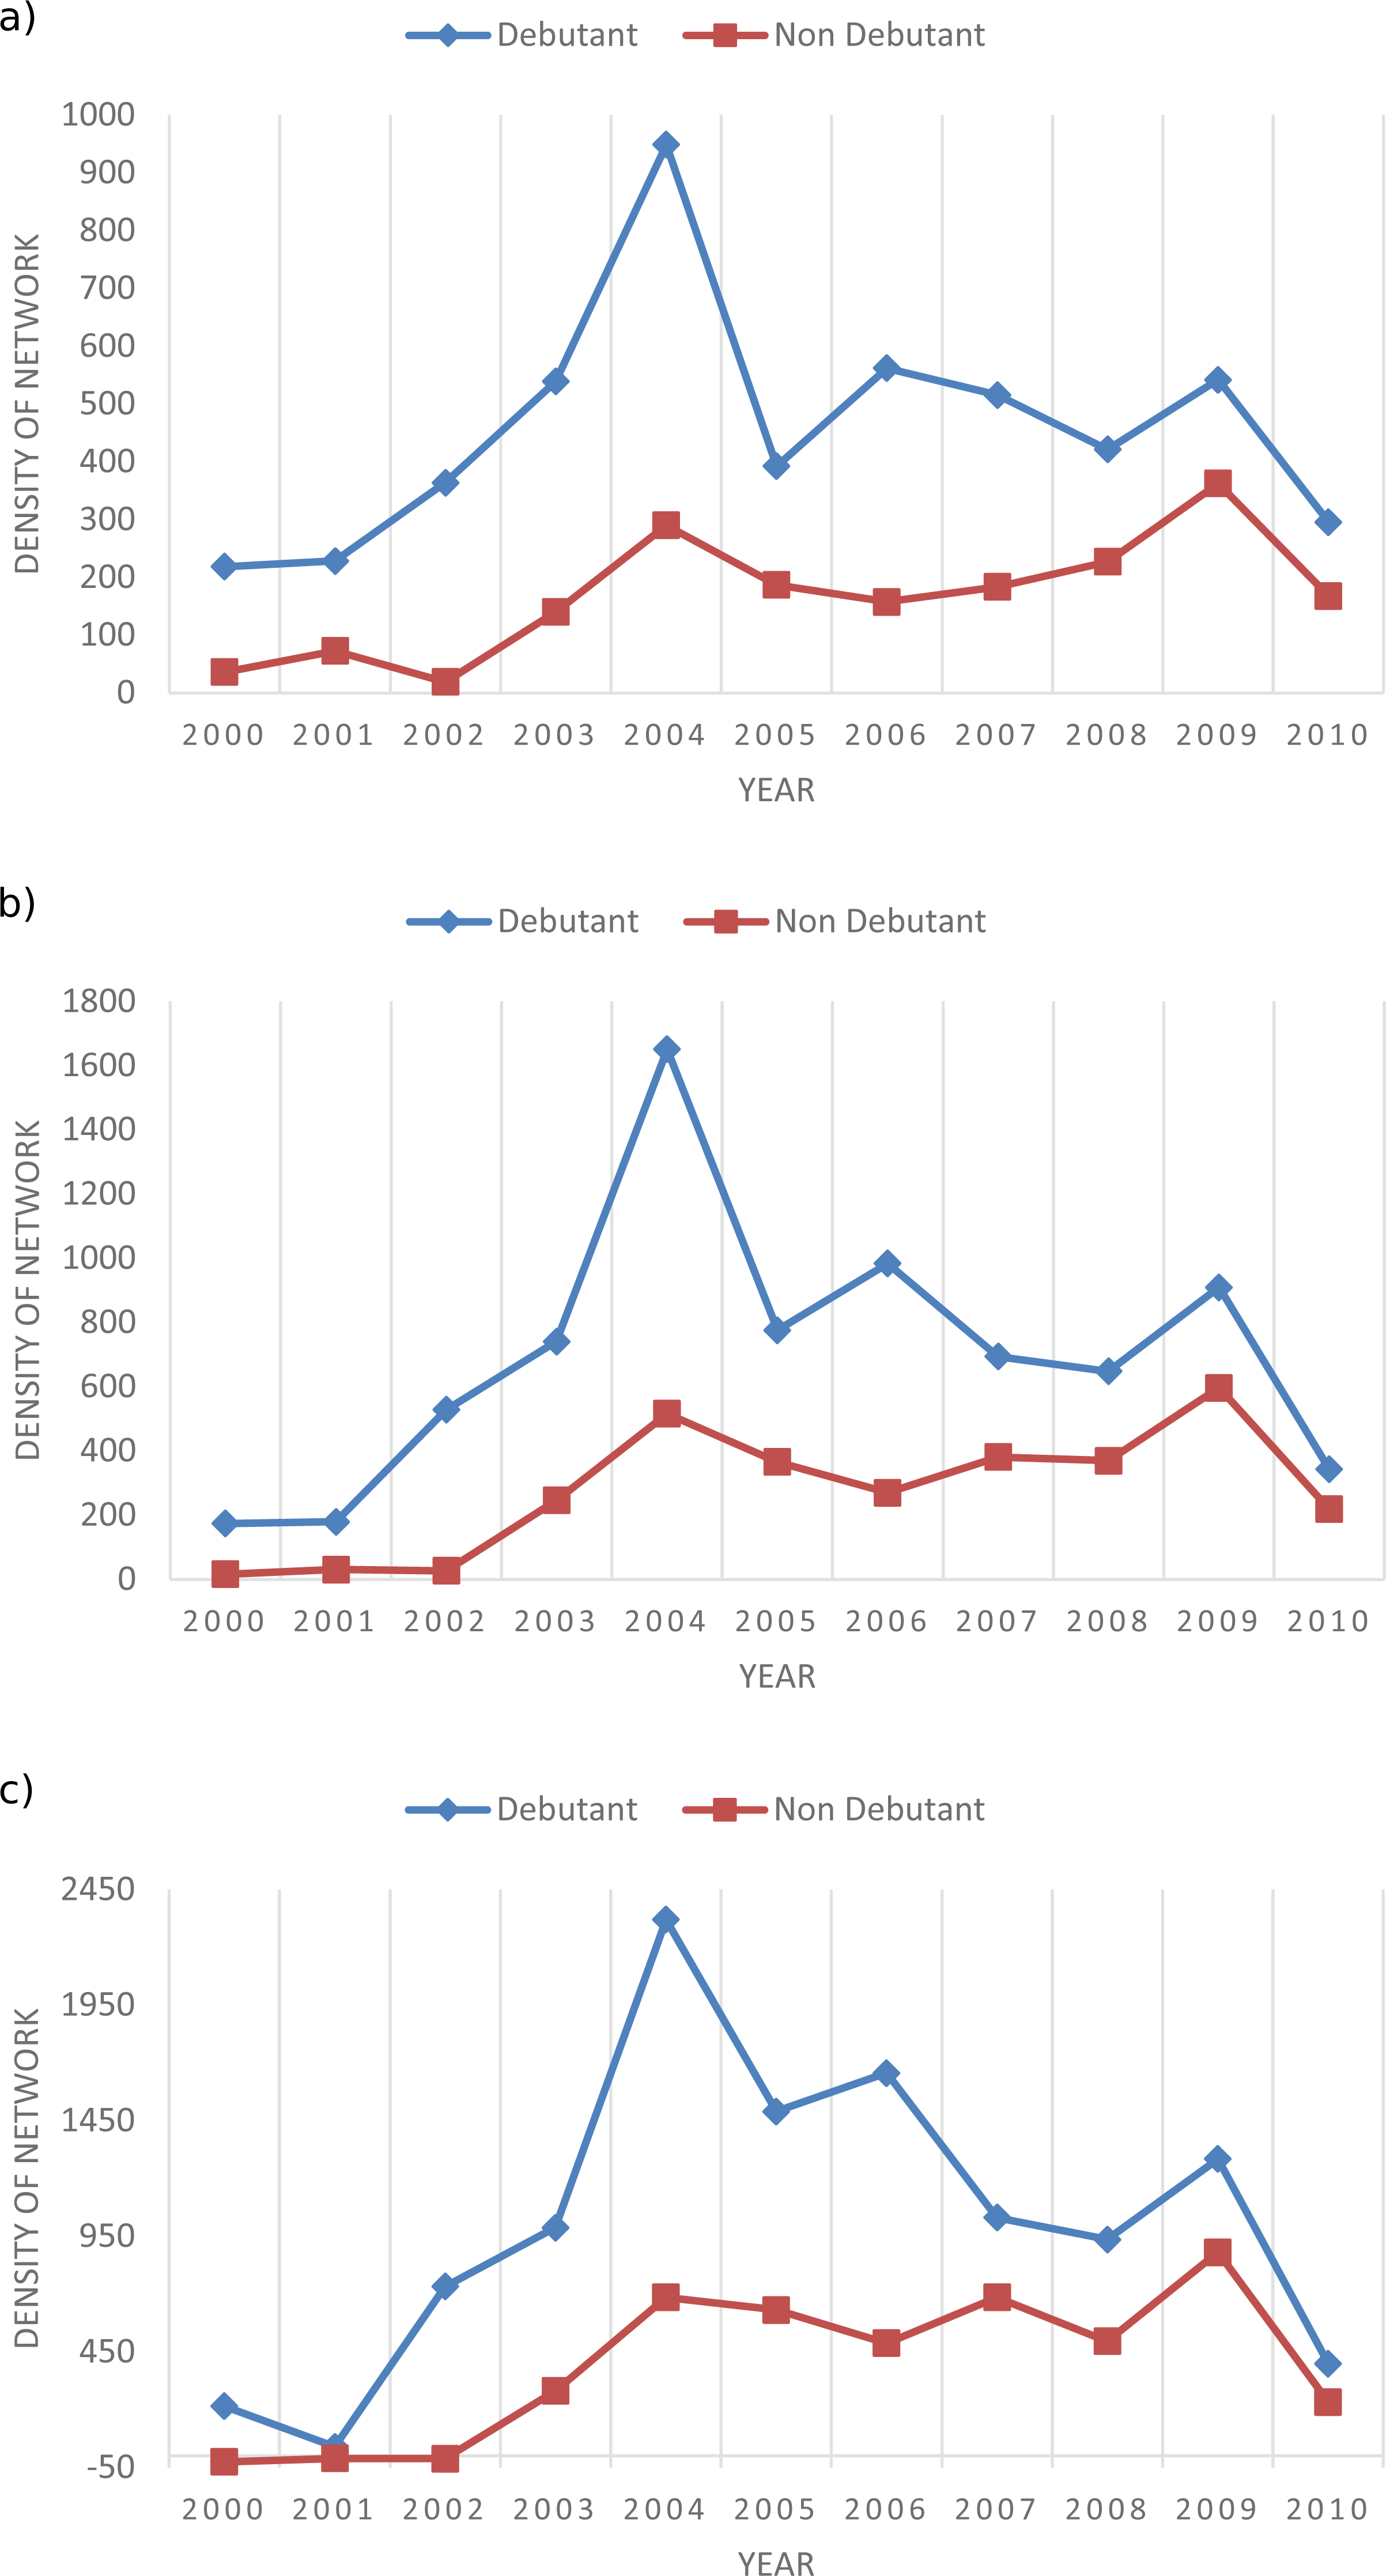
We applied the triad-based methods on the subgraphs composed by the 60 most co-occurring topics, since this configuration provided the best outcomes in previous tests. We performed multiple tests by filtering links associated with less than 3, 10 and 20 co-occurrences, to understand how collaboration strength influences the outcome.
Figure 12A reports the average value of the growth indexes when discarding links with less than 3 co-occurrences. The approach allows us to discriminate well the portion of networks related to debutant topics from the ones related to the control group. In particular, the density of network associated with the debutant topics is always higher than its counterpart. Figsures 12B and 12C report the results obtained by removing links with less than 10 and 20 co-occurrences. As in the previous experiment, we adopted the Student’s t-test to understand among the three tests which one could provide better discrimination between the two classes of topics. The results of the t-test suggest that the experiment in which we discard links with less than three co-occurrences provides a better discrimination of debutant topics from non-debutant ones. This suggests that considering weak connections is more beneficial for discriminating the two groups. The 2004 peak is caused by the debut of a number of topics associated with particularly strong underlying dynamics, such as Linked Data, Pairing-based Cryptography, Microgrid and Privacy Preservation.
| Topic (year of debut) | Collaboration Pace | Standard Collaboration pace |
|---|---|---|
| Service discovery (2000) | 0.455 | 0.156 |
| Ontology engineering (2000) | 0.435 | 0.156 |
| Ontology alignment (2005) | 0.386 | 0.273 |
| Service-oriented architecture (2003) | 0.360 | 0.177 |
| Smart power grids (2005) | 0.358 | 0.273 |
| Sentiment analysis (2005) | 0.349 | 0.273 |
| Semantic web services (2003) | 0.349 | 0.177 |
| Linked data (2004) | 0.348 | 0.250 |
| Semantic web technology (2001) | 0.343 | 0.147 |
| Vehicular ad hoc networks (2004) | 0.342 | 0.250 |
| Mobile ad-hoc networks (2001) | 0.342 | 0.147 |
| p2p network (2002) | 0.340 | 0.145 |
| Location based services (2001) | 0.331 | 0.147 |
| Service oriented computing (2003) | 0.331 | 0.177 |
| Ambient intelligence (2002) | 0.289 | 0.145 |
| Social tagging (2006) | 0.263 | 0.192 |
| Community detection (2006) | 0.243 | 0.192 |
| Cloud computing (2006) | 0.241 | 0.192 |
| User-generated content (2006) | 0.240 | 0.192 |
| Information retrieval technology (2008) | 0.231 | 0.057 |
| Web 2.0 (2006) | 0.224 | 0.192 |
| Ambient assisted living (2006) | 0.224 | 0.192 |
| Internet of things (2009) | 0.221 | 0.116 |
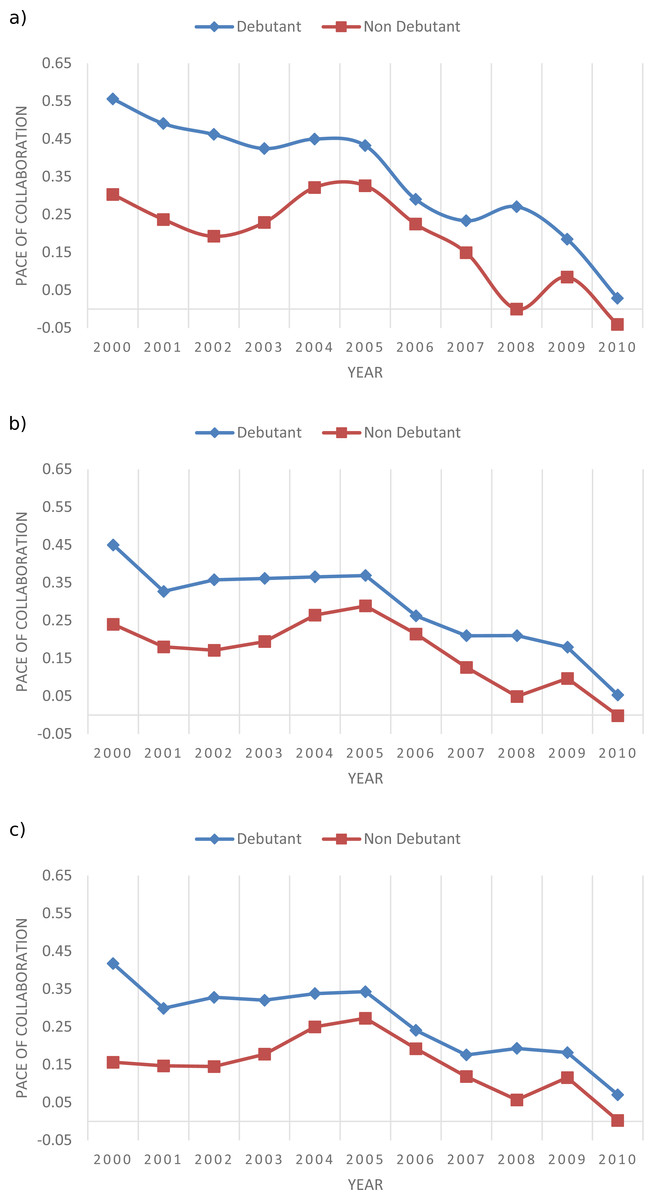
Figure 11: Average collaboration pace per year of the sub-graphs related to input topics in both debutant and control groups considering their 20 (A), 40 (B) and 60 (C) most co-occurring topics.
The year refers to the year of analysis of each topic.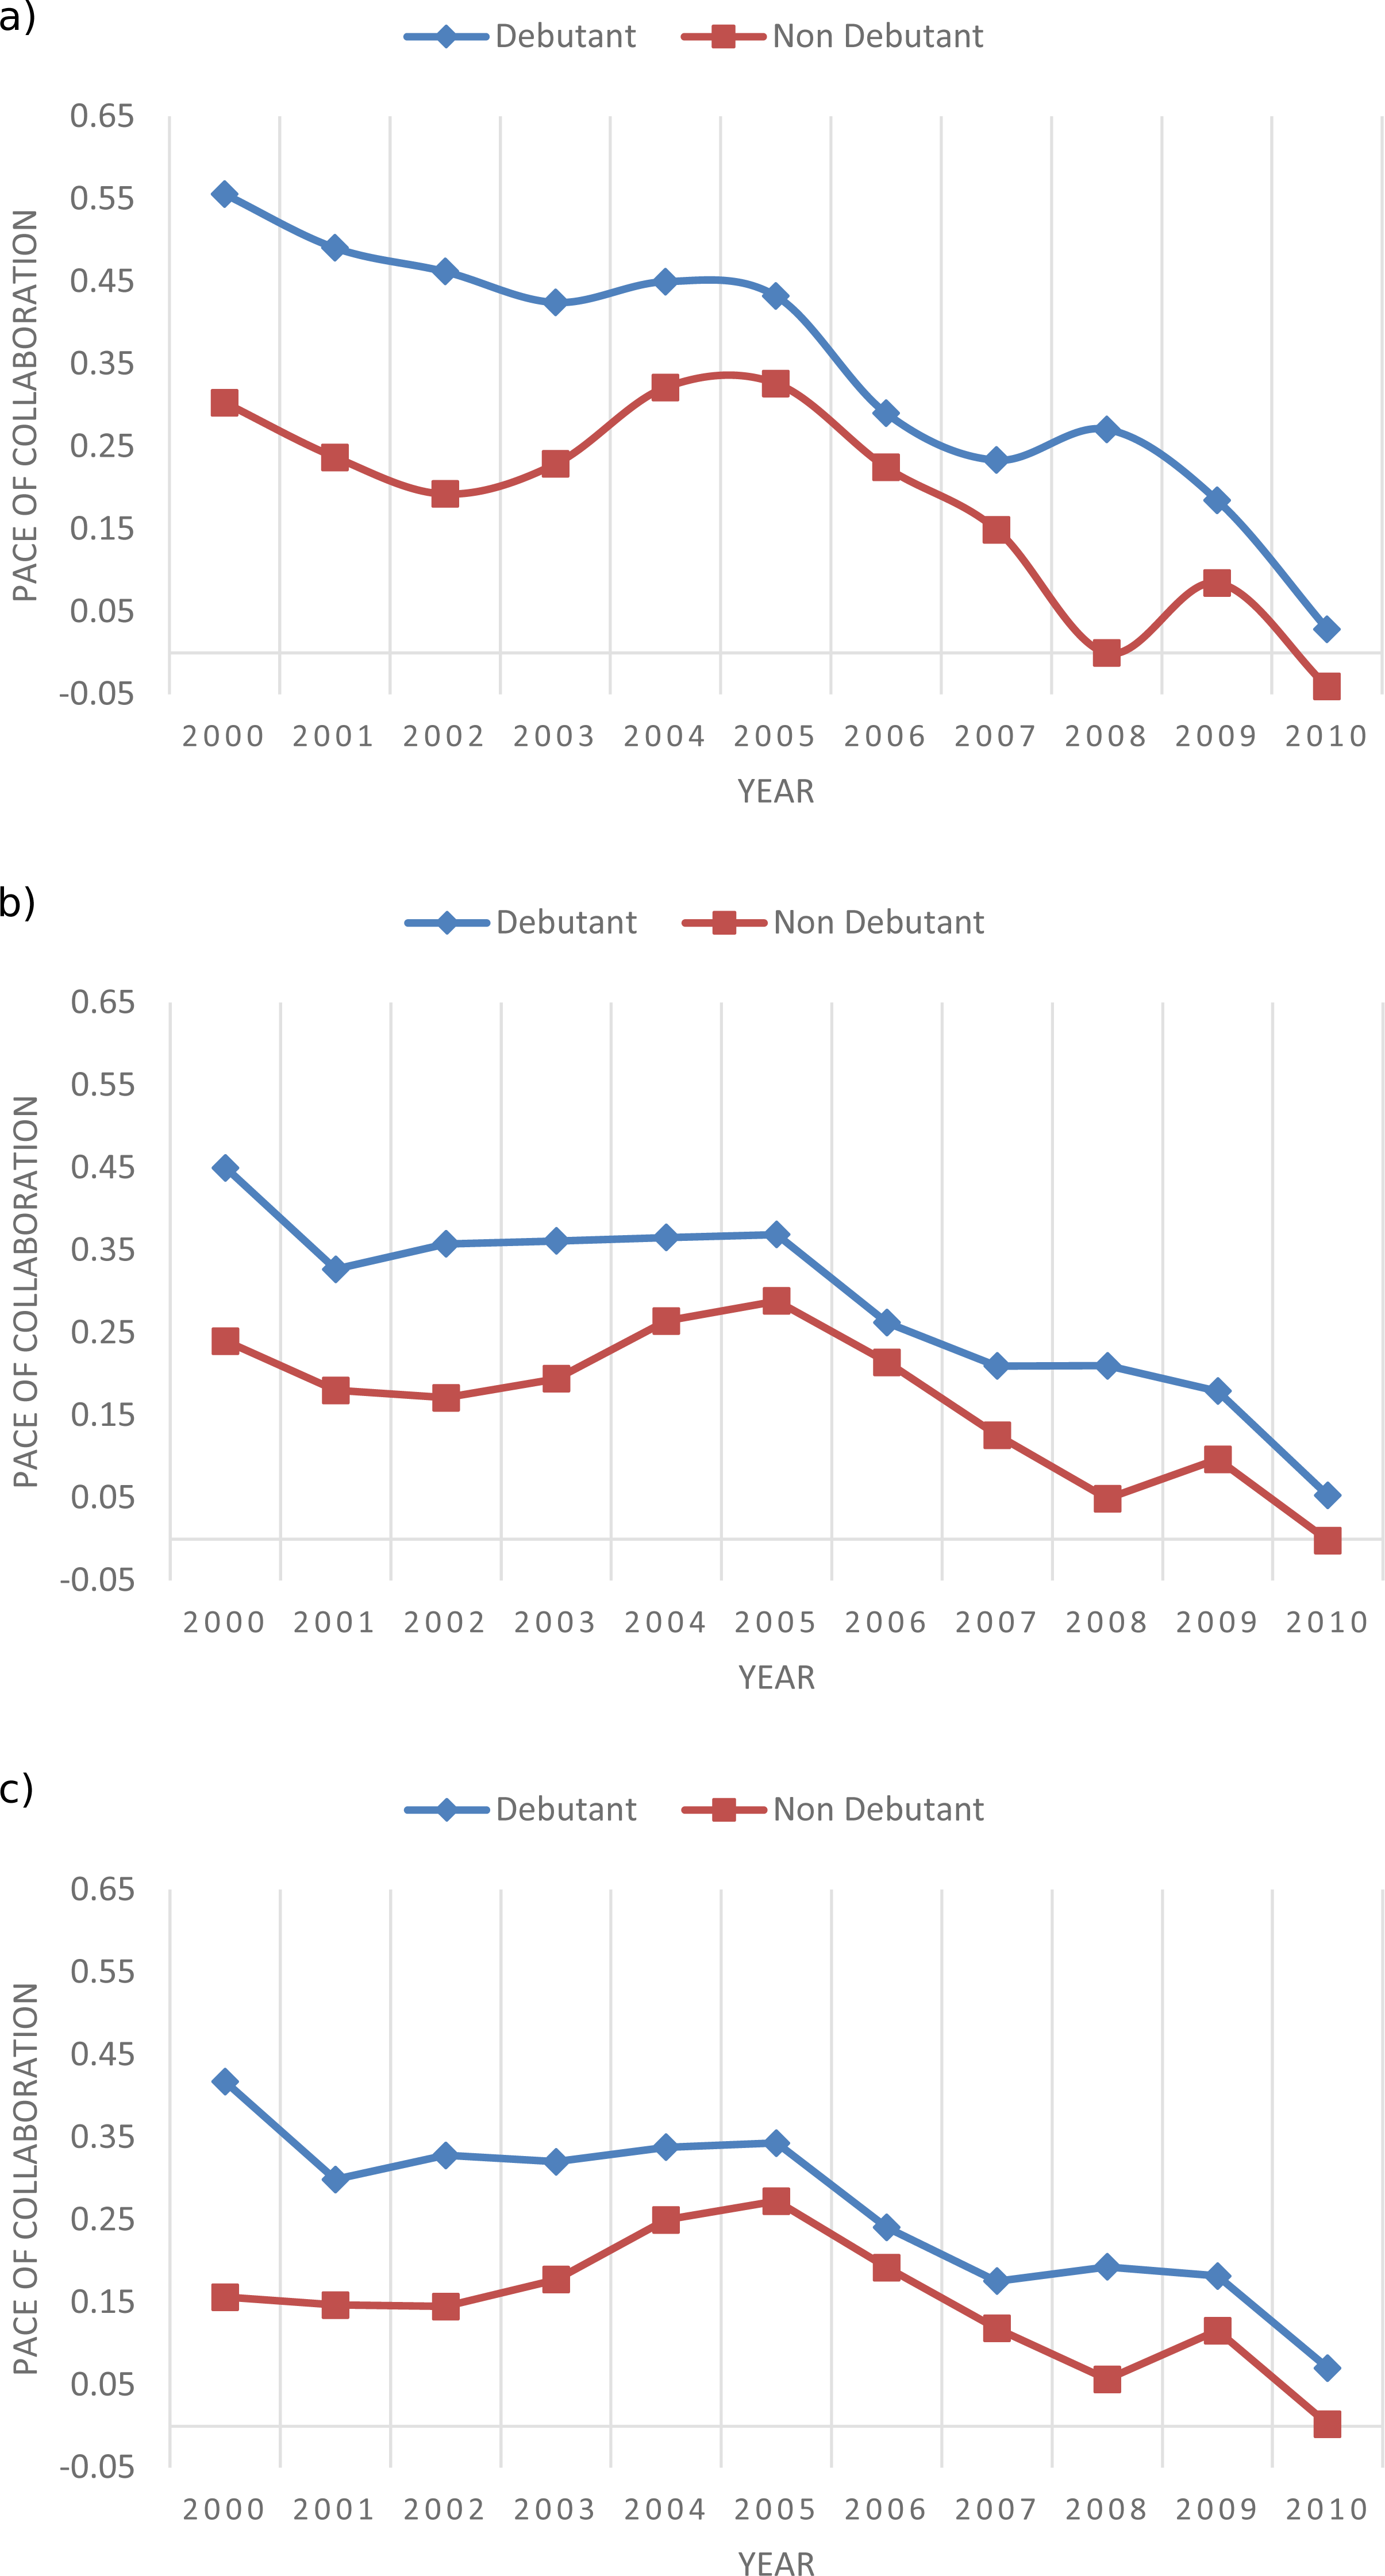
Table 6 reports as an example the triad census performed over the subgraph associated with the topic Semantic Web Technologies (SWT) debuting in 2001. We can see an increase in the number of triangles (H3) and two-stars (H2), mirroring the increasing density of the topic network. Again, this phenomenon is more evident when also using weak links (<3). The percentage of growth of full triangles is 109% in the first test and then it decreases to 86% (<10) and 36 % (<20).
Table 7 shows a selection of debutant topics and their growth indexes compared with the growth index of the control group in the same year. If we can compare this table to Table 4, we can see that the two methods used in this study reflect the same dynamics.

Figure 12: Average growth index per year of the sub-graphs related to the topics in both debutant and non-debutant groups considering their 60 most co-occurring topics and filtering links having with less than 3 (A), 10 (B) and 20 (C) publications.
| Removing links <3 | Removing links <10 | Removing links <20 | ||||||||||
|---|---|---|---|---|---|---|---|---|---|---|---|---|
| Graph | H0 | H1 | H2 | H3 | H0 | H1 | H2 | H3 | H0 | H1 | H2 | H3 |
| 1996 | 1,124 | 1,157 | 658 | 337 | 641 | 676 | 316 | 138 | 796 | 509 | 174 | 618 |
| 1997 | 928 | 1,237 | 670 | 441 | 1,022 | 828 | 315 | 135 | 632 | 432 | 204 | 62 |
| 1998 | 1,255 | 1,353 | 657 | 389 | 585 | 705 | 300 | 181 | 525 | 418 | 145 | 52 |
| 1999 | 1,307 | 1,431 | 861 | 461 | 1,222 | 1,098 | 413 | 192 | 569 | 497 | 187 | 77 |
| 2000 | 913 | 1,399 | 1,043 | 705 | 1,482 | 1,361 | 554 | 257 | 842 | 618 | 228 | 83 |
| Topic (year of debut) | Growth index | Standard growth index |
|---|---|---|
| Service discovery (2000) | 290.29 | 35.97 |
| Ontology engineering (2000) | 207.22 | 35.97 |
| Ontology alignment (2005) | 399.60 | 186.89 |
| Service-oriented architecture (2003) | 628.07 | 140.17 |
| Smart power grids (2005) | 637.53 | 186.89 |
| Sentiment analysis (2005) | 354.10 | 186.89 |
| Semantic web services (2003) | 439.85 | 140.17 |
| Linked data (2004) | 590.81 | 289.94 |
| Semantic web technology (2001) | 465.53 | 72.71 |
| Vehicular ad hoc networks (2004) | 859.44 | 289.94 |
| Mobile ad-hoc networks (2001) | 87.31 | 72.71 |
| p2p network (2002) | 305.28 | 18.92 |
| Location based services (2001) | 595.90 | 72.71 |
| Service oriented computing (2003) | 422.92 | 140.17 |
| Ambient intelligence (2002) | 308.34 | 18.92 |
| Social tagging (2006) | 429.77 | 157.69 |
| Community detection (2006) | 583.21 | 157.69 |
| Cloud computing (2006) | 695.79 | 157.69 |
| User-generated content (2006) | 485.89 | 157.69 |
| Information retrieval technology (2008) | 552.14 | 227.02 |
| Web 2.0 (2006) | 387.42 | 157.69 |
| Ambient assisted living (2006) | 940.79 | 157.69 |
| Internet of things (2009) | 580.33 | 167.86 |
With the null hypothesis “The differences in growth index between the debutant topics and topics in the control group result purely from chance”, we ran Student’s t-test over the two distributions of growth indexes, for all three experiments. It yielded p < 0.0001 for all the experiments. More details about the computed p-values per each experiment performed in this triad-based study can be found in Table 8. Figure 13 shows, as an example, the distributions associated to the two groups of topics obtained in the first test.
Hence, the results from this second experiment confirm our initial hypothesis too. In addition, per Table 8, the results from the t-test also suggest that the first experiment, which ignores the links associated with less than three publications, better discriminates the two populations.
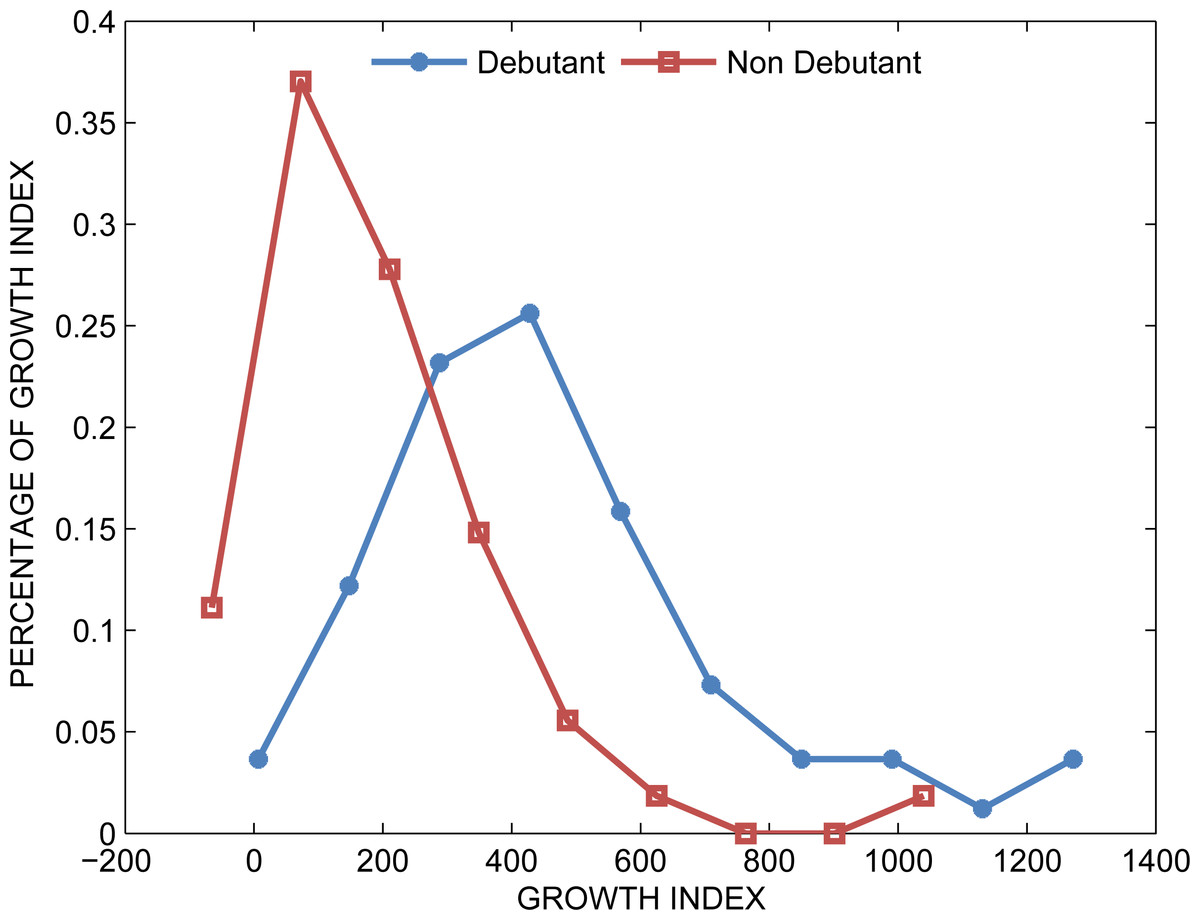
Figure 13: Distributions of growth indexes for both groups when filtering links associated with less than three publications.
Discussion
We analysed the topic network with the aim of experimentally confirming our hypothesis that the emergence of new research areas is anticipated by an increased rate of interaction of pre-existing topics. We examined the pace of collaboration (via the clique-based method) and the change in topology (via the triad-based method) in portions of the network related to debutant topics, showing that it is possible to effectively discriminate areas of the topic graph associated with the future emergence of new topics. The first experiment showed that the subgraphs associated with the emergence of a new topic exhibit a significantly higher pace of collaboration than the control group of subgraphs associated with established topics. Similarly, the second experiment showed that the graphs associated with a new topic display a significantly higher increase in their density than the control group. We can thus confirm that these two aspects can play a key role in the context of defining methods for detecting embryonic topics.
Interestingly, the ability of the two approaches in discriminating the debutant group from the control group varies with the time interval considered. It appears that the clique-based approach (see Fig. 11) discriminates them more effectively in the initial period, whereas the triad-based method (Fig. 12) seems to perform better in the central years (2004–2007). We intend to investigate in future work if these behaviours are associated with specific characteristics of the network.
The results of these two experiments allow us to effectively discriminate specific sections of the topic graph and suggest that a significant increase in the rate of collaboration between existing topics provides a strong indicator for predicting the emergence of new research areas. Even a simple threshold over the indexes introduced in this study allows us to discriminate well the subgraphs that will produce new research areas. For example, Table 9 reports the pace of collaboration obtained for both debutant and non-debutant topics in 2004. Here we can appreciate that a 0.41 threshold corresponding to a 100% precision is able to retrieve 8 out of 9 debutant topics. Table 10 displays other cases in which it is possible to obtain a very good recall when choosing a threshold corresponding to 100% precision. The application of this technique in a realistic setting would however require a scalable method for identifying promising topic graphs.
While these results are satisfactory, our analysis presents some limitations, which we shall address in future work.
In particular, we identified the relevant subgraph during the selection phase simply by selecting the n most co-occurrent topics of the topic under analysis. This solution allows us to compare graphs of the same dimension, however it introduces two issues.
First of all, it assumes that all topics derive from the same number of research areas, which is an obvious simplification. Emerging topics may have a different nature, based on their origin, development patterns, interactions of pioneer researchers, and so on. Therefore, each of them will be linked to a different number of established research areas. A manual analysis of the data suggests that using a constant number of co-occurring topics is one of the reasons why the overall pace of collaboration and growth index associated with the emergent topics are not much higher than the ones of the control group. When selecting too many co-occurring topics, we may include less significant research areas or, alternatively, research areas that started to collaborate with the topic in question only after its emergence. Conversely, when selecting too few topics, the resulting graph may exclude some important ones.
| Testing topic | Pace of collaboration | Debutant/Control |
|---|---|---|
| Linked data | 0.538 | D |
| Bilinear pairing | 0.499 | D |
| Wimax | 0.488 | D |
| Separation logic | 0.463 | D |
| Phishing | 0.446 | D |
| Micro grid | 0.433 | D |
| Privacy preservation | 0.426 | D |
| Vehicular ad hoc networks | 0.416 | D |
| Mobile computing | 0.409 | C |
| Electromagnetic dispersion | 0.401 | C |
| Online learning | 0.357 | C |
| Wavelet analysis | 0.326 | C |
| Program interpreters | 0.325 | C |
| Zigbee | 0.313 | D |
| Natural sciences computing | 0.308 | C |
| Knowledge discovery | 0.300 | C |
| Fuzzy neural networks | 0.298 | C |
| Three term control systems | 0.250 | C |
| Year | 2001 | 2004 | 2006 |
|---|---|---|---|
| Threshold | 0.35 | 0.41 | 0.23 |
| Recall | 8/9 | 8/9 | 11/14 |
| Precision | 8/8 | 8/8 | 11/11 |
A second limitation is that the selection phase performed in our study cannot be reused in a system capable of automatically detecting embryonic topics, since it requires knowledge of the set of topics with which the embryonic topic will co-occur in the future. However, this could be fixed by developing techniques that are able to select promising subgraphs according to their collaboration pace and density. For this purpose we are currently developing an approach that generates a topic graph in which (i) links are weighted according to the acceleration in the pace of collaboration between the two relevant topics and (ii) community detection algorithms are applied to select portions of the network characterized by an intense collaboration between topics. We expect that this solution will be able to detect at a very early stage that ‘something’ new is emerging in a certain area of the topic graph, even if it may not be able to accurately define the topic itself. It would thus allow relevant stakeholders to react very quickly to developments in the research landscape.
The findings of this analysis also provide contributions of potential value to research in Philosophy of Science. Firstly, they appear to support our hypothesis about the existence of an embryonic phase in the lifecycle of research topics. Secondly, they bring new empirical evidence to fundamental theories in Philosophy of Science, which are concerned with the evolution of scientific disciplines, e.g., Herrera, Roberts & Gulbahce (2010), Kuhn (2012), Nowotny, Scott & Gibbons (2013), and Sun et al. (2013). Finally, they highlight that new topics tend to be born in an environment in which previously less interconnected research areas start to cross-fertilise and generate new ideas. This suggests that interdisciplinarity is one of the most significant forces that drives innovation forward, allowing researchers to integrate a diversity of expertise and perspectives, and yield new solutions and new scientific visions. Hence the results of our analysis could be used to support policies that promote interdisciplinary research.
Conclusions
We hypothesised the existence of an embryonic phase for research topics, where, while they have not yet been consistently labelled or associated with a considerable number of publications, they can nonetheless be detected through an analysis of the dynamics of already existing topics. To confirm this hypothesis, we performed an experiment on 75 debutant topics in Computer Science, which led to the analysis of a topic network comprising about 2,000 topics extracted from a sample of three million papers in the 2000–2010 time interval. The results confirm that the creation of novel topics is anticipated by a significant increase in the pace of collaboration and density of the portions of the network in which they will appear. These findings provide supporting evidence for the existence of an embryonic phase for research topics and can be built on to foster further research to develop new techniques for the detection of topics at this stage. They also bring new empirical evidence to theories in Philosophy of Science. Finally, they suggest that an interdisciplinary environment provides a fertile ground for the creation of novel research topics.
We now plan to exploit the dynamics discussed in this study to create a fully automatic approach for detecting embryonic topics. We also intend to study and integrate additional dynamics involving other research entities, such as authors and venues. The aim is to produce a robust approach to be used by researchers and companies alike for gaining a better understanding of where research is heading.