
VESPA: Very large-scale Evolutionary and Selective Pressure Analyses
- Published
- Accepted
- Received
- Academic Editor
- James Procter
- Subject Areas
- Bioinformatics, Computational Biology
- Keywords
- Selective pressure analysis, Protein molecular evolution, Large-scale comparative genomics, Gene family evolution, Positive selection
- Copyright
- © 2017 Webb et al.
- Licence
- This is an open access article distributed under the terms of the Creative Commons Attribution License, which permits unrestricted use, distribution, reproduction and adaptation in any medium and for any purpose provided that it is properly attributed. For attribution, the original author(s), title, publication source (PeerJ Computer Science) and either DOI or URL of the article must be cited.
- Cite this article
- 2017. VESPA: Very large-scale Evolutionary and Selective Pressure Analyses. PeerJ Computer Science 3:e118 https://doi.org/10.7717/peerj-cs.118
Abstract
Background
Large-scale molecular evolutionary analyses of protein coding sequences requires a number of preparatory inter-related steps from finding gene families, to generating alignments and phylogenetic trees and assessing selective pressure variation. Each phase of these analyses can represent significant challenges, particularly when working with entire proteomes (all protein coding sequences in a genome) from a large number of species.
Methods
We present VESPA, software capable of automating a selective pressure analysis using codeML in addition to the preparatory analyses and summary statistics. VESPA is written in python and Perl and is designed to run within a UNIX environment.
Results
We have benchmarked VESPA and our results show that the method is consistent, performs well on both large scale and smaller scale datasets, and produces results in line with previously published datasets.
Discussion
Large-scale gene family identification, sequence alignment, and phylogeny reconstruction are all important aspects of large-scale molecular evolutionary analyses. VESPA provides flexible software for simplifying these processes along with downstream selective pressure variation analyses. The software automatically interprets results from codeML and produces simplified summary files to assist the user in better understanding the results. VESPA may be found at the following website: http://www.mol-evol.org/VESPA.
Introduction
Estimating selective pressure variation across homologous protein-coding genes from different species is typically done by assessing the ratio of dN/dS, i.e., the number of non-synonymous substitutions per non-synonymous site (dN) as a function of the number of synonymous substitutions per synonymous site (dS). The ratio of dN/dS is commonly referred to as omega (ω), and is routinely used to assess selective pressure variation or constraints across protein families or protein-interaction networks (Kim, Korbel & Gerstein, 2007; Kosiol et al., 2008; Alvarez-Ponce, Aguade & Rozas, 2009). These calculations of selective pressure variation are performed on alignments of protein coding sequences (and not on other data types such as raw reads from NGS experiments). Codeml is part of the PAML package for the analyses of selective pressure variation in nucleotide sequence data in a maximum likelihood framework (Yang, 2007). The models available in PAML for assessing selective pressure variation can simultaneously compare variation across sites and across lineages in the homologous protein coding gene dataset. In this way the “foreground lineage” is compared to all other lineages in the dataset in an attempt to determine lineage specific selective pressure variation. Some well-known examples of selective pressure variation on foreground lineages include the identification of positive selection in reproductive proteins that contribute to species divergence in mammals (Swanson et al., 2001), and the identification of molecular signatures of positive selection that govern protein functional divergence in a group of mammal enzymes (Loughran et al., 2012). A number of software packages estimate selective pressure variation (Pond, Frost & Muse, 2005; Yang, 2007; Delport et al., 2010). One of the most popular methods is codeML from the PAML software package (Yang, 2007). The strength of this approach is the application of flexible codon-based models capable of assessing variation in selective pressures at two levels: (i) across sites in an alignment and (ii) across sites in a predefined, or “foreground” lineage on a phylogenetic tree (Yang & Dos Reis, 2011).
Operating codeML requires a complex file structure to compute the parameters under multiple nested models. Associated likelihood ratio tests (LRTs) must also be performed in the identification of the model of best fit. These complexities are often compounded by the size of study, which increasingly are genomic in scale (Liu et al., 2014; Keane et al., 2015; Webb et al., 2015). Other approaches to streamline the process of applying codon-based models of evolution to homologous sequences sets focus on site-specific models such as POTION (Hongo et al., 2015).
To address these issues we have designed VESPA (Very large-scale Evolutionary and Selective Pressure Analyses). VESPA automates selective pressure analyses and associated prerequisite analyses and post-analysis summary statistics. VESPA can perform both lineage-site specific and site-specific analyses whereas POTION presently performs the site-specific analyses. Therefore, VESPA is unique in its capacity to perform the complex set of tasks involved in assessing lineage specific selective pressure variation across homologous gene families and across lineages. VESPA minimizes the majority of data manipulation requirements for standard molecular evolutionary analyses and also automatically implements and analyzes selective pressure variation analyses using codeML (Yang, 2007). In addition, VESPA supplies an assessment of potential false positives and produces summary files of the results that are easy to interpret. VESPA allows the user to take advantage of the wealth of publically available genomic data from model and non-model organisms to perform large-scale analyses of homology searching, alignment, phylogeny reconstruction and selective pressure variation. All that VESPA requires is the protein coding DNA sequences, which it will translate with the standard genetic code and use to search and construct gene family alignments. This flexible toolkit can permit large-scale analyses to be performed in an efficient manner and with fewer errors.
Methods
VESPA helps automation by preparing input data files and processing results but program executions are initiated by the user (e.g., via submission to an HPC queuing system. VESPA has five major phases (Table 1 and Fig. 1), each of which is composed of a number of functions. VESPA was developed as a toolkit of various independent functions within each phase and the primary goal is to simplify the procedures involved in large-scale selective pressure variation analyses. Each function either completes a specific phase of the analysis (e.g., homologous gene identification) or facilitates/automates the use of third-party software packages to complete more specialized procedures. The majority of functions are written in Python 2.7 and are designed to operate on a UNIX command-line. Functions are categorized as either basic or advanced, e.g., the function to identify single gene orthologs is a basic function whereas confirming both SGOs and multi-gene families (MGFs) is an advanced function (Fig. 2). This structure also provides users with a flexible and adaptable framework for more specialist tasks. For in-depth description and format requirements, please see the program manual, tutorials and documentation published on the program website (http://www.mol-evol.org/VESPA).
| Phase | Purpose | Supported input type | Supported file formats |
|---|---|---|---|
| 1 | Data preparation | Protein coding DNA sequencesa | FASTA |
| 2 | Homology searching | BLAST/HMMER output files | BLAST tabular, HMMER standard |
| 3 | Alignment assessment and phylogeny reconstruction | Multiple sequence alignmentsa | FASTA, NEXUS, PHYLIP |
| 4 | Selective pressure analysis preparation | Gene phylogenies (or species phylogenies) with corresponding Multiple sequence alignmentsa | Trees: Newick, NEXUS; Alignments: See above |
| 5 | Selective pressure analysis assessment | Standard codeML output files generated directly by the software | VESPA formatted codeML output |

Figure 1: Overview of the 5 Phases implemented in VESPA.
The five phases of VESPA are listed from “Data Preparation” to “Selective Pressure Analysis Assessment”. Underneath each is a grey box enclosing some representative commands from that phase. Each phase concludes with a black box indicating the use of a third-party program to perform the necessary task (e.g., sequence alignment or phylogenetic reconstruction). The output of the first four phases is then used as the input of the next phase. The final phase is written in Perl and concludes with the creation of summary files that contain all the relevant information from the selective pressure analyses.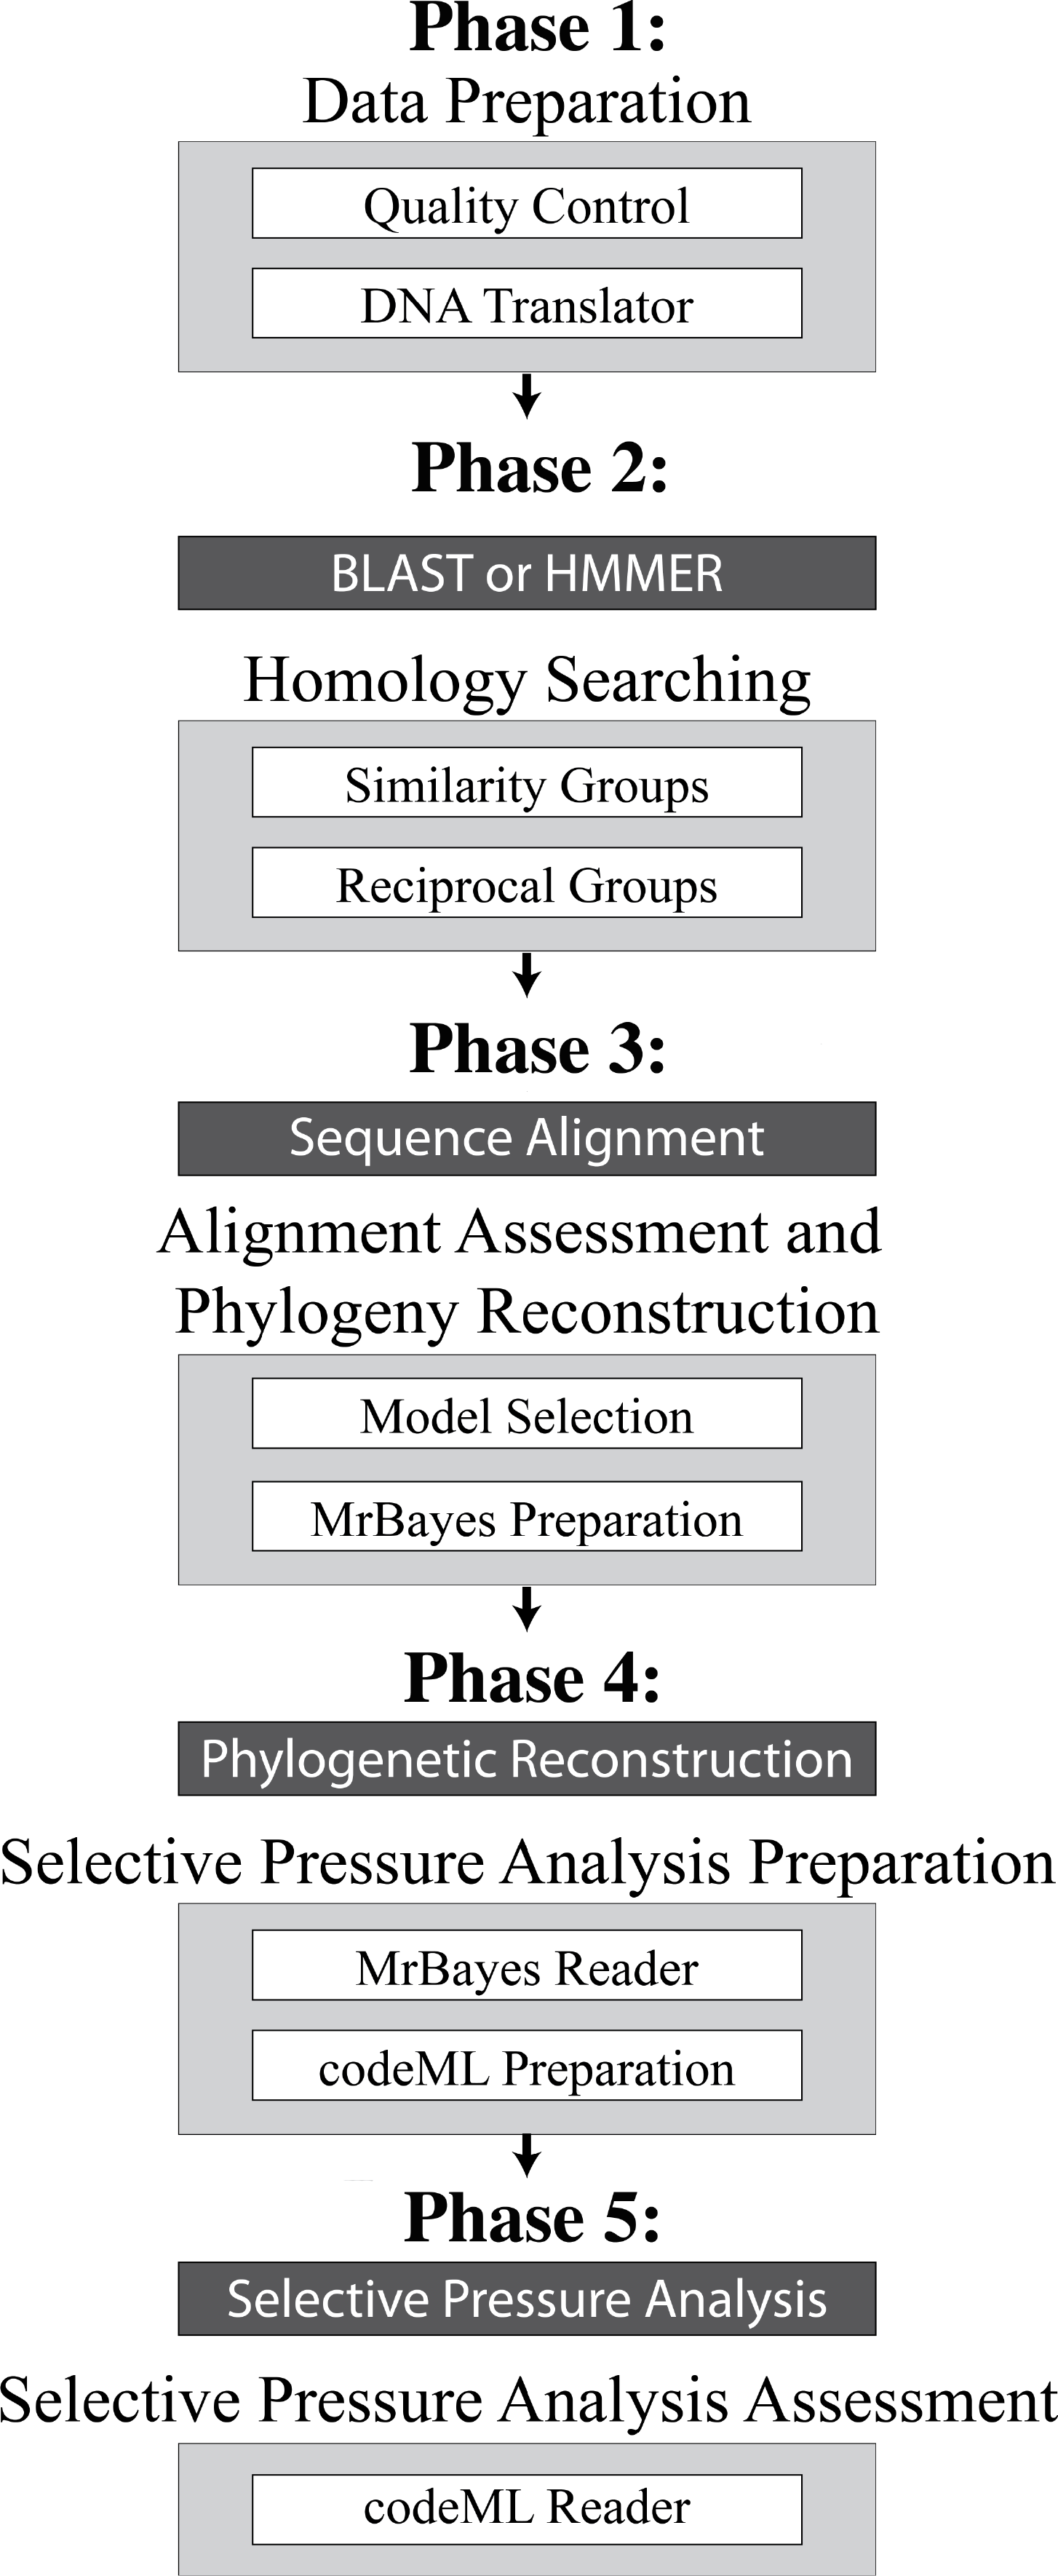
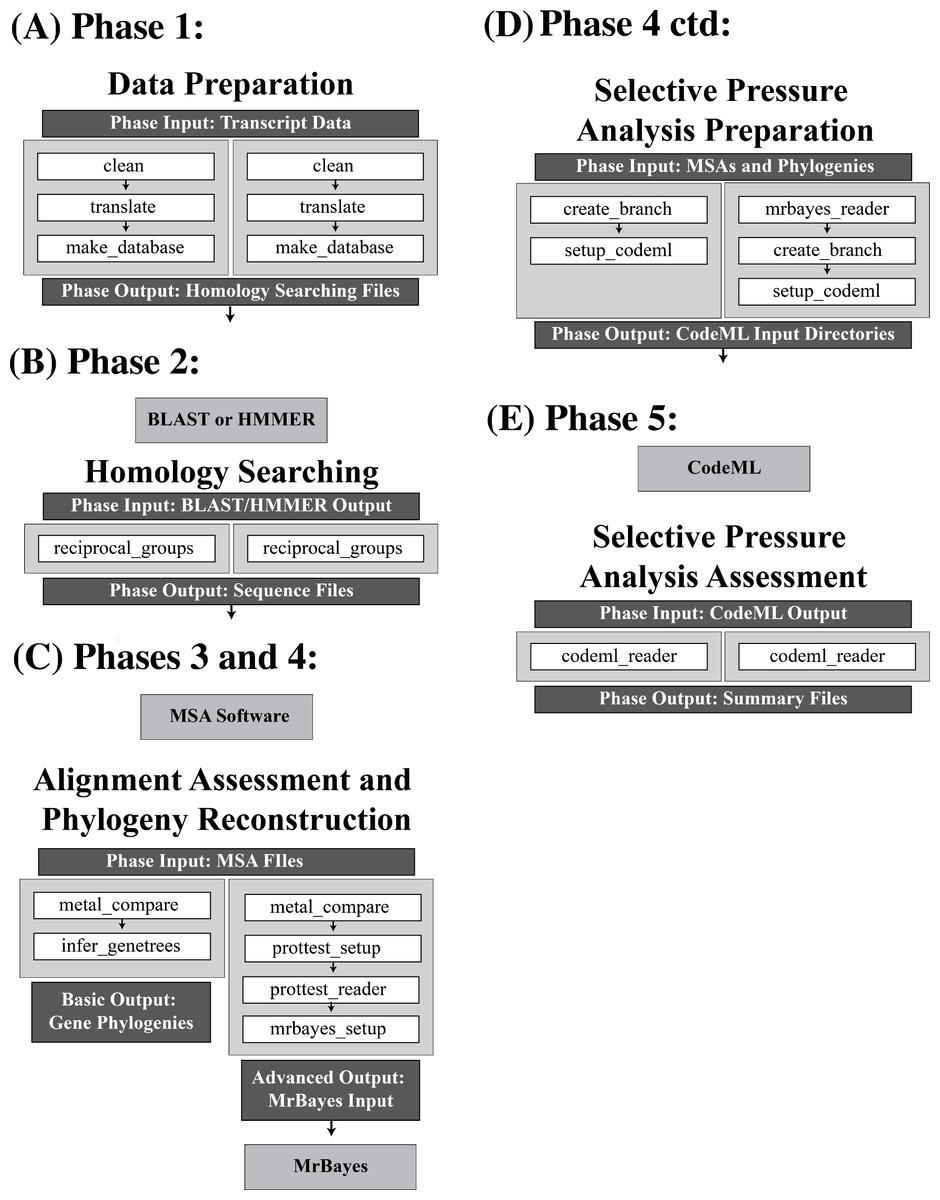
Figure 2: Overview of the options available in the VESPA package.
An overview of the basic and advanced analysis options at each of the five phases of VESPA. The functions of each phase are shown as white boxes, and are invoked in the order shown (Note: that not all functions are shown here; a complete set of VESPA functions are available in the manual). Within each phase the available alternatives for processing the data are given on the left and right hand columns. These only vary for Phase 3 and 4. The left most column may represent the processing of single gene orthologs that you wish to impose the species tree onto. If this is the case then VESPA will allow you to generate the phylogenies from the species tree (as shown on the left most side of (C)). However, you may wish to generate gene trees directly from the data for either multigene families or for single gene families of uncertain orthology (this option is shown on the right most column in (C) and involves selecting the substitution model of best fit and reconstructing the phylogeny). In addition to the functions, the input and output of each phase are shown in dark grey boxes and if a third-party program is required to analyze the output of the phase, the program is specified below the phase in a light grey box. For three of the five phases (data preparation, homology searching, and selective pressure analysis assessment) the functions invoked in both the basic and advanced options are identical. The primary difference between the analyses (basic/advanced) is found in the alignment assessment and phylogeny reconstruction phase. The advanced option uses ProtTest (Darriba et al., 2011) for substitution model selection and MrBayes (Ronquist & Huelsenbeck, 2003) for phylogenetic reconstruction. Beyond this major difference, the selective pressure analysis preparation simply requires a function to import the output of MrBayes.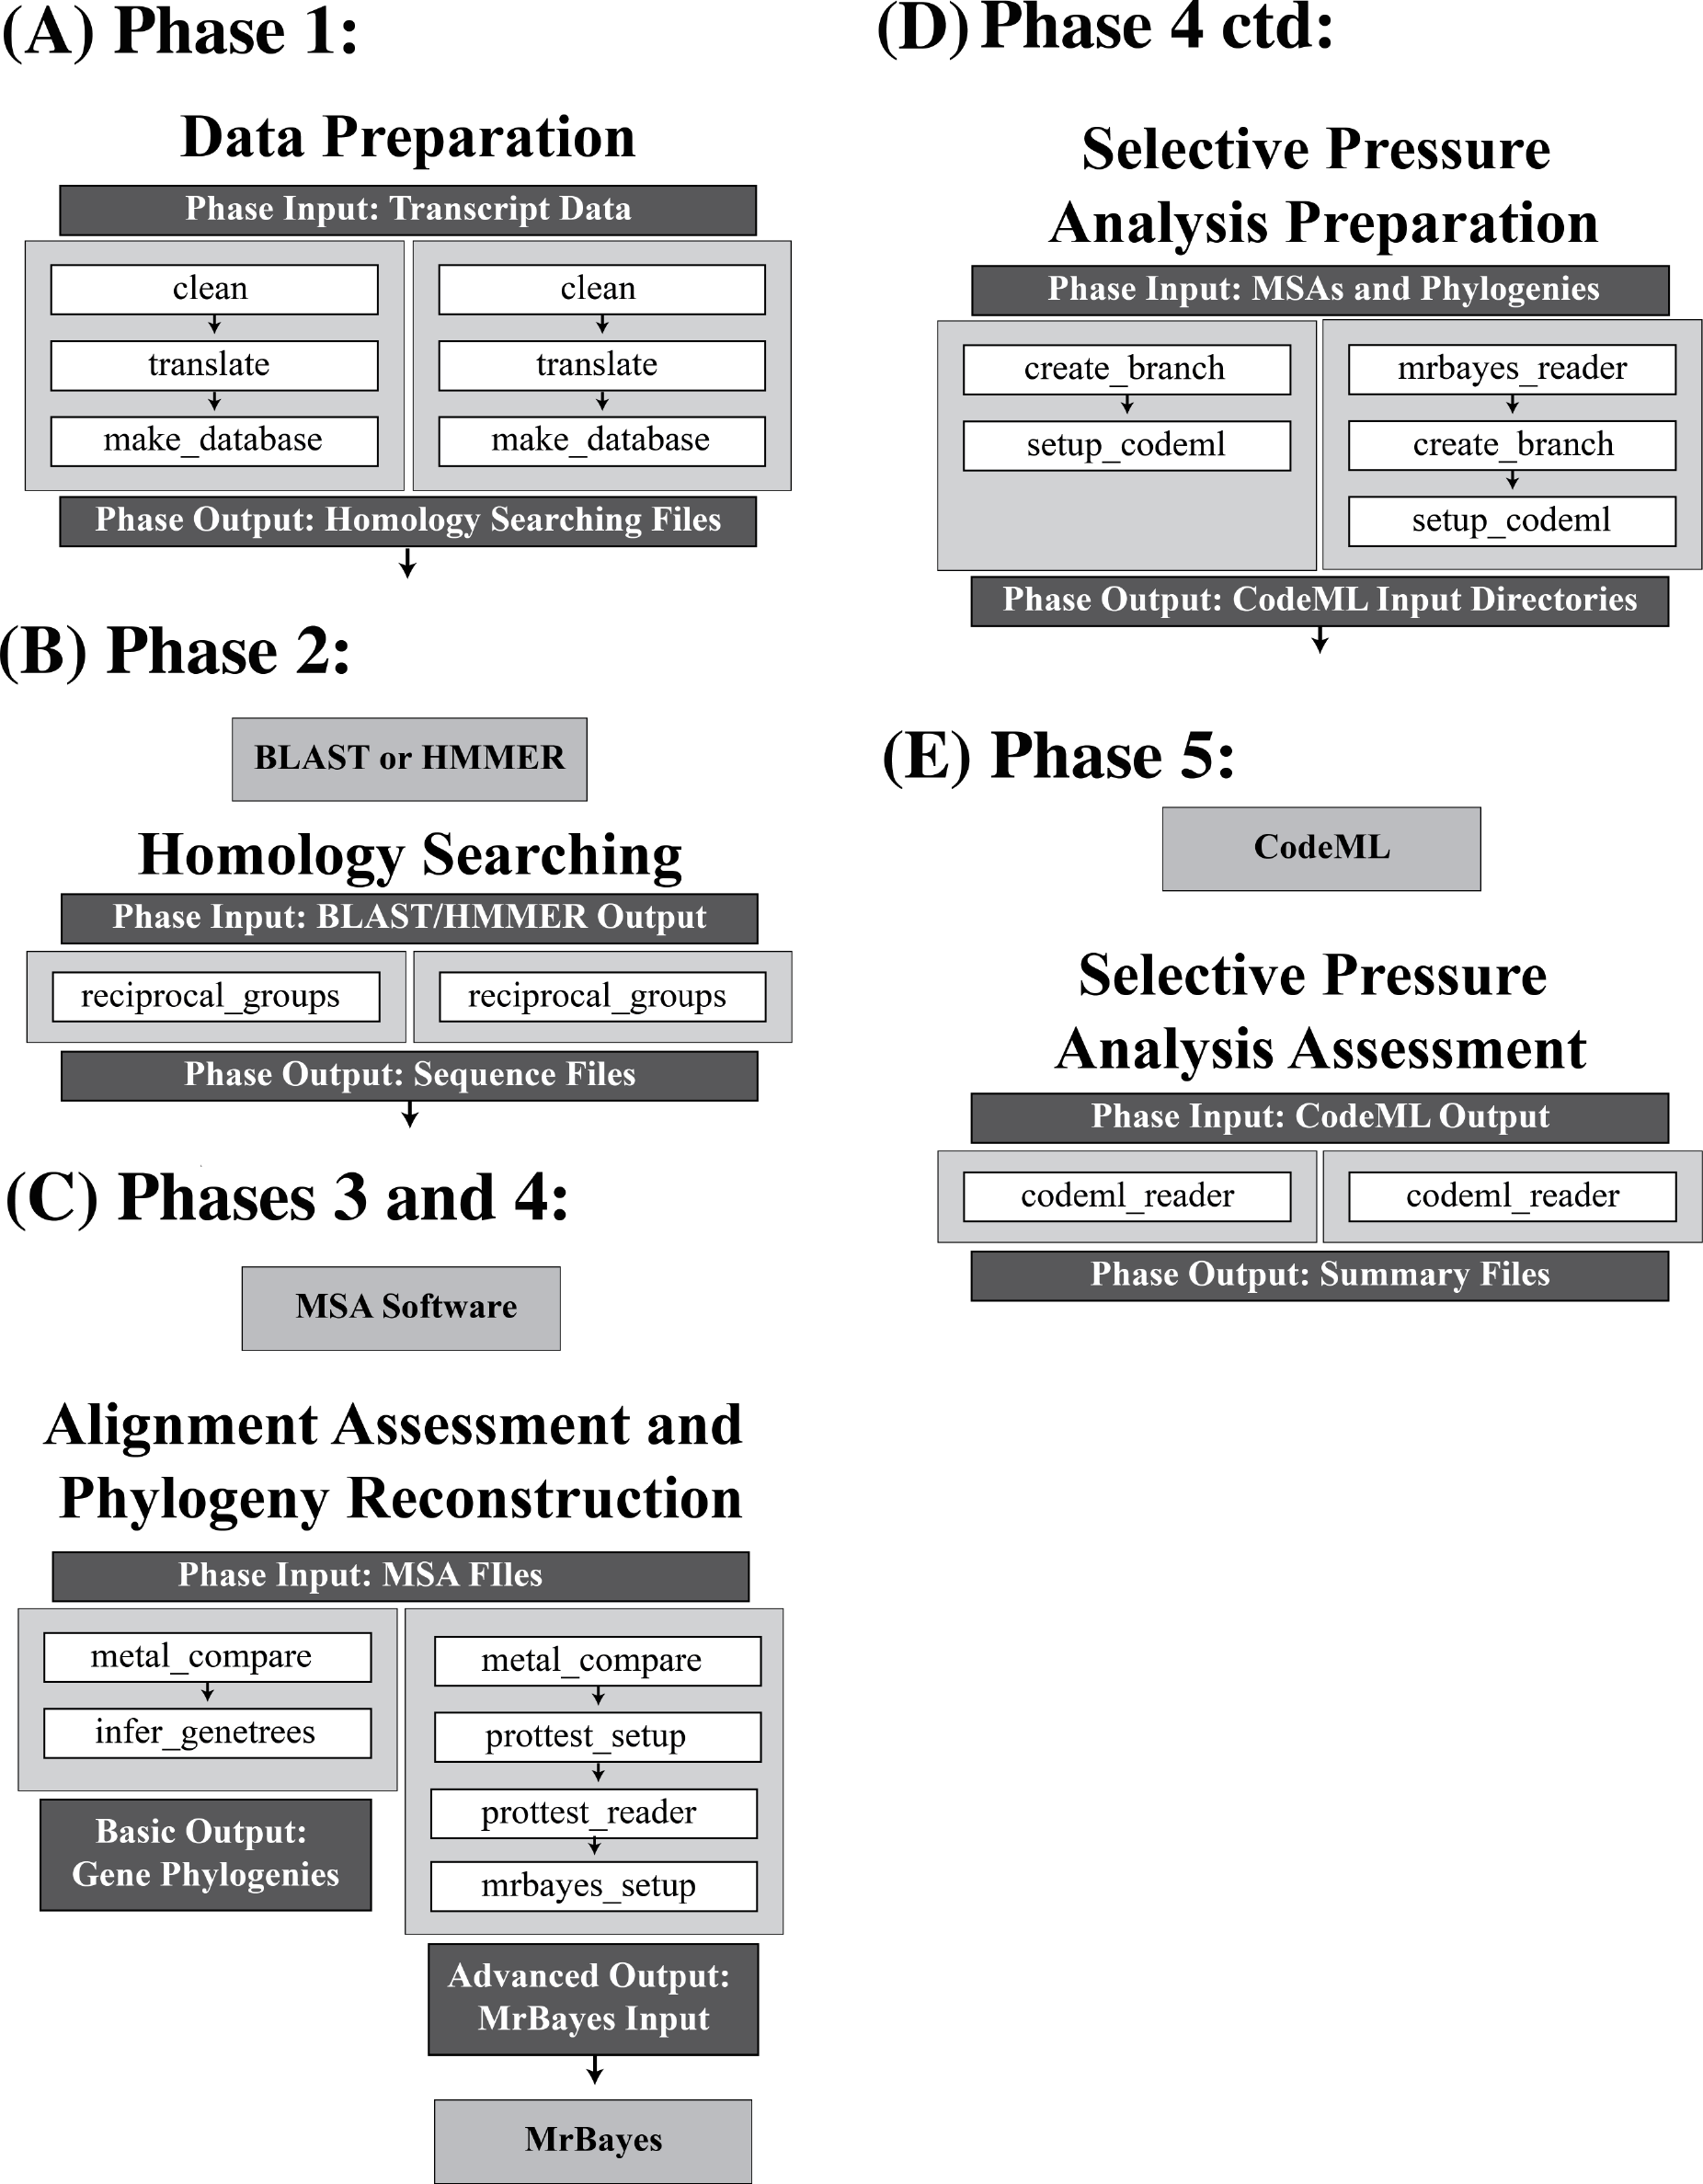
Depending on the phase of VESPA, input is accepted from any program capable of producing the supported file format(s) or a selected collection of third-party programs (Table 1). For example, Phase 2 (the homology searching phase) currently parses the output of BLAST (Altschul et al., 1997) or HMMER (Eddy, 1998), whereas the alignment assessment and phylogeny reconstruction phase is limited only by file format requirements (e.g., FASTA, NEXUS, PHYLIP). Functions in VESPA are invoked following the program call (i.e., vespa.py) along with arguments to indicate the phase-relevant input data and function-specific optional arguments. Depending on the function, optional arguments enable users to modify parameter values (e.g., BLAST search thresholds, phylogenetic reconstruction settings) or alter command-specific settings.
Functions in VESPA complete by producing the relevant output files without modifying the original input files. While this design results in the generation of a number of intermediate files (especially in the later stages of selection analysis), it enables users to easily keep track of all data modifications. Each phase of VESPA’s analysis produces the necessary data files for conducting a specialized analysis using third-party software (Fig. 1). Homology searches in particular are not fully automated by VESPA for two reasons: (i) they are best run as individual serial tasks on large high-end computing clusters, or (ii) the submission processes differ across compute clusters. However, VESPA can generate the BLAST formatted database for subsequent homology searches. All VESPA commands are issued on the command line and are readily executable via a cluster scheduling system.
Results
As detailed above, VESPA incorporates two analyses, a basic analysis for analyzing SGOs and an advanced analysis for analyzing both SGOs and MGFs (Fig. 2). Here we provide an example of an application of the basic analysis using ten genes from eleven species as a small test dataset.
As seen in Fig. 2, the process begins with the user supplying transcript data for the data preparation phase. The first phase begins with the clean function, a basic quality control (QC) filtering step, followed by translate, to translate the filtered transcripts. VESPA then proceeds to the make_database function to create a sequence database for homology searching with either BLAST (Altschul et al., 1997) or HMMER3 (Eddy, 1998). Upon completion of homology searching, the function reciprocal_groups is used to identify proteins that share reciprocal similarity. Then, files containing these families of sequences are produced. This function is highly configurable by optional arguments so that users can evaluate various different similarity scenarios (i.e., different e-value cutoffs) with only a single output file. The produced sequences files are then aligned using any multiple sequence alignment (MSA) method that can produce a supported file format (e.g., programs such as MUSCLE (Edgar, 2004) and PRANK (Loytynoja & Goldman, 2005) are supported). It is advisable to explore a variety of MSA methods for every gene family (Muller et al., 2010), and VESPA facilitates this the user to compare these different approaches. The metal_compare function (within the Alignment Assessment and Phylogeny Reconstruction phase) in VESPA allows alignment approaches to be compared and a single MSA of best fit is retained for each gene family (i.e., Gene Family A may have an MSA from MUSCLE while Gene Family B may have an MSA from PRANK). MSAs for each SGO family can then used in combination with the user-defined species phylogeny to create gene phylogenies using the function infer_genetrees or gene trees can be generated directly from the MSAs The MSAs and gene phylogenies are then used for the selective pressure analysis preparation phase. The function create_branch can be used to specifically label internal nodes as ancestral lineages that the user may wish to explore. The MSAs and gene phylogenies are then used by the function setup_codeml to automatically create the complex codeML file structure and a task file for automating codeML (Yang, 2007). Upon completion of codeML the codeml_reader function is used to automate the interpretation of the results and producing summary files of the results. VESPA creates a number of output files for each homologous gene family detailing the results of the codeML analysis. There are two primary types of output files for each gene family tested: (1) a single csv formatted summary text file (shown in Table 2) for one gene family, and (2), a multiple sequence alignment for each model tested detailing the sites (protein/codon) proposed to be under positive selection (this is also provided in html format so it can be viewed with colour coding for ease of interpretation).
To compare the results of VESPA to other pipelines and predictions of positive selection, we used a dataset of 18 gene families from the Selectome database (Moretti et al., 2014). A tarball of the data and results of the VESPA analysis of 18 gene families (i.e., input sequences, alignments, trees, codeml output, VESPA summary at each phase) have been provided in File S1. Selectome is a publicly available database of genes under positive selection. It was chosen to provide this benchmark dataset as it permits direct access to all relevant files used in its calculations, and it also uses the codon based models of evolution implemented in codeML and integrated in VESPA facilitating a direct comparison of results.
| Model | Tree | Model type | p | W (t = 0) | lnL | LRT result | Parameter estimates | Positive selection | Positively selected sites in 8 × 45 alignment (P(w > 1) > 0.5) |
|---|---|---|---|---|---|---|---|---|---|
| m0 | Sample_MSA | Homogeneous | 1 | 2 | −572.969394 | N/A | w = 0.61924 | No | |
| m1Neutral | Sample_MSA | Site-specific | 1 | 2 | −568.572319 | N/A |
p0 = 0.35065 p1 = 0.64935 w0 = 0.08403 w1 = 1.00000 |
Not allowed | |
| m2Selection | Sample_MSA | Site-specific | 2 | 2 | −568.521978 | m1Neutral |
p0 = 0.37699 p1 = 0.00000 p2 = 0.62301 w0 = 0.10174 w1 = 1.00000 w2 = 1.11245 |
No | |
| m3Discrtk2 | Sample_MSA | Site-specific | 3 | 2 | −568.521978 | m3Discrtk2 |
p0 = 0.37699 p1 = 0.62301 w0 = 0.10174 w1 = 1.11245 |
Yes | Alignment (28 NEB sites): 2 3 4 5 6 8 12 13 15 17 19 20 22 23 24 25 26 27 30 31 32 34 35 39 40 41 43 44 |
| m3Discrtk3 | Sample_MSA | Site-specific | 5 | 2 | −568.521978 | m3Discrtk2 |
p0 = 0.37699 p1 = 0.53897 p2 = 0.08404 w0 = 0.10174 w1 = 1.11245 w2 = 1.11246 |
No | |
| m7 | Sample_MSA | Site-specific | 2 | 2 | −568.764172 | N/A |
p = 0.22135 q = 0.11441 |
Not allowed | |
| m8 | Sample_MSA | Site-specific | 4 | 2 | −568.526486 | m7, m8 |
p = 11.60971 p0 = 0.37916 p1 = 0.62084 q = 99.00000 w = 1.11431 |
No | |
| m8a | Sample_MSA | Site-specific | 4 | 1 | −568.578069 | N/A |
p = 9.38528 p0 = 0.35203 p1 = 0.64797 q = 99.00000 w = 1.00000 |
Not allowed | |
| modelA | Sample_MSA_Primates | Lineage-site | 3 | 2 | −568.572319 | m1Neutral, modelAnll |
p0 = 0.35065 p1 = 0.64935 p2 = 0.00000 p3 = 0.00000 w0 = 0.08403 w1 = 1.00000 w2 = 1.00000 |
No | |
| modelAnull | Sample_MSA_Primates | Lineage-site | 3 | 1 | −568.572319 | N/A |
p0 = 0.35065 p1 = 0.64935 p2 = 0.00000 p3 = 0.00000 w0 = 0.08403 w1 = 1.00000 w2 = 1.00000 |
||
| modelA | Sample_MSA_Chimp | Lineage-site | 3 | 2 | −557.052657 | modelA |
p0 = 0.33452 p1 = 0.59186 p2 = 0.02659 p3 = 0.04704 w0 = 0.1099 w1 = 1.00000 w2 = 999.000 |
Yes | Alignment (3 BEB sites): 24 25 32 |
| modelAnull | Sample_MSA_Chimp | Lineage-site | 3 | 1 | −568.572319 | N/A |
p0 = 0.35065 p1 = 0.64935 p2 = 0.00000 p3 = 0.00000 w0 = 0.08403 w1 = 1.0000 w2 = 1.00000 |
Not allowed | |
| modelA | Sample_MSA_Human | Lineage-site | 3 | 2 | −568.572319 | m1Neutral, modelAnull |
p0 = 0.35065 p1 = 0.64935 p2 = 0.00000 p3 = 0.00000 w0 = 0.08403 w1 = 1.0000 w2 = 1.00000 |
No | |
| modelAnull | Sample_MSA_Human | Lineage-site | 3 | 1 | −568.572319 | N/A |
p0 = 0.35065 p1 = 0.64935 p2 = 0.00000 p3 = 0.00000 w0 = 0.08403 w1 = 1.0000 w2 = 1.00000 |
No |
Notes:
The following information is provided for each model tested: the lineage (internal or terminal branches) tested as foreground; the type of model (i.e. site-specific or branch-specific) being tested; number of free parameters in the distribution that are estimate by codeML, the initial value used by codeML (each run within VESPA has multiple starting values to minimise the risk of reporting from a local minimum on the likelihood plane); the resulting log likelihood (lnL) of the analysis; the resulting model of the likelihood ratio test (LRT); the parameter estimates of codeML; if positive selection was detected (yes/no); and the alignment coordinates for any positively selected sites. NEB, Nave Empirical Bayes estimate and BEB, Bayes Empirical Bayes estimate.
We carried out two tests with the dataset from Selectome (Release 6) (Moretti et al., 2014). Firstly we wished to assess if the way in which VESPA automatically sets up all codon models, labeling of foreground lineages and LRTs produced comparable results with those from the Selectome pipeline. To this end, we ran VESPA using the masked DNA alignments and gene trees for each of the 18 homologous gene families from the Selectome database. VESPA produced identical results for these input alignments. This demonstrates that VESPA’s automation of the process is reliable and robust.
| Original masked alignment | Alternative alignment | |||
|---|---|---|---|---|
| Positive selection (ModelA) | Positively selected sites | Postive selection (ModelA) | Positively selected sites | |
| ATG16L1 | Yes (HPGPoNM) | Matched | Yes (HPGPoNM , HP*, and HPG*) | Matched |
| ATP5SL | Yes (HP) | Matched | Yes (HP) | Matched |
| AZGP1 | Yes (HPGPoNM) | Matched | Yes (HPGPoNM) | Matched 9/10 (107) |
| C12orf43 | Yes (HPG) | Matched | Yes (HPG) | Matched |
| CACNA1I | Yes (HP) | Matched | Yes (HP) | Matched 2/3 (1,095) |
| CASP1 | Yes (HPG) | Matched | Yes (HPG) | Matched |
| CD151 | Yes (HPG) | Matched | Yes (HPG) | Matched |
| COBLL1 | Yes (HPGPoN) | Matched | Yes (HPGPoN) | Matched |
| HUS1 | Yes (HPGPoNM) | Matched | Yes (HPGPoNM) | Matched |
| IDH3B | Yes (HP) | Matched | Yes (HP) | Matched |
| IFIT2 | Yes (HPGPoNM) | Matched | Yes (HPGPoNM) | Matched |
| INTS7 | Yes (HPGPoNM) | Matched | Yes (HPGPoNM) | Matched |
| ODC1 | Yes (HPGPoN) | Matched | Yes (HPGPoN) | Matched |
| PASK | Yes (HP) | Matched | Yes (HP) | Matched 2/3 (434) |
| RRP8 | Yes (HPGPoN) | Matched | Yes (HPGPoN) | Matched |
| RTP2 | Yes (HP) | Matched | Yes (HP) | Matched |
| SLC8A1 | Yes (PG) | Matched | Yes (PG) | Matched |
| TRIM40 | Yes (HPGPo) | Matched | Yes (HPGPo) | Matched 2/4 (140, 256) |
Notes:
The 18 homologous families chosen from the Selectome database are given their HUGO identifier on the left. The results of analysis in VESPA as compared to Selectome results using the same masked alignments are shown in columns 2 and 3. The results from VESPA using the alternative alignment method as compared to the original alignments is shown in columns 4 and 5. For both alignments (original and alternative) it is indicated if ModelA positive selection is identified in the same lineages, and if the sites identified as positively selected match. Using the alternative alignments, four cases where the sites identified as positively selected did not completely match the position in the original alignment are indicated in parenthesis. The extant lineages with evidence of positive selection throughout are shown in parentheses and are abbreviated as follows: Human (H), Chimp (P), Gorilla (G), Orangutan (Po), Gibbon (N) and Macaque (M). Ancestral nodes are denoted as a combination of the abbreviations for the extant lineages that the node includes, e.g. the ancestral node joining Human (H) and Chimp (P) is denoted as HP.
One challenge in performing these analyses is that different alignment methods applied to the same gene families can produce different results. VESPA provides the “metal_compare” function, which allows alignments for a gene family to be compared. To highlight its utility, we performed an additional test on this dataset of 18 homologous gene families from Selectome. We used the unmasked sequences and generated a set of alternative alignments through MUSCLE (Edgar, 2004) and PRANK (Loytynoja & Goldman, 2005) and using the metal_compare function of VESPA we identified the best (i.e., most statistically significant) alignment for each gene family. The VESPA functions ‘setup_codeml’ and ‘codeml_reader’ were then used to automate the codeML set up and analysis. The VESPA pipeline was able to replicate the lineages identified as under positive selection in the Selectome database. However, the results presented in Table 3 include small differences in the number and position of sites identified as positively selected. The ATP5SL alternative alignment was found to have evidence of positive selection on two additional branches as compared to the original result, however, closer inspection of the alternative alignments found the additional branches to be false positives due to a poorly aligned segment of the MSA. Other slight variations in results between the original and alternative alignments included three instances where gene families (C12orf43, CACNA1I, and PASK) had a difference of one positively selected site and one instance (TRIM40) of differences in two positively selected sites reported in the original alignment that was not reported in the alternative alignment for the same family. Finally, a single gene (SLC8A1) contained additional sites under positive selection following VESPA analysis using the alternative alignments, it should be noted that these sites are within a poorly conserved span of the protein. The remaining 13 genes were found to replicate the positively selected sites reported in Selectome.
To demonstrate the application of VESPA to very large datasets we have assembled a novel dataset of 7,918 homologous gene families (each containing ≥ 8 sequences) from the ENSEMBL 2016 genome database (release 82) (Yates et al., 2016). Using the VESPA “clean_ensembl” command we: (1) restricted the protein coding sequences per genome to the longest transcript for each gene, and (2) logged and discarded sequences containing internal stop codons or incomplete codons. Multiple sequence alignments were made for all gene families identified and phylogenies for each homologous gene families were inferred by VESPA from the topology of the Ensembl Compara species tree demonstrating the flexibility of the VESPA package (Phase 3). Finally, the selective pressure analyses were carried out in VESPA Phase 5 with human and then mouse labeled as the foreground lineages of interest. Of the 7,918 genes analyzed by VESPA 1998 showed evidence of site-specific positive selection (model “m8”), 223 genes showed evidence of mouse-specific positive selection (“model A”), and finally 80 showed evidence of human-specific positive selection (“model A”); File S1 contains the full set of results.
For the dataset of 7,918 homologous gene families the majority of VESPA functions completed in under four minutes (on the following system: Intel Xeon CPU E5420 (2.50 GHz), 16 GB RAM, using Ubuntu OS 16.04). The exceptions were the ’codeml_setup’ function which took approximately 45 min for this dataset, this function is slightly slower as it is creating the complex directory/file structure for codeML. The second exception was the ’codeml reader’ function which took approximately 6 h (this function is to analyze the large number of files created by codeML and produce the output and summary files). The codeML component of the analyses took 36,180 CPU hours in total to complete. (Note: these time estimates are not inclusive of Phase 2—homology search).
Discussion
One of the primary goals of VESPA is to simplify and streamline basic comparative genomic procedures such as filtering poor quality protein coding sequences and generating the most appropriate alignment for each gene family. VESPA also simplifies and streamlines codeML-based selective pressure analyses. From our analysis of 7,918 homologous gene families we found that the majority of tasks could be completed within minutes using VESPA. However, the codeML-related functions for creating the input file structure and examining the output files takes considerably longer to complete. As these functions are an essential aspect of the pipeline, decreasing their execution time will be a primary goal in future updates to VESPA. Two possible approaches that will be explored are: (i) increasing the overall efficiency of the functions and (ii) developing a version of VESPA capable running these scripts (and possibly others) in parallel on multi-core processors.
The modular nature of VESPA enables the pipeline (or specific functions) to be used in conjunction with existing workflow systems. The only requirements would be having the necessary data (MSAs, protein-coding transcripts, etc.) in a supported format. For example, VESPA could be used to perform a selective pressure analysis on protein-coding transcripts obtained from RNA-Seq. Also, it is possible to skip specific stages of the VESPA pipeline for a preferred approach/software package, e.g., it is possible to use an alternative approach for phylogenetic reconstruction and employ the resulting tree in a VESPA analysis. It should also be possible to integrate the majority of VESPA’s functions (with the exception of the built-in tree pruning function) into workflow systems such as GALAXY (Afgan et al., 2016). This would allow VESPA to operate in conjunction with the scripts and tools already available on GALAXY, enabling greater freedom for the user. This integration will be implemented in future releases of VESPA.
We also employed VESPA in the analysis of 18 gene families from the Selectome database (Moretti et al., 2014). Our initial comparison used both the alignment (masked) and tree provided by Selectome. VESPA was able to confirm the findings reported within the database. Secondly, we re-aligned the 18 gene families using two methods (MUSCLE and PRANK) and then again performed the selective pressure analysis using VESPA. The analysis of these alternative alignments revealed minor differences in the reported positively selected sites of five genes (C12orf43, CACNA1I, PASK, SLC8A1, and TRIM40). These differences illustrate that the input alignment may have an impact on the genes and sites identified as positively selected as in Blackburne & Whelan, (2013). To avoid biased results due to choice of alignment method and we highly recommend the use of the “metal_compare” function or programs such as AQUA (Muller et al., 2010) to select the best alignment for each gene family.
Conclusion
VESPA provides a flexible software package designed to simplify large-scale comparative genomic analyses and specifically selective pressure variation analysis implemented in codeML (Yang, 2007). VESPA automates the entire comparative genomic process from data quality checks and homology searching to phylogeny reconstruction and selective pressure analyses, and it produces simple summary files for the user. VESPA offers users various functions that automate many of the required prerequisite analyses and removes error-prone data manipulation steps. Lastly, it is important to note that the processes implemented in the 5 Phases of VESPA facilitates those working on de novo sequence data or non-model organisms to perform large-scale comparative genomic analyses without having pre-processed gene families. All that is required by VESPA is that the protein coding DNA sequences are available.
Supplemental Information
VESPA User Manual
Detailed manual containing all instructions for use of VESPA.
Summary of results of VESPA analysis on a Dataset of 7,918 Gene families
The results of the analysis of selective pressure variation across 8,105 gene families labeling as foreground either human or mouse. The results are supplied as “.csv” file which can be displayed as an excel file or similar.