

Effect of acidity/alkalinity of deep eutectic solvents on the extraction profiles of phenolics and biomolecules in defatted rice bran extract
- Published
- Accepted
- Received
- Academic Editor
- Timothy Omara
- Subject Areas
- Analytical Chemistry (other), UV-Visible Spectroscopy
- Keywords
- Deep eutectic solvents, Acidity, Alkalinity, Extraction, Extracts, Rice bran, Phenolics, Biomolecules, By-products, Antioxidants
- Copyright
- © 2024 Sombutsuwan et al.
- Licence
- This is an open access article distributed under the terms of the Creative Commons Attribution License, which permits unrestricted use, distribution, reproduction and adaptation in any medium and for any purpose provided that it is properly attributed. For attribution, the original author(s), title, publication source (PeerJ Analytical Chemistry) and either DOI or URL of the article must be cited.
- Cite this article
- 2024. Effect of acidity/alkalinity of deep eutectic solvents on the extraction profiles of phenolics and biomolecules in defatted rice bran extract. PeerJ Analytical Chemistry 6:e29 https://doi.org/10.7717/peerj-achem.29
Abstract
This study investigated the influence of deep eutectic solvent (DES) acidity/alkalinity on the extraction profiles of phenolics and other biomolecules (phytic acid, reducing sugar, and protein) in defatted rice bran (DFRB). The DES with varying pH levels were prepared using different hydrogen bond acceptors (choline chloride (ChCl) and potassium carbonate (K2CO3)) and hydrogen bond donors (lactic acid, urea, and glycerol). The results reveal that the acidic DES (ChCl-lactic acid; pH 0.42) demonstrated superior extraction efficiency for total phenolic acids (4.33 mg/g), phytic acid (50.30 mg/g), and reducing sugar (57.05 mg/g) while having the lowest protein content (5.96 mg/g). The alkaline DES (K2CO3-glycerol; pH 11.21) showed the highest levels of total phenolic acid (5.49 mg/g) and protein content (12.81 mg/g), with lower quantities of phytic acid (1.04 mg/g) and reducing sugar (2.28 mg/g). The weakly acidic DES (ChCl-glycerol; pH 4.72) exhibited predominantly total phenolics (3.46 mg/g) with lower content of protein (6.22 mg/g), reducing sugar (1.68 mg/g) and phytic acid (0.20 mg/g). The weakly alkaline DES (ChCl-urea; pH 8.41) resulted in lower extraction yields for total phenolics (2.81 mg/g), protein (7.45 mg/g), phytic acid (0.10 mg/g), and reducing sugar (7.36 mg/g). The study also explored the distribution of phenolics among various DESs, with the alkaline DES (K2CO3-glycerol) containing the highest concentration of free phenolics. Notably, ChCl-based DESs predominantly contained soluble esterified bound phenolics and soluble glycosylated bound phenolics. Furthermore, a significant correlation between antioxidant activities and phenolic contents was observed. In conclusion, this study has revealed that the acidity and alkalinity of a DES significantly impact the extraction of phenolics and other value-added biomolecules in DFRB. These findings highlight the potential for manipulating the properties of DESs through pH variation, making them versatile solvents for extracting and isolating valuable compounds from agricultural by-products like DFRB and offering opportunities for sustainable utilization and value addition in various industries.
Introduction
Rice bran, a coproduct derived from the milling process of husked rice (Oryza sativa L.), constitutes approximately 10 wt% of the rice grain (Gul et al., 2015). Remarkably, rice bran plays a crucial role in the food industry, serving as a valuable source of rice bran oil and contributing to a global market valued at $1.23 billion in 2018. This surging demand for rice bran oil has led to the substantial production of defatted rice bran (DFRB), a primary byproduct of the oil extraction process (Alexandri et al., 2020). Despite the inherent nutritional richness and presence of bioactive compounds, the utilization of DFRB remains predominantly limited to low-value applications such as animal feed or disposal in landfills (Alexandri et al., 2019; Gul et al., 2015). It is important to note that DFRB contains bioactive phenolics, which have exhibited a range of properties, including antioxidative effects (Zhao et al., 2018), anti-inflammatory effects (Yin et al., 2019), and the potential for preventing chronic conditions like cancer (Dokkaew et al., 2019) and cardiovascular diseases (Zhang et al., 2020).
In addition, DFRB contains a notable content of myo-inositol-1,2,3,4,5,6-hexakisphosphoric acid (IP6), commonly known as phytic acid (ranging from 5.90% to 6.48% on a dry basis). This compound has been associated with various health advantages, including antimicrobial effects (Nassar et al., 2021), antioxidative properties (Canan et al., 2021), and the potential to prevent colon cancer (Kaur et al., 2020). DFRB is a rich source of proteins with distinctive attributes, encompassing emulsion, foaming, gel-forming, and hypoallergenic properties (Zhuang et al., 2019). Moreover, there have been reports on the conversion of DFRB into reducing sugars through fermentation for applications in both food and bioenergy sectors (Alexandri et al., 2020). Incorporating DFRB into value-added products offers opportunities to increase market value and develop innovative strategies that can influence the broader economic landscape.
However, the bioactive compounds within DFRB are predominantly bound to the cell wall as insoluble macromolecules, or within cell wall components like cellulose and structural proteins (Zhao et al., 2018). The release of bioactive compounds and biomolecules from the cell wall, followed by their dissolution in solvents, represents an important and critical step in obtaining extracts enriched with value-added biomolecules. Conventional methods involving strong alkaline or strong acid treatments for release (Shahidi & Hossain, 2023) encounter challenges due to their corrosive nature and potential environmental impacts. These issues are at odds with the prevailing emphasis on green chemistry and sustainable processes.
Deep eutectic solvents (DESs) have recently emerged as novel and promising solvents (Abbott et al., 2003). They are comprised of a halide salt or a hydrogen bond acceptor (HBA) and a hydrogen bond donor (HBD) (Zhang et al., 2012). DESs offer numerous advantages over conventional organic solvents. They are cost-effective, easy to prepare, require minimal energy for high-purity compound production, and exhibit biodegradability and biocompatibility (Hayyan et al., 2013; Yang, 2019; Zhang et al., 2012). Additionally, DESs are well-suited for extraction and separation processes due to their low volatility and non-toxic nature. They are characterized by non-flammability, non-corrosiveness, and high selectivity and solubility (Hizaddin et al., 2022). Extensive research has been conducted on using DESs for extracting valuable compounds from agricultural waste, including phenolic compounds (PCs) (Jablonsky et al., 2020; Ruesgas-Ramón, Figueroa-Espinoza & Durand, 2017; Ruesgas-Ramón et al., 2020), and proteins (Olalere & Gan, 2023), and for the pretreatment of lignin and cellulose (Mnasri et al., 2023; Zhu et al., 2023). However, their high viscosity presents a significant challenge, impacting the extraction process and subsequent procedures such as filtration, decantation, and dissolution, potentially limiting their industrial applications (Boateng, 2023). Nevertheless, the strategic addition of water to DESs reduces viscosity while maintaining their structure, providing the potential to enhance extraction yields (Ali Redha, 2021).
The pH of a DES in the extraction process has been recognized as a key factor influencing efficacy due to its substantial impact on the interaction between the DES and the target solute, particularly with respect to cell wall breakdown. Certain DES mixtures, such as choline chloride:lactic acid (ChCl:La) and potassium carbonate:glycerol (K:Gly), have demonstrated enhanced efficiency in dissolving biopolymers compared to DES with a near-neutral pH (Tan, Ngoh & Chua, 2018). Furthermore, both acidic (ChCl:La) and alkaline (K:Gly) DESs have effectively facilitated the delignification of various plant residues (Suopajärvi et al., 2020). Based on this theory, the cell wall of DFRB would have a high possibility of breaking down and releasing the bioactive molecules.
Previous studies have primarily concentrated on the output, composition, and bioactive attributes of free phenolic compounds (FPC) or individual value-added biomolecules. This has created a gap in our understanding of how DESs impact profiles, quantities, and functional qualities, including esterified-bound and glycosylated-bound PCs. These forms of PCs are solubilized and interact with macromolecules through covalent, ester, ether, or C–C bonds (Wang et al., 2020). They have gained growing attention due to their health-promoting attributes in food (Arruda et al., 2018; Wang et al., 2022; Zhong et al., 2022).
Therefore, the present study aims to investigate how the acidity and alkalinity of DES influence the phenolic and biomolecule compositions within extracts from DFRB. Moreover, the investigation aims to identify distinct phenolic profiles and evaluate their potential as antioxidants. These efforts offer valuable insights into the promising applications of these compounds as ingredients for promoting health and well-being.
Materials & Methods
Chemicals
Phenolic acid standards, including 4-hydroxybenzoic acid (99% purity), vanillic acid (≥ 97% purity), p -coumaric acid (≥ 98% purity), ferulic acid (99% purity), syringic acid (≥ 95% purity), sinapic acid (≥ 98% purity), and caffeic acid (≥ 98% purity), along with phytic acid, bovine serum albumin (≥ 98% purity), and glucose, were obtained from Sigma-Aldrich (St. Louis, MO, USA). Analytical grade chemicals such as potassium persulfate (K2S2O8), 2,2-diphenyl-1-picrylhydrazyl (DPPH), 2,2′-azino-bis (3-ethylbenzothiazoline-6-sulfonic acid (ABTS), choline chloride (ChCl), Folin Ciocalteu reagent (2 M), glycerol, lactic acid, and potassium carbonate (K2CO3) were also obtained from Sigma-Aldrich (Saint Louis, MO, USA). High-performance liquid chromatography (HPLC) grade ethyl acetate, hexane, and acetic acid were obtained from RCI Lab Scan Co. Ltd., Bangkok, Thailand. All other chemicals used were analytical grade and used without further purification.
Preparation of DES
Four types of DES compositions (detailed in Table 1) were selected based on variations in their pH levels. These compositions were prepared by mixing, stirring, and heating the HBA and HBD constituents in Erlenmeyer flasks. The mixture was continuously stirred and heated at 70 °C until it became a clear, homogeneous liquid. The duration of this process ranged from approximately 30 to 180 min, depending on the specific DES type.
| Hydrogen bond acceptor | Hydrogen bound donor | Molar ratio | Abbreviations |
|---|---|---|---|
| Choline chloride | Lactic acid | 1:2 | ChCl:La |
| Choline chloride | Glycerol | 1:2 | ChCl:Gly |
| Choline chloride | Urea | 1:2 | ChCl:U |
| Potassium carbonate | Glycerol | 1:7 | K:Gly |
DES properties
The pH values of freshly prepared DES samples, which contained 20% (w/v) water, were measured using a Mettler pH meter. The solvatochromic characteristics were evaluated employing Nile Red dye as a probe. Nile Red was introduced into each DES to act as a solvatochromic probe, and the wavelength of maximum visible light absorption (λmax) was determined by following previously established methods (Laokuldilok et al., 2011; Mulia, Fauzia & Krisanti, 2019). Subsequently, the DES-dye mixtures were scanned in the 400–700 nm range using a UV-vis spectrophotometer, and the Nile Red polar parameter (ENR) was then calculated using Eq. (1): (1)
Extraction procedure
Plant material
Defatted rice bran (DFRB) was obtained from Surin Rice Bran Oil Co., Ltd. (Surin Province, Thailand). Proximate analyses of DFRB were determined according to the Association of Official Analytical Chemists guidelines (AOAC, 2005) and the Van Soest sequential analytical method (Van Soest, Robertson & Lewis, 1991).
Extraction of biomolecules in DFRB using DES
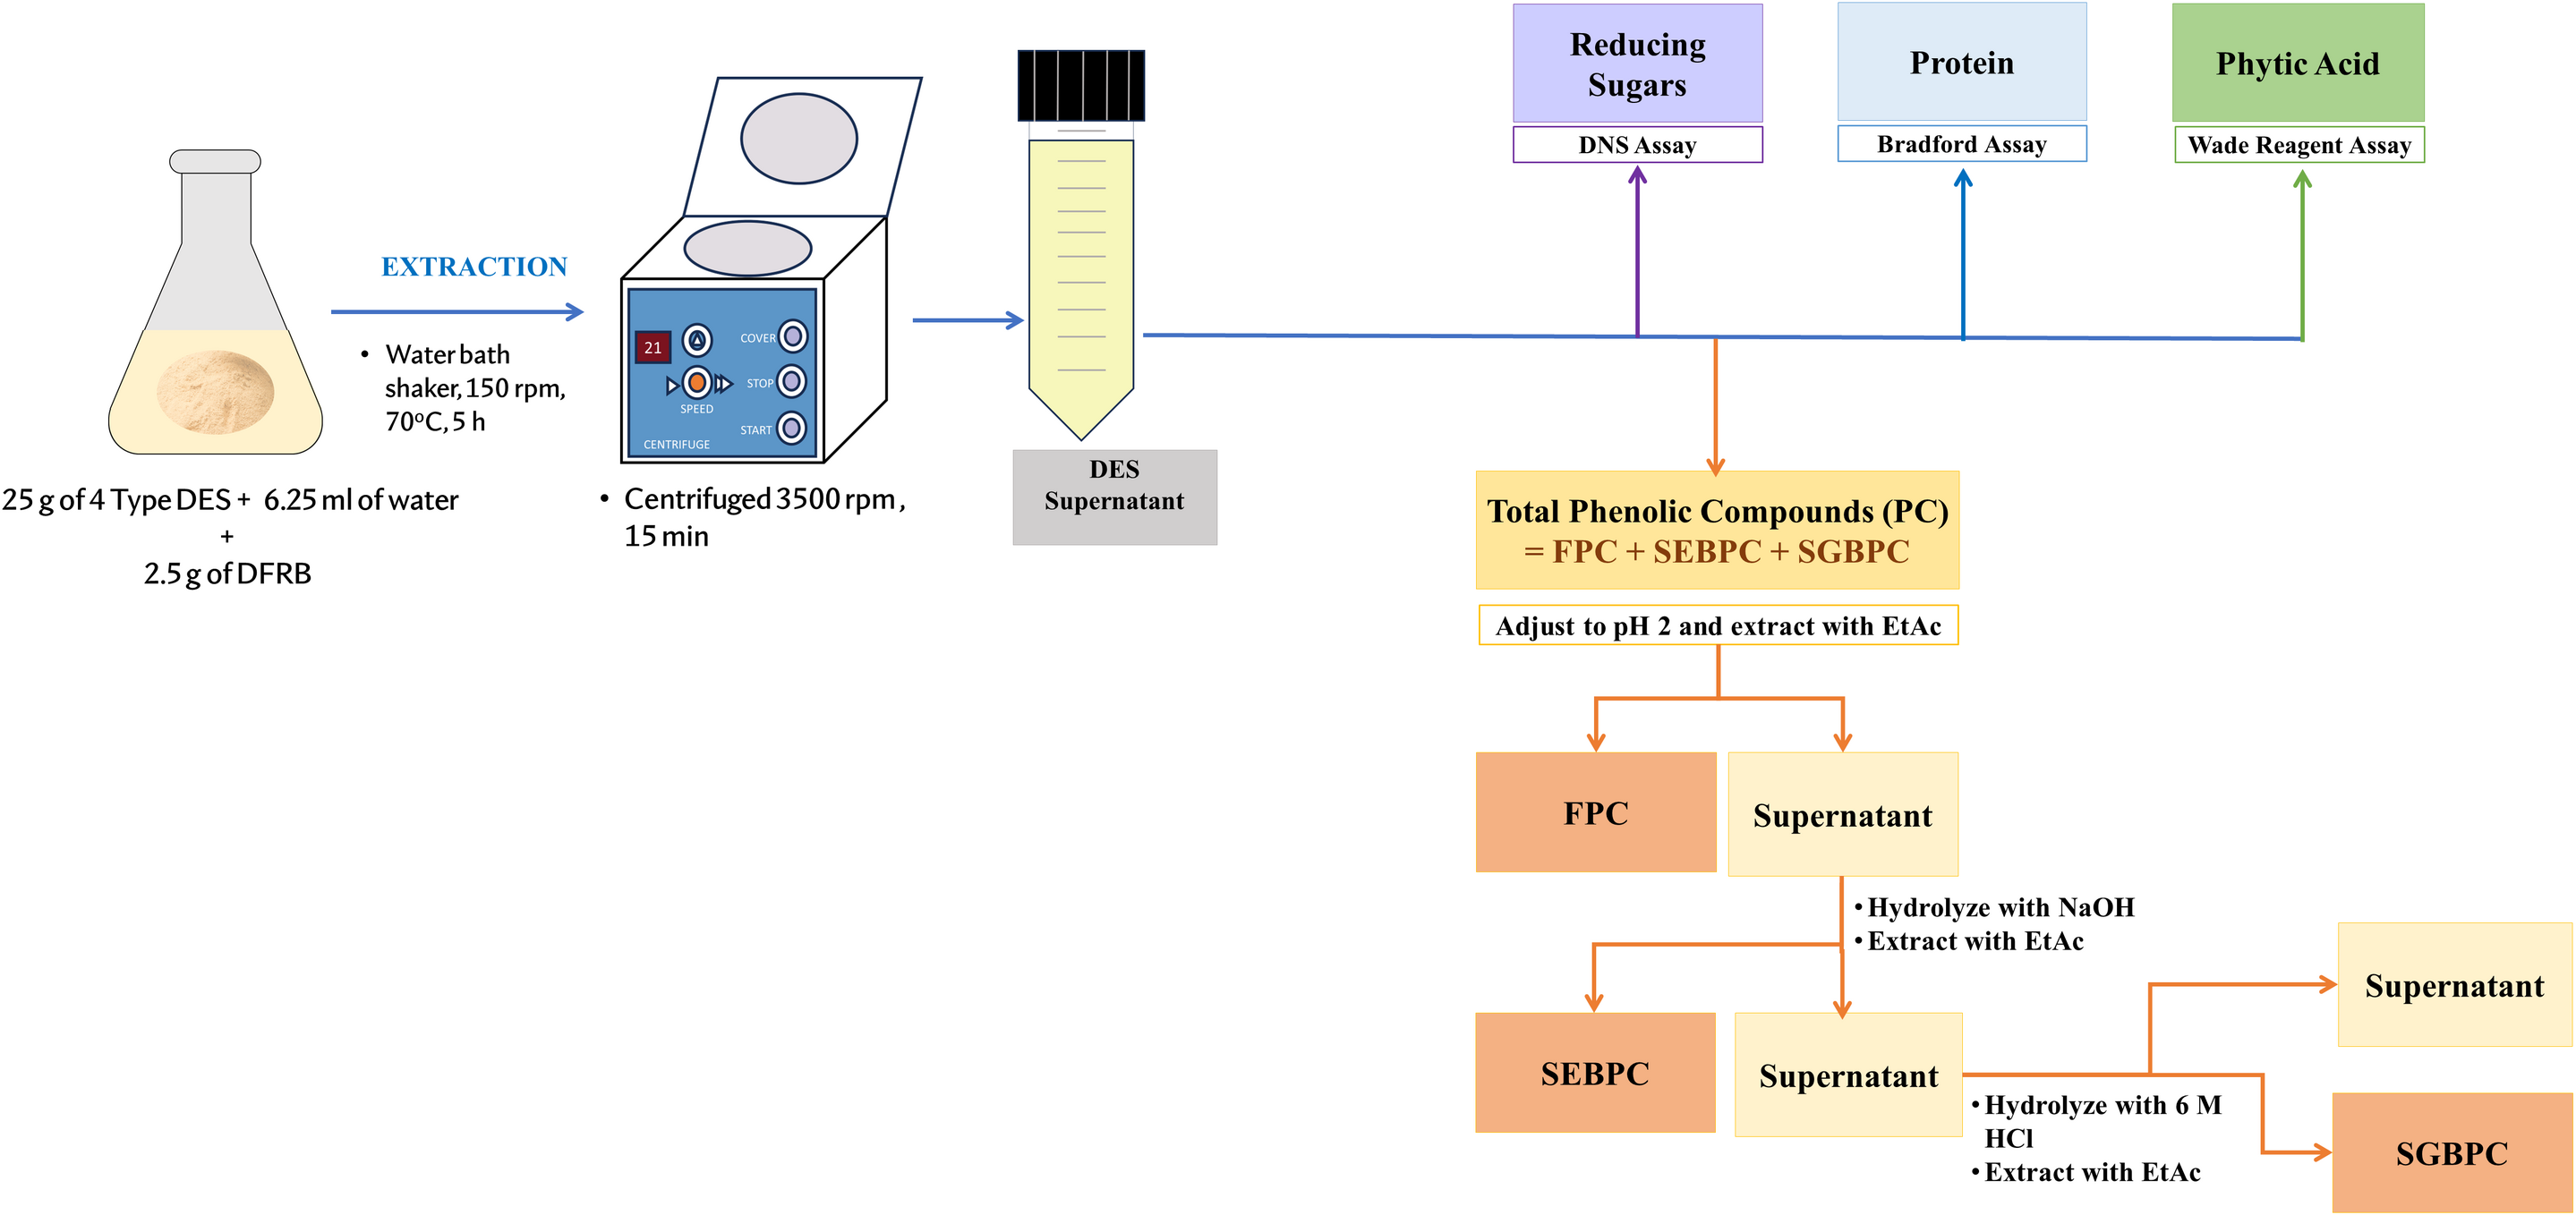
An outline depicting the process of DFRB extraction, and the characterization of PC and value-added biomolecules is illustrated in Fig. 1. The extraction process was initiated by adding 6.25 mL (20% w/w) of distilled water to 25 g of each hydrated DES in an Erlenmeyer flask with a stopper. The mixture was then heated to 70 °C for 10 min to reduce viscosity and ensure the homogeneity of the DES. Next, 2.5 g of DFRB was added to the DES mixture and subjected to agitation in a water bath shaker at 150 rpm and a temperature of 70 °C for 5 h. Upon completion of the extraction, the sample was subjected to centrifugation at 1,780 × g for 15 min, resulting in the collection of the supernatant. The supernatant was then adjusted to a volume of 50 mL by adding distilled water using a volumetric flask. Subsequently, it was stored in a 100 mL polypropylene (PP) reagent bottle wrapped with aluminum foil to protect it from light. This stored sample was maintained at −20 °C for further analysis of PC and biomolecules.
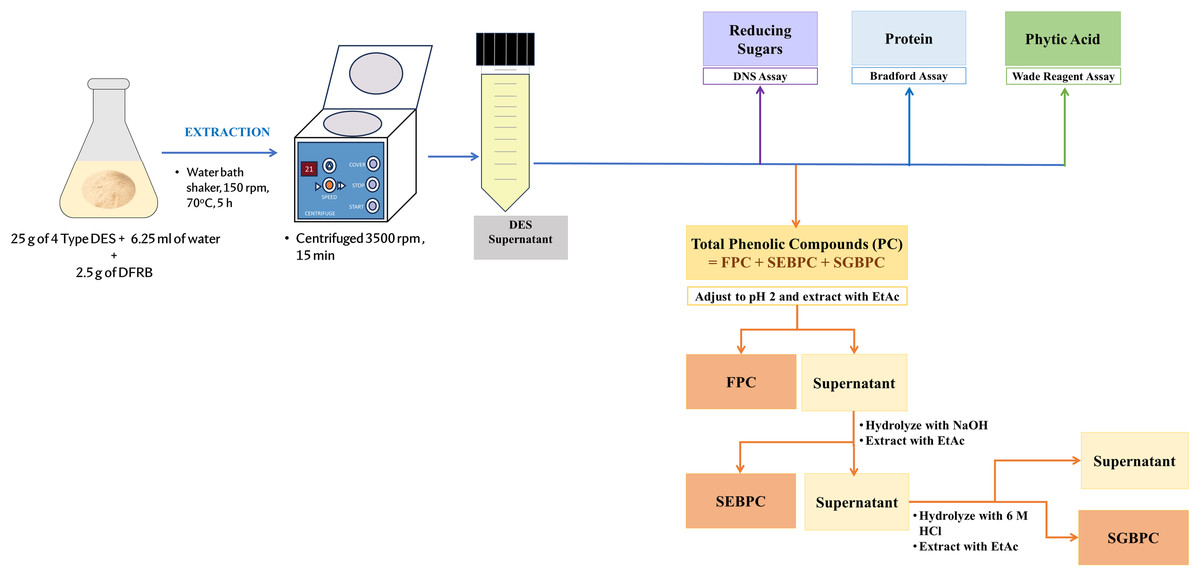
Figure 1: Overview of the DFRB extraction process, along with the characterization of phenolic compounds and value-added biomolecules.
Phenolic compounds determinations
Identification of phenolic compound types
The types of PCs in the DES supernatant extracts were established based on the work of Lou et al. (2020) with some modifications detailed below.
Free Phenolic Compounds (FPC)
The DES supernatant extracts (five mL) were acidified to a pH of 2 using 6 M HCl. The resulting supernatant underwent three successive extractions with ethyl acetate (EtAc) at a 1:1 (v/v) ratio. The EtAc phases were then combined, dehydrated using anhydrous Na2SO4, filtered, and subsequently dried with N2 gas. The resulting dry residues were reconstituted in five mL of ethanol, yielding the fraction containing free PCs (FPCs).
Soluble Esterified Bound Phenolic Compounds (SEBPC)
After extracting of FPCs, the residual aqueous phase underwent hydrolysis with five mL of 4 M NaOH containing 10 mM EDTA and 1% ascorbic acid (to protect the PC) for 4 h. at room temperature. The sample was then acidified to a pH of 2 using 6 M HCl. The PC liberated from soluble esters were subjected to triple extractions using EtAc, following a procedure similar to that used for the FPCs. This process resulted in the fraction of soluble esterified bound phenolic acid compounds (SBEPC).
Soluble Glycosylated Bound Phenolic Compounds (SGBPC)
The residual aqueous phase left after the extraction of SEBPC was subjected to additional hydrolysis using 1.25 mL of 6 M HCl at 75 °C for 60 min. The PCs released from soluble-bound glycosides were subsequently extracted three times using EtAc, following a similar methodology to that used for the extraction of FPCs. This process yielded the fraction containing soluble glycosylated bound phenolic acid compounds (SGBPC).
Determination of Total Phenolic Content (TPC)
The total phenolic content of the extracted fractions, namely FPCs, SBEPCs, and SBGPCs in DFRB, was determined utilizing the Folin-Ciocalteu method described by Kim & Lim (2016) with some modifications. Twenty microliters of the sample were combined with freshly prepared Folin-Ciocalteu reagent (80 µl) and 7.5% (w/v) Na2CO3 (200 µl). The resulting mixture was diluted with 700 µl of distilled water and then placed in a dark environment at room temperature for 2 h. to allow the reaction to proceed. The total phenolic content was assessed using a microplate reader set to a wavelength of 765 nm (Thermo Fisher Scientific, Waltham, MA, USA), using gallic acid as a standard. The quantity of total PC present in the sample was computed as gallic acid equivalents.
Characterization of phenolic acids using HPLC
Samples of FPC, SEBPC, and SGBPC derived from various types of DES were subjected to analysis of their phenolic acid profiles using high-performance liquid chromatography (HPLC). The HPLC system consisted of a pump model 515 (Water Associates, Milford, MA, USA), a Rheodyne 7125 six-port valve injector with a 10 µL loop, and a photodiode array detector (PDA; Shimadzu, Kyoto, Japan). The samples were prepared using the designated mobile phase and subsequently subjected to analysis on a Mightysil Si60 column (250 × 4.6 mm ID., 5 µm) protected with a Mightysil Si60 guard column (10 × 4.6 mm ID., 5µm) (Kanto Chemical Co. Inc., Tokyo, Japan). The mobile phase consisted of hexane/ethyl acetate/acetic acid (70:30:0.2, v/v/v) with a flow rate of 1.0 mL/min. UV absorbance was monitored in the 257-320 nm range (Sombutsuwan et al., 2021). HPLC control and data collection were performed using LC Solution Software (version 1.24; Shimadzu, Kyoto, Japan). Quantification of 4-hydroxybenzoic acid, vanillic acid, p-coumaric acid, ferulic acid, syringic acid, sinapic acid, and caffeic acid in the samples was performed using the external standard curve method.
Anti-radical activity assays
DPPH radical-scavenging activity
The DPPH assay was determined according to Laokuldilok et al. (2011) with some modifications. Briefly, a 20 µl sample was mixed with 20 µl of ethanol, and the resulting mixture was added to 560 µl of 0.1 M DPPH in ethanol. This mixture was then incubated in darkness at 25 °C for 30 min. Afterward, the absorbance at 517 nm was measured. The DPPH radical scavenging capacity of the sample was calculated using Eq. (2) (2) where Ac represents the absorbance of the control at 517 nm, and As represents the absorbance of the sample at 517 nm. The DPPH radical scavenging capacity was expressed as mmol gallic acid/g DFRB.
ABTS assay
The methodology described previously (Sombutsuwan et al., 2021) was used to determine antioxidant capacity against ABTS with some modifications. Briefly, a stock solution comprising 7 mM ABTS solution and 2.45 mM potassium persulfate solution was prepared. After mixing the two stock solutions, the resulting solution was kept in the dark at room temperature for 12 h. The solution was then diluted with ethanol to achieve an absorbance of 0.7 ± 0.05 units at 734 nm using a spectrophotometer. A DFRB sample (20 µl) was mixed with 180 µl of ABTS•+ solution and allowed to react for 6 min. The absorbance was measured at 734 nm using spectrophotometry. The ABTS•+ scavenging effect was calculated according to Eq. (3): (3) where Ac was the absorbance of diluted ABTS•+ solution at 734 nm at the beginning of the analysis and As was the absorbance of the mixture at 734 nm after 6 min. The ABTS radical scavenging capacity was expressed as mmol gallic acid/g DFRB.
Determination of value-added biomolecules
Phytic acid
The phytic acid content in the DES supernatant of DFRB extract was carried out using the Wade reagent method as described by Gao et al. (2007). A five mL aliquot of the DES extract supernatant was passed through a Dowex anion exchange column (0.25 g). Inorganic phosphorous and interfering compounds were eluted with 7.5 ml of 0.1 M NaCl, followed by elution of phytate with 7.5 ml of 0.7 M NaCl. The eluted sample (three mL) was mixed with one mL of the Wade reagent for 10 min. Measurement was conducted using a microplate reader at 500 nm. The DES solution served as the blank control. The phytic acid content in the samples was calculated based on a phytic acid standard curve.
Protein
The protein content within the DFRB extract, derived from the DES supernatant, was quantified using the Bradford assay (Bio-Rad Protein Assay Cat# 500-0006; Bio-Rad Laboratories Ltd., Bangkok, Thailand). The quantification procedure adhered to the manufacturer’s guidelines. Briefly, 10 µl of the sample was mixed with 200 µl of Bradford reagent for 5 min. Subsequently, measurement was conducted utilizing a spectrophotometer set to 595 nm. The DES solution was employed as the blank control for reference. The protein content in the DFRB extract was calculated based on a Bovine serum albumin standard curve.
Reducing sugar
Reducing sugar content was determined using the dinitrosalicylic acid (DNS) assay (Miller, 1959). A 100 µl sample of the DES supernatant of a DFRB extract was mixed with 100 µl of DNS reagent. The mixture was incubated in a water bath at 80 °C for 30 min. After cooling to room temperature, the sample was measured using a spectrophotometer at 575 nm. The DES solution was used as the blank control. The reduced sugar content in the DFRB extract was calculated based on a glucose standard curve.
Statistical analysis
All analyses were carried out in triplicate, and the results are reported as means with corresponding standard deviations. Data were analyzed using SPSS version 17 for Windows (IBM Corp, Armonk, NY, USA). Statistical differences between individual groups were evaluated using Tukey’s Honestly Significant Difference (HSD) test. A p-value of <0.05 was considered statistically significant.
Results
Analysis of the DFRB compositions and DES properties
Table 2 summarizes the proximate analysis of DFRB, highlighting its primary constituents as hemicellulose (23.22%) and protein (18.00%), with minor components comprising 11.74% ash, 8.20% cellulose, 4.27% lignin, and 5.11% moisture. In addition to the proximate analysis, the study examined the pH and polarity of different DESs. These DES types were categorized based on their pH properties, including strongly acidic (ChCl:La), weakly acid (ChCl:Gly), weakly alkaline (ChCl:U), and highly alkaline (K:Gly) as outlined in Table 3. While our initial selection of DES was guided by pH considerations, it is imperative to acknowledge the significant influence of solvent polarity on biomolecule extraction. Solvents with lower polarity tend to yield fewer phenolic compounds (Gil-Martín et al., 2022). Therefore, our study aimed to evaluate whether DES extraction efficiency is affected by polarity, analogous to conventional solvents. Table 3 indicated slight polarity decreases among the DES types, measured by ENR values where higher values indicated lower polarity. ChCl:La had the highest polarity (ENR 47.73 kcal/mol), while other DES types showed slightly varying polarities, measuring 49.04, 49.64, and 49.98 for ChCl:Gly, ChCl:U, and K:Gly, respectively.
| Composition | Amount (% w/w)a |
|---|---|
| Protein | 18.00 ± 0.00 |
| Hemicellulose | 23.22 ± 0.66 |
| Cellulose | 8.20 ± 0.05 |
| Lignin | 4.27 ± 0.18 |
| Moisture | 5.11 ± 0.01 |
| Ash | 11.74 ± 0.04 |
Notes:
Effect of DES type on the extraction of phenolic compounds and value-added biomolecules
Table 4 displays the concentrations and biomolecule types obtained from DFRB extraction using the different DES. The findings indicate that the high alkaline DES (K:Gly) yielded the highest concentrations of total PC (5.49 mg/g DFRB) and protein (12.81 mg/g DFRB) but lower levels of phytic acid (1.04 mg/g) and reducing sugar (2.28 mg/g DFRB). On the other hand, the strong acid DES (ChCl:La) yielded the highest concentrations of phytic acid and reducing sugar, along with a notable presence of total PC (4.33 mg/g DFRB). However, protein concentration from ChCl:La treatment (5.96 mg/g DFRB) was the lowest compared to other DES types. The weak acid DES (ChCl:Gly) and weak alkaline DES (ChCl:U) resulted in moderate protein concentrations (6.22 and 7.45 mg/g DFRB) and lower total PC (3.46 and 2.81mg/g DFRB) compared to strong acid and high alkaline DES types.
| DES | Content (mg/ g DFRB)1,2 | |||
|---|---|---|---|---|
| Total phenolic compounds | Proteins | Phytic acids | Reducing sugars | |
| ChCl:La | 4.33 ± 0.33b | 5.96 ± 0.12a | 50.30 ± 5.23b | 57.05 ± 2.87c |
| ChCl:Gly | 3.46 ± 0.23a | 6.22 ± 0.31a | 0.20 ± 0.07a | 1.68 ± 0.21a |
| ChCl:U | 2.81 ± 0.20a | 7.45 ± 0.29b | 0.10 ± 0.03a | 7.36 ± 0.21b |
| K:Gly | 5.49 ± 0.33c | 12.81 ± 0.15c | 1.14 ± 0.02a | 2.28 ± 0.08a |
Effect of DES type on the selectivity of extraction of phenolic compounds
Figure 2 displays the contents and profiles of PC in various DES extracts, as analyzed using the Folin-Ciocalteu assay. The observed PC types include free form (FPC), soluble esterified bound (SEBPC), and soluble glycosylated bound (SGBPC). The K:Gly treatment showed the highest FPC at 1.81 mg/g DFRB. Moreover, the K:Gly treatment exhibited substantial SEBPC and SGBPC contents, approximately 1.67 mg/g DFRB and 2.27 mg/g DFRB, respectively. Distinct patterns were observed in the PC profiles between potassium (K)- and ChCl-based DESs. In the K:Gly treatment, there were similar contents of the three PC types (FPC, SEBPC, and SGBPC). On the other hand, ChCl-based DES showed dominance of SEBPC and SGBPC, with lower amounts of FPC. For instance, in ChCl:La, ChCl:Gly, and ChCl:U treatments, SEBPC contents were 1.61, 1.30, and 1.01 mg/g DFRB, respectively, while SGBPC contents were 2.27, 1.91, and 1.60 mg/g DFRB, respectively. ChCl-based DES exhibited lower FPC contents, ranging from 0.19 to 0.46 mg/g DFRB.
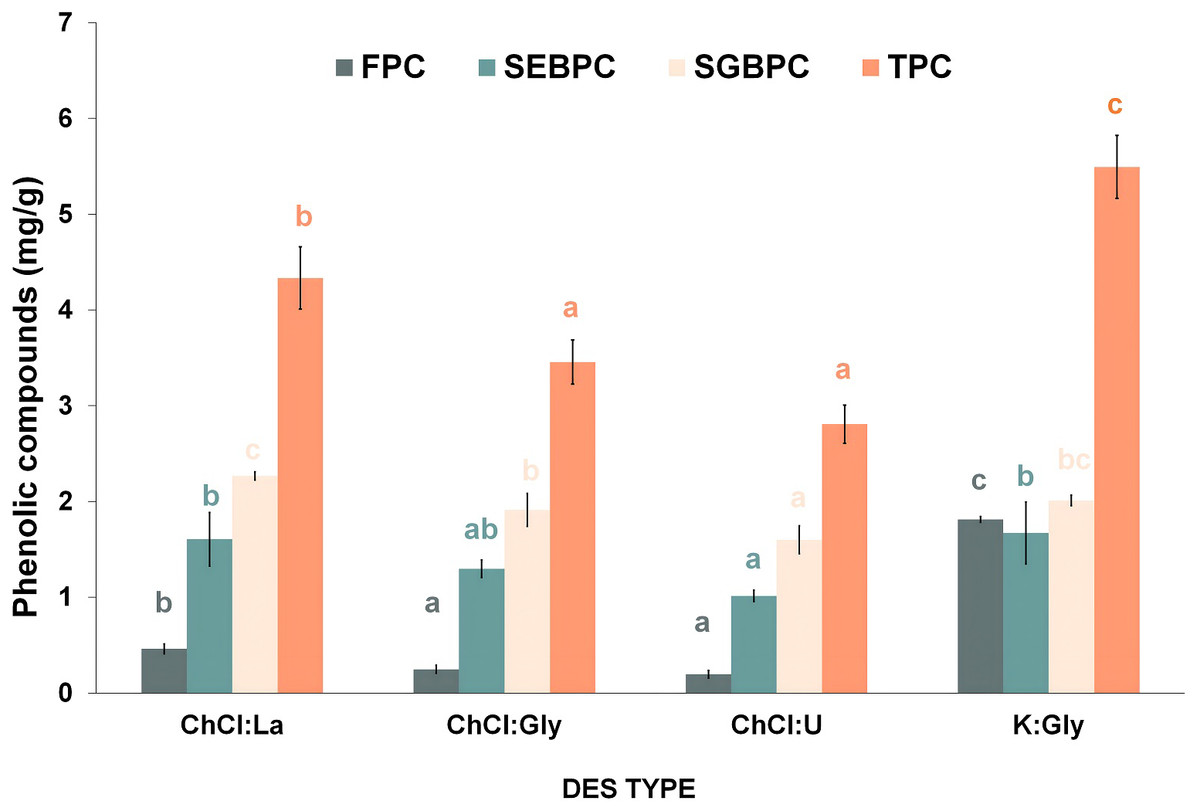
Figure 2: Impact of DES type on phenolic compounds contribution: FPC (free phenolic compounds), SEBPC (soluble esterified bound phenolic compounds), SGBPC (soluble glycosylated bound phenolic compounds), and TPC (total phenolic compounds).
Values with the same letter in the same PC types are not significantly different (p < 0.05).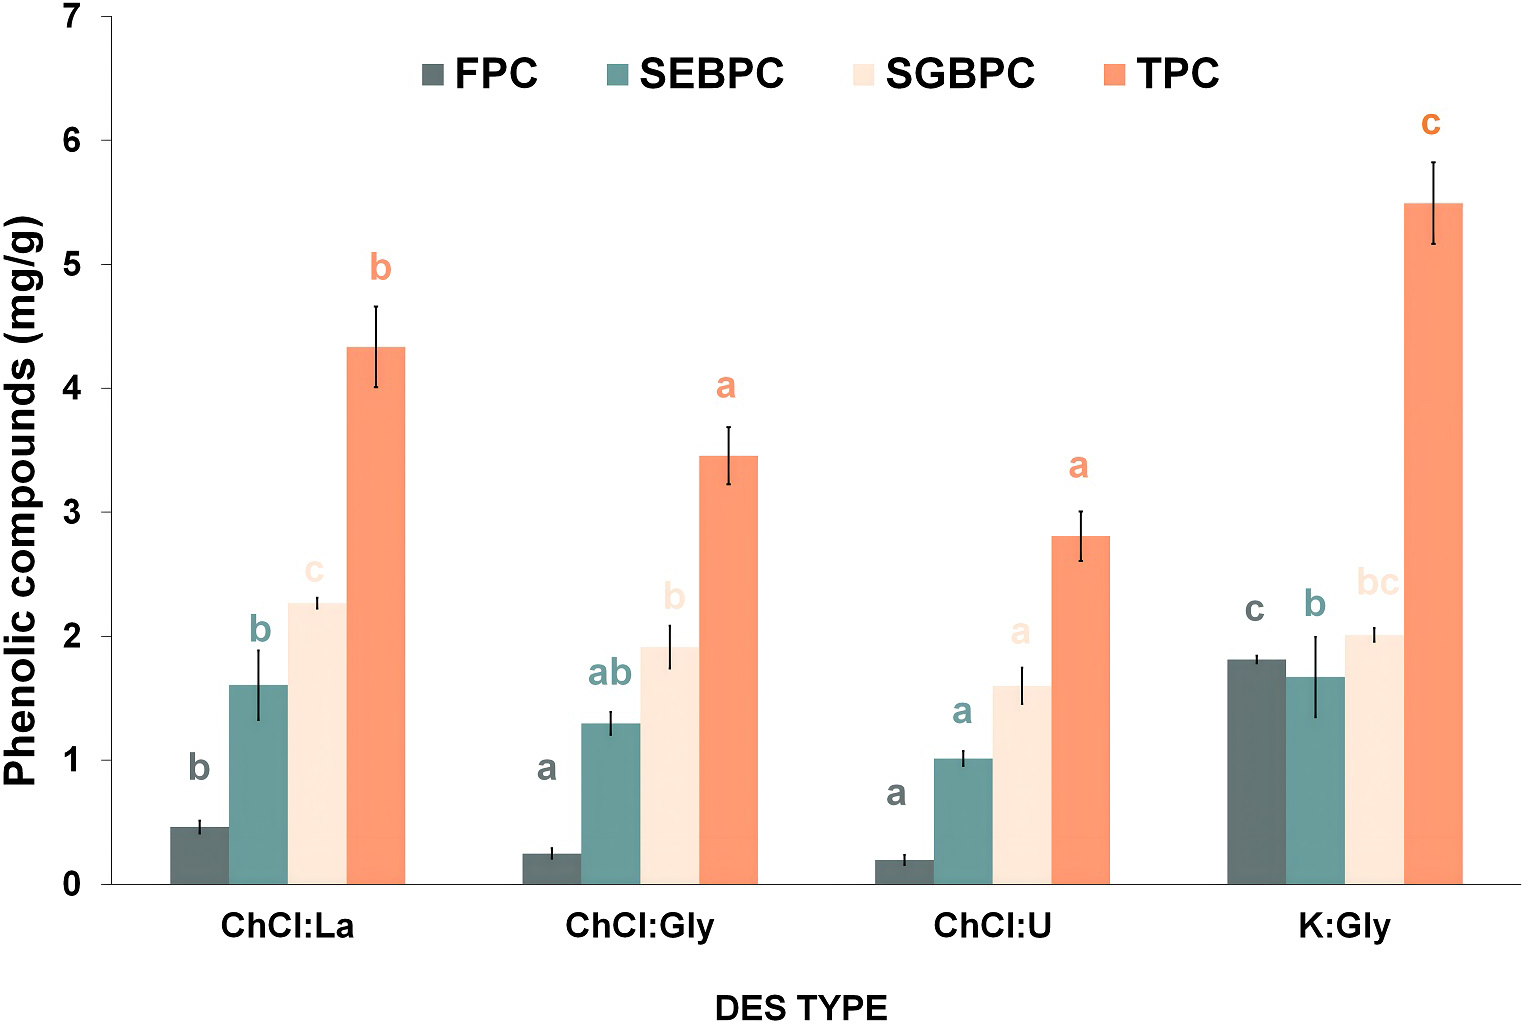
Compositions of phenolic compounds
The composition of phenolic acids within various PC fractions under different DES treatments was analyzed by HPLC. The primary phenolic acid identified across all DES types was ferulic acid, constituting a substantial portion (42.6 − 76.5%, w/w) of both free and bound PC (Figs. 3A–3C). However, the different DES treatments yielded distinct compositions of PC in both free and bound forms. In particular, the FPC was predominantly composed of ferulic acid, ranging from 42.5% to 76.5%, and p-coumaric acid, ranging from 22.4% to 54.1%. It is noteworthy that the FPC obtained from the K:Gly extraction exclusively exhibited dominance of ferulic acid and p-coumaric acid at 76.21% and 22.63%, respectively. While, the FPC derived from ChCl:U extraction exhibited fairly similar amounts of ferulic acid and p-coumaric acid. Sinapic acid in extracts was significantly more abundant in bound form(ranging from 11.37% in SGBPC extracted with K:Gly to 46.84% in SEBPC extracted with ChCl:Gly. Notably, SGBPC consistently exhibited a higher vanillic acid content compared to FPC and SEBPC fractions across most DES extractions. A similar trend was seen for 4-hydroxybenzoic acid, albeit with lower concentrations.
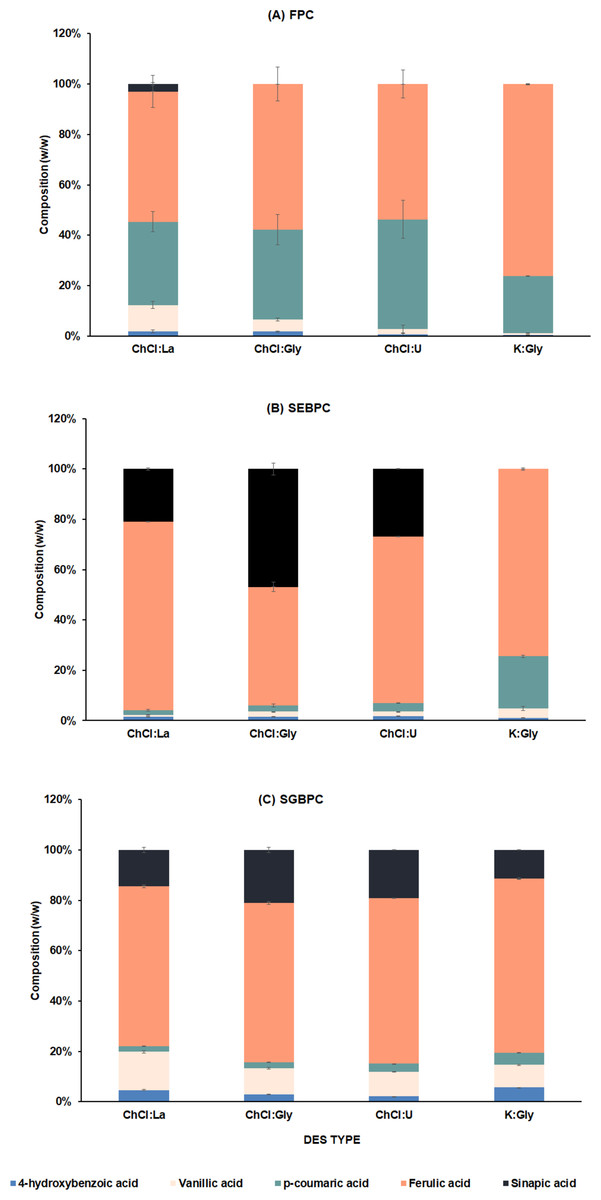
Figure 3: Compositions of phenolic compounds extracted from DFRB using different types of DES: ChCl:La (choline chloride :lactic acid), ChCl:Gly (choline chloride:glycerol), ChCl:U (choline chloride:urea), and K:Gly (potassium carbonate:glycerol).
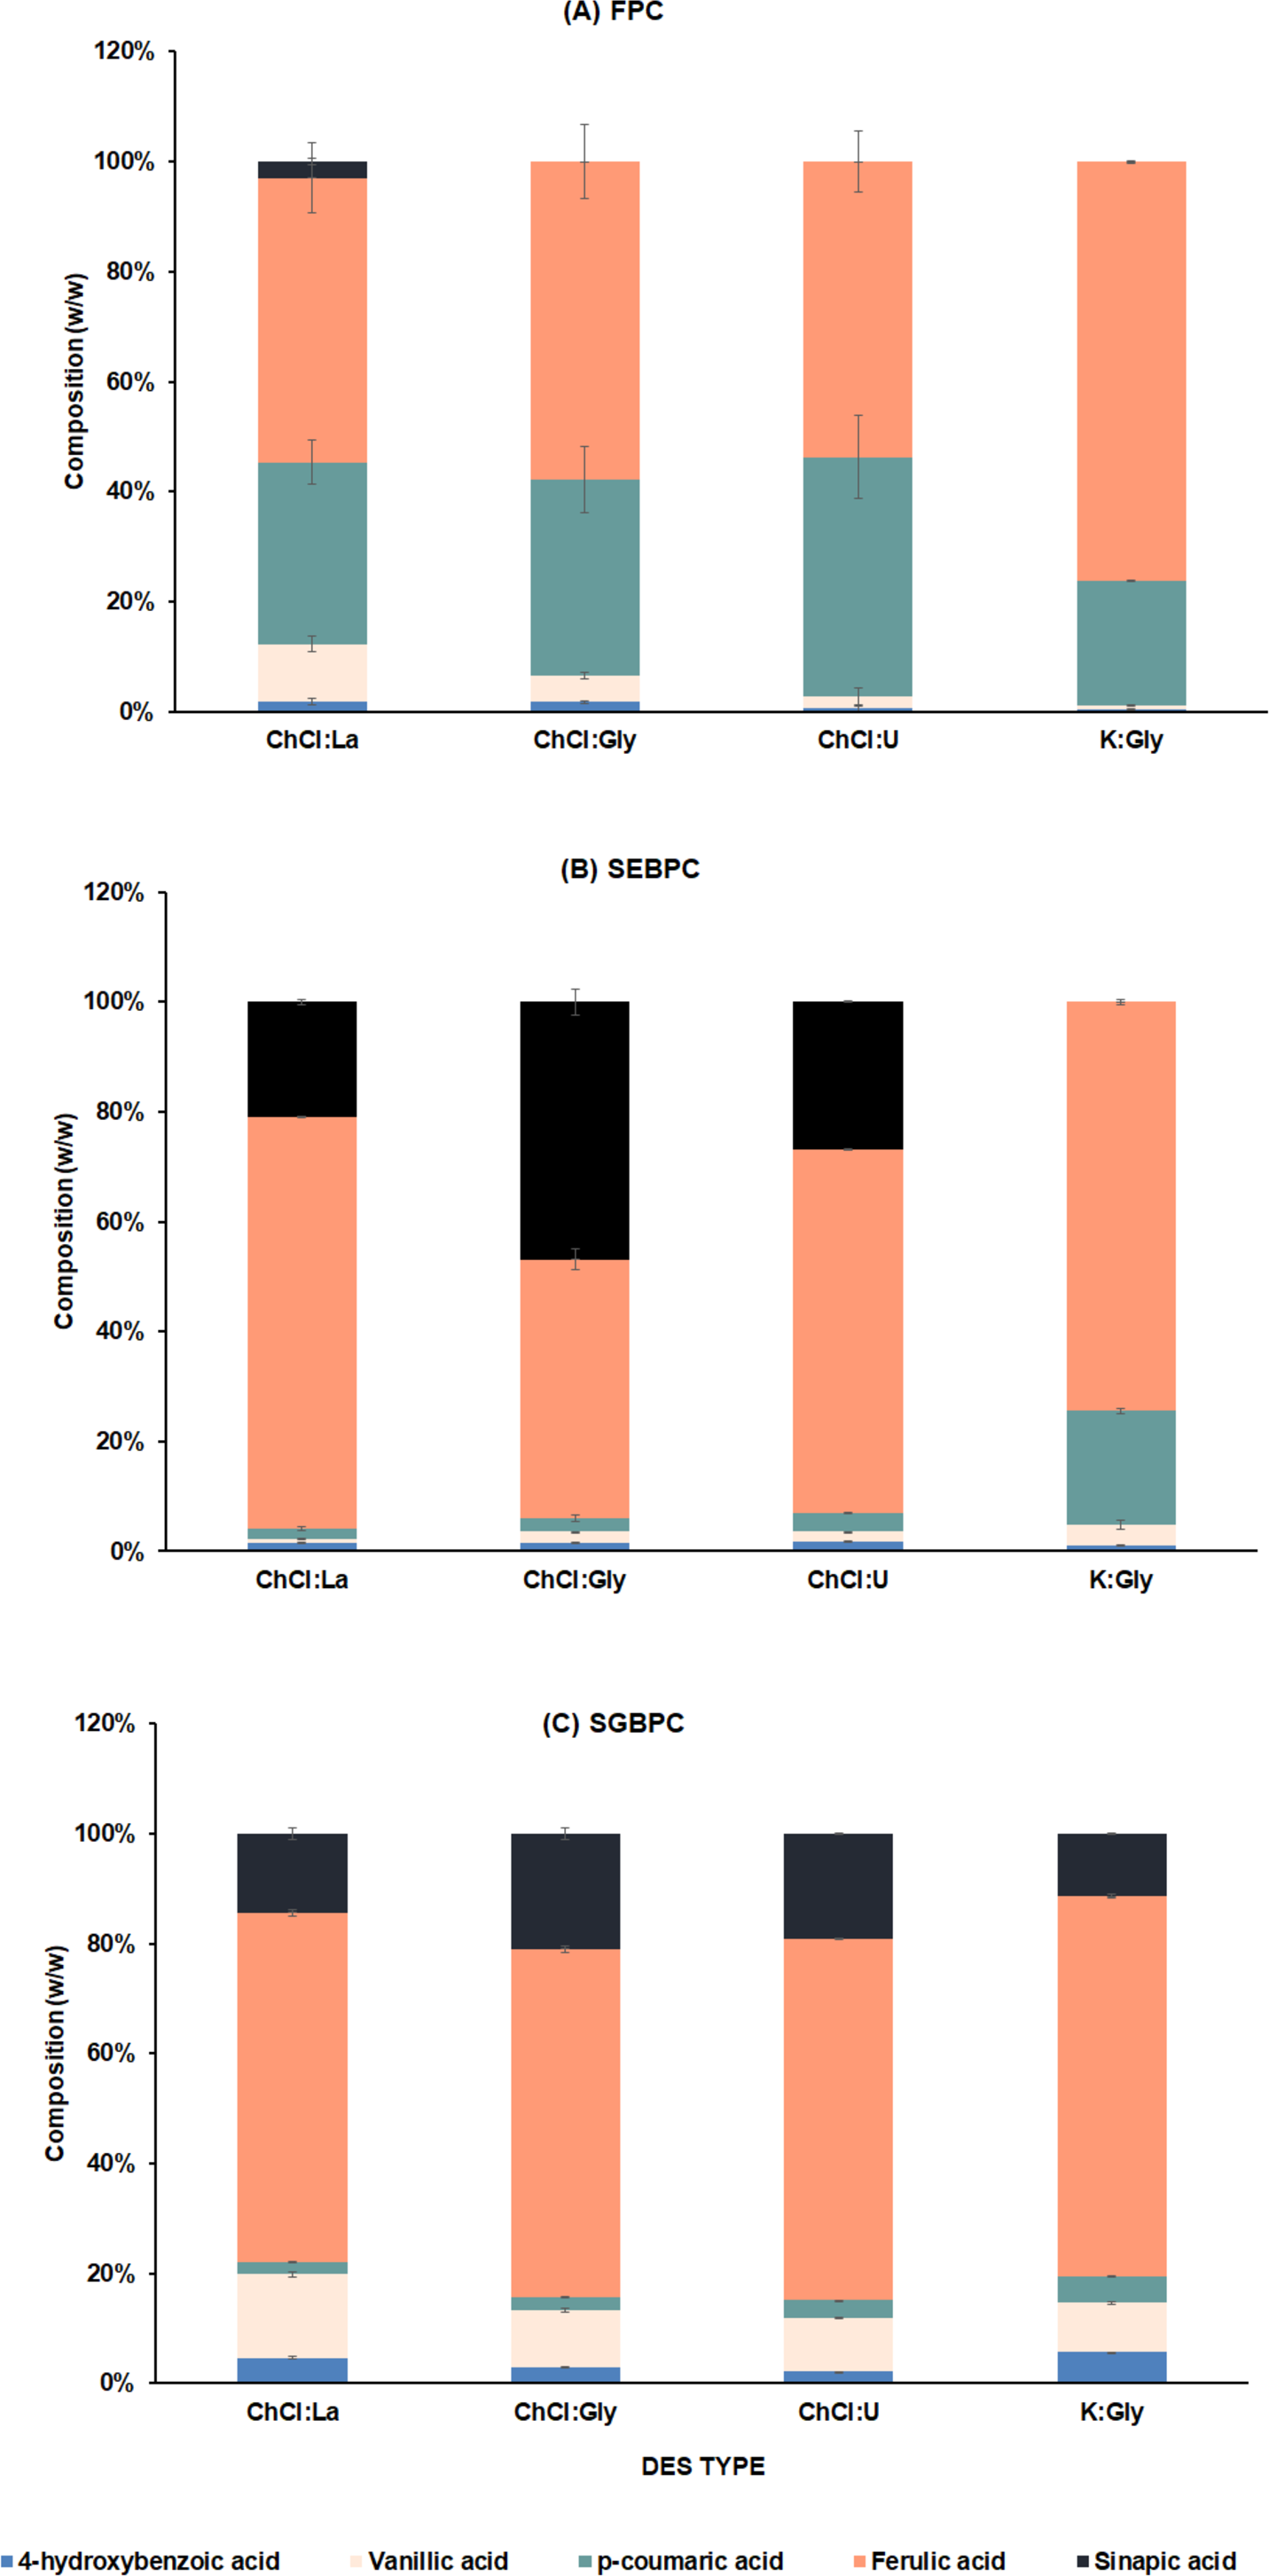
Antioxidant activities of free- and bound-form phenolic compounds
The potential antioxidant activities of free- and bound-form PCs were evaluated using the DPPH and ABTS assays, as presented in Table 5. Similar patterns for radical scavenging activities were observed using both assays. Among the treatments, the PC derived from K:Gly treatments exhibited the highest overall activities, with values of 15.69 mmol (expressed as gallic acid equivalents per gram (GAE/g)) for DPPH and 27.99 mmol GAE/g for ABTS assays. Notably, the total antioxidant activities of PCs extracted from ChCl-based DES were comparatively lower than those from potassium-based DES (K:Gly). The weakest antioxidant activities were found in PCs obtained from ChCl:U treatment, measuring 1.96 mmol GAE/g for DPPH and 10.61 mmol GAE/g for ABTS assays. Analyzing the total PC contents resulting from various treatments, the values were 5.55 mg/g for K:Gly, 4.33 mg/g for ChCl:La, 3.46 mg/g for ChCl:G, and 2.81 mg/g for ChCl:U (refer to Table 4). The ranking of antioxidant activities determined by both assays followed the order: K:Gly >ChCl:La >ChCl:G >ChCl:U, consistent with the total PC contents.
| Anti-radical activity (mmol GAE/g)a | ||||||||
|---|---|---|---|---|---|---|---|---|
| DES | DPPH | ABTS | ||||||
| FPC | SEBPC | SGBPC | Total | FPC | SEBPC | SGBPC | Total | |
| ChCl:La | 0.57 ± 0.17 | 2.66 ± 0.45 | 4.71 ± 0.12 | 7.94 ± 0.24 | 1.09 ± 0.03 | 3.53 ± 1.02 | 17.91 ± 2.00 | 22.57 ± 1.49 |
| ChCl:Gly | 0.11 ± 0.06 | 1.08 ± 0.43 | 3.63 ± 0.53 | 4.83 ± 0.86 | 1.16 ± 0.20 | 8.41 ± 2.03 | 9.72 ± 1.32 | 19.29 ± 1.54 |
| ChCl:U | 0.09 ± 0.04 | 0.52 ± 0.53 | 1.96 ± 0.29 | 2.57 ± 0.70 | 1.17 ± 0.23 | 4.01 ± 1.07 | 5.42 ± 0.36 | 10.60 ± 1.38 |
| K:Gly | 4.02 ± 0.37 | 4.77 ± 0.87 | 6.90 ± 0.87 | 15.69 ± 1.43 | 12.47 ± 0.99 | 6.58 ± 1.51 | 8.95 ± 1.22 | 27.99 ± 0.87 |
Notes:
Discussion
DFRB compositions and DES properties
The components of DFRB showed the following order: hemicellulose >protein >ash >cellulose >moisture >lignin. These findings deviate from the results reported by Moreira et al. (2022), except for the ash content. In their investigation, DFRB displayed different proportions, comprising 27.81% cellulose, 12.4% ash, 11.56% hemicellulose, 10.60% moisture, and 8.63% lignin. On the other hand, protein content closely aligned with prior studies, indicating approximately 17% protein content in DFRB, consistent with the observations made by Sairam, Gopala Krishna & Urooj (2011) and Zhuang et al. (2019). According to Wancura et al. (2023), the typical composition of rice bran demonstrates ranges of 23–28% cellulose, 11–18% hemicellulose, 12–20% protein, 8.5–16% ash, 8.5–12.5% moisture, and 3–9% lignin. These variations can be attributed to diverse factors, including cultivation conditions, rice species diversity, and soil agronomic nuances, as well as differences in analysis methodology and sample pretreatment (Wancura et al., 2023). Based on pH measurements, the DESs used in this study can be categorized into four groups: strongly acidic (ChCl:La), weakly acidic (ChCl:Gly), highly alkaline(K:Gly), and weakly alkaline (ChCl:U). The pH values for these DES types in a 1:2 molar ratio were consistent with previous research. Sazali et al. (2023) and Ruesgas-Ramón et al. (2020) reported pH values of 0−1.0 and 0.78 for ChCl:La and 4.0−5.0 and 4.34 for ChCl:Gly, respectively. Zhu et al. (2023) reported a pH of 5.86 for ChCl:Gly (1:2 molar ratio), while Thi & Lee (2019) reported a pH of 9.0 for the 1:2 molar ratio of ChCl:U DES. Additionally, the pH value of K:Gly in a 1:7 molar ratio was reported as 12.3 in a prior study (Lim et al., 2019), consistent with the value of 11.21 found in this study. It is noteworthy that DES pH values vary based on the molar ratios used. For instance, as the amount of glycerol increased in K:Gly DES, the pH value gradually decreased (Lim et al., 2019). However, for ChCl-based DESs, pH is significantly affected by molecular-level interactions between the HBA and HBD components (Sazali et al., 2023). In terms of ENR assessment among the DES options, ChCl:La demonstrated the highest polarity and exhibited efficient extraction of primary components, including PC, phytic acids, and reducing sugars. The polar characteristics of K:Gly closely resembled those of ChCl:U and ChCl:Gly. Notably, a prior study reported an ENR value of 49.55 kcal/mol for ChCl:Gly:water with a molar ratio of 1:2:1 (Dai et al., 2013), aligning with our findings, which measured 49.04 kcal/mol for the 1:2 molar ratio of ChCl:Gly with 20% water (0.35 mol). A study by Pandey & Pandey (2014) used solvatochromic probes to quantitatively measure the polarity of various DES formulations. These DESs were prepared by combining ChCl with glycerol, urea, malic acid, and ethylene glycol in a 1:2 molar ratio. Their findings suggested that the high polarity of these DESs primarily arose from the inherent HBD characteristics in their components. Another investigation revealed that natural deep eutectic solvents (NADES) based on organic acids exhibited greater polarity than those composed of alcohols and sugar-based components (Dai et al., 2013).
Effect of DES type on the extraction of phenolic compounds and value-added biomolecules
More than 70% of the total PC present in RB are insoluble and covalently linked to cell wall components such as cellulose, hemicellulose, lignin, pectin, and structural proteins. Extracting these bound PCs from plants using conventional aqueous or organic solvents is challenging. Typically, chemical methods involving acid or base hydrolysis are utilized to enhance the extractability of PCs (Kim & Lim, 2016). Recent research indicates that DESs offer higher PC extractability compared to traditional solvents, with ChCl-DES exhibiting exceptional solubility and selectivity for PCs. The efficacy of DESs as extraction solvents is attributed to the ability of the HBD component to form hydrogen bonds with macromolecules present in plant cell walls. Mechanisms of PC extraction using ChCl-DES solvents have been proposed by Alam et al. (2021). In this study, we utilized four distinct DES formulations with pH levels ranging from acidic (pH 0.42) to alkaline (pH 11.21) to extract PCs and value-added biomolecules from DFRB, eliminating the need for traditional acid or base chemical hydrolysis. The results presented in Table 4 depict unique profiles of bioactive compounds extracted by these DES variants. The results revealed that the highly alkaline K:Gly demonstrated remarkable efficiency in extracting PCs and protein, while it did not exhibit the same proficiency in extracting phytic acid and sugars. Conversely, the potent acid, ChCl:La, exhibited excellent extraction capabilities for phytic acid, reducing sugars, and phenolic content. ChCl:gly and ChCl:U, representing weak acid and weak alkaline types, respectively, showed moderate efficacy in extracting a range of bioactive compounds. The pH of DES emerged as a key factor influencing the extraction efficiency of PC and value-added biomolecules. DESs with either low or high pH values exhibited the potential to disrupt plant cell walls more effectively, thereby facilitating the release of bioactive molecules into the DES solution. Tan, Ngoh & Chua (2018) reported that DES types with harsh pH conditions, such as ChCl:La and K:Gly, demonstrated enhanced efficiency in dissolving biopolymers compared to DESs with pH levels closer to neutral. Moreover, the acidic ChCl:La and alkaline K:Gly have been shown to effectively delignify wheat, corn, and rapeseed stem residues (Suopajärvi et al., 2020).
The primary ChCl-based DES commonly used for PC extraction incorporates polyalcohols (e.g., glycerol) as the HBD, followed by carboxylic acids(e.g., lactic acid) and amides (e.g., urea) serving as HBD. However, research indicates that the PC extractability of carboxylic acid–based ChCl-DES surpasses that of amide-based ChCl-DES due to the presence of free H+ ions in carboxylic acids. These ions play a crucial role in catalyzing the hydrolysis of cellulose, hemicellulose, and pectin within the cell walls of biomass. Consequently, this catalytic process promotes the diffusion of PCs from the biomass matrix to the ChCl-DES (Alam et al., 2021), aligning with the findings of our study. ChCl:La has been reported as an effective solvent for extracting PCs from rice bran and other agricultural waste sources (Jablonsky et al., 2020; Ruesgas-Ramón et al., 2020; Santos et al., 2021).
The higher content of reducing sugars under strongly acidic DES conditions can be attributed to the hydrolysis of β-glycosidic bonds in cellulose and hemicellulose to release reducing sugars. Ren et al. (2020) proposed a detailed mechanism for the conversion of cellulose into total reducing sugar using acidic DES, shedding light on this process. It is worth noting that corn stover treated with ChCl:La exhibited the presence of reducing sugars, as observed by Liang et al. (2021). Additionally, a higher quantity of reducing sugars in the liquid fraction of ChCl:La-treated samples was obtained when compared to K:Gly, ChCl:U, and ChCl:Gly treatments, as reported by Tan et al. (2021).
Protein extraction from rice bran is typically achieved through a two-step process involving alkaline extraction followed by acid precipitation. The use of alkaline conditions enhances protein extraction yield by breaking down the protein matrix, which, in turn, increases the surface charge and solubility of proteins in an aqueous extraction medium (Abd Rahim et al., 2023). The suggested pH range for extracting rice bran protein typically falls within the range of pH 7.5 to pH 11 (Zheng et al., 2019). In this study, ChCl:U (pH 8.41) and ChCl:Gly (pH 11.21) exhibited high protein content at 7.45 and 12.81 mg/g DFRB, respectively, aligning with a previous study that employed K:Gly as medium for the extraction of protein from defatted wheat germ (Olalere & Gan, 2023). Unfolding and denaturation of proteins are strongly pH-dependent, with acid-induced unfolding often occurring between pH 2 and 5 and base-induced unfolding at pH 10 or higher (Konermann, 2012). Therefore, if protein extraction is the primary objective, ChCl:La DES may not be the ideal choice as an extraction solvent. On the other hand, low pH values between 0 and 1 are required to dissociate phytate from iron and protein complexes (Gifford & Clydesdale, 1990). Results obtained by Saad et al. (2011) also showed that an acidic solution containing 5% H2SO4 at pH 0.6 yielded the highest amount of phytic acid extracted from rice bran. Thus, the pronounced acidic characteristics of ChCl:La played a substantial role in the increased phytic acid content observed in this study.
Similar to traditional extraction methods involving aqueous or organic solvents, various extraction parameters such as temperature, time, and solid-to-liquid ratio significantly influence extract yields and stability. Optimal temperatures for ChCl-based DESs in extracting phenolic PC from biomass typically range between room temperature and 80 °C. Elevated temperatures, over 40 °C, are often utilized to reduce the viscosity of ChCl-based DESs, facilitating enhanced solute transfer from solid to liquid phases (Alam et al., 2021). Our study maintained an extraction temperature of 70 °C, well within the optimal range. However, it is important to note that higher temperatures may cause thermal degradation of PCs. For example, research by Xiao, Han & Shi (2008) highlighted the significant impact of extraction temperature on flavonoid concentration. Their findings revealed that a range between 70 to 110 °C did not decrease the flavonoid content from Radix Astragal. The optimal extraction time for phenolic compounds using ChCl-DESs, as summarized by Alam et al. (2021), typically ranges from 30 to 240 min and is dependent on the specific characteristics of the biomass and ChCl-DESs used. For instance, (Suopajärvi et al., 2020) employed 8 h for PC extraction from wheat straw, corn stalk, and rapeseed stem at 100 °C using ChCl:La and K:Gly DES. In our study, we employed a 7 h extraction time.
Effect of DES type on the selectivity of phenolic compound extraction and the resulting potential in antioxidant activities
In this section, we investigate the influence of different types of DES on phenolic composition and anti-radical activities. It is worth highlighting that the K:Gly treatment demonstrated the highest concentration of FPC. Additionally, among the ChCl-based DES, ChCl:La stood out for its significant presence of soluble-bound PC (Fig. 2).
The impact of pH on the liberation of bioactive compounds was discussed in the previous Section. It was evident that relatively weaker acidic and basic conditions yielded a reduced release of bioactive compounds, likely due to a less efficient degradation of the cell wall, consequently affecting the total release of PCs. Phenolic compounds bound to the cell wall components (such as cellulose, hemicellulose, pectin, lignin, and structural proteins) were found to be more abundant than their free counterparts (Harukaze, Murata & Homma, 1999; Zhou et al., 2004).
Alkaline hydrolysis demonstrated greater effectiveness in liberating PCs from their bound state in comparison to acid hydrolysis (Nenadis, Kyriakoudi & Tsimidou, 2013; Vadivel & Brindha, 2015). The soluble-bound forms, consisting of SEBPC and SGBPC, were observable in both acid and alkaline DES treatments. This could be attributed to the capability of DES to dissolve and modify constituents of the cell wall, such as lignin, cellulose, hemicellulose, and protein, thereby leading to their degradation into smaller molecules. It has been reported that acidic DESs can cleave lignin-carbohydrate linkages and lignin ether bonds. In contrast, alkaline DESs have shown a more pronounced effect on lignin removal compared to hemicellulose (Guo et al., 2022). Additionally, studies have documented the successful extraction of oligosaccharide hydroxycinnamates from wild rice through the application of acid hydrolysis (Bunzel et al., 2002), and the extraction of feruloylated arabinoxylans from nixtamalized maize bran achieved via alkaline hydrolysis (Herrera-Balandrano et al., 2020).
Ferulic acid and p-coumaric acid emerged as the prominent PCs in DFRB. These compounds were detected across all types of DESs and in all forms of PCs (as illustrated in Fig. 3). Furthermore, additional minor PCs, including p-hydroxybenzoic acid, vanillic acid, and sinapic acid, were also identified. These observations are in line with a study by Kim et al. (2006), who identified p-hydroxybenzoic and vanillic acids in both free and bound forms of red and white wheat bran. Additionally, Qiu, Liu & Beta (2010) identified monomeric phenolic acids in wild rice, including p-coumaric, vanillic, syringic, and p-hydroxybenzoic acids, as well as phenolic acid aldehydes, which were found in both soluble and insoluble forms. Similar outcomes were reported by Laokuldilok et al. (2011), who highlighted the prevalence of ferulic acid in rice bran, accompanied by lower quantities of gallic, protocatechuic, hydroxybenzoic, p-coumaric, and sinapic acids in the bound form.
Furthermore, the PCs extracted using different types of DESs displayed distinct variations in radical scavenging activities, as indicated in Tables 4 and 5. A clear correlation was observed between the overall efficiency and the total phenolic contents, suggesting that the extracted PCs remained stable within these DESs. Previous research has highlighted the remarkable stability of polyphenolic compounds in DESs based on sugars, glycerol, betaine, and lactic acid (Gómez-Urios et al., 2023). Notably, the ABTS assay revealed a stronger trend in antioxidant activity when compared to the DPPH assay. This difference can be attributed to varying mechanisms, primarily involving hydrogen atom transfer (to scavenge free radicals through hydrogen donation) and electron transfer (to reduce compounds by transferring electrons) (Apak, 2019).
Conclusions
This study investigated the influence of acidity and alkalinity within DESs on the extraction of PCs and other value-added biomolecules from DFRB. The outcomes highlight the potential of adjusting DES properties by controlling pH levels, thus making them adaptable solvents that effectively extract and isolate valuable compounds from agricultural by-products such as DFRB. These findings open up promising opportunities for sustainable utilization and value enhancement across various industries. Further work is ongoing to implement a strategy where pH-tuned DES may be used to drive the optimum composition of the natural extract, especially with the aim of promoting its application as an antioxidant ingredient.