
A simple, cost-effective colorimetric assay for aluminum ions via complexation with the flavonoid rutin
- Published
- Accepted
- Received
- Academic Editor
- Scott Wallen
- Subject Areas
- Spectroscopic Analysis, UV-Visible Spectroscopy
- Keywords
- Colorimetric assay, Flavonoid, Aluminum, Metal chelation
- Copyright
- © 2022 Arnold et al.
- Licence
- This is an open access article distributed under the terms of the Creative Commons Attribution License, which permits unrestricted use, distribution, reproduction and adaptation in any medium and for any purpose provided that it is properly attributed. For attribution, the original author(s), title, publication source (PeerJ Analytical Chemistry) and either DOI or URL of the article must be cited.
- Cite this article
- 2022. A simple, cost-effective colorimetric assay for aluminum ions via complexation with the flavonoid rutin. PeerJ Analytical Chemistry 4:e19 https://doi.org/10.7717/peerj-achem.19
Abstract
Aluminum has been linked to deleterious health effects with high concentration, chronic exposure, creating a need for innovative detection techniques. Colorimetric assays are an ideal approach since they are simple, cost-effective, and field adaptable. Yet, commercially available colorimetric assays for aluminum are limited since it forms few colored chelation complexes. Flavonoids, a class of polyphenolic compounds, are one of the few examples that create colored aluminum complexes. Aluminum ions (Al3+) are the main constituent in colorimetric assays for flavonoid detection in food or plant samples. Our assay design was based on colorimetric flavonoid assays, where the assay reported herein was optimized. Specifically, the flavonoid rutin concentration and sample-to-rutin volume ratio (295:5 µL) were optimized to detect Al3+ at low µM concentrations in samples. The assay performed comparably, and in some instances better, than those requiring advanced instrumentation and previously reported colorimetric assays, with a linear range (1–8 µM), sensitivity (7.6 nM), limit of detection (79.8 nM), and limit of quantification (266 nM) for Al3+. The colorimetric assay was accurate (99 ≤ 108 ± 4 ≤ 6% Al3+ recovery), precise (low intra- and inter-assay coefficient of variation (CV) of 3.1 ≤ 5.9% and 4.4%, respectively), and selective for Al3+ ions compared to solutions containing a variety of other mono-, di-, and tri-cations at much higher concentrations (10- to 100-fold higher). Lastly, the colorimetric assay was applicable to complex analysis. It was used to generate a chelation curve depicting the Al3+ chelation capacity of sodium alginate, a biologically derived polymer used as a bioink for 3D bioprinting.
Introduction
Aluminum is a ubiquitous material in the Earth’s crust (Inan-Eroglu & Ayaz, 2018; Igbokwe, Igwenagu & Igbokwe, 2019) and readily enters the environment through weathering processes, and to a lesser extent, by anthropomorphic activity (Igbokwe, Igwenagu & Igbokwe, 2019). Interestingly, aluminum ions (Al3+) have no physiological role; in fact, there is a growing body of evidence that suggests chronic exposure to high concentrations of aluminum can cause deleterious health effects in humans and other animals (Inan-Eroglu & Ayaz, 2018; Igbokwe, Igwenagu & Igbokwe, 2019; Klotz et al., 2017). Thus, it is essential to develop effective techniques to quantify aluminum.
Advanced methods to quantify aluminum, such as flame atomic absorption spectroscopy (AAS), graphite furnace AAS, and inductively coupled plasma—mass spectrometry (ICP-MS), are sensitive techniques with typical aluminum detection ranges of 185–3.7 × 10³ µM, 0.40–4.0 µM, (12020:1997, 1997) and 0.074–3.7 µM, (Si-Qi et al., 1969) respectively. AAS and ICP-MS, however, require expensive, dedicated instrumentation and an associated equipped laboratory. Alternative methods of quantification include colorimetric assays, which are cost effective, simple to use (Gilchrist & Colorimetry, 2017; Li et al., 2019; Luka et al., 2017), and adaptable for field use (Li et al., 2019; Luka et al., 2017; Raji et al., 2021). A few commercial options for the colorimetric determination of aluminum are currently available. Typically, these colorimetric assay options are semi-quantitative and in the form of test strips (Colorimetric test kit VISOCOLOR ECO, 2021; Aluminium Test colorimetric, 2019). Additionally, a series of options are available to couple with water analysis spectrophotometers from Hach, where it is necessary to use the manufacturer’s kits and testing units (Aluminum TNTplus Vial Test (0.02-0.50 mg/L Al), 2021; Aluminum Reagent Set, 2021a; Aluminum Reagent Set, 2021b). A portable option from Hach is available, the DR300 Pocket Colorimeter, which is a small footprint kit for field aluminum analysis at a relatively low cost (August 2021, $494, Hach.com) (DR300 Pocket Colorimeter, 2021).
From a method development standpoint, aluminum is notoriously difficult as it forms few colored chelation complexes with potential to serve as the recognition element component. The lack of color in most aluminum complexes may explain the relatively small amount of commercially available colorimetric assays. However, small, polyphenolic molecules known as flavonoids form colored chelation complexes with Al3+ ions. In fact, Al3+ ions are used in commonly employed colorimetric assays for detection of specific classes of flavonoids in food or plant samples (Pekal & Pyrzynska, 2014). In theory, if Al3+ can be used to quantify flavonoid content, then the assay could be used to quantify Al3+. To this end, a few studies have suggested that flavonoids may be used quantitatively to determine Al3+ by colorimetric means. However, these assays either require elaborate media conditions (Al-Kindy, Suliman & Salama, 2003; De-song et al., 2004; Oter & Aydogdu, 2011); corrosive reagents; (Ahmed & Hossan, 1995; Medina Escriche, Cirugeda & Hernandez Hernandez, 1983) or complex cocktails of components to function, such as carbon dots and dyes that are used in conjunction with flavonoids (Wang et al., 2020; Zou et al., 2014; Li et al., 2018; Kong et al., 2017).
Here, we proposed a simple colorimetric assay consisting of a low-cost, widely available flavonoid, rutin, to quantify aluminum, without the need for additional components. Specifically, we quantified the linear range, sensitivity, limit of detection (LoD), and limit of quantification (LoQ). Further, the colorimetric assay described herein was screened for its accuracy, precision, and selectivity for Al3+ ions compared to more concentrated amounts of a series of mono-, di-, and tri-cations. After illustration of the attractive quantitative aspects of the disclosed method, we then apply the rutin-based approach for Al3+ quantification to complex sample analysis. Specifically, we demonstrate the utility of the aluminum assay to construct a chelation curve, which represents the chelation response of Al3+ to functional groups contained on a polymer (sodium alginate) until saturation. Sodium alginate is a bio-derived polymer that is commonly used as a bioink for three-dimensional (3D) printing due to its ability to transform from a liquid to a solid upon metal chelation (Arnold et al., 2021). Thus, it is valuable to quantify the portion of Al3+ ions bound in solution as it cross-links the polymer material because the extent of cross-linking enables tuning of the physical properties of the polymer.
Materials & Methods
Chemical reagents and vendors
Dimethyl sulfoxide (DMSO, ACS Spectroscopic Grade, ≥99.9%); rutin hydrate (≥94% by HPLC); aluminum chloride hexahydrate (ReagentPlus, 99%); lithium chloride (99.9% BioXtra); sodium chloride; potassium chloride (≥99.0% SigmaUltra); magnesium chloride hexahydrate (99.0–102.0% ACS reagent); anhydrous calcium chloride (product number: C1016; ≤7.0 mm granular); manganese (II) chloride hexahydrate (99.99% trace metal basis); zinc chloride (Bioreagent); iron (III) chloride (98% reagent grade); and sodium alginate (product number: W201502; manufacturer reported viscosity at 1% in water at 25 °C of 5–40 cps) were purchased from Sigma Aldrich (St. Louis, MO, USA). Copper (II) chloride dihydrate (pure powder) and nickel (II) chloride hexahydrate (99.9999%) were purchased from Acros Organics (The Hague). In-house reverse osmosis (RO) water was used as is without further purification.
Images
All images of samples were acquired with a 16-mega pixel camera.
Aluminum assay protocol
To prepare the assay, 5 µL aliquots of rutin in DMSO (2.25, 4.5, 9, or 18 mM) and 295 µL of RO water or a sample dispersed in RO water was added to a clear, polystyrene, flat bottom 96-well tissue culture plate. A blank consisting of 5 µL of DMSO and 295 µL RO water was also run. The samples were incubated at room temperature for 10 min and then the absorbance spectra were acquired on a Tecan Safire plate reader using Magellan 7.2 sp1 software. Data was acquired in absorbance measurement mode using a wavelength scan acquired over 300–800 nm and a 5 nm step-size. Further, data was acquired at room temperature using a COS96fb plate definition file with no plate lid. Each well had 50 reads with 10 ms in between the movement and read steps. Then, all absorbance spectra were baseline subtracted from the blank containing 5 µL of DMSO and 295 µL RO water. The ratio of absorbance at 410 nm (rutin chelated Al3+ ions) and 355 nm (unchelated rutin) (A410nm/A355nm) was used to determine aluminum content. All stock solutions were made fresh and an aluminum calibration curve for each plate analyzed was run on the same day of testing.
Rutin concentration optimization
A stock solution of rutin (50 mM in DMSO) was used to create dilutions for testing. To determine the appropriate target concentration of rutin, a collection of serial dilutions of rutin in DMSO were evaluated. Specifically, a 48 mM rutin sample was prepared as the maximum concentration that was then diluted, yielding 18 rutin samples ranging from 3.7 × 10⁻⁴–48 mM. Then, 300 µL of each rutin concentration, plus a DMSO blank, were loaded into a 96-well plate and the absorbance spectra were acquired. All rutin samples were run in triplicate and each spectrum was baseline subtracted from the DMSO blank. Rutin concentrations that yielded absorbance values between 0.1–1.0 at 355 nm, which corresponded to unchelated rutin, were used as the basis for further testing for assay development. The rutin concentration range that yielded 0.1–1.0 absorbances, corresponded to a final concentration range of 0.23–0.38 mM. Note that rutin concentrations for aluminum testing required a dilution correction, as shown by Eq. (1), to fall within 0.23–0.38 mM rutin target range since 5 µL of rutin was added to 295 µL of sample, yielding a final volume of 300 µL. (1)
Thus, the upper limit of the rutin component concentration utilized for aluminum quantification was 18 mM, which corresponds to a final rutin concentration of 0.30 mM when diluted with the sample. The 18 mM rutin sample was diluted to generate a total of 4 rutin concentrations including 2.25, 4.5, 9, and 18 mM for use in the optimization of the aluminum assay.
Aluminum assay linear range, sensitivity, limit of detection (LoD), and limit of quantitation (LoQ)
The linear range of the aluminum assay for each rutin concentration (4 samples: 2.25, 4.5, 9, and 18 mM rutin) was determined by identifying the linear portion of the A410nm/A355nm ratios versus Al3+ concentration curves (i.e., an R2 > 0.9) as shown in Fig. S1. Specifically, a stock concentration of 100 mM Al3+ in RO water was diluted to a 16 mM Al3+ sample. The 16 mM Al3+ sample was then serially diluted using a two-fold dilution approach to create a series of Al3+ samples (22) ranging from 7.6 × 10⁻³ µM to 16 mM that were used to generate the A410nm/A355nm versus Al3+ concentration curves (Fig. S1). The linear regions of the curves (i.e., the standards containing 0, 1, 2, 4, and 8 µM of Al3+) were used to construct the aluminum calibration curves in Fig. S1.
The sensitivity of the aluminum assay at various concentrations of rutin was determined using the slope of the aluminum calibration curves in Fig. S1 (Armbruster & Pry, 2008). The LoD for each rutin concentration was determined using a modified method as reported by Armbruster and Pry (Armbruster & Pry, 2008). Specifically, the A410nm/A355nm ratios of n = 10 samples of a low aluminum concentration (l µM Al3+ was used in this study) were measured and converted to µM of Al3+ using the linear equations from the aluminum calibration curves in Fig. S1. Then, the LoD for each rutin concentration was calculated using Eq. (2). That is, LOD is the standard deviation (σ) of the n = 10 Al3+ measurements (reported as µM) as multiplied by 3. (2)
Similarly, the LOQ of each rutin concentration was determined using Eq. (3) (Armbruster & Pry, 2008). (3)
Accuracy and precision of the aluminum assay
A 100 mM Al3+ sample was diluted to 4 µM of Al3+ and analyzed using the assay described above, where the rutin concentration used was 9 mM. A total of n = 60 replicates of the 4 µM Al3+ sample were run on the same plate. On each plate, a blank containing 5 µL DMSO and 295 µL RO water, a control without Al3+, i.e., 5 µL rutin and 295 µL of RO water, and samples to generate a calibration curve encompassing 1-8 µM of Al3+ was run in conjunction with this analysis. All spectra were baseline subtracted from the blank.
The percent of aluminum recovered from the analysis was determined by converting the A410nm/A355nm ratios to concentration of Al3+ using a calibration curve and Eq. (4). (4)
Then, the coefficient of variation (CV), expressed as %, for the n = 60 replicates, which is also referred to as the intra-assay CV, was determined using Eq. (5): (5)
where σ is the standard deviation of the %Al3+ recovered from n = 60 replicates and x is the average of the %Al3+ recovered from n = 60 replicates (Haserodt, Aytekin & Dweik, 2011). This process was repeated with 2 additional 100 mM Al3+ samples, yielding a total of 3 datasets with an intra-assay CV. The inter-assay CV was determined by calculating the average of the intra-assay CV for the 3 datasets (Haserodt, Aytekin & Dweik, 2011).
Rutin cation selectivity
A series of solutions containing 8, 80, and 800 µM of mono- (Li+, Na+, K+), di- (Mg2+, Ca2+, Mn2+, Ni2+, Cu2+, Zn2+), and tri-cations (Fe3+) were prepared and analyzed using the aluminum assay procedure described above, with a rutin concentration of 9 mM. A total of n = 3 measurements for each cation at each concentration was evaluated. A blank, no Al3+ control, and samples to generate an Al3+ calibration curve were run in conjunction with this analysis as described in the accuracy and precision section above. All spectra were baseline subtracted from the blank.
To express the signal produced by the cations, an aluminum calibration curve was used to convert the ratio of the absorbances at 410 to 355 nm to concentration for each cation. Then, the measured concentrations were normalized to the concentration of the highest aluminum standard in the calibration curve (i.e., 8 µM Al3+) using Eq. (6). (6)
Sodium alginate-aluminum gelation
Approximately 2 mL of an 8% (w/v) sodium alginate solution dissolved in RO water was added to a 6-well, polystyrene tissue culture dish. Then, 2 mL of a 100 mM aluminum chloride solution was added to the same well and incubated at room temperature for 24 h. The resulting alginate-aluminum gel was then removed from the well with forceps and placed on a microscope slide. Images of the 8% (w/v) sodium alginate, alginate-aluminum gel immediately after adding 2 mL of aluminum chloride, alginate-aluminum gel after a 24 h incubation, and alginate-aluminum gel on a microscope slide were acquired and demonstrated in Fig. S4.
Sodium alginate-aluminum chelation curve
A 0.001% (w/v) solution of sodium alginate preprepared in RO water was aliquoted in 5 mL volumes for chelation analysis. Then, a specific volume of an 819 µM Al3+ sample was added to each 5 mL 0.001% alginate sample (Table 1). The alginate-aluminum samples were incubated at room temperature for at least 10 min to promote chelation. Then, the samples were filtered with a Whatman 0.02 µm polytetrafluoroethylene (PTFE) syringe filter to remove the alginate-Al3+ chelation complexes. The filtered solutions containing unchelated aluminum were analyzed using the colorimetric assay procedure described above.
| Volume of 0.001% Alginate (mL) | 5.00 | ||||||
| Volume of 819 µM Al3+ Added (µL) | 0 | 10 | 20 | 40 | 80 | 160 | 320 |
| Total Volume (mL) | 5.00 | 5.01 | 5.02 | 5.04 | 5.08 | 5.16 | 5.32 |
| Final Concentration of Al3+ Added (µM) | 0.00 | 1.63 | 3.26 | 6.50 | 12.9 | 25.4 | 49.3 |
| Measured Concentration of Al3+ (µM)* | 0.0 | 1.3 ± 0.9 | 1.8 ± 0.9 | 1.7 ± 0.5 | 0.9 ± 0.3 | 6.3 ± 0.7 | 32 ± 2 |
| Concentration of Chelated Al3+ (µM) | 0.00 | 0.3 ± 0.9 | 1.5 ± 0.9 | 4.8 ± 0.6 | 12.0 ± 0.3 | 19.1 ± 0.7 | 17.3 ± 2 |
Notes:
The absorbances of n = 3 replicates were measured for each sample analyzed (Table 1), where the 0 µL sample consisted of only 0.001% sodium alginate with no Al3+ added. All absorbances were baseline corrected to a blank consisting of 5 µL of DMSO and 295 µL RO water. Then, the calibration curve was used to calculate the concentration of Al3+ and the average was computed for the n = 3 replicates. The samples (10-320 µL of added Al3+) were corrected to the 0 µL sample, yielding the measured concentration of Al3+ ions (i.e., the unchelated Al3+).
The concentration of the Al3+ ions chelated by alginate, as shown in Table 1, was calculated using Eq. (7). (7)
The chelation curve was generated by plotting the concentration of chelated Al3+ ions (µM) versus the volume of 819 µM Al3+ sample added. The saturation point was determined using the extrapolation of two straight lines in TRIOS (TA Instruments) software using the Endset point function. Using the saturation information, the mole-to-mole binding ratio of alginate, specifically the number of carboxylic acids on alginate, to Al3+ ions was calculated using Eq. (8): (8)
The thermodynamic stability of the alginate2-Al3+ complex, where the subscript 2 represents the number of moles of alginate required to chelate 1 mol of Al3+ ions, was determined using three parameters: stability constant (β), logarithm of the stability constant (log β), and the Gibbs free energy of chelation (ΔG). The balanced chemical equation (Eq. (9)) of the chelation process (i.e., the formation of the Alginate2-Al3+ complex) was used to quantify the thermodynamic stability parameters. (9)
Thus, the stability constant (β) is quantified using the following equation: (10)
where [Alginate2-Al3+] is equivalent to the concentration of chelated Al3+ ions calculated using Eq. (7) and displayed in Table 1 and [Alginate] and [Al3+] are computed using Eqs. (11) and (12). (11) (12)
In Eqs. (11) and (12), the 0 subscript indicates initial concentrations.
Lastly, the Gibbs free energy (ΔG) of the chelation process was calculated using Eq. (13): (13)
where R is the ideal gas constant (8.314 J mol−1 K−1), T is room temperature (293.15 K), and log β is determined by taking the logarithm of β from Eq. (10).
Results and Discussion
Rationale for assay design
Al3+ ions can form colored complexes with numerous compounds from the flavonoid family (Pekal & Pyrzynska, 2014; Cvek et al., 2007; Mammen & Daniel, 2012; Shraim et al., 2021). Yet, the cost and availability of flavonoids varies widely. The cost of rutin, for example, when procured from a scientific supplier in the United States is $2.44 USD/g (as of August 2021 from Sigma Aldrich), where hundreds of gram quantities can be acquired. Orientin, on the other hand, is only available in small quantities (10 mg) at $43,000 USD/g from the same scientific supplier. The cost and availability of other flavonoids are outlined in Table 2. Considering this, cost and availability were the main considerations when selecting a flavonoid. Thus, rutin, which is the most cost effective and widely available flavonoid identified, was used for assay development.
Notes:
Assay optimization
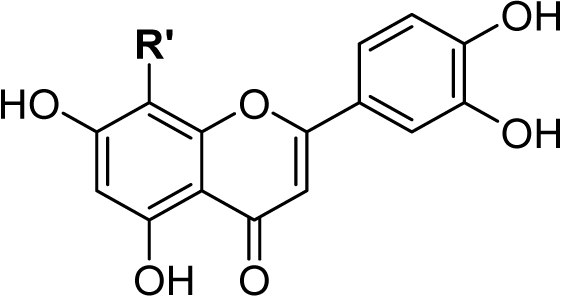
The chemical structure of rutin (Fig. 1A) and other flavonoids makes it uniquely equipped to chelate metals. As a ligand, rutin features weakly acidic phenol moieties that bind metal ions to form acid-stable complexes (Tristantini & Amalia, 2019; Jomova et al., 2019; Karpinsky et al., 2020). In the case of rutin, phenols on ring B (Pekal & Pyrzynska, 2014; Kasprzak, Erxleben & Ochocki, 2015; Jomova et al., 2019) and the phenol and keto group on rings A and C, (Pekal & Pyrzynska, 2014; Kasprzak, Erxleben & Ochocki, 2015; Tristantini & Amalia, 2019; Jomova et al., 2019) respectively, are potential sites for chelation. When rutin forms a chelation complex with Al3+ ions, a signature yellow color forms, which can be quantified using absorption spectroscopy (Pekal & Pyrzynska, 2014) (Fig. 1B). The absorbance spectrum of unchelated rutin has a signal maximum at 355 nm. As aluminum concentration increases, the absorbance at 355 nm decreases, while a new peak at 410 nm increases, where the peak at 410 nm is indicative of the rutin color-signature complex with Al3+ ions. Considering this, the inverse relationship between the absorbance at 355 nm and 410 nm can be exploited to quantify aluminum content. While the absorbance at either 355 nm or 410 nm can be utilized, previous literature has shown that a ratiometric approach (i.e., an absorbance ratio) produces more consistent results because it is self-correcting to minor fluctuations in absorbance (Wang et al., 2020; Zou et al., 2014; Li et al., 2018). Thus, the ratio of the absorbance at 410 nm to the absorbance at 355 nm (A410nm/A355nm), which is proportional to aluminum concentration, was used as the signal response.
Figure 1: Rutin chelation of aluminum forms colored complexes.
The metal chelation capacity of rutin to form acid-stable, colored complexes with aluminum ions. (A) Chemical structure of rutin, where the rings of the structure are denoted A–C and possible chelation sites are highlighted in red. (B) Absorbance spectra of rutin-aluminum chelation complexes with increasing aluminum concentration and a representation of the color shift from pale yellow to dark yellow after rutin chelation of Al3+ ions. The spectra demonstrate that the absorbance peak at 355 nm, which is indicative of unchelated rutin, decreases with increasing aluminum content while the absorbance peak at 410 nm that corresponds to rutin-aluminum chelation complexes increases with increasing aluminum concentration. Both the absorbance at 355 and 410 nm are highlighted in gray.
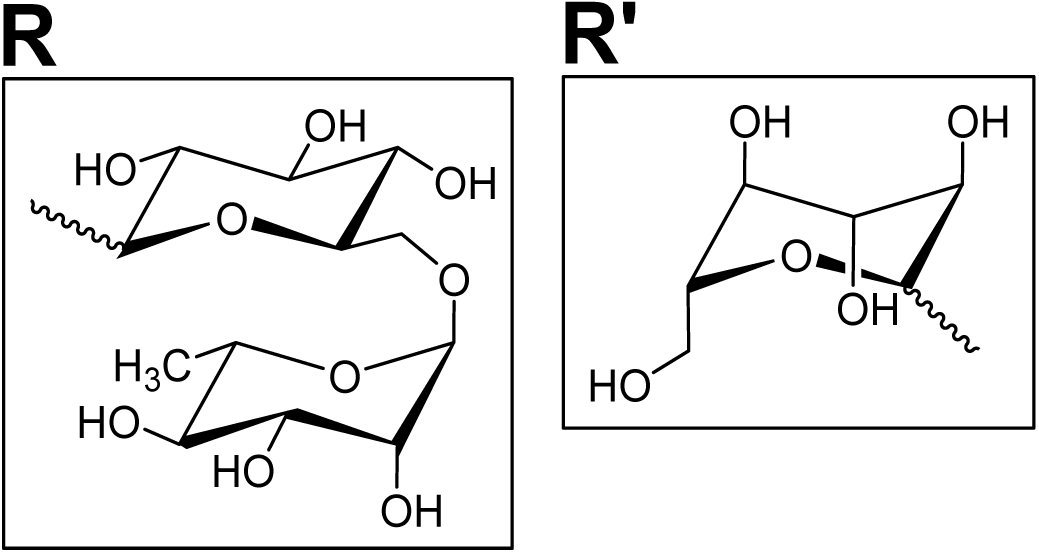
We were interested in developing a colorimetric assay for aluminum quantification with detection ranges comparable to advanced methods and assays that have been previously described (low µM range). Considering this, we used colorimetric protocols for flavonoid quantification using Al3+ ions as the basis for our assay design. There are numerous procedures available, but protocols were not suited to detecting low concentrations of Al3+ ions; rather, they were optimized using high concentrations of aluminum to detect dilute solutions of flavonoids that were added in large volume ratios (1:3 flavonoid to assay volume). Thus, we aimed to tune the assay for lower, more sensitive detection and quantification of aluminum using high concentrations of rutin with low volume ratios (5:295 rutin to assay volume), which in turn, enabled larger volume ratios of aluminum samples (295:5 Al3+ to assay volume) to be analyzed (Fig. 2A).
Figure 2: Rutin-based colorimetric assay overview of aluminum quantification.
Overview of the rutin-based colorimetric assay for Al3+ ion quantification. (A) Representation of the assay procedure. (B) Visual representation of assay samples containing aluminum concentrations within the linear range of quantification. (C) Calibration curve of the assay reported as the ratio of the absorbance at 410 and 355 nm versus aluminum concentration. The values in panel (C) are the average of n = 3 measurements whereas the error bars, which are small and within the boundaries of the marker, are the standard deviation of n = 3 measurements.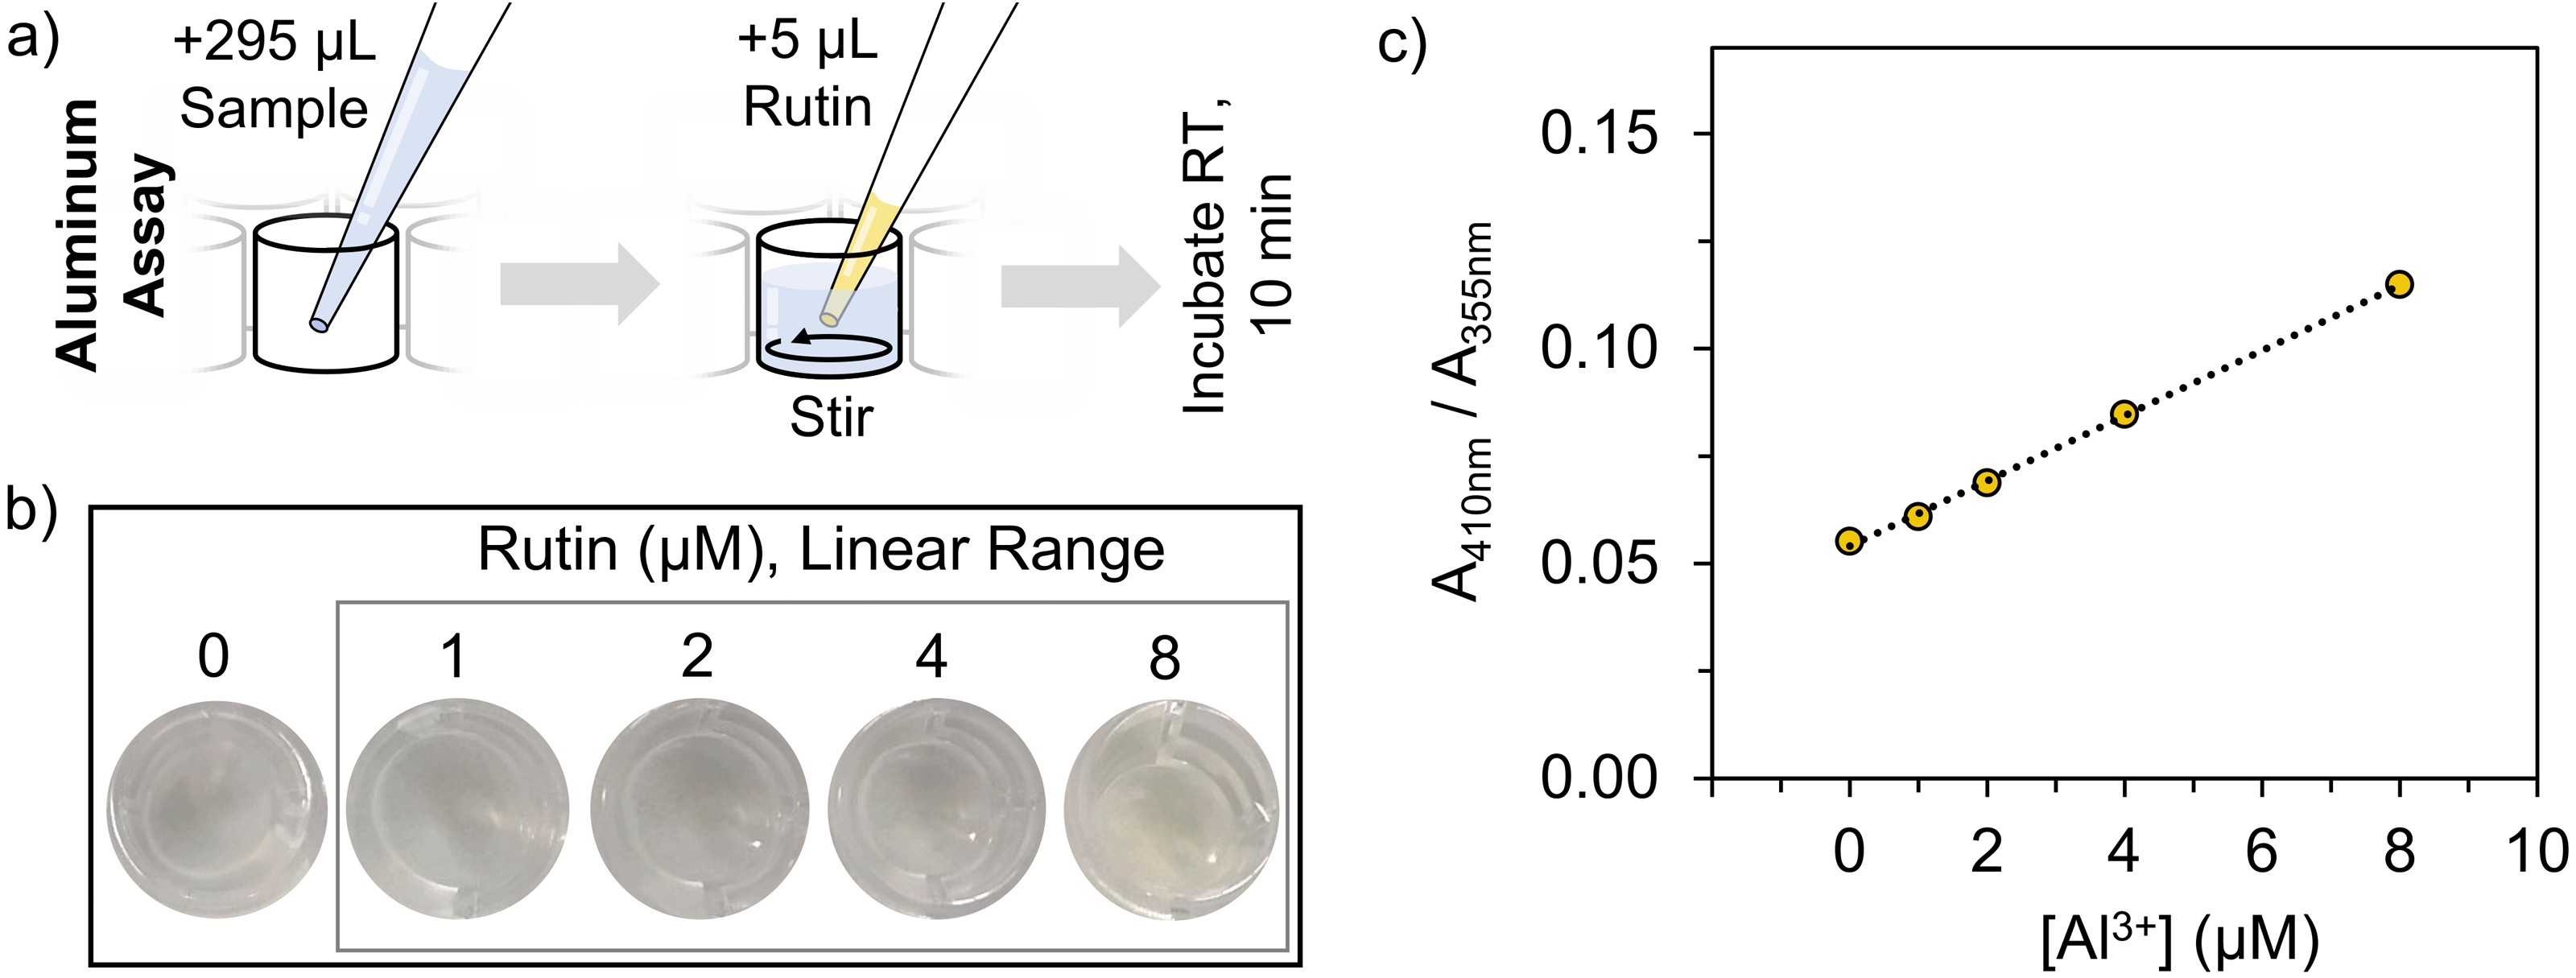
Transitioning from dilute to highly concentrated rutin solutions necessitated reevaluation of the assay solvents. Many colorimetric procedures for flavonoids suggest dissolving rutin in water, methanol, ethanol, or a combination thereof (Pekal & Pyrzynska, 2014), which is suitable for preparing dilute solutions. However, rutin has excellent solubility in DMSO (∼50 mM), (Hespeler et al., 2019) which makes it ideal for preparing more concentrated rutin solutions to quantify Al3+ions.
Assay performance
Analyzing the performance of an assay is essential to ascertain if it is appropriate for specific applications. Here, we assessed assay performance based on the quantitative response to Al3+ ions. The intent was to identify the optimal rutin concentration for analysis using parameters such as the linearity, sensitivity, LoD, and LoQ responses. To establish a target concentration range, a series of rutin samples were analyzed by absorption spectroscopy. The peak absorbance values of unchelated rutin at 355 nm (Fig. 3A) was of specific interest since it is one of the measures to quantify aluminum. We found that rutin concentration and the absorbance response at 355 nm were proportional (i.e., increasing rutin concentration resulted in an increase in absorbance) until the spectrophotometer detector was saturated (∼6 mM of rutin) (Fig. 3B). Thus, we identified a rutin concentration range of 23.4–375 µM that produced absorbances between 0.1–1.0 for further analysis with aluminum.
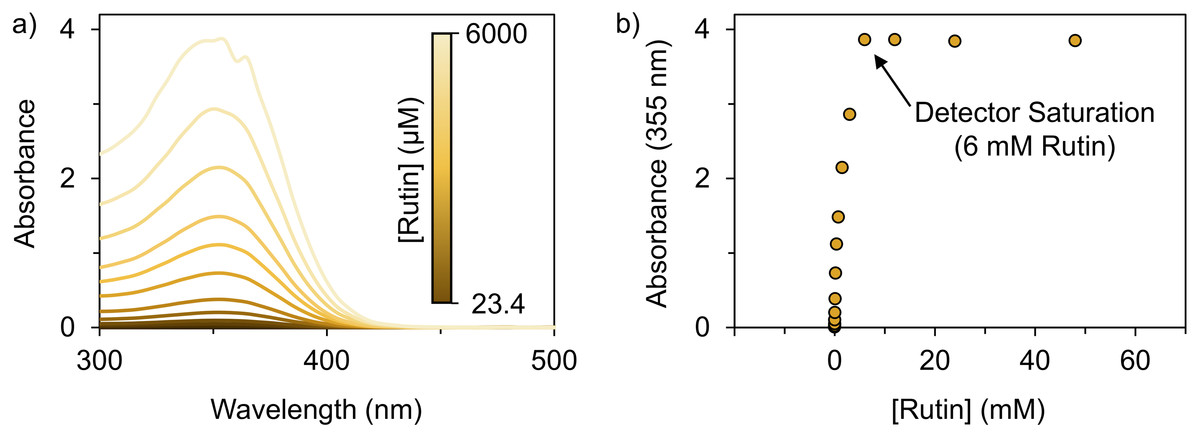
Figure 3: Optimizing the rutin concentration for aluminum quantification.
The absorbance spectra of rutin in DMSO as a function of concentration. (A) Absorbance spectra of rutin ranging in concentration from 23.4–6,000 µM. (B) The absorbance of rutin at 355 nm as a function of rutin concentration (23.4 µM–48.0 mM), which shows the rutin concentration (23.4–375 µM) where the absorbance at 355 nm falls within the 0.1–1.0 range and the rutin concentration (6 mM) that results in the saturation of the detector (i.e., the maximum absorbance that can be detected). Note that the values in panel (B) are the average of n = 3 measurements whereas the error bars, which are small and within the boundaries of the marker, are the standard deviation of n = 3 measurements.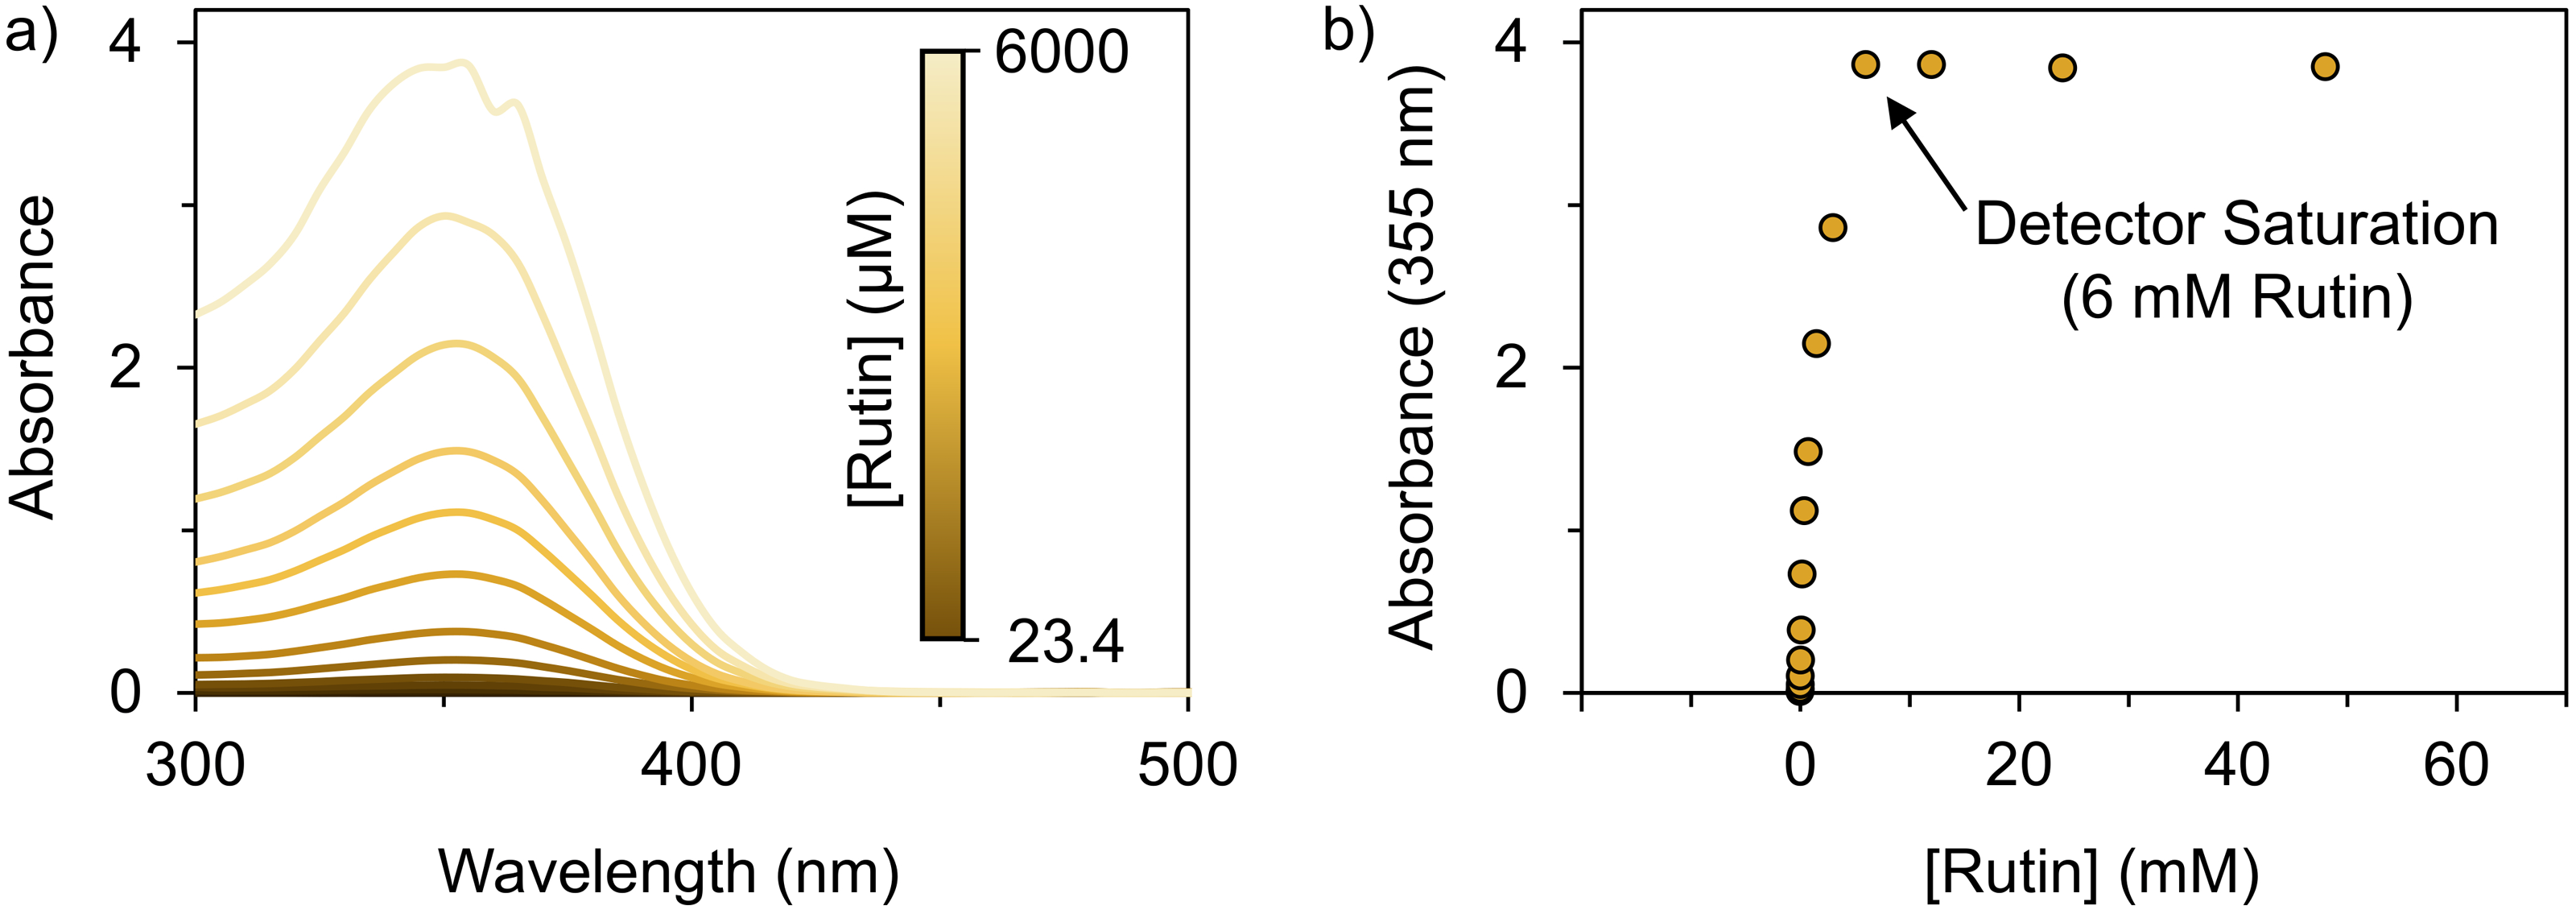
Assay optimization with respect to rutin concentration was performed using four rutin concentrations with the procedure outlined in Fig. 2A. The rutin concentrations were within the target range of 23.4–375 µM (Fig. 3B). Specifically, assay performance was assessed using 2.25, 4.5, 9, and 18 mM rutin, which computes to final assay concentrations of 37.5, 75, 150, and 300 uM, respectively (Eq. (1)). The assay response of each rutin concentration was tested using a series of 22 Al3+ concentrations with two-fold dilutions, ranging from 7.6 ×10⁻³ µM to 16 mM.
All four rutin concentrations generated a similar response: as aluminum concentration increased, the A410nm/A355nm ratio increased proportionally until rutin saturation at ∼16 mM of aluminum (Fig. S1). The linear range of Al3+ detection (1–8 µM) (Figs. 2B, 2C) and the linearity (≥0.9974) was consistent across all rutin concentrations (Fig. S1, Table S1). However, the 9 mM rutin concentration produced the best response with respect to the sensitivity, LoD , and LoQ for Al3+ quantification. Compared to 9 mM rutin, the 2.25, 4.5, and 18 mM rutin concentrations were up to 2.9-fold less sensitive to Al3+ and had up to 3.1-fold higher LoD and LoQ. The decreased assay performance of 2.25, 4.5, and 18 mM rutin concentrations stems from the absorbance values at 355 nm and 410 nm, which introduce more variability in absorbance measurements. At a rutin concentration of 2.25 mM and 4.5 mM, the absorbance at 410 nm is <0.1, whereas the 18 mM rutin concentration has a high absorbance value at 355 nm that approaches the saturation of the detector (∼4).
Our assay performs comparably and, in some instances, better than advanced techniques (i.e., AAS and ICP-MS) and complex, flavonoid-based colorimetric methods from the literature (Table 3). The linear concentration range of the assay described herein is narrower when compared to other methods. However, the assay is characterized by a very sensitive response to aluminum (7.6 nM) and low LoD (79.8 nM) and LoQ (266 nM) when compared to other colorimetric methods, and only rivaled by extremely sensitive, advanced techniques such as graphite furnace AAS and ICP-MS.
| Method | Flavonoid used | Linear range (µM) | Sensitivity (nM) | LoD (nM) | LoQ (nM) | References |
|---|---|---|---|---|---|---|
| Our Work: Colorimetric | 9 mM Rutin | 1–8 | 7.6 | 79.8 | 266 | N/A |
| Flame AAS | N/A | 185–3,706 | – | 1,668 | 5,560* | 12020:1997 (1997); 45 () |
| Graphite Furnace AAS | N/A | 0.4–4 | – | 4 | 12* | 12020:1997 (1997); 45 () |
| ICP-MS | N/A | 0.074–3.7 | – | 0.0004 | 0.001 | Si-Qi et al. (1969); 45 () |
| Colorimetric in Micellular Media | Morin | 2–37 | – | 111 | – | Al-Kindy, Suliman & Salama (2003) |
| Colorimetric in Ionic Liquids | Morin | 2–267 | – | 1,334 | 4,448* | Oter & Aydogdu (2011); Al-Kindy, Suliman & Salama (2003) |
| Colorimetric with Surfactants | Morin | 0–1 | 35 | 7.4 | – | Medina Escriche, Cirugeda & Hernandez Hernandez (1983) |
| Colorimetric in Acidic | Morin | 0.4–185 | – | 222 | 740* | Ahmed & Hossan (1995) |
| Colorimetric Corrosive Reagents | Luteolin | 0.7–40 | – | 500 | 1,667* | Sun et al. (2014); Medina Escriche, Cirugeda & Hernandez Hernandez (1983); Ahmed & Hossan (1995) |
| Colorimetric Carbon Dot-System | Morin | 8–20 | – | 113 | 377 | Kong et al. (2017); Oter & Aydogdu (2011); Sun et al. (2014); Medina Escriche, Cirugeda & Hernandez Hernandez (1983) |
| Colorimetric Carbon Dot-System | Quercetin | 0–35 | 90 | 90 | 300* | Wang et al. (2020); Oter & Aydogdu (2011) |
| Colorimetric Carbon Nanodot-System | Quercetin | 1–20; 20–60 | 5.2 | 558 | – | Zou et al. (2014); Kong et al. (2017) |
| Colorimetric Carbon Dot-System | Rutin | 0.8–20 | 19.3 | 320 | 1,090 | Li et al. (2018); Wang et al. (2020); Kong et al. (2017) |
| Colorimetric Carbon Dot-System | Rutin | 2–4,818 | 434* | 741 | 2,471* | Li et al. (2019); Zou et al. (2014); Li et al. (2018); Wang et al. (2020) |
Assay performance was also evaluated based on the accuracy and precision of the assay to quantify Al3+ (Table 4), as well as the assay selectivity for Al3+ ions over other cations (Fig. 4, Figs. S2, and S3). To this end, the aluminum colorimetric assay returned accurate recovery of Al3+ ions (99 ≤ 108%) in a precise manner (4 ≤ 6% SD). Assay precision is also demonstrated by the low intra-assay and inter-assay coefficients of variation (CV), which describe measurement precision between samples on the same plate and precision across different plates, respectively.
| Added Al3+(µM) | Measured Al3+(µM) | Recovered Al3+(%) | Intra-assay CV (%) | Inter-assay CV (%) |
|---|---|---|---|---|
| 4.0 | 4.3 ± 0.3 | 108 ± 6 | 5.9 | 4.4 |
| 4.0 | 4.1 ± 0.1 | 104 ± 3 | 3.1 | |
| 4.0 | 4.0 ± 0.2 | 99 ± 4 | 4.3 |
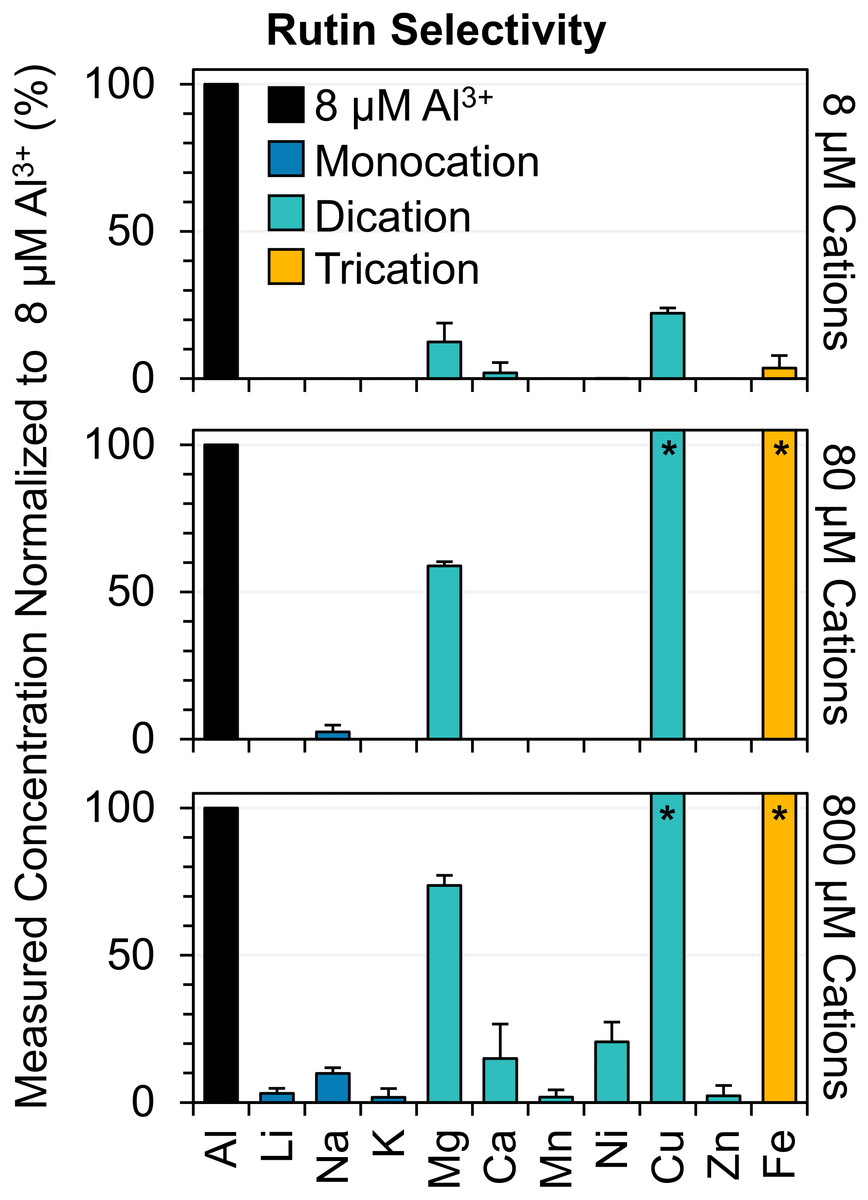
Figure 4: Selectivity of rutin to a series of mono-, di-, and tri-cations.
Demonstrates the assay response in percent of mono- (dark blue), di- (light blue), and tri-cations (orange) with increasing concentration with respect to the response of the highest detectable aluminum concentration (8 µM). The A410nm/A355nm ratios of the cations were measured and converted to a concentration via an aluminum calibration curve and then normalized to the maximum concentration of aluminum (8 µM) within the linear range of the assay. Note that the A410nm/A355nm signal of the cations may be due to either rutin complexation or chromaticity resulting from the cation solutions. The asterisks (*) for copper and iron cations denote that the measured concentration exceeded the linear range of the assay (i.e., measured concentrations are higher than 8 µM of Al3+). The bars represent the average of n = 3 measurements and the error bars are the standard deviation of n = 3 measurements.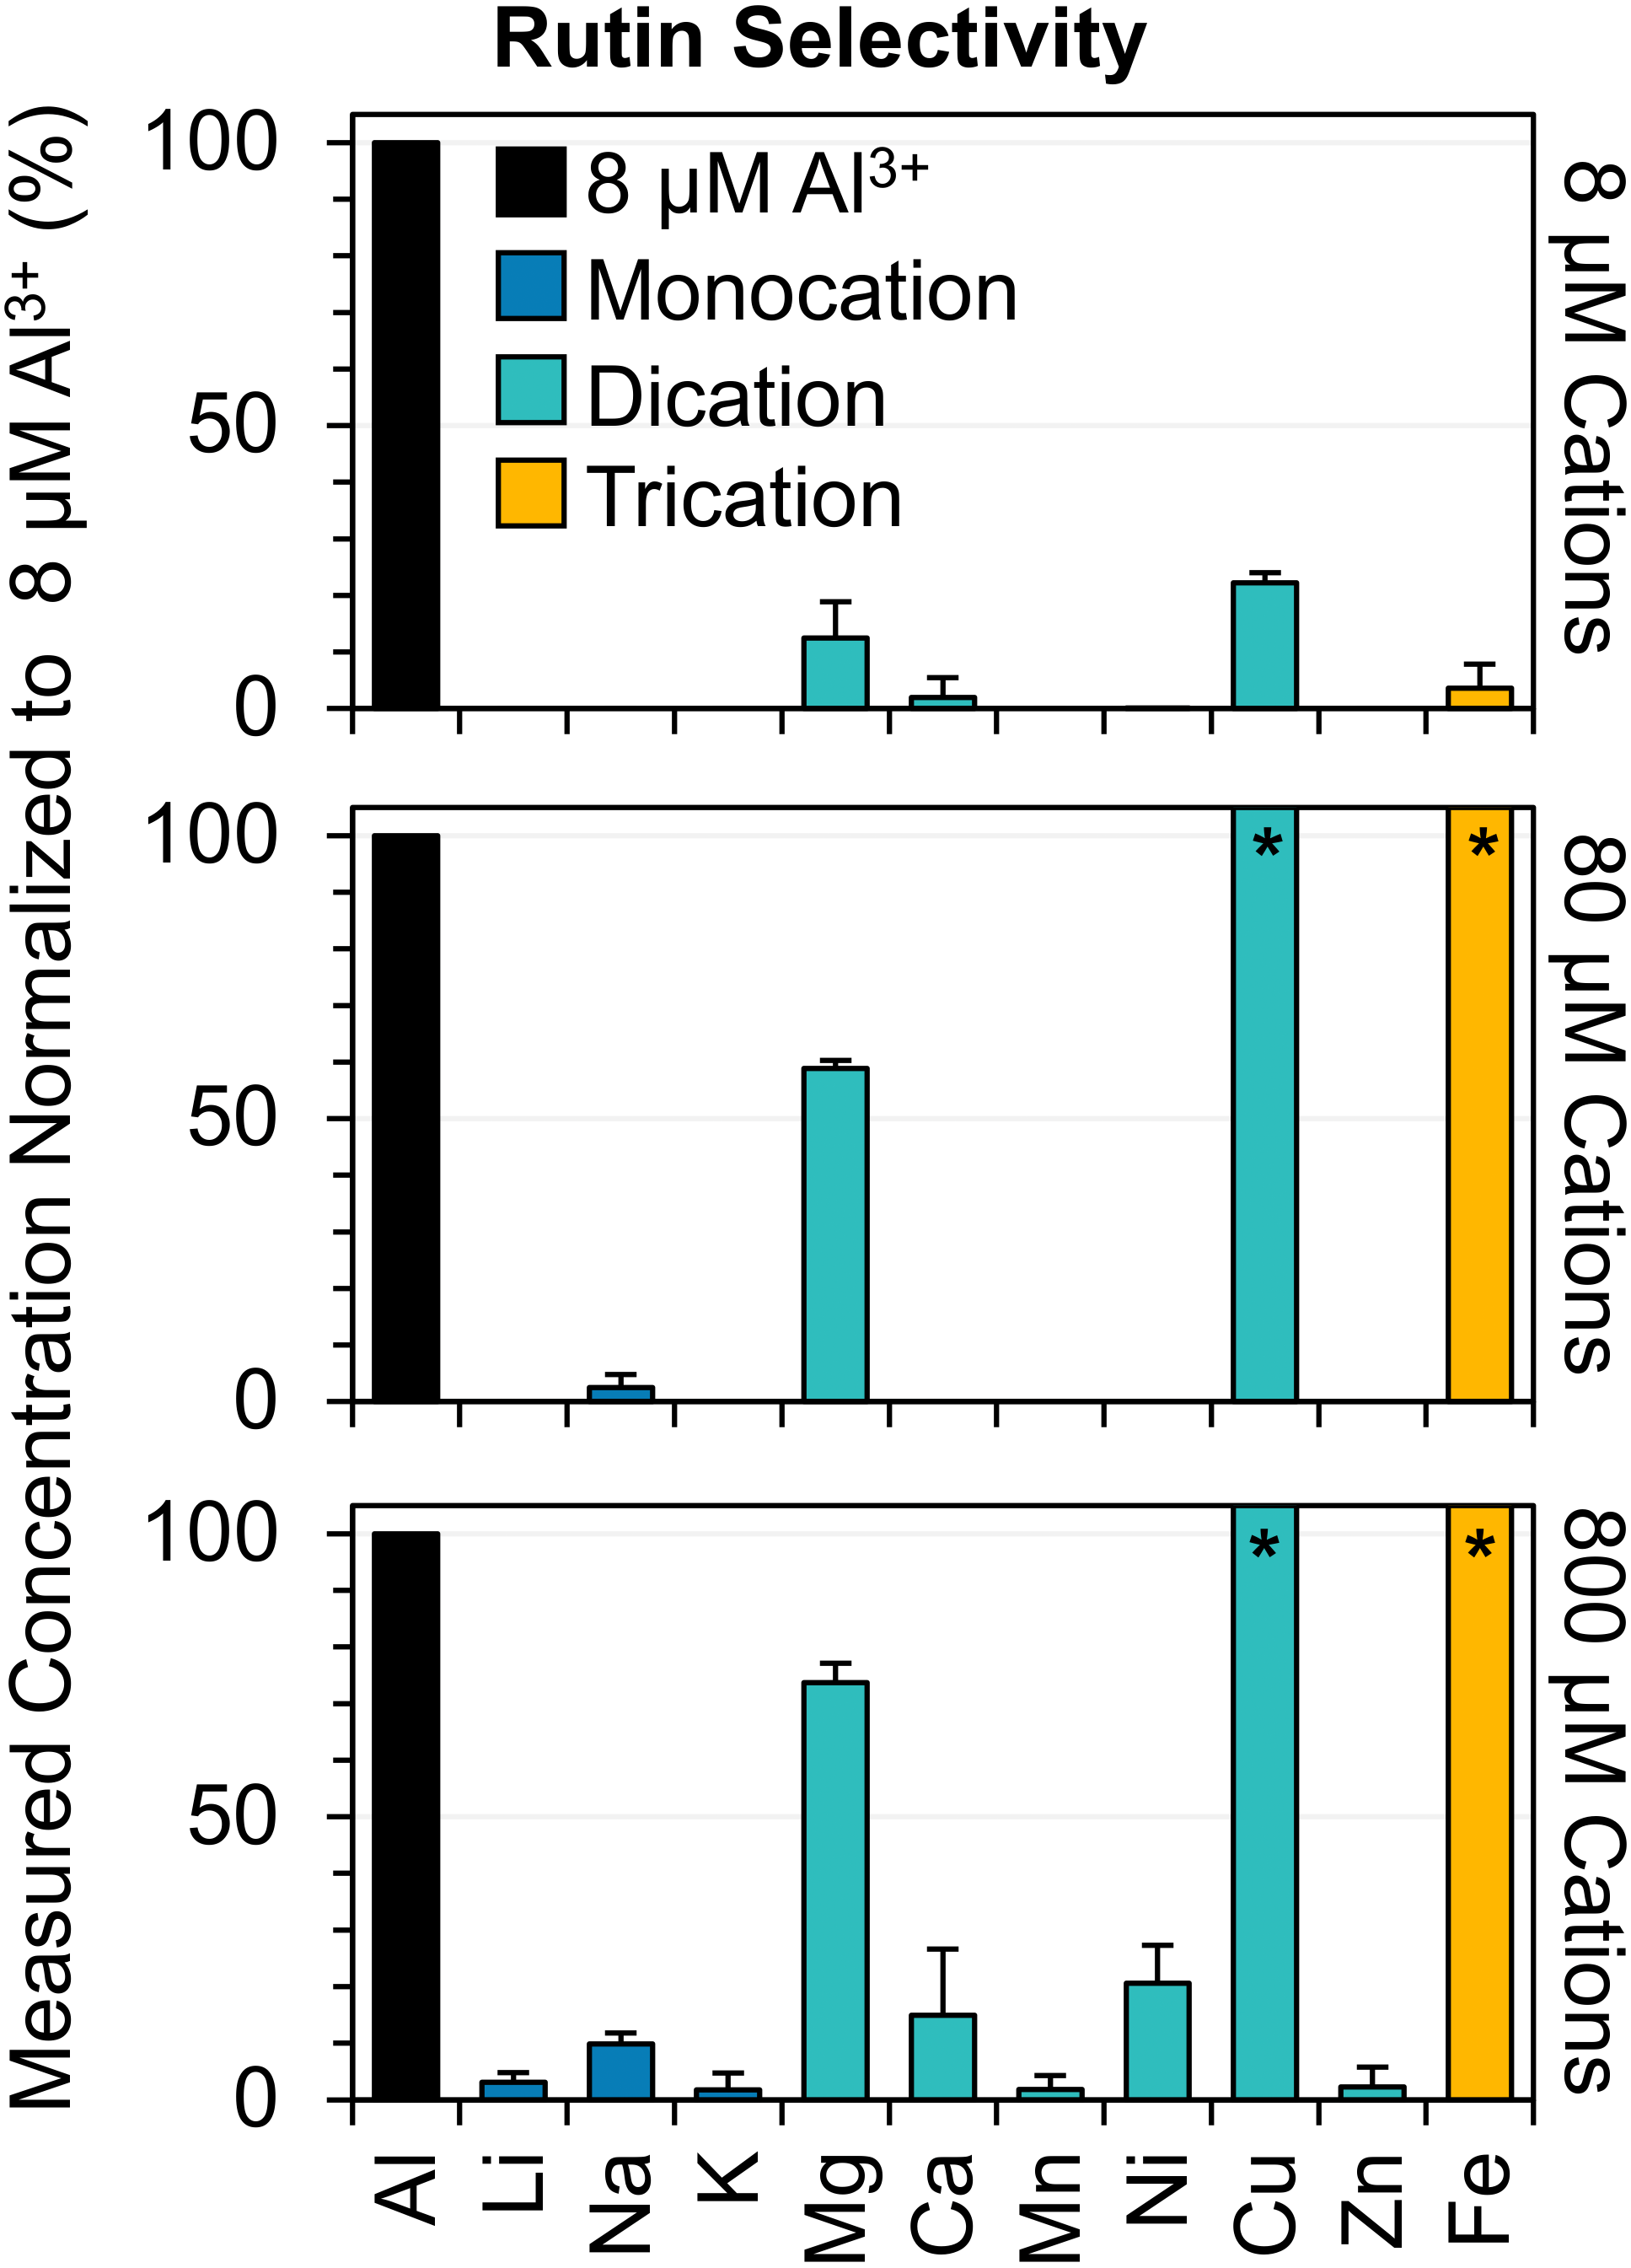
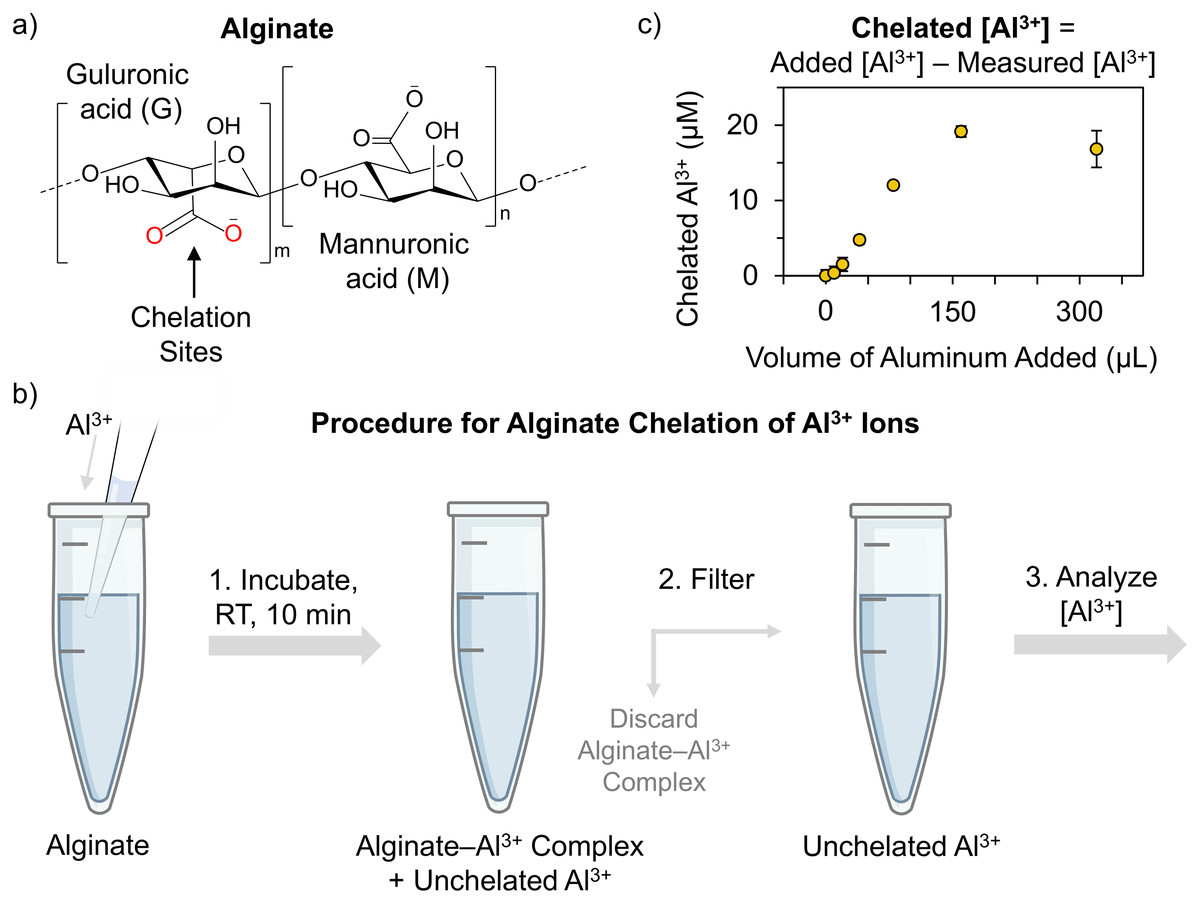
Figure 5: Measuring sodium alginate chelation of aluminum via the rutin-based colorimetric assay.
Representation of the alginate chelation response to Al3+ ions. (A) Chemical structure of the sodium alginate polymer consisting of (1,4)-linked β-D-mannuronate (M) and α-L-guluronate (G) residues. The G residues participate in chelation, where the carboxylic acid moiety (highlighted in red) is the site of chelation. (B) Representation of the experimental design of the alginate–Al3+ chelation process. (C) Chelation curve of the alginate complexation of Al3+ ions that was measured using the aluminum colorimetric assay. Note that the values in (C) are the average of n = 3 measurements and the error bars are the standard deviation of n = 3 measurements. Error bars are included for all the values in (C), but in cases where the standard deviation for the measurements is low, the error bars are not visible.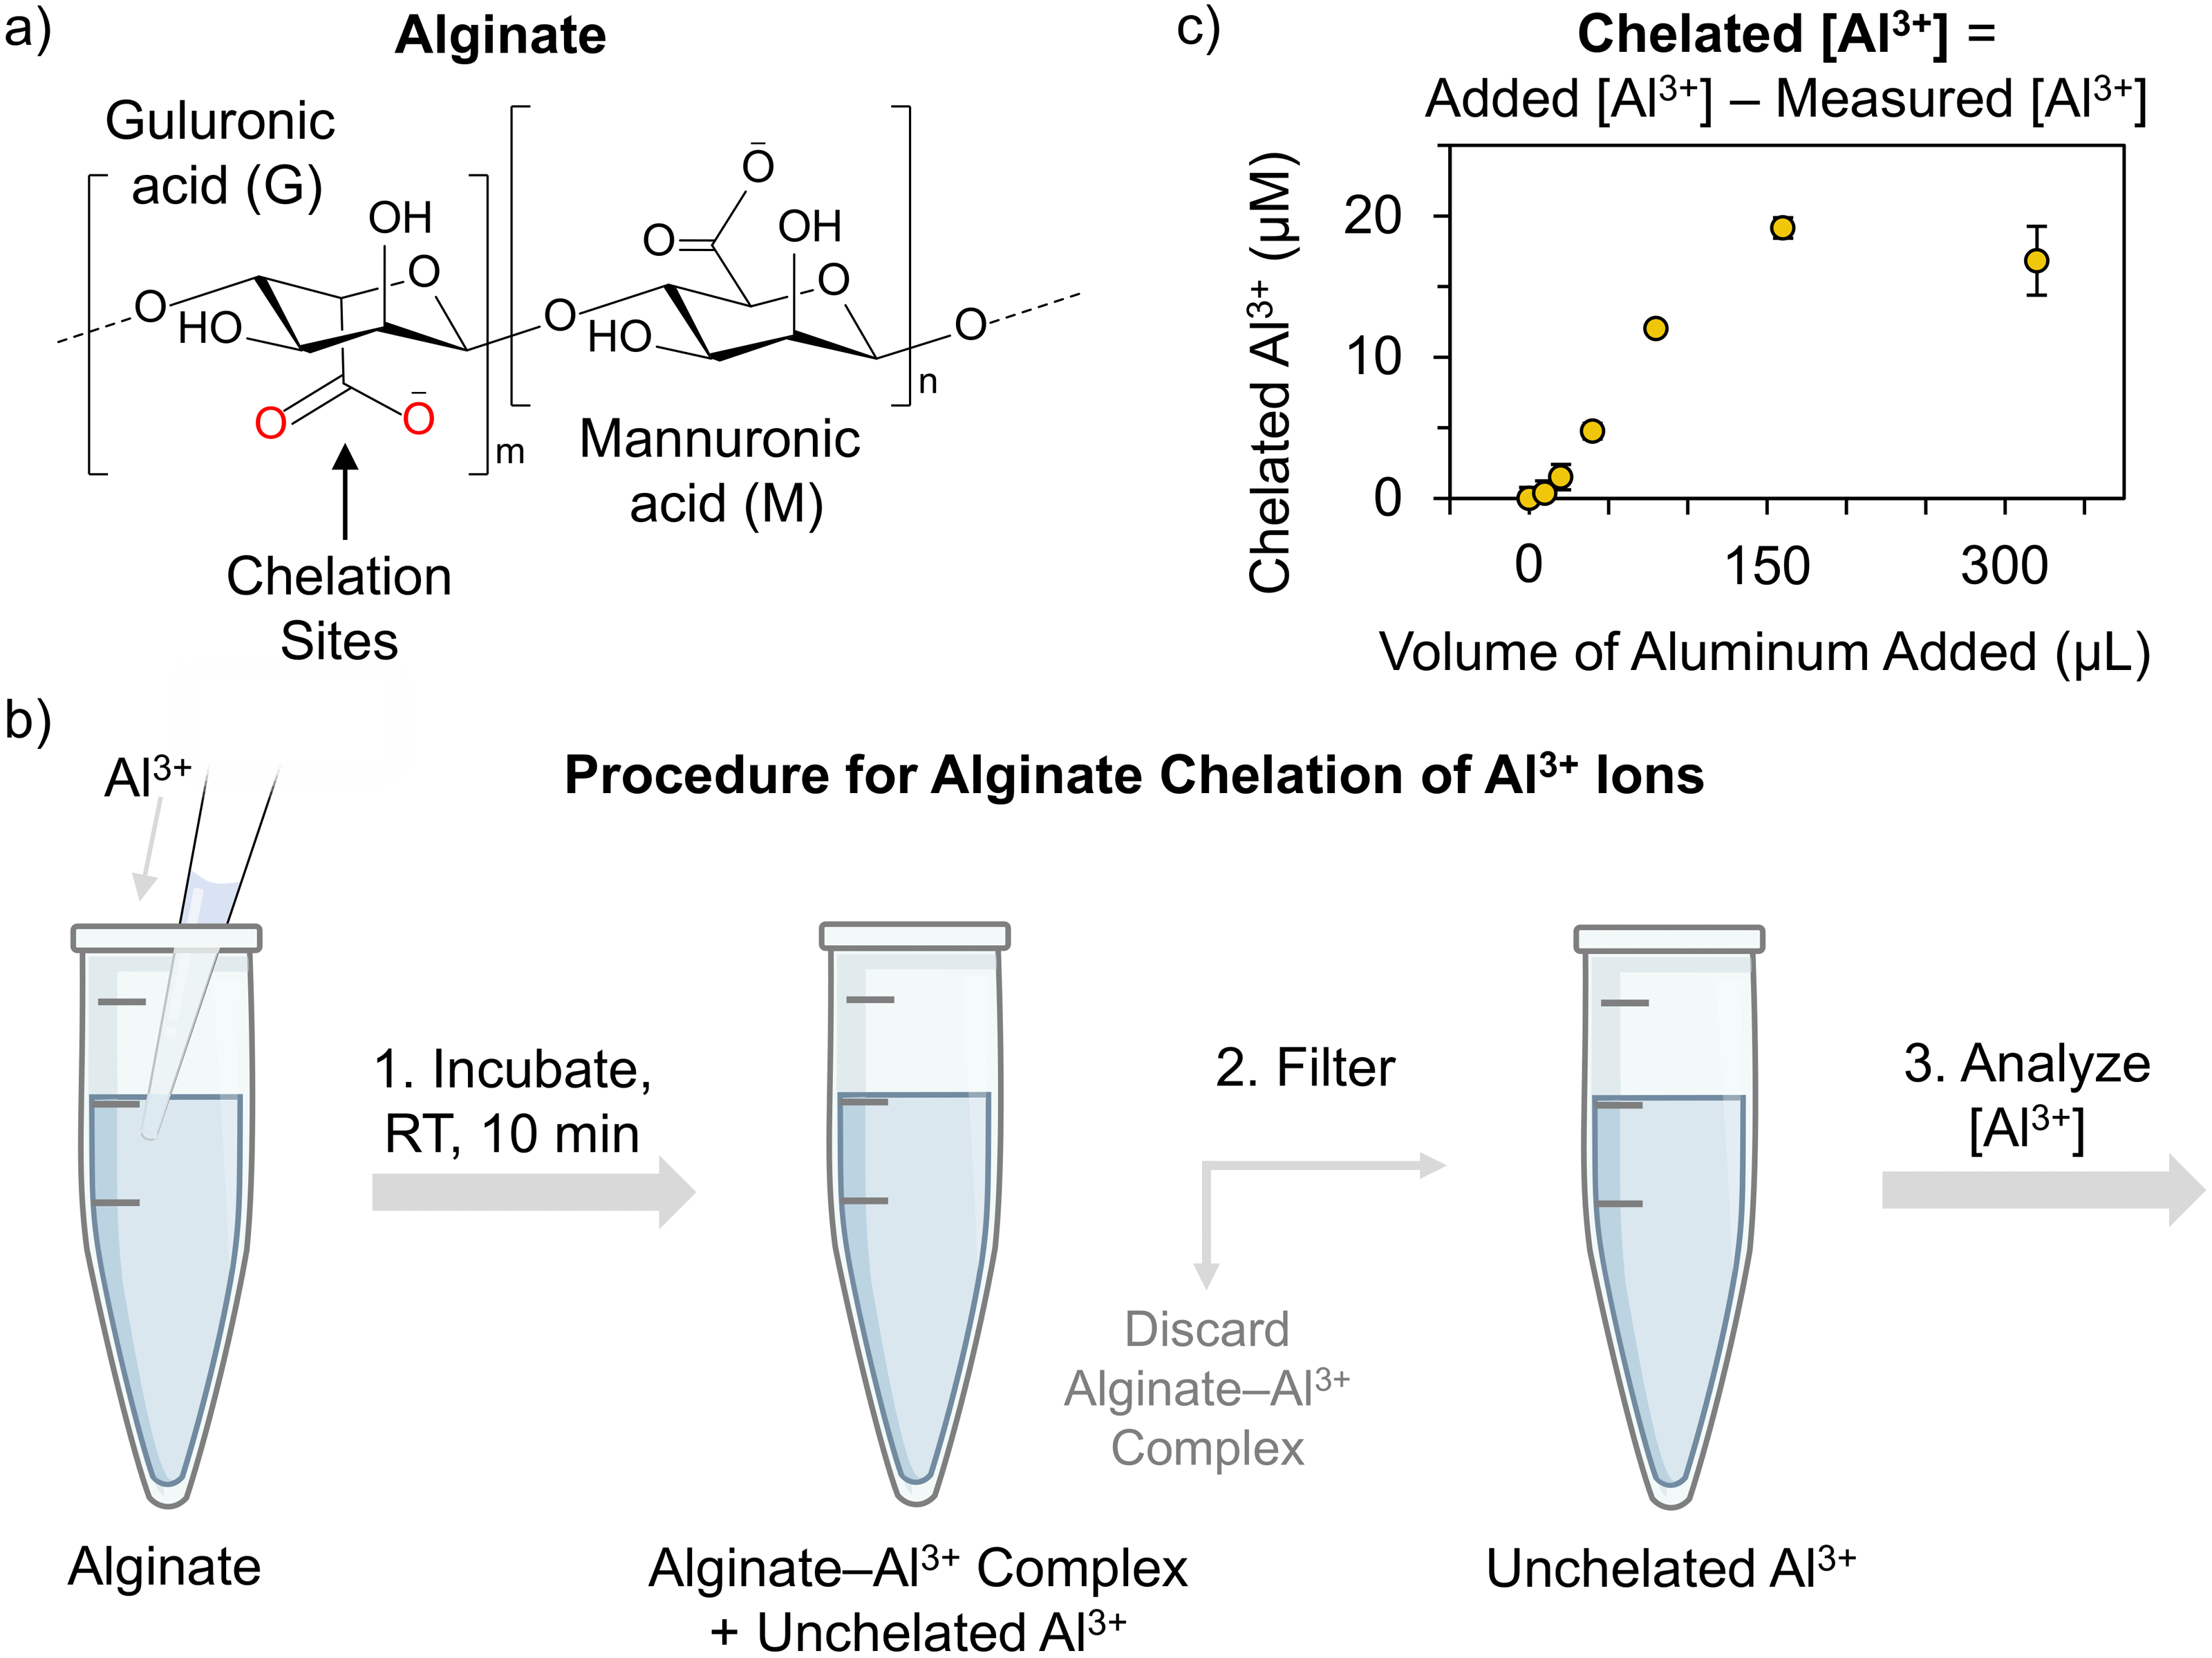
A series of mono- (M+), di- (M2+), and tri-cations (M3+) were analyzed to ascertain the selectivity of the assay for Al3+ ions. Specifically, an Al3+ calibration curve was used to convert the A410nm/A355nm absorbance ratios of the cations at 3 different concentrations (8, 80, and 800 µM) to an equivalent concentration of Al3+. Then, the cation concentrations were normalized to the highest aluminum concentration within the linear range of the assay (i.e., 8 µM Al3+) and expressed as a percent (Eq. 6). The value of the percent was indicative of whether the cations either produced or did not produce a colorimetric response similar to that of an 8 µM Al3+ sample. For example, a response of 0% indicates that the cation did not produce a colorimetric response to the assay (i.e., no concentration was detected), indicating the rutin assay was selective for Al3+ ions. On the other hand, a response ≥ 100% shows a cation has produced a colorimetric response and thus, a concentration greater than an 8 µM Al3+ sample, suggesting the rutin assay is not selective for Al3+ ions.
We found that even at high concentrations of mono- and di-cations (100-fold molar excess to 8 µM Al3+), with the exception of Cu2+, these cations did not produce more than a 21% response (Fig. 4). This suggests that for most cations, the rutin assay is selective for Al3+ ions. However, the presence of Cu2+ and Fe3+ in 10- to 100-fold molar excesses produces ≥ 100% response, suggesting these cations, if present in high concentrations, could interfere with the accurate quantification of Al3+ ions (Fig. 4, Figs. S2, and S3). Nevertheless, advances in selective precipitation could be utilized, if necessary, to decrease the concentration of these interferences for optimal assay performance.
Assay application to complex sample analysis
The utility of the colorimetric aluminum assay was exemplified by the capacity to analyze complex samples. Here, we evaluated the extent of a polymer (sodium alginate) to chelate Al3+ ions. Sodium alginate is a bioderived polymer sourced from brown seaweed that has demonstrated excellent utility as a bioink for 3D bioprinting. When hydrated, sodium alginate forms a viscous gum due to high molecular weight polymer chains. Upon exposure to specific cations, sodium alginate transforms from a viscous gum to robust gels due to chelation, a property that is exploited to 3D print specific shapes. Numerous cations can form chelation complexes that result in robust gels, Arnold et al. (2021), including Al3+ ions (Fig. S4).
The chemical structure of the polymer backbone makes sodium alginate (Fig. 5A) well suited for metal chelation. Specifically, sodium alginate consists of (1,4)-linked β-D-mannuronate (M) and α-L-guluronate (G) blocks, where the carboxylic acid moiety on the G residues is responsible for metal chelation (Fig. 5A) (Arnold et al., 2021; Lee & Mooney, 2012).
Using the approach outlined in Fig. 5B, sodium alginate chelation was evaluated by incubating dilute solutions of alginate (i.e., 0.001% (w/v)) with increasing concentrations of aluminum. Dilute alginate solutions were optimal for this experiment because it facilitated filtration to remove excess alginate and/or alginate–Al3+ complexes that could interfere with the aluminum colorimetric assay. The success of the filtration method utilized herein to remove alginate from samples pre-assay is demonstrated in Fig. S5.
Following sample filtration, the concentrations of excess Al3+ ions (i.e., unchelated) were colorimetrically quantified, permitting the computation of the Al3+ concentration that was chelated by alginate polymers (Fig. 5B, Eq. (7)). The concentration of chelated Al3+ ions was used to construct a chelation curve. A chelation curve is a plot of the volume of metal added versus the measured response proportional to chelation (or vice versa). Here, the curve visually represents the alginate complexation process with Al3+ ions until saturation is reached (i.e., all available chelation sites on the G residues of alginate have been occupied) (Fig. 3C).
The alginate chelation curve (Fig. 5C) provides valuable, quantitative information on the chelation process. For example, chelation saturation occurs after the addition of 119 µL of the 819 µM aluminum solution. Using the saturation information and Eq. (8), the mole-to-mole ratio of alginate to Al3+ ions was calculated, which corresponds to 2: 1; This suggests that 2 carboxylic acid groups on alginate polymers participate in the chelation of 1 Al3+ ion, where intra- or inter-chelation between polymer chains could be occurring. Furthermore, the thermodynamic stability of the alginate–Al3+ chelation complex (β, logβ, and ΔG) were quantified (Eqs. (9)–(13)), which corresponds to 3.42 × 10¹¹ M−2, 11.5, and −64.7 kJ mol−1, respectively. The large value of β and small value of logβ indicate that alginate forms a stable chelation complex with Al3+ ions, while the negative ΔG value demonstrate the chelation process occurs spontaneously.
Conclusions
Here, we developed a simple, cost effective assay for aluminum quantification by exploiting the signature-colored chelation complex of a flavonoid, specifically rutin, with Al3+ ions. We demonstrated that the colorimetric assay was sufficiently optimized to detect aluminum concentrations in samples in the low µM range, with assay performance comparable to other methods such as advanced instrumentation (e.g., AAS and ICP-MS) and previously reported colorimetric methods that employ complex components. We detailed the colorimetric aluminum assay was accurate, precise, and selective to Al3+ ions up to 10- to 100-fold molar excesses of mono-, di-, and tri-cations. Lastly, our assay was compatible with complex sample analysis. Specifically, the aluminum chelation capacity of a polymer (sodium alginate) was quantified. We found that sodium alginate forms spontaneous, stable complexes with Al3+ ions, demonstrating the utility of the polymer to form stable 3D structures upon chelation for 3D bioprinting. Thus, we conclude that our colorimetric assay can be used to quantify aluminum in simple and complex samples.