
Transcriptome analysis reveals a reprogramming energy metabolism-related signature to improve prognosis in colon cancer
- Published
- Accepted
- Received
- Academic Editor
- Michael Hallett
- Subject Areas
- Bioinformatics, Computational Biology, Molecular Biology, Oncology, Computational Science
- Keywords
- Colon cancer, Overall survival, Reprogramming energy metabolism, Signature, Metabolism
- Copyright
- © 2020 Zhang et al.
- Licence
- This is an open access article distributed under the terms of the Creative Commons Attribution License, which permits unrestricted use, distribution, reproduction and adaptation in any medium and for any purpose provided that it is properly attributed. For attribution, the original author(s), title, publication source (PeerJ) and either DOI or URL of the article must be cited.
- Cite this article
- 2020. Transcriptome analysis reveals a reprogramming energy metabolism-related signature to improve prognosis in colon cancer. PeerJ 8:e9458 https://doi.org/10.7717/peerj.9458
Abstract
Although much progress has been made to improve treatment, colon cancer remains a leading cause of cancer death worldwide. Metabolic reprogramming is a significant ability of cancer cells to ensure the necessary energy supply in uncontrolled proliferation. Since reprogramming energy metabolism has emerged as a new hallmark of cancer cells, accumulating evidences have suggested that metabolism-related genes may serve as key regulators of tumorigenesis and potential biomarkers. In this study, we analyzed a set of reprogramming energy metabolism-related genes by transcriptome analysis in colon cancer and revealed a five-gene signature that could significantly predict the overall survival. The reprogramming energy metabolism-related signature could distinguish patients into high-risk and low-risk groups with significantly different survival times (P = 0.0011; HR = 1.92; 95% CI [1.29–2.87]). Its prognostic value was confirmed in another two independent colon cancer cohorts (P = 5.2e–04; HR = 2.09, 95%; CI [1.37–3.2] for GSE17538 and P = 3.8e−04; HR = 2.08, 95% CI [1.37–3.16] for GSE41258). By multivariable analysis, we found that the signature was independent of clinicopathological features. Its power in promoting risk stratification of the current clinical stage was then evaluated by stratified analysis. Moreover, the signature could improve the power of the TNM stage for the prediction of overall survival and could be used in patients who received adjuvant chemotherapy. Overall, our results demonstrated the important role of the reprogramming energy metabolism-related signature in promoting stratification of high-risk patients, which could be diagnostic of adjuvant therapy benefit.
Introduction
Colon cancer is the third most common cause of cancer-related death in the United States and one of the most prevalent diseases worldwide (Bray et al., 2018; Siegel, Miller & Jemal, 2019). In the past decades, many studies devoted to understanding the tumorigenesis of colon cancer to descend its mortality. Unfortunately, the prognosis of colon cancer remains pessimistic for many patients. In clinical trials, pathological staging is the primary prognostic classification to select patients for adjuvant chemotherapy. The tumor–node–metastasis (TNM) staging system has been confirmed as a conventional classification system (Pineros et al., 2019). Depending on the TNM stage at the time of diagnosis, a proper possibility of curative surgical intervention and clinical survival time can be predicted (Boland & Goel, 2016; Vychytilova-Faltejskova et al., 2016). However, the TNM staging fails to predict recurrence accurately in many patients undergoing curative surgery and the prediction is feasible mainly for patients limited to the primary tumor and regional lymph nodes. For the patients with the same stage and receive similar treatment, they may have distinct clinical outcomes (Das, Kalita & Pal, 2017).
Metabolic reprogramming confers cancer cells with the ability to alter cellular metabolism to support the increased energy request due to continuous growth, rapid proliferation, and other characteristics (Cazzaniga & Bonanni, 2015). It is therefore not surprising that altered cellular metabolism in cancer cells is critical to meet the anabolic demands of cancer cells (Claudino et al., 2012; Hanahan & Weinberg, 2011). Importantly, reprogramming energy metabolism has emerged as a hallmark of cancer and is required for malignant cell development, including invasion and metastasis (Hanahan & Weinberg, 2011). Current efforts have proved that metabolic reprogramming has been pointed out as a promising target for anti-cancer therapy (Granja et al., 2015). Exploration of energy metabolism heterogeneity has been proved to be beneficial to discover the useful biomarkers for cancers (Li, Zhan & Zhan, 2018). Many studies have implicated cancer metabolism as a major contributor to tumor initiation, growth and metastatic dissemination in colorectal cancer (La Vecchia & Sebastian, 2020). The alteration of specific metabolic pathways, including nucleotide metabolism, amino acid metabolism and carbohydrate metabolism, could influence the carcinogenesis in colorectal cancer (Manna et al., 2014; Xie et al., 2015). Some of the driver genes of colorectal cancer also play critical roles in controlling metabolic reprogramming, such as KRAS and p53 (Kawada, Toda & Sakai, 2017; Labuschagne, Zani & Vousden, 2018). Although the interest in the metabolic reprogramming of cancer cells is arising in the past few years, few studies focus on the expression and clinical significance of the metabolism-related genes in colon cancer. Therefore, it would be valuable to explore a reprogramming energy metabolism-related signature for prognosis and risk stratification for improving the management of colon cancer patients.
Here, based on multiple independent cohorts of colon cancer, we evaluated the expression and prognostic value of metabolism-related genes and analyzed a reprogramming energy metabolism-related signature that would be able to predict the overall survival of patients. The results indicated that the signature could serve as an independent prognostic factor and promote the risk stratification according to TNM stages for the prediction of overall survival.
Materials and Methods
Colon cancer datasets preparation
Three independent and publicly available gene expression microarray datasets (GSE39582 (Marisa et al., 2013), GSE17538 (Freeman et al., 2012; Smith et al., 2010; Williams et al., 2015a), and GSE41258 (Martin et al., 2018; Sheffer et al., 2009)), which also contained patient outcome and clinicopathological features, were retrieved from the Gene Expression Omnibus (GEO). In total, 879 colon cancer patients were included. For the dataset GSE39582, we excluded 86 samples which received treatment but not without corresponding drug information or did not contain the exact treatment information. The 316 patients who didn’t receive adjuvant chemotherapy and the 19 normal subjects from GSE39582 were treated as training set, and the other two datasets (GSE17538 and GSE41258) were served as independent validation cohorts. In the training cohort, 3 tumor samples that had no available clinical survival information and the 19 normal samples were excluded in survival analysis. For the two validation cohorts, we used the similar strategies to select samples. Besides, 164 colon cancer patients who received fluorouracil-based ACT in GSE39582 were further used for stratification analysis.
Identification of reprogramming energy metabolism-related genes associated with prognosis in colon cancer
Differential expression analyses to detect transcriptome differences between tumor and normal samples were performed by the “limma” R package (3.42.2) in GSE39582. We assigned the false discovery rate (FDR) as 0.1% and fold change (FC) threshold as 2 to screen differentially expressed genes (DEGs). Among DEGs, we focused on genes involved in reprogramming energy metabolism as well as genes related to malignant tissue development. The reprogramming energy metabolism-related genes were identified by hallmark-associated GO terms in our previous research (Deng et al., 2018). Then, we performed the univariable Cox regression analysis to select genes associated with overall survival in the training cohort. Finally, a risk score model was established: Risk score = (0.4911 × expression level of AARS) + (0.2992 × expression level of COL4A2) + (0.2865 × expression level of COL4A1) + (−0.3543 × expression level of PCNA) + (−0.2377 × expression level of MMP12). The formula was a linear combination of the five genes weighted by its corresponding regression coefficient in the univariable Cox regression analysis. Based on this model, each sample could be assigned an assessment score and then assigned to the high-risk or low-risk group according to the median score in the corresponding cohort.
Statistical analysis
The Kaplan–Meier method was used to assess the survival time in each cohort (Dudley, Wickham & Coombs, 2016). The difference of overall survival between the high-risk group and the low-risk group in each cohort was evaluated by the log-rank test. We applied the univariate Cox regression model to assess the prognostic value of the signature and performed the multivariate Cox regression models to estimate whether it was an independent predictor of overall survival in colon cancer (Zhang et al., 2016b). The Cox proportional hazards regression model was used to calculated hazard ratio (HR) and 95% confidence intervals (CI). The statistically significant result was defined as the two-tailed P-value being less than 0.05. We further performed ROC analysis to assess the sensitivity and specificity of the signature in overall survival prediction. The prediction models of the five-gene risk score and the TNM stage were also assessed, respectively. And then, the two variables were regarded as predictors and combined in a logistic regression model. The pROC package was used to plot ROC curves of the predictions (Robin et al., 2011), and the areas under the curve (AUC) of these models were computed to compare their abilities. All the statistical analyses were conducted under the R program 3.5.2 (http://www.r-project.org).
Result
Transcriptome analysis reveals a prognostic signature related to reprogramming energy metabolism
Transcriptional profiles of colon cancer patients and corresponding clinical information were obtained from Marisa et al. (2013) After removing patients who received fluorouracil-based ACT or without available clinical survival information, a total of 316 tumor samples and 19 normal samples were recruited in the training cohort (Table 1). Based on the transcriptional profile, we identified 1,489 differentially expressed genes in colon cancer patients (FDR < 0.001 and FC > 2 by “limma” method), including 752 up-regulated and 737 down-regulated genes. Then, by subjecting the differentially expressed genes to reprogramming energy metabolism as well as malignant tissue development, we obtained 43 metabolism-related genes for subsequent analysis (Table S1). To extract a core prognostic gene set related to reprogramming energy metabolism, we applied univariate Cox proportional hazards regression analysis. We obtained a five-gene signature that was significantly related to overall survival (Table 2, P < 0.05). Among the five genes, high expression levels of two genes (PCNA and MMP12) were strongly associated with better overall survival, and the other three genes (COL4A1, COL4A2, and AARS) showed opposite correlations. Based on the risk score formula of the five genes (see Materials and Methods), each sample assigned a risk score (Fig. S1). Then, samples could be divided into high-risk (n = 156) and low-risk (n = 157) groups according to the median score 3.71 in the training cohort in which 3 tumor samples without available clinical survival information were excluded. For the high-risk group, COL4A1, COL4A2, and AARS showed relatively higher expression and PCNA and MMP12 showed relatively lower expression than the low-risk group. Moreover, the high-risk samples presented a trend of short survival time (Fig. S2).
| Characteristic | GSE39582(N = 499) | GSE17538(N = 232) | GSE41258(N = 167) |
|---|---|---|---|
| Age at diagnosis, years | 67.8 | 65.5 | 66.0 |
| Gender | |||
| Male | 275 | 122 | 87 |
| Female | 224 | 110 | 80 |
| Sample Type | |||
| Tumor | 480 | 232 | 167 |
| Normal | 19 | – | – |
| TNM Stage of tumor | |||
| Stage 0 | 4 | – | – |
| I | 33 | 28 | 26 |
| II | 248 | 72 | 39 |
| III | 158 | 76 | 43 |
| IV | 37 | 56 | 59 |
| Chemotherapy of tumor | |||
| NO | 316 | – | – |
| YES | 164 | – | – |
Notes:
- TNM
-
Tumor node metastasis
Validation of the prognostic value of the reprogramming energy metabolism-related signature
To evaluate the prognostic value of the signature, we performed Kaplan–Meier analysis to evaluate the survival outcomes of patients with colon cancer. Our result showed that the overall survival time of the patients in the high-risk group was significantly shorter than that in the low-risk group (Fig. 1A, log-rank test, P = 0.0011). By using univariate Cox regression analysis, we also found that patients with higher five-gene risk scores had shorter overall survival time (hazard ratio (HR) = 1.92, 95% CI [1.29–2.87]).
| Gene symbol | P-value | HR | Coefficient |
|---|---|---|---|
| AARS | 0.041* | 1.634 | 0.4911 |
| COL4A2 | 0.035* | 1.349 | 0.2992 |
| COL4A1 | 0.037* | 1.332 | 0.2865 |
| PCNA | 0.032* | 0.702 | −0.3543 |
| MMP12 | <0.001* | 0.788 | −0.2377 |
Notes:
To further validate the prognostic ability of the five-gene signature, we collected another two independent validation cohorts, i.e., GSE17538 (n = 232) and GSE41258 (n = 167). Consistent with the results in the training cohort, patients classified as “high-risk” suffered significantly poorer overall survival than those defined as “low-risk” in both two independent validation cohorts (Figs. 1B–1C, P = 5.2e−04 and 3.8e−04, respectively). Through the univariate Cox regression model analysis, the correlation between the signature and the overall survival was consistently strong in the two cohorts (HR = 2.09, 95% CI [1.37–3.2] for GSE17538 and HR = 2.08, 95% CI [1.37–3.16] for GSE41258). In addition, we collected 373 colon cancer samples containing RNA-seq expression and clinical information from The Cancer Genome Atlas (TCGA) (https://cancergenome.nih.gov/). Our signature was still able to significantly predict overall survival of colon cancer patients in TCGA (Fig. S3A, P = 0.038, HR = 1.57, 95% CI [1.02–2.4]). We further explored our risk model in other gastro-intestinal tumors from TCGA but not of colonic origin. We found that the risk model did not have the ability to predict patient survival in other gastro-intestinal tumors (Figs. S3B–S3C, P = 0.8, HR = 0.85, 95% CI [0.23–3.17] for pancreatic cancer and P = 0.096, HR = 0.69, 95% CI [0.45–1.07] for liver cancer). Our signature might be specific for colon tissue.
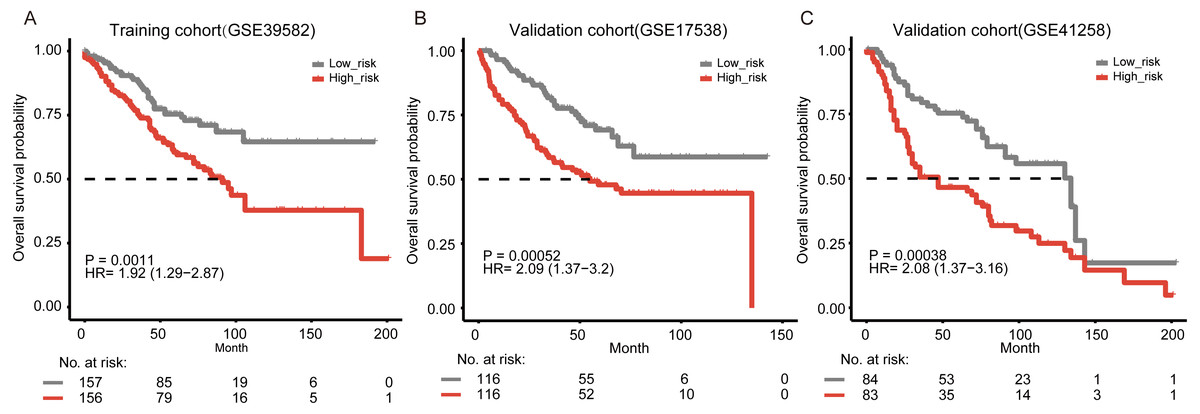
Figure 1: Kaplan–Meier curves of overall survival according to the five-gene signature.
(A) Training cohort (GSE39582, n = 313). In the training cohort, three tumor samples that had no available clinical survival information and 19 normal samples were removed in survival analysis. (B) Validation cohort from GSE17538 (n = 232). (C) Validation cohort from GSE41258 (n = 167). The two-side log-rank test determined the differences between the two curves.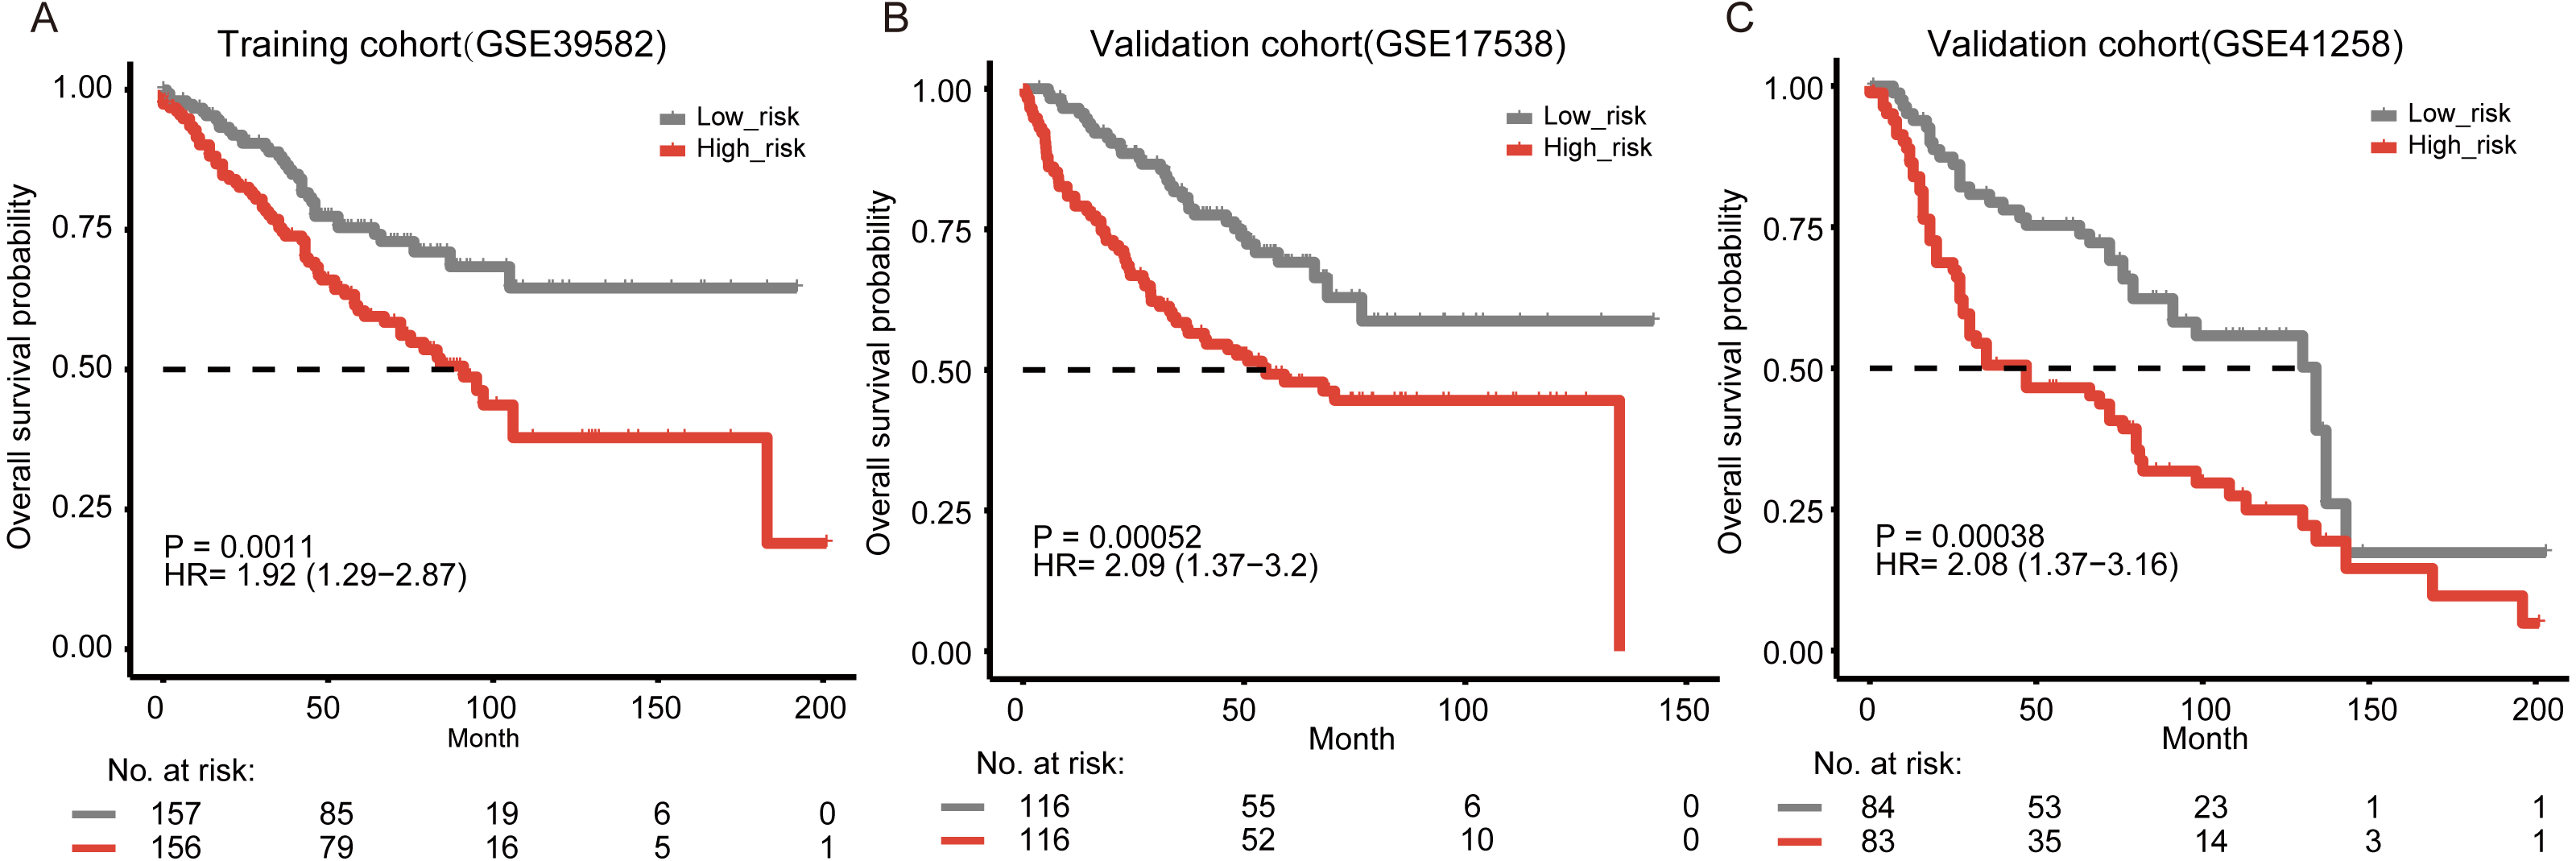
The five-gene signature predicts patient survival independently
To further test whether the prognostic value of the five-gene signature was independent, we performed the multivariate Cox regression model analysis according to clinicopathological parameters of the colon cancer patients, including age, sex, and tumor stage. Our results proved that the signature remained to have prognostic power of overall survival when considering those factors in the training cohort (Table 3, P = 0.009, HR = 1.72, 95% CI [1.15–2.59]). The multivariate Cox regression model analysis based on the two validation cohorts also showed that the risk score was significant among all clinicopathological parameters and significantly associated with overall survival (Table 3, P = 0.006, HR = 1.84, 95% CI [1.19–2.82] for GSE17538 and P = 0.01, HR = 1.76, 95% CI [1.14–2.71] for GSE41258, respectively). While for other factors, only the TNM stage was independent in all cohorts (Table 3). In addition, we further explored the connection between the signature and the TNM stages. The risk scores had a positive Spearman’s correlation with the TNM stages (Fig. S4, Spearman’s correlation, 0.26 for the training cohort; 0.24 for the validation cohort GSE17538; 0.271 for the validation cohort GSE41258).
| Variables | Univariate analysis | Multivariate analysis | |||||
|---|---|---|---|---|---|---|---|
| HR | 95% CI of HR | P-value | HR | 95% CI of HR | P-value | ||
| Training set GSE39582 | |||||||
| Risk score | |||||||
| High-risk VS Low-risk | 1.956 | 1.306–2.931 | 0.001* | 1.722 | 1.146–2.588 | 0.009* | |
| Age | 1.045 | 1.026–1.065 | <0.001* | 1.046 | 1.025–1.067 | <0.001* | |
| Gender | |||||||
| Male VS Female | 1.460 | 0.983–2.169 | 0.061 | 2.015 | 1.331–3.052 | 0.001* | |
| TNM Stage | |||||||
| III-IV VS I-II | 2.559 | 1.714–3.820 | <0.001* | 2.310 | 1.526–3.497 | <0.001* | |
| Validation set GSE17538 | |||||||
| Risk score | |||||||
| High-risk VS Low-risk | 2.090 | 1.366–3.199 | 0.001* | 1.836 | 1.194–2.823 | 0.006* | |
| Age | 1.009 | 0.992–1.025 | 0.304 | 1.020 | 1.004–1.037 | 0.016* | |
| Gender | |||||||
| Male VS Female | 1.006 | 0.669–1.515 | 0.975 | 1.105 | 0.720–1.694 | 0.648 | |
| TNM Stage | |||||||
| III-IV VS I-II | 3.696 | 2.230–6.127 | <0.001* | 3.775 | 2.256–6.319 | <0.001* | |
| Validation set GSE41258 | |||||||
| Risk score | |||||||
| High-risk VS Low-risk | 2.082 | 1.372–3.161 | 0.001* | 1.760 | 1.144–2.708 | 0.010* | |
| Age | 1.007 | 0.991–1.024 | 0.370 | 1.014 | 0.996–1.031 | 0.122 | |
| Gender | |||||||
| Male VS Female | 1.659 | 1.082–2.542 | 0.020* | 1.748 | 1.126–2.715 | 0.013* | |
| TNM Stage | |||||||
| III-IV VS I-II | 3.878 | 2.395–6.280 | <0.001* | 3.668 | 2.238–6.012 | <0.001* | |
Prognostic prediction of the signature within clinical stages
The disease-specific survival of colon cancer is impacted by several factors, including the tumor–node–metastasis (TNM) staging. The stage of disease at diagnosis has been proved to be a major predictor to help evaluate the prognosis (Crooke et al., 2018). In the multivariate survival analysis, our results showed that the prognostic value of the signature was significant in all cohorts and independent of TNM stage. To examine the significance of our reprogramming energy metabolism-related signature in patients with the same stage, a stratified analysis was performed. Our results showed that the signature could further divide the subgroups of patients with the same stage. Those patients with high-grade (Stage III–IV) tumors were divided into two subgroups with significantly different survival times (Fig. 2B, log-rank test, P = 0.042). For patients with low-stage (Stage I–II) tumors, our signature could also divide them into two different prognostic groups (Fig. 2A, log-rank test, P = 0.1). Similar results were also found in the other two cohorts (Figs. 2C–2D, Fig. S5).
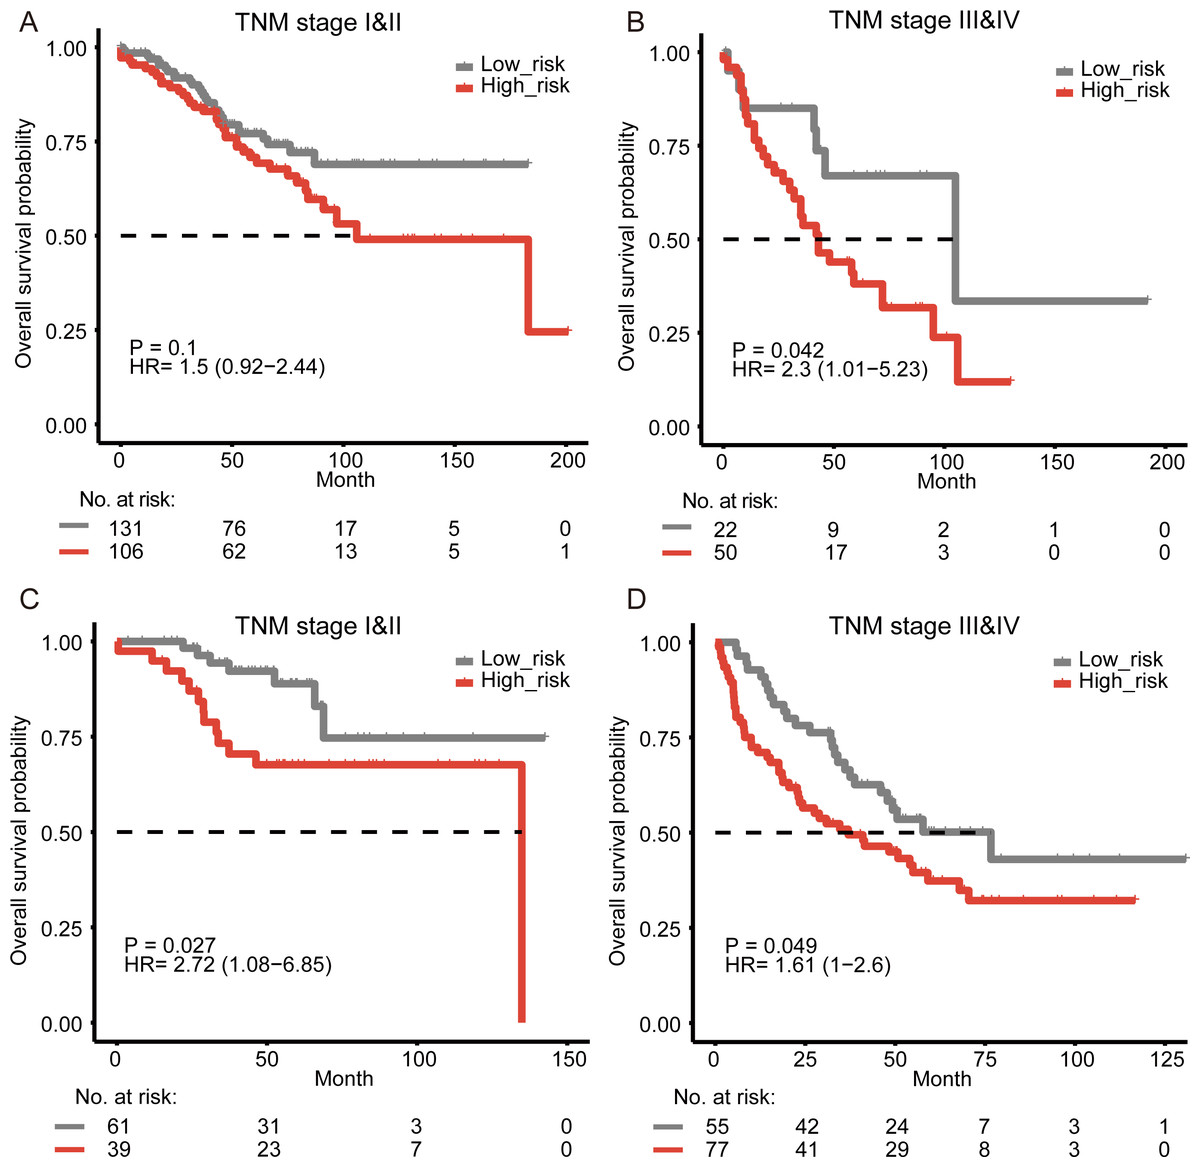
Figure 2: Survival analysis for colon cancer patients stratified by the TNM stage.
The Kaplan–Meier estimates overall survival in stage I–II patients and stages III–IV patients from the training cohort (A–B) and the validation cohort from GSE17538 (C–D).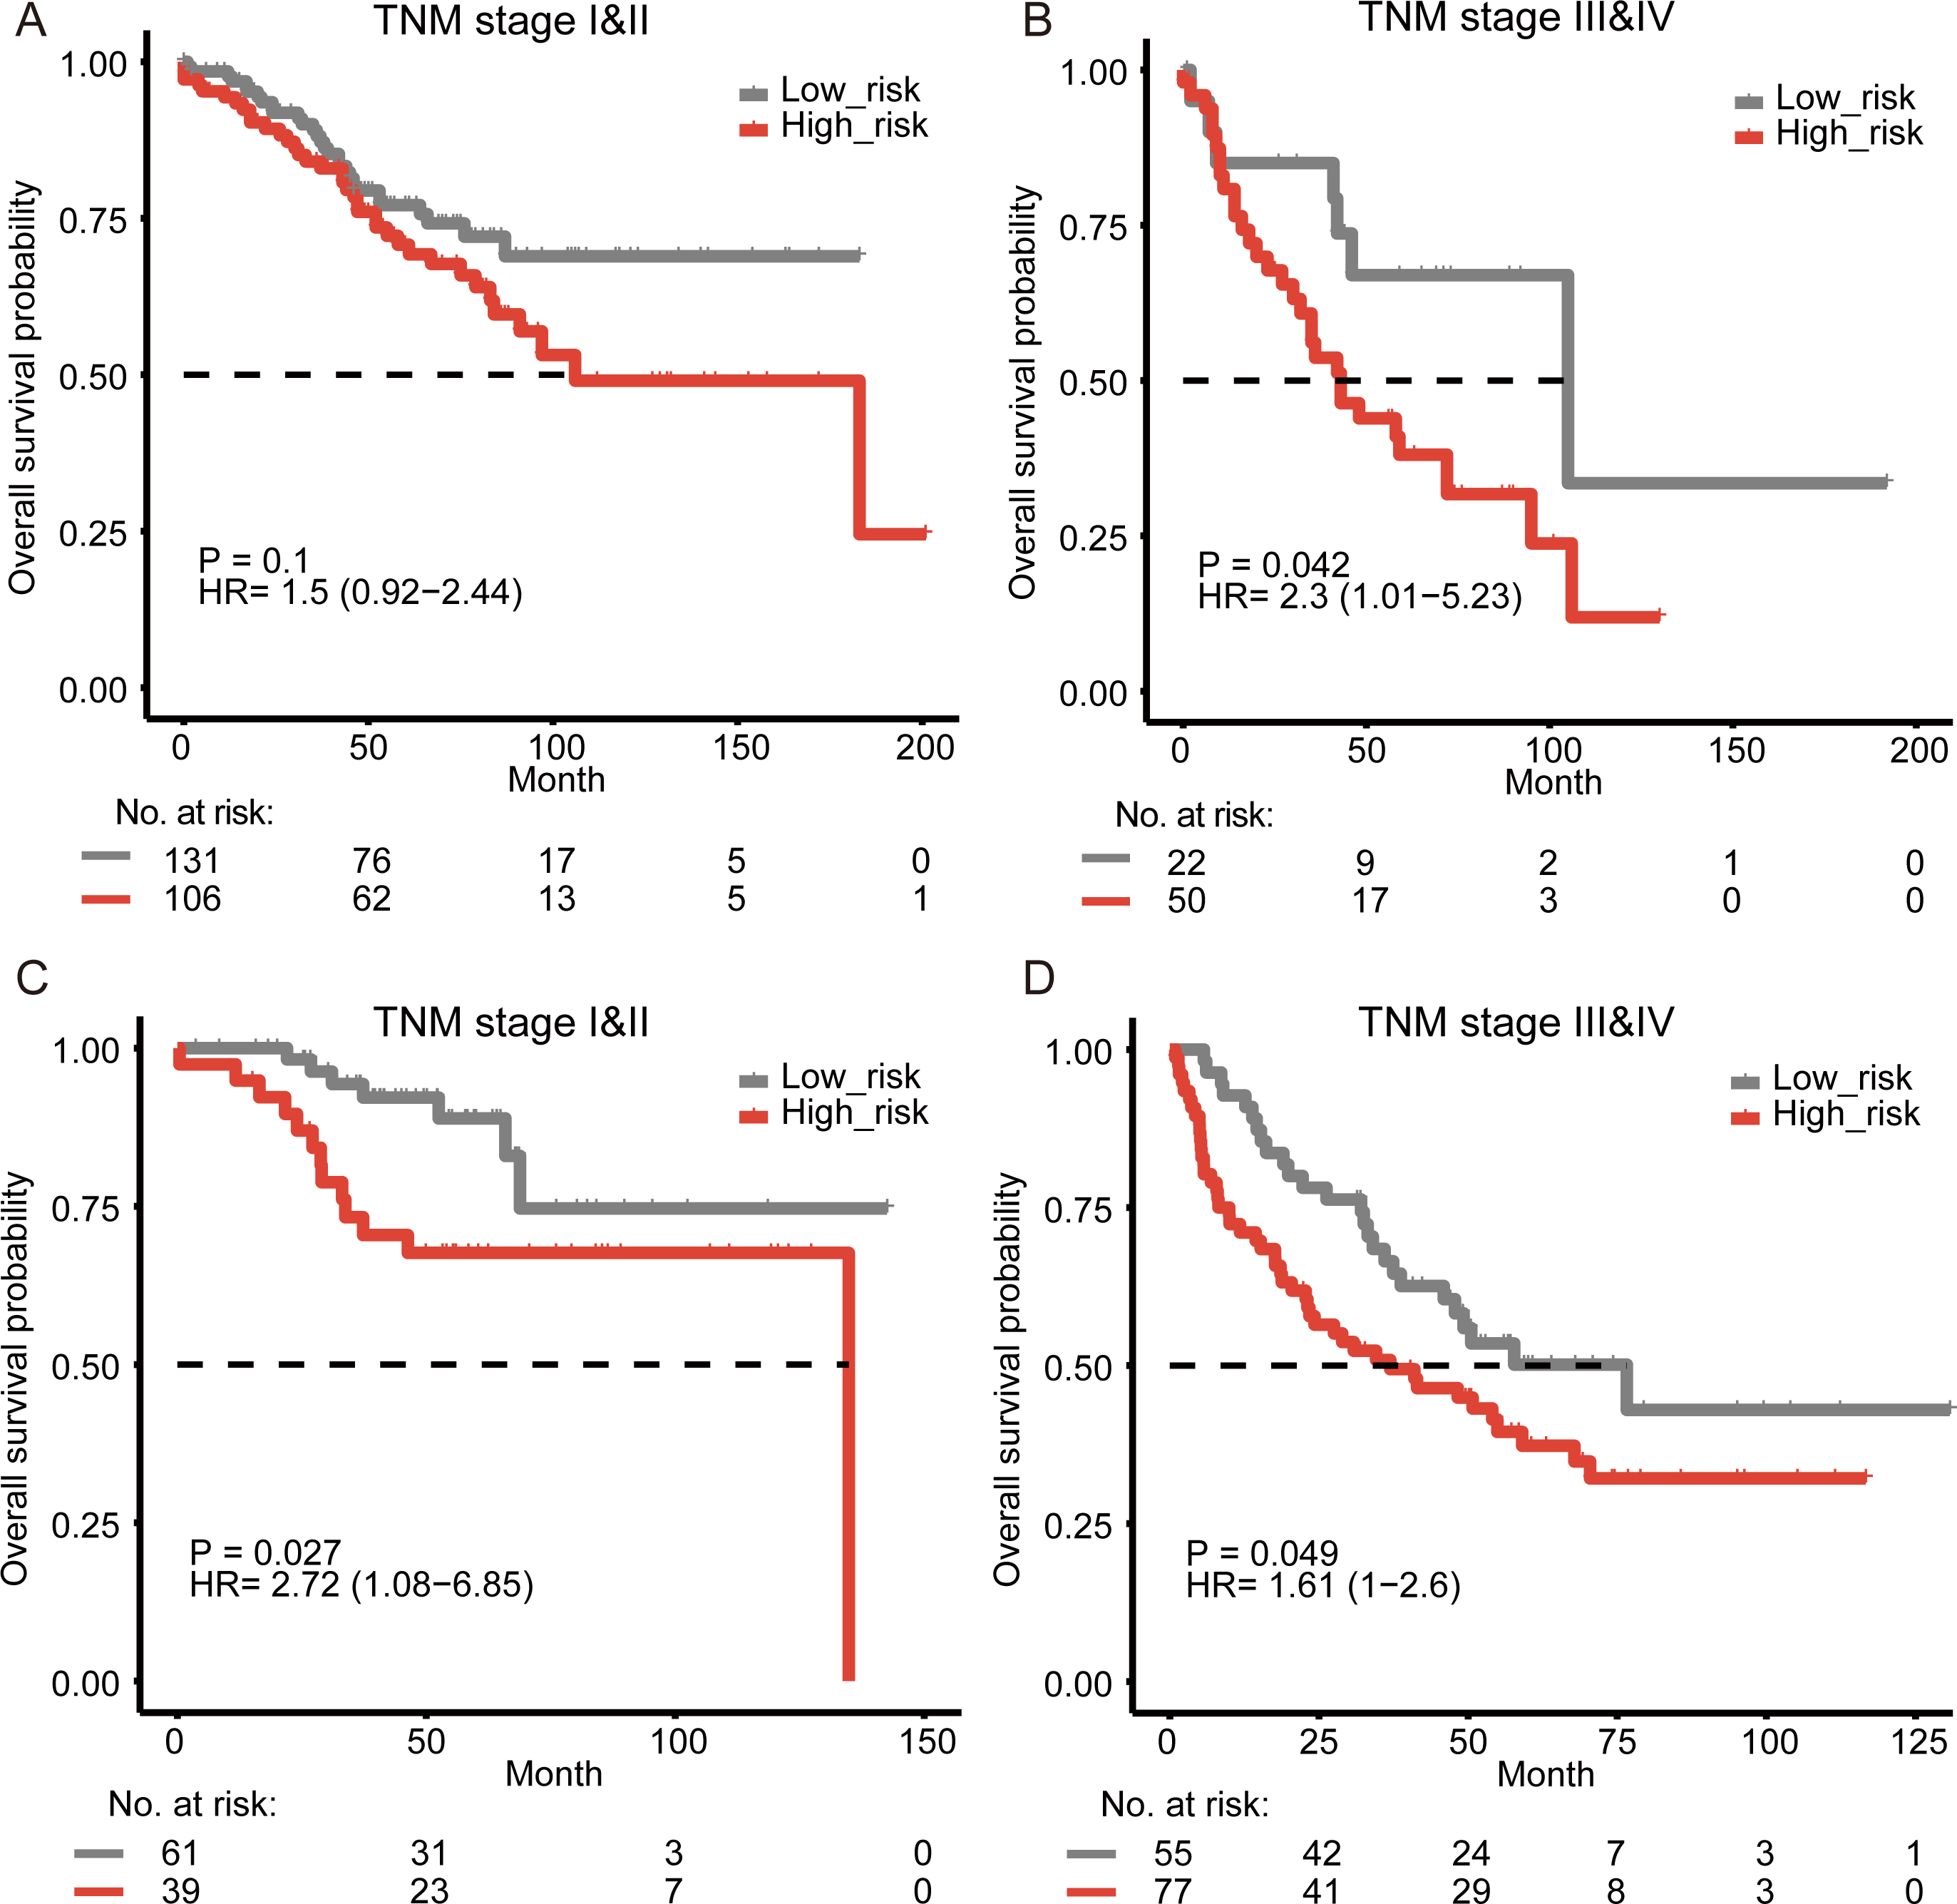
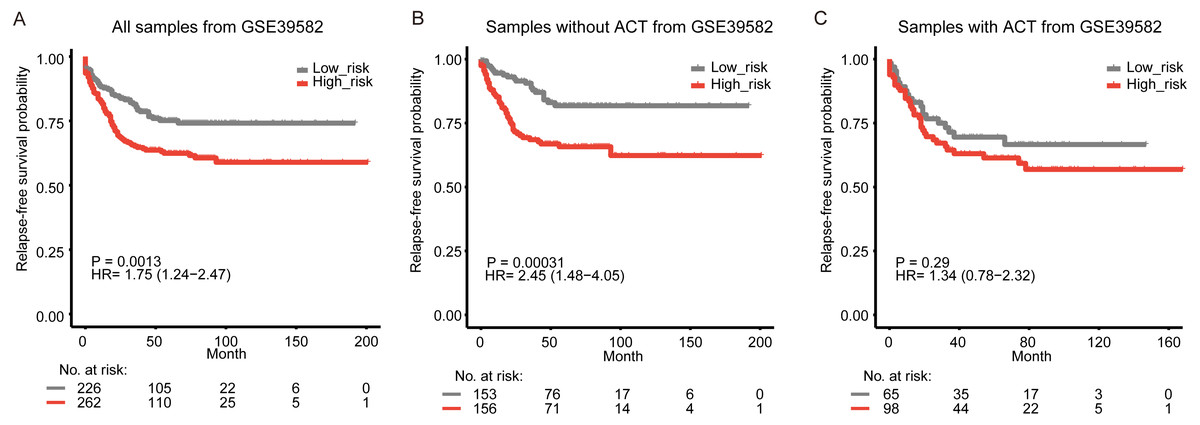
Figure 3: Kaplan-Meier curves of relapse-free survival according to the signature in GSE39582.
All samples with and without fluorouracil-based adjuvant chemotherapy (ACT) (A), the samples without ACT (B), and the samples without ACT (C).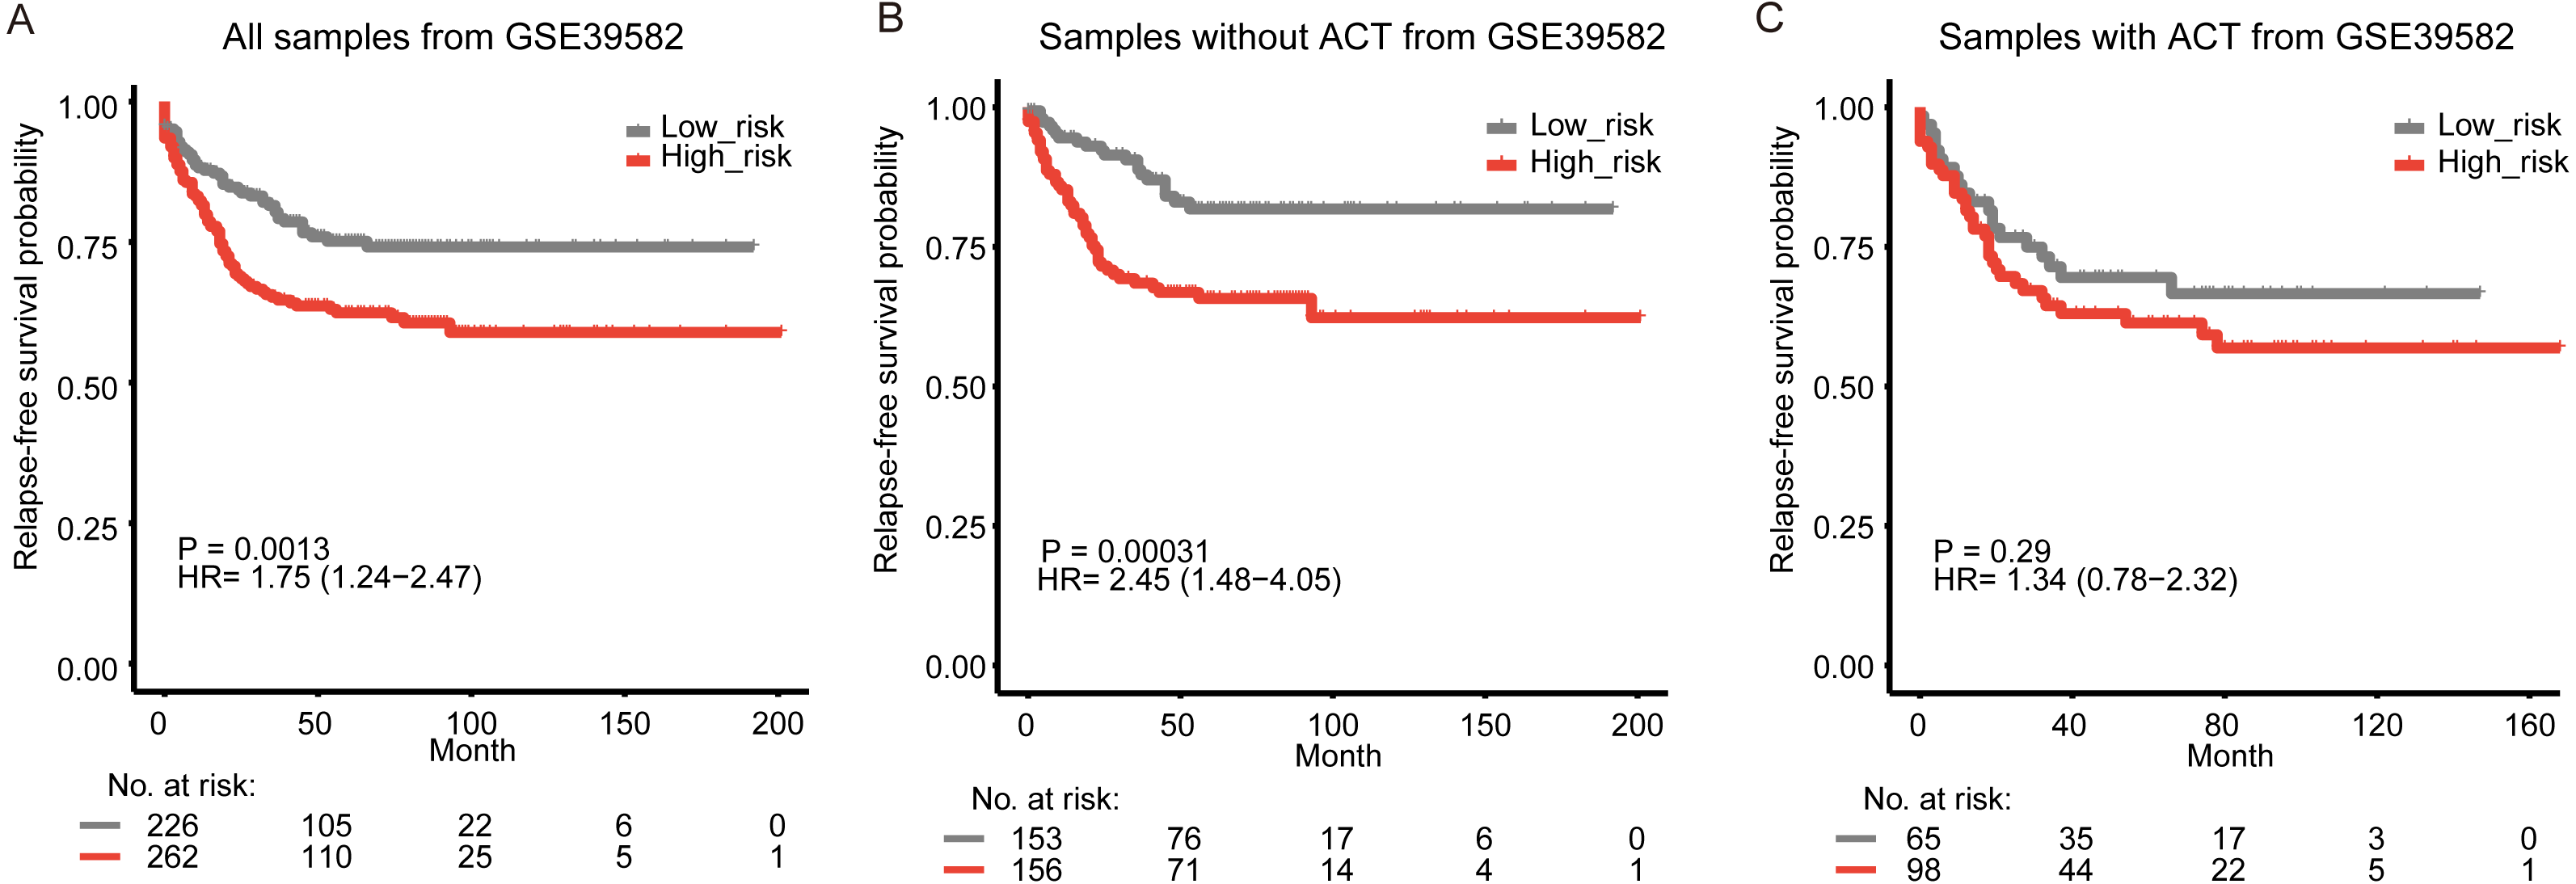
The signature is associated with adjuvant chemotherapy and can improve the predictive value of TNM stage
Adjuvant chemotherapy is frequently considered for patients with colon cancer. We found that the signature could significantly predict overall survival and relapse-free survival for all samples with and without fluorouracil-based adjuvant chemotherapy (ACT) in GSE39582 (Fig. S6A, Fig. 3A, log-rank test, P = 0.0013 for overall survival; P = 0.0013 for relapse-free survival). The high-risk samples who did not receive ACT, had a significantly worse overall survival and were more likely to relapse (Figs. 1A, 3B, log-rank test, P = 0.0011 for overall survival; P = 0.00031 for relapse-free survival). For the samples who received ACT, there was a similar phenomenon, but without significance (Fig. S6B, Fig. 3C, log-rank test, P = 0.14 for overall survival; P = 0.29 for relapse-free survival). The results implied that the samples could benefit from adjuvant chemotherapy without a significant difference in risk scores. To assess the combinative prognostic value of the signature with clinical factors, we further analyzed the benefit of the signature by evaluating the risk score together with the TNM stage. As shown in Table 3, the risk score and the TNM stage were both independent prognostic factors. So, it is reasonable to generate a new score combining the risk score and the TNM stage. When considering the reprogramming energy metabolism-related signature together with TNM stage, the prognostic power of TNM stage could be significantly enhanced: the AUC was 0.60 (95% CI [0.55–0.65]) for TNM stage alone, and the AUC became 0.67 (95% CI [0.61–0.74]) when adding the risk score (Fig. 4A, P = 0.0093). The other two independent cohorts also showed significant improvement after adding the risk score (P = 0.0072 for GSE17538 and P = 0.0025 for GSE41258, Figs. 4B and 4C).
Discussion
In this study, we found the prognostic power of metabolism-related genes and identified a reprogramming energy metabolism-related signature to predict overall patient survival in colon cancer. The prognosis value of the signature was robust among three independent cohorts in both Kaplan–Meier and univariate analyses. After adjusting clinicopathological risk factors, this signature could serve as an independent prognostic factor and improve the classification based on the TNM stage. In addition, we also observed that the signature could predict the survival benefits of adjuvant chemotherapy for colon cancer patients.
Metabolic reprogramming, which is required for both malignant transformation and tumor development, has been recognized as one of the hallmarks of tumor cells. Accumulating evidences have revealed that metabolic reprogramming could remarkably enhance the invasion and metastatic potentials of cancer cells and can facilitate the development of novel therapeutic strategies (Yoshida, 2015). Therefore, our reprogramming energy metabolism-related signature could be helpful to explore the importance of metabolic reprogramming and develop innovative therapeutic strategy. The advances in metabolic researches of colonic epithelium and serum have provided the possibility to identify individuals who may have potential risk for the development of colon cancer and could explored guidance on the ongoing management of patients (Williams et al., 2015b). The dysregulation of some genes in metabolism, such as fatty acid metabolism and lipid metabolism, had an important role in tumor progression and prognosis of human cancers (Nath & Chan, 2016; Sun et al., 2015). For example, Chen et al. screened two differentially expressed metabolic genes, PGK1 and G6PD, which were determined as critical regulators involved in glycolysis and the pentose phosphate pathway, respectively. Their up-regulated expression is associated with a high risk of recurrent metastasis and poor survival of patients (Chen et al., 2018; Chen et al., 2020). Moreover, antimetabolites have been used in many modern chemotherapy regimens that improve patient survival and, in some cases, help cure disease (Luengo, Gui & Van der Heiden, 2017). Thus, understanding the molecular features in tumor metabolism could reveal potential value in better interpreting the progression of colon cancer.
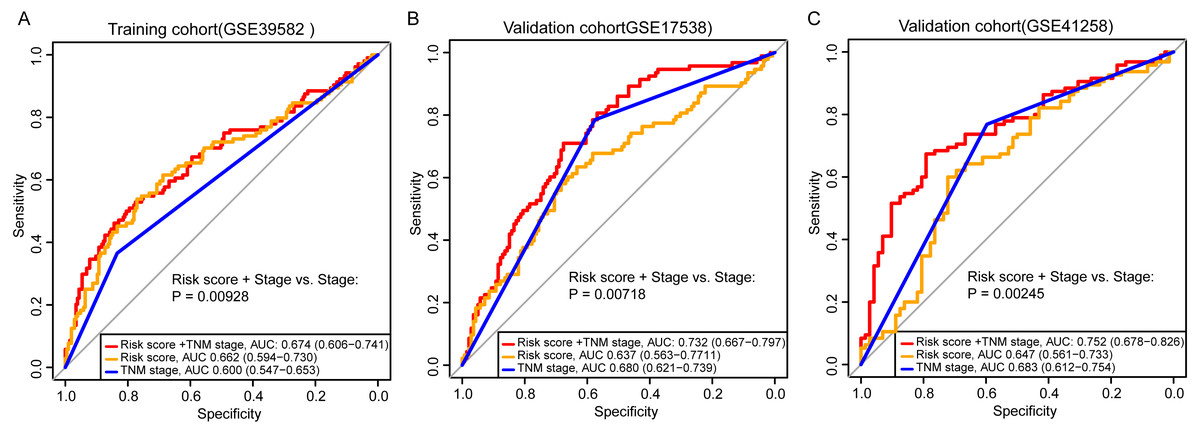
Figure 4: Comparison of sensitivity and specificity for survival prediction by the signature and TNM stage.
The ROC curves evaluating the prediction capability of the five-gene risk score, the TNM stage, and the combination of the two factors in GSE39582 (A), GSE17538 (B), and GSE41258 (C). P-value showed the AUC of the TNM stage versus the AUC of the combination of signature and TNM stage.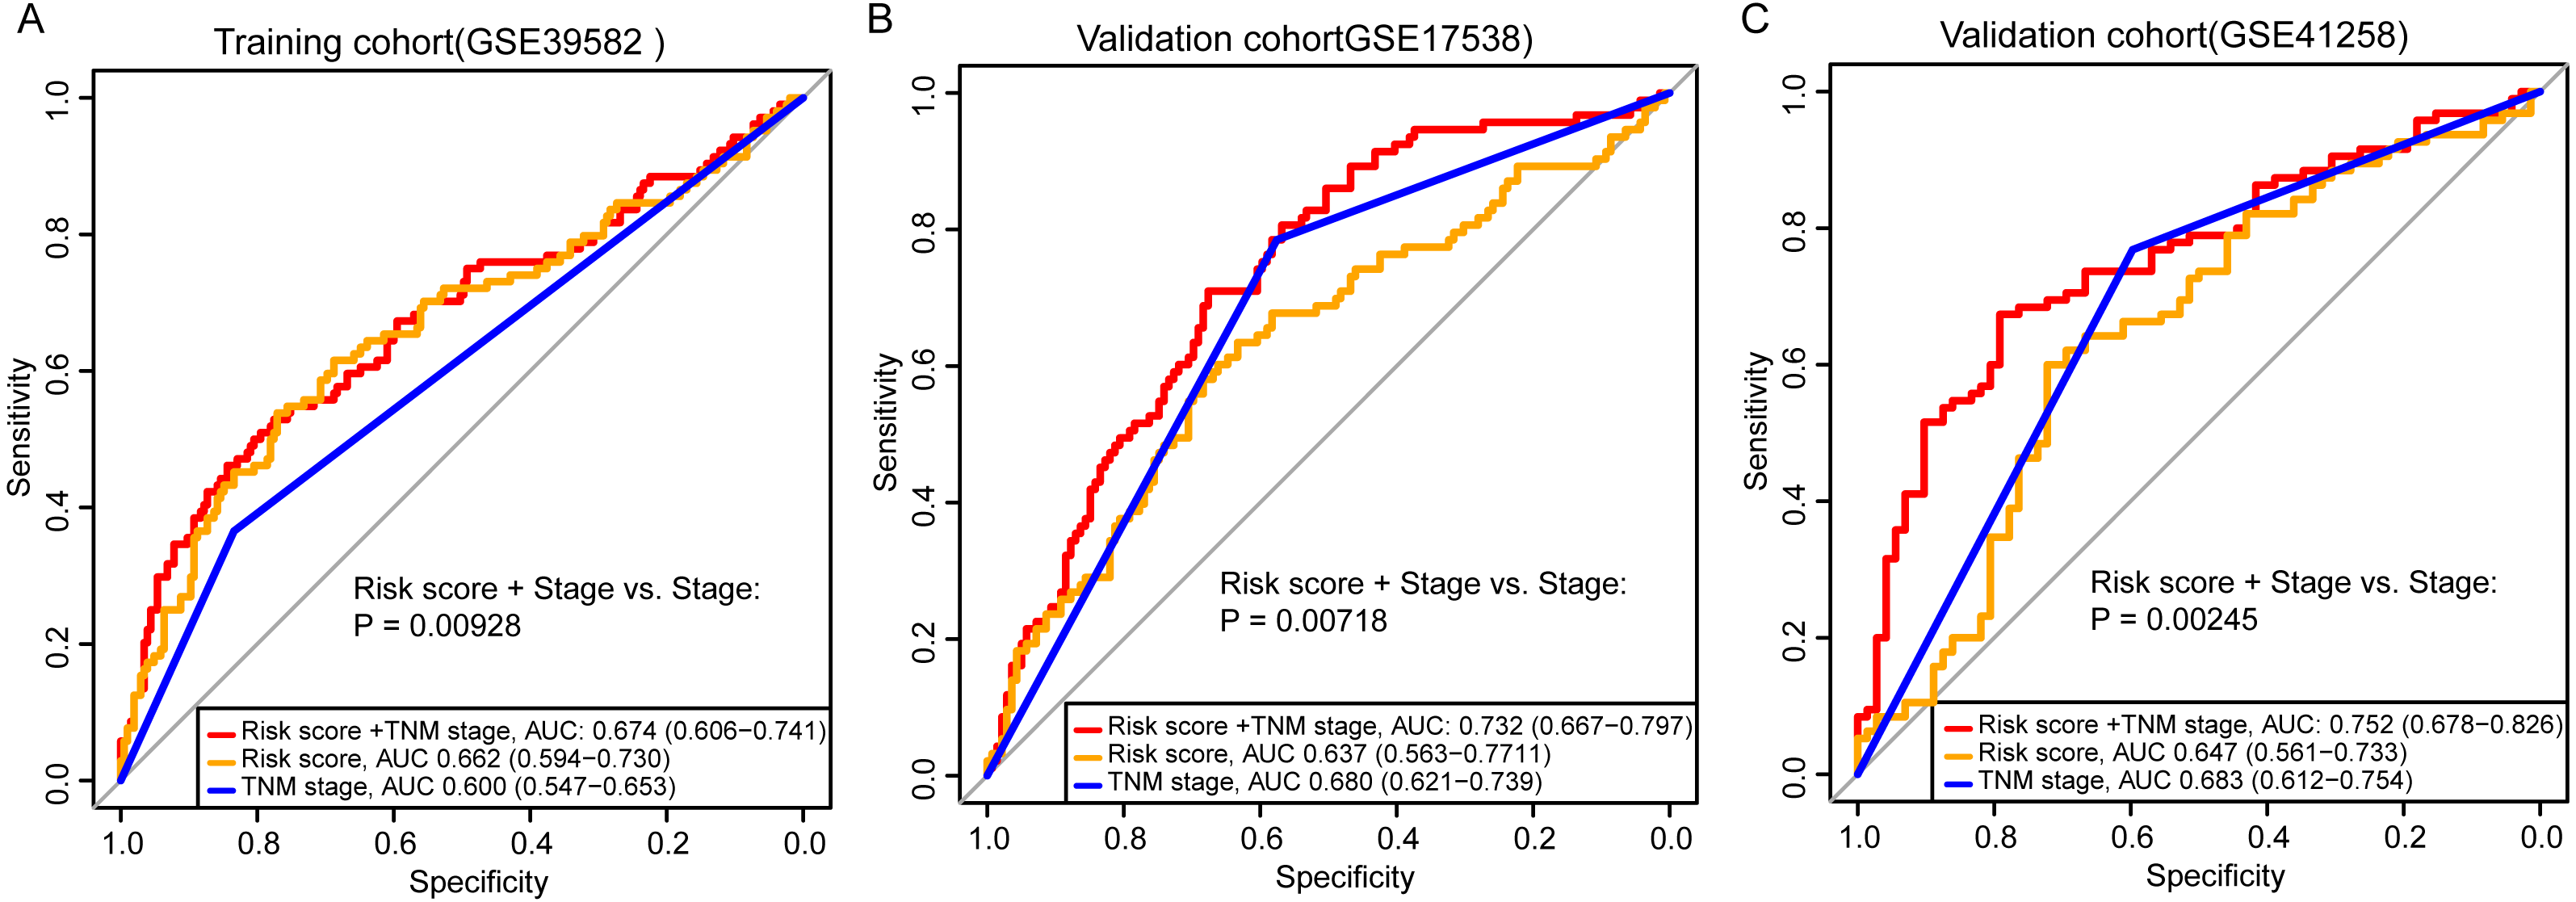
For the five genes in the signature, four of them (expected COL4A1) were annotated in the metabolic process (GO:0008152). PCNA was one of the members in the metabolism of proteins pathway (PathCards, https://pathcards.genecards.org/) and played an essential role in nucleic acid metabolism (Kelman, 1997). Deletion of MMP12 could effectively prevent inducible NOS and then contribute to the glucose metabolism (Bahadoran, Mirmiran & Ghasemi, 2020). Using proteomic analysis, Chafey et al. identified AARS was involved in amino-acid metabolism pathway (Chafey et al., 2009). Both COL4A1 and COL4A2 were involved in the PI3K-Akt pathway and this signaling pathway has been demonstrated to be responsible for controlling metabolic reprogramming (Lien, Lyssiotis & Cantley, 2016; Liu et al., 2020). All of five genes have been previously reported to have prognostic roles in several cancers, such as AARS in breast cancer and PCNA in colon adenocarcinoma (Ho et al., 2017; Klupp et al., 2016; Zhang et al., 2016a). Matrix metalloproteinases (MMPs) are important in colorectal cancer invasion and progression. Among them, MMP12 is known to be associated with increased survival in colorectal cancer, which has become an important therapeutic target (Said, Raufman & Xie, 2014). Previous studies have shown that COL4A1 is essential in tumorigenesis, which contributes to the proliferation, migration and colony formation in many cancers (Huang et al., 2018; Jin et al., 2017). COL4A1 has been identified as one of the prognostic biomarkers of several diseases, whose high expression level is usually associated with poor overall survival (consistent with our result HR = 1.332) (Huang et al., 2018; Li et al., 2019; Sulpice et al., 2013). Another marker, COL4A2, is involved in proliferation and migration of endothelial cells and induces apoptosis (JingSong et al., 2017). A correlation analysis of COL4A2 showed that the overexpression of COL4A2 was highly correlated with shorter progression-free survival in liver cancer (Liu et al., 2020). Heterotrimers composed of COL4A1 and COL4A2 constituted the most abundant components of almost all basement membranes. It has been found that COL4A1/2 could accelerate cell cycle and promote tumorigenesis (Liu et al., 2020). Kuo et al. proved that mutations in COL4A1 or COL4A2 were important to a broad spectrum of disorders and may be potential therapeutic targets (Kuo, Labelle-Dumais & Gould, 2012). In addition, it has been reported that COL4A1 and COL4A2 were associated with high risk of relapse in colon cancer (Chida et al., 2016). They were predominantly expressed in the cancer stroma and were further found to be specifically expressed by the endothelial cells and cancer-associated fibroblasts. A recent study showed that cancer cell metabolism had been proposed to drive stromal cells toward a regenerative response that supports tumor growth (Schworer, Vardhana & Thompson, 2019). Considering the mutant phenotypes of both COL4A1 and COL4A2 included metabolism phenotype and the GO annotations related to them contained extracellular matrix structural constituent (Eppig, 2017), the two metabolism-related genes may be released by tumor cells and mainly play a role in cancer stroma. The fluorescence-based real-time polymerase chain reaction (qPCR) has become the gold standard for the quantification of mRNAs and ensconced as the benchmark for clinical prognosis and pathogen detection (Bustin, 2010). We will further validate our signature with potential biomarker value by qPCR to expand the clinical application.
Conclusions
In conclusion, our study presented a powerful reprogramming energy metabolism-related signature for the prognosis of colon cancer by employing different independent patient cohorts. The risk score was significantly separate among other clinicopathological factors and could be used as a potential clinical predictor alongside the TNM stage. The five-gene signature would be useful to develop novel strategies of precision medicine, and more prospective studies are necessary to further assess the reliability and the clinical implications of the reprogramming energy metabolism-related signature.