
A real-time PCR assay to accurately quantify polar bear DNA in fecal extracts
- Published
- Accepted
- Received
- Academic Editor
- Xavier Pochon
- Subject Areas
- Biochemistry, Evolutionary Studies, Genetics, Molecular Biology, Zoology
- Keywords
- qPCR, Population genetics, Noninvasive sampling, Ursus maritimus
- Copyright
- © 2020 Hayward et al.
- Licence
- This is an open access article distributed under the terms of the Creative Commons Attribution License, which permits using, remixing, and building upon the work non-commercially, as long as it is properly attributed. For attribution, the original author(s), title, publication source (PeerJ) and either DOI or URL of the article must be cited.
- Cite this article
- 2020. A real-time PCR assay to accurately quantify polar bear DNA in fecal extracts. PeerJ 8:e8884 https://doi.org/10.7717/peerj.8884
Abstract
DNA extracted from fecal samples contains DNA from the focal species, food, bacteria and pathogens. Most DNA quantification methods measure total DNA and cannot differentiate among sources. Despite the desirability of noninvasive fecal sampling for studying wildlife populations, low amounts of focal species DNA make it difficult to use for next-generation sequencing (NGS), where accurate DNA quantification is critical for normalization. Two factors are required prior to using fecal samples in NGS libraries: (1) an accurate quantification method for the amount of target DNA and (2) a determination of the relative amount of target DNA needed for successful single nucleotide polymorphism genotyping assays. Here, we address these needs by developing primers to amplify a 101 bp region of the nuclear F2 gene and a quantitative PCR (qPCR) assay that allows the accurate quantification of the amount of polar bear (Ursus maritimus) DNA in fecal extracts. We test the assay on pure polar bear DNA extracted from muscle tissue and find a high correlation between fluorometric and qPCR quantifications. The qPCR assay was also successfully used to quantify the amount of DNA derived from polar bears in fecal extractions. Orthologs of the F2 gene have been identified across vertebrates; thus, similar qPCR assays could be developed for other species to enable noninvasive studies.
Introduction
Molecular scatology, the use of fecal samples for genetic analyses, is increasingly being used in ecological and conservation studies of wild animals. Traditionally, scat was used for documenting the abundance and distribution of focal species, or for studying diet based on bone fragments and other prey hard parts (Robertshaw & Harden, 1985). Putman (1984) was among the first to recognize the value of scat as a source of DNA. Since then, scat-derived DNA has been applied to study various animals, including brown bears (Ursus arctos; Taberlet et al., 1997), chimpanzees (Pan troglodytes verus; Morin et al., 2001), seals (Halichoerus grypus and Phoca vitulina; Reed et al., 1997), and gray wolves (Canis lupus; Stenglein et al., 2010). Scat samples are one means of obtaining DNA for threatened or endangered species when capture or handling is undesirable (Stenglein et al., 2010). Data from noninvasive DNA sampling can provide important insights on sex ratios, population size, demography, mating and breeding system, population structure, gene flow, diet and disease (Frankham, 2010), and can help address important questions in conservation.
Many important questions in conservation genetics are investigated using next generation sequencing (NGS). To reliably use fecal samples for NGS libraries, we first must have a method to quantify the amount of target DNA. Fecal samples contain DNA from both the focal species via cells shed from the intestinal lining and potentially from food/prey items, bacteria, pathogens and parasites (Kohn & Wayne, 1997). Quantifying DNA amounts from each of these sources poses a challenge. Common DNA quantification tools, including spectrophotometry and fluorometry, measure the total DNA present and cannot apportion contributions from each source. Not knowing the concentration of focal species DNA becomes a critical problem when preparing NGS libraries, as poor normalization across samples can result in uneven sequence depth among individuals, low confidence in scoring genotypes and inaccurate estimates of allele frequency (Simbolo et al., 2013). Successful and accurate quantification may also identify samples that are unlikely to yield sufficient data, allowing researchers to focus on more promising samples. Thus, there is a need to develop a quick, cost-effective and accurate protocol to quantify focal species DNA in fecal extractions that will allow for normalization.
In this study, we address the challenge of using fecal samples in NGS studies by developing a quantitative PCR (qPCR) assay to quantify the amount of polar bear (Ursus maritimus) DNA in extractions from polar bear fecal samples. We show that our method performs well for polar bear DNA quantification in fecal DNA and suggest that similar assays could be useful tools for monitoring programs for other taxa that require noninvasive sampling.
Materials and Methods
Primer design, optimization and specificity testing
For our qPCR assay, we selected coagulation factor II (F2), a protein coding gene implicated in formation of fibrin clots that is conserved across vertebrates (Rallapalli et al., 2014). The F2 gene has been used to assess the species composition of ground meat products because variation in the intronic sequence can allow for species-specific detection (Floren et al., 2015). We designed three pairs of primers to amplify ~100 base pair (bp) segments of three different introns (Table 1) using the polar bear genome annotation (accession no. XM_008701092.1) and Primer3 software (version 0.4.0, Untergasser et al., 2012). All oligonucleotides were supplied by Eurofins Genomics (TO, Canada) and purified using standard desalting.
| Region | Amplicon length (base pairs) | Primer direction | Primer sequence (5′–3′) | Primer location on NW_007907185.1 |
|---|---|---|---|---|
| Intron 01 | 103 | F | CAGTGAGCCAGGAGGTCTTGG | 2114209.. 2114229 |
| R | TTTAGGGTTCTGCCACCATCC | 2114291.. 2114311 | ||
| Intron 06 | 106 | F | TCAAGCAGGAAGGAAAGCAT | 2111091.. 2111110 |
| R | GTGAAGGCAGGAGACCAGAG | 2111177.. 2111196 | ||
| Intron 12 | 101 | F | AGGGTAAGTCCAAGGCATGAC | 2099674.. 2099694 |
| R | GCTGGTGGGTAGAGCTTCTGG | 2099754.. 2099774 |
To determine the optimal annealing temperature for each primer pair and if there was nonspecific amplification, we ran test PCR using DNA extracted from a single sample of polar bear muscle tissue on an Eppendorf Mastercycler Gradient thermocycler. In a 20 µL reaction mixture, 0.2 ng of DNA was amplified with 10 µL GoTaq® mastermix (Promega, Madison, WI, USA) and 0.5 µL 10 µm of each primer. The PCR cycling profile was as follows: initial denaturation at 95 °C for 5 min, then 40 cycles of amplification with 95 °C for 10 s, annealing temperatures from 55 °C to 65 °C for 10 s and 72 °C for 10 s, followed by elongation at 72 °C for 5 min. Successful PCR results were confirmed by 2% agarose gel electrophoresis, stained with RedSafe™ Nucleic Acid Staining Solution.
Intron 1 and intron 6 both exhibited nonspecific amplification (Figs. 1A and 1B) and were dropped from further testing. Intron 12 yielded a clean single band on agarose gel for polar bear DNA samples with no nonspecific amplification at any annealing temperature (Fig. 1C); thus, we used 60 °C for all further PCR.
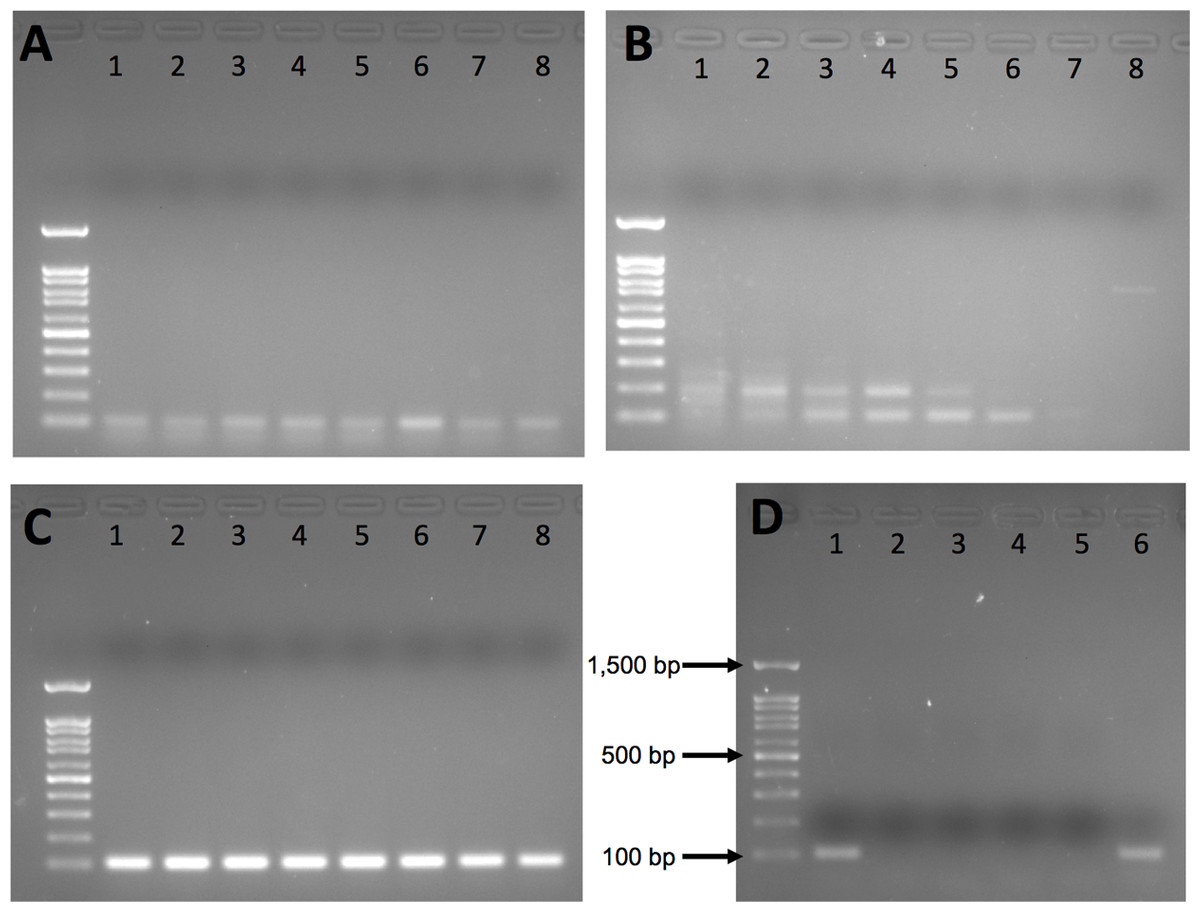
Figure 1: Agarose gel results from initial gradient PCR tests of the three primer pairs.
(A) F2_Intron_01, (B) F2_Intron_06 and (C) F2_Intron_12. From lane 1 to lane 8, the annealing temperatures are 54.8 °C, 55.9 °C, 57.3 °C, 58.9 °C, 60.5 °C, 62.2 °C, 63.4 °C and 65 °C, respectively. (D) Amplification results of different DNA templates for F2_intron_12 using 60 °C as the annealing temperature. Lane 1: polar bear muscle DNA; lane 2: seal DNA; lane 3: Arctic char DNA; lane 4: human DNA; lane 5: water (negative control); lane 6: grizzly bear DNA. All gels were run using 100 base pair ladder (Frogga Bio); bands for 100, 500 and 1,500 base pairs (bp) are indicated on (D).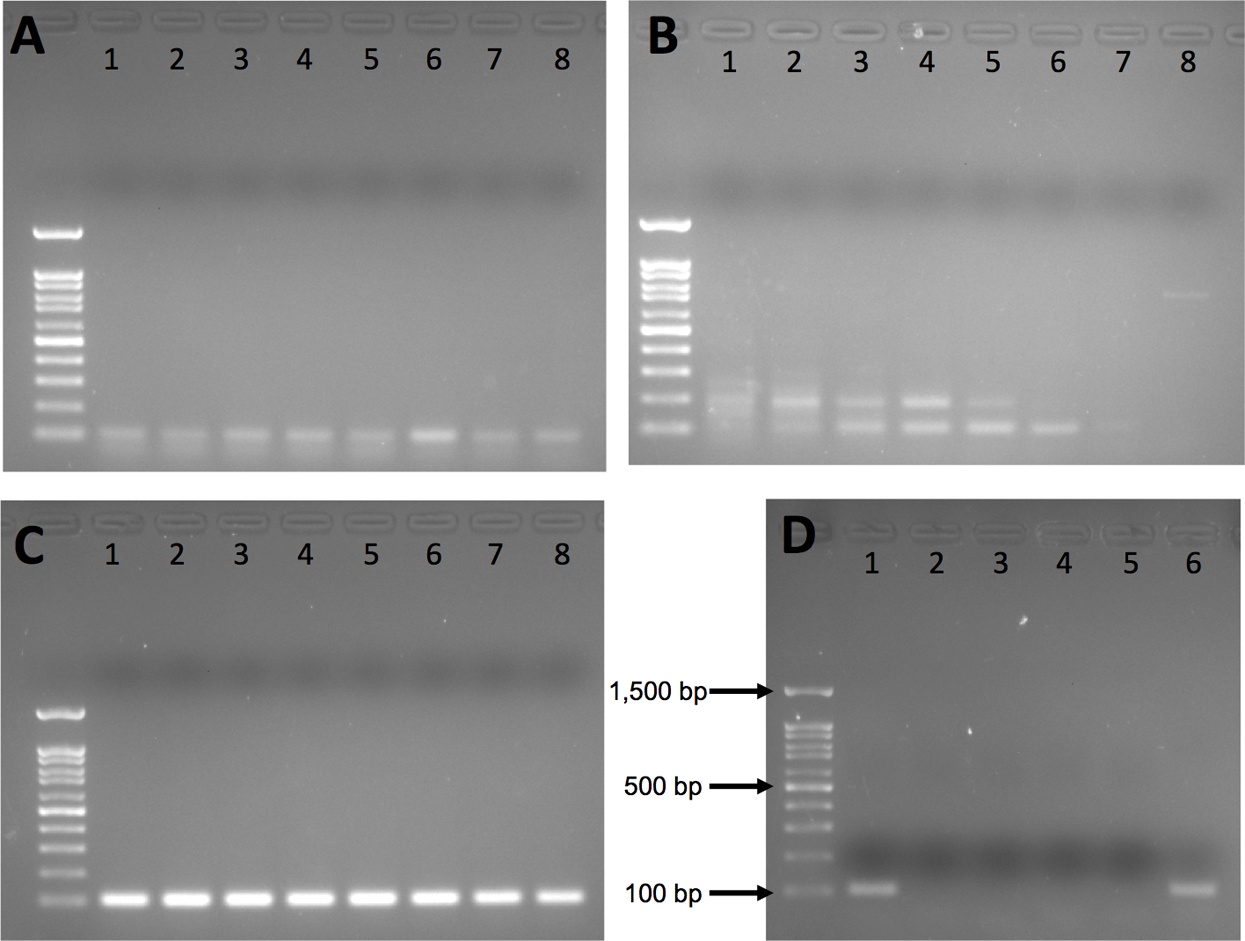
We next tested the species specificity of the intron 12 primers using both in silico and in vitro approaches. We used Primer-BLAST (Ye et al., 2012) and BLAST (Altschul et al., 1990) to search for sequence similarity to the genomes of non-target species, including humans and polar bear prey species, such as various small mammals, seals and fish present in the Arctic environment, for which cross-amplification was a concern. We also included closely related bear species, Ursus arctos (grizzly bear) and Ursus americanus (American black bear), whose ranges partially overlap with polar bears. We directly tested for amplification of human, Arctic char and grizzly bear DNA using the regular PCR with conditions as described above. Human DNA was from an A2780 cell line; grizzly bear and Arctic char DNA was provided by collaborators.
Pure polar bear DNA extraction
To assess the accuracy of the qPCR method, we used “pure” polar bear DNA from eight bears sampled from three subpopulations (Southern Hudson Bay, Gulf of Boothia and Foxe Basin), using tissue samples provided to us by the Government of Nunavut. DNA was extracted from muscle tissue using a salt extraction protocol (Aljanabi & Martinez, 1997). DNA quantification was performed using a DeNovix DS-11 FX Series fluorometer with DeNovix dsDNA Broad Range Assay Kit (DeNovix Inc., Wilmington, DE, USA) according to the manufacturer’s protocol. We compared the qPCR and fluorometric quantifications using a Pearson’s correlation (Pearson, 1895) in R (R Development Core Team, 2010).
Fecal DNA extraction
We used DNA extracted from feces collected directly from inside the colon of bears that had been harvested by hunters (n = 25) provided to us by the Government of Nunavut (Wildlife Research Permit WL 2018-006). After harvesting, the colons were stored at −20 °C until they were thawed for dissection. Colons were cut open and feces were removed, with care taken to not disturb the epithelium of the intestine. Genomic DNA was extracted from the fecal samples (approximately 180–220 mg) in a Biosafety Level 2 laboratory using a Qiagen QIAmp Fast DNA Stool Mini Kit (Qiagen Inc., Hilden, Germany) according to manufacturer’s protocol. DNA quantification was performed as for the muscle tissue samples.
Quantification with qPCR
qPCR reactions were done on a CFX96 Touch™ Real–Time PCR Detection System (Bio-Rad Laboratories Canada, Mississauga, ON, Canada) in 20 µL reaction mixture with 10 µL PowerUp™ SYBR® Green Master Mix (Thermo Fisher Scientific, Toronto, ON, Canada), 0.5 µL 10 µm final concentration of forward and reverse primers respectively and 2.5 µL of DNA template. The cycling profile was as follows: initial incubation at 50 °C for 2 min and 95 °C for 2 min, followed by 40 cycles of 95 °C for 15 s and 60 °C for 60 s. A final melt curve step was added after the amplification cycles, from 65 °C to 95 °C with incubation for 5 s at each temperature and temperature increased by 0.5 °C increments each cycle. Standard curves were created using high-quality pure DNA samples extracted from polar bear muscle tissues. Muscle DNA was quantified with Denovix first, after which we did a serial dilution: 17.4 ng, 1.74 ng, 0.174 ng, 0.0174 ng and 0.00174 ng per µL. The standard curve and the concentration of DNA samples were analyzed using the CFX Manager Software ver. 3.1 (Bio-Rad Laboratories Canada, Mississauga, ON, Canada). All qPCR amplifications were performed in triplicate for each sample, including the standards and negative controls.
Results
Our in silico and in vivo assessments of the specificity of the intron 12 primers indicate that they will not produce amplicons near the target size for polar bear prey species or human DNA (Table 2; Fig. 1D). However, the primers are not species-specific, as they also amplified a ~100 bp fragment in the PCR with grizzly bear DNA (Fig. 1D), and would be expected to work equally well for American black bear, given that there are no mismatches between the primer sequences and the reference genomes (Table 2). Despite having several mismatches, it is possible that the primers may also amplify a region in F2 gene based on alignment to the walrus (Odobenus rosmarus) genome, but this would require additional testing to determine.
| Species | Gene name/chromosome location | Forward primer mismatches | Reverse primer mismatches | Amplicon length (base pairs) |
|---|---|---|---|---|
|
Ursus maritimus (Polar bear) |
F2/NW_007907185.1 (2099674.. 2099774) | 0 | 0 | 101 |
|
Ursus arctos (Grizzly bear) |
F2/NW_020656153.1 (1273581.. 1273681) | 0 | 0 | 101 |
|
Ursus americanus (American black bear) |
LZNR01006541.1 (2577..2675) | 0 | 0 | 99 |
|
Odobenus rosmarus (Walrus) |
F2/NW_004450361.1 (1452127.. 1452228) | 3 | 4 | 102 |
| NW_004451026.1 (978853.. 979724) | 5 | 5 | 872 | |
|
Physeter catodon (Sperm whale) |
NC_041218.1 (20318453.. 20320,487) | 4 | 5 | 2,035 |
| NC_041216.1 (17373001.. 17373563) | 5 | 4 | 563 | |
|
Microtus ochrogaster (Meadow vole) |
LOC101993482I/NW_004949111.1 (7953849.. 7955477) | 4 | 5 | 1,629 |
|
Salvelinus alpinus (Arctic char) |
NC_036855.1 (58986567.. 58987750) | 5 | 5 | 1,184 |
| NC_036850.1 (14661252.. 14664675) | 5 | 5 | 3,424 |
For all qPCR reactions with polar bear DNA, all standard curves had R2 greater than 0.97. No template negative controls had detectable SYBR® Green fluorescence signal until the end of the 40-cycle qPCR reaction. For all samples used for standard curves, the melt curves had a single peak at 81.5 °C, confirming the amplification of a single PCR product consistent with the agarose gel electrophoresis results.
Some fecal DNA samples (3 of 25 or 12%) had no signal throughout the 40-cycle reaction, indicating low polar bear genomic DNA (not detectable) in these samples. When there were fluorescence signals, qPCR reactions showed a single peak at 81.5 °C on the melt curve.
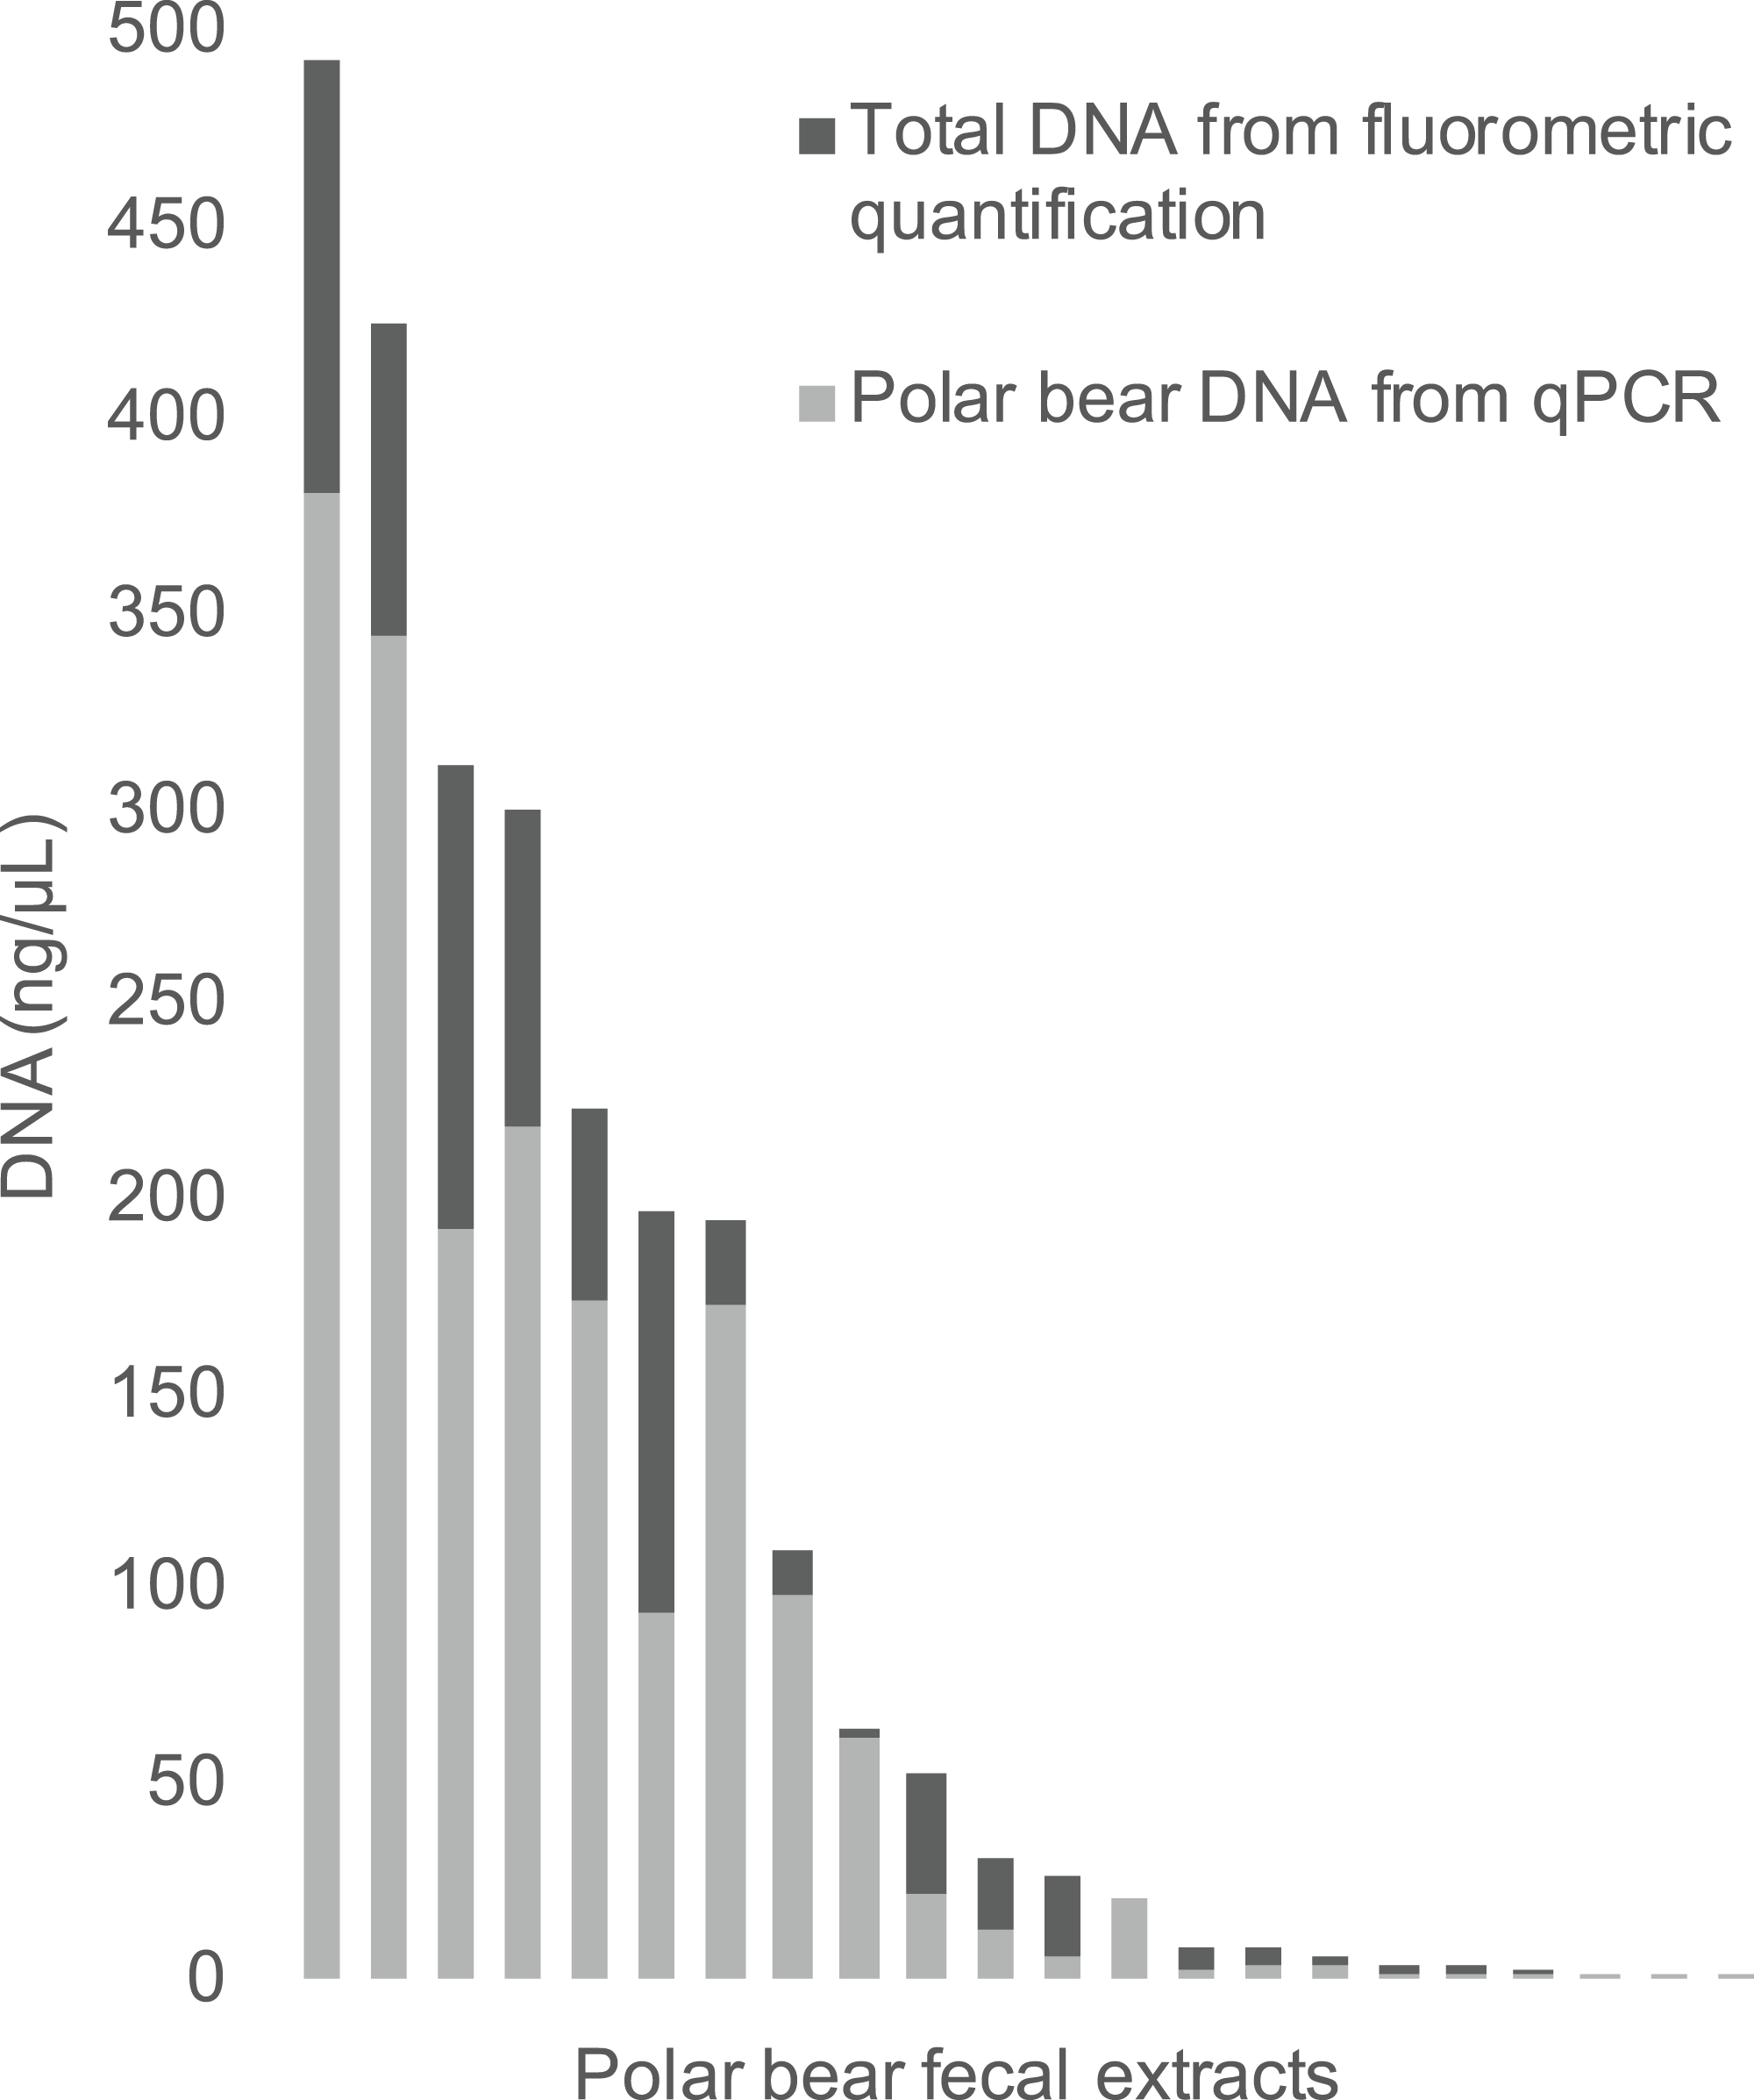
The qPCR results for polar bear DNA extracted from muscle closely matched our expected quantifications based on fluorometry (Fig. 2). The fluorometric quantification of the total DNA in the fecal extracts ranged from 493 to 0.5 ng/µL, while the qPCR quantification of polar bear DNA ranged from 381 to 0.1 ng/µL (Fig. 3). The proportion of polar bear DNA in fecal extractions (i.e., the ratio of polar bear DNA measured in the qPCR to the total DNA from the fluorometric quantification) ranged from 0.02 to 1.02 (mean = 0.5, Standard Deviation = 0.32).
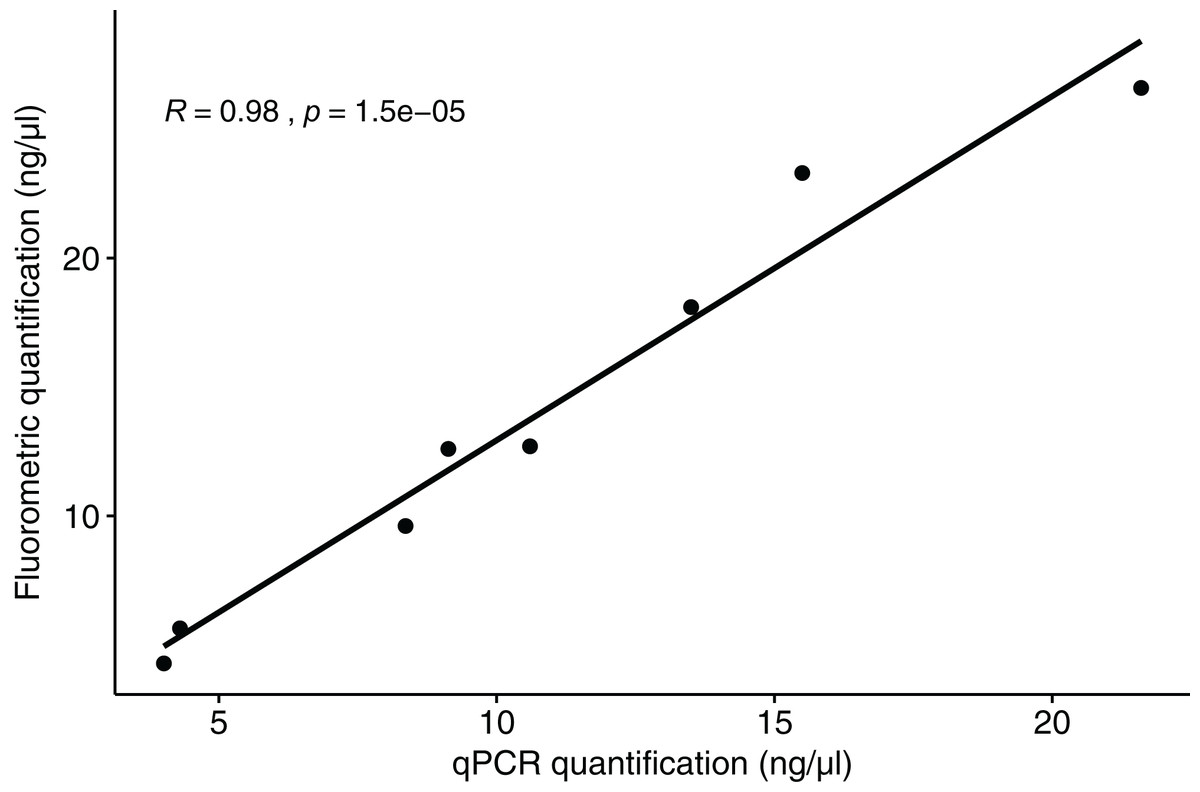
Figure 2: Correlation between the quantification results for polar bear muscle DNA from the qPCR assay and the fluorometric method.
R value is based on a Pearson correlation.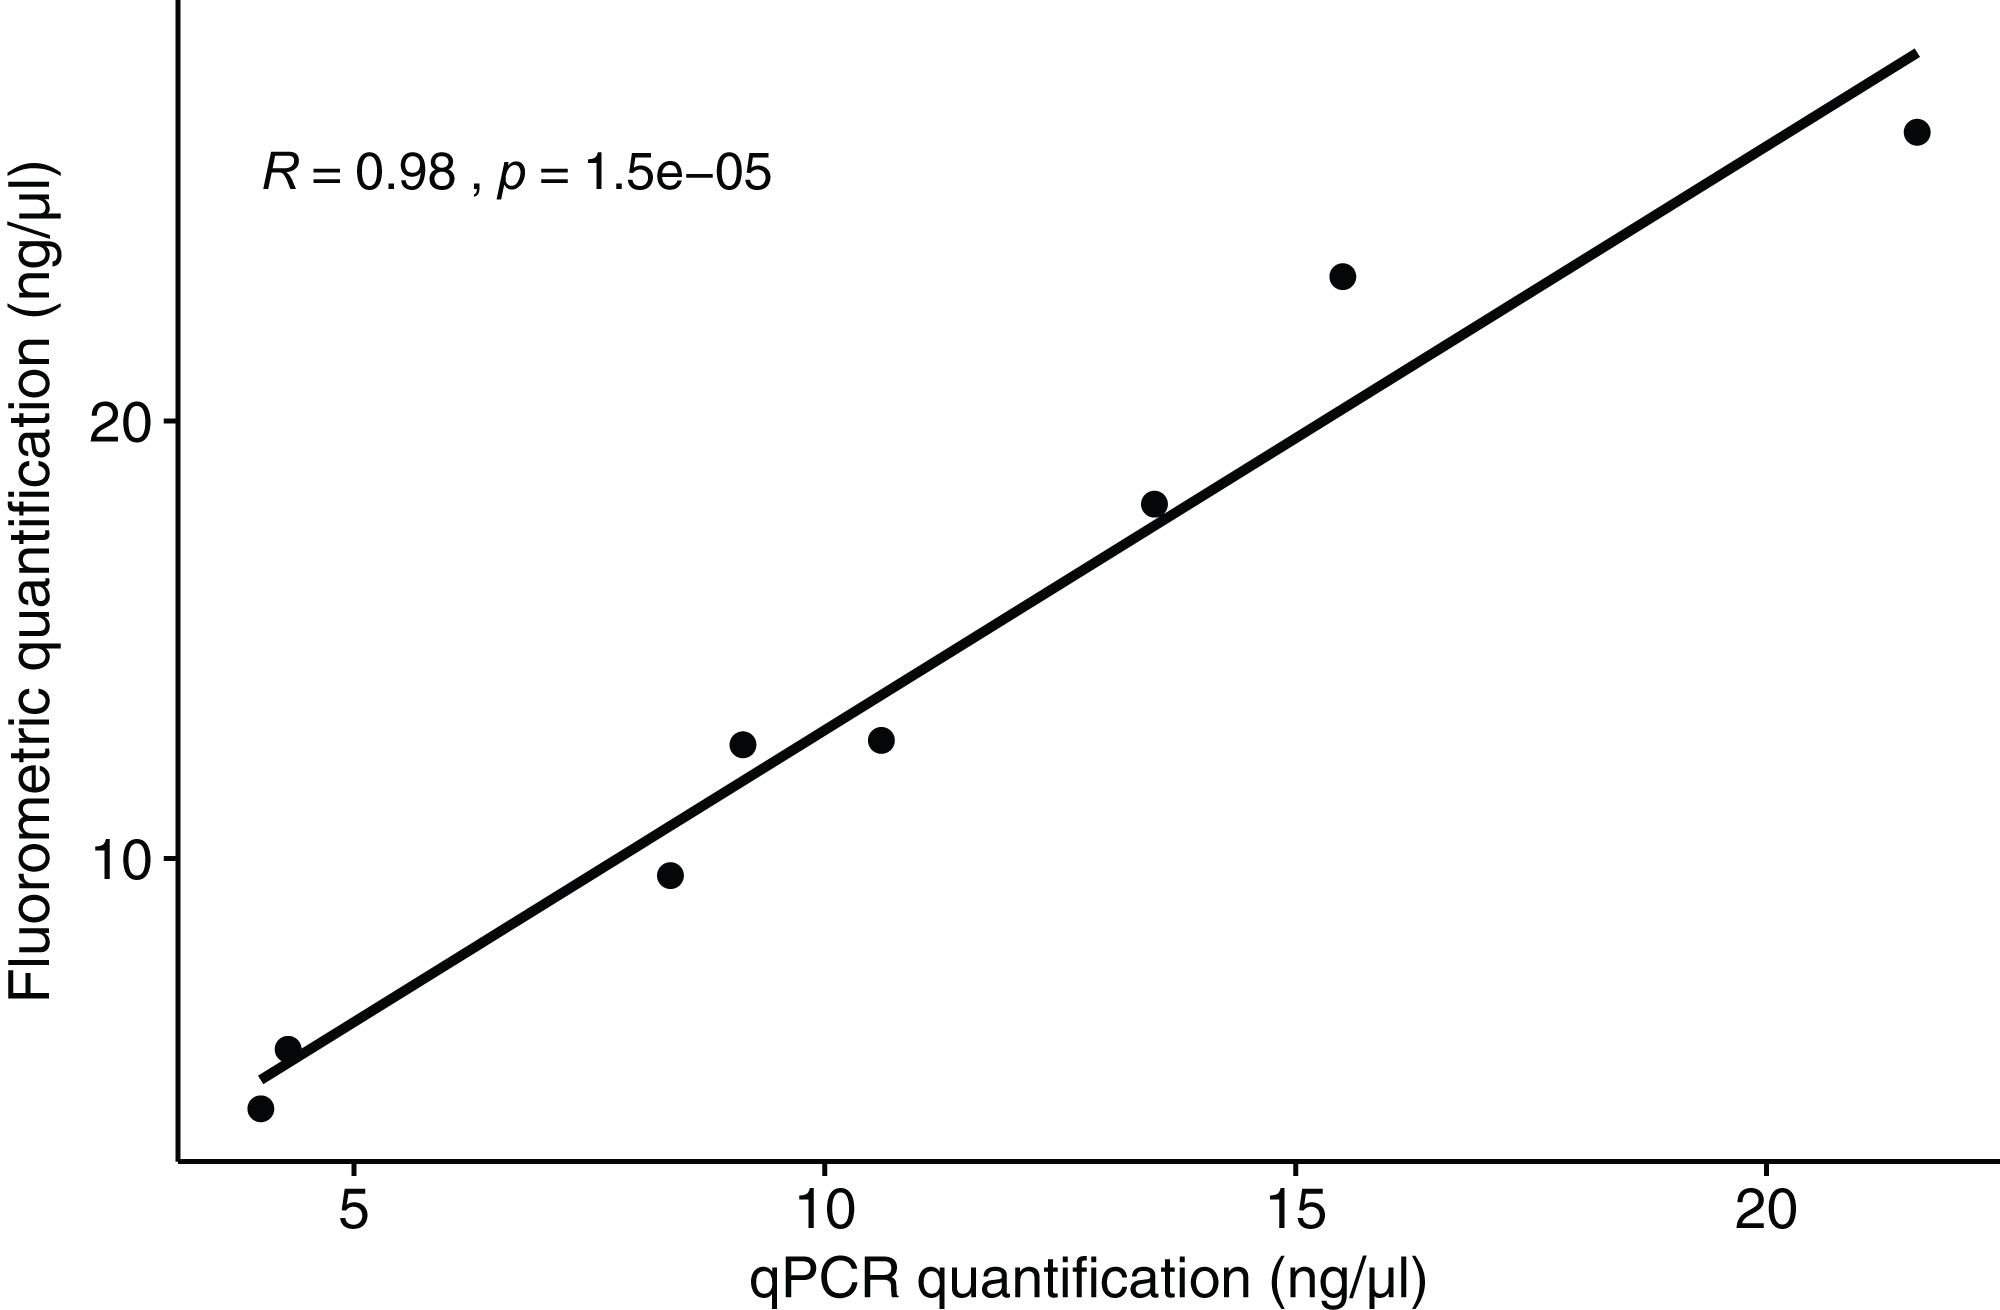

Figure 3: The total DNA in fecal extractions as measured by fluorometry and the portion identified to be polar bear DNA using the qPCR assay.
Discussion
Our goal in developing a qPCR assay was to quantify the amount of polar bear DNA in extractions from fecal samples, so that we can accurately normalize DNA in downstream reactions and identify samples that are unlikely to have enough focal species DNA to yield usable data. The high correlation between the quantifications from qPCR and fluorometry for the polar bear tissue DNA (Fig. 2) demonstrates that the assay does quantify polar bear DNA accurately. We found that the primers will also amplify a similar sized amplicon for grizzly bear DNA and is likely to work similarly for American black bear DNA based on analysis of the genome sequence. These results suggest that the assay may be useful for quantification of DNA from all three species of bear in North American, which are each of conservation and management interest. Despite having slight portions of their ranges overlapping with those of polar bears, grizzly and American black bears demonstrate temporal differences in resource and habitat use (Clark et al., 2019; Miller, Wilder & Wilson, 2015), and thus their feces are not likely to be mistaken for that of polar bears. Even if samples were to be accidentally collected from a non-target species, these would be detected in the downstream NGS genotyping step.
Although the proportion of polar bear DNA detected in the fecal extractions varied widely (Fig. 3), this reflects the heterogeneous nature of feces, which has been an ongoing challenge in molecular scatology. Across a wide range of species diet, meal size, contaminants and sampling conditions all have been shown to influence DNA detectability (Hofreiter et al., 2010; Oehm et al., 2011; Thalinger et al., 2017). Additionally, DNA in fecal samples is typically highly degraded and a robust method for determining DNA quality from these samples is highly sought after, as reflected by the numerous approaches developed to measure DNA quality in various situations (Ayala-Torres et al., 2000; Deagle, Eveson & Jarman, 2006; Mitchell, Willerslev & Hansen, 2005). Our method contributes to these approaches, as we provide a method to directly measure the amount of polar bear DNA in an extraction, allowing for the comparison of various extraction methods to increase the yield of target DNA. It should be noted that in this study we have used feces dissected directly from colons, not droppings collected in the field, which may be why the proportions of DNA are so high for some samples. The qPCR assay developed here will be used as part of a protocol to genotype feces using targeted amplicon sequencing, as part of an effort to develop a new means to assess polar bear demography and population health in near real time across the Canadian Arctic.
This method for quantifying polar bear DNA in fecal samples could readily be adapted for other species. In general, primers targeting intronic regions are more likely to be taxon specific, due to high sequence variability among homologous introns. qPCR works best with amplicons between 100 and 120 bp long, with primers ~20 bp long. Testing the taxon specificity of primers using in silico and in vivo approaches is important, as we demonstrate in this study. Because the sensitivity, detection and quantitation limits will differ across primers, it will also be important to explore these variables to validate any qPCR assay (Bunce, Oskam & Allentoft, 2012).
F2 orthologs have been identified in 120 mammalian species, including humans (Homo sapiens), house mice (Mus musculus), pigs (Sus scrofa), dogs (Canis lupus familiaris) and horses (Equus caballus) (NCBI, 2019). Among these are numerous endangered species, according to the IUCN Red List of Threatened Species, such as Sumatran orangutan (Pongo abelii), Western gorilla (Gorilla gorilla), and Amur tiger (Panthera tigiris altaica) (IUCN, 2019). Field-based scat sampling could thus be coupled with assays similar to ours to allow for accurate and noninvasive sampling techniques to aid in investigating population dynamics related to species conservation. In addition to mammals, 124 other vertebrates have an F2 ortholog identified in their genomes, making a total of 244 taxa (IUCN, 2019). These species span the tree of life and include birds, bony fishes, lizards, turtles, amphibians and cartilaginous fishes. In addition to quantifying target species DNA in fecal extractions, such quantification assays could be used to identify contamination in other sample types, as well as identify the relative proportions of species in mixed samples, such a ground meats (Floren et al., 2015 who used droplet digital PCR) or powdered animal products used in traditional medicine.
Conclusions
In this work we have developed a quantitative PCR assay that can be used to accurately determine the amount of polar bear DNA in a mixed extract, such as that from feces. We tested the species specificity of the assay using both in silico and in vitro approaches and found that the assay will not amplify non-target species likely to be found in the polar bear’s environment, but may work just as well for other North American bear species as it does for polar bears. We have outlined how similar assays could be readily be developed for other target species using orthologs of the F2 gene.