
The complete mitochondrial genome of Flavoperla biocellata Chu, 1929 (Plecoptera: Perlidae) and the phylogenetic analyses of Plecoptera
- Published
- Accepted
- Received
- Academic Editor
- Jia-Yong Zhang
- Subject Areas
- Evolutionary Studies, Genomics
- Keywords
- Flavoperla, Plecoptera, Mitochondrial genome, Phylogeny
- Copyright
- © 2020 Shen and Du
- Licence
- This is an open access article distributed under the terms of the Creative Commons Attribution License, which permits unrestricted use, distribution, reproduction and adaptation in any medium and for any purpose provided that it is properly attributed. For attribution, the original author(s), title, publication source (PeerJ) and either DOI or URL of the article must be cited.
- Cite this article
- 2020. The complete mitochondrial genome of Flavoperla biocellata Chu, 1929 (Plecoptera: Perlidae) and the phylogenetic analyses of Plecoptera. PeerJ 8:e8762 https://doi.org/10.7717/peerj.8762
Abstract
Of the roughly 400 species of Perlidae in the world, most species are widely distributed in the northern hemisphere, but a few can be found in South Africa and South America. There are only five species in the genus Flavoperla of the family Perlidae in China. To gain a better understanding of the architecture and evolution of mitochondrial genome in Flavoperla, the entire mitochondrial genome (mitogenome) of a Chinese Flavoperla biocellata Chu, 1929 from family Perlidae (Insecta: Plecoptera) was sequenced. The 15,805-bp long mitochondrial genome of F. biocellata contained 37 genes, including 13 protein-coding genes (PCGs), 22 transfer RNA genes (tRNAs), two ribosomal RNA genes (rRNAs) and a putative control region (CR). The gene arrangement of F. biocellata was identical with that of other stoneflies and with the fly Drosophila yakuba. Most PCGs of F. biocellata used the standard ATN start codons and complete TAN termination codons. Twenty-one of the 22 tRNA genes exhibited cloverleaf secondary structures, but the dihydrouridine (DHU) arm of trnSer (AGN) was completely reduced. Phylogenetic analyses with both Bayesian inference (BI) and maximum likelihood methods (ML) generated similar topology, both supporting the monophyly of all stonefly families and the infraorder Systellognatha. The phylogenetic analysis based on mitochondrial genomic data from 30 stonefly species recovered a well-supported tree resolving higher-level relationships within Plecoptera. The northern hemisphere suborder Arctoperlaria divided into two groups, Euholognatha and Systellognatha. The southern hemisphere suborder Antarctoperlaria formed two clades: Eustheniidae+Diamphipnoidae and Austroperlidae+ Gripopterygidae; consistent with relationships proposed based on morphology. The final relationships within Plecoptera were recovered as (((Perlidae+(Perlodidae+Chloroperlidae))+(Pteronarcyidae+(Peltoperlidae+Styloperlidae))) +(Taeniopterygidae+(Capniidae+(Nemouridae+Notonemouridae))))+ (Gripopterygoidae+Eusthenioidae).
Introduction
The Plecoptera (stoneflies) is an ancient order of aquatic insects that is an important bioindicator of water quality (William & Felmate, 1992). It is also important for the phylogenetic reconstruction of insects. Plecoptera contains two suborders, Antarctoperlaria and Arctoperlaria, including 16 extant families (Zwick, 1973). However, the phylogenetic relationship among the families of the Plecoptera is still unresolved (Gibson et al., 2004; Cameron, 2014). The area of origin and sister-group of Plecoptera are inconclusive (Zwick, 2009; Yoshizawa, 2011; Simon et al., 2012; Letsch & Simon, 2013; Song et al., 2016). In 2009, Zwick tried to compare the hypotheses concerning the placement of stoneflies based on the morphological evidence, but failed (Zwick, 2009). Most molecular studies support Dermaptera as the sister group of Plecoptera, however, the transcriptome data suggests that Plecoptera may be one of the basal branches of Polyneoptera, and sister to a clade composed of all other orders except Dermaptera and Zoraptera (Ishiwata et al., 2011; Yoshizawa, 2011; Letsch & Simon, 2013; Wu et al., 2014; Song et al., 2016). Low taxon sampling within Plecoptera which reduced the reliability of their proposed phylogenies (Ding et al., 2019). To develop a better understanding of the phylogeny of Plecoptera, we sequenced the mitochondrial genome of F. biocellata, which was the first species sequenced in the genus Flavoperla from the family Perlidae of the Arctoperlaria. There are only five species of Flavoperla in China, and thus the sequence of the mitochondrial genome of F. biocellata will help us understand the architecture and evolution of the genus and will supplement data on the Perlidae. Recently, the number of complete mitochondrial genome sequences available has increased dramatically due to the development of next-generation sequencing technology. But the information on the Perlidae is still limited, with only five complete mitochondrial genomes sequenced, two from Kamimuria, and one each from Togoperla, Dinocras and Acroneuria. Mitochondrial genomes have been used in phylogenetic and evolutionary studies of insects, including the Plecoptera (Chen & Du, 2017a; Chen & Du, 2017b; Chen & Du, 2018; Chen et al., 2018; Wu et al., 2014; Wang, Cao & Li, 2017; Wang et al., 2019). To date, over thirty mitochondrial genomes of Plecoptera have been sequenced and reported, and their nucleotide composition and gene arrangement are highly conserved and identical with that of Drosophila yakuba (Wei & Chen, 2011; Chen & Du, 2015; Chen, Wu & Du, 2016; Chen & Du, 2017a; Chen & Du, 2017b; Chen & Du, 2018; Chen et al., 2018; Huang et al., 2015; Zhou et al., 2016; Wu et al., 2014; Elbrecht et al., 2015; Wang, Ding & Yang, 2016a; Sproul et al., 2015; Wang, Cao & Li, 2017; Wang, Wang & Yang, 2016b; Wang et al., 2019). The mitochondrial genome of Plecoptera has been verified as a double strand circular molecule that is nearly 16 kb in length and contains 13 PCGs, 22 tRNAs, two rRNA and a large non-coding control region, similar to other mitochondrial genomes (Clary & Wolstenholme, 1985; Steinberg & Cedergren, 1994; Gibson et al., 2004; Jia & Higgs, 2007; Cameron, 2014; Chen & Du, 2018; Chen & Du, 2018; Wang et al., 2019). We analyzed the nucleotide compositions of mitochondrial organizations, codon usages, tRNA structures of F. biocellata, and performed phylogenetic analyses of Plecoptera on the strength of the nucleotide sequences of available stonefly mitochondrial genomes.
Materials & Methods
Sample collecting and DNA extraction
Fresh specimens of F. biocellata were collected from Liyang, Jiangsu Province China (31.43∘N, 119.48∘E) in 2018. No endangered or protected species were involved in the study. All the samples were collected by sweeping the trees near streams, and identified using a microscope to identify the samples and were then stored in 100% ethanol and held at −20 °C. Genomic DNA was extracted with the Column mtDNAout kit (Tianda, Beijing, China) from the identified adults and stored at −20 °C for subsequent PCR amplifications.
PCR reaction and DNA sequencing
The mitochondrial genome of F. biocellata was amplified using a similar sequencing strategy to Chen & Du (2018). Firstly, the large and small ribosomal genes (rrnL and rrnS), cox1 and cox2 were amplified using four pairs of newly designed primers. Based on the four obtained sequences, two pairs of LA-PCR primers were designed to amplify two overlapping fragments covering the whole mitochondrial genome (rrnL-cox2 and cox1-rrnS). The remaining gaps were filled with specially designed primers. LA-PCR amplifications were performed with LA Taq DNA polymerase (Takara, Japan) using the following conditions: 2 min of initial denaturation at 93 °C, followed by 40 cycles at 92 °C for 10 s; 30 s of annealing at 54 °C; and 8 min of elongation at 68 °C (20 cycles), which increased 20 s/cycle in the final 20 cycles; and 10 min of final elongation at 68 °C. Table 1 summarizes all primers used in this study. Electrophoresis with 1.0% agarose gels was used to separate the products according to gene size of PCR reactions. Axygen DNA Gel Extraction Kit was used to purify the PCR products. All obtained purified PCR fragments were sequenced using sanger sequencing method by Map Biotech Company (Shanghai, China).
| Primer name | Nucleotide sequence (5′–3′) |
|---|---|
| FL-COI-16S-longF | GGTGTCTCCTCAATTCTAGGGGCAG |
| FL-ND5-3R | TATTTATAGCTGGATTAGGGGCT |
| FL012-1F | CGTAGTGGCTCATTTTCATTATG |
| FL012-1R | TAGCTTTAATTGTAAGTGTCTTGG |
| FL012-2F | AACTATCGGCCATCAATGATAC |
| FL012-2R | CTTCTTATTTGTTCTAGTCAGGCT |
| FL012-3F | TATTTTCCGTATTTGACCCATC |
| FL012-3R | AAATGTTGATCCGTATACAGCAT |
| LCO1490 | GGTCAACAAATCATAAAGATATTGG |
| HCO2198 | TAAACTTCAGGGTGACCAAAAAATCA |
| FL-16S-COI-longF | CTTGTCCAACCATTCATACCAGCC |
| FL-CO1-1R | CACTAATCAATTTCCAAACCCTC |
| FL033-1F | CAATACAATAACTCCTTCACTATAAAAT |
| FL033-1R | TAACTCATTTAGGGAGAAACCC |
| FL033-2F | AAATAATAGGGTATCTAATCCTAGTTT |
| FL033-2R | CTTGGTACACTGAAAATTAAGGCTG |
| FL033-3F | GTCCTTAATAGTTAAAGTTTATTGGC |
| FL033-3R | GATGGTACTCAAAAAGCATCTTC |
| 16S-L(16SarL) | CGCCTGTTTATCAAAAACAT |
| 16S-H(16SbrH) | CCGGTCTGAACTCAGATCACGT |
| FL-CB-1F | TGCTGCAGTCTTAGTTCACCTTC |
| FL-COI-16S-longR | CGCTGGGTGCATTATTTTATTGGG |
| FL014-1F | AAGGTAAAAATCTCTTTCACGC |
| FL-ND5-3F | ACCATCTCAACCCAATAAGATTC |
| FL-CB-1R | AAAGGATTGGCTGGAGTAAAATTAT |
| FL009-1F | AATAAAAACCACCATAAAGTTATTCT |
| FL009-1R | CATGAGCGGTGTAATGTATAGC |
| FL009-2F | TAAAACAGAAACAAATTTATTGAACT |
| FL-ND5-2F | TTGAGAATCCTTTATATTATGAATAATAGC |
| FL-ND5-1R | ATGATTTAGTGTATTTTATTGAATGGG |
Mitochondrial genome annotation
The mitochondrial genome was assembled with CodonCode Aligner (http://www.codoncode.com/aligner/). BioEdit was used to align all used mitochondrial genomes. Alignment with other published Plecoptera mitochondrial genomes were performed to identify the PCGs and rRNAs. ORF finder was used to examine the boundaries of the PCGs. The mitochondrial genome map was depicted by CGView (http://stothard.afns.ualberta.ca/cgview_server/). ARWEN (http://mbio-serv2.mbioekol.lu.se/ARWEN/) was used to detect the tRNAs and show their secondary structures. MEGA v. 6.0 was used to calculate the nucleotide composition. Composition skew values were obtained with AT-skew = [A–T]/[A+T] and GC-skew = [G–C]/[G+C]. The mitochondrial genome sequence of F. biocellata was added to GenBank under accession number MK905206.
Phylogenetic reconstructions
In this study, 30 stonefly mitochondrial genomes were used for the phylogenetic analyses; the outgroup was the mayfly Parafronurus youi (Insecta Ephemeroptera) whose GenBank accession number is EU349015 (Table 2). MAFFT was used to align the amino acid sequences of the 13PCGs and concatenate them excluding the stop codons (Vaidya, Lohman & Meier, 2010; Katoh & Standley, 2013). PartitionFinder v.2.1.1 with BIC (Bayesian Information Criterion) was used to determine the best nucleotide substitution models (GTR+I+G) and the best partitioning schemes (partition by gene types) using a greedy search algorithm with unlinked branch lengths (Lanfear et al., 2016). BI analysis (Bayesian inferences) was conducted with MrBayes v.3.2.6, conditions are as follows: 20 million generations of runs sampled every 1,000 generations; four chains (three hot chains and one cold chain) with a burn-in of 25% trees (Ronquist & Huelsenbeck, 2003). Tracer v.1.5 was used to examine the stationarity of all runs (ESS > 200). Maximum likelihood (ML) analysis was performed using RAxML v.8 and had 1,000 bootstrap replicates (Stamatakis, 2014). FigTree v.1.4.2 was used to visualized all phylogenetic trees.
| Family | Species | Accessionnumber | Size(bp) |
|---|---|---|---|
| Perlidae | Kamimuria wangi | KC894944 | 16,179 |
| Kamimuria chungnanshana | KT186102 | 15,943 | |
| Togoperla sp. | KM409708 | 15,723 | |
| Dinocras cephalotes | KF484757 | 15,666 | |
| Acroneuria hainana | KM199685 | 15,804 | |
| Flavoperla biocellata Chu, 1929 | MK905206 | 15,805 | |
| Perlodidae | Isoperla bilineata | MF716959 | 15,048 |
| Isoperla eximia | MG910457 | 16,034 | |
| Pseudomegarcys japonica | MG910458 | 16,067 | |
| Perlodes sp. | MF197377 | 16,039 | |
| Chloroperlidae | Sweltsa longistyla | KM216826 | 16,151 |
| Suwallia teleckojensis | MF198253 | 16,146 | |
| Pteronarcyidae | Pteronarcella badia | KU182360 | 15,586 |
| Peltoperlidae | Cryptoperla sp. | KC952026 | 15,633 |
| Soliperla sp. | MF716958 | 15,877 | |
| Styloperlidae | Styloperla spinicercia | KX845569 | 16,129 |
| Styloperla sp. | KR088971 | 15,416 | |
| Capniidae | Mesocapnia arizonensis | KP642637 | 14,921 |
| Apteroperla tikumana | KR604721 | 15,564 | |
| Capnia zijinshana | KX094942 | 16,310 | |
| Nemouridae | Nemoura nankinensis | KY940360 | 16,602 |
| Taeniopterygidae | Doddsia occidentalis | MG589787 | 16,020 |
| Taeniopteryx ugola | MG589786 | 15,353 | |
| Gripopterygidae | Zelandoperla fenestrata | KY522907 | 16,385 |
| Antarctoperla michaelseni | MK111413 | 16,069 | |
| Austroperlidae | Klapopteryx armillata | MK111414 | 14,870 |
| Eustheniidae | Neuroperla schedingi | MK111415 | 16,882 |
| Diamphipnoidae | Diamphipnoa annulata | MK111416 | 14,882 |
| Diamphipnopsis sp. | MK111417 | 16,714 | |
| Notonemouridae | Neonemura barrosi | MK111418 | 14,852 |
Results
Mitochondrial genome structure and nucleotide composition
The F. biocellata mitochondrial genome was a double strand circular 15,805 bp molecule. The typical set of 37 genes was identified along with a 852 bp-long control region, of the total, 23 genes were found on the J-strand (majority strand) and 14 genes were on the N-strand (minority strand) (Fig. 1, Table 3). Altogether 54 overlapping nucleotides were found in 14 gene pairs, and their length ranged from 1 to 17 bp (Table 3). There were 84 intergenic nucleotides (IGNs) dispersed in 13 gene gaps; and the longest IGN was located between 16s (rrnL) and trnVal and was 28 bp long, similar to other stoneflies. In F. biocellata, the whole mitochondrial genomes, the PCGs, tRNAs and rRNAs have very similar A+T contents:67.2%, 66.4%, 70.4%, and 70.6%, respectively (Table 3). A+T content of the 37 genes ranged from 53.0% in trnTyr to 83.6% in trnGlu (Table 3). The mitochondrial genome of F. biocellata has a positive AT-skew value and negative GC-skew value, biased for the A and C nucleotides.
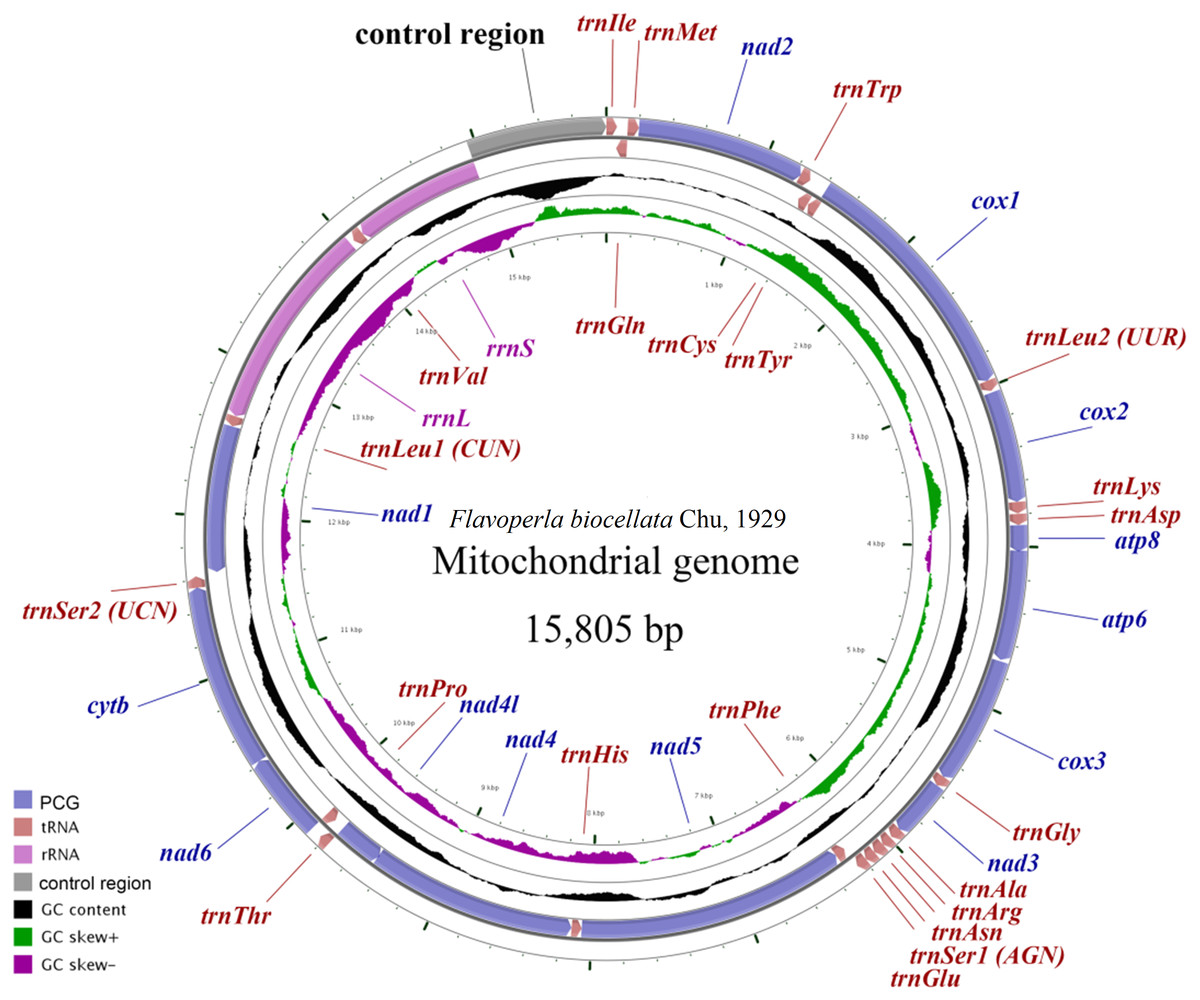
Figure 1: Mitochondrial maps of Flavoperla biocellata Chu, 1929.
Genes outside the map are transcribed clockwise, whereas those inside the map are transcribed counterclockwise. The inside circles show the GC content and the GC skew. GC content and GC skew are plotted as the deviation from the average value of the entire sequence.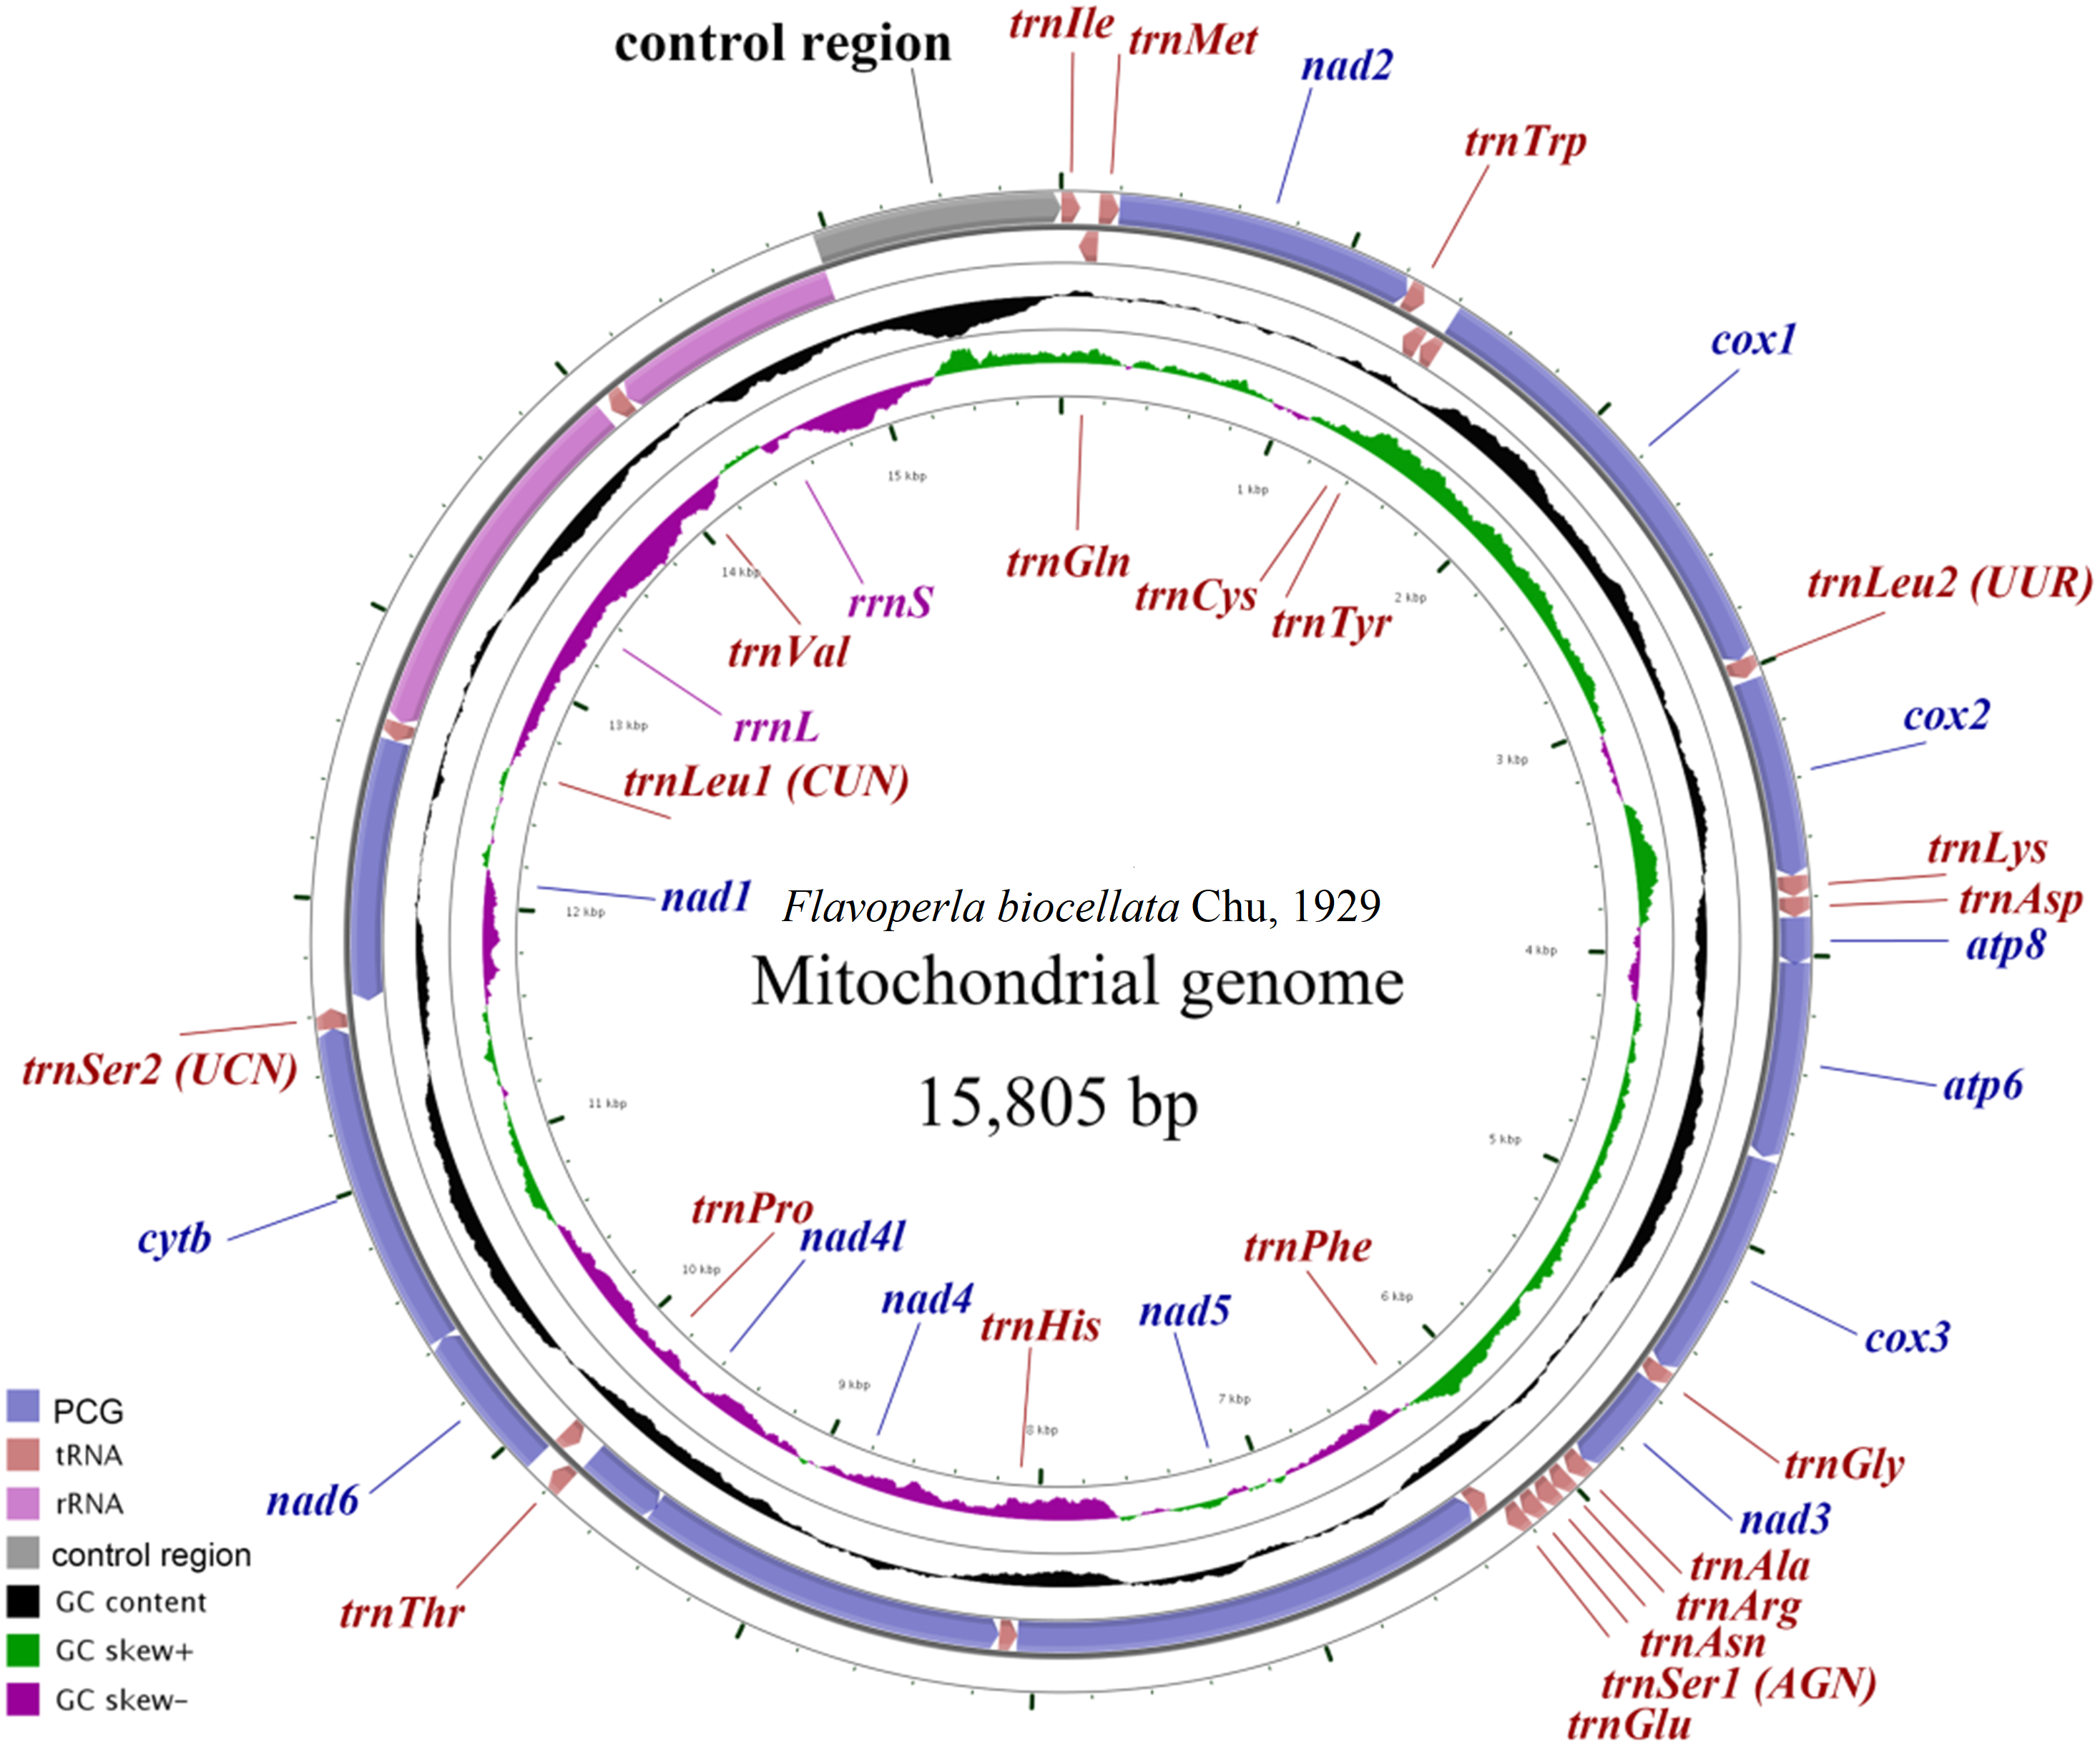
| Gene | Position (bp) | Size (bp) | Direction | Intergenic Nucleotides (IGN) | Anti or Start/ StopCodons | A+T% |
|---|---|---|---|---|---|---|
| trnIle(I) | 1–65 | 65 | Forward | 0 | GAT | 67.7 |
| trnGln(Q) | 63–131 | 69 | Reverse | −3 | TTG | 71.0 |
| trnMet(M) | 131–199 | 69 | Forward | −1 | CAT | 66.7 |
| nad2 | 200–1234 | 1,035 | Forward | 0 | ATG/TAA | 66.7 |
| trnTrp(W) | 1,233–1,300 | 68 | Forward | −2 | TCA | 70.6 |
| trnCys(C) | 1,293–1,360 | 68 | Reverse | −8 | GCA | 72.1 |
| trnTyr(Y) | 1,365–1,430 | 66 | Reverse | 4 | GTA | 53.0 |
| cox1 | 1,414–2,963 | 1,550 | Forward | −17 | ATC/TT- | 61.1 |
| trnLeu2(UUR) | 2,963–3,028 | 66 | Forward | −1 | TAA | 68.2 |
| cox2 | 3,039–3,726 | 688 | Forward | 10 | ATG/T– | 63.5 |
| trnLys(K) | 3,727–3,797 | 71 | Forward | 0 | CTT | 63.4 |
| trnAsp(D) | 3,800–3,868 | 69 | Forward | 2 | GTC | 81.2 |
| atp8 | 3,869–4,030 | 162 | Forward | 0 | ATT/TAA | 72.8 |
| atp6 | 4,024–4,701 | 678 | Forward | −7 | ATG/TAA | 65.3 |
| cox3 | 4,711–5,499 | 789 | Forward | 9 | ATG/TAA | 62.1 |
| trnGly(G) | 5,499–5,564 | 66 | Forward | −1 | TCC | 80.3 |
| nad3 | 5,565–5,918 | 354 | Forward | 0 | ATT/TAG | 65.5 |
| trnAla(A) | 5,917–5,984 | 68 | Forward | −2 | TGC | 69.1 |
| trnArg(R) | 5,992–6,055 | 64 | Forward | 7 | TCG | 68.8 |
| trnAsn(N) | 6,055–6,124 | 70 | Forward | −1 | GTT | 67.1 |
| trnSer1(AGN) | 6,125–6,191 | 67 | Forward | 0 | GCT | 61.2 |
| trnGlu(E) | 6,192–6,258 | 67 | Forward | 0 | TTC | 83.6 |
| trnPhe(F) | 6,258–6,325 | 68 | Reverse | −1 | GAA | 70.6. |
| nad5 | 6,326–8,062 | 1,737 | Reverse | 0 | GTG/TAA | 68.3 |
| trnHis(H) | 8,063–8,127 | 65 | Reverse | 0 | GTG | 73.8 |
| nad4 | 8,129–9,469 | 1,341 | Reverse | 1 | ATG/TAA | 68.5 |
| nad4l | 9,463–9,759 | 297 | Reverse | −7 | ATG/TAA | 73.1 |
| trnThr(T) | 9,762–9,828 | 67 | Forward | 2 | TGT | 73.1 |
| trnPro(P) | 9,830–9,897 | 68 | Reverse | 1 | TGG | 73.5 |
| nad6 | 9899–10,423 | 525 | Forward | 1 | ATT/TAA | 65.1 |
| Cytb | 10,423–11,556 | 1,134 | Forward | −1 | ATG/TAG | 62.2 |
| trnSer2(UCN) | 11,555–11,624 | 70 | Forward | −2 | TGA | 77.1 |
| nad1 | 11,641–12,588 | 948 | Reverse | 16 | TTG/TAG | 68.5 |
| trnLeu1(CUN) | 12,590–12,656 | 67 | Reverse | 1 | TAG | 71.6 |
| rrnL | 12,659–14,009 | 1,351 | Reverse | 2 | 70.0 | |
| trnVal(V) | 14,038–14,109 | 72 | Reverse | 28 | TAC | 65.3 |
| rrnS | 14,110–14,953 | 844 | Reverse | 0 | 71.1 | |
| CR | 14,954–15,805 | 852 | 0 | 73.2 |
PCG, tRNA and rRNA genes
When compared with other stoneflies, each PCG of F. biocellata had a similar A+T content and length (Table 3). Eleven PCGs began with the standard start codon ATN (or ATT or ATG), however, for nad5 GTG was the start codon, while for nad1 it was TTG. Eleven PCGs of the mitochondrial genome had complete termination codons (TAA or TAG), but cox1, cox2 terminated with an incomplete stop codon T. The RSCU (relative synonymous codon usage) value was calculated for F. biocellata, suggesting that the most frequently used codon was TTA (Leu), while CGC (Arg) was the least often used codon (Fig. 2, Table 4).
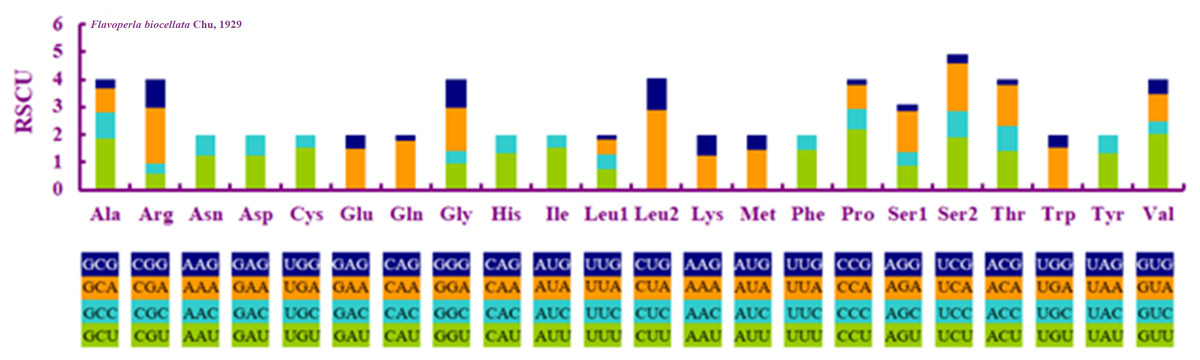
Figure 2: Relative synonymous codon usage (RSCU) in Flavoperla biocellata Chu, 1929.
Codon families are indicated below the X-axis.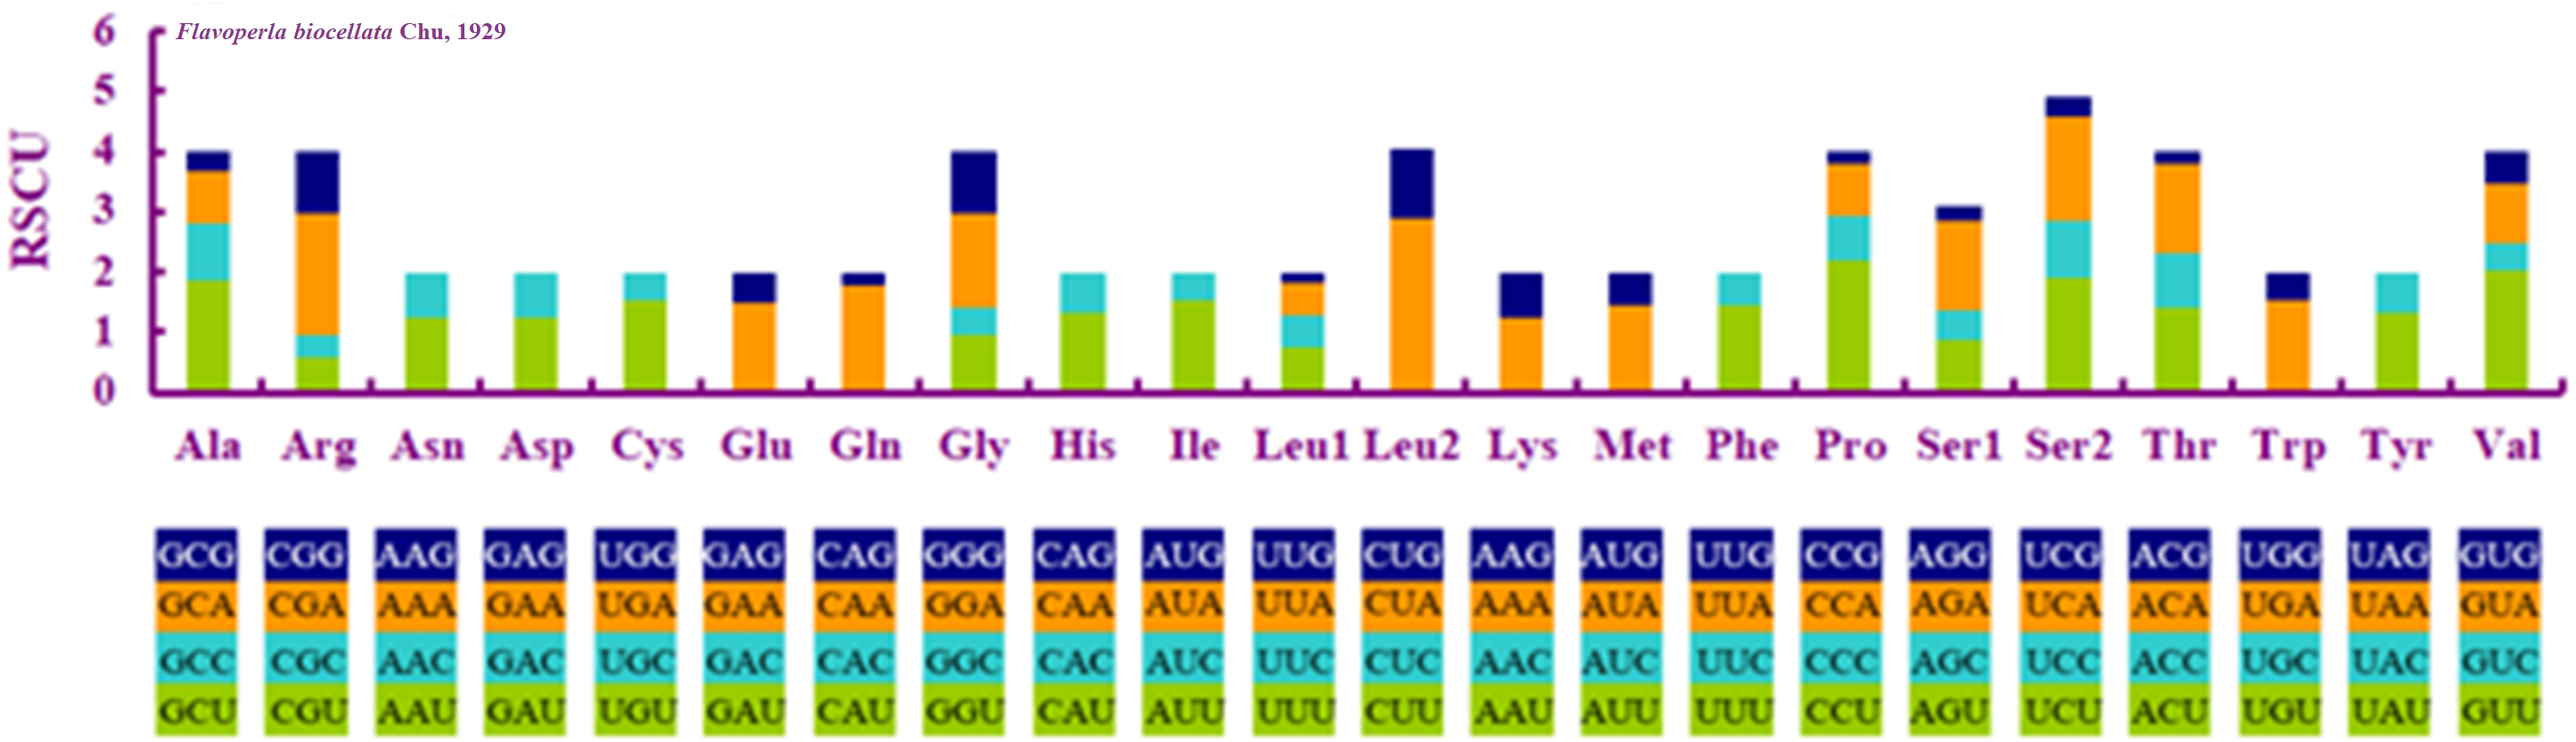
| Codon | Count | RSCU | Codon | Count | RSCU | Codon | Count | RSCU | Codon | Count | RSCU |
|---|---|---|---|---|---|---|---|---|---|---|---|
| UUU(F) | 238 | 1.47 | UCU(S) | 83 | 1.9 | UAU(Y) | 93 | 1.32 | UGU(C) | 35 | 1.52 |
| UUC(F) | 86 | 0.53 | UCC(S) | 41 | 0.94 | UAC(Y) | 48 | 0.68 | UGC(C) | 11 | 0.48 |
| UUA(L) | 301 | 2.88 | UCA(S) | 75 | 1.72 | UAA(*) | 0 | 0 | UGA(W) | 83 | 1.55 |
| UUG(L) | 121 | 1.16 | UCG(S) | 15 | 0.34 | UAG(*) | 0 | 0 | UGG(W) | 24 | 0.45 |
| CUU(L) | 79 | 0.76 | CCU(P) | 80 | 2.21 | CAU(H) | 53 | 1.31 | CGU(R) | 9 | 0.57 |
| CUC(L) | 55 | 0.53 | CCC(P) | 27 | 0.74 | CAC(H) | 28 | 0.69 | CGC(R) | 6 | 0.38 |
| CUA(L) | 55 | 0.53 | CCA(P) | 30 | 0.83 | CAA(Q) | 68 | 1.79 | CGA(R) | 32 | 2.03 |
| CUG(L) | 16 | 0.15 | CCG(P) | 8 | 0.22 | CAG(Q) | 8 | 0.21 | CGG(R) | 16 | 1.02 |
| AUU(I) | 216 | 1.52 | ACU(T) | 72 | 1.41 | AAU(N) | 99 | 1.25 | AGU(S) | 39 | 0.89 |
| AUC(I) | 69 | 0.48 | ACC(T) | 47 | 0.92 | AAC(N) | 59 | 0.75 | AGC(S) | 21 | 0.48 |
| AUA(M) | 138 | 1.46 | ACA(T) | 74 | 1.45 | AAA(K) | 54 | 1.23 | AGA(S) | 65 | 1.49 |
| AUG(M) | 51 | 0.54 | ACG(T) | 11 | 0.22 | AAG(K) | 34 | 0.77 | AGG(S) | 10 | 0.23 |
| GUU(V) | 127 | 2.03 | GCU(A) | 97 | 1.87 | GAU(D) | 43 | 1.25 | GGU(G) | 59 | 0.96 |
| GUC(V) | 27 | 0.43 | GCC(A) | 48 | 0.92 | GAC(D) | 26 | 0.75 | GGC(G) | 28 | 0.46 |
| GUA(V) | 63 | 1.01 | GCA(A) | 46 | 0.88 | GAA(E) | 59 | 1.49 | GGA(G) | 96 | 1.57 |
| GUG(V) | 33 | 0.53 | GCG(A) | 17 | 0.33 | GAG(E) | 20 | 0.51 | GGG(G) | 62 | 1.01 |
The F. biocellata mitochondrial genome had 22 tRNA genes, these tRNA genes were a total of 1,490 bp long with an average A+T content of 70.4% (similar to that in other stoneflies). Each tRNA gene ranged from 64 to 72 bp. Most tRNAs of F. biocellata had a typical cloverleaf secondary structure (Fig. 3), however, the dihydrouridine (DHU) arm of trnSer (AGN) was reduced to a small loop. Anticodons of all tRNAs in F. biocellata were identical with other species in Plecoptera. Thirty-three mismatched base pairs were detected in the tRNAs of F. biocellata, all of which were G-U pairs (Fig. 3). Two rRNAs in F. biocellata had a total length of 2,195 bp and an A+T content of 70.6%. The large ribosomal RNA gene (rrnL) was 1,351 bp with an A+T content of 70%, the small ribosomal gene (rrnS) was 844 bp long, with an A+T content of 71.1% (Table 3).
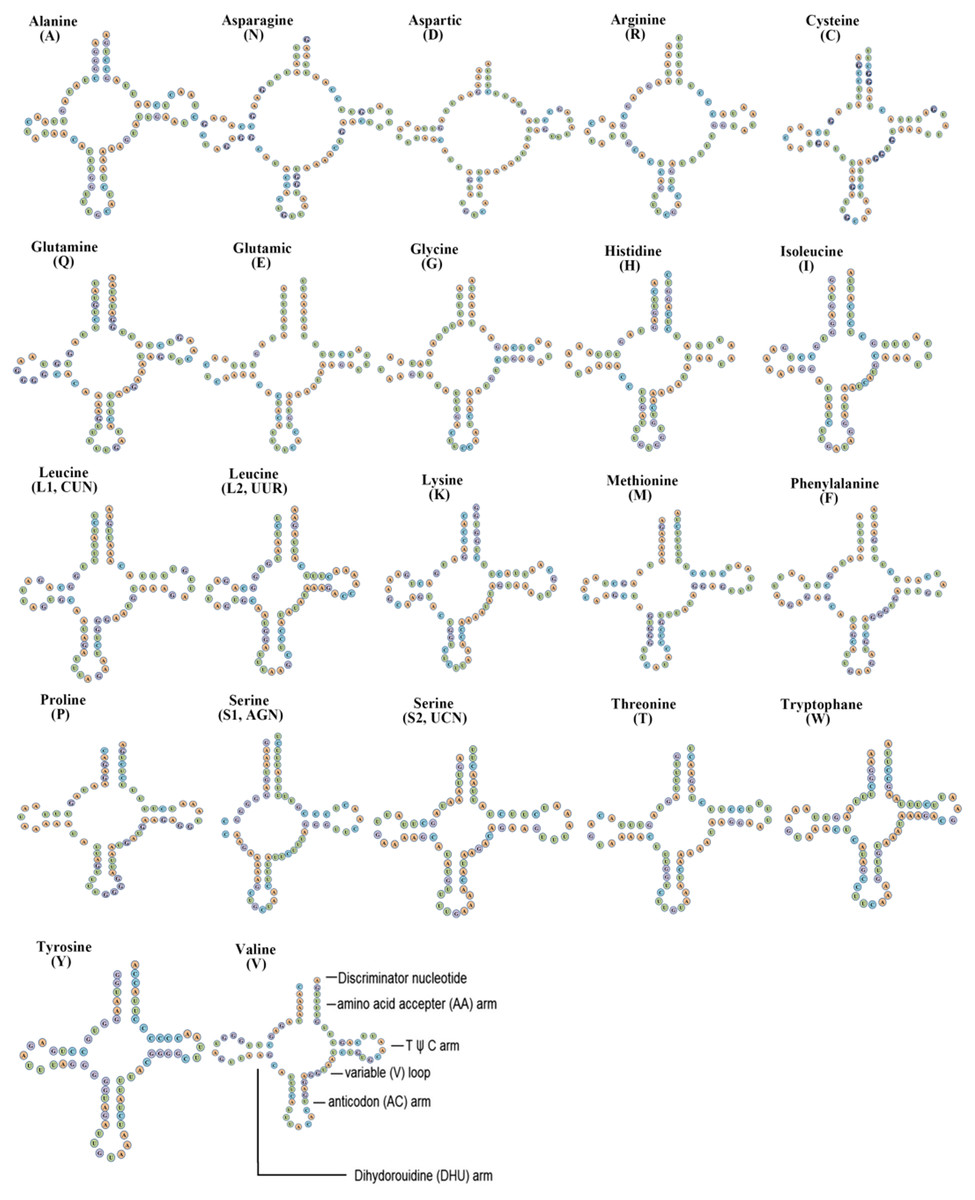
Figure 3: Inferred secondary structures of tRNAs from Flavoperla biocellata Chu, 1929.
The tRNAs are labelled with their corresponding amino acids. Structural elements in tRNA arms and loops are illustrated as for trnV.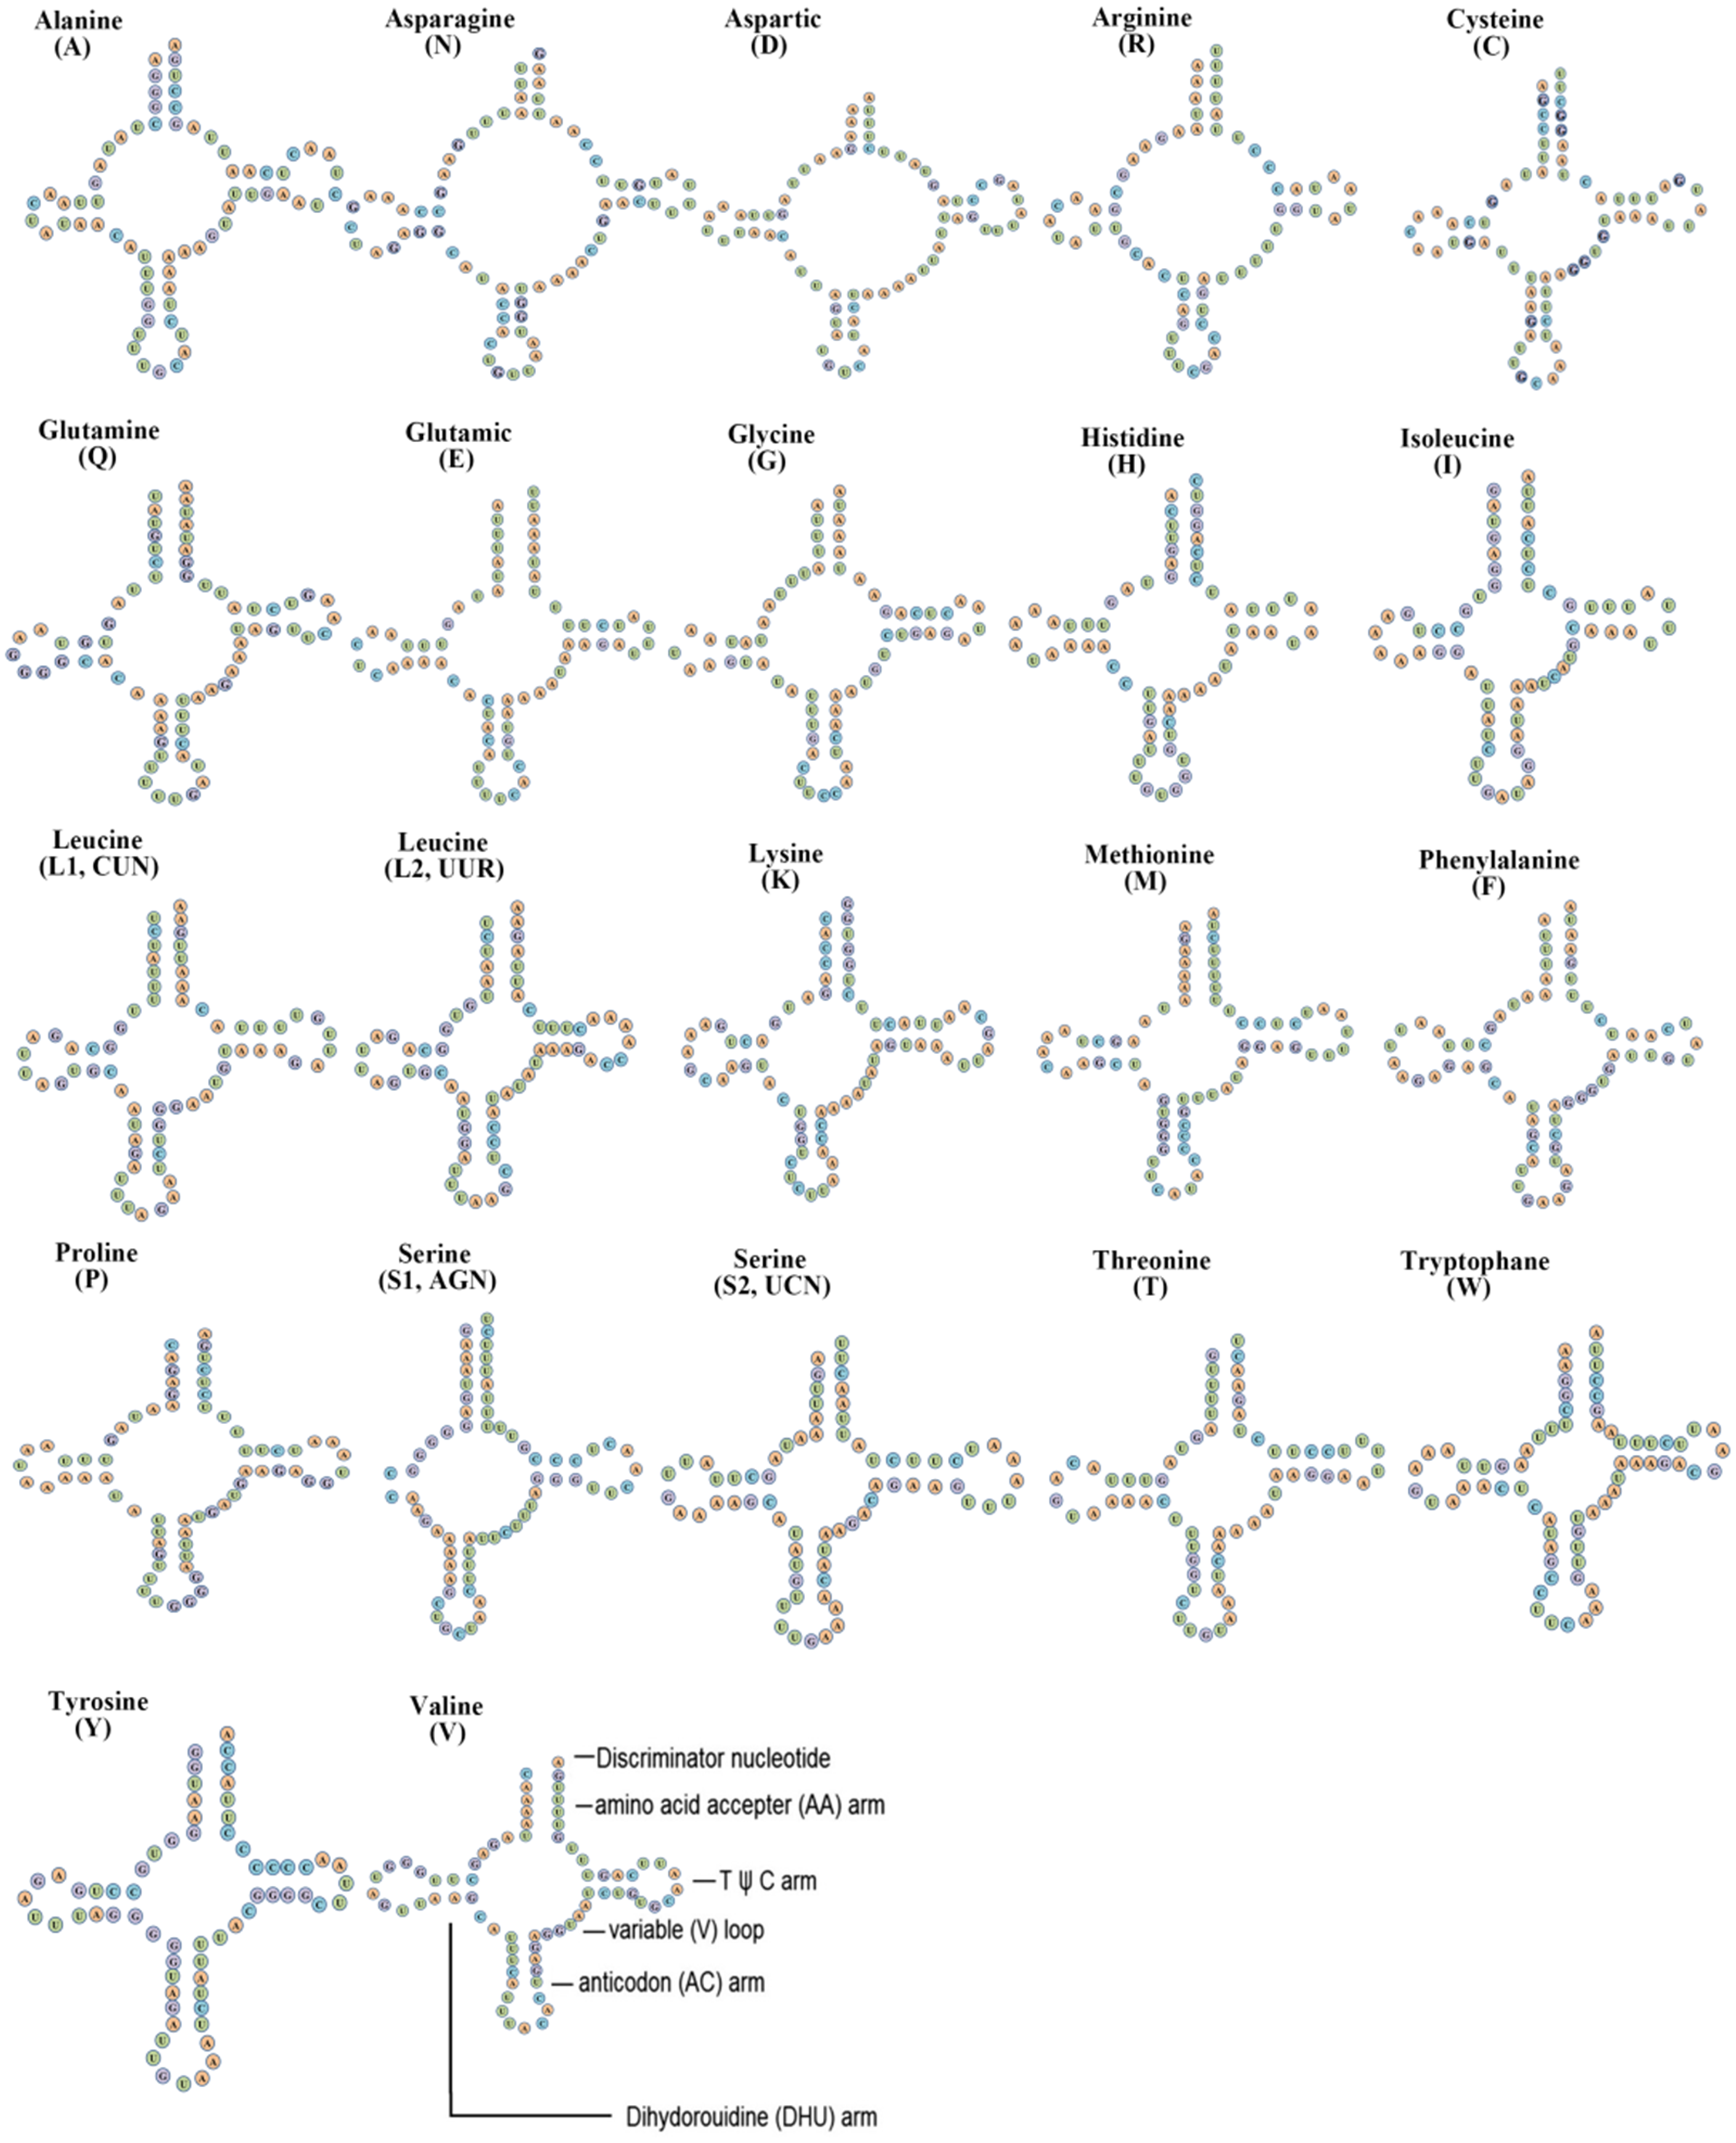
The control region
In the mitochondrial genome of insects, the most variable region is the control region, which is difficult to sequence because of its complicated secondary structures. The control region of F. biocellata was 852-bp long with an A+T content of 73.2%. All stoneflies have the conserved control region and the location was between rrnS and trnIle (Fig. 1).
Phylogenetic analyses
Based on the concatenated sequences of 13 PCGs from 30 stonefly mitochondrial genomes, we reconstructed the phylogenetic relationship of Plecoptera; using the mayfly species Parafronurus youi as the outgroup. BI and ML were used to generate two phylogenetic trees which have generally identical topological structures (Figs. 4 and 5). In both analyses, the monophyly of each family is highly supported. The monophyly of suborders Antarctoperlaria and Arctoperlaria were consistently recovered in both trees. The phylogeny within Antarctoperlaria shows two superfamilies: Eusthenioidea (including Eustheniidae and Diamphipnoidae) and Gripopterygoidea (including Austroperlidae and Gripopterygidae), which is consistent with the study of Ding et al. (2019). In the suborder Arctoperlidae, the sister-group relationship between Nemouridae and Notonemouridae were consistently supported. In Systelognatha, the superfamily Perloidea is monophyletic; and the Perlodidae and Chloroperlidae are sister groups, which is congruent with recent studies (Chen & Du, 2018; Wang et al., 2019). The superfamily Pteronarcyoidea is monophyletic, with Styloperlidae being the sister group to the Peltoperlidae.
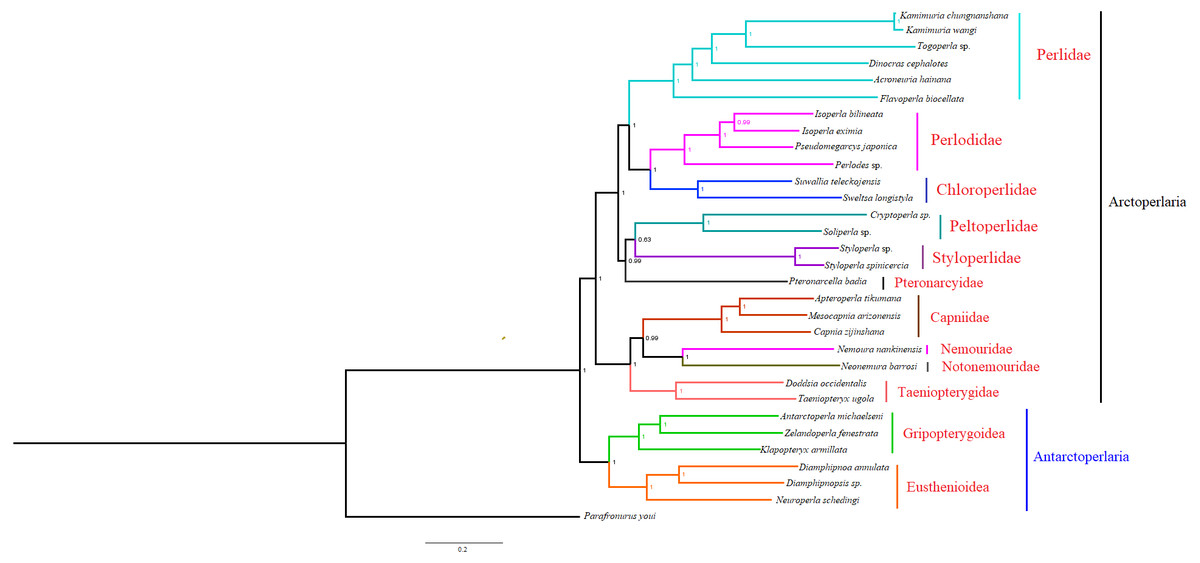
Figure 4: Phylogenetic relationships among stoneflies inferred by Bayesian inference.
Numbers at the nodes are posterior probabilities. The family names are listed after the species.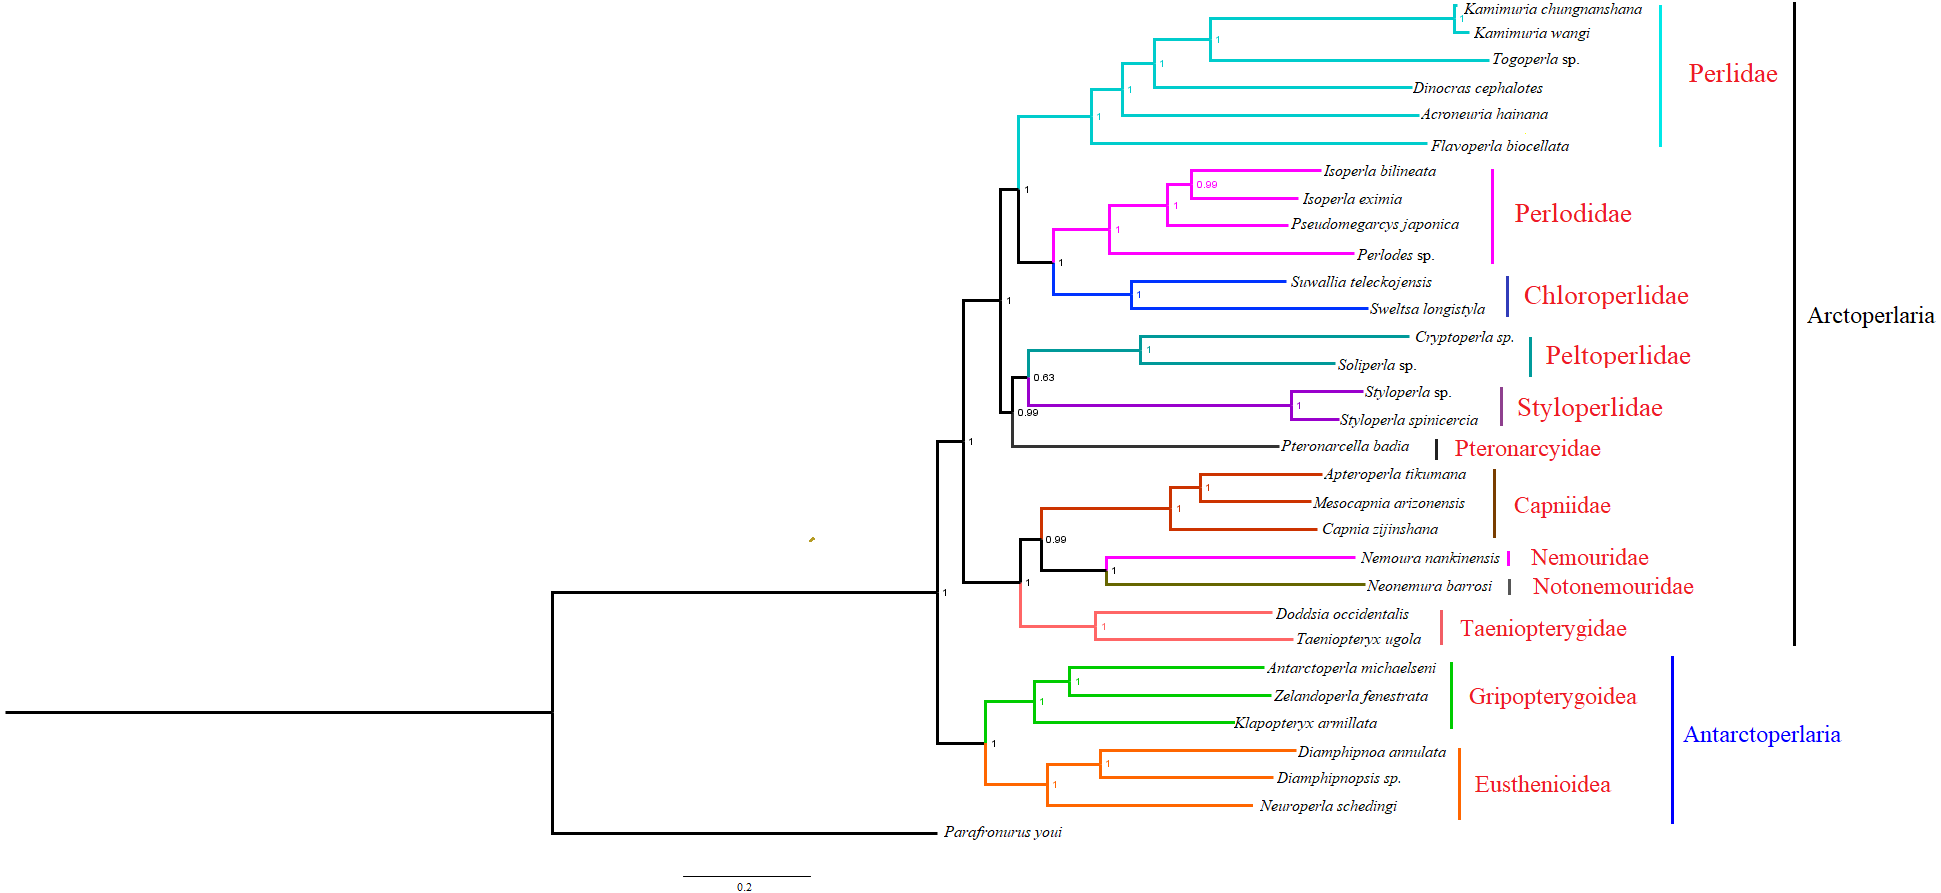
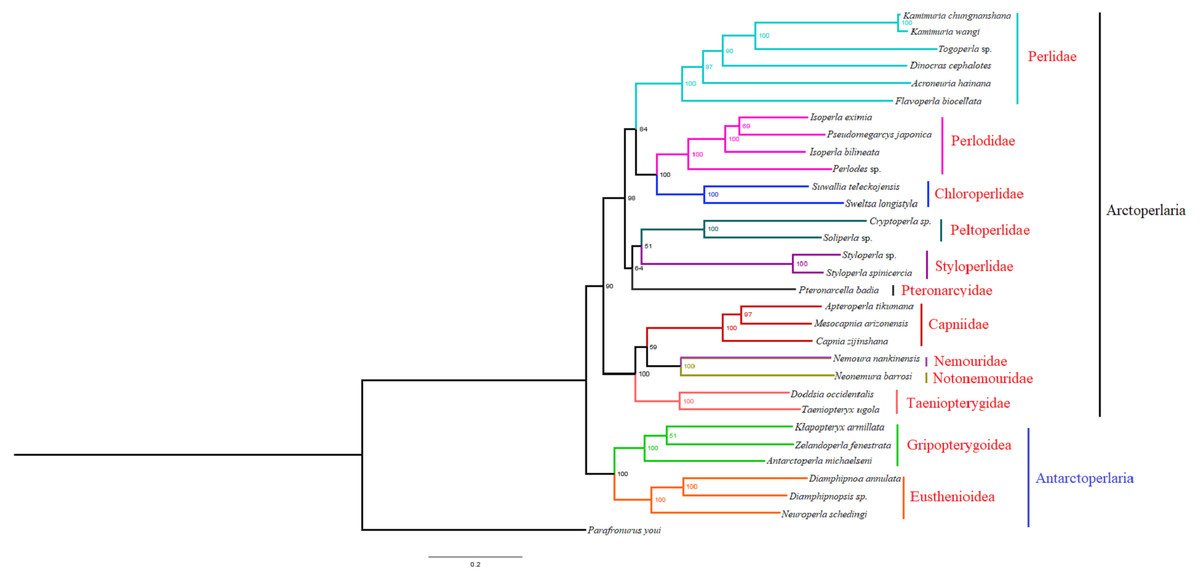
Figure 5: Phylogenetic relationships among stoneflies inferred by maximum likelihood analysis.
Numbers at the nodes are bootstrap values. Family names are shown after the species.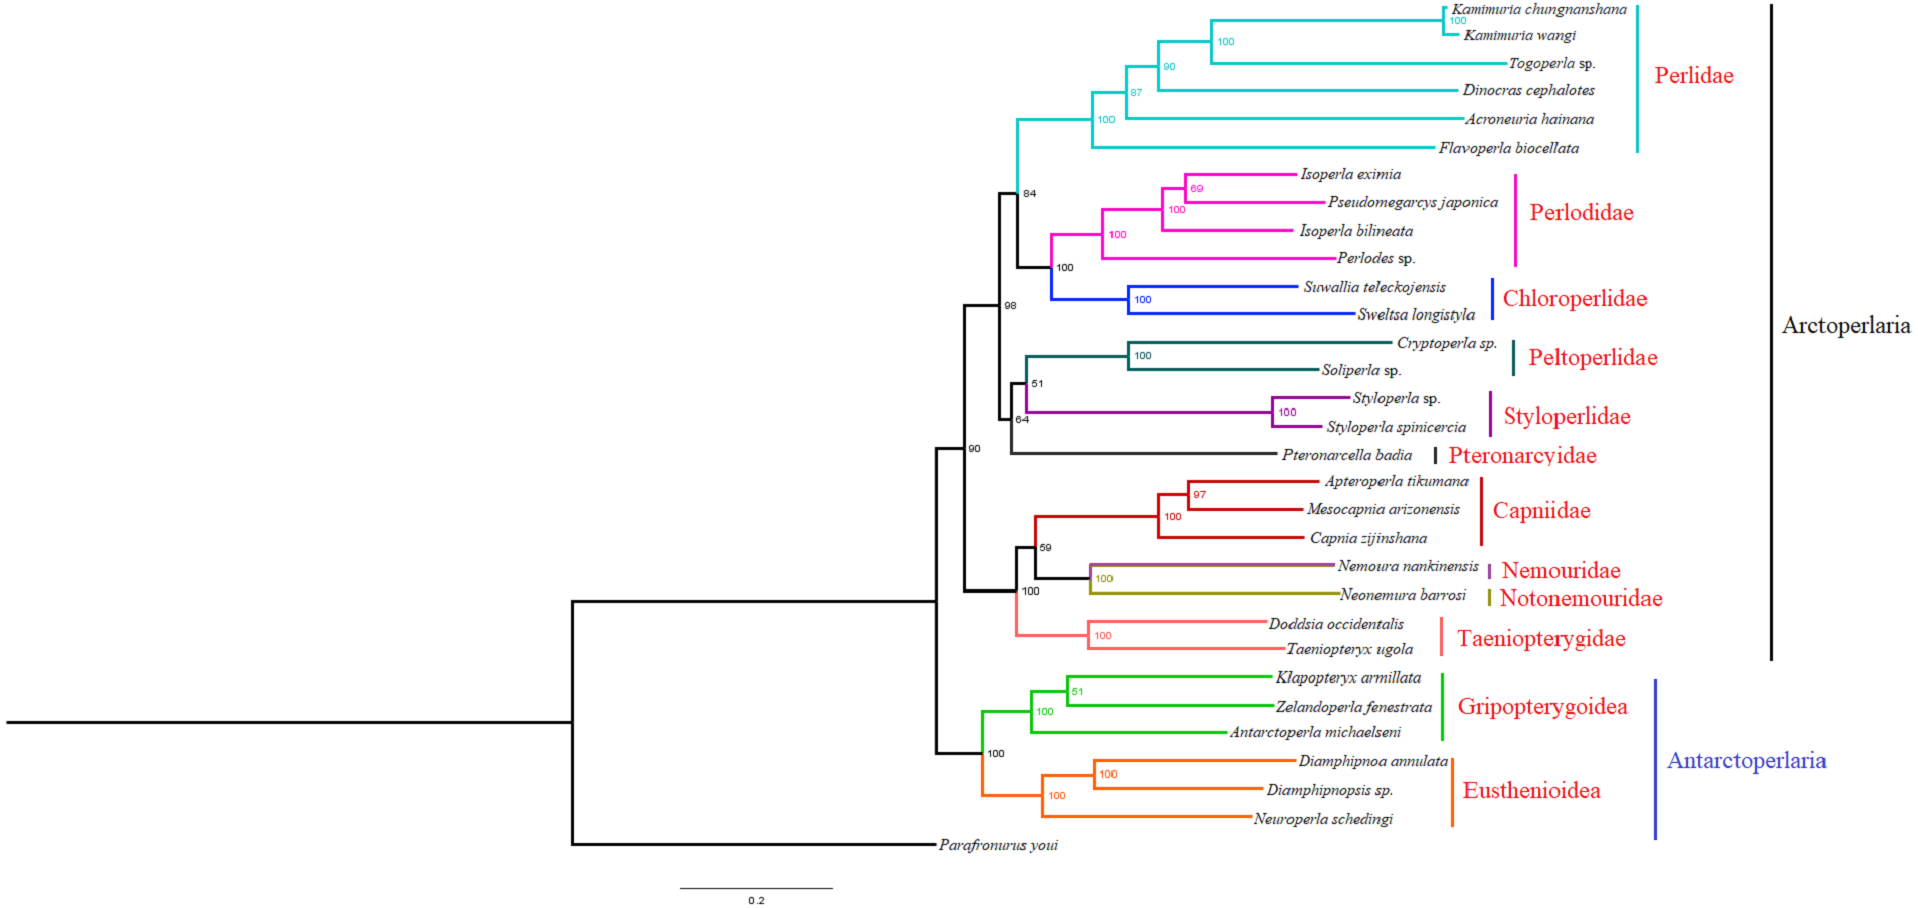
Discussion
The mitochondrial arrangement of the F. biocellata mitochondrial genome was identical with other stoneflies and the model insect Drosophila yakuba (Clary & Wolstenholme, 1985), which was regarded as the ancestral mitochondrial genome due to the conserved gene order in non-insect hexapods (Nardi et al., 2003) and crustaceans (Crease, 1999). The nucleotide skew was consistent in Plecoptera and most other insects (Wei et al., 2010). The trnSer was had a small loop, which is a common phenomenon in stoneflies and other metazoans (Garey & Wolstenholme, 1989).
Zwick proposed two suborders: Antarctoperlaria and Arctoperlaria, and Arctoperlaria further divided into Systellognatha and Euholognatha (Zwick, 1973). In our study, the mitogenomic phylogeny strongly supported this classification (Figs. 4 and 5). In our study, the phylogeny within Antarctoperlaria supports the morphological phylogeny proposed by Zwick (Zwick, 2000). Ding et al. (2019) used four gene inclusion/exclusion datasets: protein-coding genes alone, with third codon positions (PCG123), PCGs without third positions (PCG12), PCGs including third positions plus rRNA genes (PCG123+RNA) and PCGs excluding third positions plus rRNAs (PCG12+RNA). Our study used the protein-coding genes alone, with third codon positions (PCG123) datasets and produced similar results. Our results also indicated the phylogeny within Antarctoperlaria showed two superfamilies: Eusthenioidea (including Eustheniidae and Diamphipnoidae) and Gripopterygoidea (including Austroperlidae and Gripopterygidae), which is consistent with Ding et al. (2019).
In both BI and ML, Nemouridae + Notonemouridae confirmed the northern origin of the currently southern hemisphere restricted Notonemouridae. Nemouridae currently is only found in the northern hemisphere, while Notonemouridae is only distributed in the southern hemisphere. Our phylogenetic analysis recovered the sister group relationship between Nemouridae and Notonemouridae, which supports the hypothesis that Notonemouridae was historically distributed in the northern hemisphere, but then migrated to the southern hemisphere and is now extinct from the northern hemisphere.
Uchida and Isobe proposed the relationships of (Pteronarcyidae + (Peltoperlidae + Styloperlidae)). Zwick then summarized the phylogeny of Systellognstha as ((Pteronarcyidae + (Peltoperlidae + Styloperlidae)) + (Perlidae + Chloroperlidae + Perlodidae)) (Zwick, 2000). Thomas et al. (2000) resolved the relationships as (Chloroperlidae + (Perlodidae + Perlidae)). Chen et al. reported (((Perlidae + (Chloroperlidae + Perlodidae)) + (Pteronarcyidae + Styloperlidae)) + Peltoperlidae) (Chen & Du, 2018). Our analyses showed (((Perlidae+(Perlodidae+Chloroperlidae)) + (Pteronarcyidae+(Peltoperlidae+Styloperlidae))). These different results may indicate that mitochondrial genomes are not a good data source for relationships within Systellognatha.
The difference in phylogenetic studies may have also resulted from the low numbers of samples; more sampling of the three families in future studies is expected to reconstruct a more robust phylogenetic relationship among the three families. Recent phylogenetic studies aimed to resolve the phylogeny of Plecoptera have demonstrated that the mitogenomic data were reliable and informative in inferring the inner phylogenetic relationships of Plecoptera. However, more comprehensive sampling especially for stoneflies from the southern hemisphere is needed to better resolve the mitochondrial phylogeny of Plecoptera.
Conclusions
The entire mitochondrial genome of F. biocellata was sequenced and analyzed. The gene arrangement of F. biocellata was very conserved and identical with other stoneflies and the mitochondrial genome of Drosophila yakuba. The phylogenetic reconstructions with Bayesian inference (BI) and maximum likelihood methods (ML) had similar phylogenetic topology. More sequences should be obtained in future works to better resolve the phylogeny of Plecoptera.