
Molecular cloning and expression analysis of tyrosinases (tyr) in four shell-color strains of Manila clam Ruditapes philippinarum
- Published
- Accepted
- Received
- Academic Editor
- Rogerio Sotelo-Mundo
- Subject Areas
- Aquaculture, Fisheries and Fish Science, Biotechnology, Genomics, Molecular Biology
- Keywords
- Ruditapes philippinarum, Shell-color strains, Tyrosinase, Early development stages, Gene expression, RNAi
- Copyright
- © 2020 Jiang et al.
- Licence
- This is an open access article distributed under the terms of the Creative Commons Attribution License, which permits unrestricted use, distribution, reproduction and adaptation in any medium and for any purpose provided that it is properly attributed. For attribution, the original author(s), title, publication source (PeerJ) and either DOI or URL of the article must be cited.
- Cite this article
- 2020. Molecular cloning and expression analysis of tyrosinases (tyr) in four shell-color strains of Manila clam Ruditapes philippinarum. PeerJ 8:e8641 https://doi.org/10.7717/peerj.8641
Abstract
The Manila clam (Ruditapes philippinarum) is an economically important molluscan bivalve with variation in pigmentation frequently observed in the shell. In nature, tyrosinase is widely distributed in invertebrates and vertebrates, and plays a crucial role in a variety of physiological activities. In this study, a tyrosinase gene (tyr 9) was cloned and the expression level of tyr genes (tyr 6, tyr 9, tyr 10, and tyr 11) were investigated in different shell colors. Quantitative real-time PCR showed that tyr genes were significantly expressed in the mantle, a shell formation and pigmentation-related tissue. Moreover, the expression pattern of the tyr genes in the mantle of different shell-color strains was different, suggesting that tyrosinases might be involved in different shell-color formation. In addition, the expression profile of tyr 6, tyr 9, tyr 10, and tyr 11 genes were detected at different early developmental stages and the expression level varied with embryonic and larval growth. RNA interference (RNAi) results showed that the expression level of tyr 9 in the RNAi group was significantly down-regulated compared to control and negative control groups, indicating that Rptyr 9 might participate in shell-color formation. Our results indicated that tyr genes were likely to play vital roles in the formation of shell and shell-color in R. philippinarum.
Introduction
Mollusks have conspicuous colors and color patterns that attract growing interest from many different perspectives, such as research on shell formation and pigmentation (Meinhardt & Klingler, 1987; Jackson et al., 2010), genetic breeding (Wada & Komaru, 1996), and biomaterial study on pearl formation (Liu et al., 2012). Over the past decades, shell color is widely used as an important trait for selective breeding in many bivalve species, including Patinopecten yessoensis (Sun et al., 2015; Liu et al., 2013), Crassostrea gigas (Feng et al., 2015), Hyriopsis cumingii (Chen et al., 2016), and Meretrix (Jing, 2015).
Much of the pigment-based coloration in invertebrates results from the production of the melanin, ommochrome, pteridine, papiliochrome, and heme synthesis pathways (Takeuchi et al., 2005). Of these, melanin is one of the most widespread pigments in nature and consists of two classes: eumelanins and pheomelanins (True et al., 1999). The enzyme tyrosinase is essential for the production of various melanins in invertebrates (Wittkopp, Carroll & Kopp, 2003). In mollusks, tyrosinases are a key compound in shell pigments (Comfort, 2010) and are involved in the regulation of the melanin biosynthesis pathway (Luna-Acosta et al., 2011). In the biosynthesis pathway of melanin, tyrosinase catalyzes three different reactions: (1) the hydroxylation of tyrosine to L-DOPA; (2) the oxidation of L-DOPA to L-dopaquinone; and (3) the oxidation of 5,6-dihydroxyindole to indole-quinone (Sanchez-Ferrer, 1995). Tyrosinases belong to the type-3 copper protein family (Cicero et al., 1982; Johansson & Soderhall, 1996) and possess two conserved copper-binding domains, known as Cu (A) and Cu (B), both of which are coordinated by three conserved histidines (Decker & Tuczek, 2000; Decker et al., 2007).
In recent years, the genetic bases and molecular mechanisms of shell and shell-color formation are receiving increasing attention (Yue et al., 2015; Rihao et al., 2014). In Crassostrea angulata, Ca-tyrA1 mRNA first occurs at the gastrula stage, persists until the early D-veliger stage and mainly distributes in the mantle of adults (Yang et al., 2017). Cgi-tyr1 transcripts were first detected in the saddle-shaped shell field in trochophores and were not detected after the D-veliger stage in Crassostrea gigas (Huan et al., 2013). It has been reported that the pathways of tyrosinase metabolism and melanogenesis were detected in the mantle transcriptome of Patinopecten yessoensis, which indicates that tyrosinase might play a fundamental role in shell pigmentation (Sun et al., 2015). Studies on four shell-color variants of Crassostrea gigas have shown that a tyrosinase transcript (CGI_10008737) represented a higher expression level in the golden shell-color variant than in the three other shell-color variants (white, black, and partially pigmented) (Feng et al., 2015). In H. cumingii, the activity of tyrosinase in the mantle of a purple strain was significantly higher than in a white strain (Chen et al., 2016). In addition, the expression level of tyr genes in a black strain of Meretrix meretrix was significantly higher than that in three other strains (white, pink, and red), indicating tyr genes were involved in the black appearance of the shell color (Jing, 2015).
Ruditapes philippinarum, is an important shellfish with significant economic value, and widely distributed along the coasts of China, Japan, and Korea (Zhang & Yan, 2010). In natural habitats, R. philippinarum displays a different shell color, including white, orange, and zebra striated patterns (Nie et al., 2017a). Since 2005, the shell-color strains of the Manila clam were selected for several generations, with the aim of faster growth, stronger resistance, and a high survival rate, and the hybridization of the white and zebra strains (white-zebra strain) has been established (Zhao et al., 2012). In our previous study, 21 tyrosinase genes were found in the R. philippinarum genome and six of them were differentially expressed in strains with different colored shells (Yan et al., 2019). However, very few mechanistic studies have been carried out on the shell and shell-color formation of the Manila clam. In this study, a tyrosinase (Rptyr9) was cloned from R. philippinarum, and the relationship between tyr genes and various shell colors was investigated by quantitative real-time PCR (qRT-PCR) and RNA interference (RNAi). This study provides new insights on the expression pattern of tyr genes in strains of R. philippinarum with different colored shells, and the molecular basis of shell-color formation and pigmentation in R. philippinarum.
Materials and Methods
Experimental Manila clams
Four adult shell-color strains (three dark shell-color strains: orange, zebra and white-zebra clams; and one light shell-color strain: white clam) and a wild population of R. philippinarum collected from Zhuanghe and Dalian, China, respectively, were used in the experiment. The color strains of clams were selected by our team (Zhang & Yan, 2010) and wild clam were obtained from commercial sources and harvested by clam collector. Manila clam is not an endangered or protected species, so no specific permits were required for the study (Nie et al., 2017b). The clams had an average shell length of 26.1 ± 2.1 mm and an average weight of 5.85 ± 0.75 g. All the adult Manila clams were acclimatized in aerated seawater (30 ppt) at 20 ± 1 °C and pH 8.1 ± 0.1 for 7 days before the experiment. Clams were fed with Spirulina powder once a day for 1 week and water was exchanged fully once per day to discharge waste products.
For the analysis of tyr expression pattern in different shell color strains, the mantle of three adult clams for each shell-color strain were randomly sampled. Different tissues, including mantle, gonad, gill, labial palp, siphon, hepatopancreas, and adductor muscle, were collected from each strain to investigate the tissue-specific expression of tyr genes.
Embryos and larvae collection
The larvae of Manila clams were obtained from the offspring of the wild population, collected from Zhangzi Island (Dalian, Liaoning Province, China). Spawning, fertilization, and embryo collections were performed in controlled lab conditions. The density of fertilized eggs was maintained at 30 eggs mL−1 during the incubation period. About 30 h after fertilization, D-shaped larvae were placed into 20 L tanks, at a density of 5–8 individual mL−1. Larvae were fed 5,000–20,000 and 40,000–60,000 cells ml−1 day−1 of Isochrysis galbana on days 1–3 and from day 4 to the juvenile stage, respectively. Embryos and larvae at different developmental stages, including egg, fertilized egg, gastrula, trochophore, D-shaped larvae, pediveliger, and juvenile stages, were sampled (Table 1). Collected tissues, embryos, and larvae were immediately frozen in liquid nitrogen and stored at −80 °C until RNA extraction.
| Developmental stages | Sampling time (after fertilization) |
|---|---|
| Egg | 0 min |
| Fertilized egg | 3 min |
| Gastrula | 6 h |
| Trochophore | 16 h |
| D-shaped larvae | 21 h |
| Umbo larvae | 3 days |
| Pediveliger | 13 days |
| Juvenile | 43 days |
RNA extraction and cDNA synthesis
Total RNA was extracted using TRIzol Reagent (TRIzol® Plus RNA Purification Kit; Invitrogen, Carlsbad, CA, USA), according to the manufacturer’s protocol. The integrity and purity of RNA were determined by electrophoresis on a 1% agarose gel and a Nanodrop ND-2000 spectrophotometer (Thermo Electron Corp., Waltham, MA, USA), respectively. Total RNA was reverse-transcribed to cDNA with a PrimeScript RT reagent Kit (TaKaRa, Tokyo, Japan) and stored at −20 °C before analysis.
Cloning of the full-length tyr9 cDNA
The 5′-untranslated region (UTR) and 3′-UTR of the tyr9 gene were obtained by rapid amplification of cDNA ends (RACE) with a SMARTer™ RACE cDNA Amplification Kit (Clontech, Mountain View, CA, USA). The gene-specific primers designed by Primer Premier 5.0 are shown in Table 2. Nest-PCR (Li et al., 2009) and touchdown PCR (Korbie & Mattick, 2008) were used to improve the amplification specificity. The first round of the PCR thermal cycle profile was as follows: five cycles at 94 °C for 30 s, 72 °C for 3 min, and five cycles at 94 for 30 s, 70 °C for 30 s, and 72 °C for 3 min followed by a final five cycles at 94 °C for 30 s, 68 for 30 s, and 72 °C for 3 min. The products were then diluted 50 fold as the template for the second round of PCR. The second round of PCR reaction conditions were 25 cycles at 94 °C for 30 s, 68 °C for 30 s, and 72 °C for 3 min. The PCR products were purified with an agarose gel DNA extraction kit (centrifugal columnar) and cloned into a pMD18-T Simple Vector (TaKaRa, Tokyo, Japan) and then transformed into competent cells of Escherichia coli Top10 cells (Tiangen Biotech. Co. Ltd., Beijing, China). Positive colonies containing insert fragments of the expected size were screened by colony PCR. Eight positive colonies were sequenced.
| Primers name | Sequences (5′-3′) | |
|---|---|---|
| Forward primer | Reverse primer | |
| Quantitative real-time PCR primers | ||
| β-actin | CTCCCTTGAGAAGAGCTACGA | TAATGACAAGTGGTTTACGGG |
| tyr6 | ACCCAGATGAGCGTGGTAGAGG | TTAGTGTTTGGATACGGTGTTG |
| tyr9 | ACTGGGATAATACGATAGAAG | GTGCGTTAGGATTAGTTATGT |
| tyr10 | ACAGACCAATCACGCAGTTTC | TAGTCTTGCCAAAGCGTCATA |
| tyr11 | ATGCGTCAAATGTCTAAATGC | TCTGCGTTTGTGAACTGTGGG |
| RACE primers | ||
| tyr 5′GPS-out | TGGTCCACCATGAGCCGACAGTGCGGTG | |
| tyr 5′ GPS-in | CGCACGCGCAGTTCCCCTTCTGGTGGTA | |
| tyr 3′GPS-out | AACTAATCCTAACGCACCTGATGCCACC | |
| tyr 3′GPS-in | GATGCGACTGGAGTAGACAACGCTGTGT | |
| Longup | CTAATACGACTCACTATAGGGCAAGCAGT GGTATCAACGCAGAGT |
|
| Shortup | CTAATACGACTCACTATAGGGC | |
| RNAi primers | ||
| tyrF1i | GATCACTAATACGACTCACTATAGGGAATACGATAGAAGAAGGTT | |
| tyrR1 | TGTTCTAAAGTCTTCCCAA | |
| tyrF1 | AATACGATAGAAGAAGGTT | |
| tyrR1i | GATCACTAATACGACTCACTATAGGGTGTTCTAAAGTCTTCCCAA | |
Sequence and phylogenetic analyses
The cDNA and amino acid sequences of tyr were analyzed with the BLAST algorithm at the NCBI website (http://www.ncbi.nlm.nih.gov/blast). The deduced amino acid sequence was analyzed with a Simple Modular Architecture Research Tool (SMART, http://smart.embl-heidelberg.de). Domain searches and annotations were conducted with SMART (Schultz et al., 1998). The amino acid sequence of tyr9 that was identified in R. philippinarum was compared in a multiple-sequence alignment using DNAMAN (Wang, 2017). Protein sequences were used in the phylogenetic analysis and were aligned by ClustalW with the software package MEGA10 and bootstrapping (n = 1,000) (Kumar et al., 2018).
Tyr mRNA expression analysis in different early developmental stages and different tissues of four shell-color strains
Primers used in the study (Table 2) were designed by Primer Premier 5.0 and were synthesized by the Sagon Company (Shanghai, China). Synthesized cDNA template was diluted 10-folds for qRT-PCR. qRT-PCR was carried out on a Roche LightCycler 480 (Roche, IN, USA) using the SYBR ExScript qRT Kit (TaKaRa, Tokyo, Japan), and performed in a total volume of 20 μL, including 10 μL of SYBR® Primix Ex Taq II, 0.8 μL of primer F and primer R, 2 μL of cDNA and 6.4 μL of H2O. β-actin was performed as an internal control (Nie et al., 2017a). Reactions were performed in 94 °C for 5 min, and 40 cycles of 94 °C for 30 s, 60 °C for 30 s, and 72 °C for 30 s. The purity of amplification products was evaluated by dissociation curve analysis. The 2−ΔΔCT method (Livak & Schmittgen, 2001) was used to analyze the relative expression level of tyr genes. The data were the mean ± standard error from at least three independent experiments performed in duplicate. The data were subjected to one-way analysis of variance followed by multiple-range testing in the SPSS 20.0 program. P < 0.05 was considered statistically significant.
The dsRNA synthesis and RNAi of Rptyr9
RNA interference primers were designed close to the 5′ end of the tyr9 gene sequence of R. philippinarum. T7 promoter sequence primer was added to RNAi primers (Table 2). The dsRNA synthesis was performed using an in vitro Transcription T7 Kit for siRNA Synthesis (TaKaRa, Tokyo, Japan) according to the manufacturer’s protocol. The region encompassing positions 536 to 910 of the tyr9 cDNA was amplified from the total extracted mRNA, the thermal cycling protocol was 30 cycles at 4 °C for 3 min, 94 °C for 30 s, 68 °C for 30 s; 72 °C for 5 min, 75 °C for 5 min. The PCR amplification products were used as a template for in vitro transcription (Table 3) to synthesize dsRNA. Finally, the dsRNA was analyzed by 1% agarose gel electrophoresis and the quality and quantity were assessed by using a Nanodrop ND-2000 spectrophotometer (Thermo Scientific, Madison, NY, USA).
| Component | Volume |
|---|---|
| 10 × Transcription buffer | 2 μL |
| ATP solution | 2 μL |
| GTP solution | 2 μL |
| CTP solution | 2 μL |
| UTP solution | 2 μL |
| RNase inhibitor | 0.5 μL |
| T7 RNA polymerase | 2 μL |
| RNase free dH2O | X μL |
| linear template DNA | 20 ng–1 μg |
| Total | 20 μL |
In the RNAi experiment, 90 adult wild clams were used and divided into three groups. In the first group, 30 clams were injected into the sinusoid with approximately 100 μL of dsRNA (50 μg mL−1) and used as the RNAi group. The control group of 30 clams received an injection of 100 μL phosphate-buffered saline (272 mmol L−1 NaCl, 5.2 mmol L−1 KCl, 16 mmol L−1 Na2HPO4, 4 mmol L−1 KH2PO4, pH 7.4). The remaining 30 clams were untreated and used as a negative control group. The clams were returned to water tanks after treatment, and three individuals were randomly sampled at 0, 24, 48, 72, 96, and 120 h post-injection from each group. The mantle was collected and then immediately frozen in liquid nitrogen and stored at −80 °C for subsequent RNA extraction.
Results
The cDNA cloning and sequence analysis of Rptyr9
The cDNA sequence of the tyr9 gene of R. philippinarum (designated as Rptyr9) was obtained using the RACE method and deposited in GenBank (accession number: MH392190). The full-length cDNA of Rptyr9 was 2,452 bp (Fig. 1). As shown in Fig. 1, there is a start codon (ATG) at the 5′ end of the cDNA and a stop codon (TAA) at the 3′ end. Rptyr9 contains a 121 bp of 5′-UTR, an open reading frame (ORF) consisting of 1,152 and 1,179 bp of 3′-UTR. A putative polyadenylation signal (AATAAA) was recognized at position 2,435, which is located upstream of the poly (A) tail separated by 11 nucleotides. The ORF of tyr9 cDNA encodes a protein consisting of 383 amino acid (aa) residues with an isoelectric point of 6.80 and a predicted molecular weight of 43.72 kDa. The predicted signal peptide comprised the N-terminal sequence of 22 amino acids (Fig. 1).
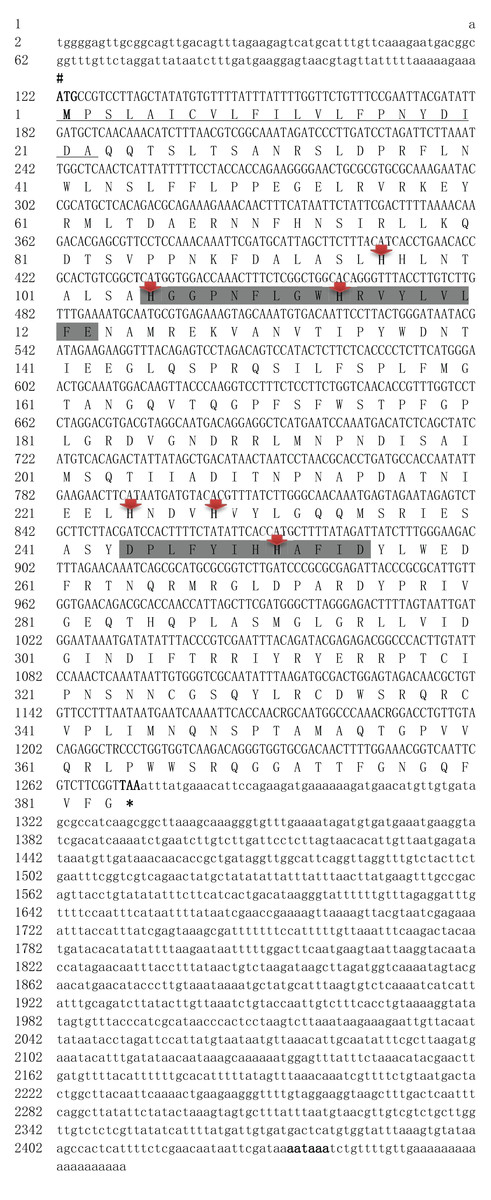
Figure 1: Nucleotide and deduced amino acid sequences of R. philippinarum tyr 9.
The # and * under the amino acid sequence indicated the promoter sequence (ATG) and translation termination codon (TAA).
Homology and phylogenetic analyses
The Rptyr9 amino acid sequence was aligned with the known amino acid sequences of their counterparts in known mollusks (Fig. 2). Two copper-binding sites Cu (A) (from His105 to Glu122) and Cu (B) (from Asp244 to Asp255) with six conserved histidine residues were found in the aligned sequences (Fig. 2). A tyrosinase domain was found in tyr of R. philippinarum and in other species (Fig. 3). To understand the evolutionary relationships between Rptyr and other tyr gene, a phylogenetic tree was constructed based on the amino acid sequences of 27 tyr gene (Fig. 4). The result showed that the tyrosinase domain of Rptyr kept a close evolutionary relationship with tyr gene from other mollusks, such as 60.27% with Pinctada maxima, 46.84% with Crassostrea virginica, and 42.25% with Mytilus galloprovincialis. As shown in Fig. 4, R. philippinarum clustered most closely with Pinctada maxima, and then with other mollusks, including Crassostrea virginica, Mytilus galloprovincialis, Azumapecten farreri, Pinctada fucata, Mizuhopecten yessoensis, Sepia officinalis, and Illex argentinus. The Nematomorph tyr gene (Caenorhabditis briggsae, Caenorhabditis elegans, Ascaris suum, and Loa loa) formed another cluster. The tyr gene of ascidians, mammals, fish, and amphibians formed a third cluster. Therefore, the phylogenetic relationships of the Rptyr amino acid sequence are consistent with traditional classification.
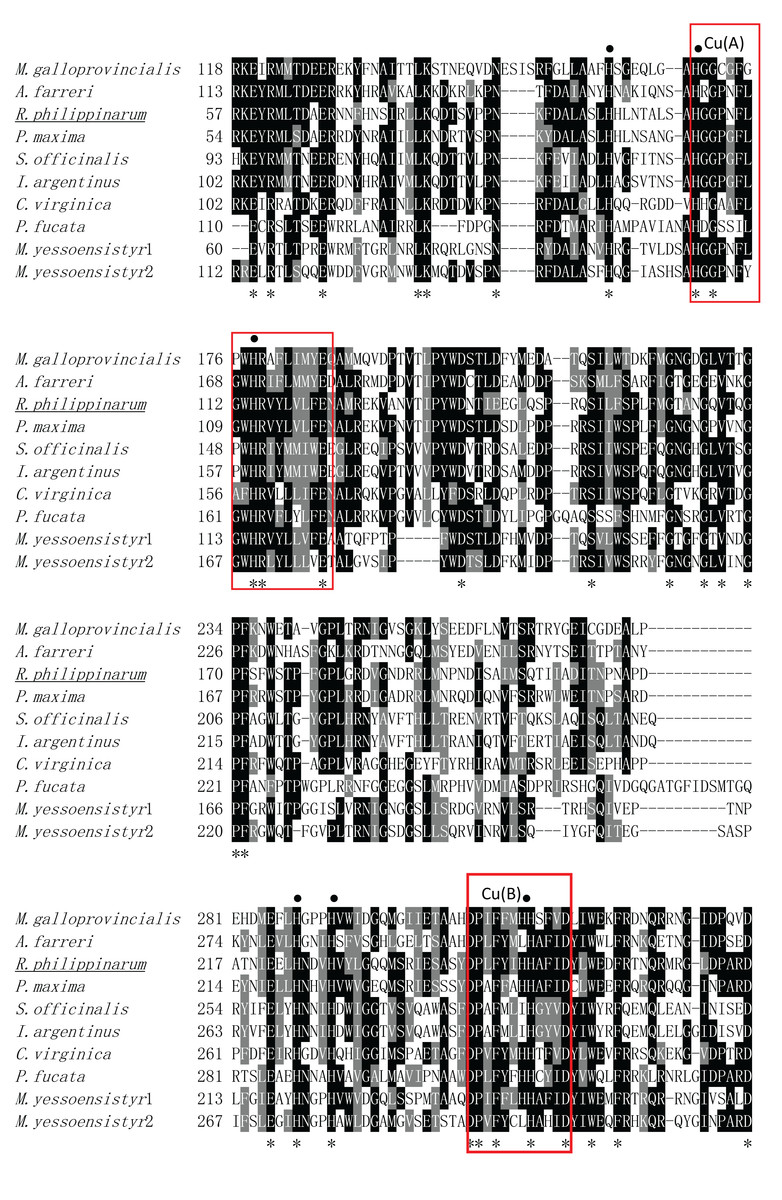
Figure 2: Multiple alignment of tyr 9 gene between the R. philippinarum tyr 9 and tyr gene of other mollusks.
Identical residues were marked in dark, and similar amino acids were shaded in gray. Two copper-binding domains (CuA and CuB) were implied in red boxes. Six conserved histidine residues were labeled with ⚫. The GenBank accession numbers of the aligned sequences are: Mytilus galloprovincialis (OPL33388.1), Azumapecten farreri (ASR73340.1), Ruditapes philippinarum (QBC75368.1), Pinctada maxima (AHZ34287.1), Sepia officinalis (CAC82191.1), Illex argentinus (BAC87844.1), Crassostrea virginica (XP_022344539.1), Pinctada fucata (AAZ66340.1), Mizuhopecten yessoensis 1 (XP_021374237.1), and Mizuhopecten yessoensis 2 (XP_021373699.1).
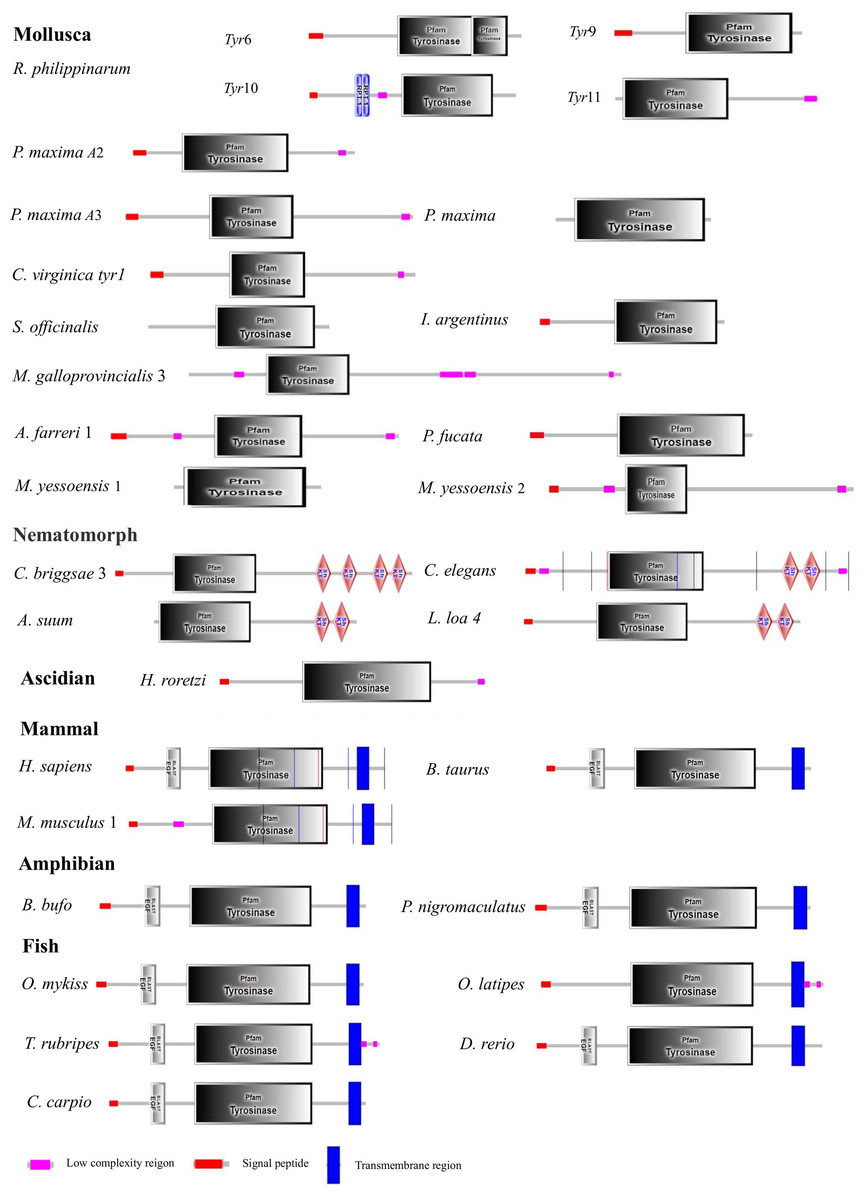
Figure 3: Domain architecture of tyrosinase of R. philippinarum and tyrosinase domain-containing of tyrosinase proteins selected from other animal.
The pink block was low complexity, the red block was signal peptide, and the blue block was transmembrane region.
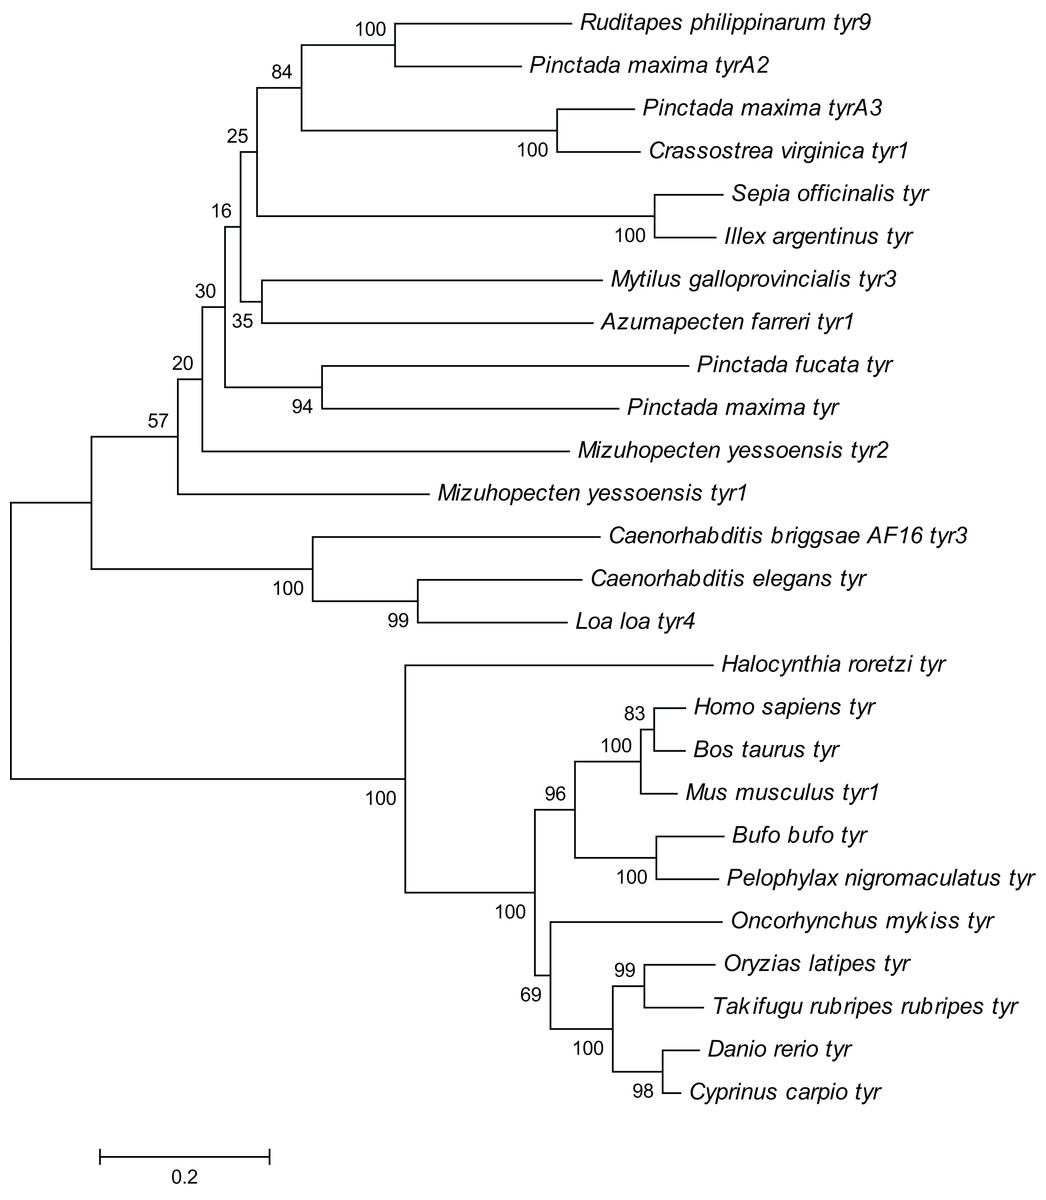
Figure 4: Phylogenetic tree of R. philippinarum tyr9 and tyr gene of other species was constructed with the MEGA 10.0 software using the neighbor-joining method.
Rptyr gene expression characteristics during larval development
As shown in Fig. 5, the expression pattern of the tyr genes at different developmental stages was detected by quantitative RT-PCR analysis. The tyr6 and tyr9 genes were highly expressed at the trochophore and D-shaped stages (P < 0.05) (Figs. 5A and 5B). The tyr10 and tyr11 genes of R. philippinarum were mainly expressed at the egg, trochophore, and D-shaped larvae stage and were expressed particularly high in the egg stage (P < 0.05) (Figs. 5C and 5D). However, with larval development, the expression of the tyr gene significantly decreased and was almost undetectable in the juvenile (Fig. 5).
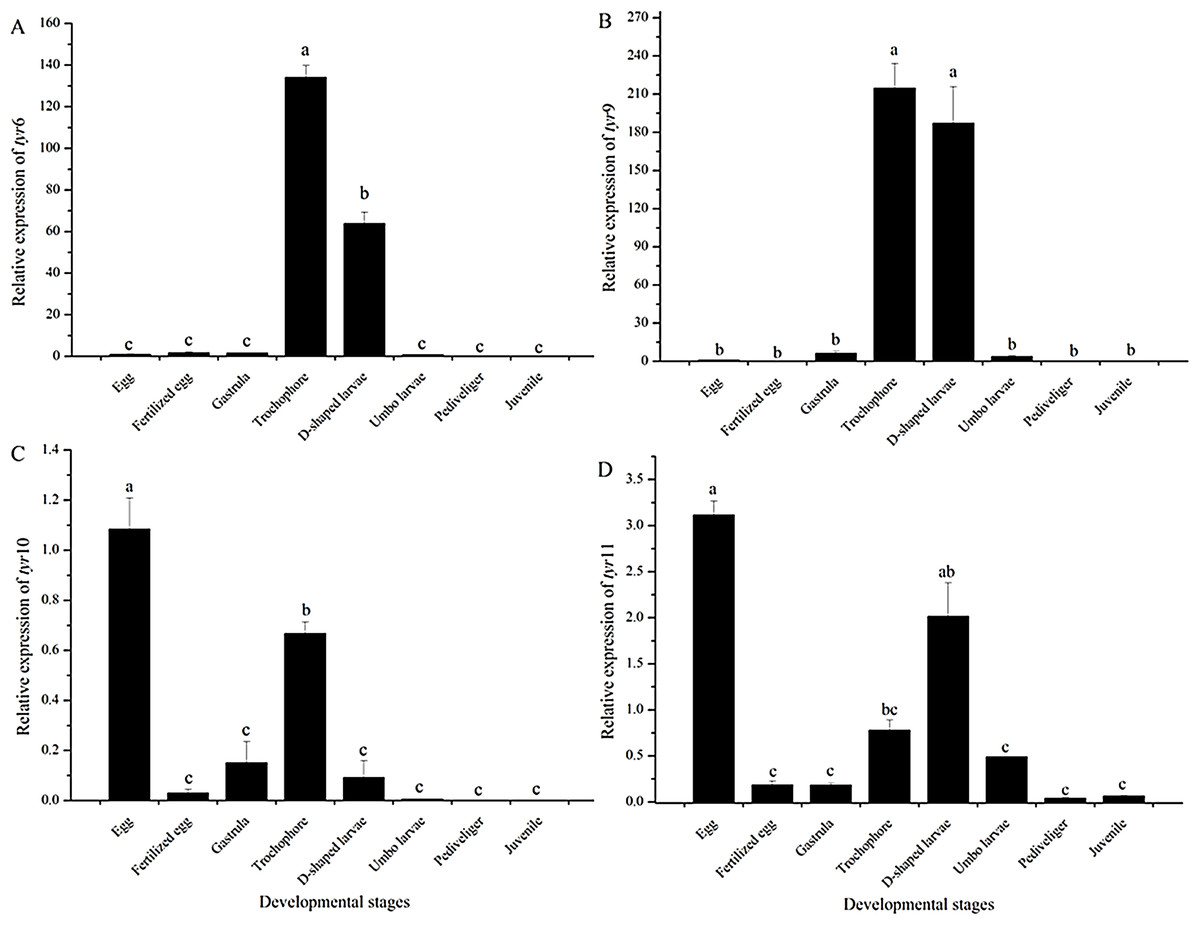
Figure 5: Tyr 6 (A), tyr 9 (B), tyr 10 (C), and tyr 11 (D) mRNA relative expression level in different early developmental stages (egg, fertilized egg, gastrula, trochophore, D-shaped larvae, pediveliger, and juvenile stage) of wild R. philippinarum detected by qRT-PCR.
The β -actin gene from R. philippinarum was used as an internal control. Data from the qRT-PCR experiments were expressed as the mean ± SD. Bars with different letters indicate significant differences (P < 0.05), the same as below.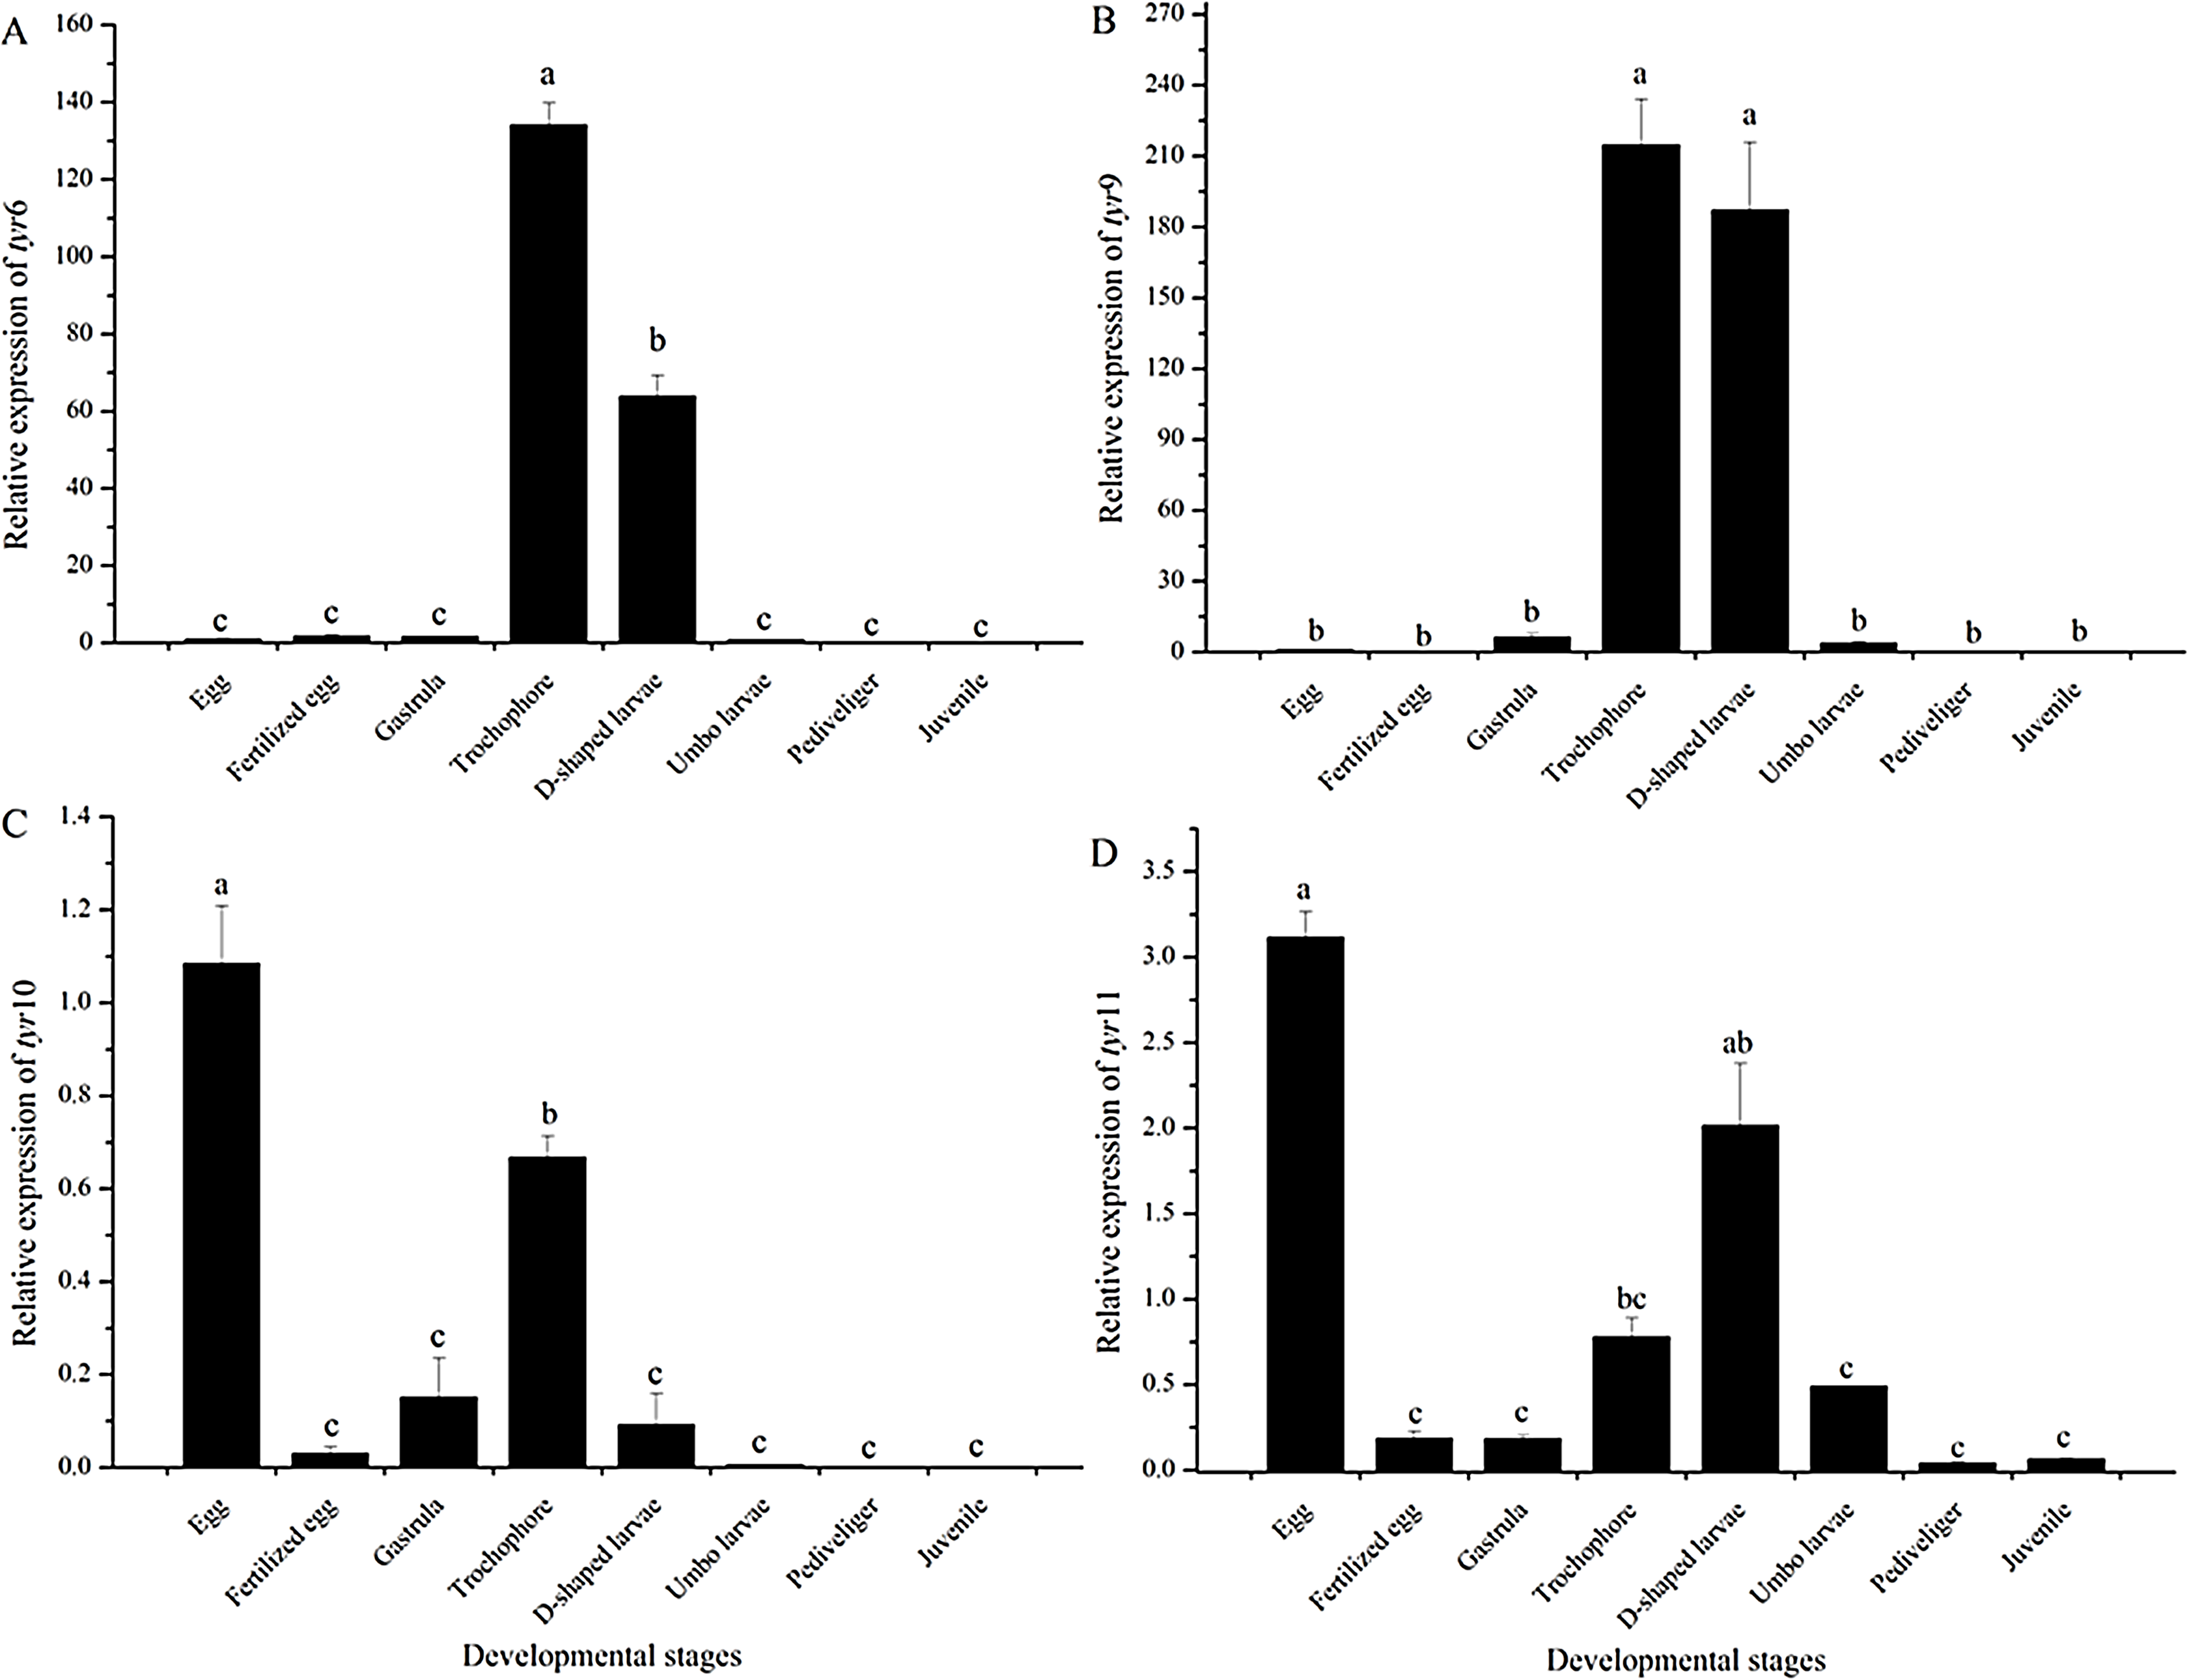
Expression pattern of Rptyr genes in the mantle of four shell-color strains
To investigate the relationship between the expression level of tyr genes and different shell colors, the expression level of tyr genes in the adults of four shell-color strains were analyzed. Tyr6, tyr9, tyr10, and tyr11 genes were expressed in the mantle of different strains with various patterns (Figs. 6A−6D). Zebra clams had a high tyr11 gene expression level, which was significantly different from white-zebra clams and white clams (P < 0.05). Orange clams had a high expression level in the mantle of the tyr6, tyr9, tyr10, and tyr11 gene (P < 0.05). White-zebra clams had significantly high expression levels of tyr6 and tyr9 (P < 0.05). Only the white clam expressed a low level of the four tyr gene (P < 0.05). According to these results, the tyr gene were more highly expressed in the mantle of dark shell-color strains (orange, zebra, and white-zebra clams) than in the light shell-color strain (white clams).
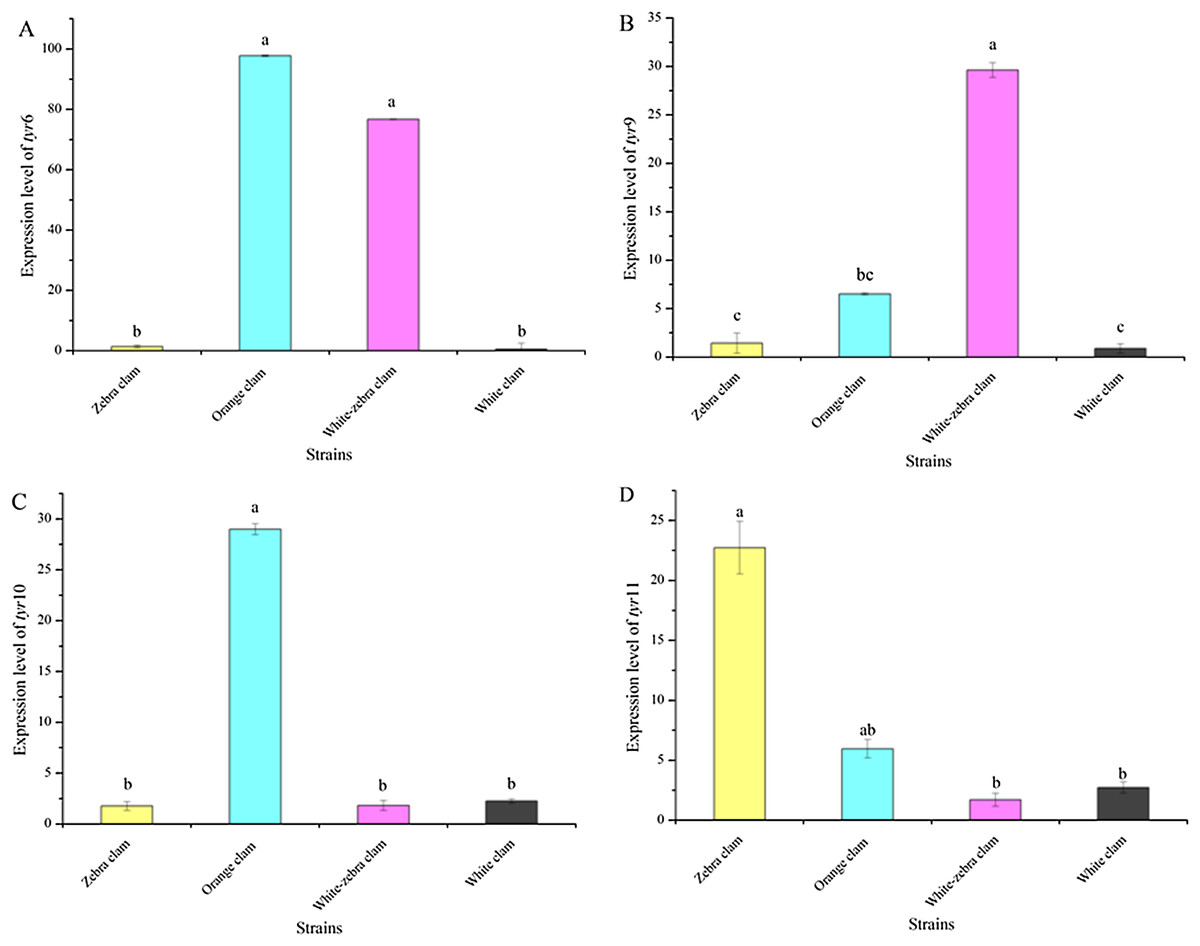
Figure 6: Expression analysis of tyr6 (A), tyr9 (B), tyr10 (C), and tyr11 (D) in R. philippinarum mantle tissues (from zebra clam, orange clam, white-zebra clam, and white clam).
Expression was determined with qRT-PCR relative to β-actin mRNA expression. Bars with different letters indicate significant differences (P < 0.05).
The tissue distribution of Rptyr transcripts
The tissue-specific expression of tyr genes in different shell-color strains of R. philippinarum was analyzed using qRT-PCR. In this study, the transcript of tyr9 was expressed in a wide range of the tissues examined, including mantle, gonad, gill, labial palp, siphon, hepatopancreas, and adductor muscle (Fig. 7). In zebra clams, tyr9 was mainly expressed in the mantle and labial palp (P < 0.05). In orange clams, tyr9 was only detected in the mantle at a significantly high level (P < 0.05). In white-zebra clams, tyr9 was mainly expressed in the mantle, gill, and hepatopancreas (P < 0.05). White clams had a high expression level in the gill, labial palp, and hepatopancreas (P < 0.05).
Figure 7: Expression analysis of tyr9 mRNA in the mantle, gonad, gill, labial palp, siphon, hepato pancreas, adductor muscle of R. philippinarum detected with qRT-PCR.
Bars with different letters indicate significant differences (P < 0.05).
RNAi-mediated tyr9 knockdown in R. philippinarum
In this study, the temporal expression of Rptyr9 in healthy clams after dsRNA injection was detected. The transcriptional characteristics of Rptyr9 in the mantle after dsRNA injection are shown in Fig. 8. The expression level of Rptyr9 mRNA was significantly downregulated in the mantle by 2.28 and 23.94-fold at 24 and 72 h (P < 0.05), respectively, and was hardly detected at 96 h (P < 0.05) after RNAi. However, the transcripts of tyr9 recovered to its original level (1.52-fold higher than the original level) at 120 h (Fig. 8). While both the control and negative control groups showed a stable expression level of tyr9 similar to the original level during the whole experiment.
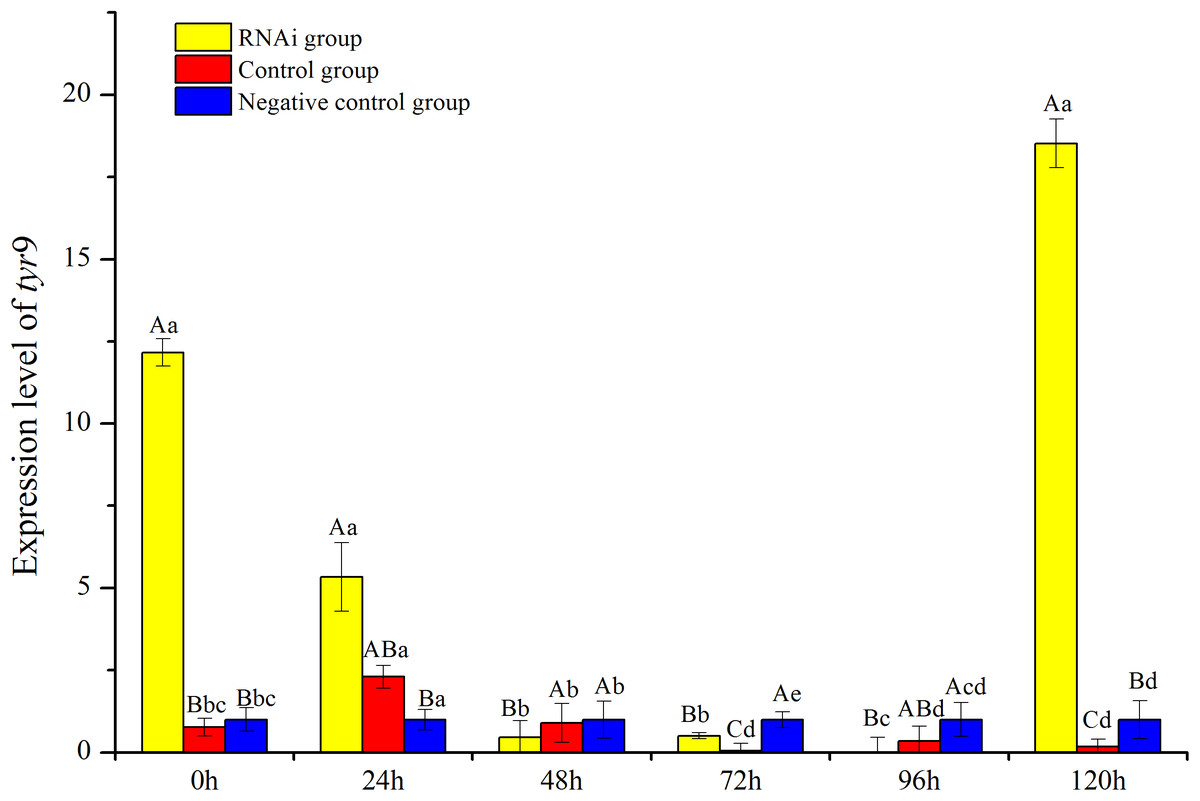
Figure 8: Analysis of expression difference of different times under RNA interference of R. philippinarum.
The capital letters indicated significant differences at the same time points with different processing, the lowercase letters meant significant differences at different time point with same processing.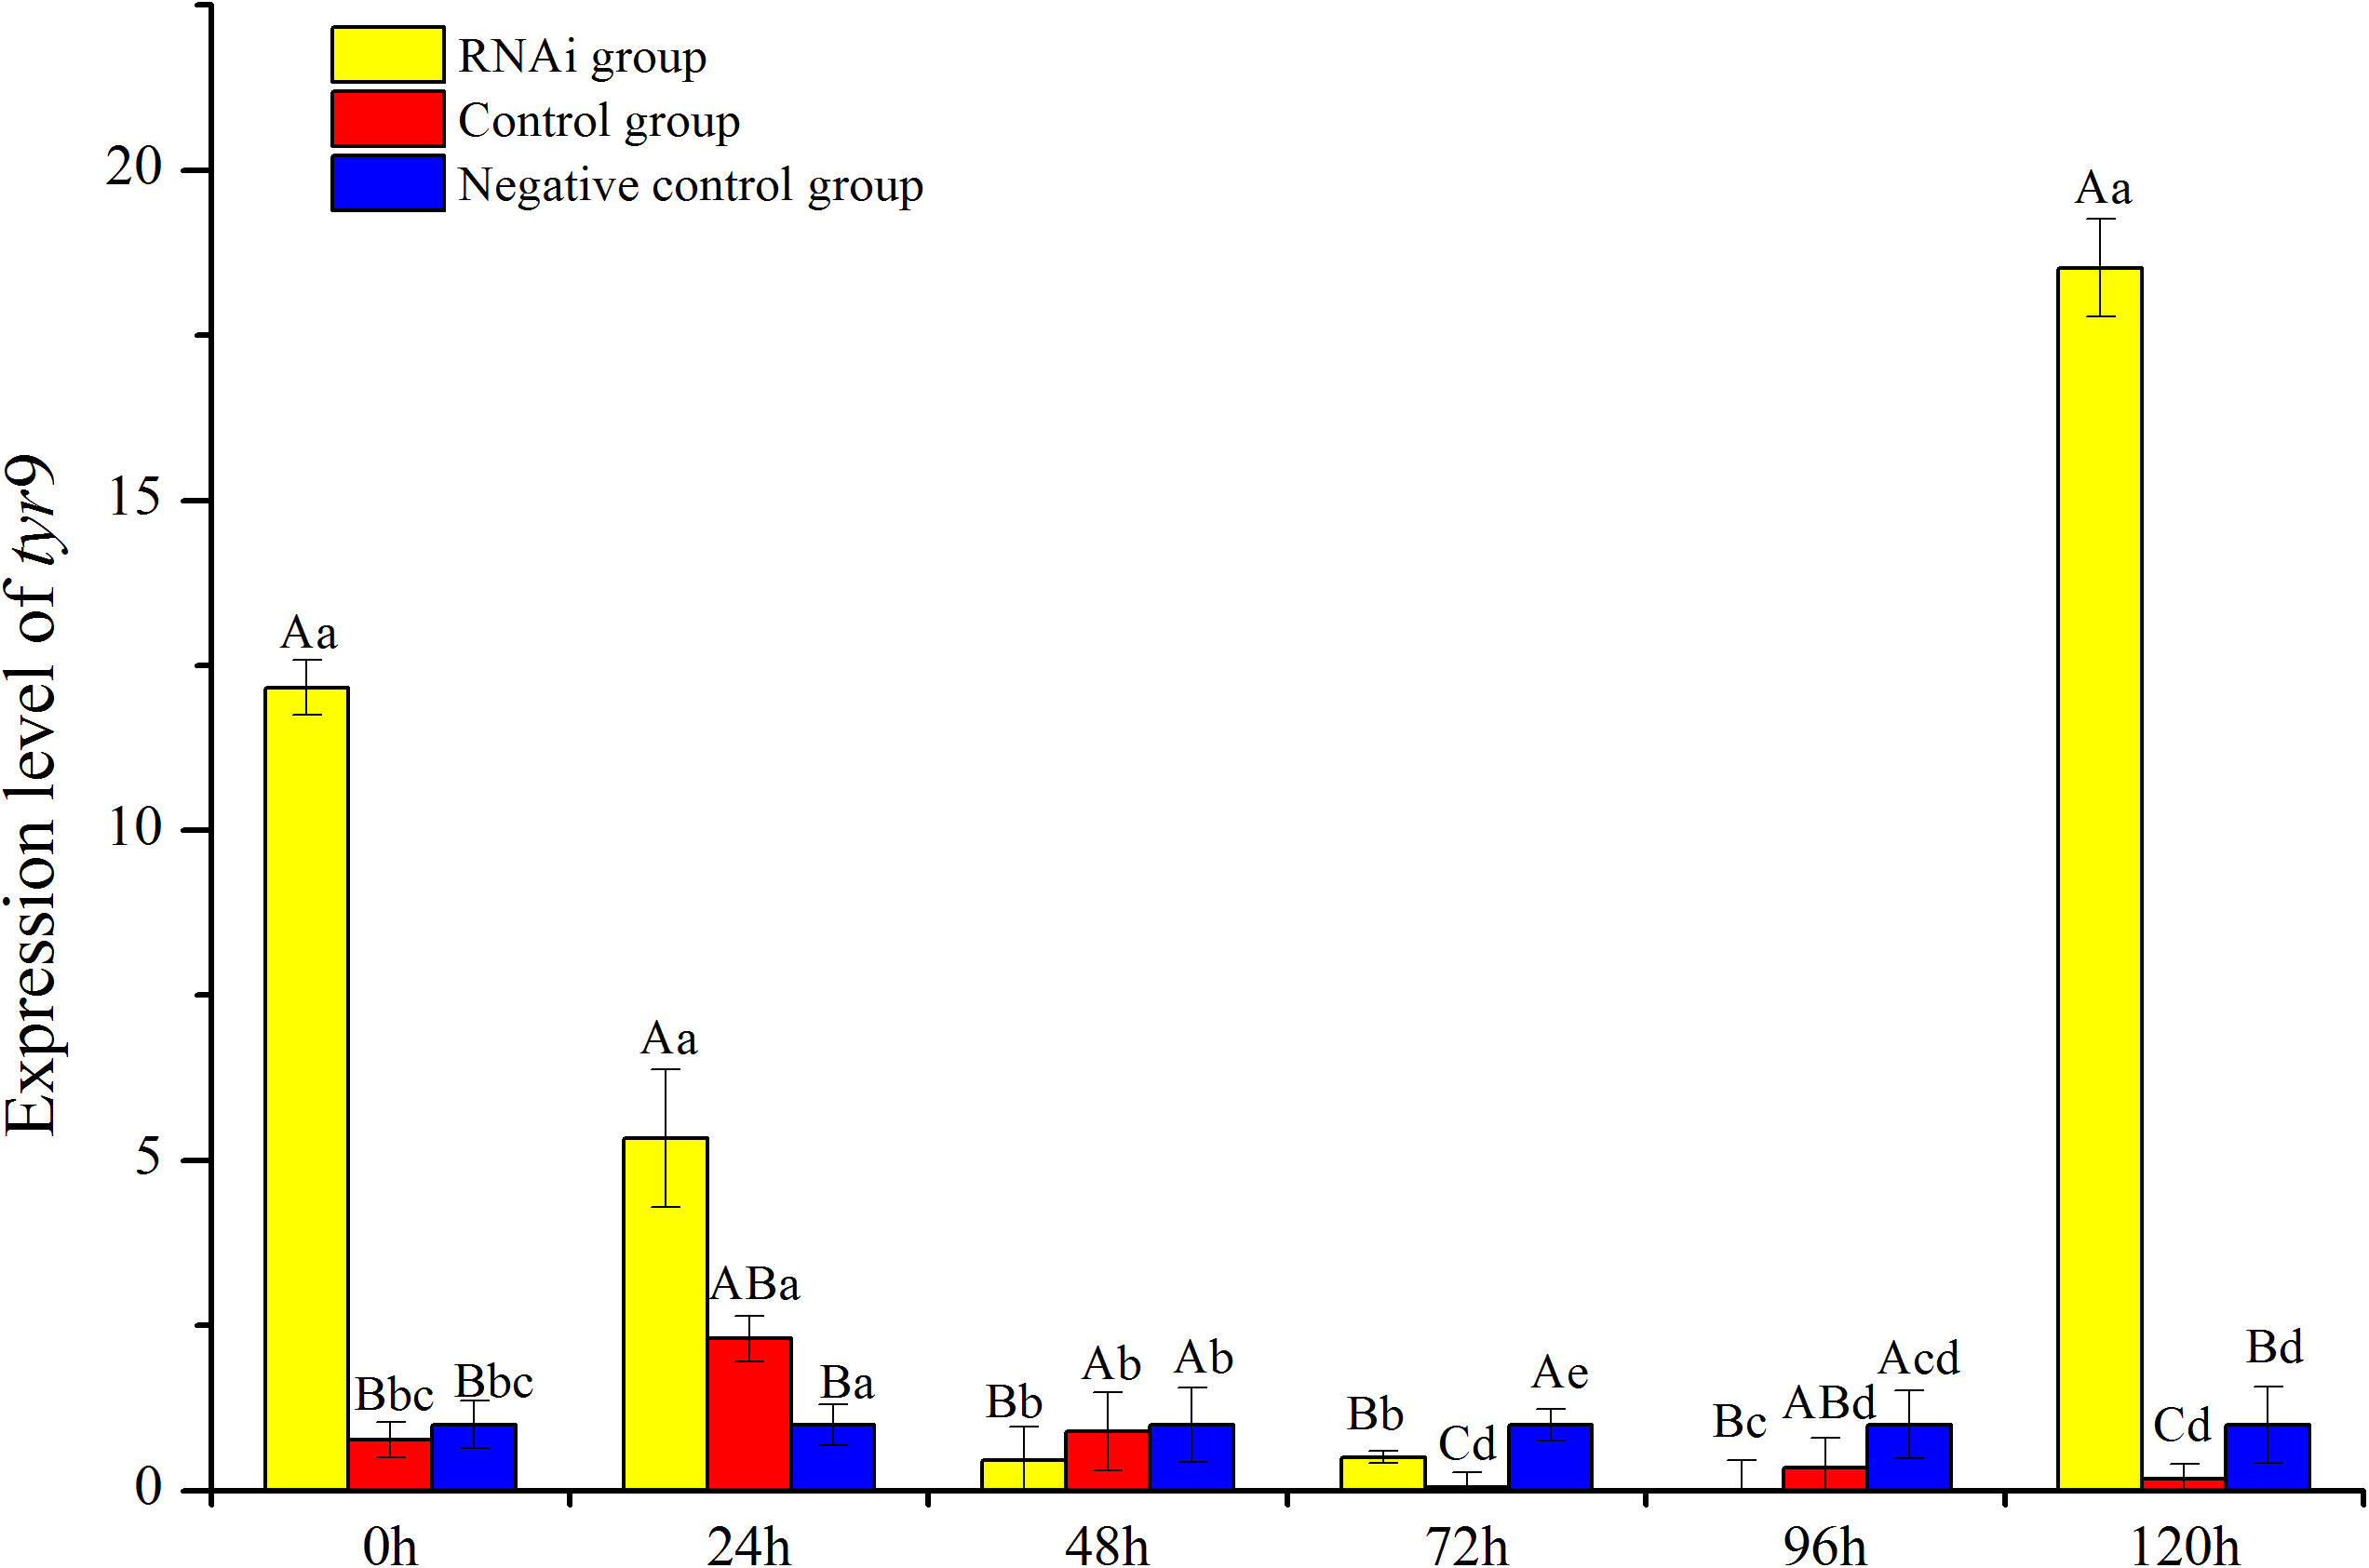
Discussion
Currently, tyrosinases are considered to be involved in many biological activities of mollusks, including non-calcified shell formation (Yang et al., 2017; Huan et al., 2013), shell growth (Feng, Li & Yu, 2019), pigmentation (Feng et al., 2015; Chen et al., 2016; Jing, 2015; Yu et al., 2018), and the immune response (Zhou et al., 2012; Asokan, Arumugam & Mullainadhan, 1997). Studies of the tyr gene expression pattern in Crassostrea gigas (Yang et al., 2017) and Crassostrea angulata (Huan et al., 2013) at the early developmental stages found that tyr was highly expressed at the trochophore stage until the D-veliger stage, which indicates that the tyr gene might participate in the formation of initial non-calcified shell. In addition, several studies have suggested that tyrosinase plays a key role in melanin synthesis and the color formation of the Pteria penguin (Yu et al., 2018). Studies on Crassostrea gigas (Feng et al., 2015) and H. cumingii (Chen et al., 2016) have shown that the dark shell-color variants (golden and purple, respectively) represented a higher expression level of tyrosinase than other shell-color variants, which indicates that tyrosinase might play an important role in the pigmentation of shellfish.
In this study, we detected the expression level of the tyr9 gene in different tissues of four shell-color strains. Our data showed that the tyr9 gene was mainly expressed in the mantle of dark shell-color strains (orange, zebra, and white-zebra clams) compared with white clams. Among them, the orange clams had the highest expression level of tyr9, and then the zebra and white-zebra clams. However, in the white clam, a light shell-color strain, tyr9 was mainly expressed in the gill, labial palp, and hepatopancreas. Moreover in the mantle, tyr6, tyr9, tyr10, and tyr11 mainly expressed in the dark shell-color strains compared with light shell-color clams. Similar results were found in H. cumingii, HcTyr was more highly expressed in the nacre of the purple strain than in the white strain (Chen et al., 2016). Therefore, our study indicated that tyr gene expression was associated with the accumulation of melanins to form various shell colors and the expression of tyr gene in the mantle increased with the darkness of the shell color.
In the past decade, a number of studies mainly focused on the roles of tyrosinases in adult shell calcification and pigmentation in Mollusca (Meinhardt & Klingler, 1987; Wada & Komaru, 1996; Comfort, 2010), but the expression level of tyrosinases in early developmental stages is largely unexplored. In the present study, we found tyr10 and tyr11 showed a high expression level in the egg stage which could be inferred to be from maternal contribution (Wang et al., 2015). Tyr6, tyr9, tyr10, and tyr11 were highly expressed at the trochophore and D-shaped larvae stages and greatly down-regulated after the D-shaped larvae stage, which is similar with the expression profiles of tyrosinase genes in early larva of Crassostrea angulata and Crassostrea gigas (Yang et al., 2017; Huan et al., 2013). These results suggested that tyr6, tyr9, tyr10, and tyr11 might play important roles in the formation of the primary larval shells of Manila clams.
RNA interference is an important molecular tool for the analysis of gene function in vivo (Feng, Li & Yu, 2019). Over the past decades, RNAi was widely used to specifically silence the expression of any gene to study its functional effect (Wheeler, Carpenter & Sabatini, 2005) and as an effective approach for gene function validation and analysis (Paschka et al., 2003). In this work, RNAi-mediated gene silencing technology was performed to validate the effects of RNAi and the gene function. The results showed that the Rptyr9 gene was silenced at 48 to 96 h post-injection and increased gradually at 96 h post-injection and recovered to its original level at 120 h, which indicates that the endogenous tyr9 mRNA was degraded by dsRNA. However, there was no obvious change in the shell-color phenotypes of the clams. These results suggested that the dsRNA of tyr9 could effectively reduce the expression level of tyr9 at 48 to 96 h post-injection, but shell-color determination could be the long-term result of melanin accumulation (Yu et al., 2018), short-term knockdown of the tyr gene may not rapidly change the phenotype. A recent study in Crassostrea gigas reported the expression of tyrosinase was knocked down and shell growth was hindered after the dsRNA of tyrosinase was fed for 35 days (Feng, Li & Yu, 2019).
Conclusion
We identified four tyrosinase genes (tyr6, tyr9, tyr10, and tyr11) from R. philippinarum. Tissue expression analysis showed that tyr genes were highly expressed in mantle, a shell formation and pigmentation-related tissue. Those four tyr genes were expressed highly mainly in the mantle of dark shell-color strains and the expression level increased with the darkness of the shell-color. The injection of dsRNA of tyr9 significantly inhibited tyr9 expression temporarily. Therefore, we believe that tyrosinases play key roles in shell formation and high tyrosinase gene expression contributes to melanin accumulation to form a dark shell-color in R. philippinarum.