
Changes of cellular stress response related hsp70 and abcb1 transcript and Hsp70 protein levels in Siberian freshwater amphipods upon exposure to cadmium chloride in the lethal concentration range
- Published
- Accepted
- Received
- Academic Editor
- Jörg Oehlmann
- Subject Areas
- Molecular Biology, Ecotoxicology, Freshwater Biology
- Keywords
- Amphipods, Cellular stress response, Cadmium, hsp70, Lake Baikal, Heavy metal, Conjugated dienes, P-glycoprotein, Toxicity, Transcript levels
- Copyright
- © 2020 Protopopova et al.
- Licence
- This is an open access article distributed under the terms of the Creative Commons Attribution License, which permits unrestricted use, distribution, reproduction and adaptation in any medium and for any purpose provided that it is properly attributed. For attribution, the original author(s), title, publication source (PeerJ) and either DOI or URL of the article must be cited.
- Cite this article
- 2020. Changes of cellular stress response related hsp70 and abcb1 transcript and Hsp70 protein levels in Siberian freshwater amphipods upon exposure to cadmium chloride in the lethal concentration range. PeerJ 8:e8635 https://doi.org/10.7717/peerj.8635
Abstract
The induction of cellular stress response systems, heat shock protein hsp70/Hsp70 and multixenobiotic transporter abcb1, by cadmium chloride (CdCl2) was explored in amphipod species with different stress adaptation strategies from the Lake Baikal area. Based on the lethal concentrations (LC) of CdCl2, the sensitivities of the different species to CdCl2 were ranked (24 hr LC50 in mg/L CdCl2 (mean/95% confidence interval)): Gammarus lacustris (1.7/1.3–2.4) < Eulimnogammarus cyaneus (2.9/2.1–4.0) < Eulimnogammarus verrucosus (5.7/3.8–8.7) < Eulimnogammarus vittatus (18.1/12.4–26.6). Conjugated dienes, indicating lipid peroxidation, were significantly increased after 24 hr exposures to 5 mg/L CdCl2 only in the more CdCl2-sensitive species G. lacustris and E. cyaneus. Upon treatment with 0.54 to 5.8 mg/L CdCl2 for 1, 6 and 24 hrs, hsp70 transcript levels were generally more increased after the longer exposure times and in the more CdCl2-sensitive species. Relating the CdCl2 exposure concentrations to LCx values revealed that across the species the increases of hsp70 transcript levels were comparatively low (up to 2.6-fold) at CdCl2 concentrations ≤LC50. Relative hsp70 transcript levels were maximally increased in E. cyaneus by 5 mg/L CdCl2 (LC70) at 24 hrs (9.1-fold increase above the respective control). When G. lacustris was exposed to 5 mg/L CdCl2 (LC90) for 24 hrs, the increase in hsp70 was in comparison to E. cyaneus considerably less pronounced (3.0-fold increase in hsp70 levels relative to control). Upon exposure of amphipods to 5 mg/L CdCl2, increases in Hsp70 protein levels compared to untreated controls were highest in E. cyaneus at 1 and 6 hrs (5 mg/L CdCl2 LC70) and in E. verrucosus at 24 hrs (5 mg/L CdCl2 LC45). Thus, when the fold increases in Hsp70 protein levels in the different amphipod species were related to the respective species-specific LCx values a similar bell-shaped trend as for hsp70 transcript levels was seen across the species. Transcript levels of abcb1 in CdCl2exposed individuals of the different amphipod species varied up to 4.7-fold in relation to the respective controls. In contrast to hsp70/Hsp70, abcb1 transcripts in CdCl2 exposed individuals of the different amphipod species did not indicate similar levels of induction of abcb1 at equal LCx levels across the species. Induction of hsp70 and abcb1 genes and Hsp70 proteins by CdCl2 in the lethal concentration range shows that these cellular responses are rather insensitive to CdCl2 stress in the examined amphipod species. Furthermore, the increase of expression of these cellular defense systems at such high stress levels suggests that induction of these genes is not related to the maintenance of normal metabolism but to mitigation of the effects of severe toxic stress.
Introduction
Cadmium is a non-essential heavy metal entering the environment via various anthropogenic and natural sources. It causes poisoning in humans and wildlife at low concentrations (Pinot et al., 2000). Toxic cadmium effects have often been related with increased levels of reactive oxygen species (ROS) and reactive nitrogen species (RNS) that cause damage of biological macromolecules such as proteins (Nemmiche, 2017). Exposure to cadmium was found to lead to an increase in the levels of transcripts of proteins encoded by the cellular stress response genes hsp70 (Blechinger et al., 2002; Da Silva Cantinha et al., 2017; Eufemia & Epel, 2000; Haap & Köhler, 2009; Jung & Lee, 2012; Kim et al., 2014; Lee et al., 2006; Mlambo et al., 2010; Piano, Valbonesi & Fabbri, 2004; Schill, Görlitz & Köhler, 2003; Singer, Zimmermann & Sures, 2005; Werner & Nagel, 1997) and abcb1 (Eufemia & Epel, 2000; Ivanina & Sokolova, 2008; Zucchi et al., 2010) in a range of aquatic organisms. Induction of the hsp70 and abcb1 genes by cadmium can be related to the increased abundance of damaged cellular macromolecules, such as cellular membrane fragments or misfolded proteins (Beyersmann & Hechtenberg, 1997; Thévenod et al., 2000). Increased hsp70 and abcb1 transcript levels are therefore seen here as indication for cellular stress caused by cadmium.
Lake Baikal in Eastern Siberia, the oldest, deepest and by volume largest lake in the world, is a biodiversity hotspot with a high degree of endemicity (Kozhova & Izmest’eva, 1998; Timoshkin, 2001). Baikal’s water is generally highly pristine; however, the risk of water contamination by heavy metals is increasing. In particularly the Selenga river, the largest tributary of Lake Baikal comprising almost half of the riverine inflow into the lake, is the main source of such contaminants (Ciesielski et al., 2016; Kulikova et al., 2017).
Amphipods are a dominant taxon of the benthic communities of Lake Baikal and the more than 350 endemic species and subspecies represent 45.3% of all freshwater amphipod species of the world (Bedulina et al., 2014; Takhteev, 2000). The numerous phylogenetically closely related species featuring a range of adaptation strategies are interesting models for comparative studies (Luckenbach, Bedulina & Timofeyev, 2015). In the here studied amphipod species, constitutive expression levels of cellular stress response genes vary within an order of magnitude. A number of studies indicate that these different degrees of species-specific gene expression are related to differences in stress tolerance across species. Thus, constitutive hsp70 levels relate to the species-specific differences in thermotolerance (Axenov-Gribanov et al., 2016; Bedulina et al., 2013; Protopopova et al., 2014). Furthermore, different, species-dependant hsp70 and abcb1 gene responses to exposures to organic compounds, such as humic substances (Protopopova et al., 2014) and phenanthrene (Pavlichenko et al., 2015), were found.
In this study, we aimed to obtain an insight how sensitively cellular stress response genes hsp70 and abcb1 respond to heavy metal stress in amphipod species with different cellular stress response capacities. We addressed the question, at which stress levels those stress response genes are induced upon exposure of animals to CdCl2. The species-specific lethal CdCl2 concentrations after 24 hr exposure of animals to CdCl2 (LCx 24h) served as a measure for the stress levels elicited by CdCl2 at different concentrations in the different species. Quantitative polymerase chain reaction (qPCR) was used to quantify hsp70 and abcb1 transcript levels in RNA from tissue of amphipods upon exposure to different CdCl2 concentrations for up to 24 hrs. In addition, Hsp70 protein tissue levels were determined with western blot. The study was performed with four amphipod species that differ with regard to their ecological preferences and habitats and accordingly with their physiological and cellular adaptations to environmental conditions (Axenov-Gribanov et al., 2016; Bedulina et al., 2013; Jakob et al., 2016). Three species, all with littoral habitats, were from the Baikal endemic Eulinogammarus genus. In addition, the Holarctic amphipod Gammarus lacustris was examined. The species occurs in waters connected to Lake Baikal but not in the areas of the lake inhabited by endemic fauna.
Materials and Methods
Studied species and animal sampling
The experimental species were Eulimnogammarus cyaneus (Dyb., 1874), Eulimnogammarus verrucosus (Gerstf., 1858) and Eulimnogammarus vittatus (Dyb., 1874), endemic to Lake Baikal, and Gammarus lacustris (Sars, 1863), a common species in surface waters across the Holarctic. Eulimnogammarus cyaneus is most abundant along the shallow shoreline (mainly down to 1 m water depth), few individuals occur at water depths down to 20 m (Weinberg & Kamaltynov, 1998) at temperatures between 5−13 °C (Takhteev, 2000). Habitats of E. vittatus are at water depths of down to 30 m, its abundance peak is at 2–3 m depth (Bazikalova, 1945); the water temperatures in its habitat range between 9−13 °C (Takhteev, 2000). Eulimnogammarus verrucosus commonly occurs close to shore across Lake Baikal at water depths of less than 1 m to down to 10 to 15 m (Bazikalova, 1945) at temperatures of 5−13 °C (Takhteev, 2000). Gammarus lacustris is common in shallow, eutrophic lakes with seasonal temperature fluctuations in the Lake Baikal region at water depths of 0–7 m, but the species is not found in the open Baikal (Bekman, 1954). Constitutive transcript and protein levels of heat shock protein 70 (hsp70/Hsp70) and transcript levels of ATP binding cassette (ABC) transporter 1 (abcb1) indicate the cellular stress response capacities of the species in the order: Eulimnogammarus vittatus ≈ Eulimnogammarus verrucosus <<Eulimnogammarus cyaneus <Gammarus lacustris (Protopopova et al., 2014). Indeed, the species-specific constitutive and induced hsp70/Hsp70 levels correlate with higher degrees of thermotolerance of E. cyaneus and G. lacustris compared to E. verrucosus (Axenov-Gribanov et al., 2016; Bedulina et al., 2013; Jakob et al., 2016).
Eulimnogammarus specimens for the experiments were sampled at the Baikal shoreline close to Irkutsk State University’s biological station at the Bolshie Koty settlement (Southern Baikal). Gammarus lacustris was collected from a small shallow artificial pond close to Bolshie Koty [“Lake 14”, for specifications of the sampling points refer to Protopopova et al. (2014)]. Body lengths and weights of the animals used in the experiments were: E. verrucosus—20 to 25 mm, 403 ± 95 mg; E. vittatus—18 to 20 mm, 121 ± 16 mg; E. cyaneus—9 to 14 mm, 17 ± 3 mg; G. lacustris—14 to 18 mm, 80 ± 16 mg. Upon sampling, the animals were brought to the lab in a cold box with water from the sampling sites. The water parameters of Lake Baikal and ”Lake 14” measured in another year [summer 2012, refer to Gurkov et al. (2019)] than the amphipod samplings for this experiment (summer 2011) can be seen as representative for the water parameters at the sampling sites at Baikal/”Lake 14” at this time of the year: Temperature—11 °C/8 °C, pH—7.5/6.8; [O2]—12 mg/L/9 mg/L. Animals were acclimated to lab conditions in aerated water in 2 L tanks at 6.5−7 °C for 1 to 3 days prior to the experiments. The water used for maintaining the animals in the tanks and for the experiments was withdrawn from Lake Baikal with buckets from the pier next to the Biological Station in Bolshie Koty. Lake Baikal water instead of water from the pond “Lake 14” was also used for G. lacustris exposures. Thus, it was avoided that different water characteristics (minerals, organic matter) caused differences in CdCl2 toxicity in the different species.
Acute toxicities of CdCl2
Acute toxicities of CdCl2 to amphipods were determined in 24 hr exposure experiments. Aqueous CdCl2 solutions for the experiments were set up in glass tanks with 2 L of well-aerated water along a control with clean water. The water temperature in the tanks was maintained at 6.5 to 7.0 °C during the exposures. Twenty individuals of each species were placed in each tank. Concentration series with a total of eight different CdCl2 concentrations across different replicate experiments were set up. One tank was set up per CdCl2 concentration and control in each replicate experiment. The CdCl2 concentration ranges were 0.5 to 8 mg/L for G. lacustris and E. cyaneus and 0.625 to 30 mg/L for E. verrucosus and E. vittatus. Dead animals were removed and recorded during the experiments and all animals in all tanks were counted at the end of the exposures. Exposure experiments were repeated two to three times with different CdCl2 concentrations that were chosen depending on the mortality rates determined for the already tested concentrations. Cadmium concentrations in water from a control and a CdCl2 exposure were determined with atomic absorption spectroscopy (AAS) at the Analytical Chemistry Department at the UFZ. The actual Cd concentration deviated from the nominal concentration by 15% (nominal: 10 CdCl2 mg/L; actual: 8.5 CdCl2 mg/L). All given CdCl2 concentration values were accordingly adapted (i.e., the given concentration values are 15% lower than the initial nominal concentrations).
Measurements of conjugated diene levels
Levels of conjugated dienes were measured in amphipods upon exposure to 5 mg/L CdCl2 for 1, 6 and 24 hrs and in respective controls with uncontaminated water according to Stalnaya (1977) with some modifications. Several entire animals were pooled to obtain 150–800 mg fresh tissue, depending on the species. The tissue was homogenized in a heptane/isopropyl alcohol mixture (1:1, v/v) using a Potter-Elvehjem tissue homogenizer. The extract was then filled in a glass tube and brought up to a volume of 4.5 ml with a heptane/isopropyl alcohol mixture. One ml of distilled water was added, the mix was vigorously shaken and incubated at 25 °C for 30 min for phase separation. Half a ml of the heptane phase was mixed with ethanol in a 1:3 ratio (v/v) and the absorbance at 233 nm was measured on a SmartSpec Plus spectrophotometer (Bio-Rad) with extraction blanks used as references. An extinction coefficient of 2.52 ×10⁴ M−1cm−1 (Low & Nickander, 1991) was used to determine the amount of conjugated dienes in the solution. The data are reported as nmol g−1 wet weight. The numbers of replicates were after 1 hr/6 hrs/24 hrs: 6/6/9 (CdCl2 treatment), 6/5/6 (control) for E. verrucosus; 6/5/5 (CdCl2 treatment), 5/5/6 (control) for E. vittatus; 4/5/6 (CdCl2 treatment), 4/4/4 (control) for E. vittatus; 5/5/3 (CdCl2 treatment), 5/5/5 (control) for G. lacustris.
CdCl2 exposures for investigating cellular stress responses
To examine cellular responses of the different amphipod species to CdCl2 exposure amphipods were exposed to CdCl2 concentrations resembling the species-specific LC10 and LC50 values. Eulimnogammarus cyaneus, E. verrucosus, G. lacustris were in addition exposed to CdCl2 concentrations of 1.7 mg/L ( LC50 for G. lacustris) and of 5 mg/L ( LC10 for E. vittatus). Eulimnogammarus vittatus was only exposed to 5 mg/L ( LC10). Concentrations of CdCl2 in the LC10/LC50-experiment were: E. cyaneus—0.68/2.89 mg/L, E. verrucosus—0.54/5.75 mg/L, G. lacustris—0.59/1.7 mg/L. In parallel to all CdCl2 exposures controls were kept in uncontaminated water. Exposures of amphipods to CdCl2 were in aerated 2 L tanks (n = 5/concentration) with Baikal water at 7 °C. Specimens were sampled after 1, 6, and 24 h exposures, frozen and stored in liquid nitrogen for extraction of total protein and diene conjugates or placed in QIAzol Lysis Reagent (Qiagen, Hilden, Germany) and frozen in liquid nitrogen for RNA isolation. Control animals were kept in water not contaminated with CdCl2 but otherwise at equal temperature and aeration conditions as CdCl2 exposed animals. One whole specimen of E. verrucosus or a pool of several whole animals of the other species equalling 200–500 mg of tissue were used for the further analyses. All exposure experiments were repeated three to nine times and all samples were assessed in triplicate.
Isolation of total RNA and cDNA synthesis
Isolation of total RNA and cDNA synthesis were performed as described in Pavlichenko et al. (2015). The tissue preserved in QIAzol Lysis Reagent was homogenized with a MM400 homogenizer (Retsch, Haan, Germany) followed by a phenol-guanidine-chloroform based extraction of total RNA. To improve the separation of the organic and aqueous phases MaXtract gel (Qiagen) was used according to the manufacturer. Total RNA was purified from the obtained aqueous phase with the miRNeasy kit with DNase treatment using a QIAcube instrument (Qiagen). One µg of total RNA was reverse-transcribed to single-stranded cDNA using Oligo(dT)18 primer (Fermentas, USA, order no. SO131) and H Minus Reverse Transcriptase (Fermentas, USA, order no. EP0452) following the manufacturer’s instructions.
Quantitative real-time PCR analysis
Gene expression levels were analysed with quantitative polymerase chain reaction (qPCR) using a StepOnePlus Real-Time PCR System (Applied Biosystems) as described previously (Protopopova et al., 2014). The amplification was performed in a final volume of 12.5 µl using the SensiMix SYBR Low-ROX Kit (Bioline) with each primer at 200 nM. Primer sequences for qPCR of hsp70 and abcb1 and housekeeping genes β-actin, gapdh and ef1-a were from Protopopova et al. (2014); qPCR conditions were according to Pavlichenko et al. (2015) and Protopopova et al. (2014): 94 °C for 4 min; 35 (for hsp70 and references genes) and 45 cycles (for abcb1) with 95 °C for 15 s, 60−62 °C for 15 s and 72 °C for 15 s followed to fluorescent measurement step with 78−79 °C (close to the melting temperature of the PCR products) for 10 s. The extra step for fluorescence measurement was added to avoid detection of unspecific amplification products and primer dimers. Relative expression levels of hsp70 and abcb1 genes were calculated with the comparative ΔΔCt method (Livak & Schmittgen, 2001) using efficiency corrected calculation models and Best Keeper levels based on the geometric mean of the Ct values of the housekeeping genes (Pfaffl, 2006; Pfaffl et al., 2004; Vandesompele et al., 2002).
Western blotting
Isolation of total protein from amphipod tissue and western blotting were performed as described in Protopopova et al. (2014). Tissues were homogenized in 0.1 M Tris buffer (pH = 7.6) containing 1.5 mg phenylmethylsulfonyl fluoride (PMSF) and 1% protease inhibitor cocktail (Amresco, USA); proteins were then subjected to denaturation in Tris-HCl buffer [0.25 M Tris-HCl (pH = 6.8), 5% sodium dodecyl sulphate (SDS), 0.5 mM ethylenediamine tetraacetic acid (EDTA), 10% glycerol, 5% ß-mercaptoethanol and 0.03% Bromophenol Blue] at 95 °C for 5 min. Total protein concentrations were determined following Lowry et al. (1951). Equal amounts of total protein per sample were separated by SDS gel electrophoresis on a 12.5% polyacrylamide gel (Laemmli, 1970) using a Mini-PROTEAN II Electrophoretic Cell (Bio-Rad, USA). Wet-transfer of the proteins from the gel to a polyvinylidene difluoride transfer membrane (GE Healthcare, UK) was according to Towbin, Staehelin & Gordon (1979) with minor modifications. Hsp70 protein was labelled with anti-HSP70 (Sigma-Aldrich, order no. H9776) at 1:3000, which detects both the inducible and constitutive forms of HSP70, and with secondary antibodies conjugated with alkaline phosphatase (Anti-Mouse IgG:AP Conj., Stressgen, order no. SAB-101) at 1:1000. Anti-actin antibody (Sigma-Aldrich, order no. A2668) dissolved 1:400 and secondary antibodies (Anti-Rabbit IgG, Sigma, order no. A9919) dissolved 1:1000 were used for actin labelling. Sixty ng of bovine Hsp70 (Sigma-Aldrich, order no. H9776) and 60 ng of bovine actin (Sigma-Aldrich, order no. A3653) were used as positive controls. Bands were visualized with 0.4 mM BCIP (5-bromo-4-chloro-3-indolyl phosphate) and 0.4 mM nBT (nitroblue tetrazolium). The Gel Explorer software package (DNAtechnology, Russia) was used for semi-quantitative measurements of Hsp70 and actin levels on the membranes and Hsp70 levels were normalized relative to actin for each sample.
Data analysis and statistics
Regressions of concentration-mortality relationships were calculated by fitting mortalities at the respective concentrations to the non-linear HILL model: (1) where
Y is the mortality at the CdCl2 concentration c
X is the logarithm of the CdCl2 concentration
min is the minimum percentage mortality (control, constrained to 0)
max is the maximal percentage mortality (constrained to 100)
P is the shape parameter
LC50 is the CdCl2 concentration causing mortality of 50% of the individuals
Data from qPCR, western blotting and lipid peroxidation analyses were found to satisfy the assumptions of equal variance and normality and parametric statistics were used. For pairwise comparisons of abcb1 and hsp70/Hsp70 levels in treatments and respective controls at each time point the t-test was applied. Multiple comparisons of several treatments with one respective control were done with two-way ANOVA and Dunnett’s test. To analyse the significance of observed changes in each time-point, pair-wise comparisons with the respective control were done. The results of multiple pair-wise comparisons were done using Steel-Dwass method for all pairs’ comparison. Differences were regarded as significant if P < 0.05. Regressions were calculated with Graphpad Prism version 7. Statistical analyses were performed with JMP version 10.0 (SAS Institute, Cary, NC).
Results
Lethal CdCl2 concentrations
Acutely toxic CdCl2 concentrations were across the different amphipod species from <1 to <100 mg/L (Fig. 1, Table 1). The range of LCx values calculated from CdCl2 concentration—lethality relationships varied over an order of magnitude across the species. LCx values were highest for E. vittatus indicating the lowest sensitivity of this species to CdCl2. The order of the species with regard to their sensitivities to CdCl2 was: G. lacustris <E. cyaneus <E. verrucosus <E. vittatus (Fig. 1, Table 1). Below, we report the molecular effects of CdCl2 on the amphipods related to the species-specific LCx values. The LCx values serve as representations of the species-specific stress levels elicited by CdCl2 at different concentrations.
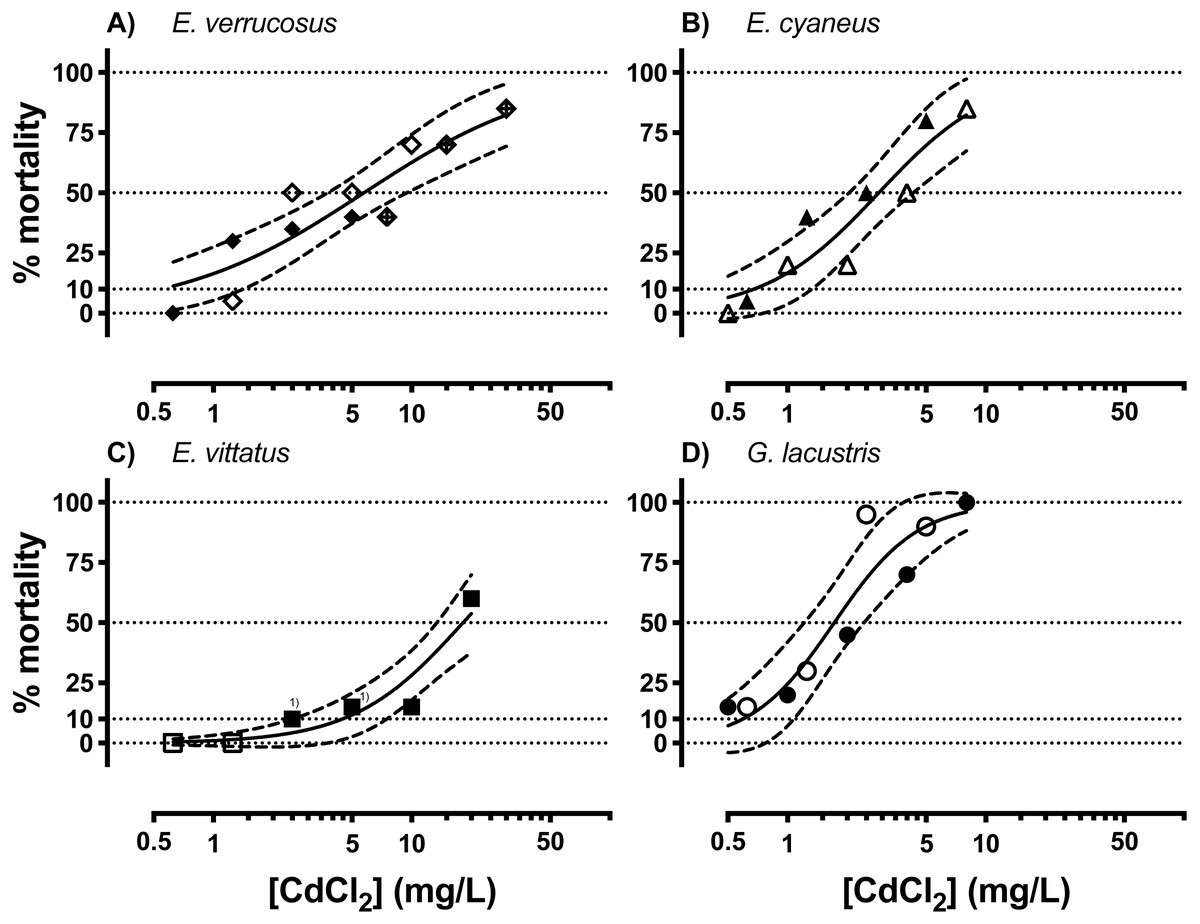
Figure 1: Concentration-mortality relationships for CdCl2 in the different amphipod species.
(A) E. verrucosus, (B) E. cyaneus, (C) E. vittatus, (D) G. lacustris. Symbols represent the observed % mortality at a certain CdCl2 concentration in a single treatment. Solid lines are regressions fitted with the HILL model (Eq. (1)) to all the data in the graph and dashed lines are the 95% confidence intervals. Each symbol stands for a single data point, symbols marked with (1) represent two data points from different experimental series. Data for % mortality were obtained in two or three separate experimental series with different CdCl2 concentrations. Symbols represent data from a certain experimental series. Test series 1: filled symbols; test series 2: empty symbols; test series 3: symbol filled with a cross.
| E. verrucosus | E. cyaneus | E. vittatus | G. lacustris | ||
|---|---|---|---|---|---|
| LCx | 10 | 0.54 | 0.67 | 4.47 | 0.59 |
| 25 | 1.76 | 1.38 | 8.98 | 1.01 | |
| 30 | 2.31 | 1.64 | 10.63 | 1.14 | |
| 45 | 4.65 | 2.52 | 16.07 | 1.55 | |
| 50 (95% CI ) | 5.72 (3.8–8.7) | 2.89 (2.1–4.0) | 18.05 (12.4–26.6) | 1.71 (1.3–2.4) | |
| 70 | 14.31 | 5.05 | 31.05 | 2.59 | |
| 75 | 18.76 | 5.96 | 36.74 | 2.91 | |
| 90 | 60.81 | 12.22 | 73.81 | 4.98 | |
| Hill slope (95% CI) | 0.20 (0.5–1.4) | 0.34 (0.7–2.3) | 0.34 (0.7–2.4) | 0.53 (0.8–3.3) | |
| R2 | 0.83 | 0.87 | 0.88 | 0.88 | |
Notes:
- CI
-
confidence interval
- R2
-
curve fit
Conjugated diene levels
No significant changes in conjugated diene levels (P > 0.05) were detected in individuals of any of the examined species exposed to 5 mg/L CdCl2 for 1 and 6 hrs. After 24 hr exposures, conjugated diene levels were significantly increased compared to the respective controls (P < 0.05) in E. cyaneus and G. lacustris by about 58% (p = 0.0061, t-test) and 47% (p = 0.0018, t-test), respectively (Fig. 2). The CdCl2 concentration of 5 mg/L corresponds to LC90 for G. lacustris, LC70 for E. cyaneus, LC45 for E. verrucosus and LC10 for E. vittatus (Fig. 1, Table 1). Thus, the significant changes in conjugated diene levels occurred only in the more sensitive species.
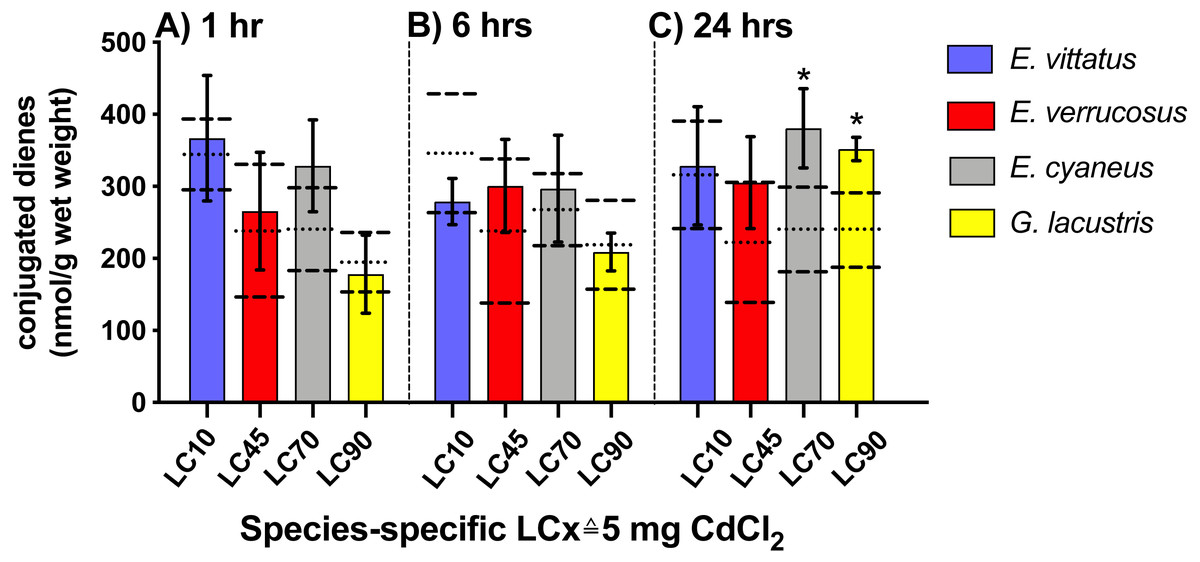
Figure 2: Levels of conjugated dienes (CD; nmol g−1 wet weight) in the different amphipod species upon exposure to 5 mg/L CdCl2.
Exposure times to CdCl2 were 1 hr (A), 6 hrs (B) and 24 hrs (C). The CdCl2 concentration of 5 mg/L corresponds to the species-specific LCx values on the x-axis (refer to Table 1). Data for CdCl2 exposed animals are depicted as columns (mean) and bars (standard deviations); data for the respective controls are shown as dotted (mean) and dashed (standard deviations) lines. Significant differences between treatments and respective controls are indicated by *(p < 0.05; refer to Table 2 for P-values). N = 3 − 9 (refer to ‘Materials and Methods’ for details).
Heat shock protein 70 transcript/protein levels
Hsp70 transcript levels across the amphipod species were upon exposures to CdCl2 significantly (p < 0.05) increased by between 1.4—(E. cyaneus at LC30 for 24 hrs) to up to 9.1-fold (E. cyaneus at LC70 for 24 hrs) (Fig. 3, for P-values refer Table 2, for correspondent CdCl2 concentrations to LCx values refer to Table 1). With longer exposure times to CdCl2, changes in hsp70 transcript levels were generally more pronounced in all amphipod species: After 1 hr exposures, hsp70 levels were significantly (p < 0.05) increased in two cases (E. cyaneus at LC30, G. lacustris at LC90), after 6 hr exposures in four cases (E. cyaneus at LC30, E. verrucosus and G. lacustris at LC50, G. lacustris at LC90) and after 24 hr exposures in nine cases (E. vittatus at LC10, G. lacustris at LC10, LC50 and LC90, E. verrucosus at LC25, LC45 and LC50, E. cyaneus at LC30 and LC70; Fig. 3A, Table 2). Maximum hsp70 transcript levels were at 1, 6 and 24 hrs CdCl2 exposure at LC70 (E. cyaneus); at the lower LCx values and at LC90 the hsp70 transcript levels were across the species lower (Fig. 3).

Figure 3: Hsp70 transcript levels in tissue of the different amphipod species upon exposure to CdCl2 for 1, 6 and 24 hrs.
Exposure times to CdCl2 were 1 hr (A), 6 hrs (B) and 24 hrs (C). CdCl2 concentrations were scaled to the species-specific LCx values (refer to Table 1 for the LCx equivalences in mg/L). Depicted are mean hsp 70 expression levels (columns) and standard deviations (bars) in CdCl2 exposed animals. Expression levels in controls are shown as dotted (mean) and dashed (standard deviations) lines. Significant differences between treatments and respective controls are indicated by * (p < 0.05; refer to Table 2 for P-values).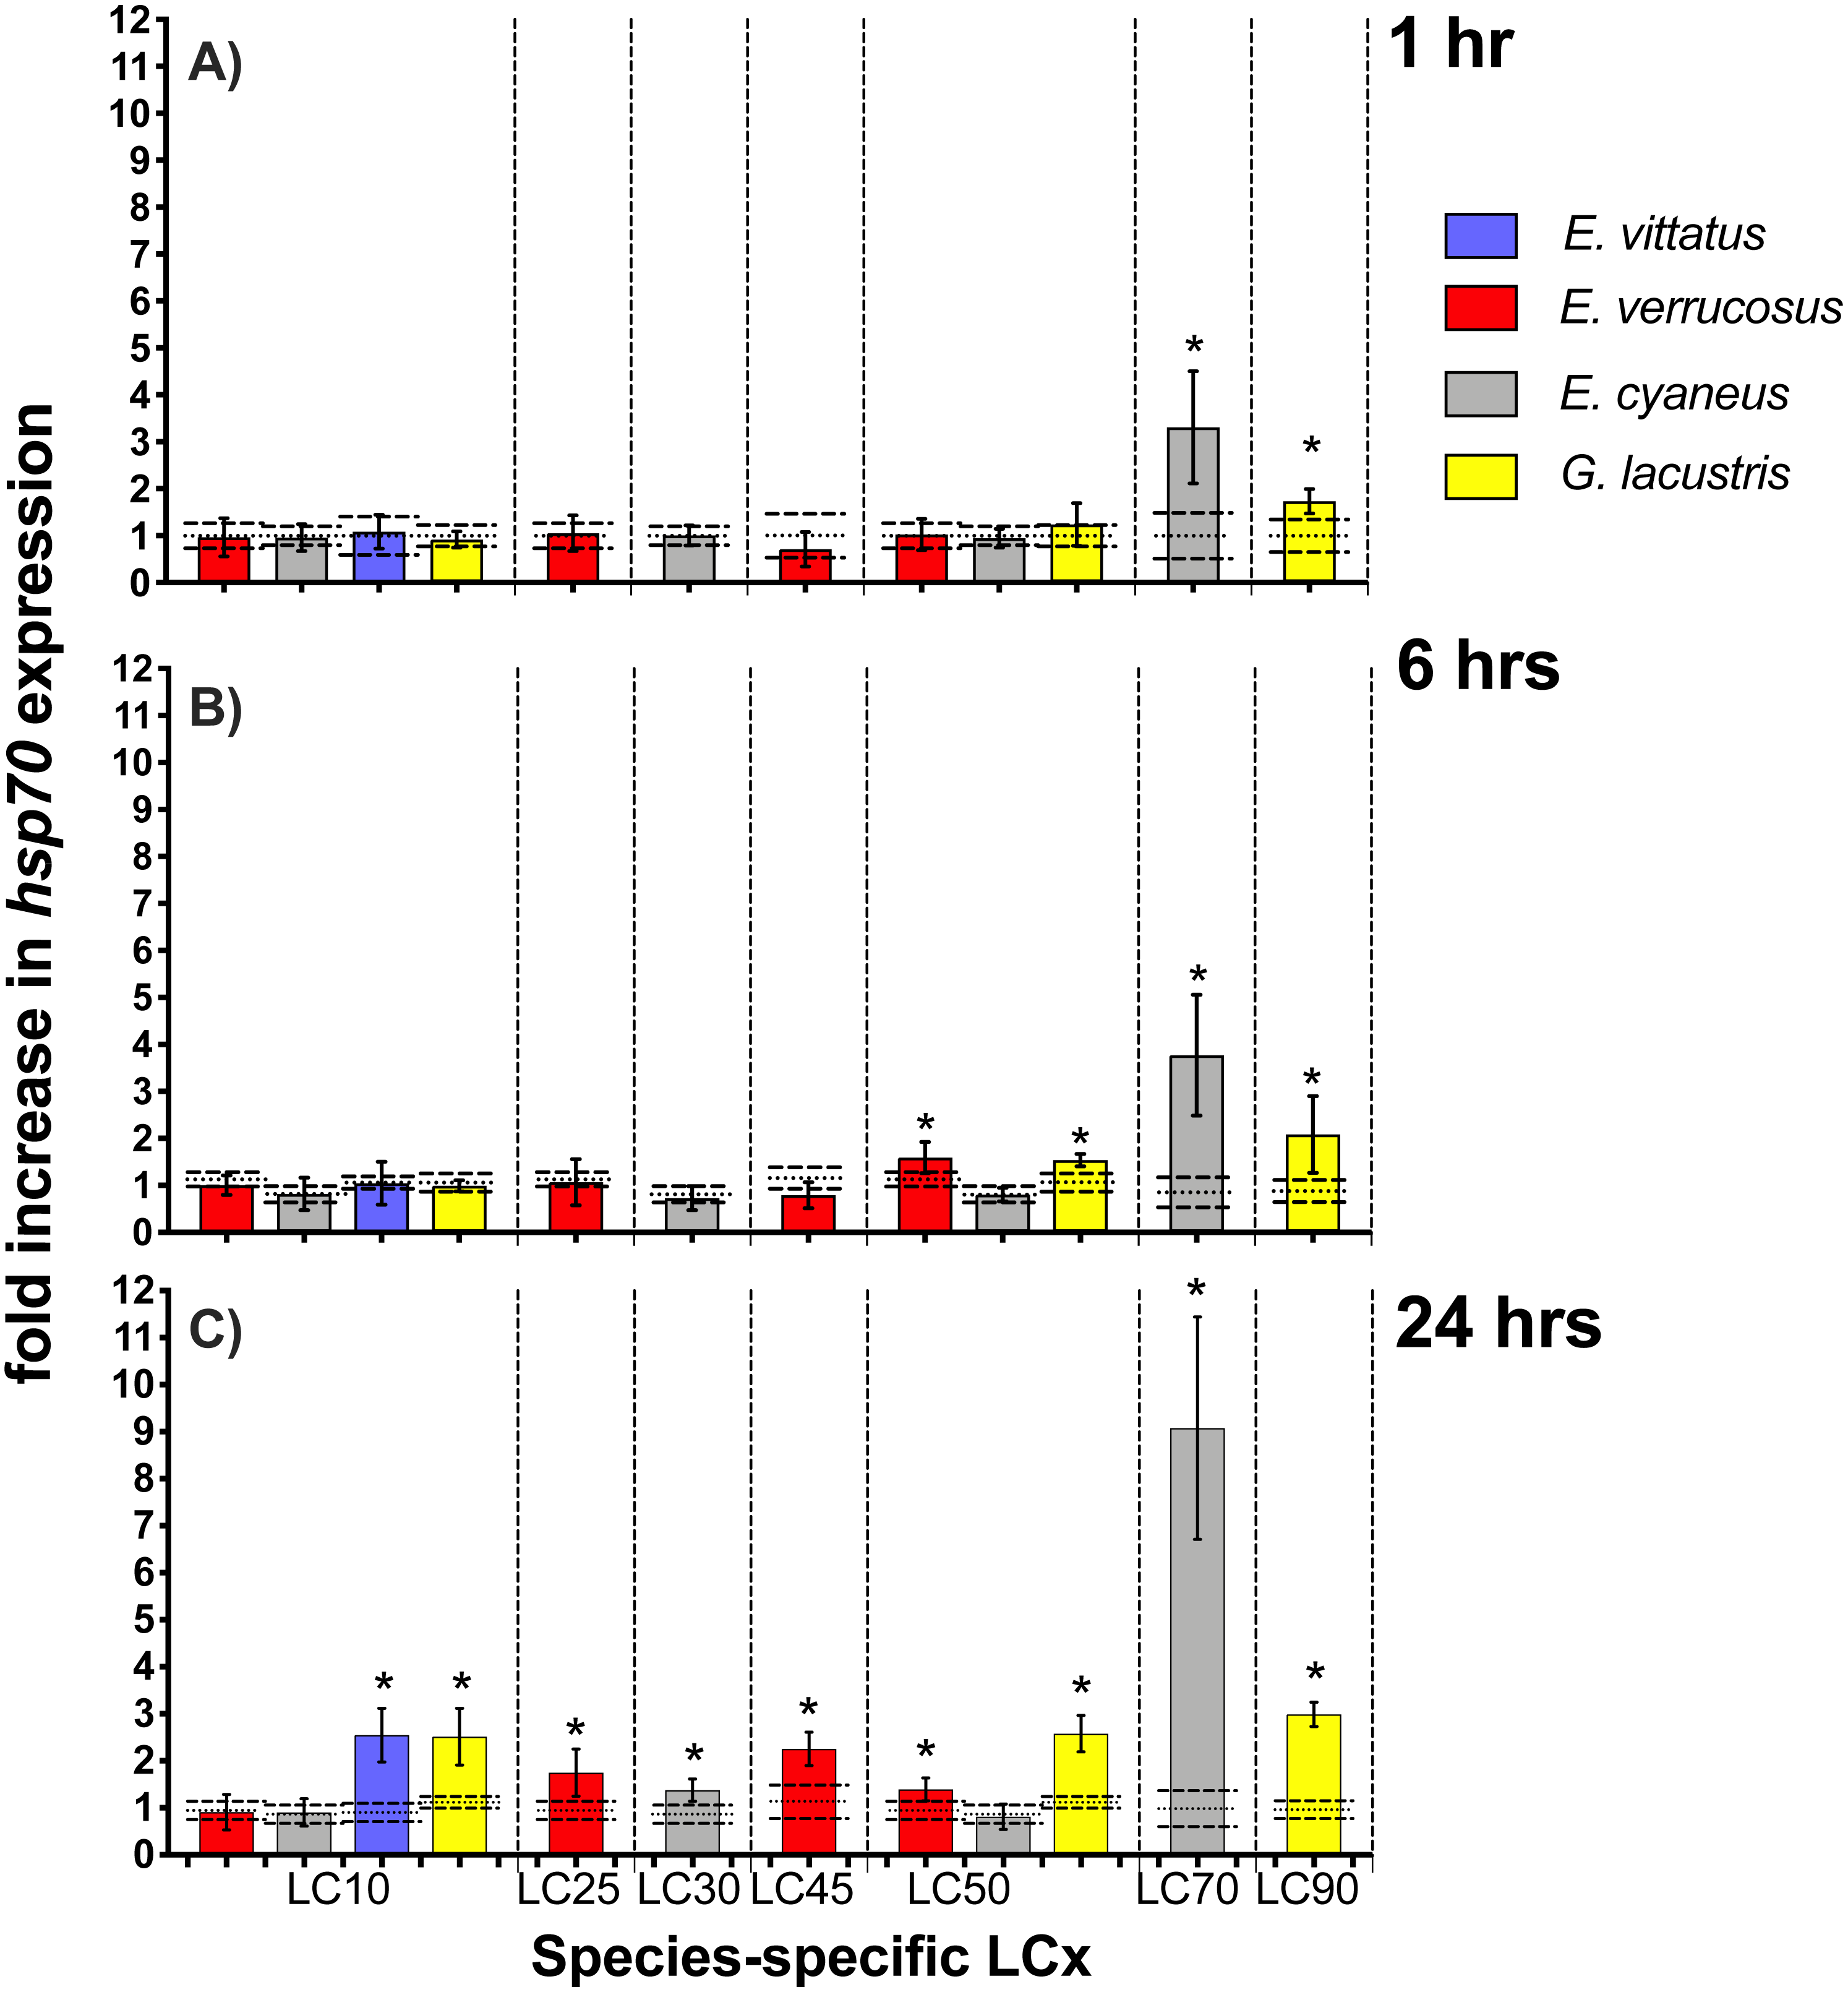
| Exposure time (h) | LC10 | LC25 | LC30 | LC45 | LC50 | LC70 | LC90 | |
|---|---|---|---|---|---|---|---|---|
| E. verrucosus | 1 | P = 0.00033∗ | ||||||
| 6 | P = 0.00571 | |||||||
| 24 | P = 0.00051 | P = 0.0041; | p = 0.00201 | |||||
| P = 0.00222; | ||||||||
| P = 0.00243 | ||||||||
| E. cyaneus | 1 | p < 0.00011; | ||||||
| P = 0.00152; | ||||||||
| P = 0.00053 | ||||||||
| 6 | P = 0.00033∗ | P = 0.00021; | ||||||
| P = 0.01042; | ||||||||
| 24 | p = 0.00391 | P = 0.01133∗ | P < 0.00011 | |||||
| E. vittatus | 1 | |||||||
| 6 | ||||||||
| 24 | P < 0.00011 | |||||||
| P = 0.00053 | ||||||||
| G. lacustris | 1 | P = 0.00361; | ||||||
| P = 0.00773; | ||||||||
| 6 | p = 0.00141 | P = 0.00821 ; | ||||||
| P < 0.00013 | ||||||||
| 24 | P = 0.00081 | p < 0.00011 | P < 0.00011; | |||||
| P < 0.00013 |
Notes:
P-values marked with * were determined with Dunnet’s test, all other P-values were determined with the t-test.
Upon 1 and 6 hr exposures to 5 mg/l CdCl2 ( species-specific LC70), Hsp70 protein levels were significantly increased (P < 0.05) in E. cyaneus by 1.8- and 1.7-fold vs. the respective controls. After 24 hrs CdCl2 exposure, the Hsp70 protein level showed a significant increase (P <0.05) in E. verrucosus by 2.6-fold above the control (Fig. 4, Table 2; 5 mg/l CdCl2 species-specific LC45). In E. vittatus and G. lacustris, Hsp70 protein levels in CdCl2-exposed animals were not significantly changed (P > 0.05; Fig. 4). The applied CdCl2 corresponded to the species-specific LC10 and LC90 values, respectively (Fig. 1, Table 1).
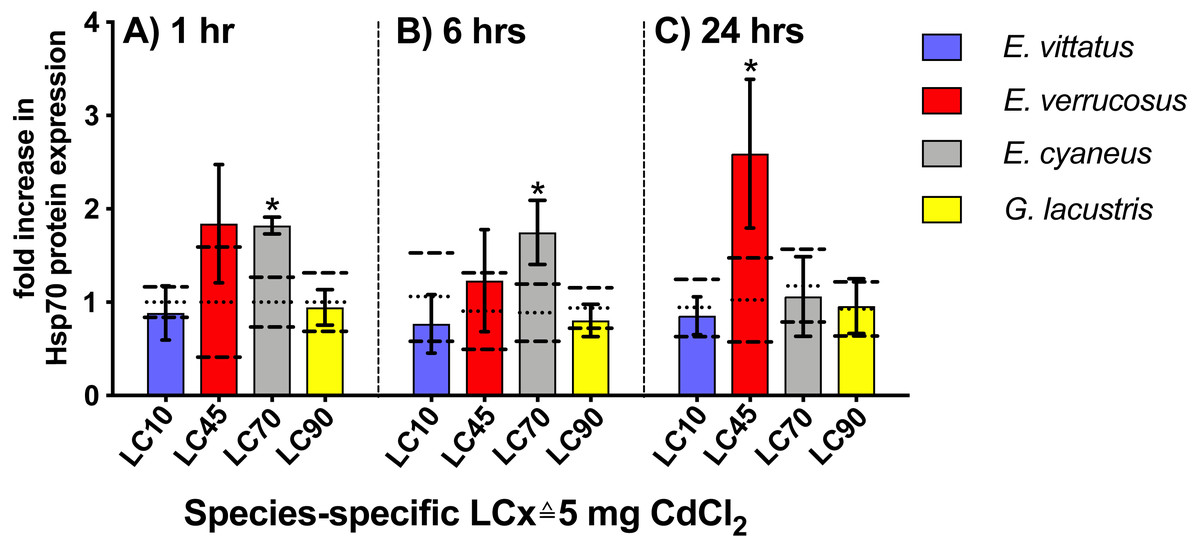
Figure 4: Hsp70 protein levels in tissue of the different amphipod species upon exposure to 5 mg/L CdCl2 for 1, 6 and 24 hrs.
Exposure times to CdCl2 were 1 hr (A), 6 hrs (B) and 24 hrs (C). CdCl2 concentrations were scaled to the species-specific LCx values (refer to Table 1 for the LCx equivalences in mg/L). Depicted are mean hsp 70 expression levels (columns) and standard deviations (bars) in CdCl2 exposed animals. Expression levels in controls are shown as dotted (mean) and dashed (standard deviations) lines. Significant differences between treatments and respective controls are indicated by * (p < 0.05; refer to Table 2 for P-values).
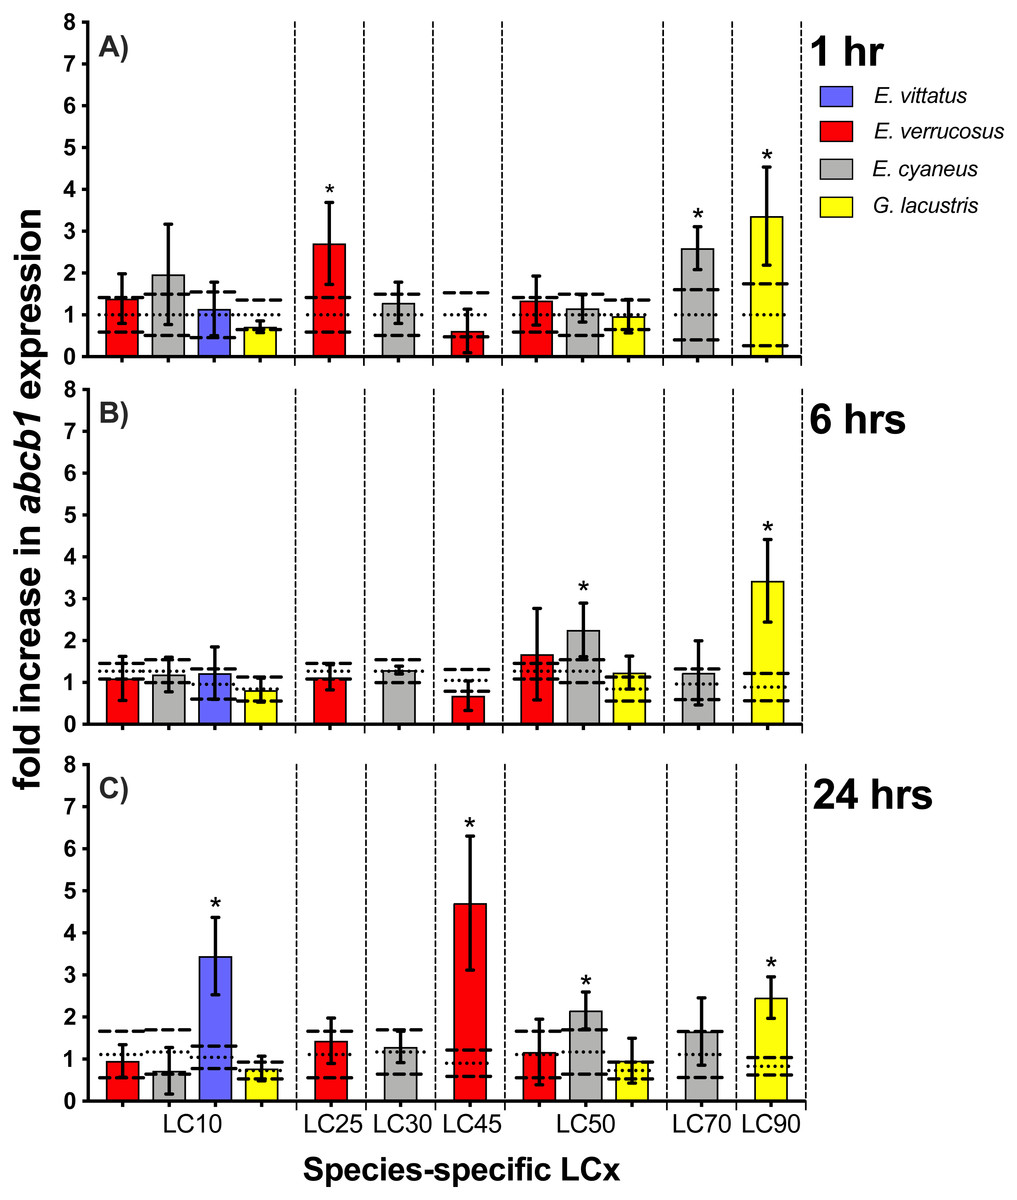
Figure 5: Relative abcb1 levels in amphipods upon exposure to CdCl2 for 1, 6 and 24 hrs.
Exposure times to CdCl2 were 1 hr (A), 6 hrs (B) and 24 hrs (C). The shown abcb1 transcript levels were scaled to the species-specific LCx values (refer to Table 1 for the LCx equivalences in mg/L). Depicted are mean abcb1 levels (columns) and standard deviations (bars) in CdCl2 exposed animals. Expression levels in controls are shown as dotted (mean) and dashed (standard deviations) lines. Significant differences between treatments and respective controls are indicated by *(p < 0.05; refer to Table 2 for P-values).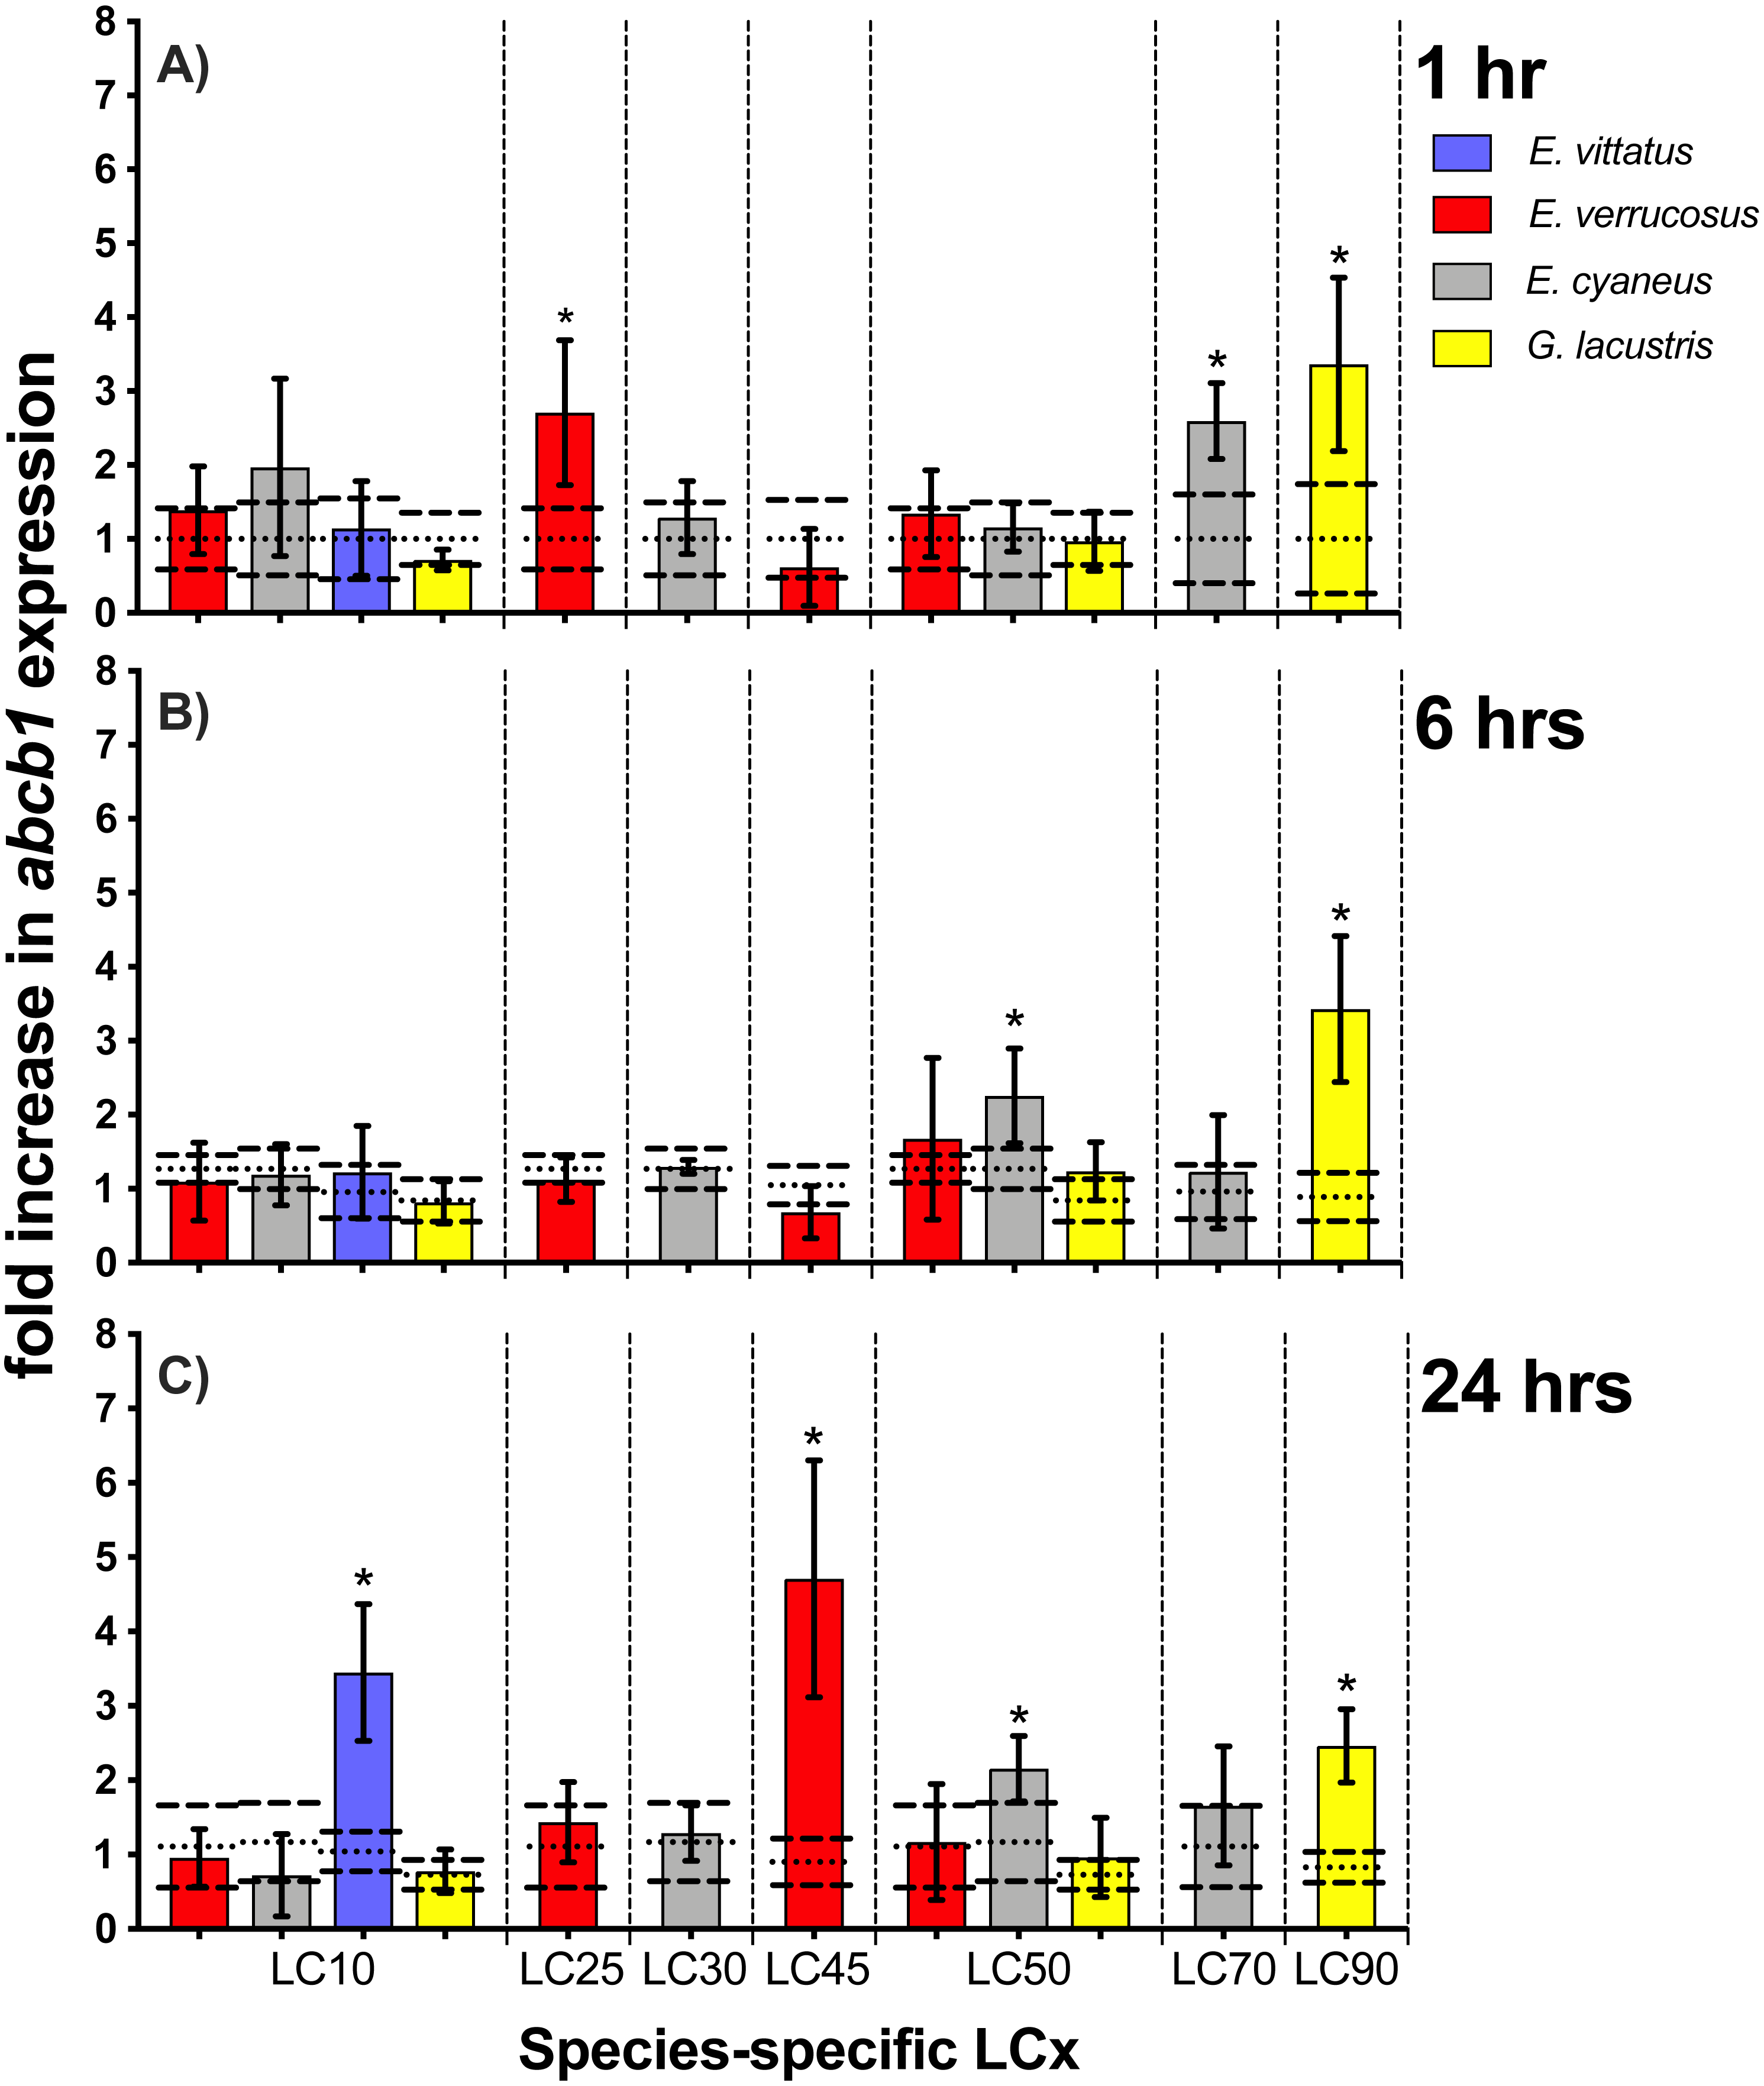
Abcb1 transcript levels
Upon exposures of amphipods to CdCl2, abcb1 transcript levels were significantly (p < 0.05) increased by between 2.2- (E. cyaneus at LC50 for 24 hrs) to up to 4.7-fold (E. verrucosus at LC45 for 24 hrs) (Fig. 5, Table 2). The numbers of cases of significant increases of abcb1 transcripts differed only slightly after the different exposure times. Thus, abcb1 transcript levels were increased in three cases after 1 hr exposures (E. verrucosus at LC25, E. cyaneus at LC70, G. lacustris at LC90), in two cases after 6 hr exposures (E. cyaneus at LC50, G. lacustris at LC90) and in four cases after 24 hr exposures (E. verrucosus at LC45, E. cyaneus at LC50, G. lacustris at LC90, E. vittatus at LC10) (Fig. 5, Table 2). Significant abcb1 transcript increases at all three time points occurred only in G. lacustris at LC90; abcb1 transcripts were increased at two time points in E. cyaneus at LC50 (Fig. 5, Table 2). In the other cases, significant abcb1 transcript increases were only seen at one time point. Changes in abcb1 transcript levels did not seem to depend on the CdCl2 concentration or the LCx level; the significant changes were seen across different LCx values and were not generally induced at higher or lower LCx values (Fig. 5, Table 2, for LCx correspondent CdCl2 concentrations values refer to Table 1).
Discussion
In this study, different amphipod species were compared regarding their sensitivities and the reactions of their cellular stress response systems to CdCl2 exposure. The species-specific sensitivities to CdCl2 were clearly different, as shown by LC50 values ranging over one order of magnitude (Fig. 1, Table 1). In line with sensitivities ranked by LC50 values, conjugated diene levels were only increased in E. cyaneus and G. lacustris that, based on their LCx, were the more sensitive species (Fig. 2). Conjugated dienes are primary products of lipid peroxidation resulting from oxidative stress (Chang et al., 2011; Jozwik et al., 1999), a main cause of cadmium toxicity (Dally & Hartwig, 1997; Stohs & Bagchi, 1995). The occurrence of oxidative stress caused by CdCl2 exposure in amphipods was previously shown by the inhibition of common antioxidant enzymes in CdCl2-exposed individuals (Timofeyev et al., 2008).
Sensitivities to CdCl2 expsoure
Experimental conditions could have influenced the sensitivities of the amphipods to CdCl2 exposure. Thus, it is conceivable that the experimental temperature, which was equal for all species (6.5–7.0 °C), may have had an effect on the species-specific sensitivities to CdCl2. As mentioned above in the species description (“3.1. Studied species and animal sampling” in the Materials and Methods section), the studied species inhabit different water zones with different temperatures. Along those lines, laboratory studies showed that the different species preferentially choose different temperature ranges, according to their habitats. Experiments, in which amphipods were kept in water with a temperature gradient, indicated that E. verrucosus and E. vittatus are adapted to colder temperatures than E. cyaneus and G. lacustris: The temperature ranges preferentially chosen were 5 °C to 6 °C by both E. verrucosus and E. vittatus, 11° to 12 °C by E. cyaneus and 15° to 16 °C by G. lacustris (Timofeyev, Shatilina & Stom, 2001; Timofeyev & Shatilina, 2007). It thus seems possible that E. cyaneus and G. lacustris may have been metabolically more depressed at the experimental temperature than E. verrucosus and E. vittatus. In our experiments, E. cyaneus and G. lacustris were in comparison to E. verrucosus and E. vittatus more sensitive to CdCl2. If the experimental temperature in our study had resulted in metabolic depression in E. cyaneus and G. lacustris, the sensitivities of those species to CdCl2 may be even more increased at higher temperatures that are closer to their physiological optima.
A further parameter determining the species-specific sensitivity to CdCl2 is the cadmium uptake rate into the tissue and the resulting internal cadmium levels. Cadmium uptake majorly depends on body size. It was shown with aquatic insects that the uptake rate is higher in smaller species, depending on the in relation larger body surface area across which cadmium is taken up (Buchwalter et al., 2008). In a study with amphipods, cadmium uptake rates during CdCl2 exposures were accordingly found to be higher in the smaller and more sensitive E. cyaneus than in E. verrucosus (Jakob et al., 2017). The fresh weights of E. verrucosus specimens, as a measure of body size, were 10- to 50-fold higher than those of E. cyaneus specimens (Jakob et al., 2017); differences in fresh weights between the species were in the same range in the present study (24-fold, refer to wet weights given in section “3.1 Studied species and animal sampling”). Eulimnogammarus vittatus, however, was from the examined species least sensitive to CdCl2 although the body sizes of the individuals were clearly below those of E. verrucosus (3.3-fold lower wetweights of E. vittatus compared to E. verrucosus specimens). It can therefore be assumed that in consequence of smaller body size the cadmium uptake rate was higher. It was previously found that the CdCl2 sensitivity of amphipods may be decreased by metabolic depression: Upon exposure to CdCl2, metabolic depression occurred in E. verrucosus but not in the more sensitive E. cyaneus (Jakob et al., 2017). Metabolic activity of the amphipods was not examined here, but it seems conceivable that E. vittatus may have reacted with particularly pronounced metabolic depression to CdCl2 exposure, resulting in its comparatively low sensitivity despite its smaller body size compared to E. verrucosus.
Gammarus lacustris was the most sensitive species to CdCl2 exposure (Fig. 1, Table 1). Strikingly, G. lacustris was also more sensitive than E. cyaneus despite considerably larger body sizes of G. lacustris (4.7-fold higher wet weights of G. lacustris than of E. cyaneus). Thus, for G. lacustris cadmium uptake rates could have been expected to be lower than for E. cyaneus, resulting in a consequently lower CdCl2 sensitivity of G. lacustris. Furthermore, a metabolic depression response of E. cyaneus to CdCl2 exposure, another potential explanation for the in comparison lower CdCl2 sensitivity of E. cyaneus, can be ruled out: E. cyaneus does not react with metabolic depression to CdCl2 exposure (Jakob et al., 2017). Furthermore, titres of metallothioneins that may be diverging in the different species can probably be excluded as reason for different sensitivities to CdCl2 exposure; it was found earlier that those proteins do not seem to play an important role in cadmium detoxification in a gammarid (Ritterhoff, Zauke & Dallinger, 1996). It is conceivable that, independent from body size, cadmium uptake was in comparison higher in G. lacustris for other reasons. For instance, it was previously found that the exoskeleton of G. lacustris is less sturdy to mechanical pressure than that of Eulimnogammarus species (Jakob et al., 2016), indicating different compositions of the exoskeletons. Thus, because of the less rigid consistency the exoskeleton of G. lacustris may be better permeable for cadmium than that of the Eulimnogammarus species.
Gene responses
Although metabolic depression by cadmium may have decreased activity on a physiological level in some of the species, it appeared to have had no effect on transcription activity in the amphipods. Thus, in the 6 and 24 hr CdCl2 treatments at LC50 hsp70 was significantly induced in E. verrucosus but not in E. cyaneus (Fig. 3); CdCl2-caused metabolic depression occurred in E. verrucosus but not in E. cyaneus (Jakob et al., 2017). Furthermore, a significant abcb1 increase was seen in E. verrucosus at LC25 but not in E. cyaneus at LC30 after 1 hr exposure to CdCl2 (Fig. 5). Also E. vittatus, which may have been metabolically depressed by CdCl2 exposure (see above), showed, as the only species, a significant increase in abcb1 transcript levels upon a 24 hr exposure to CdCl2 at LC10 (Fig. 5).
In a recent study on the whole transcriptome response of amphipods to chemical stressors, which was similarly set up as this study, it was concluded that the experimental temperature of 6 °C perturbed the transcriptome response in G. lacustris (Drozdova et al., 2019b). Thus, in comparison to Eulimnogammarus species, the transcriptome response in G. lacustris was less pronounced. Since the metabolism of G. lacustris appears to be less well adapted to this temperature than that of the Eulimnogammarus species (Axenov-Gribanov et al., 2016) the weaker transcriptome response in this species was seen as a result of a more decreased metabolism at 6 °C (Drozdova et al., 2019b). In the present study, no relation of the degree of gene responses to the species-specific adaptation to the experimental temperature became evident. If there was an effect of the temperature on the examined gene responses, it was within the observed data variation.
When relating the hsp70 transcript or Hsp70 protein levels across the species to LCx values a bell-shaped trend of the expression data becomes obvious (Figs. 3 and 4). Such stress-level dependent expression degrees of Hsp70 have been described before: The Hsp70 titre increase in the “compensation phase” is followed by a Hsp70 titre decrease in the “non-compensation phase” (Eckwert, Alberti & Köhler, 1997). This Hsp70 titre decrease results from the increasingly degraded ability of the cells to react to toxicants at higher stress levels (Eckwert, Alberti & Köhler, 1997). The bell-shaped trend appearing in the LCx-related mRNA/protein expression data from the different species combined in the same graphs can be seen as an indication that the hsp70 transcript/Hsp70 protein responses are corresponding in the different amphipod species at correspondent stress levels.
It was indicated earlier that across gammarid species equal internal cadmium concentrations cause toxic effects of corresponding magnitude (Jakob et al., 2017). Based on this finding, the LCx values may be regarded as approximate measures of the respective internal cadmium concentrations. Hence, the degrees of hsp70 transcript and Hsp70 protein induction appear to be approximately equal at corresponding internal cadmium levels across the species.
The regulation of the hsp70 gene and Hsp70 protein is a rapid response to stress impact on the cell (De Nadal, Ammerer & Posas, 2011) and has been proposed as early-warning marker for the presence of deleterious agents in the environment, affecting the organisms at an examined site (Bierkens, 2000; Nadeau et al., 2001). To be useful as a marker indicating the exposure of organisms to stress causing conditions, the hsp70 gene/Hsp70 protein response should be sensitive, i.e., a response should occur at a sublethal stress impact. However, the changes of hsp70 transcript and Hsp70 protein levels at CdCl2 concentrations in the lethal range in our experiments indicate that these gene/protein responses in the here examined species are rather insensitive. Concerning the stress levels, at which changes in expression levels of hsp70 transcript/Hsp70 protein levels were found in various animal species/cell lines upon cadmium exposure, so far published studies come to diverging results: A significant increase of hsp70 transcripts/Hsp70 protein by cadmium at levels considerably below the LC50 value was found in studies with the shrimp Marsupenaeus japonicus (Ren et al., 2019), with larvae of the midge Chironomus tentans (Lee et al., 2006), with the amphipod Hyalella azteca (Werner & Nagel, 1997) and with HeLa cells (Ait-Aissa et al., 2000). Changes in hsp70 transcript / Hsp70 protein levels upon exposure to cadmium close to LC50, thus in the lethal concentration range, were seen in the redworm Eisenia fetida (Brulle et al., 2006), in the snail Biomphalaria glabrata (Da Silva Cantinha et al., 2017) and in the rotifer Brachionus koreanus (Jung & Lee, 2012). Also in the snail Deroceras reticulatum a Hsp70 protein increase was observed upon exposure to a rather high cadmium concentration that was above LT50 (time of expsoure lethal for 50% of the population) (Köhler et al., 1998). No or only slight changes of hsp70 transcript/Hsp protein levels upon cadmium exposures below LC50 were seen in the fishes Oreochromis mossambicus (Mlambo et al., 2010) and Acipenser persicus (Safari et al., 2014). Changes in Hsp70 levels upon cadmium expsoure were also seen in the wasp Pteromalus puparum but effect concentrations were not linked to toxic cadmium levels (Wang et al., 2012).
Although our results suggest that the hsp70/Hsp70 responses across our examined gammarid species occur at corresponding stress levels caused by CdCl2, there is no indication that the heat shock response across cellular systems/animal species is consistently evoked at similar cadmium impacts.
Across the amphipods examined here, changes in abcb1 transcript levels upon CdCl2 exposure were not uniform at corresponding LCx levels (Fig. 5, Table 2), which is in contrast to the hsp70/Hsp70 responses. The differences in sensitivities of the hsp70 and abcb1 transcript responses across the gammarid species may confirm that induction of the two genes is via different pathways. The induction of the hsp70 gene is triggered by the presence of misfolded proteins that are damaged e.g., by the impact of cadmium-induced ROS (Beyersmann & Hechtenberg, 1997; Thévenod et al., 2000): According to the chaperone titration model (Richter, Haslbeck & Buchner, 2010), heat shock factor (Hsf1) is released when Hsps bind to the misfolded proteins thus initiating hsp transcription. Induction of abcb1 appears to be triggered via another pathway involving the transcription factor NF-κB (Beyersmann & Hechtenberg, 1997; Thévenod et al., 2000).
Both Hsp70 and Abcb1 proteins act as cellular protection against cadmium toxicity: the chaperone Hsp70 preserves the structure of intact proteins and re-folds damaged proteins; Abcb1, a cellular efflux transporter, appears to efflux cell membrane components, such as ceramides, which result from membrane damage by ROS and can induce apoptosis (Beyersmann & Hechtenberg, 1997; Thévenod et al., 2000). It was found earlier that E. cyaneus, which shows higher constitutive and induced levels of Hsp70 than E. verrucosus (Bedulina et al., 2013; Protopopova et al., 2014), detoxifies a higher proportion of cadmium by binding it to proteins of the biologically detoxified heat stable protein fraction (BDF) (Jakob et al., 2017). The in comparison high constitutive Hsp70 titres in Gammarus lacustris (Protopopova et al., 2014) may indicate that also in this species a comparatively high level of the internal cadmium is bound to the BDF. However, when considering that the more sensitive gammarid species have higher titers of cadmium detoxifying proteins and that the transcripts of both here examined proteins are induced by cadmium only at comparatively high stress levels, it seems obvious that overall the detoxifying effect by those cellular stress response proteins on cadmium is only minor. Major determinants of the cadmium sensitivity of the species appear to be body size and in relation to that the cadmium uptake rate and one additional parameter that could be the degree of metabolic depression caused by cadmium.
Responses that could be more sensitive in the amphipods to the exposure to CdCl2 than the examined genes may be the degree of lipid peroxidation and metallothionein titres (Correi, Livingstone & Costa, 2002). Recently, various hsp70 isoforms were described in amphipods that could be classified as “cognate-inducible” and “inducible” (Drozdova et al., 2019a). As indicated by the relatively little increase in transcript level a “cognate-inducible” hsp70 isoform was examined here: Thus, the “inducible” hsp70 isoform may also respond more sensitively to the stress impact from CdCl2 exposure.
Summary and Conclusions
In this study, cadmium-induced hsp70/Hsp70 and abcb1 levels in gammarids exposed to CdCl2 were phenotypically anchored, i.e., exposure concentrations of treatments for transcript measurements were equated with the respective lethal concentrations (LCx). When gene/protein responses were related to LCx values, the four gammarid species examined showed a relatively uniform hsp70/Hsp70 response with pronounced responses in CdCl2 treatments at higher LCx and in lower LCx treatments after longer times of exposure to CdCl2. For abcb1, responses to CdCl2 exposure, when related to LCx levels, were not uniform across the species. However, abcb1 was, overall, also induced by CdCl2 in the lethal concentration range. Induction of hsp70/Hsp70 and abcb1 responses by CdCl2 in the lethal concentration range in the gammarids indicates that changes in transcript levels of those genes are rather insensitive markers for cadmium stress.