
Comparative RNA-sequencing profiled the differential gene expression of liver in response to acetyl-CoA carboxylase inhibitor GS-0976 in a mouse model of NASH
- Published
- Accepted
- Received
- Academic Editor
- Xiang-Jiao Yang
- Subject Areas
- Bioinformatics, Molecular Biology, Metabolic Sciences
- Keywords
- Transcriptome, RNA-Seq, Non-alcoholic steatohepatitis, Acetyl-CoA carboxylase inhibitor
- Copyright
- © 2019 Lu et al.
- Licence
- This is an open access article distributed under the terms of the Creative Commons Attribution License, which permits using, remixing, and building upon the work non-commercially, as long as it is properly attributed. For attribution, the original author(s), title, publication source (PeerJ) and either DOI or URL of the article must be cited.
- Cite this article
- 2019. Comparative RNA-sequencing profiled the differential gene expression of liver in response to acetyl-CoA carboxylase inhibitor GS-0976 in a mouse model of NASH. PeerJ 7:e8115 https://doi.org/10.7717/peerj.8115
Abstract
Background
Non-alcoholic steatohepatitis (NASH) is a progressive liver disease characterized by hepatic steatosis, lobular inflammation and fibrosis. Acetyl-CoA carboxylase (ACC) isoform 1 and 2 involved in de novo lipogenesis (DNL) and fatty acid oxidation have been identified as a therapeutic target in NASH. GS-0976, the inhibitor of ACC1 and ACC2, has achieved favorable therapeutic effects in clinical trials with NASH. The purpose of this study was to explore the transcriptional alterations regulated by GS-0976 in NASH.
Methods
C57BL/6 mice were fed on a choline-deficient, L-amino acid-defined, high-fat diet (CDAHFD) or normal diet for 12 weeks. Mice were treated with or without GS-0976 (3 mg/kg per day) in the last 8 weeks. Oil Red O, Haematoxylin-eosin (H & E), and Sirius Red were used to evaluate hepatic steatosis, inflammation and fibrosis. The comparative RNA-sequencing was conducted to analyse the hepatic gene expression profiles in mice. Reverse transcription–polymerase chain reaction analysis was performed to validate the differential expression of representative genes.
Results
GS-0976 attenuated the steatosis, inflammation, and fibrosis of NASH in CDAHFD mouse model. High-throughput sequencing and differential gene expression analysis showed that there were 516 up-regulated genes and 525 down-regulated genes after GS-0976 treatment. Genes involved in the metabolic process, extracellular matrix formation, immune response, and angiogenesis were significantly enriched. The “Metabolic pathways” and “ECM-receptor interaction” pathways were the most significantly enriched KEGG pathways in the up-regulated and down-regulated differentially expressed genes (DEGs), respectively.
Conclusions
Transcriptome analysis showed that GS-0976 could regulate the expression of genes related to metabolism, inflammation and fibrosis in NASH. The global transcriptomic changes in gene expression promote the further understanding for the inhibition mechanisms of GS-0976 in NASH.
Introduction
Non-alcoholic fatty liver disease (NAFLD) has become one of the most common chronic liver disease (CLD) related to metabolic syndrome, obesity and type 2 diabetes. NAFLD has caused great social and economic burden in the world (Younossi et al., 2018a). As a portion of the NAFLD spectrum, NASH is a progressive process characterized by steatohepatitis, lobular inflammation and fibrosis (Bedossa, 2017). In the United States, the number of patients with NASH is expected to increase from 16.52 million in 2015 to 27.00 million in 2030 (Estes et al., 2018). Lifestyle interventions are considered an effective therapy for NASH, but hard to maintain (Younossi et al., 2018b). However, there is no approved pharmacotherapy for NASH.
Disorders of fatty acid metabolism, including increased fatty acid synthesis or DNL, decreased fatty acid oxidation and imbalanced of adipokines, are key factors in the etiology of NASH (Chalasani et al., 2018). The DNL plays an important role in fatty acid synthesis and catabolism. Acetyl-CoA carboxylase (ACC) is the first committed and rate-limiting enzyme regulating DNL pathway, which catalyzes the carboxylation of acetyl-CoA into malonyl-CoA. There are two isoforms of ACC in mammals, ACC1 and ACC2, with different distribution in cells and physiological function (Neuschwander-Tetri, 2010). ACC1, a cytosolic enzyme, promotes the synthesis of cytosolic malonyl-CoA and is the primary substrate for fatty acid synthesis and elongation. ACC2 is distributed in mitochondrial membrane and generates malonyl coenzyme A. And malonyl coenzyme A inhibits carnitine palmitoyl transferase (CPT-1) by isomerization, thus inhibiting the carrier protein of fatty acids from entering mitochondria for β-oxidation (Abu-Elheiga et al., 1995).
Studies have shown that inhibition of ACC expression in liver by knocking out ACC genes or small molecule drugs can significantly reduce the concentration of hepatic triglyceride (TG) and DNL. (Harriman et al., 2016; Harwood Jr et al., 2003; Mao et al., 2006). GS-0976 is one of the effective ACC1 and ACC2 inhibitors for the treatment of NASH. In the obesity rodent model and NASH patients, GS-0976 has a good effect on hepatic steatosis and fibrosis (Harriman et al., 2016; Lawitz et al., 2018; Loomba et al., 2018). These evidences strongly support the view that the inhibition of ACC is an important therapeutic target in NASH. However, little is known about the whole transcriptome regulation with ACC inhibition by GS-0976 treatment. In the present study, to further understand the mechanisms of GS-0976 in NASH, RNA-Seq was used to investigate hepatic gene expression profiles in CDAHFD-induced NASH model. Functional enrichment analysis of the DEGs revealed the potential molecular mechanism of GS-0976 on metabolism, inflammation, fibrosis, and angiogenesis.
Material and Methods
Animals and diets
Male C57BL/6 mice (4 weeks old) were purchased from the Vital-River Animal Ltd (Beijing, China). Animals were housed in a specific pathogen-free environment and maintained on standard diet at a temperature of 24 ± 1 °C and 12/12 h light/dark cycles, with free access to food and water (Zhang et al., 2017). The animal procedures were performed in accordance with the standard guidelines and were approved by the institutional animal care and treatment committee of West China Hospital, Sichuan University (Chengdu, China; approval no.182). Mice were divided into three groups at 9 weeks of age and fed with CDAHFD (Research Diets Inc, New Brunswick, New Jersey, USA, A06071302) or normal diet (DASHOU, Chengdu, China) for 4 weeks, respectively. Subsequently, GS-0976 or equal volume of vehicle were given by oral gavage once daily for another 8 weeks. Mice in the GS-0976 group were fed on CDAHFD and GS-0976 (3 mg/kg/d) (Harriman et al., 2016). Mice in the Model group and Control group were fed on CDAHFD and vehicle or normal diet, respectively. GS-0976 for clinical trials was purchased from MedchemExpress (Cat.No. HY-16901). The vehicle was made up of 1% carboxymethylcellulose sodium and 0.1% tween 80 with boiling water. GS-0976 was then co-grinded with pre-cooled vehicle and stored at 4 °C. GS-0976 mixture was prepared once a week and was vortexed before administration. Animals were anesthetized with pentobarbital sodium. The terminal blood samples were collected from the eyelids for plasma biochemistry. Liver tissues of all the mice were collected and stored at −80 °C.
Histopathological and biochemical assessment
Fresh liver tissues were fixed in 10% neutral formalin, embedded in paraffin, and cut into 5 µm sections. Sections of formalin-fixed livers were used for H&E, Oil red O staining and Sirius Red staining. The stained slices were observed using BA400 Digital microscope (Motic China Group Co., Ltd). The percent of fibrosis areas were calculated by NanoZoomer Digital Pathology S210. Histological steatosis, inflammation, and ballooning were graded in a blinded manner by an experienced pathologist according to the scoring method described by Kleiner et al. (2005). The NAS scores of steatosis, inflammation and ballooning scores were evaluated.
Blood samples obtained from eyelids were used for evaluating the concentration of serum alanine aminotransferase (ALT), aspartate aminotransferase (AST), high-density lipoprotein (HDL) and low-density lipoprotein (LDL) by a chemistry analyzer (Hitachi 7020, Tokyo, Japan) according to the manufacturer’s instructions.
Sample preparation, library construction and RNA-Seq
Total liver RNA from the three mice of each group was extracted using Tiangen RNA prep Pure Plant Kit (Tiangen, Beijing, China). The quantity and quality of the extracted RNA were verified by Qubit®RNA Assay Kit in Qubit® 2.0 Fluorometer (Life Technologies, CA, USA) and the RNA Nano 6000 Assay Kit of the Bioanalyzer 2100 system (Agilent Technologies, CA, USA). The cDNA library construction and sequencing were performed as described before (Chen et al., 2018).
Data processing, assembly, and annotation
The acquired data were processed as previously described (Chen et al., 2018). Briefly, raw data were first processed through Perl scripts to obtain clean data by removing reads containing adapter, ploy-N and with low quality. Meanwhile, Q20, Q30 and GC content of the clean data were calculated to meet the standard (Q20>90, Q30>85). All the downstream analyses were based on clean data with high quality. Indexes of the reference genome were built using Bowtie v2.0.6 and paired-end clean reads were aligned to the reference genome using TopHat v2.0.9. HTSeq v0.6.1 was used to count the read numbers mapped of each gene. And then RPKM of each gene was calculated based on the length of the gene and reads count mapped to this gene.
Gene expression pattern analysis
Differential expression analysis between two groups was performed using the DESeq R package (1.10.1). DESeq provides statistical routines for determining differential expression in digital gene expression data using a model based on the negative binomial distribution. The results of P-values were adjusted using the Benjamini and Hochberg’s approach for controlling the False Discovery Rate (FDR). Genes with an adjusted P < 0.05 were assigned as differentially expressed.
The identified DEGs were used for bioinformatics analyses. The Gene ontology (GO) analysis were performed using the GOseq R package and was mapped in the GO database (P-value ≤ 0.05). The Kyoto Encyclopedia of Genes and Genomes (KEGG) pathway enrichment analysis of the DEGs was conducted using KOBAS software.
Cell culture
The immortalized human hepatic stellate cell line LX-2 (Procell, Wuhan, China) was cultured in DMEM-high glucose supplemented with 20% fetal bovine serum, 100 U/mL penicillin and 100 µg/mL streptomycin. The normal human hepatocyte cell line LO2 were obtained from the Chinese Academy of Sciences (Shanghai, China) and cultured in RPMI-1640 supplemented with 10% fetal bovine serum, 100 U/mL penicillin and 100 µg/mL streptomycin. Cells were maintained at 37 °C in a humidified atmosphere of 5% CO2 (Lai et al., 2018).
Cell treatment
To induce the hepatocyte steatosis in vitro, a mixture of free fatty acids (FFA) comprised by palmitic and oleate at a ratio of 1:2 were supplied in culture medium at the final concentration of 0.8 mM. LO2 cells were seeded on a cover slide in 24-well plates at a density of 10,000 cells per well. After reaching 75–80% confluence, cells were exposed to the indicated concentrations of GS-0976 in the presence of FFA for 24 h. Specifically, LO2 cells with only 0.8 mM FFA treatment were defined as Model group and cells treated without FFA were Control group. To study the effects of GS-0976 on fibrosis, LX-2 cells were administrated with GS-0976 and TGF-β1 (10 ng/mL, Novoprotein, Chain) for 24 h. The mRNA expression of α-smooth muscle actin (α-SMA), type I collagen (COL1A1, COL1A2), type III collagen (COL3A1), connective tissue growth factor (CTGF), Extracellular sulfatase (SULF-2) were evaluated.
Oil Red O staining
After treatment and washes, LO2 cells were fixed in 4% paraformaldehyde for 10 mins, followed by three times washes with PBS, then stained with freshly prepared Oil Red O working solution for 10 mins at room temperature. Cells were then rinsed in 60% isopropanol for 10 s, followed by PBS washing and Hematoxylin stain for 10 mins. Lipid droplets were captured at ×400 magnification using a light microscope (Olympus-CX31, Japan).
RNA isolation and quantitative real-time PCR
Total RNA of LX-2 cells was extracted using cell RNA isolation kit (Foregene, China). First strand cDNA was synthesized by HiScript® II Reverse Transcriptase (Vazyme, China) from 1 µg of total RNA template according to the manufacturer’s instruction. Gene expression was quantified by real-time PCR with SYBR Green master mix (Vazyme, China) and CFX96 real-time PCR system (Bio-Rad, USA). The sequence-specific primers of the target gene are given in Table S1. All the experiments were carried out three times and β-actin was used as the housekeeping gene. The relative mRNA fold changes were calculated using the 2−ΔΔCT method.
Statistical analysis
Statistics were analysed with SPSS 25.0 (IBM Corp., Armonk, NY, USA). One-way ANOVA followed by LSD test was used to assess statistical significance. The data were presented as the mean ± Standard Error of Mean (SEM). P values <0.05 were considered to be significant in this study.
Results
Validation of CDAHFD-induced NASH model in C57BL/6 mice
C57BL/6 mice were maintained on CDAHFD or normal diet for 4 weeks and were co-administered with GS-0976 (3 mg/kg/d) or vehicle for the following eight weeks. The body weight gain and food intake of mice in the Model group were lower than that of mice in the Control group (Figs. 1A, 1B). The liver weight and liver/body weight ratio were increased in the Model group (Figs. 1C, 1D). At the end of 12 weeks, compared with the Control group, the levels of ALT and AST in the model group increased 7.1 times and 3.3 times respectively (Figs. 1E, 1F). Moreover, both the serum high-density lipoprotein (HDL) and low-density lipoprotein (LDL) were decreased in the CDAHFD model compared to the Control group (Figs. 1G, 1H). H&E results showed that there were excessive accumulation of lipid droplets, moderate inflammatory foci and few ballooning cells in the Model group (Figs. 2A–2D). Compared with the Control group, Sirius Red and Oil Red O results showed an increase of fibrosis area and lipid accumulation in the Model group, respectively (Figs. 2G–2J, 2M, 2N). The average NAS score was 6.0 ± 0.0 in CDAHFD fed mice (Fig. 2S). Hence, these results confirmed CDAHFD-induced NASH model was well-established.
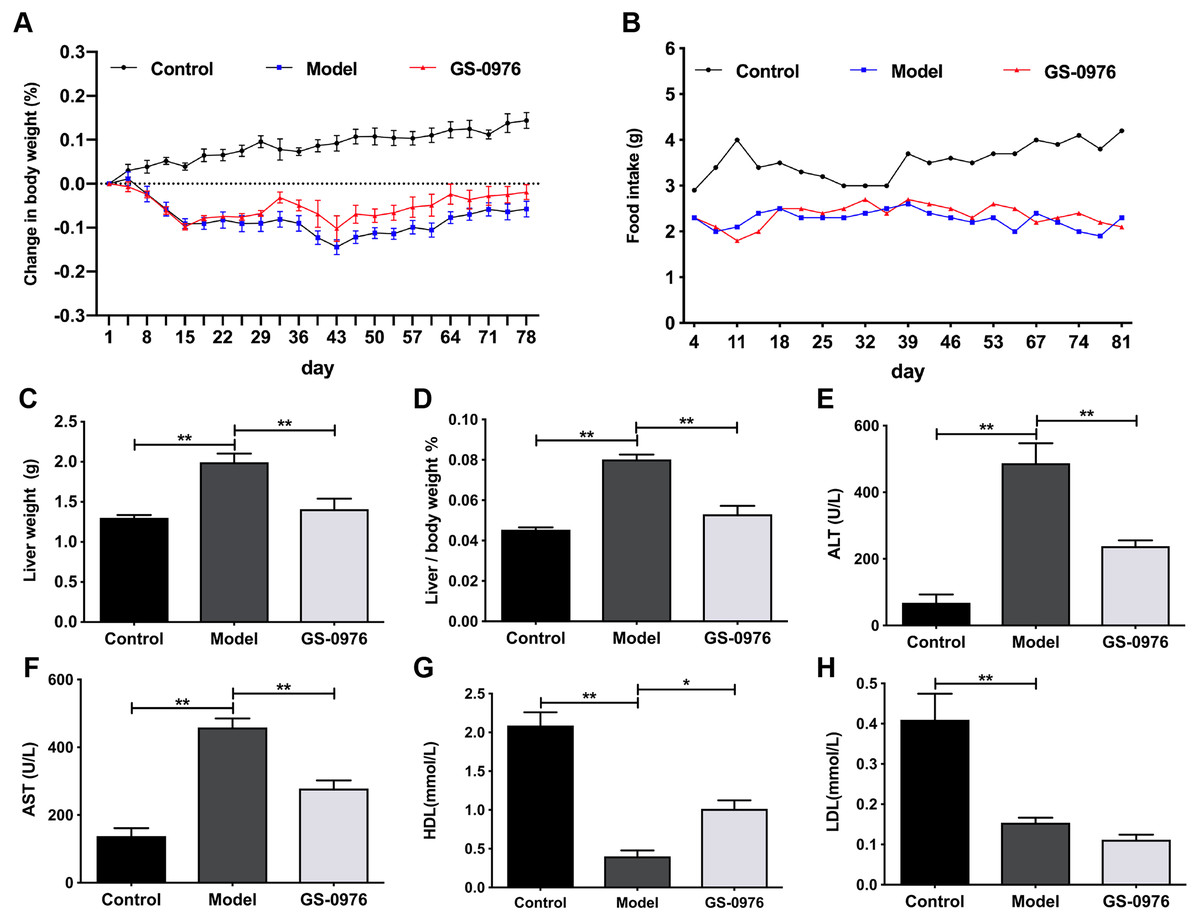
Figure 1: GS-0976 administration attenuated CDAHFD-induced liver injury.
Mice were divided into three groups (n = 5) and placed either on CDAHFD or normal chow. GS-0976 were given orally 3 mg/kg per day for 8 weeks. (A) Change in body weight, (B) food intake, (C) liver weight, (D) ratio of liver/body weight. (E) Serum levels of ALT, (F) AST , (G) HDL, (H) LDL. Data are shown as means ±SEM. ∗P < 0.05, ∗∗P < 0.001 compared with the Model group by one-way ANOVA with LSD test.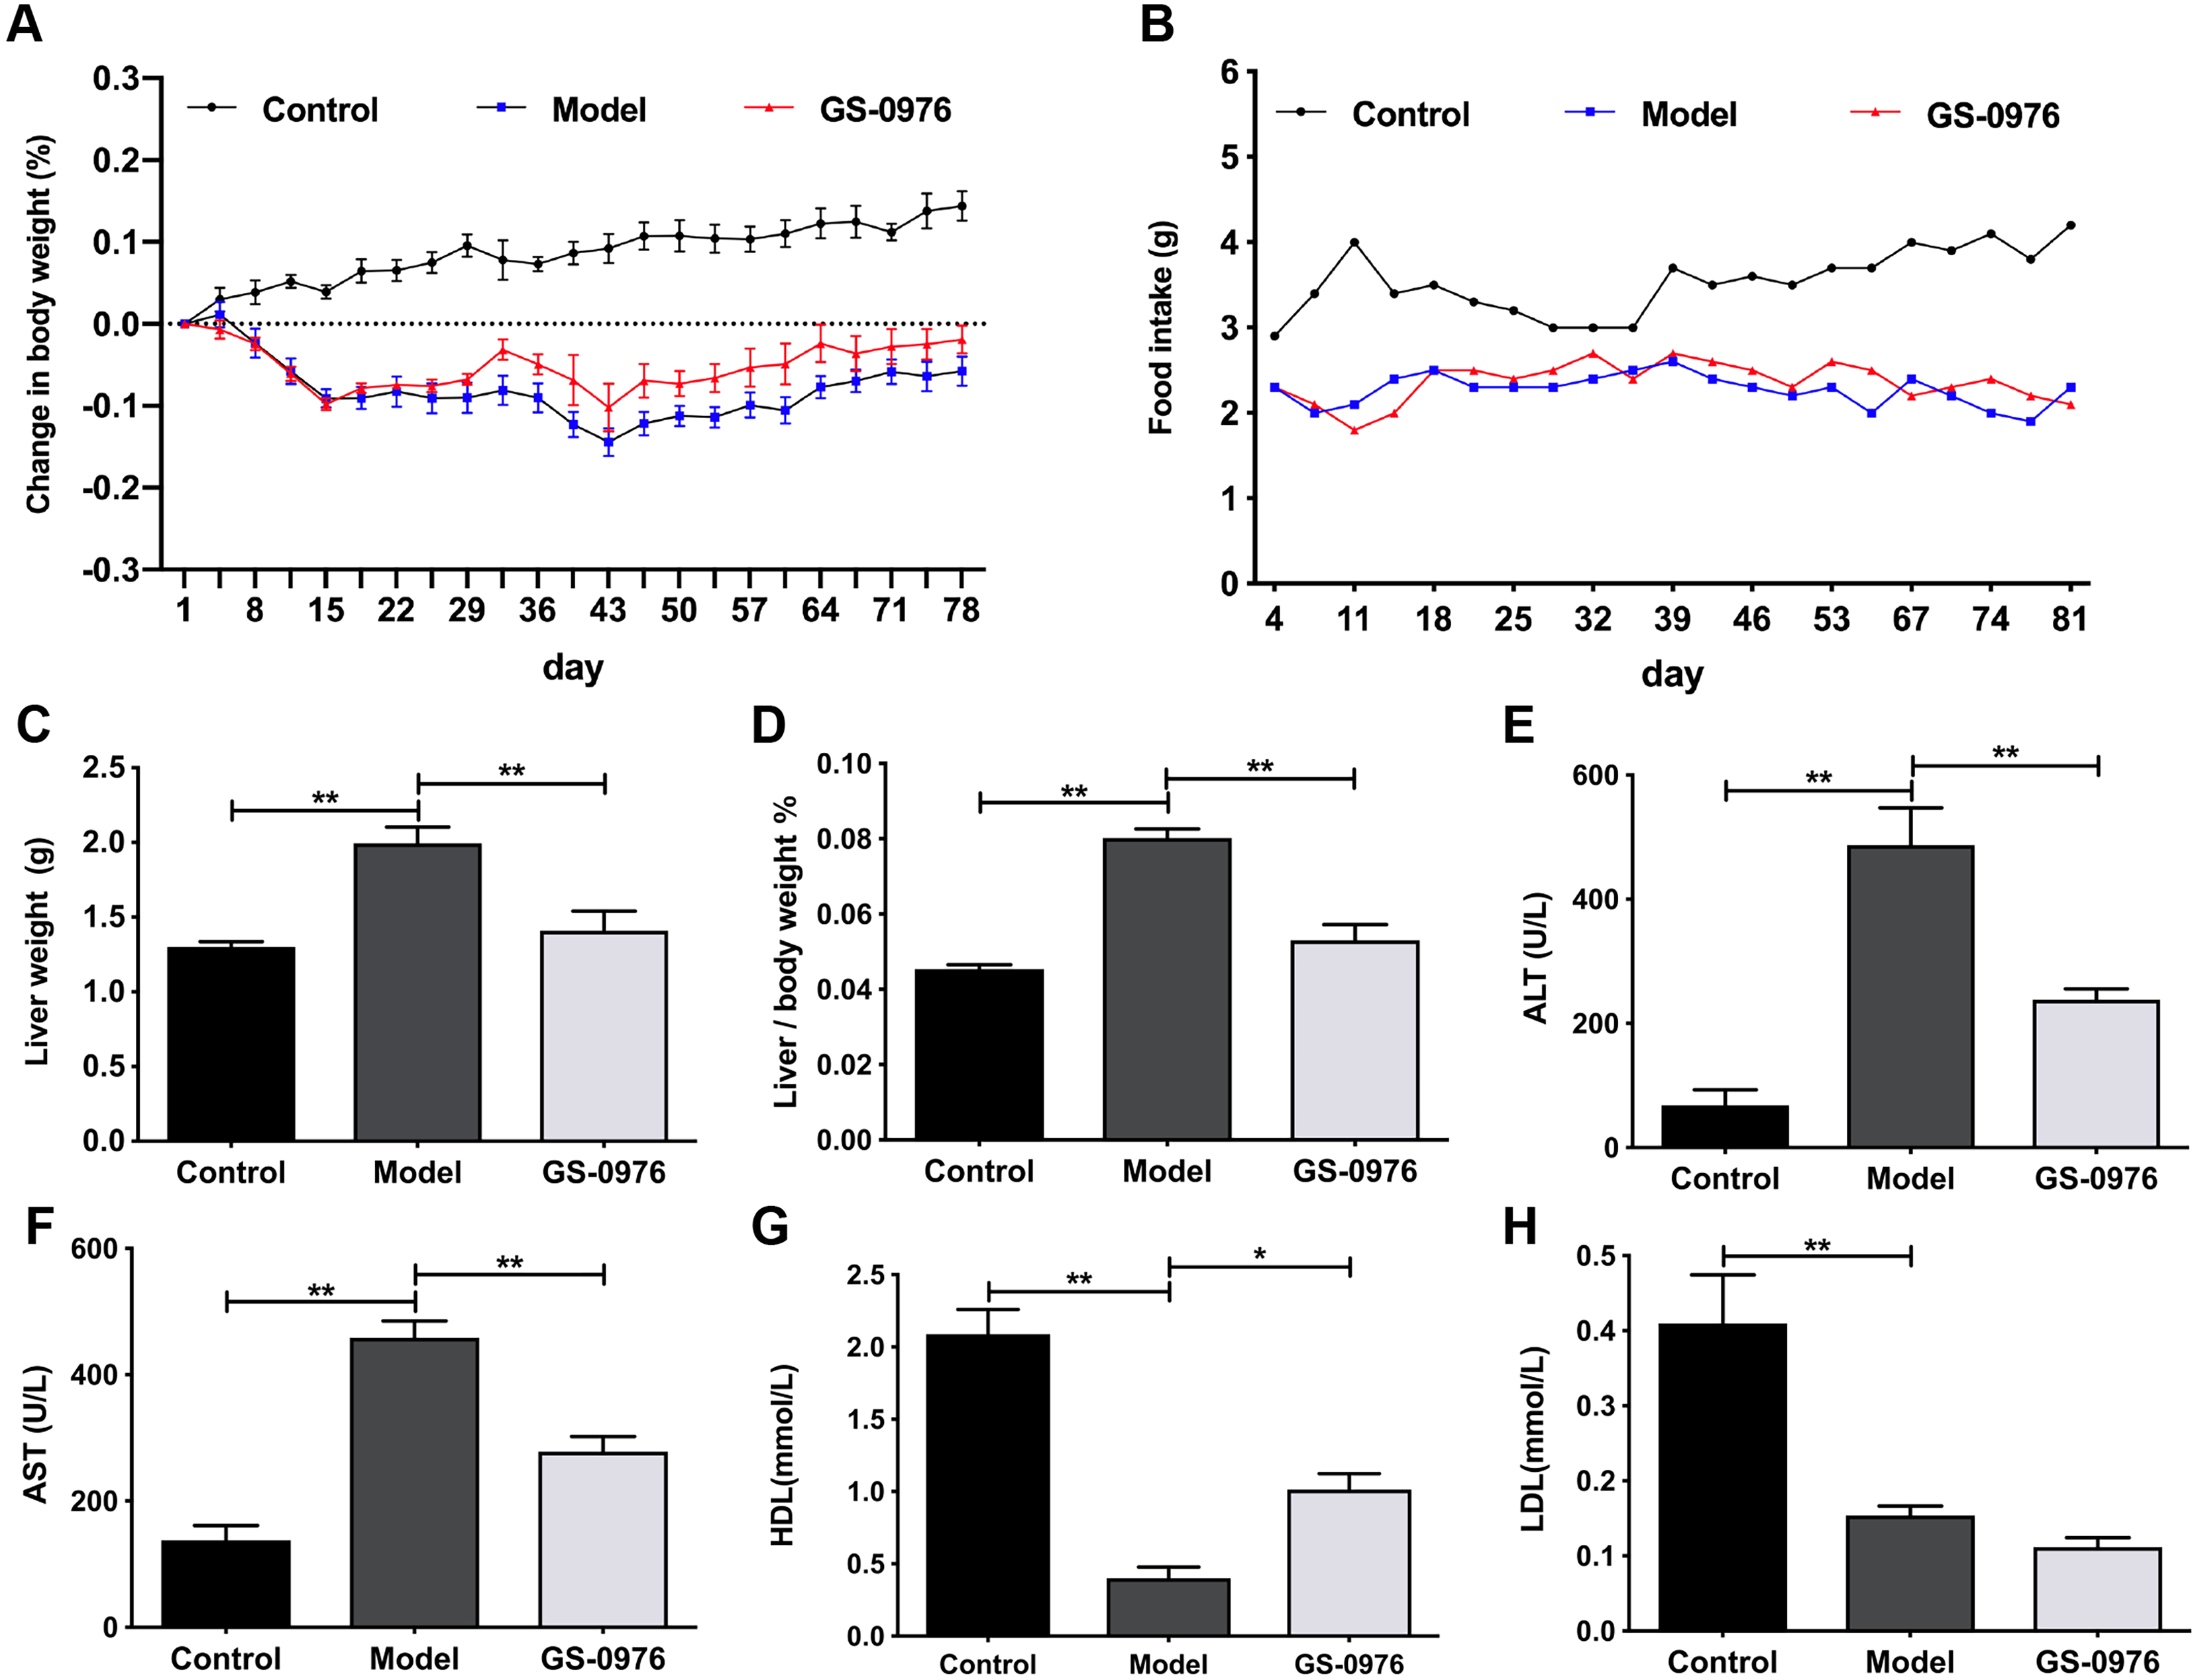
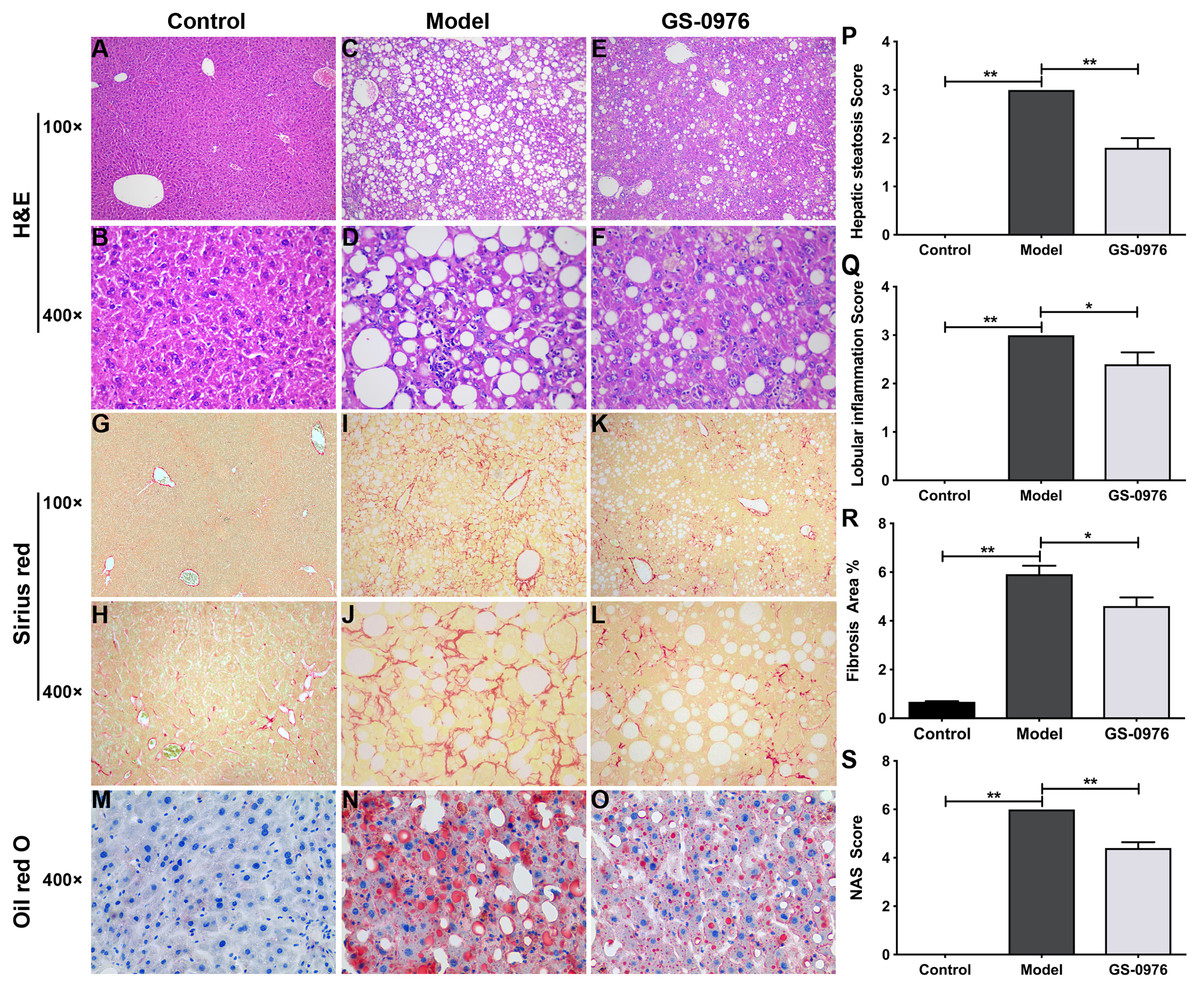
Figure 2: Effect of GS-0976 on liver histology in CDAHFD-induced NASH model.
Histological evaluations of liver were performed in each group (n = 5). Paraffin-embedded liver sections were stained with H&E (A–F), Sirius red (G–L) and Oil Red O (M–O). Representative photographs of each group were presented. Images were obtained at 100× and 400×, respectively. Global hepatic steatosis (P), inflammation (Q), fibrosis (R), and NAS score (S) were analyzed in a blinded manner or by digital image analyzer. Data are shown as means ± SEM. ∗P < 0.05, ∗∗P < 0.001 compared with the Model group by one-way ANOVA with LSD test.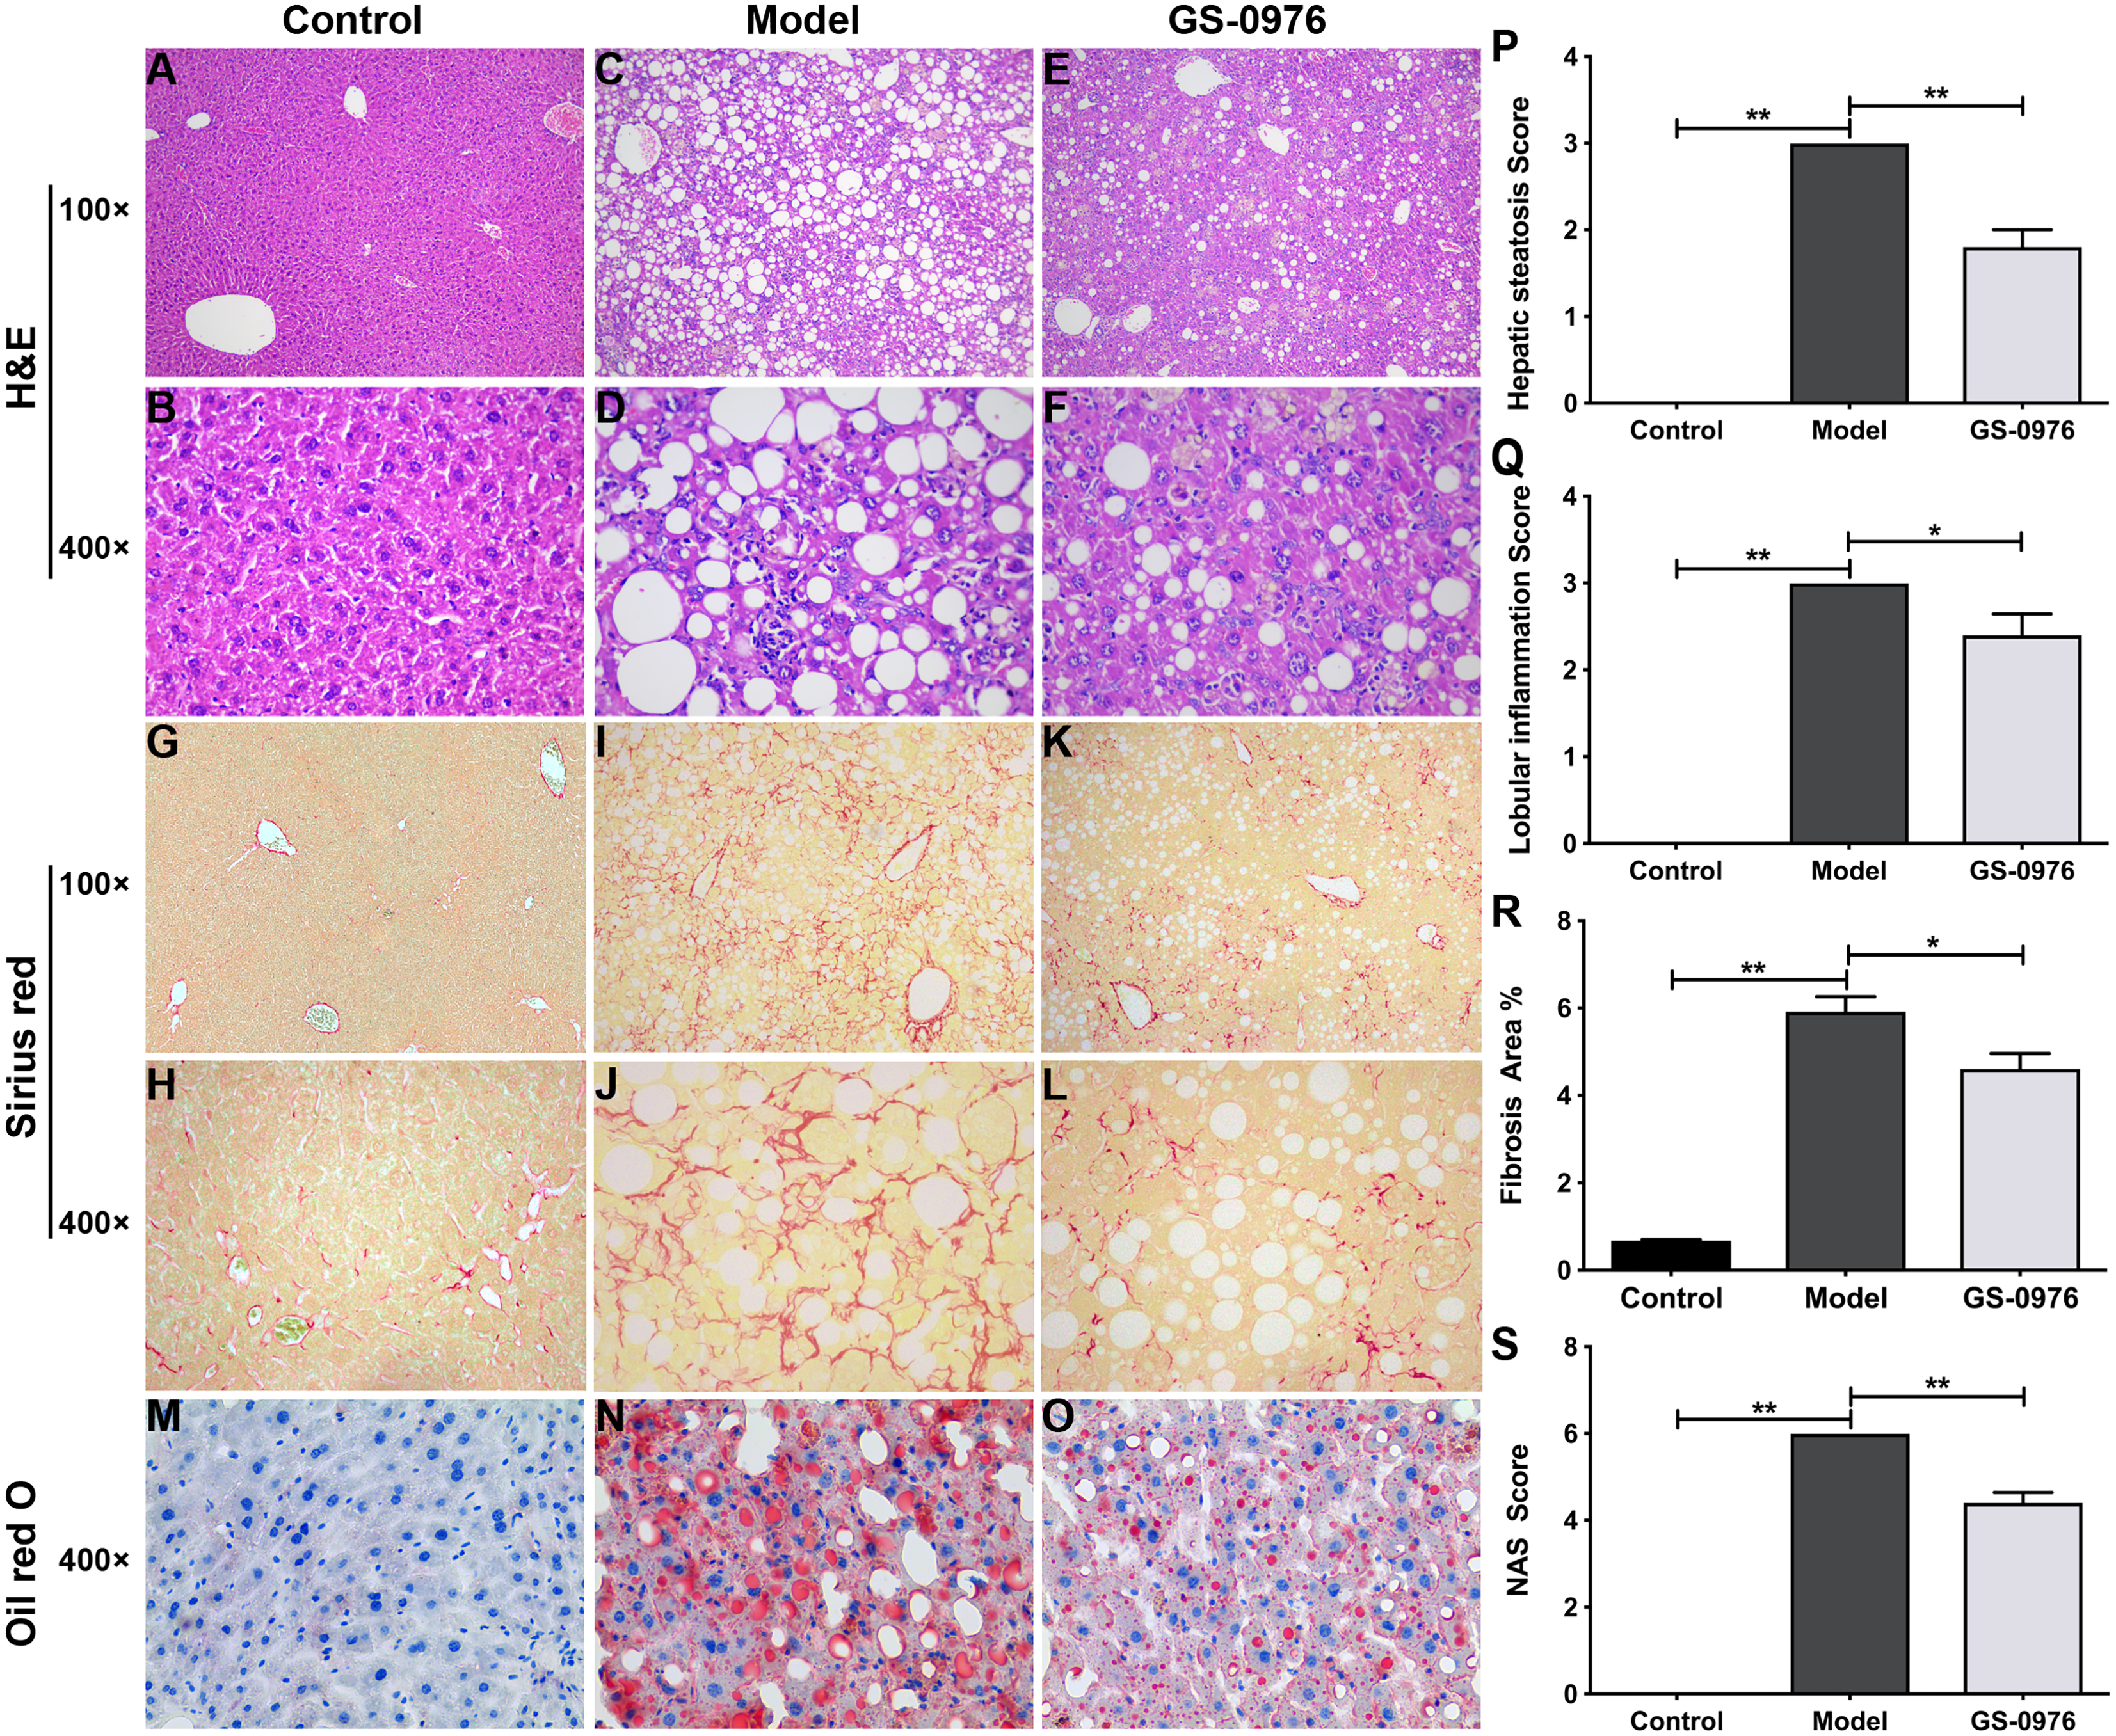
GS-0976 treatment inhibited CDAHFD induced NASH development
There was no significant difference in body weight gain and food intake between GS-0976 group and Model group (Figs. 1A, 1B). Notably, the increase in liver weight was inhibited by GS-0976 treatment (Figs. 1C, 1D). The concentration of serum ALT (48.9%), AST (60.7%) was lower in the GS-0976 group than that of the Model group (Figs. 1E, 1F). The Serum HDL was increased 2.54 times and LDL decreased slightly after GS-0976 treatment compared with Model group (Figs. 1G, 1H). GS-0976 inhibited the accumulation of fat droplets and inflammatory cell infiltration (Figs. 2C–2F, 2N, 2O). The hepatic steatosis score (P < 0.001) and inflammation score (P < 0.05) were decreased by GS-0976 (Figs. 2P, 2Q). The Sirius Red staining results showed that the fibrosis area was decreased by GS-0976 in NASH (Figs. 2I–2L, 2R). The NAS score of the GS-0976 group (4.4 ± 0.245) was lower than that of the Model group (6.0 ± 0.0, P < 0.05) (Fig. 2S). These results showed that GS-0976 could inhibit the inflammation, fibrosis and hepatic steatosis in NASH.
RNA-Seq and DEG analysis
In order to study the global transcriptomic changes in gene expression induced by GS-0976 treatment in CDAHFD-induced NASH model, total RNA was extracted from the liver tissues of the Model group, GS-0976 group and Control group (N = 3) after eight weeks’ GS-0976 or vehicle treatment. RNA-Seq was subsequently performed on the Illumina Hiseq platform. A total of 30,792,280, 28,201,679 and 31,217,825 raw reads were obtained from the three groups, respectively. Following quality control and the removal of duplicate, ambiguous and low-quality reads, a total of 29,878,505, 27,680,698, and 30,460,759 clean reads were attained from cDNA libraries respectively. Over 93% of the clean reads had a quality score equal or above Q30 level (sequencing error rate 0.01%), supporting the preciseness of sequencing. To identify genes significantly altered under GS-0976 exposure, DEGs analysis was executed with the DEGSeq R package (1.20.0) and the P values were adjusted by the Benjamin-Hochberg method. DEGs were identified as either up or down regulated with a Padj threshold of 0.05 between treatment groups. And the results were displayed by volcano plots (Fig. 3A). The expression of 516 genes was up-regulated and 525 genes was down-regulated of 1,041 altered genes. The genes associated with NASH were selected and their expression profiles were analyzed by group comparisons (Fig. 3B). Quantitative RT-PCR was performed to validate the differential expression of representative genes. The results of qRT-PCR conformed the results of RNA-seq (Figs. 3C–3E). GS-0976 treatment inhibited the alterations of gene expression induced by CDAHFD feeding.
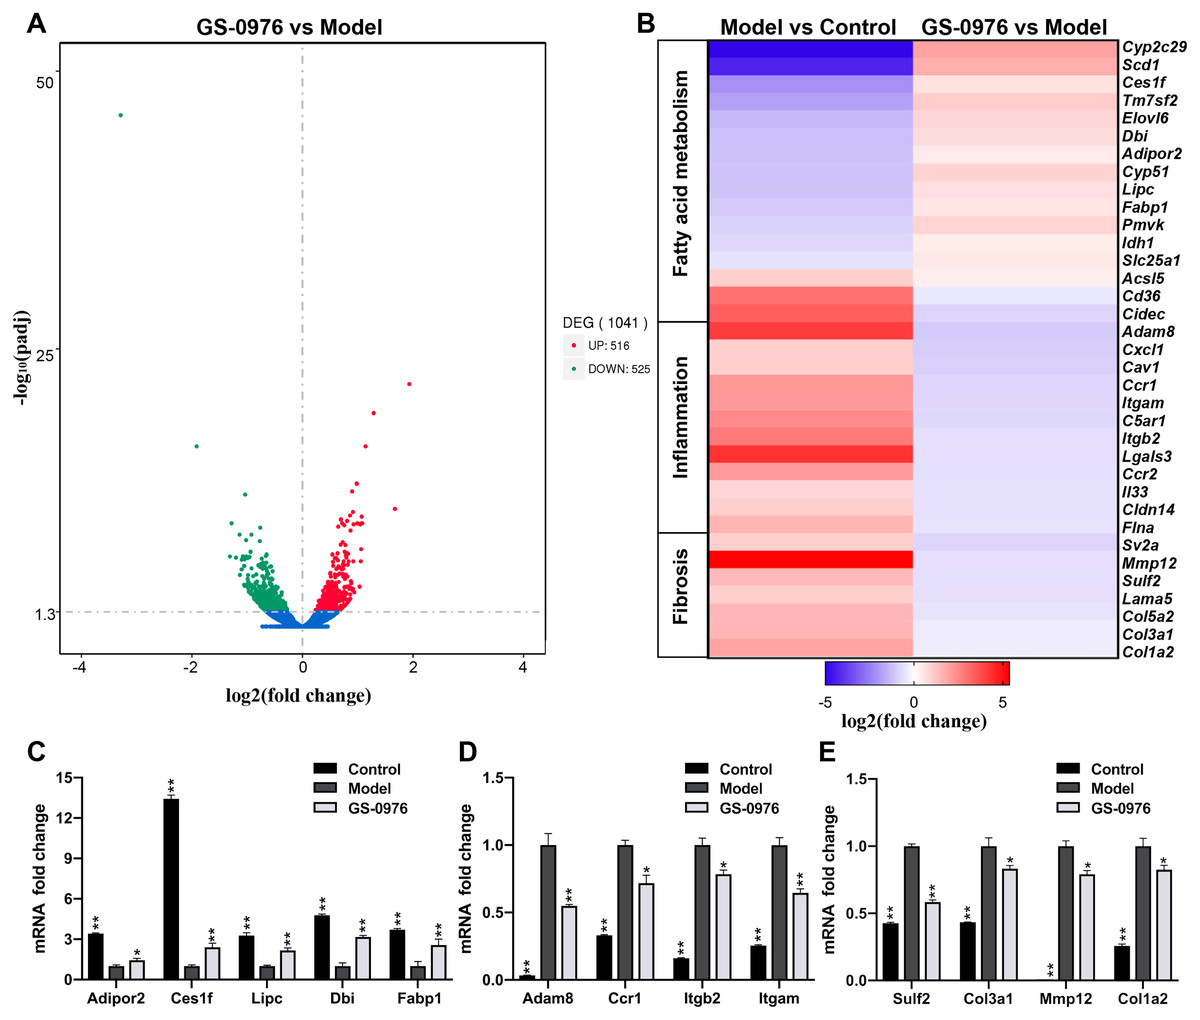
Figure 3: Global transcriptomic response and GS-0976-mediated signatures in NASH livers.
(A) Global gene expression changes between the Model and the GS-0976 treatment group at mRNA level are shown in volcano plots of log2 (fold change) versus –log10 (P-value). Red dots indicate up-regulated DEGs, the green dots indicate down-regulated DEGs, and blue dots represent non-DEGs. (B) Heat map shows expression analysis of selected genes associated with fatty acid metabolism, inflammation and fibrosis. Color coded as log2 (fold change) from −5 to 5.4 with Padj < 0.05. Quantitative RT-PCR was used to verify the differentially expressed genes related to fatty acid metabolism (C), inflammation (D) and fibrosis (E) identified by RNA-Seq analysis. Data are shown as means ± SEM; n = 3. ∗P < 0.05, ∗∗P < 0.001 compared with the Model group by one-way ANOVA with LSD test.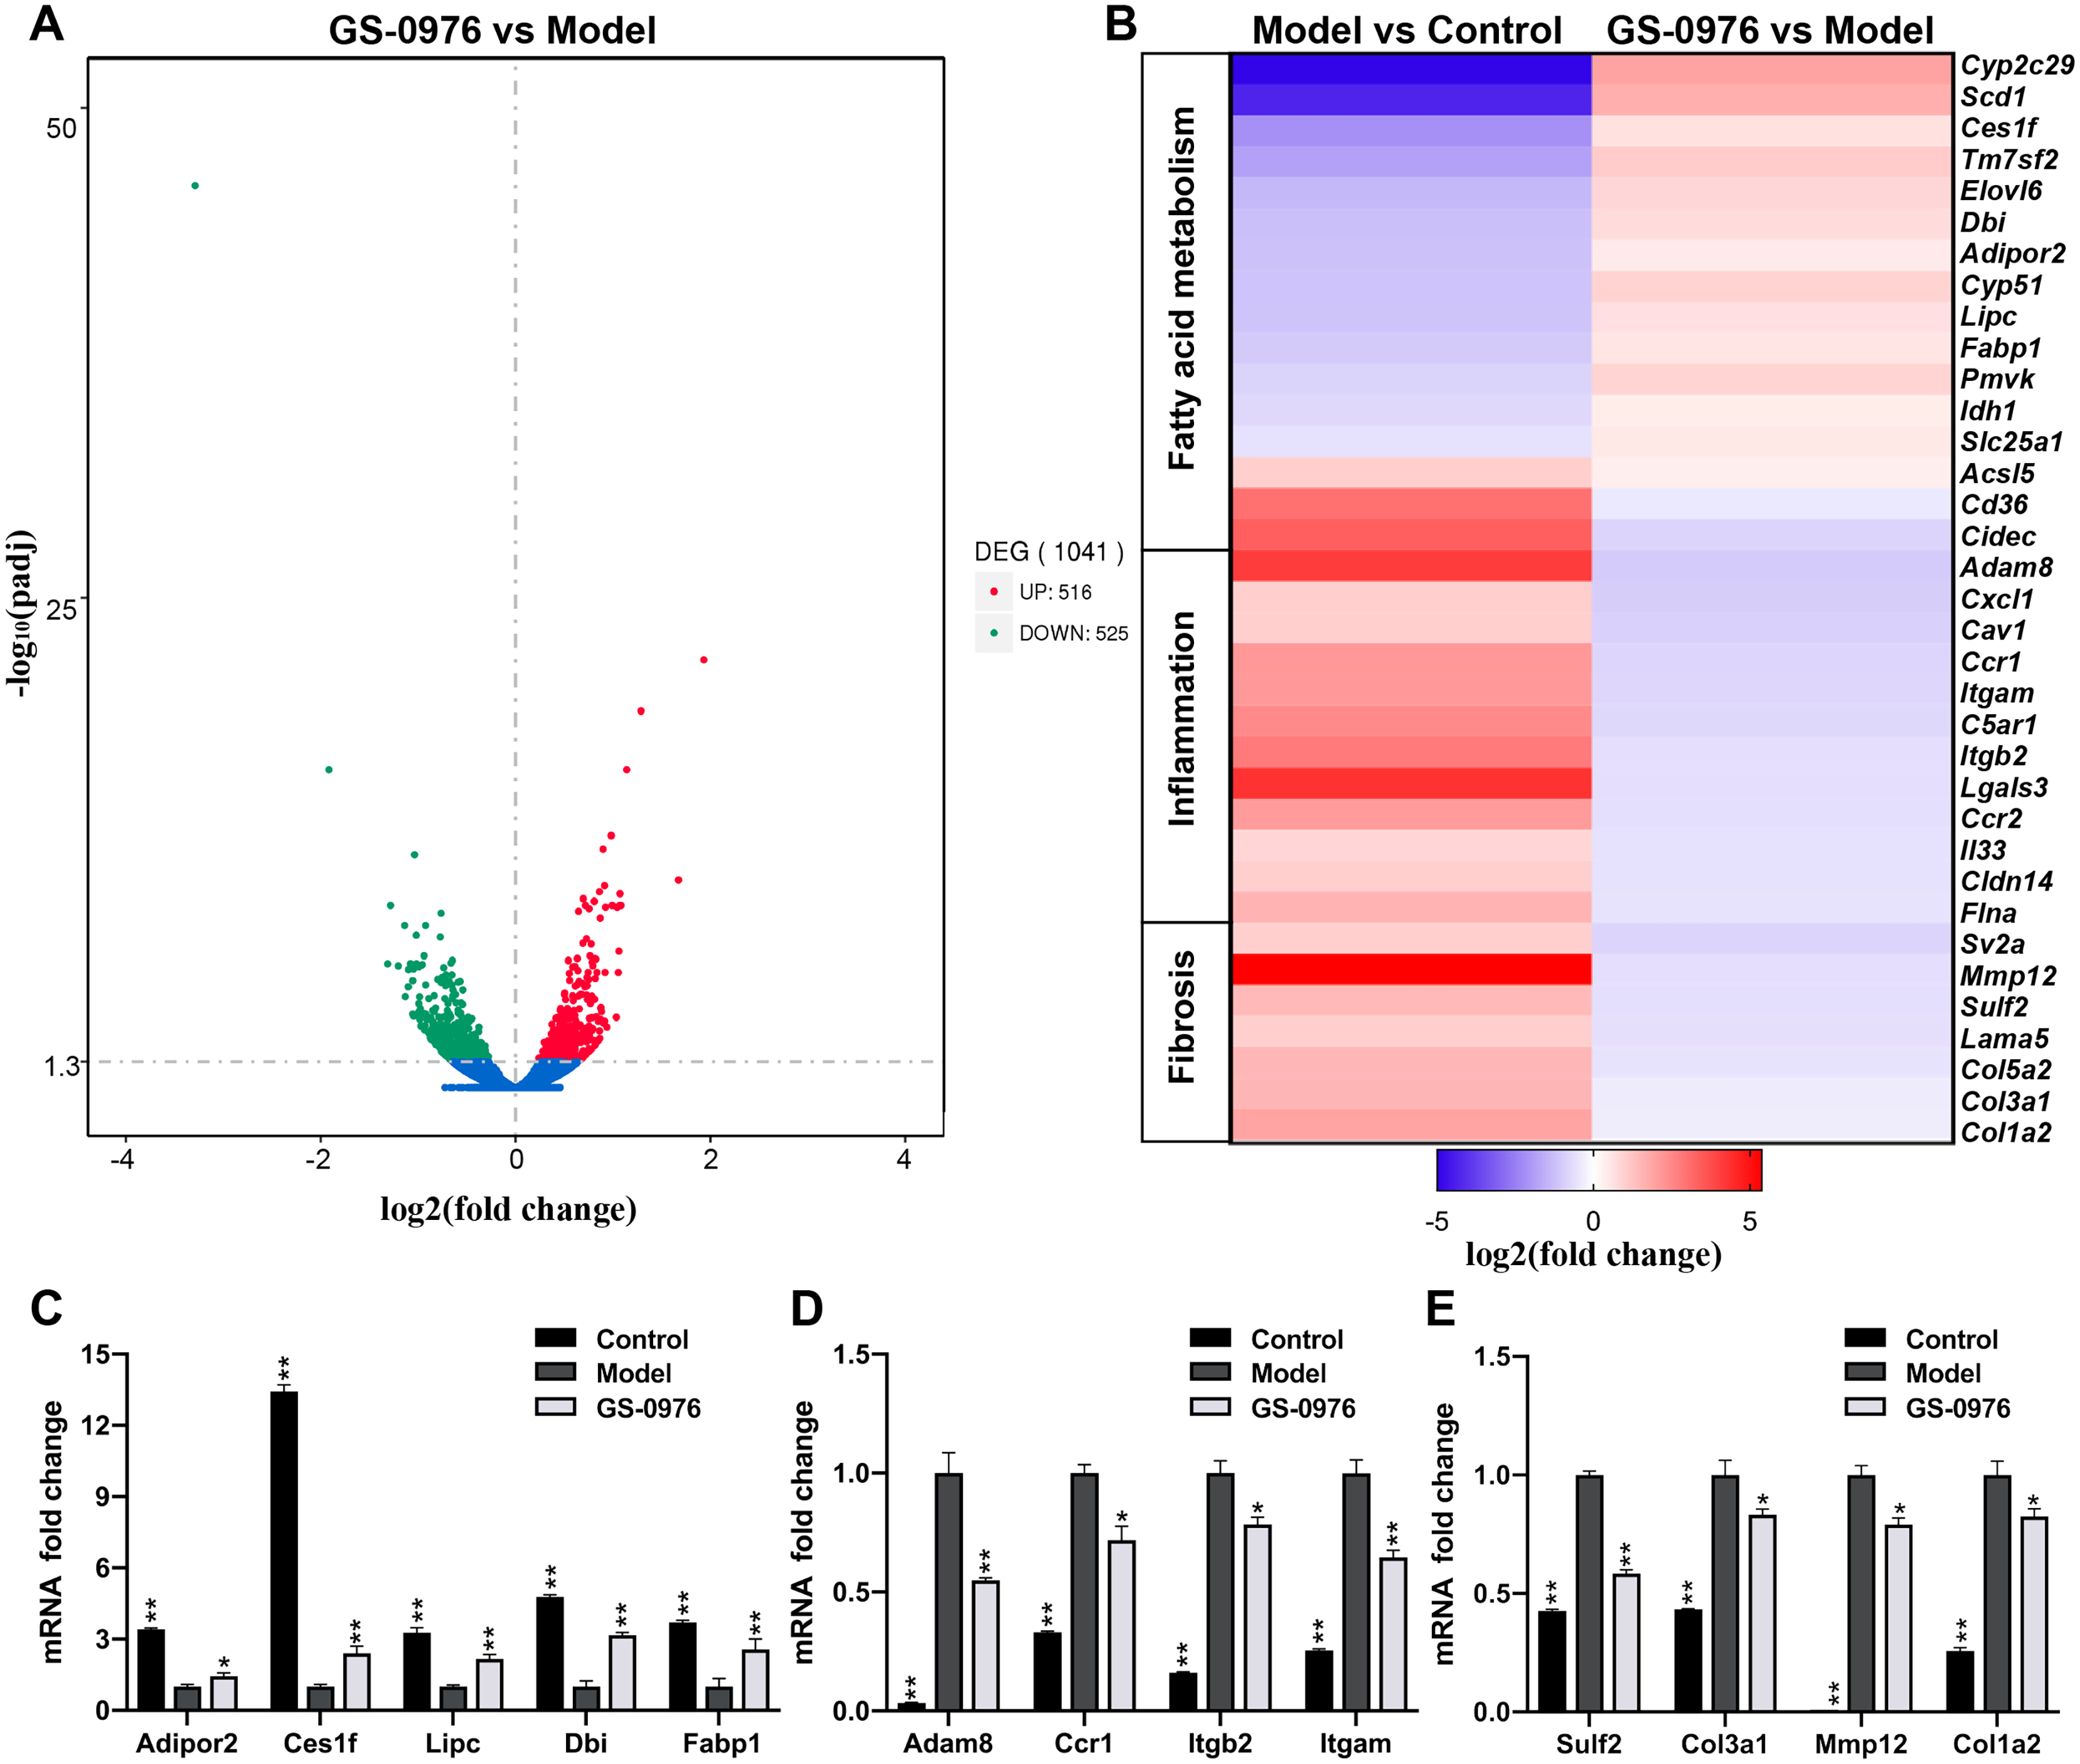
Bioinformatics analysis
To better understand the effect of GS-0976 on gene expression in the CDAHFD-induced NASH model, we performed GO analysis to categorize DEGs into relevant functions. In our study, 1041 DEGs were classified into 212 biological process (BP) terms, 25 cellular component (CC) terms, and 80 molecular function (MC) terms. Most of the enriched BP terms of up-regulated DEGs were categorized into metabolic processes. And the most significant BP terms of down-regulated DEGs were involved in extracellular matrix formation (GO: 0030198), wound healing (GO:0042060), cell chemotaxis (GO: 0060326), leukocyte migration (GO: 0050900) and angiogenesis (GO:0001525). The top 20 significant GO-BP terms were shown in Figs. 4A and 4B.
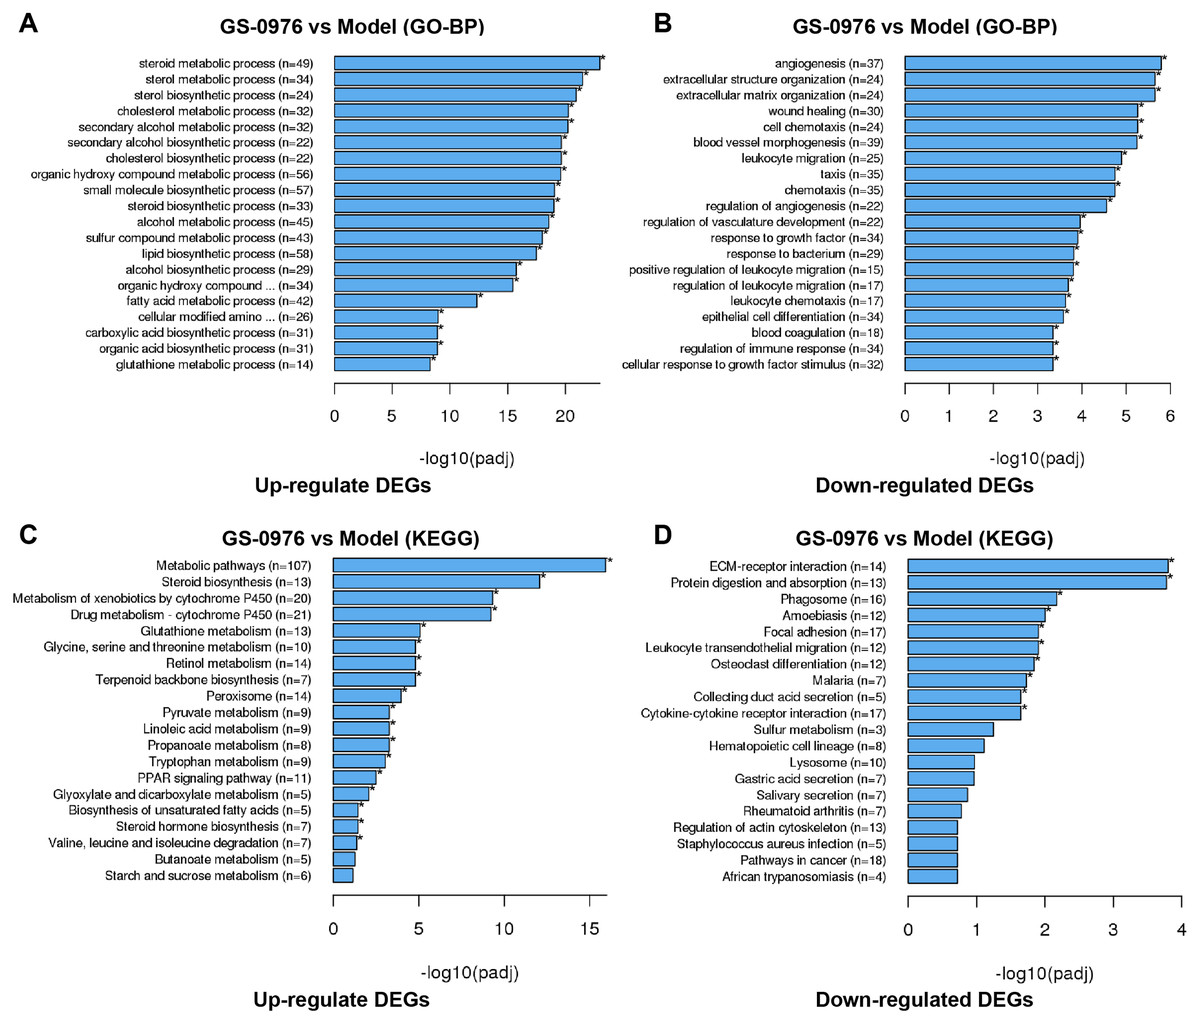
Figure 4: GO and KEGG enrichment analysis of DEGs.
Top 20 GO biological process categories of significantly up- (A) and down-regulated (B) DEGs were presented in bar charts. Top 20 KEGG pathways among the up- (C) or down-regulated (D) DEGs were presented in bar charts.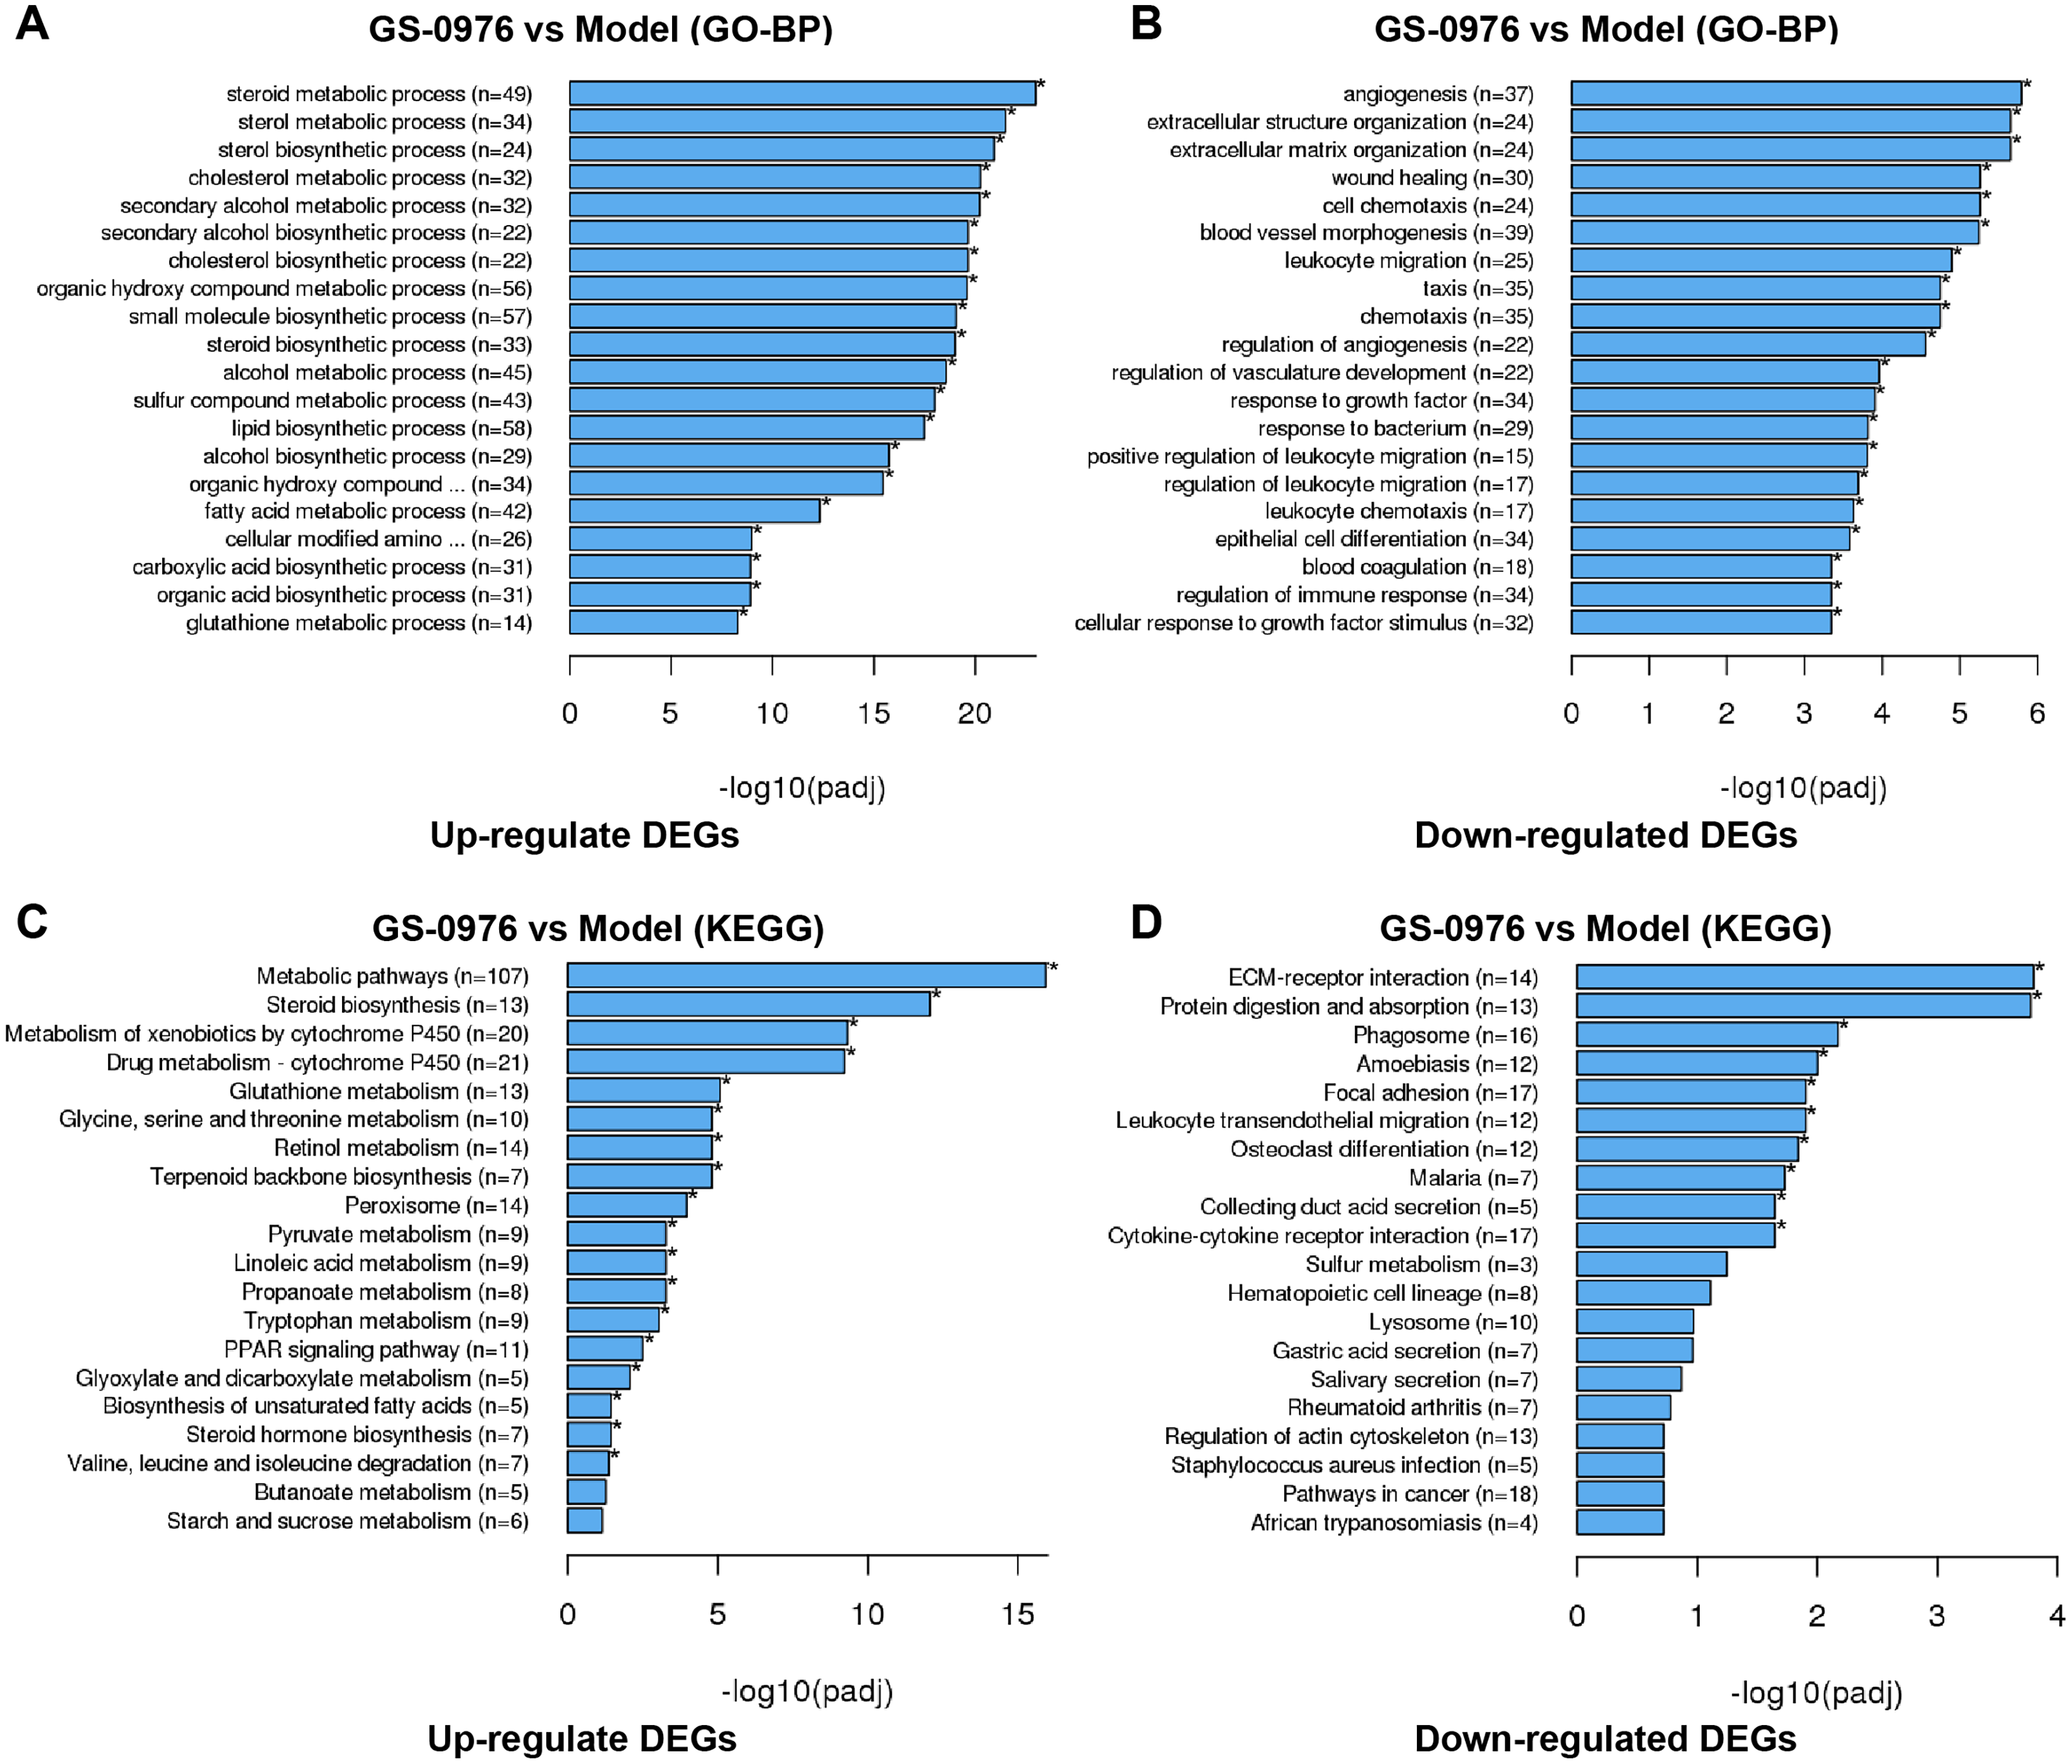
To further identify relevant biological pathways, KEGG pathway analysis were performed based on the annotation results. The top 20 KEGG pathways among the up- or down-regulated DEGs were showed in Figs. 4C and 4D. The most significantly enriched pathway was “Metabolic pathways” including 107 up-regulated DEGs. As for the down-regulated DEGs, enriched pathways included “ECM-receptor interaction”, “Protein digestion and absorption”, “Leukocyte transendothelial migration”, “Focal adhesion” and “Cytokine-cytokine receptor interaction”. Some of the pathways and the corresponding genes were mapped by Pathview (Fig. 5) and listed in Table 1.
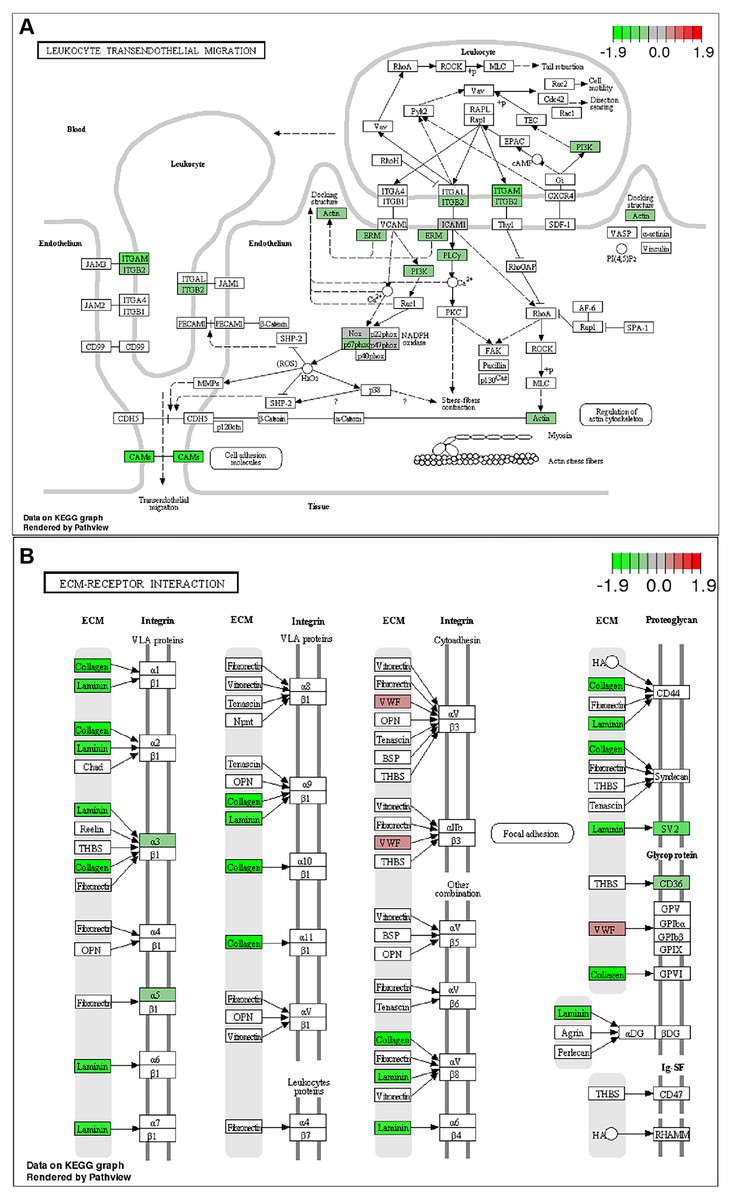
Figure 5: KEGG pathway analysis .
List of the DEGs implicated in “Leukocyte transendothelial migration” (A) and “ECM-receptor interaction” (B) signaling pathways. The red frames represent upregulated DEGs; the green frames represent downregulated DEGs .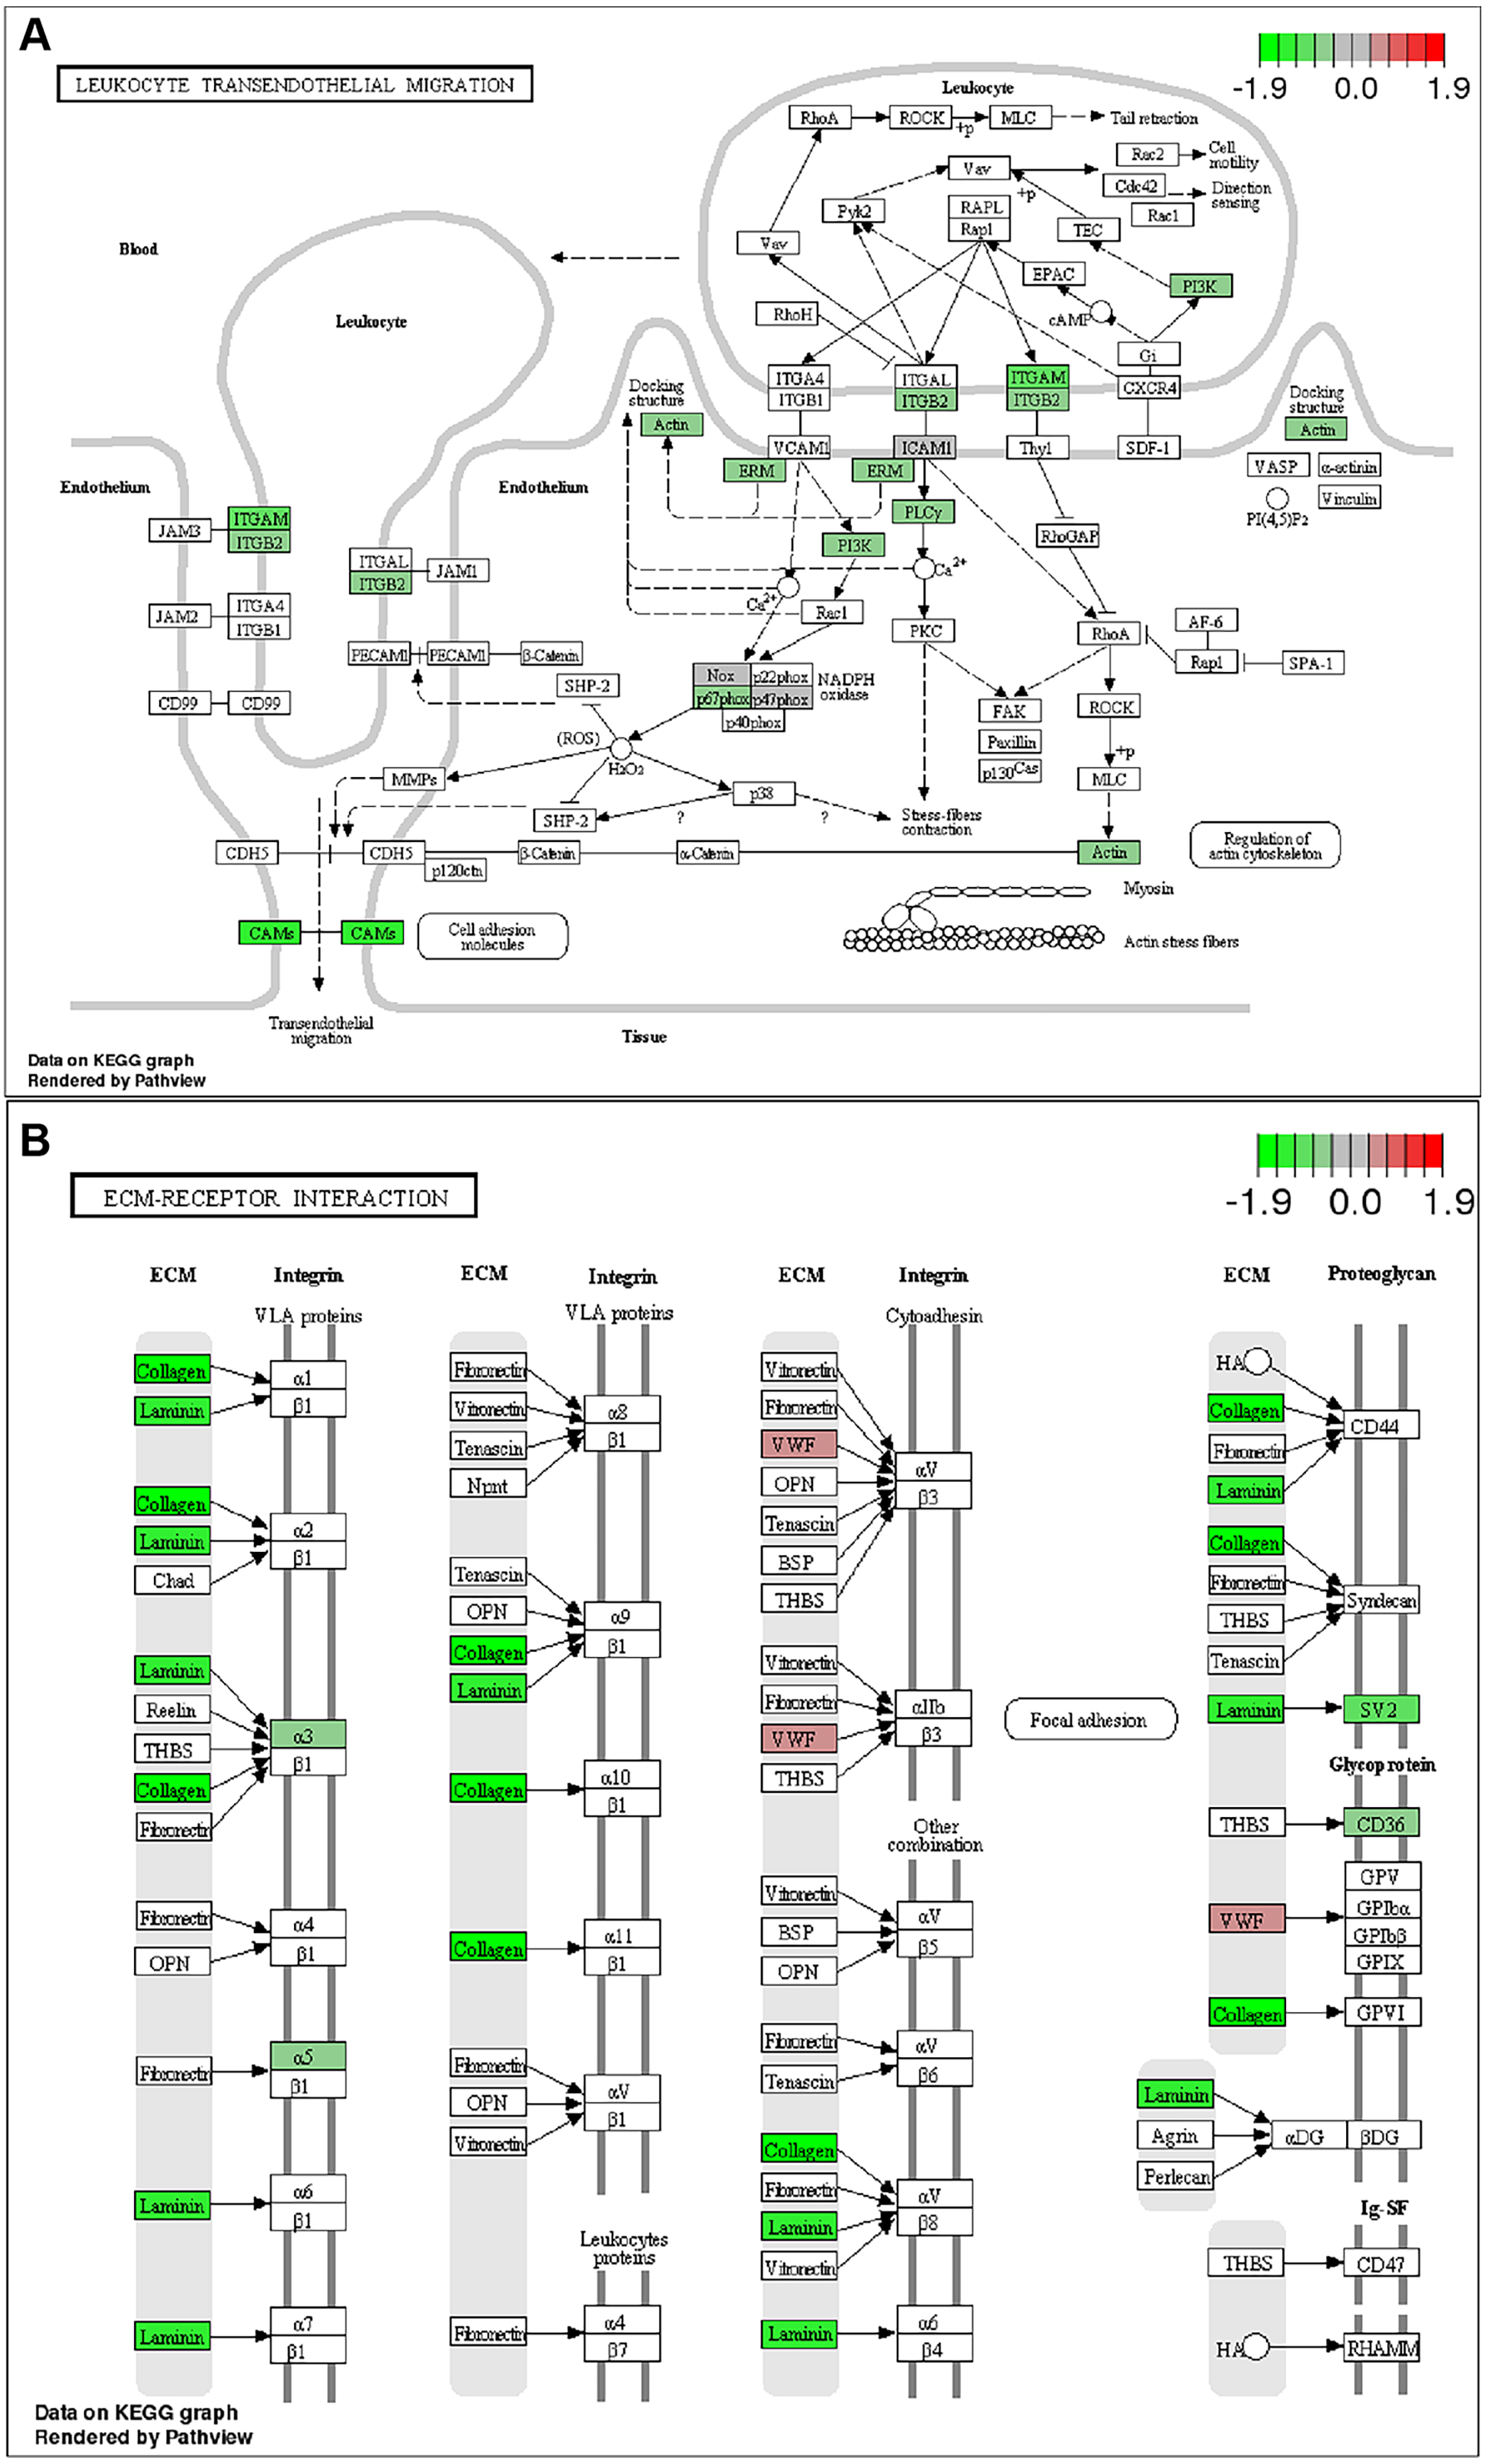
In vitro validation of GS-0976 on lipid accumulation and fibrosis
To further validated the effect of GS-0976 on lipid accumulation, the Oil red O staining was used to detect the lipid accumulation in FFA-induced LO2 cells treated with GS-0976. As shown in Figs. 6A–6E, the lipid accumulation was decreased by GS-0976 treatment at all dosages. The effect on anti-fibrosis is an important factor for evaluating the efficacy of drugs in NASH. Thus, the effects of GS-0976 on fibrosis were assessed in LX-2 cells. The mRNA levels of α-SMA, COL1A1, CTGF were significantly increased with 10 ng/mL TGF- β1 stimulation and these changes were inhibited by GS-0976 (Fig. 6F). Besides, the decreased expression of COL1A2, COL3A1, SULF2 found in vivo were observed in TGF-β1-induced LX-2 cells with GS-0976 treatment (Fig. 6F).
| Description | BgRatio | Padj | Gene ID |
|---|---|---|---|
| Metabolic pathways | 1106/5208 | 1.16E−16 | Cyp2c29/Idi1/Pmvk/Tm7sf2/Gclc/Sqle/Rdh11/Nsdhl/Cyp51/Hmgcs1/Ugdh/Acss2/ Acat2/Msmo1/Me1/Fdft1/Cbs/Qdpr/Sc5d/ Ebp/Acacb/Lipc/Kynu/Lss/Mvd/Acaca/Adh4/Mvk/Coasy/Ddc/Dhcr7/Cyp2c38/ Cyp27a1/Pi4k2b/Aox1/Cyp2j5/Cyp2r1/Aldh1a7/Cyp2c55/Cyp4f14/ Cyp1a2/Tat/Haao/9130409I23Rik/ Cyp3a11/Hibadh/Gldc/Ugt2b36/Sgms2/Pcyt2/Ugt2b5/Idh1/Fdps/ Gbe1/Ndufa4/Csad/Mmab/Comt/Atp5j/Acmsd/Agxt/Cyp2c44/Mdh1/Dhcr24/ Cat/Paics/St3gal3/Slc33a1/Tgds/Scp2/Aldh7a1/Oat/ Akr1c6/Adk/Hsd17b7/Amt/Amdhd1/Pcca/Pon1/Hsd17b2/Acsl5/Ndufv3/Mcee/Hyi/ Lap3/Mat2b/Baat/Enpp3/Cyp2c70/Btd/Adi1/ Cept1/Atp5g1/Gclm/Pik3c3/Cbr3/Gatm/Pipox/ Cox6c/Acly/Otc/Nat2/Glud1/Acss3/Khk/Acsm5/Atp5e |
| ECM-receptor interaction | 84/5208 | 0.00015843 | Cd36/Itga5/Col5a2/Col4a4/Lama5/Sv2a/Col6a1/Lamb2/Col3a1/Col4a1/ Col1a2/Col4a6/Col6a2/Itga3 |
| Protein digestion and absorption | 77/5208 | 0.00016717 | Atp1a3/Kcnn4/Col5a2/Col4a4/Slc1a5/Col6a1/Col3a1/Col4a1/Slc7a8/ Col1a2/Col14a1/Col4a6/Col6a2 |
| Leukocyte transendothelial migration | 111/5208 | 0.01246479 | Itgb2/Itgam/Cldn14/Cldn15/Actg1/Ezr/Plcg2/Icam1/Pik3r5/Cybb/Ncf1/Ncf2 |
| Focal adhesion | 196/5208 | 0.01246479 | Flna/Cav1/Itga5/Col5a2/Col4a4/Lama5/Actg1/Col6a1/Tln1/Lamb2/Col3a1/ Col4a1/Col1a2/Col4a6/Pik3r5/Col6a2/Itga3 |
| Cytokine-cytokine receptor interaction | 216/5208 | 0.02264483 | Cxcl1/Ccr1/Csf2rb/Csf2ra/Ccr2/Tnfrsf12a/Inhbe/Lepr/Tnfrsf1b/Kitl/ Clcf1/Pf4/Ccl6/Il6ra/Csf1r/Cxcl14/Tnfrsf11b |
Discussion
In this study, we confirmed the effect of GS-0976 in CDAHFD-induced NASH model. RNA-Seq transcriptome was used to analyze the gene expression profiles in mice treated with GS-0976. Functional enrichment analysis of the DEGs highlighted the pathways involved in metabolic, fibrosis and immune/ inflammation processes.
Various NASH mouse models have been established based on different genetic or dietary operations (Santhekadur, Kumar & Sanyal, 2018). And there was no universal mouse model of NASH for not well-replicating human disease or rapidly progressing to fibrosis. In our study, the CDAHFD consisting of 60% kcal fat and 0.1% methionine was used to establish NASH model in C57BL/6 mice. Studies have reported that mice fed with CDAHFD showed excessive fat accumulation in the liver and rapidly developed progressive hepatic fibrosis with the body weight mildly changed. Thus, CDAHFD-induced NASH model can be potentially useful for understanding human NASH (Jain et al., 2018; Matsumoto et al., 2013; Susutlertpanya et al., 2019).
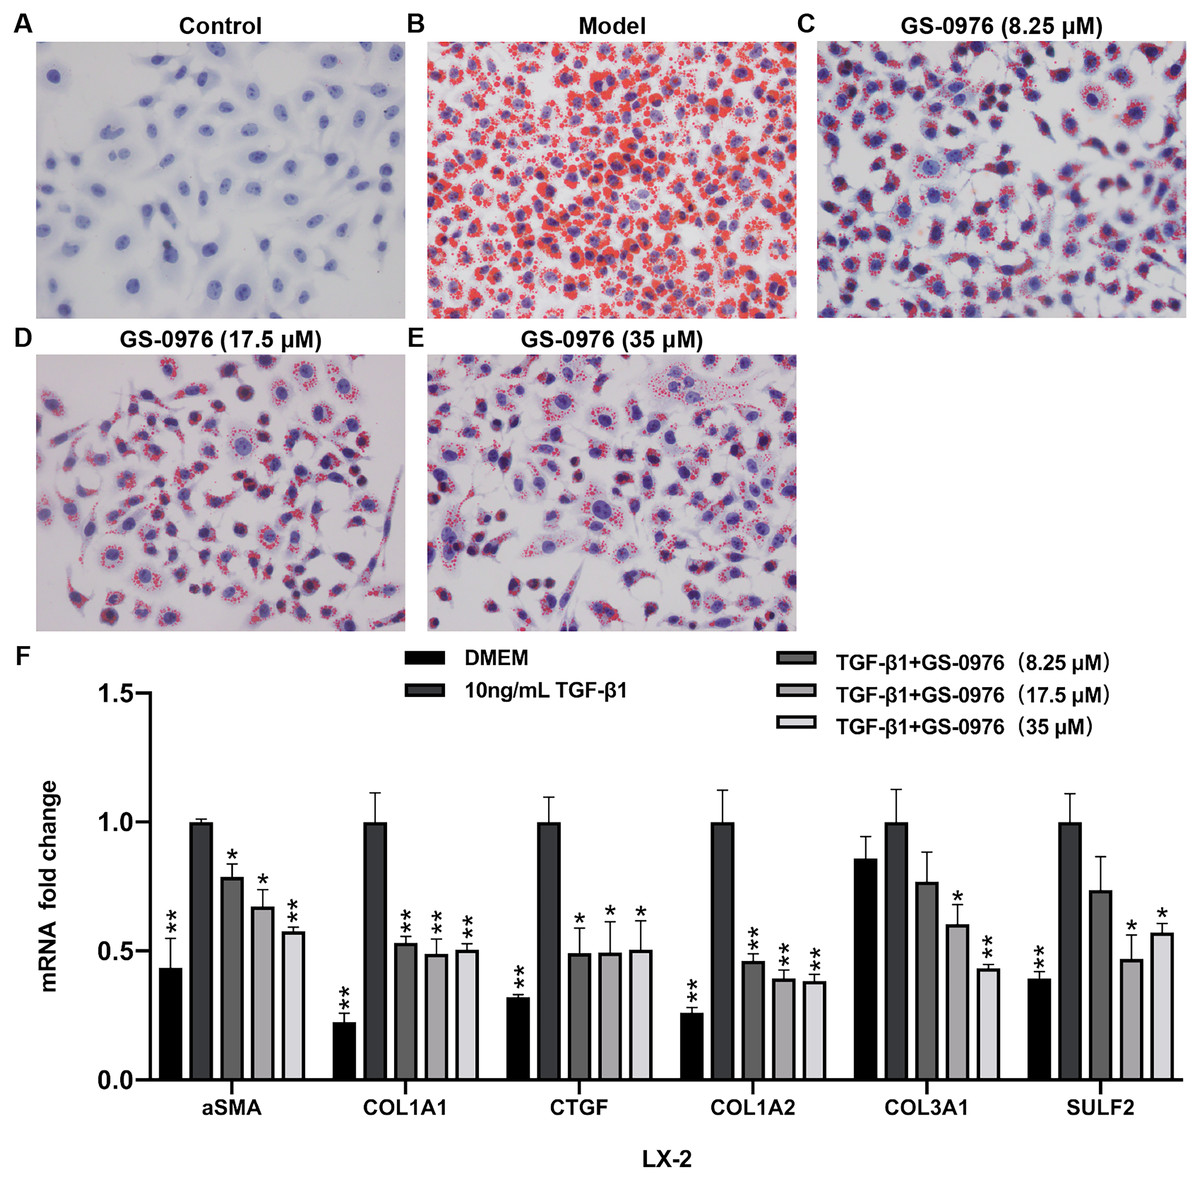
Figure 6: GS-0976 reduced lipid accumulation and expression of profibrogenic genes.
(A–E) Oil Red O staining was performed in LO2 cells after treatment with the indicated GS-0976 in the presence of 0.8 mM FFA for 24 h. Original magnification , 400 ×. (F) Quantitative RT-PCR assessments of the mRNA levels of α-SMA, COL1A1, CTGF , COL1A2, COL3A1, SULF2 in response to GS-0976 treatment in LX-2 cells. Data are presented as means ±SEM; n = 3. ∗P < 0.05, ∗∗P < 0.001 compared with the 10 ng/mL TGF- β1 treatment group by One-way ANOVA with LSD test.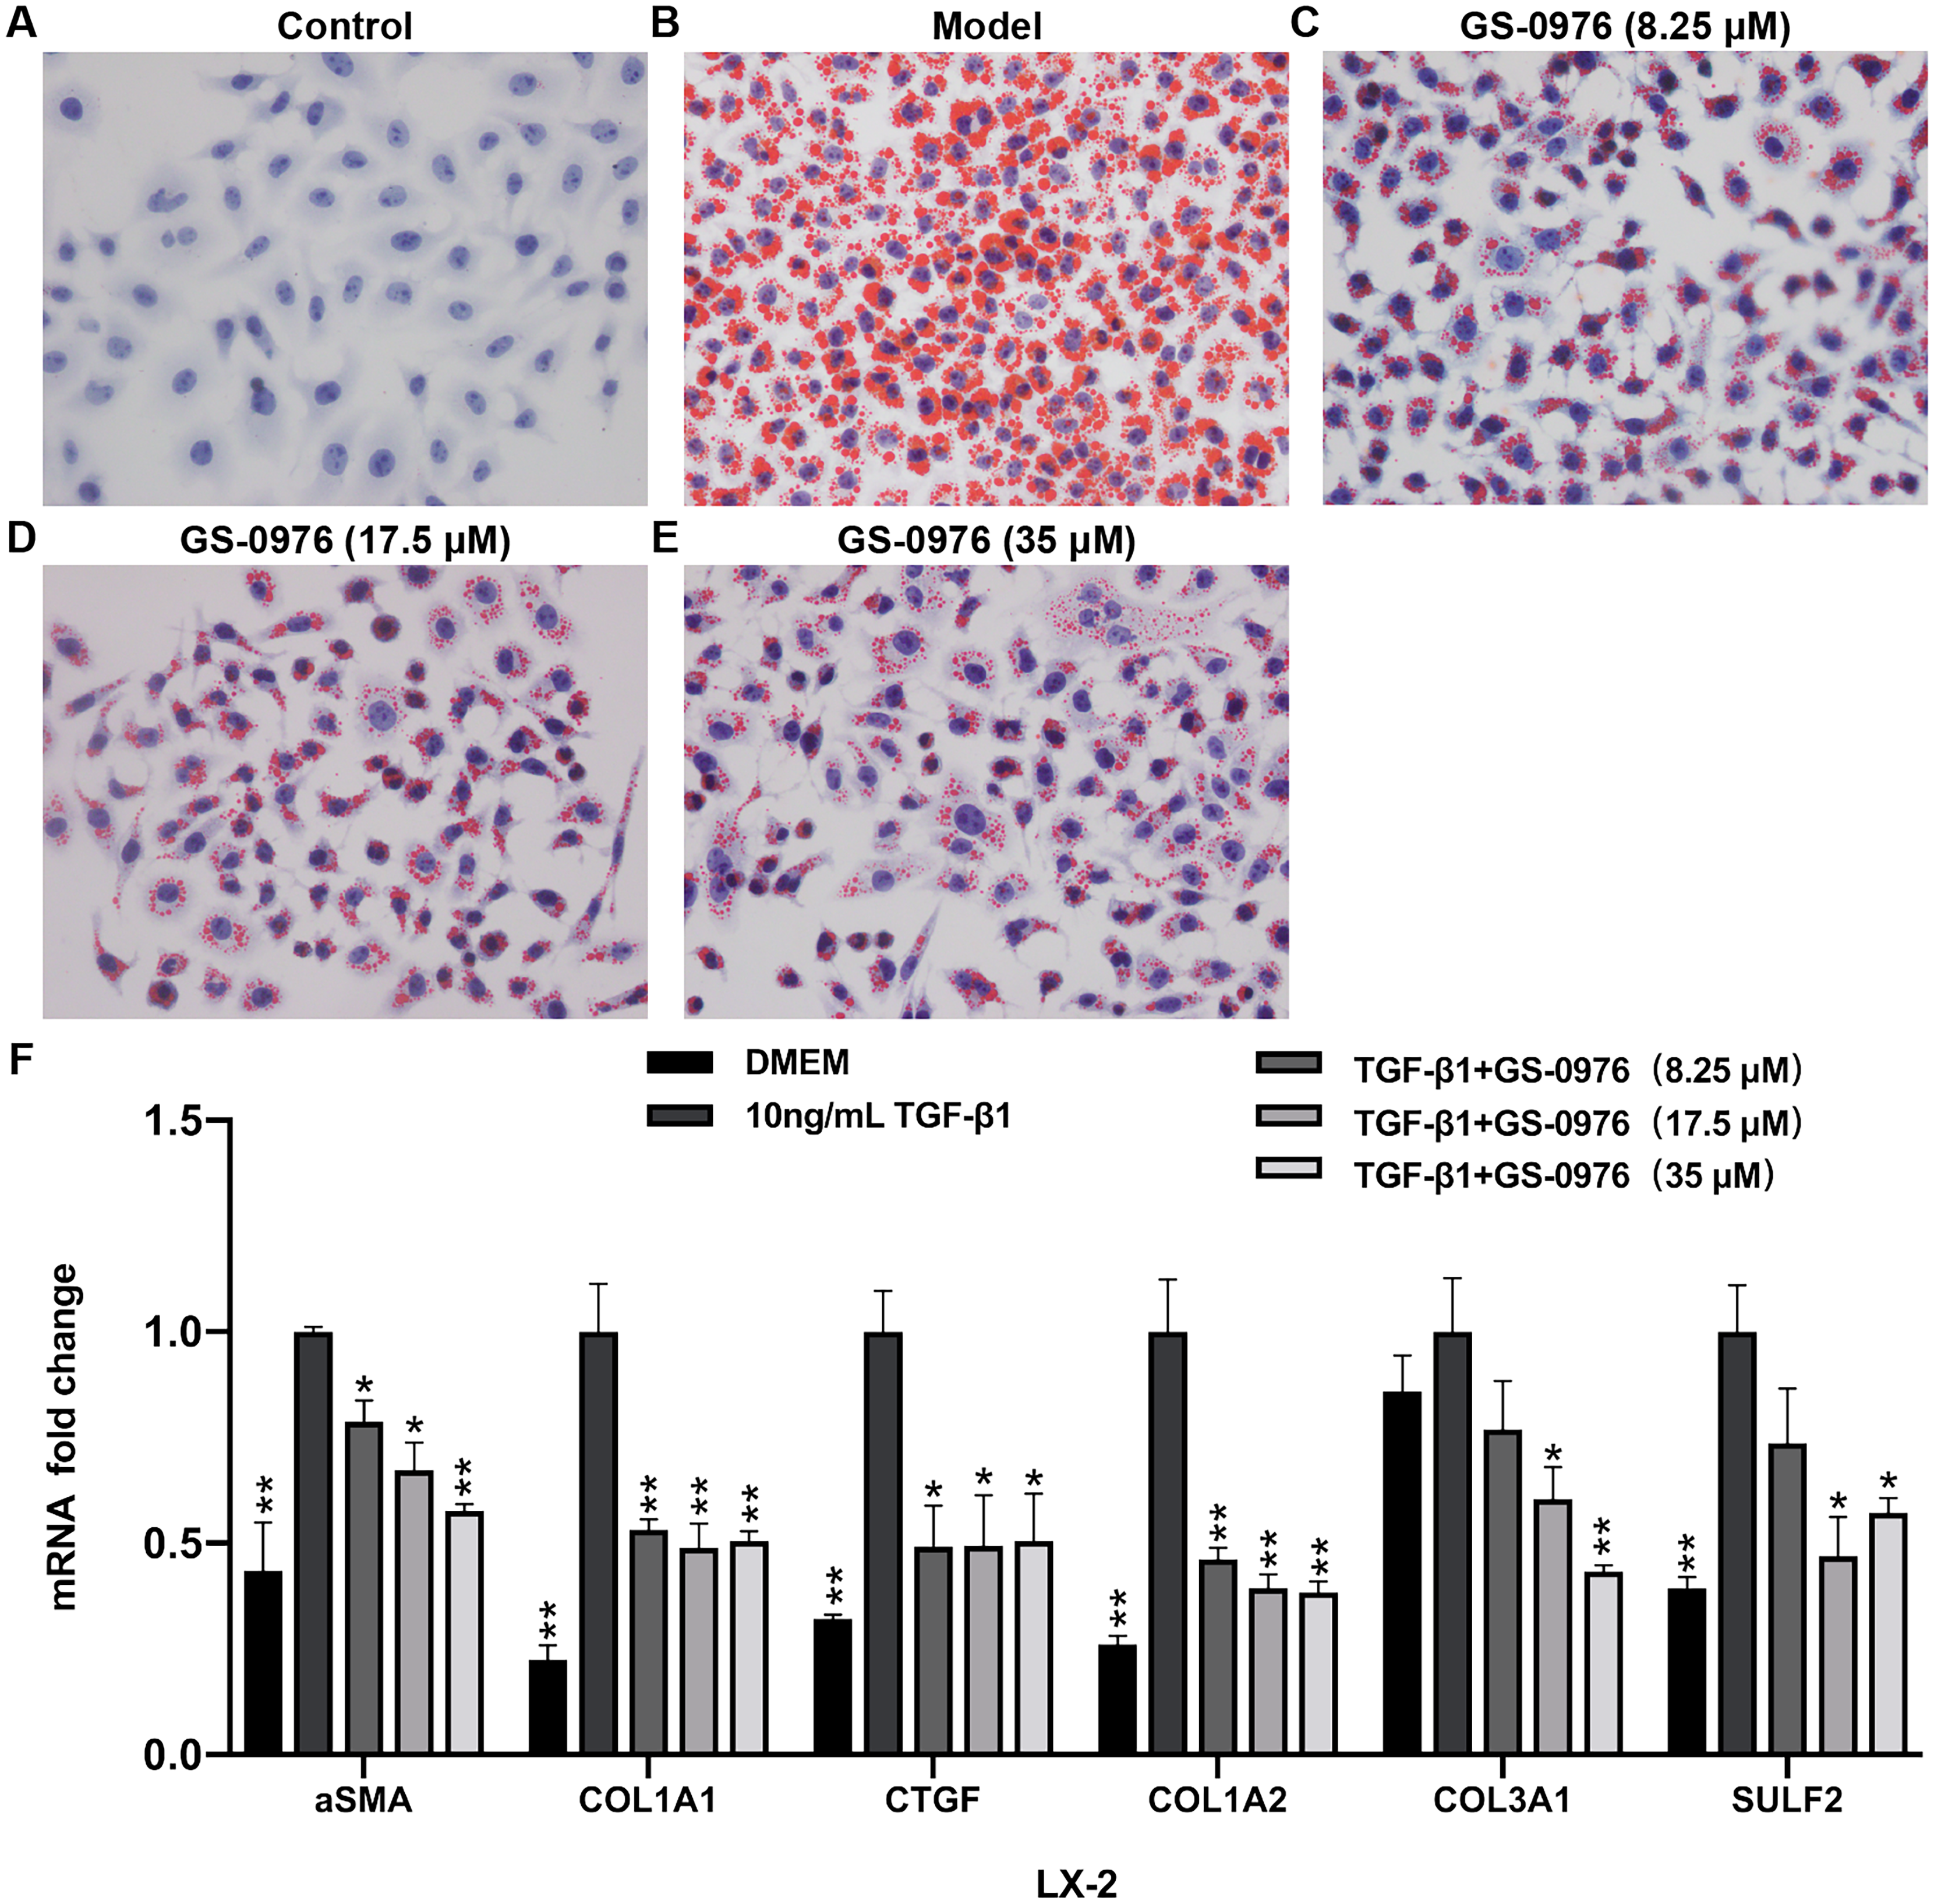
Studies have showed that hepatic steatosis is the primary cause for NAFLD/NASH. The accumulation of lipid will lead to cell damage, organelle dysfunction, and chronic inflammation. Saturated fatty acids (SFA), including palmitate acid and stearate acid, have lipotoxicity in the steatotic liver (Musso et al., 2018). There are two ways to inhibit hepatic SFA lipotoxicity. One is to regulate nuclear transcription factors through LXR-α (liver X receptor α), FXR (farnesoid X receptor) and peroxisome proliferator–activated receptors (PPARs). The other is to inhibit the enzymes involved in lipid synthesis (Musso et al., 2018). Inhibition of Acetyl-CoA carboxylase, the first rate-limiting enzymes involved in de novo fatty acid synthesis, is an effective way to inhibit lipotoxicity. The previous study has showed that NASH patients received GS-0976 20 mg daily for 12 weeks, hepatic lipid was decreased (Lawitz et al., 2018). In our study, the hepatic steatosis was decreased by GS-0976 treatment in CDAHFD-induced NASH model (Figs. 2C–2F, 2N, 2O). These results were confirmed in vitro hepatic steatosis cell model (Figs. 6A–6E). The underlying mechanism of GS-0976 in decreasing hepatic steatosis was indicated by RNA-Seq transcriptome analysis. GS-0976 regulated the genes associated with metabolic pathways. These genes involved in fatty acid oxidation were significantly increased, such as Dbi and Fabp1, encoding the binding protein of acyl-CoA and free fatty acid for mitochondrial β-oxidation. FABP1 expression was shown to be overexpressed in simple steatosis, but underexpressed in NASH patients. The decrease of FABP1 expression could inhibit its detergent effect on FFA (Charlton et al., 2009). Lipid catabolic genes such as Ces1f and Lipc were up-regulated. Adiponectin receptor 2 (AdipoR 2) involved in the PPAR α pathway activation was up-regulated as well (Kadowaki & Yamauchi, 2005) (Figs. 3B, 3C). However, the up-regulation of several genes involved in steroid, cholesterol and fatty acid biosynthesis were observed with GS-0976 treatment, such as stearoyl-CoA desaturase 1 (Scd1), Phosphomevalonate kinase (Pmvk) and elongation of long-chain fatty acids family member 6 (Elovl6). These genes were down-regulated with CDAHFD feeding (Fig. 3B). The homeostasis and compensatory response of liver might explain these results. Ye et al. reported that Hmgcr, encoding the rate-limiting enzyme in cholesterol biosynthesis, was down-regulated with high-fat diet plus streptozocin feeding (Ye et al., 2016). It was possible for liver to maintain homeostasis in response to CDAHFD thus resulted in the down-regulation of these genes. Besides, studies indicated that ACC deficiency directly led to a reduction of malonyl-CoA and further repressed the endogenous synthesis of polyunsaturated fatty acids (PUFAs), which in turn could result in the activation of Srebp-1c (Kim et al., 2017). SREBP-1c is a transcription factor that largely regulates the genes involved in fatty acid synthesis including Scd1 and Elovl6 (Horton, Goldstein & Brown, 2002).
Chronic liver inflammation promotes the development of NASH and fibrosis (Farrell & Larter, 2006). In this study, the CDAHFD feeding induced liver inflammatory cell infiltration. Studies showed ND-654, the analog of GS-0976, reduced neutrophil recruitment by decreasing the pro-inflammatory cytokines including Cxcl1 on a chronic inflammation HCC model (Lally et al., 2019). Here we reported the effect of ACC inhibition in NASH-related inflammation. Although GS-0976 treatment modestly alleviated inflammation by H&E staining (Figs. 2C–2F), RNA-Seq analysis showed that the enriched DEGs and pathways were significantly involved in in inflammatory process. Genes of integrin (Itgam/Itgb2), claudin (Cldn14/Cldn15), chemokine (Cxcl1/Ccr1/Ccr2), filamin (Flna) and caveolin (Cav1) are involved in “Leukocyte activation and migration”, “Cytokine-cytokine receptor interaction” and “Focal adhesion” pathways. The expressions of these genes were significantly down-regulated by GS-0976 treatment (Figs. 3B, 3D; Table 1). Thus, GS-0976 treatment attenuated inflammation in CDAHFD-induced NASH model.
Hepatic fibrosis can promote the development of NASH and is associated with poor clinical outcomes in NASH. Anti-fibrotic effects of ACC inhibitor have been noticed by several studies. The serum fibrosis marker TIMP1 was decreased both in a proof-of-concept study and the phase II trial of NASH patients treated with GS-0976 (Lawitz et al., 2018; Loomba et al., 2018). The beneficial effects in rat fibrosis models and primary hepatic stellate cells of GS-834356, an analog of GS-0976, were reported (Bates et al., 2018). The anti-fibrosis mechanism of GS-0976 has not been fully elucidated. In this study, Sirius red showed that GS-0976 could significantly reduce the fibrosis in the CDAHFD NASH model (Figs. 2I–2L). According to the RNA-Seq analysis, GS-0976 downregulated genes related to ECM function and structure, including ECM receptor interaction, protein digestion and absorption, local adhesion and extracellular matrix organization (Table 1). Moreover, GS-0976 can inhibit the expressions of α-SMA, COL1A1, CTGF, COL1A2, COL3A1, SULF2 in LX-2 cells, suggesting that GS-0976 has a direct anti-fibrotic effect (Fig. 6F).
It has been reported that NASH is accompanied by increased angiogenesis both in human and animal experimental models (Kitade et al., 2006; Kitade et al., 2008). Increased angiogenesis can promote the inflammation and fibrosis in NASH. Studies have demonstrated that the inhibition of angiogenic response by suppressing the interaction between VEGF signaling and Ang-2/Tie2 attenuated the severity of NASH in experimental models (Coulon et al., 2013; Lefere et al., 2019). In our study, the GO terms of angiogenesis and blood vessel morphogenesis were significantly enriched in down-regulated DEGs (Fig. 4B), suggesting the potential efficiency of GS-0976 on angiogenesis.
Conclusion
GS-0976 attenuated liver injury in CDAHFD-induced NASH model. Comparative RNA-seq transcriptome analysis showed that GS-0976 can regulate the expression of genes involved in the metabolism, inflammation, fibrosis and angiogenesis of NASH. These results further elucidate the mechanisms of GS-0976 in NASH.