
Population history of deep-sea vent and seep Provanna snails (Mollusca: Abyssochrysoidea) in the northwestern Pacific
- Published
- Accepted
- Received
- Academic Editor
- Tim Collins
- Subject Areas
- Biodiversity, Ecology, Marine Biology, Zoology, Biological Oceanography
- Keywords
- Chemosynthetic community, DNA barcoding, Population expansion, Okinawa Trough
- Copyright
- © 2018 Ogura et al.
- Licence
- This is an open access article distributed under the terms of the Creative Commons Attribution License, which permits unrestricted use, distribution, reproduction and adaptation in any medium and for any purpose provided that it is properly attributed. For attribution, the original author(s), title, publication source (PeerJ) and either DOI or URL of the article must be cited.
- Cite this article
- 2018. Population history of deep-sea vent and seep Provanna snails (Mollusca: Abyssochrysoidea) in the northwestern Pacific. PeerJ 6:e5673 https://doi.org/10.7717/peerj.5673
Abstract
Background
Gastropods of the genus Provanna are abundant and widely distributed in deep-sea chemosynthetic environments with seven extant species described in the northwestern Pacific.
Methods
We investigated the population history and connectivity of five Provanna species in the northwestern Pacific through population genetic analyses using partial sequences of the cytochrome c oxidase subunit I gene.
Results
We found that P. subglabra, the most abundant and genetically diverse species, is genetically segregated by depth. Among the five species, the three comparatively shallower species (P. lucida, P. kuroshimensis, P. glabra) had a more constant demographic history compared to the deeper species (P. subglabra, P. clathrata).
Discussion
Environmental differences, especially depth, appears to have a role in the segregation of Provanna snails. The population of P. clathrata in the Irabu Knoll appears to have expanded after P. subglabra population. The remaining three species, P. lucida, P. kuroshimensis, and P. glabra, are only known from a single site each, all of which were shallower than 1,000 m. These data indicate that Provanna gastropods are vertically segregated, and that their population characteristics likely depend on hydrothermal activities.
Introduction
A true understanding of biodiversity is not just about counting the number of species, but must also encompass comprehensive understanding of evolutionary processes and natural history in a heterogeneous biosphere (Grosberg, Vermeij & Wainwright, 2012). The knowledge of evolutionary processes in the deep-sea, despite it making up about 95% of all habitable space on Earth, is limited due to its inaccessibility. Deep-sea hydrothermal vents and hydrocarbon seep areas are populated by many species endemic to these deep habitats, and provide opportunities to investigate evolutionary and ecological processes, such as succession and the invasion of new habitats. About half of known hydrothermal vents are located on mid-ocean ridges, while the other half are located in arc-backarc systems (Beaulieu et al., 2013). The latter systems are younger, for example, vents in the Mariana Trough and Manus Basin appeared only six and four million years ago, respectively (Ishibashi & Urabe, 1995). Unlike vents, hydrocarbon seeps are not confined to spreading centres, and are found along passive and active margins around the globe. Faunal compositions of vent and seep fauna tend to be different, and fauna in back-arc hydrothermal vents are mostly separated among basins (Desbruyères, Hashimoto & Fabri, 2006). To understand evolutionary processes in the deep sea, it is critical to understand how taxa invade and colonize such ecosystems.
The northwestern Pacific is an excellent model system for examining such evolutionary processes, since there are back-arc vents (e.g., Okinawa Trough, Manus Basin) and hydrocarbon seeps (e.g., Sagami Bay, Nankai Trough) in close proximity. The Okinawa Trough is a back-arc basin with more than 10 known hydrothermal vent fields, and more continue to be discovered (Ishibashi et al., 2015; Nakamura et al., 2015; Chen et al., 2017; Miyazaki et al., 2017). As these vents appeared only two million years ago at the southern end of the back-arc basin, the historical evidence of animals invading these habitats can still be recovered genetically, along with ongoing evolutionary and ecological processes. Gastropod snails of the superfamily Abyssochrysoidea radiated about 50–158 million years ago, and today they are common inhabitants of deep-sea chemosynthetic environments including hydrothermal vent fields, hydrocarbon seep sites, and organic falls (Johnson et al., 2010). The genus Provanna, particularly, is a representative group in the northwestern Pacific (Fujikura, Okutani & Maruyama, 2008; Johnson et al., 2010). Recently, a combined effort of morphological and genetic approaches revealed that the Provanna species dominant in the Sagami Bay seep area is distinct from those (at least three species) inhabiting the Okinawa Troughvents. Furthermore, another species was discovered from the Kuroshima Knoll seep area in the Ryukyu Trench, on the eastern side of the Ryukyu Arc (Sasaki et al., 2016). However, ecological differences amongst species have not been available for these species, as Provanna species are difficult to differentiate in video imaging due to morphological similarities and their small sizes (as noted by Nakajima et al., 2015).
For such animals inhabiting deep-sea ecosystems that can only be observed in sporadic time points, population genetics provide valuable insights to inferring historical parametres such as dispersal, past population sizes, and relationships among populations, as demonstrated by Rogers & Herpending (1992). Indeed, population genetics studies have revealed many dispersal barriers for deep-sea hydrothermal vent faunas since the 1990s, including depth, oceanic currents, and lateral offsets in mid-oceanic ridges (reviewed in Vrijenhoek, 2010). Most of these dispersal barriers do not apply to arc-backarc and subduction systems which have different geological features and deep currents, however, and therefore dispersal barriers for deep-sea taxa remain poorly understood for the western Pacific where such systems dominate (Watanabe et al., 2010). Population genetic analyses of animals inhabiting the western Pacific will provide new insights for evolutionary and ecological processes shaping the deep-sea ecosystems as we know today across time, and help to improve dispersal models (Mitarai et al., 2016).
Accordingly, we conducted population genetic analyses of five Provanna species inhabiting the northwestern Pacific vents and seeps to understand their population history. One species, P. glabra, dominates the hydrocarbon seeps in Sagami Bay and has been shown to be phylogenetically very close to P. laevis in Monterey Bay, California (Sasaki et al., 2016). Three species, including P. subglabra, P. clathrata, and P. lucida, inhabit hydrothermal vents in the Okinawa Trough, with P. subglabra being the most abundant and wide-spread. A further species, P. kuroshimensis, is limited to the Kuroshima Knoll seep site in the Ryukyu Trench (Sasaki et al., 2016). For each species we investigated genetic diversities, which accumulates after colonization. Furthermore, we discuss the colonization scenario of the five Provanna species inferred from their population genetics data, and the potential factors contributing to their population history.
Materials and Methods
Sampling
A total of 204 Provanna gastropods were collected from 10 chemosynthetic sites in Sagami Bay, the Okinawa Trough, and the Ryukyu Trench (Fig. 1, Table 1), on-board the Japan Agency for Marine-Earth Science and Technology (JAMSTEC) ship R/V Natsushima. Provanna glabra was collected from the Off Hastushima seep site, Sagami Bay, by the remotely operated vehicle (ROV) Hyper-Dolphin during the NT11-01 cruise (January 2011). Specimens from hydrothermal vent fields in the Okinawa Trough were collected by the same submersible during the cruise NT11-20 conducted in October 2011. Provanna kuroshimensis was collected from the Kuroshima Knoll seep site, Ryukyu Trench, during the NT02-07 and NT02-08 cruises in May 2002 by ROV Dolphin 3K and the human-occupied vehicle (HOV) Shinkai 2000, respectively. Upon recovery on-board the ship, all specimens were fixed and preserved in 99.5% ethanol or frozen in −20 °C for DNA extraction.
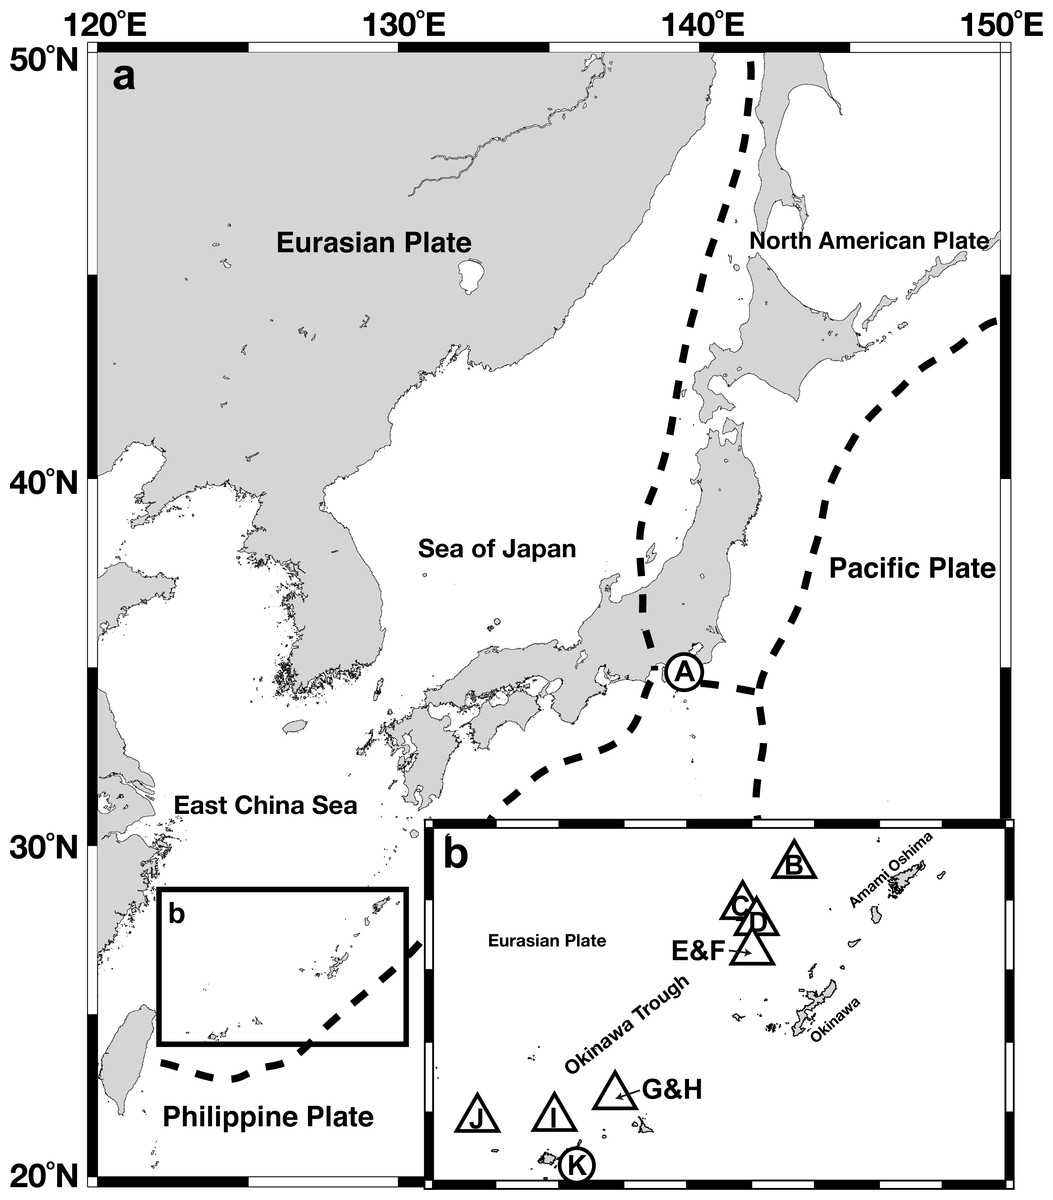
Figure 1: Gross map (A) and magnified map (B) of sampling locations in the Nansei-shoto area.
Circles, methane seep sites; triangles, hydrothermal fields. IDs in the capitalized letters corresponds to those in Table 1.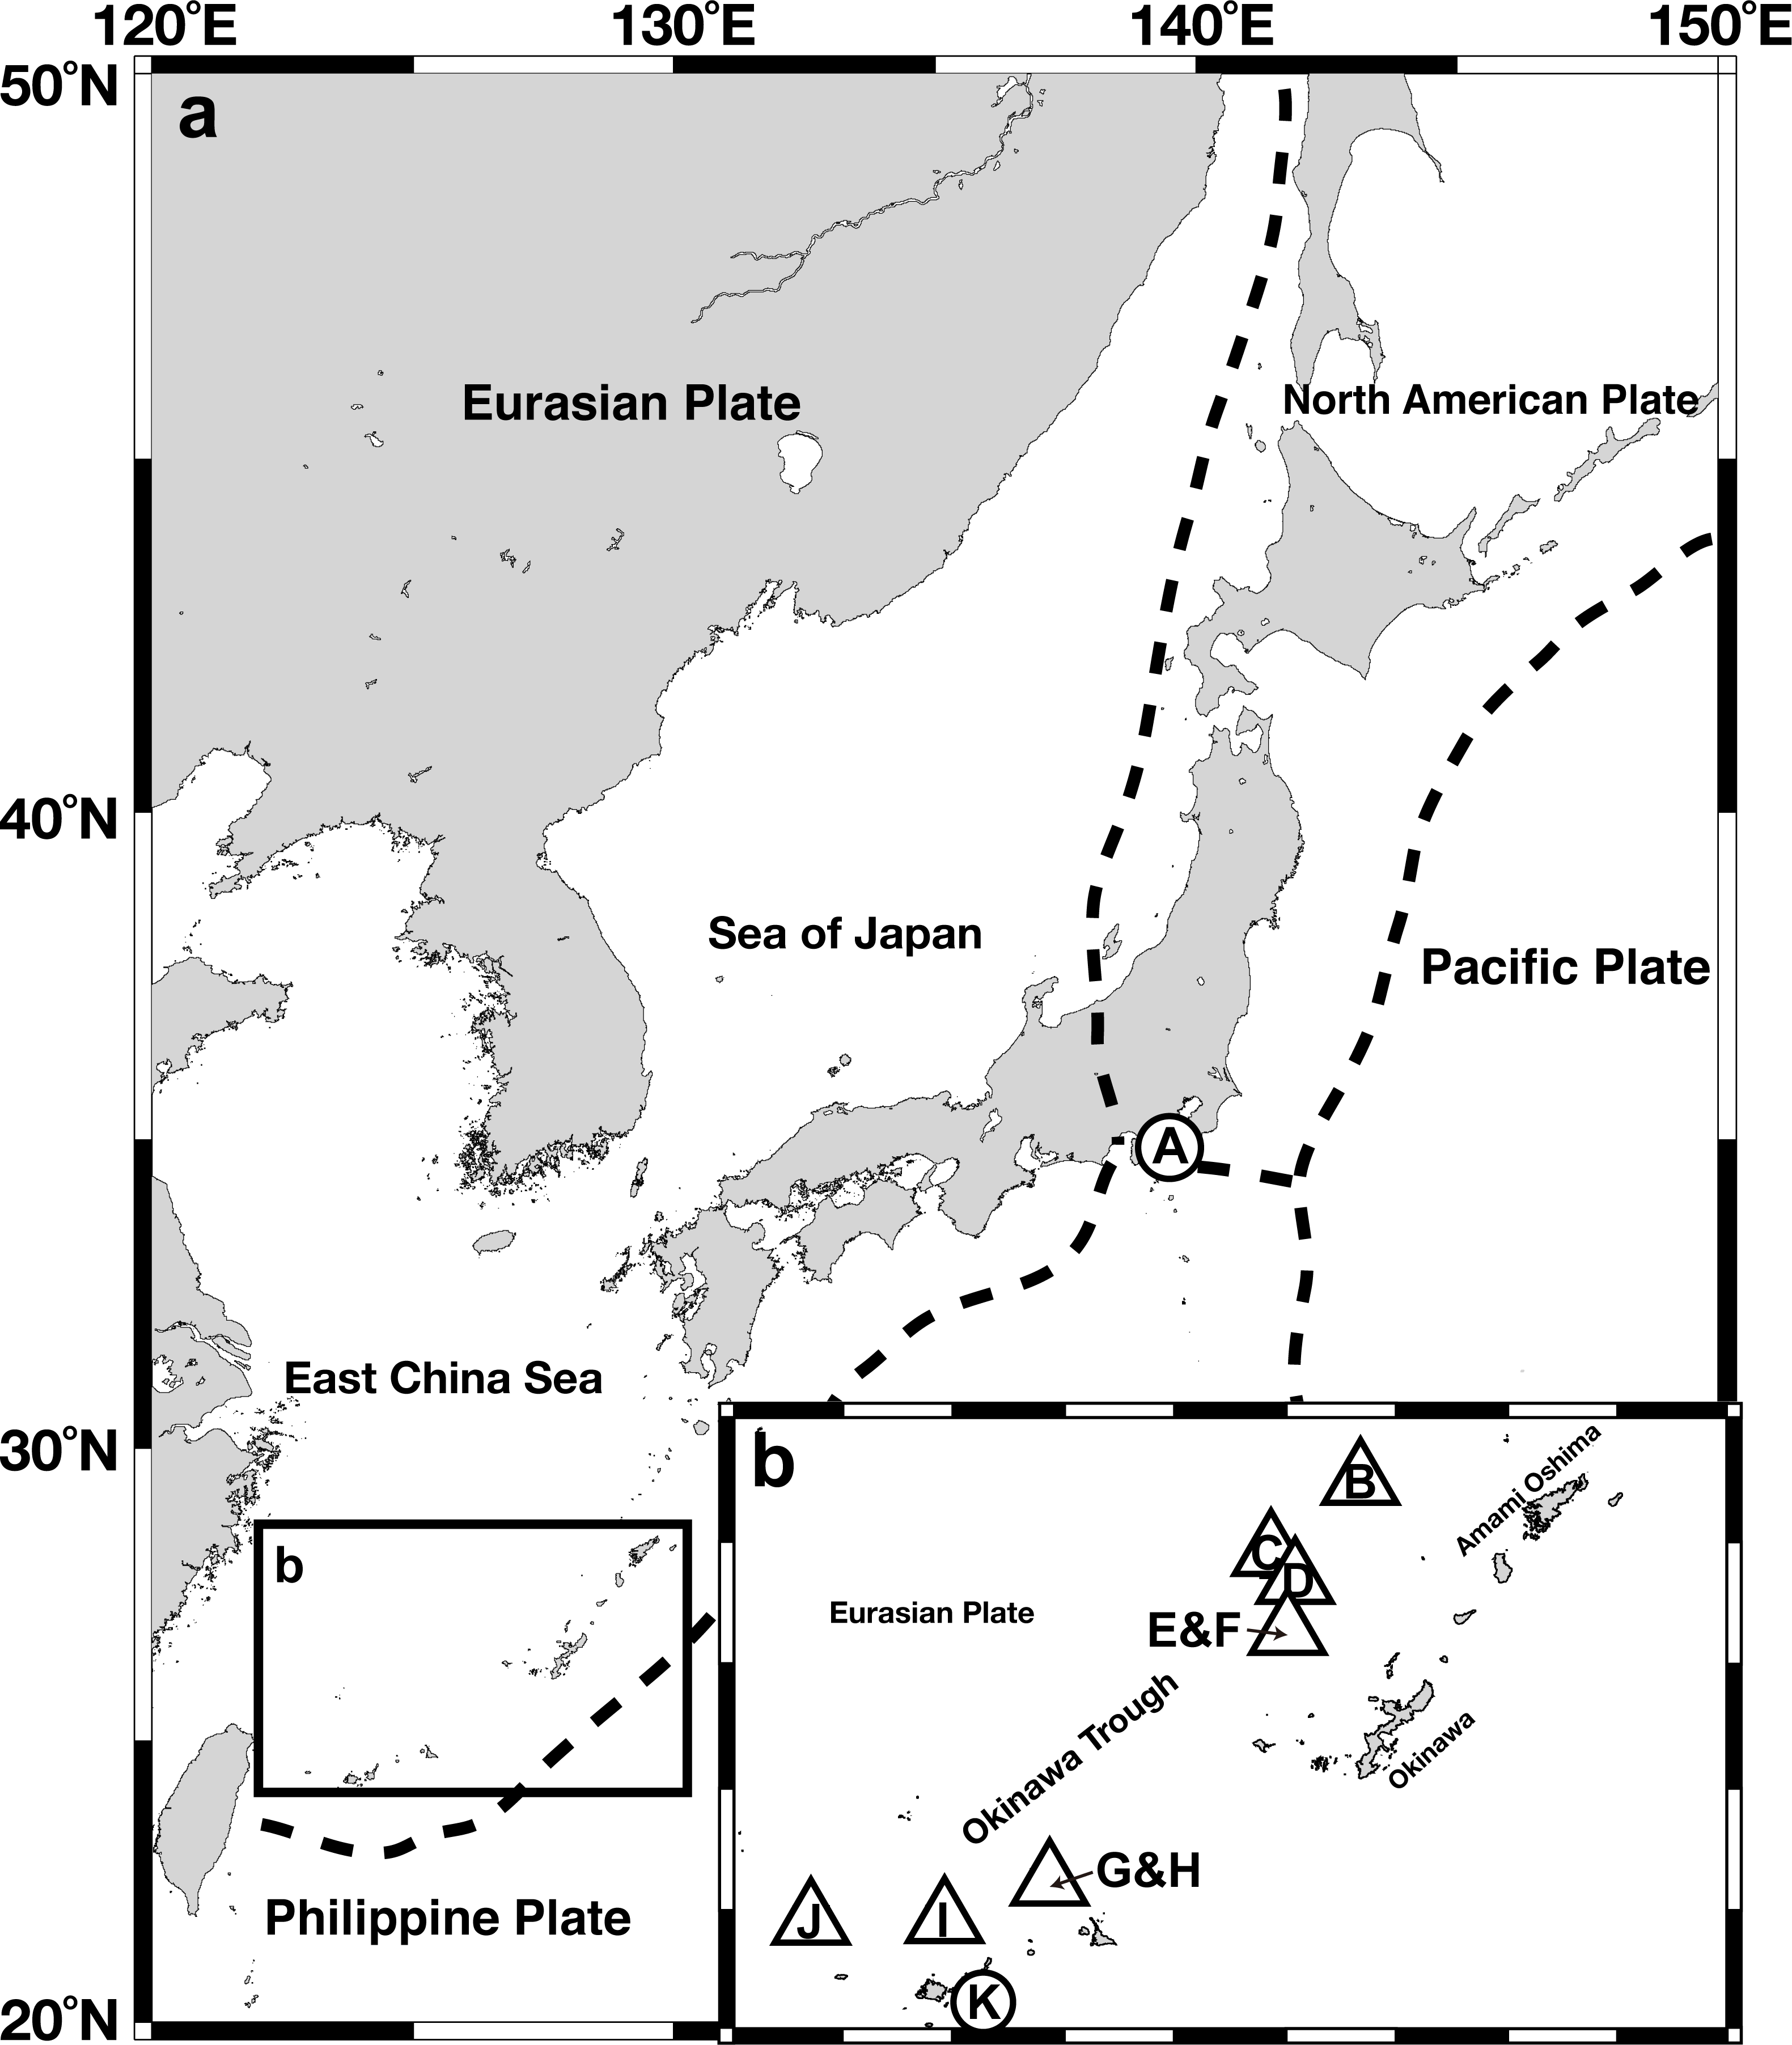
| ID | Site | Type | Latitude | Longitude | Depth (m) |
|---|---|---|---|---|---|
| Sagami Bay | |||||
| A | Off Hatsushima | Seep | 35°00′N | 139°14′E | 1,172 |
| Nansei-shoto area | |||||
| B | Minami Ensei Knoll | Vent | 28°24′N | 127°38′E | 701 |
| C | Iheya North | Vent | 27°48′N | 126°54′E | 982 |
| D | Iheya Ridge | Vent | 27°33′N | 126°58′E | 1,399 |
| E | Jade site, Izena Hole | Vent | 27°16′N | 127°04′E | 1,309 |
| F | Hakurei site, Izena Hole | Vent | 27°15′N | 127°04′E | 1,617 |
| G–H | Irabu Knoll | Vent | 25°14′N | 124°52′E | 1,646 |
| I | Hatoma Knoll | Vent | 24°52′N | 123°51′E | 1,473 |
| J | Dai-yon Yonaguni Knoll | Vent | 24°51′N | 122°42′E | 1,387 |
| K | Kuroshima Knoll | Seep | 24°08′N | 124°12′E | 644 |
DNA extraction and sequencing
Genomic DNA was extracted from the foot muscle Provanna specimens using the DNeasy Tissue Extraction Kit (QIAGEN, Valencia, CA, USA), and 1 µL of the extraction was purified using GeneReleaser (BioVenture, San Carlos, CA, USA) following the manufacturer’s protocol. Fragments of the mitochondrial cytochrome c oxidase subunit I (COI) gene were amplified by polymerase chain reaction from 204 specimens, using the univcrsal primers LCO1490 and HCO2198 (Folmer et al., 1994) and the Pg501L and Pg1253R primer pair designed for Provanna (Sasaki et al., 2016). Reaction volumes consisted of 1 µL template DNA, 13.35 µL deionized sterilized water, 2 µL 10 × PCR buffer, 1.5 µL 2.5 mM dNTP, 1 µL of each primer, and 0.15 µL of 5 U/µL Ex Taq DNA polymerase (TaKaRa, Shiga, Japan), for a total of 20 µL. Targets were amplified by initial denaturation at 94 °C for 120 s, 30 cycles of denaturation at 94 °C for 30 s, annealing at 45 °C for 30 s, and extension at 72 °C for 30 s, followed by final extension at 72 °C for 40 s. PCR products were purified using ExoSAP-IT (United States Biochemical), and sequenced using the BigDye® Terminator Cycle Sequencing Kit Version 3.1 (Applied Biosystems, Foster City, CA, USA). Sequencing reactions contained 1 µL of purified PCR products, 7.55 µL deionized sterilized water, 0.7 µL 5 × BigDye Sequencing Buffer, 0.25 µL of each primer, and 0.5 µL BigDye®, for a total of 10 µL. Reactions were initially denatured at 96 °C for 60 s, and then cycled 25 times at (96 °C for 10 s, 50 °C for 50 s, 60 °C for 60 s). The resulting products were purified using the BigDye XTerminator® Kit (Applied Biosystems, Thermo Fischer) or a Gel Filtration Cartridge (Edge BioSystems, Gaithersburg, MD, USA), and sequenced using an ABI 3130 automated DNA sequencer (Applied Biosystems, Foster City, CA, USA). Sequences obtained were aligned, checked by eye, assembled, and translated into amino acids to confirm the absence of stop codons in Geneious v9 (http://www.geneious.com, Kearse et al., 2012). The resulting COI sequences were registered to DDBJ, EMBL, and GenBank under Accession Numbers AB810040 to AB810216 (Table S1).
Population genetic analyses
Parsimonious haplotype networks were reconstructed for each species from mitochondrial COI fragments (1,044 bp) using the program TCS ver. 2.01 (Clement, Posada & Crandall, 2000) with the connection probability set to 95% and sequences differing only by ambiguous characters treated as the same haplotype. Population history was inferred from the same mitochondrial COI fragmentsfrom about 20 specimens per population (Table 1, Fig. 1) in the program ARLEQUIN ver. 3.5.1.2 (Schneider, Roessli & Excoffier, 2000). Nucleotide and haplotype diversity were estimated, and parametres for the available populations were compared by pairwise ΦST comparison of haploid genes and exact tests (Raymond & Rousset, 1995), as well as AMOVA assuming two scenarios: (1) latitudinal subdivision into northern (Iheya North, Iheya Ridge, JADE and Hakurei sites in the Izena Hole) and southern (Irabu, Hatoma and Dai-yon Yonaguni) populations, or (2) depth subdivision into shallower (Iheya North, Iheya Ridge, and JADE site in Izena Hole) and deeper (Hakurei site in Izena Hole, Irabu, Hatoma and Dai-yon Yonaguni Knoll) populations. Genetic mismatch distributions were also analyzed to estimate the relative time of population expansion from a simulated sudden-expansion model (Schneider & Excoffier, 1999). This approach is based on the frequency distribution of the number of genetic differences between paired individuals in a population, which follow a unimodal distribution soon after demographic expansion (Rogers & Herpending, 1992). Goodness-of-fit of the mismatch distribution to the simulated sudden-expansion model was examined by χ2 test, and the number of generations since the population started expanding (t) was estimated from t = τ∕2u , where τ is an estimate obtained from the mismatch analysis and u is the total mutation rate per generation per gene (Schneider & Excoffier, 1999). In addition, Tajima’s D, which can be used as an indicator of historical population expansion events, was calculated.
Bayesian Coalescent Skyline Plots were reconstructed by the software BEAST 2.5.0 (Bouckaert et al., 2014). Number of Markoc chain Monte Carlo (MCMC) were changed from 107 to 108 after 106 to 107 burn-in processes. The results were visualized using Tracer v. 1.7.1 (Rambaut, Suchard & Drummond, 2013).
Results
The distribution and relative abundance of the five Provanna species inhabiting the surveyed areas were summarized in Fig. 2. Three species were only found in one locality: P. glabra in Off Hatsushimas seep site of Sagami Bay, P. lucida in Minami-Ensei Knoll, and P. kuroshimensis in Kuroshima Knoll (Table 2). Provanna subglabra was found in all vent sites except the Minami-Ensei Knoll and P. clathrata was found in three vent sites (Hakurei site of Izena Hole, Irabu Knoll, and Hatoma Knoll). Provanna subglabra was often the only species present and highly dominant when P. clathrata co-occurred (Fig. 2); the relative abundance of P. clathrata was highest in the Irabu Knoll, the deepest of all sites surveyed in the present study.
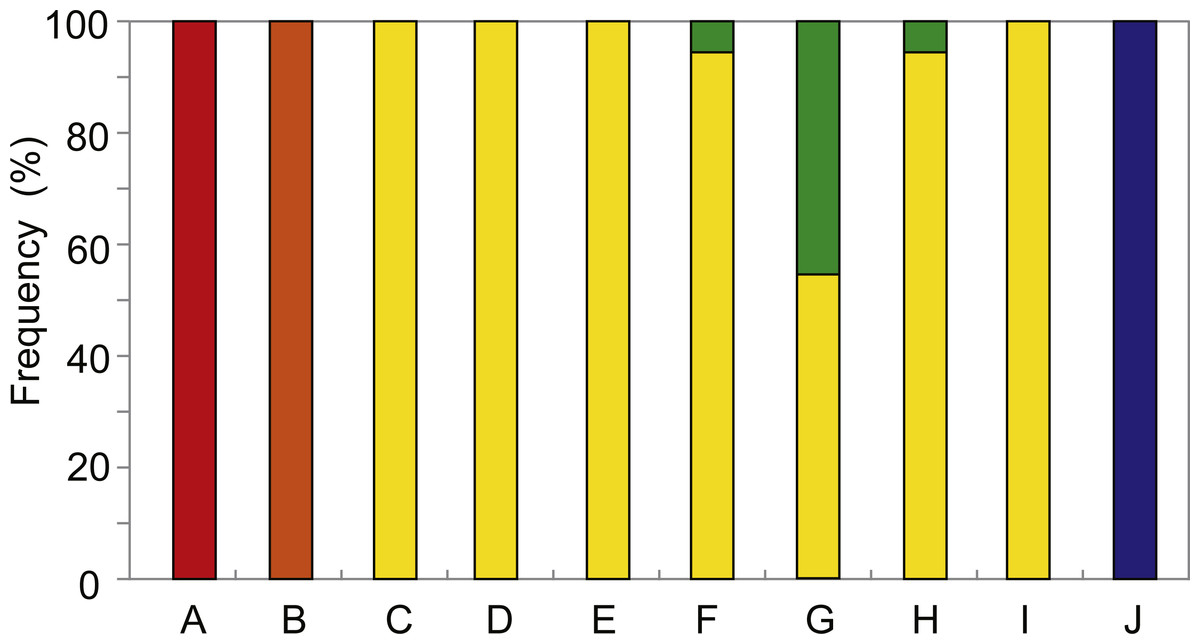
Figure 2: Distribution and local relative abundance of P. glabra (red), P. lucida (orange), P. subglabra (yellow), P. clathrata (green), and P. kuroshimensis (blue).
IDs in the capitalized letters corresponds to location codes in Table 1.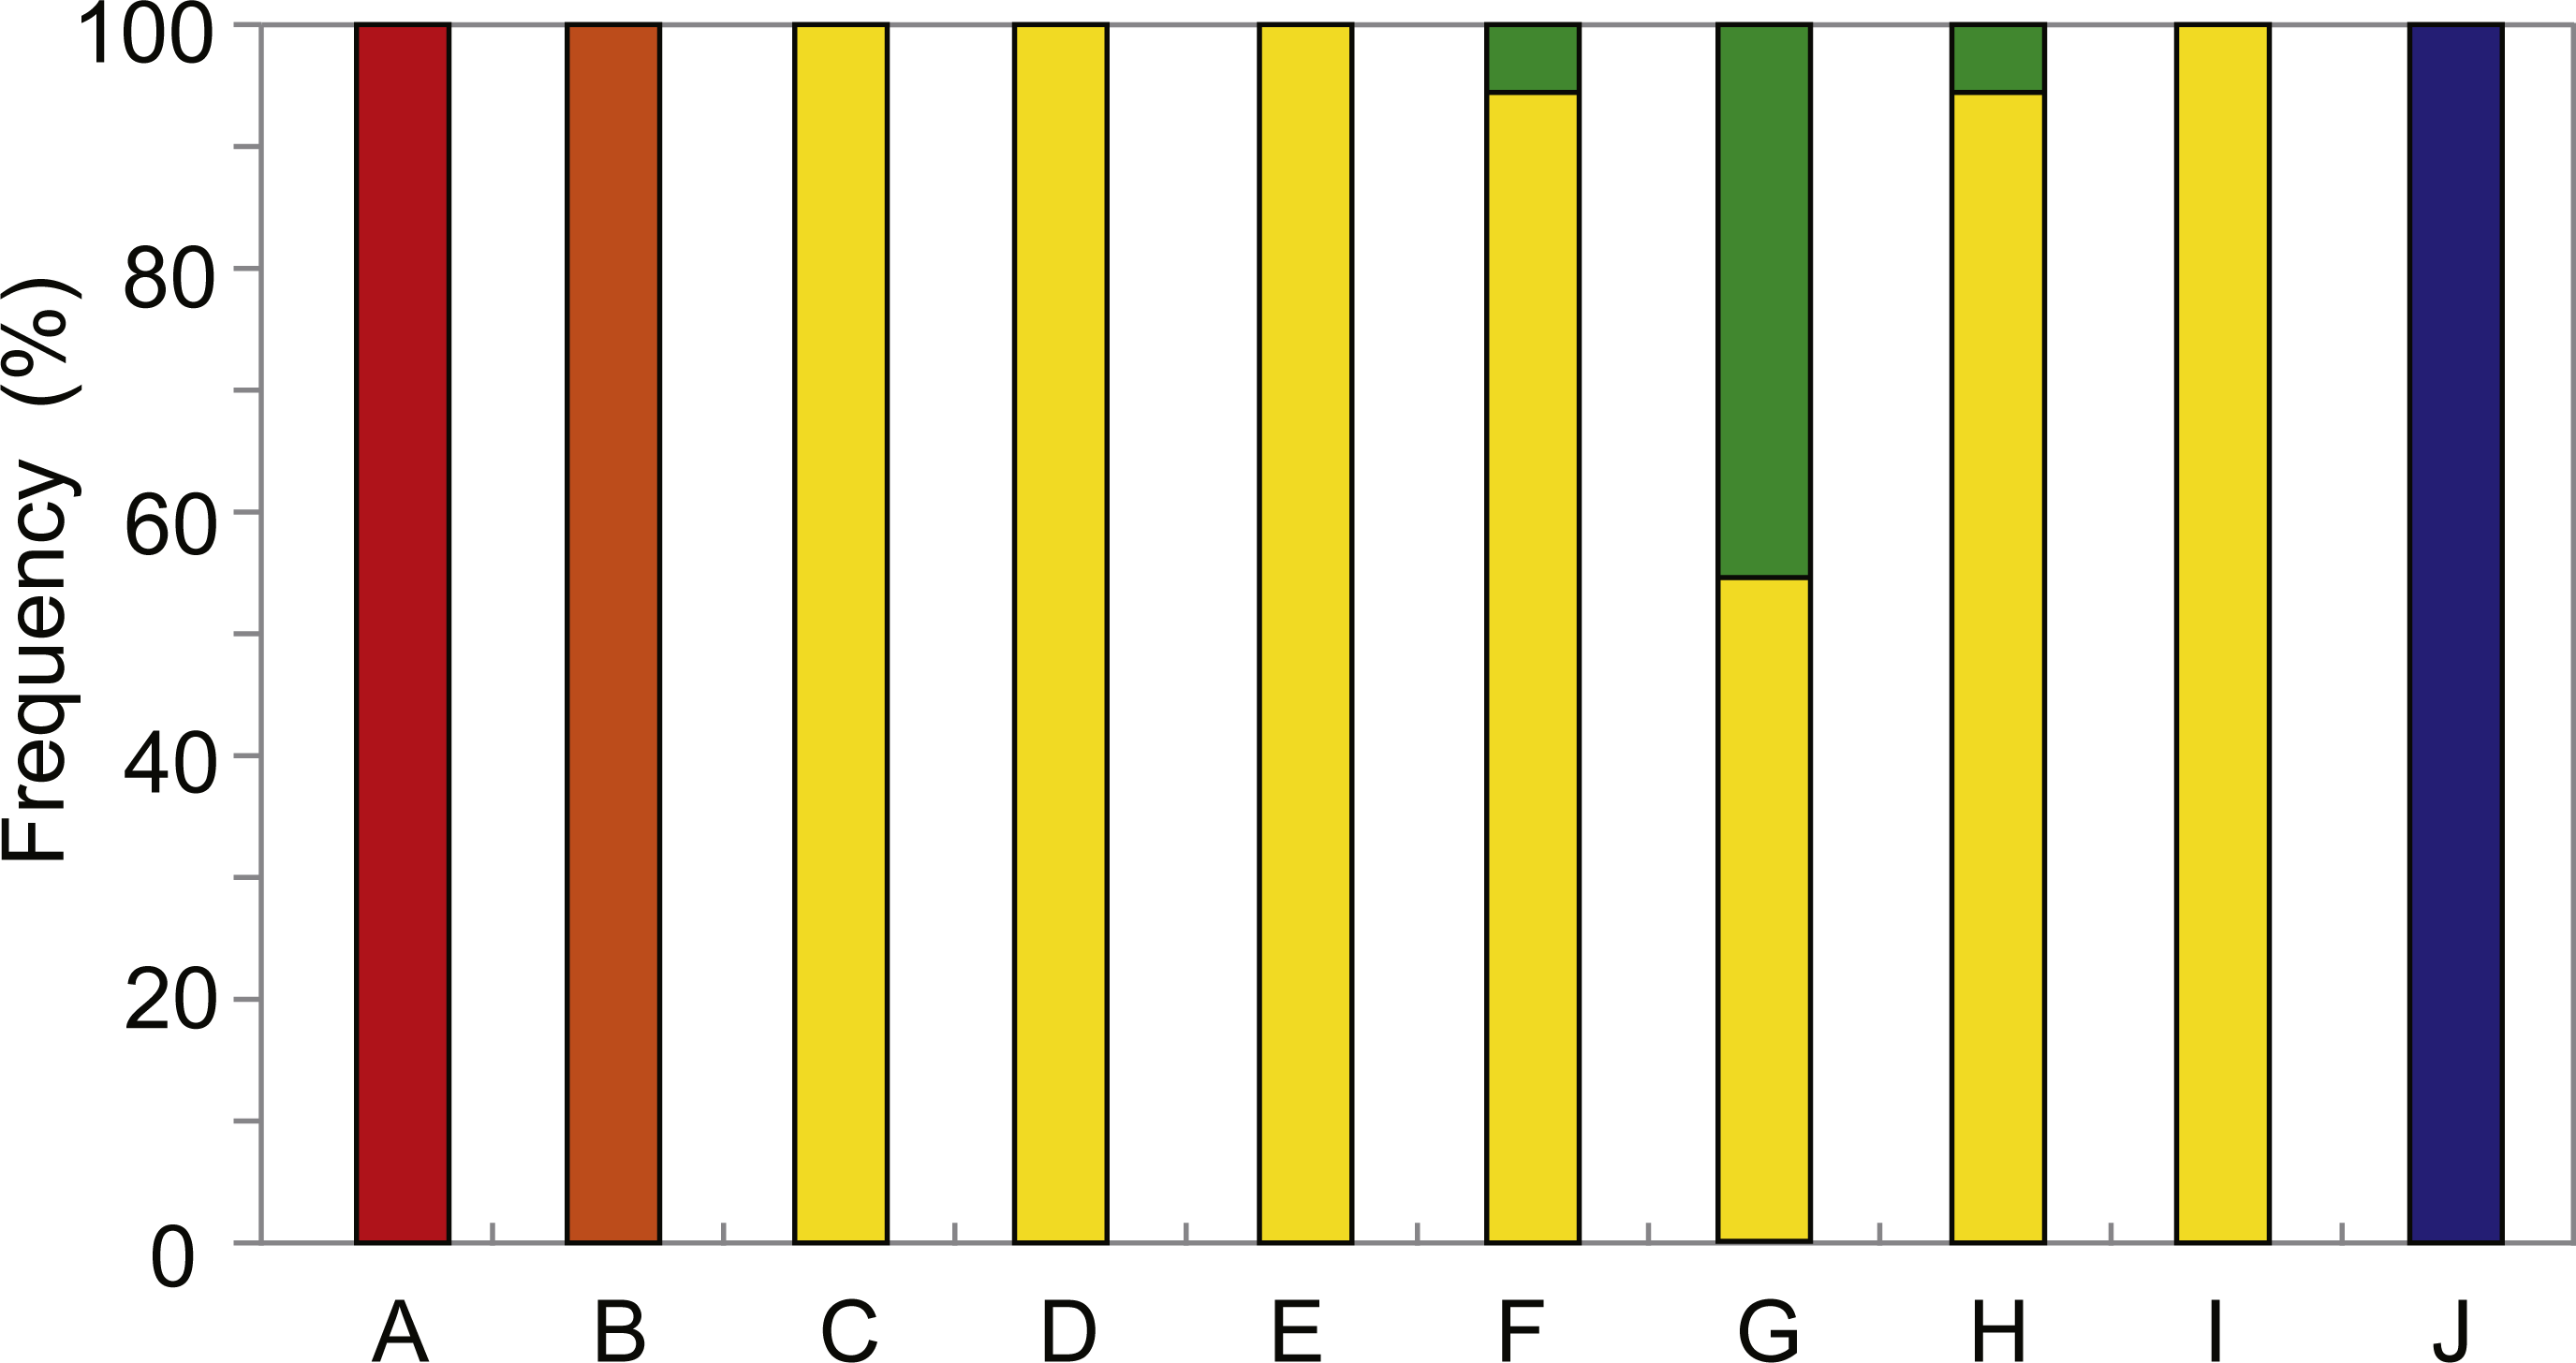
| ID | Population | N | Nh | Np | Ĥ | π | Tajima’s D |
|---|---|---|---|---|---|---|---|
| A | P. glabra (Sagami Bay) | 22 | 22 | 49 | 1.0000 ± 0.0137 | 0.006759 ± 0.003681 | −1.87288** |
| B | P. lucida (Minami-Ensei Knoll) | 20 | 7 | 18 | 0.8053 ± 0.0564 | 0.004194 ± 0.002415 | −0.51514 |
| P. subglabra | |||||||
| C | Iheya North | 20 | 19 | 56 | 0.9947 ± 0.0178 | 0.008499 ± 0.004568 | −1.78983* |
| D | Iheya Ridge | 16 | 16 | 47 | 1.0000 ± 0.0221 | 0.009295 ± 0.005036 | −1.35916 |
| E | Jade site, Izena Hole | 19 | 16 | 52 | 0.9852 ± 0.0223 | 0.008394 ± 0.004529 | −1.69953* |
| F | Hakurei site, Izena Hole | 17 | 16 | 57 | 0.9926 ± 0.0230 | 0.010619 ± 0.005682 | −1.46468 |
| G | Irabu Knoll | 21 | 20 | 53 | 0.9952 ± 0.0165 | 0.009180 ± 0.004894 | −1.41920 |
| I | Hatoma Knoll | 14 | 14 | 48 | 1.0000 ± 0.0270 | 0.008728 ± 0.004798 | −1.75860* |
| J | Dai-yon Yonaguni Knoll | 19 | 18 | 48 | 0.9942 ± 0.0193 | 0.008484 ± 0.004574 | −1.46415 |
| P. clathrata | |||||||
| F | Hakurei site, Izena Hole | 1 | 1 | ND | ND | ND | ND |
| H | Irabu Knoll | 17 | 15 | 37 | 0.9853 ± 0.0252 | 0.005980 ± 0.00343 | −1.76989* |
| I | Hatoma Knoll | 1 | 1 | ND | ND | ND | ND |
| K | P. kuroshimensis (Kuroshima Knoll) | 20 | 15 | 19 | 0.9579 ± 0.0328 | 0.004129 ± 0.002382 | −0.73793 |
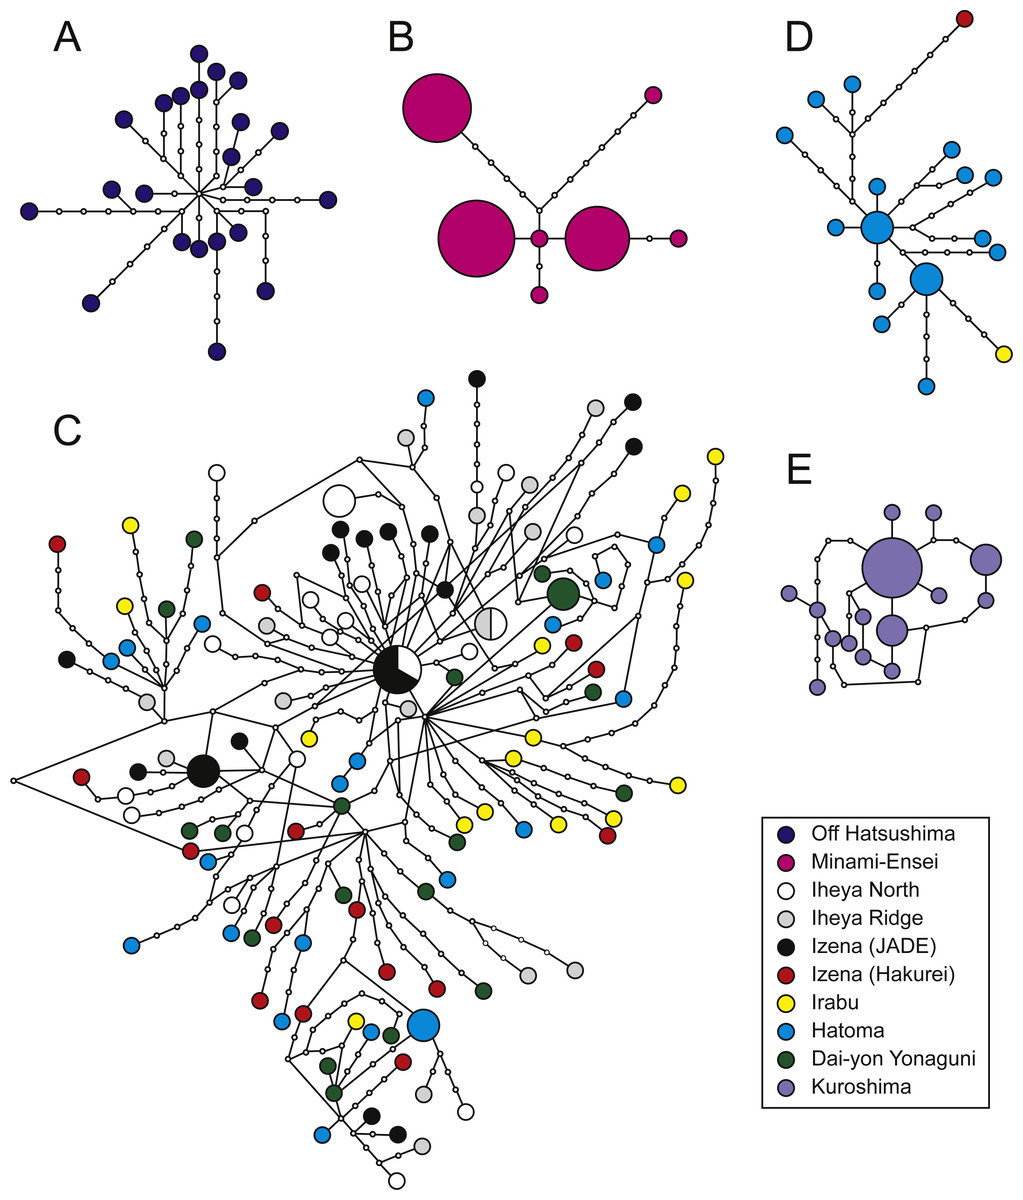
Figure 3: Haplotype networks.
P. glabra (A), P. lucida (B), P. subglabra (C), P. clathratas (D), and P. kuroshimensis (E).
Genetic diversities in local populations were higher in all populations of P. subglabra among the five species, as inferred from haplotype () and nucleotide (π) diversities (Table 2). Simple parsimonious haplotype networks consisting of a few dominant haplotypes were recovered in P. lucida and P. kuroshimensis, simple networks consisting of diversified haplotypes were recovered in P. glabra and P. clathrata, while a complicated haplotype network was recovered for P. subglabra (Fig. 3). Shared haplotypes were found between local populations of P. subglabra in Iheya North field and JADE site in Izena Hole as well as between Iheya North field and Iheya Ridge, but not in populations inhabiting Hakurei site, Hatoma, and Dai-yon Yonaguni Knolls (Fig. 3C). No statistically significant genetic differences were found among the local populations in P. subglabra from ΦST and Wright’s exact test (Table 3). The degree of genetic differentiation among local populations was examined only for P. subglabra, as that was the only species with sufficient individuals from more than one site (Fig. 2). Pairwise ΦST did not indicate clear genetic structures among local populations (Table 3), and homogeneity in the haplotype distribution was not rejected by Wright’s exact test (P > 0.05). However, the result of AMOVA, when assuming a depth subdivision of populations, was statistically significant (P < 0.05, among groups variation: 0.18, among populations within groups variation: 0.44, and within populations variation: 99.38), whereas the analyses assuming a latitudinal subdivision did not yield statsiticaly significant differences (P > 0.05, among groups variation: 0.08, among populations within groups variation: 0.49, and within populations variation: 99.43).
| C | D | E | F | G | I | J | |
|---|---|---|---|---|---|---|---|
| C | – | – | – | – | – | – | |
| D | −0.00046 | – | – | – | – | – | |
| E | 0.00616 | 0.00559 | – | – | – | – | |
| F | 0.00630 | 0.00369 | 0.01248 | – | – | – | |
| G | 0.00264 | 0.00242 | 0.01112 | 0.00604 | – | – | |
| I | 0.00269 | 0.00000 | 0.00895 | 0.00373 | 0.00244 | – | |
| J | 0.00555 | 0.00295 | 0.01170 | 0.00660 | 0.00530 | 0.00298 |
Notes:
P > 0.05 for all cells.
Tajima’s D was negative in value for all examined populations (Table 2). Among them, the lowest value was observed in P. glabra from the Off Hatsushima seep (−1.87288), and the highest value was observed in P. lucida from the Minami-Ensei Knoll vent field (−0.51514). The population of P. kuroshimensis from the Kuroshima Knoll exhibited a similar Tajima’s D value (−0.73793) to that of P. lucida, while those of P. subglabra and P. clathrata showed values similar (ranged from −1.78983 to −1.35916) to that of P. glabra. Values obtained for populations of P. glabra, P. subglabra and P. clathrata were statistically significant.
Mismatch distribution was not statistically significantly different from the expansion model distribution (P < 0.05 by χ2 test), which implies that population expansion occurred in the detectable past, except for a single populations of P. glabra from the Off Hatsushima site (Fig. 4). Tau (τ) value, an indicator for the relative age of population expansion among closely related taxa, was 7.031 for the P. glabra population from the Off Hatsushima seep in Sagami Bay, 8.257 for the P. lucida population from Minami-Ensei Knoll, 4.021 for the P. kuroshimensis population from Kuroshima Knoll, 5.229 for the P. clathrata population from Irabu Knoll, and ranged between 6.980 (Iheya Ridge) and 10.867 (Hakurei site, Izena Hole) for P. subglabra (Fig. 4). The mismatch distribution of P. lucida in Miami-Ensei Knoll visually exhibited two prominent peaks, but the distribution was not statistically different from the model distribution.

Figure 4: Mismatch distributions of local populations of Provanna gastropods, with number of mismatches plotted on horizontal axes and frequency plotted on vertical axes.
IDs in the capitalized letters are correlated with those in Table 1. (A) P. glabra from Off Hatsushima, (B) P. lucida from Minami-Ensei Knoll, (C) P. subglabra from Iheya North, (D) P. subglabra from Iheya Ridge, (E) P. subglabra from Jade site in Izena Hole, (F) P. subglabra from Hakurei site in Izena Hole, (G) P. subglabra from Irabu Knoll, (H) P. clathrata from Irabu Knoll, (I) P. subglabra from Hatoma Knoll, (J) P. subglabra from Dai-yon Yonaguni Knoll, (K) P. kuroshimensis from Kuroshima Knoll.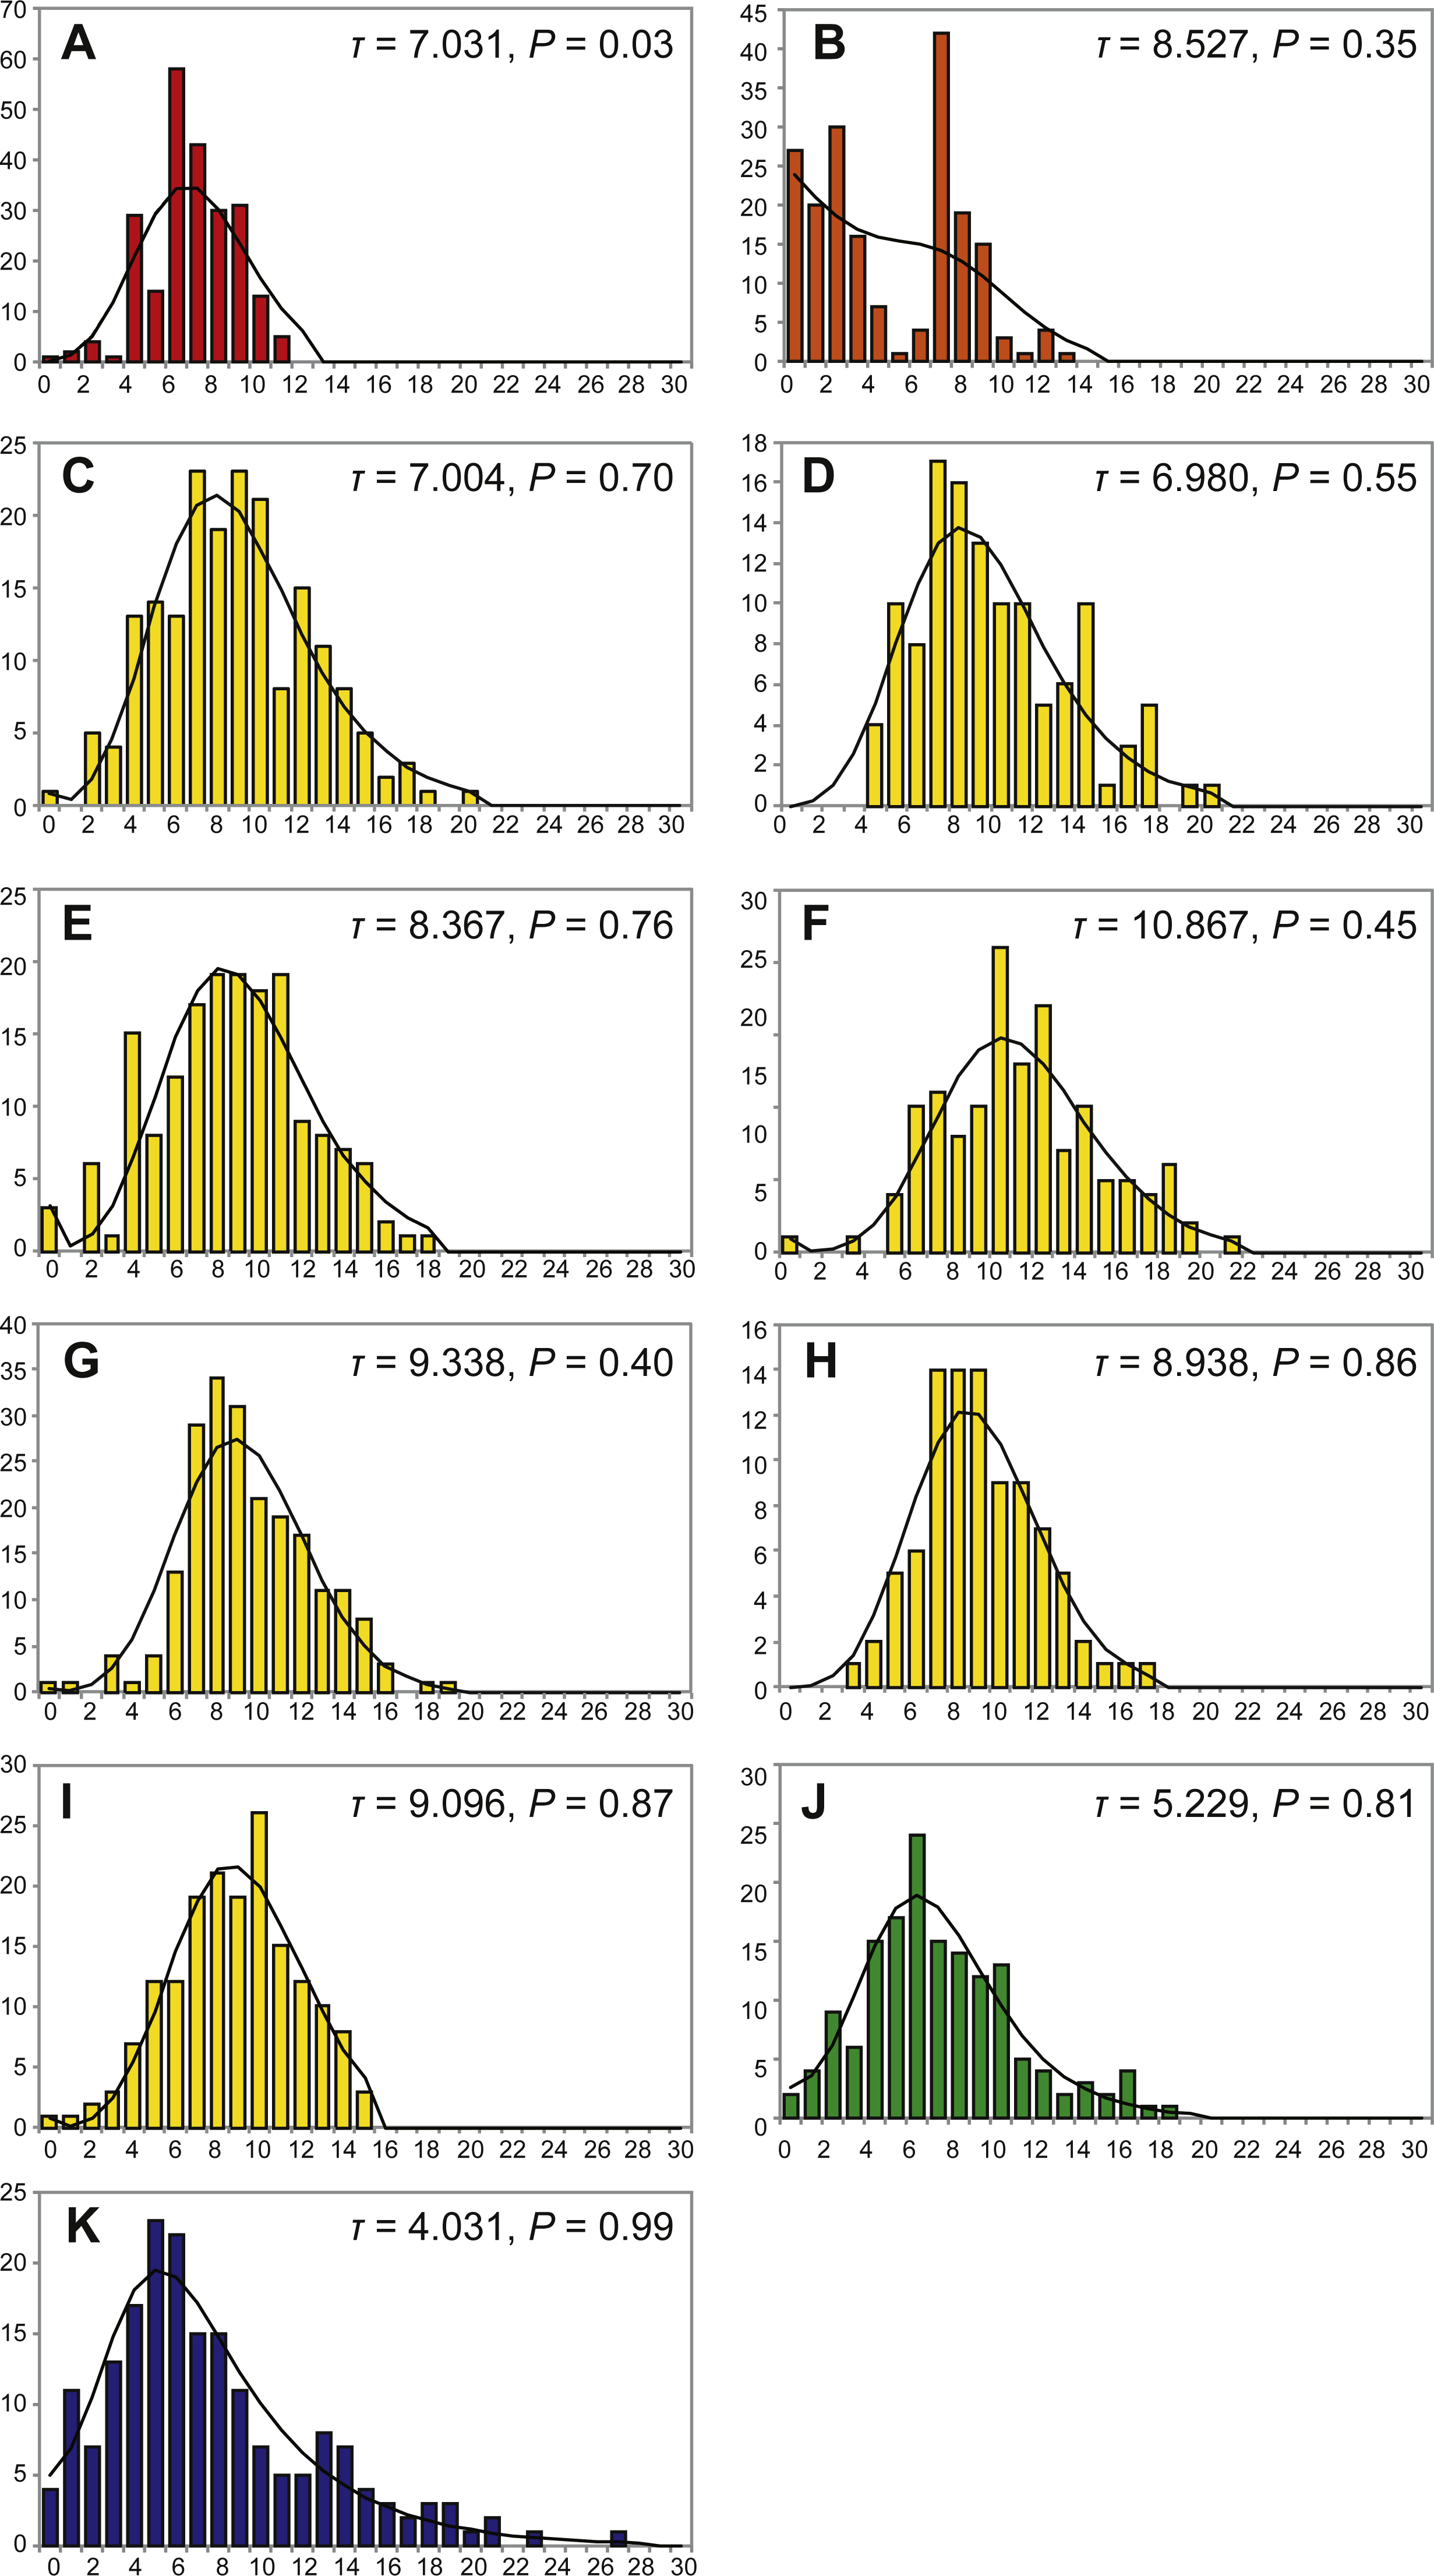
The time range of Bayesian coalescent skyline plot estimated for each species was different, due to the dfferences in the divergence of the sequence dataset available, i.e., the longest in P. subglabra with the highest divergence observed, compared to the other species (Fig. 5). Historical demographic increase was inferred for P. clathrata and P. subglabra, whereas relatively constant demographic histories were inferred for P. glabra, P. lucida, and P. kuroshimensis.
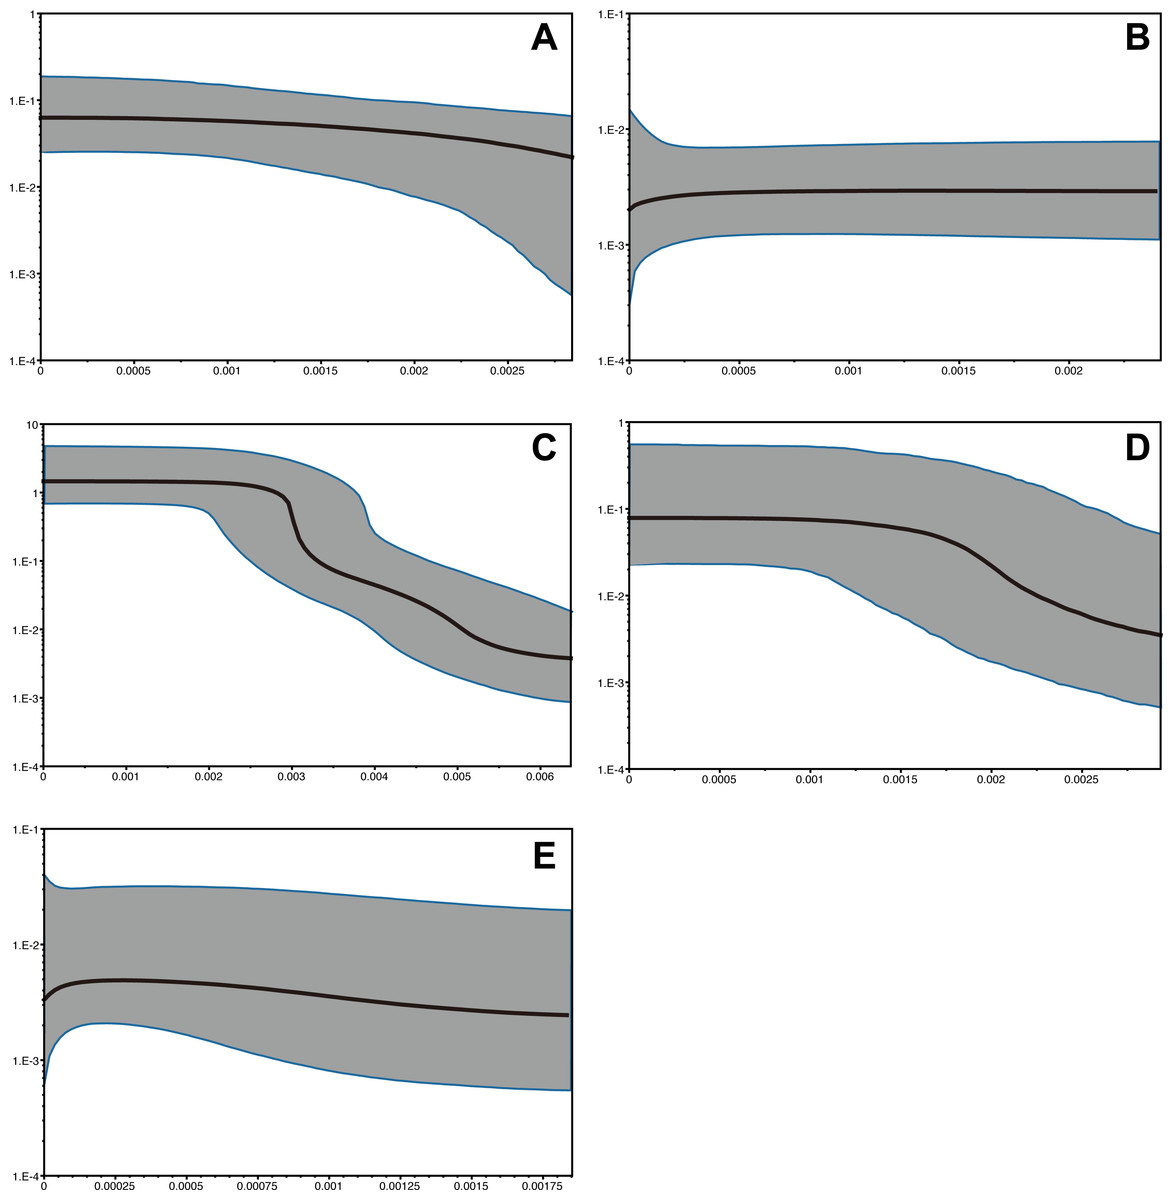
Figure 5: Bayesian skyline plots of Provanna gastropods, with time or mutations per sites plotted on the horizontal axis and generation-scaled effective population size on the vertical axis.
Black lines indicate median estimates, and shaded zones surrounded by blue lines indicate 95% highest posterior density limits. (A) P. glabra, (B) P. lucida, (C) P. subglabra, (D) P. clathrata, (E) P. kuroshimensis.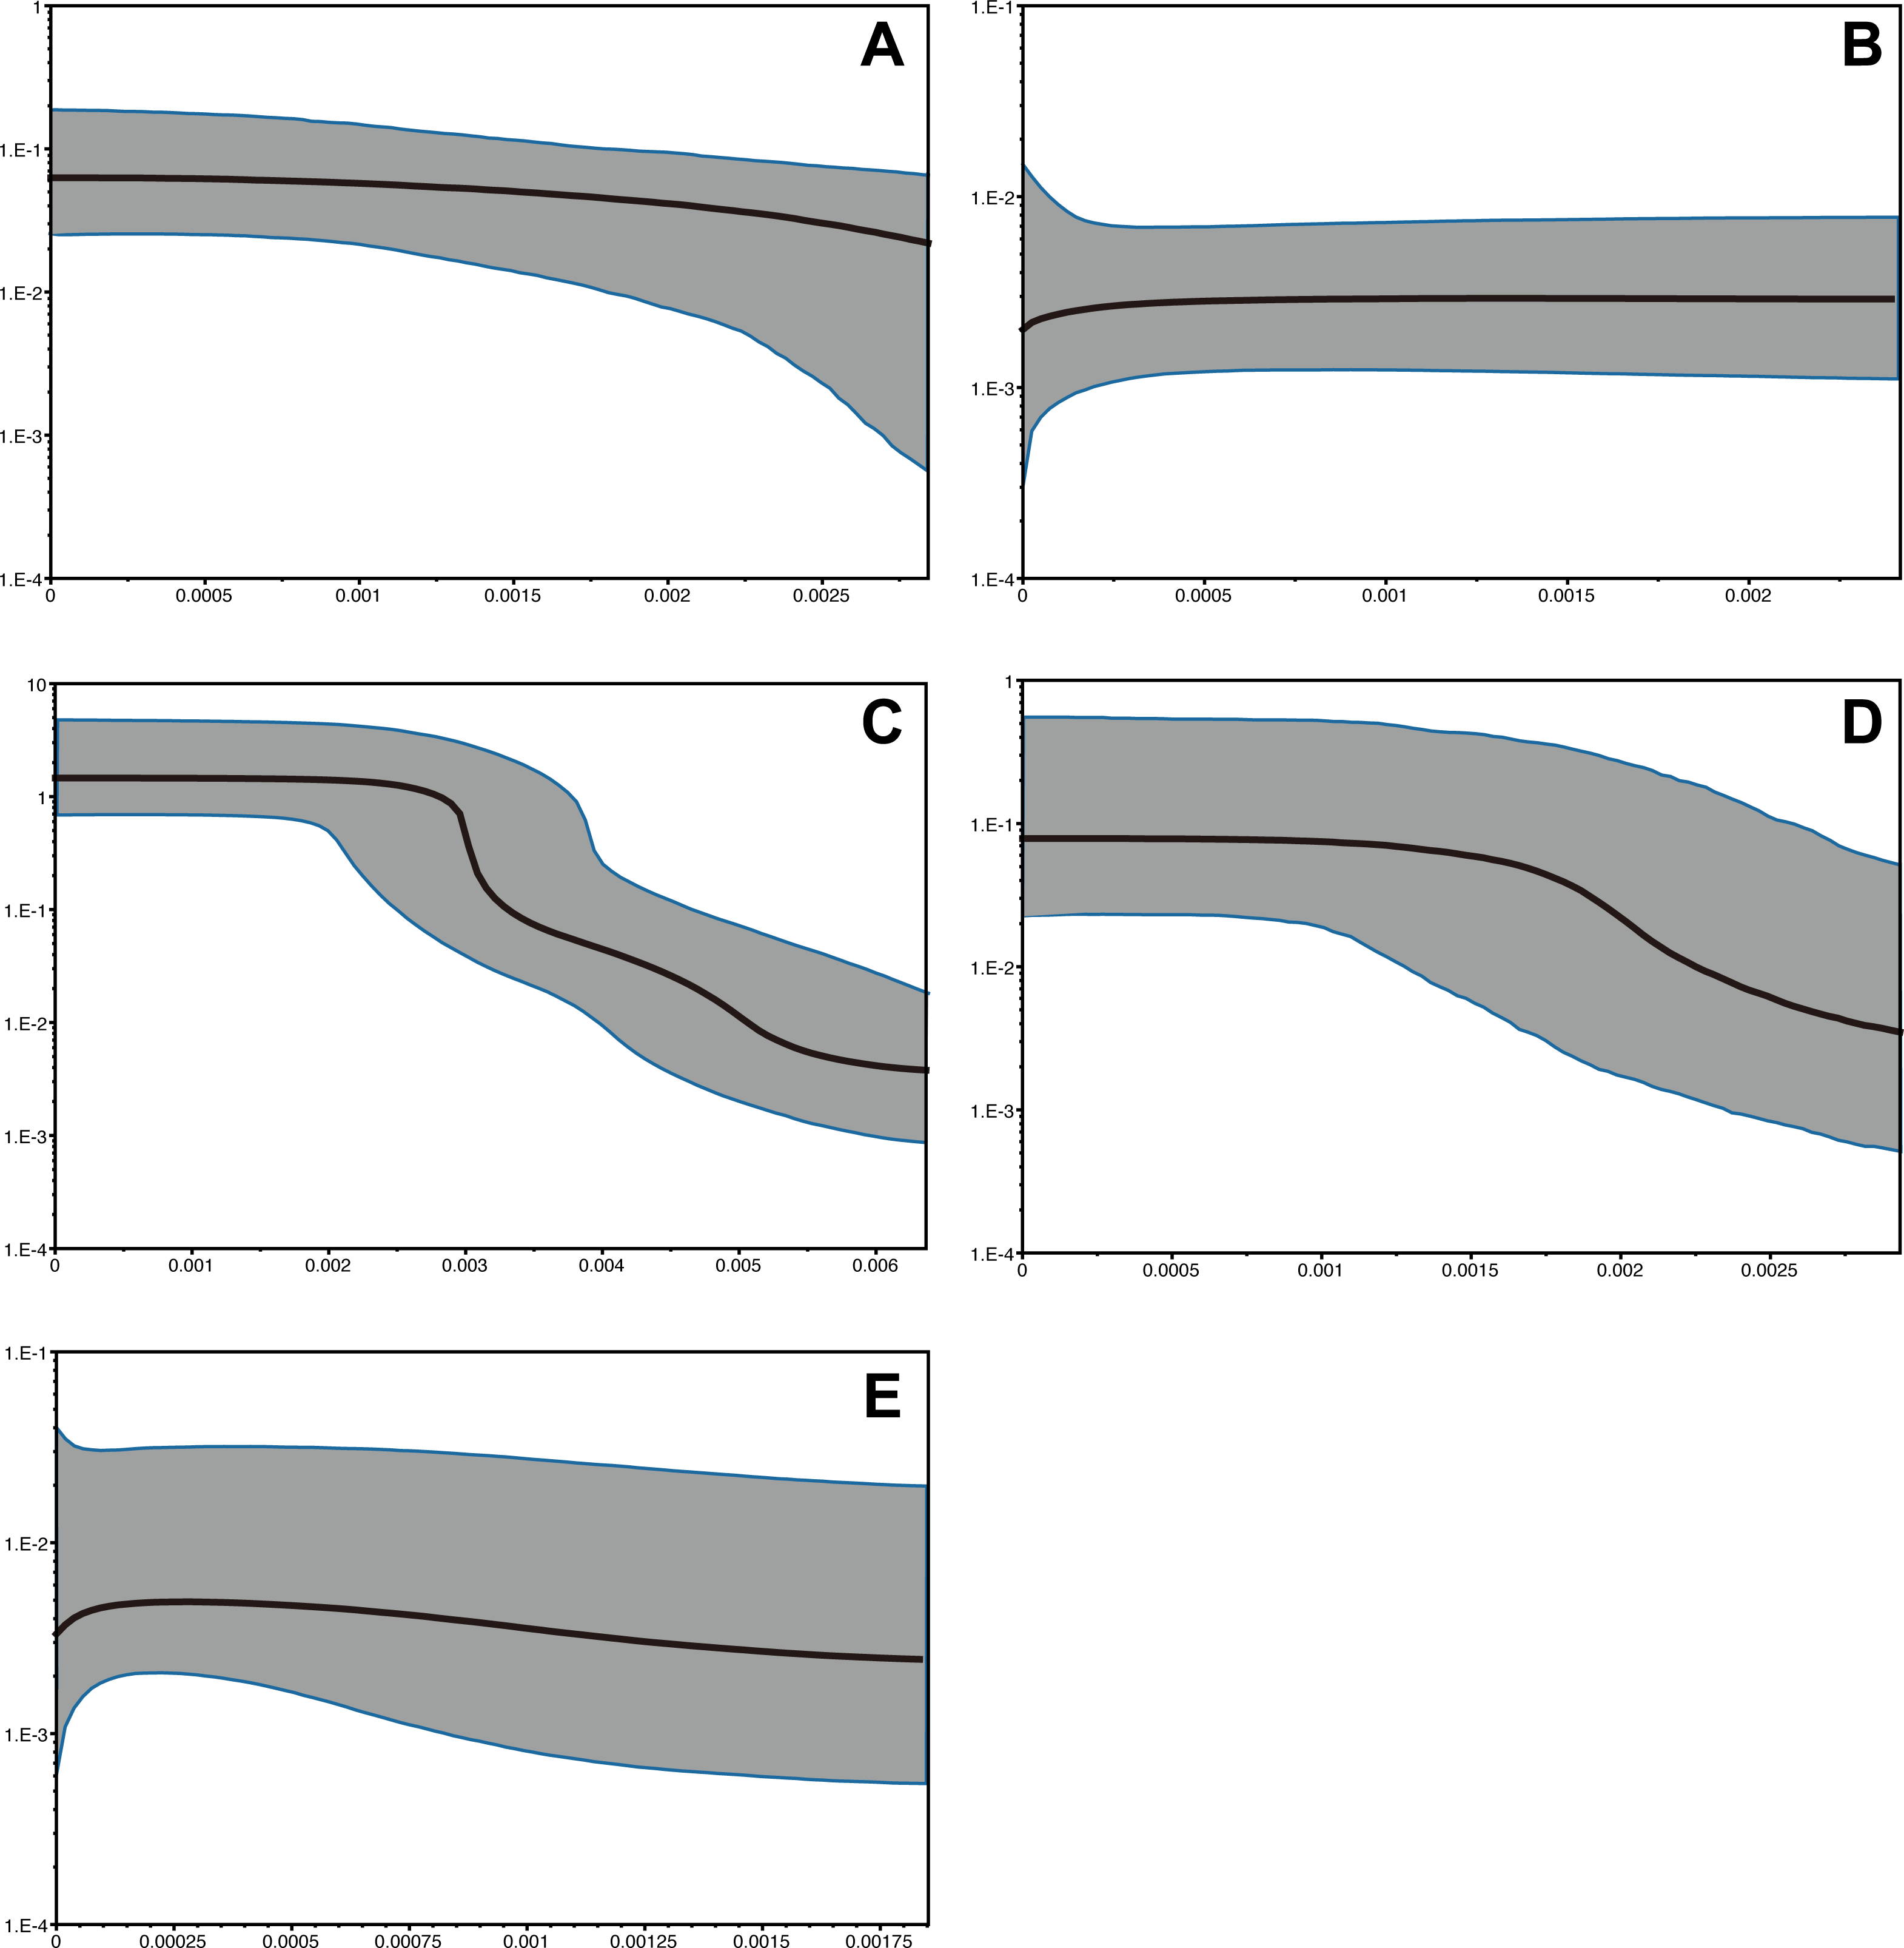
Discussion
Results from the present study elucidated the distribution and genetic diversity of five Provanna species inhabiting chemosynthetic environments in the western Pacific, and revealed the population history and genetic connectivity of their local populations. All five species were restricted to either vent or seep habitats, with three (P. glabra, P. lucida, P. kuroshimensis) currently only known from a single site, and the other two (P. subglabra and P. clathrata) being found in at least three hydrothermal vent fields in the Okinawa Trough (Fig. 2).
Interestingly, both nucleotide diversity (Table 2) and number of mismatches (Fig. 4) were higher in P. subglabra than in P. clathrata at the Irabu Knoll, suggesting that population is more diversified in P. subglabra than P. clathrata, under the same environment. Both species appear to have experienced sudden expansions of population in the detectable past, according to Tajima’s D and mismatch analyses. Furthermore, τ in mismatch distributions was higher in P. subglabra (τ = 8.938) than that in P. clathrata (τ = 5.229; Figs. 4G and 4H), indicating that the historical demographic increase began earlier in P. subglabra than in P. clathrata, as shown by the Bysian skyline plot (Fig. 5). One explanation for these results, assuming that the nucleotide substitution rate or life-history traits are comparable in both species, is that P. subglabra colonized the Okinawa Trough earlier than P. clathrata. This interpretation implies that the suitable habitat for P. subglabra was formed earlier than that for P. clathrata during the geological history of the Okinawa Trough. Provanna clathrata appears to have adapted to deeper depths and only occurs below 1400 m deep, whereas P. subglabra appears to occur throughout a wide depth range (Table 1; also see Miyazaki et al., 2017). This agrees with the fact that depth of the back-arc basin spreading centre increases with time, meaning the deeper sites suitable for P. clathrata came into existence later than the shallower sites suitable for P. subglabra. This interpretation therefore also highlights the significance of habitat formation during the invasion and colonization process of Provanna gastropods. Alternatively, since nucleotide substitution is correlated to the number of offspring produced in a generation and the number of reproductive opportunities per year (e.g., periodic vs. continuous reproduction), the nucleotide substitution rate may not be uniform among Provanna species, in which case we cannot exclude that the colonization time of the both species might be the same.
Of the five species surveyed, P. subglabra had by far the widest distribution range, being found in all currently examined hydrothermal vent fields in the Okinawa Trough except for the very shallow Minami-Ensei Knoll. At this point, no Provanna species have been observed in Yoron Hole, the shallowest hydrothermal field of the Okinawa Trough (550–600 m deep; Watanabe & Kojima, 2015). Notably, P. subglabra appears to be segregated into two regional populations, with the northern population inhabiting Iheya North, Iheya Ridge, and Jade site in Izena Hole, while the southern population inhabits Hakurei site in Izena Hole, Irabu Knoll, Hatoma Knoll, and Dai-Yon Yonaguni Knoll. This segregation can be seen in pairwise ΦST (Table 3) and parsimonious haplotype networks (Fig. 4), although not on the results of Wright’s exact tests.
Though this genetic structure of P. subglabra initially seems to be a northern-southern segregation, the two populations are separated within the Izena Hole vent field where Jade and Hakurei sites are within 3 km of each other in the single caldera (Kawagucci et al., 2010; Ishibashi et al., 2014). Genetic structure across such a close distance has not been observed in other hydrothermal vent animals in the Okinawa Trough examined to date (e.g., the gastropod Lepetodrilus nux (Nakamura et al., 2014), Neoverruca barnacles (Watanabe et al., 2005), alvinocaridid shrimps (Yahagi et al., 2015). Typically, these genetic segregations are seen in larger scales in other Pacific chemosynthetic ecosystems, such as inter-current microplates, fracture zones, and topological depressions in the eastern Pacific (Won et al., 2003; Hurtado, Lutz & Vrijenhoek, 2004; Johnson et al., 2006; Plouviez et al., 2009; Vrijenhoek, 2010), or between backarc basins in the western Pacific ( Kojima et al., 2000; Kojima et al., 2001; Watanabe et al., 2005). Therefore, the segregation of P. subglabra on either side of the Izena Hole is unlikely to be caused by distance. There was also no significant differences between northern and southern populations of P. subglabra when compared using AMOVA.
Instead, genetic segregation seen in P. subglabra is likely caused by environmental differences, particularly depth. This is supported by a significant difference in the AMOVA analysis between shallower and deeper populations. There is a clear gap in water depth between Jade (1,309 m) and Hakurei (1,617 m) sites in the Izena Hole. Furthermore, the distribution of Okinawa Trough Provanna species seems to be separated by depth, with P. lucida in the shallowest Minami-Ensei Knoll, P. subglabra in intermediate depths, and P. clathrata with the deepest central bathymetric range. Though chemistry of hydrothermal fluids, such as concentration of gases, cannot be excluded entirely as a possibility, this is unlikely to be the key environmental difference causing the segregation in P. subglabra. In the Okinawa Trough, subseafloor phase separation leads to intra-field diversity of mineralization which can cause drastic differences in hydrothermal fluid chemistry in different sites (Ishibashi et al., 2015). However, in Izena Hole, the geochemistry of high-temperature vent fluids is generally similar between Jade and Hakurei sites, except for the concentration of minor gases including hydrogen (Ishibashi et al., 2014). This difference in hydrogen, however, is caused by whether the rising geofluid passes through a sediment layer or not, and not related to depth or latitude (Ishibashi et al., 2014; Kawagucci, 2015).
Genetic diversity and mismatch distribution were relatively low for P. lucida from Minami-Ensei Knoll and P. kuroshimensis from Kuroshima Knoll, and statistical analyses did not indicate recent population expansion, with Tajima’s D being statistically insignificant for both species, and constant demographic states shown by Bayesian skyline plots. These results together suggest that these populations are fragmented or consist of relatively small populations compared to those observed in the other species. The distribution of these two species is restricted to depths shallower than 1,000 m, shallower than the other Provanna species examined. Planktonic larval duration, which is important in mediating metapopulation, is not known for Provanna gastropods but has been shown for 69 marine organisms to have a trade-off relationship with temperature with the mean dispersal distance increasing from 20 to 225 km as the temperature drops from 30 to 5 °C (O’Connor et al., 2007). Therefore, species in shallower waters tend to have shorter planktonic larval durations, and thus shorter dispersal distances, especially in patchy habitats like hydrothermal vent fields and hydrocarbon seep sites. On the other hand, the population of P. glabra in the Off Hatsushima seep site exhibited comparable genetic diversities to those in P. subglabra, with a clear population expansion in the past (Tajima’s D in Table 2 and mismatch distribution in Fig. 4A).
Bayesian skyline plots (Fig. 5) inferred differences in demographic history between the comparatively deeper-occuring species (P. clathrata and P. subglabra with historical demographic increase) and shallower-occuring species (P. glabra, P. lucida, and P. kuroshimensis with constant demographic histories). There was no clear pattern that matched habitat types (i.e., seep vs. vent), further implying that depth is a key factor in shaping the past population dynamics of Provanna species instead of habitat types (i.e., vents vs. seeps).
The phylogenetic analysis of Provanna based on partial DNA sequences of COI, 16SrRNA, and 28SrRNA showed that P. glabra could not be separated from P. laevis in Monterey Bay (Sasaki et al., 2016). This suggests that the population of P. glabra in the Off Hatsushima site in fact is part of a large and complex metapopulation across the Pacific Ocean (P. laevis in Monterey Bay being the other end), with comparable genetic diversity to P. subglabra. More detailed morphological and genetic analyses, particularly samples from intervening populations, are required to solve this problem.
Conclusion
Genetic analyses of partial mitochondrial COI sequences revealed differences in the historical timing of colonization among Provanna species inhabiting vents and seeps in the northwestern Pacific. Our results indicate that depth is likely the key factor in initial colonization, niche separation, distribution determination, and speciation for these gastropods. Additional characterization of life-history traits (such as dispersal depth and larval duration; see Yahagi et al., 2017) is, however, required for confirming our hypotheses and further advance our understanding of how biodiversity is generated in deep chemosynthetic ecosystems.