
TNFRSF10C methylation is a new epigenetic biomarker for colorectal cancer
- Published
- Accepted
- Received
- Academic Editor
- Yegor Vassetzky
- Subject Areas
- Biochemistry, Genetics, Molecular Biology, Gastroenterology and Hepatology, Oncology
- Keywords
- Colorectal cancer, Promoter, DNA methylation, TNFRSF10C
- Copyright
- © 2018 Zhou et al.
- Licence
- This is an open access article distributed under the terms of the Creative Commons Attribution License, which permits unrestricted use, distribution, reproduction and adaptation in any medium and for any purpose provided that it is properly attributed. For attribution, the original author(s), title, publication source (PeerJ) and either DOI or URL of the article must be cited.
- Cite this article
- 2018. TNFRSF10C methylation is a new epigenetic biomarker for colorectal cancer. PeerJ 6:e5336 https://doi.org/10.7717/peerj.5336
Abstract
Background
Abnormal methylation of TNFRSF10C was found to be associated with different types of cancers, excluding colorectal cancer (CRC). In this paper, the performance of TNFRSF10C methylation in CRC was studied in two stages.
Method
The discovery stage was involved with 38 pairs of CRC tumor and paired adjacent non-tumor tissues, and 69 pairs of CRC tumor and paired adjacent non-tumor tissues were used for the validation stage. Quantitative methylation specific PCR (qMSP) method and percentage of methylated reference (PMR) were used to test and represent the methylation level of TNFRSF10C, respectively. A dual-luciferase reporter gene experiment was conducted to evaluate the promoter activity of TNFRSF10C fragment.
Results
A significant association of TNFRSF10C promoter hypermethylation with CRC was found and validated (discovery stage: 24.67 ± 7.52 vs. 3.36 ± 0.89; P = 0.003; validation stage: 31.21 ± 12.48 vs. 4.52 ± 1.47; P = 0.0005). Subsequent analyses of TCGA data among 46 pairs of CRC samples further confirmed our findings (cg23965061: P = 4E − 6; cg14015044: P = 1E − 7). Dual-luciferase reporter gene assay revealed that TNFRSF10C fragment was able to significantly promote gene expression (Fold change = 2.375, P = 0.013). Our data confirmed that TNFRSF10C promoter hypermethylation can predict shorter overall survival of CRC patients (P = 0.032). Additionally, bioinformatics analyses indicated that TNFRSF10C hypermethylation was significantly associated with lower TNFRSF10C expression.
Conclusion
Our work suggested that TNFRSF10C hypermethylation was significantly associated with the risk of CRC.
Introduction
Colorectal cancer (CRC) is the third most common cancer and the fourth most universal cause of cancer-related death around the world (Ferlay et al., 2015). CRC has an annual incidence of 1.2 million new cases and 600,000 deaths (Chen et al., 2014). Though advanced screening and diagnostic technologies have developed continuously (Buturovic, 2014; Kim et al., 2008; Wang et al., 2014), the outcomes for CRC patients remain poor, and their average survival time is less than 30 months (Scartozzi et al., 2014).
Genetic and epigenetic studies are hot topics for CRC research (Fukushige & Horii, 2013; Okugawa, Grady & Goel, 2015). CRC was found to be relevant to aberrant expression of microRNAs (Mohammadi, Mansoori & Baradaran, 2016), altered histone modifications (Gargalionis et al., 2012), and disrupted regulation of inflammation (Janakiram & Rao, 2014). DNA methylation is one of the important epigenetic modification mechanisms (Dawson & Kouzarides, 2012), and it has been verified to be associated with CRC (Capuano et al., 2015).
Tumor necrosis factor receptor superfamily member 10c (TNFRSF10C) is located on 8p21.3 (23.01∼23.03 Mb), which is one of the most frequently deleted loci in CRC (Chughtai et al., 1999). TNFRSF10C functions as one of the TNF-related apoptosis inducing ligand-like (TRAIL) decoy receptors that could inhibit the intracellular signaling pathway of apoptosis (Cheng et al., 2009; Van Noesel et al., 2002). Additionally, TNFRSF10C expression was often found to be down-regulated in CRC (Macartney-Coxson et al., 2008), and a decreased TNFRSF10C copy number was shown to accelerate CRC distant metastasis (Tanenbaum et al., 2016). TNFRSF10C hypermethylation was found in mutiple cancers, including glioblastomas (Vaitkiene et al., 2013), breast cancer (Tserga et al., 2012), basal cell carcinomas (Stamatelli et al., 2014), melanoma (Venza et al., 2013), gastric cancer (Dauksa et al., 2014), hepatocellular carcinoma (Shin et al., 2010), pancreatic adenocarcinoma (Dauksa et al., 2012), ovarian neoplasia (Braga Lda et al., 2012), cervical cancer (Narayan et al., 2016), pheochromocytoma (Margetts et al., 2005), cholangiocarcinoma (Amornpisutt, Sriraksa & Limpaiboon, 2012), choroid plexus papilloma (Michalowski et al., 2006), and prostate carcinoma (Hornstein et al., 2008). Meanwhile, accumulating studies showed that TNFRSF10C hypermethylation might play an important role in tumorigenesis and tumor progression (Shivapurkar et al., 2004).
However, there was no literature about whether TNFRSF10C hypermethylation was associated with CRC. In light of previous findings, we carried out a two-stage study in order to investigate the performance of TNFRSF10C hypermethylation in CRC.
Material and Methods
Samples collection and ethics statement
Frozen tumor tissues and paired adjacent non-tumor tissues (5 cm away from the tumor) were collected from 38 CRC patients from the Third Affiliated Hospital of Nanjing University of Traditional Chinese Medicine (Jiangsu province, China) in the discovery stage. Frozen tumor tissues and paired adjacent non-tumor tissues (5 cm away from the tumor) of 69 CRC patients were collected from Zhejiang Tumor Hospital (Zhejiang province, China) and Shaoxing First People’s Hospital (Zhejiang province, China) for the verification. The corresponding clinical information was obtained at the time of surgery. All patients were diagnosed by pathological examination. No radiotherapy or chemotherapy was performed before surgery. We also used slides stained with hematoxylin and eosin (H & E) to identify representative areas of invasive tumors (Fig. 1). Over 80% of tumor cells were found in CRC specimens, and there were no tumor cells in the 5 cm adjacent non-tumor specimens. In fact, the majority of CRC tumors are adenocarcinoma (96%), and other histological types are rare, including signet ring cell carcinoma, squamous cell carcinoma, undifferentiated tumor and myeloid adenocarcinoma (Ponz de Leon & Di Gregorio, 2001). It is noteworthy that all CRC tumors in this study were adenocarcinomas. All the patients in the present study had signed informed consent, and this study was approved by the ethics committees of the above hospitals and Ningbo University.
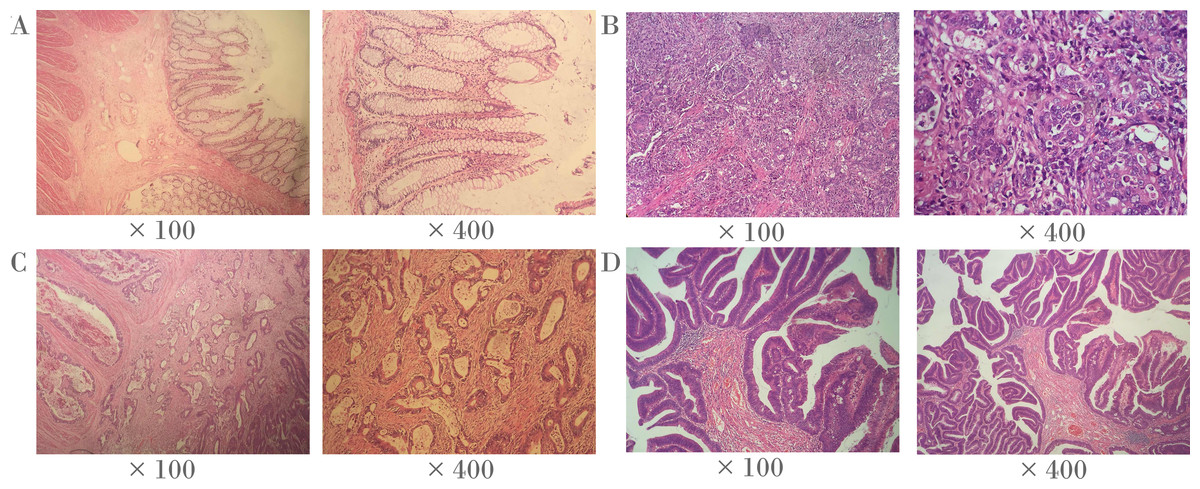
Figure 1: Representative histopathological photographs.
(A) Normal colorectal tissues. (B) Poorly-differentiated CRC tissues. (C) Moderately-differentiated CRC tissues. (D) Well-differentiated CRC tissues.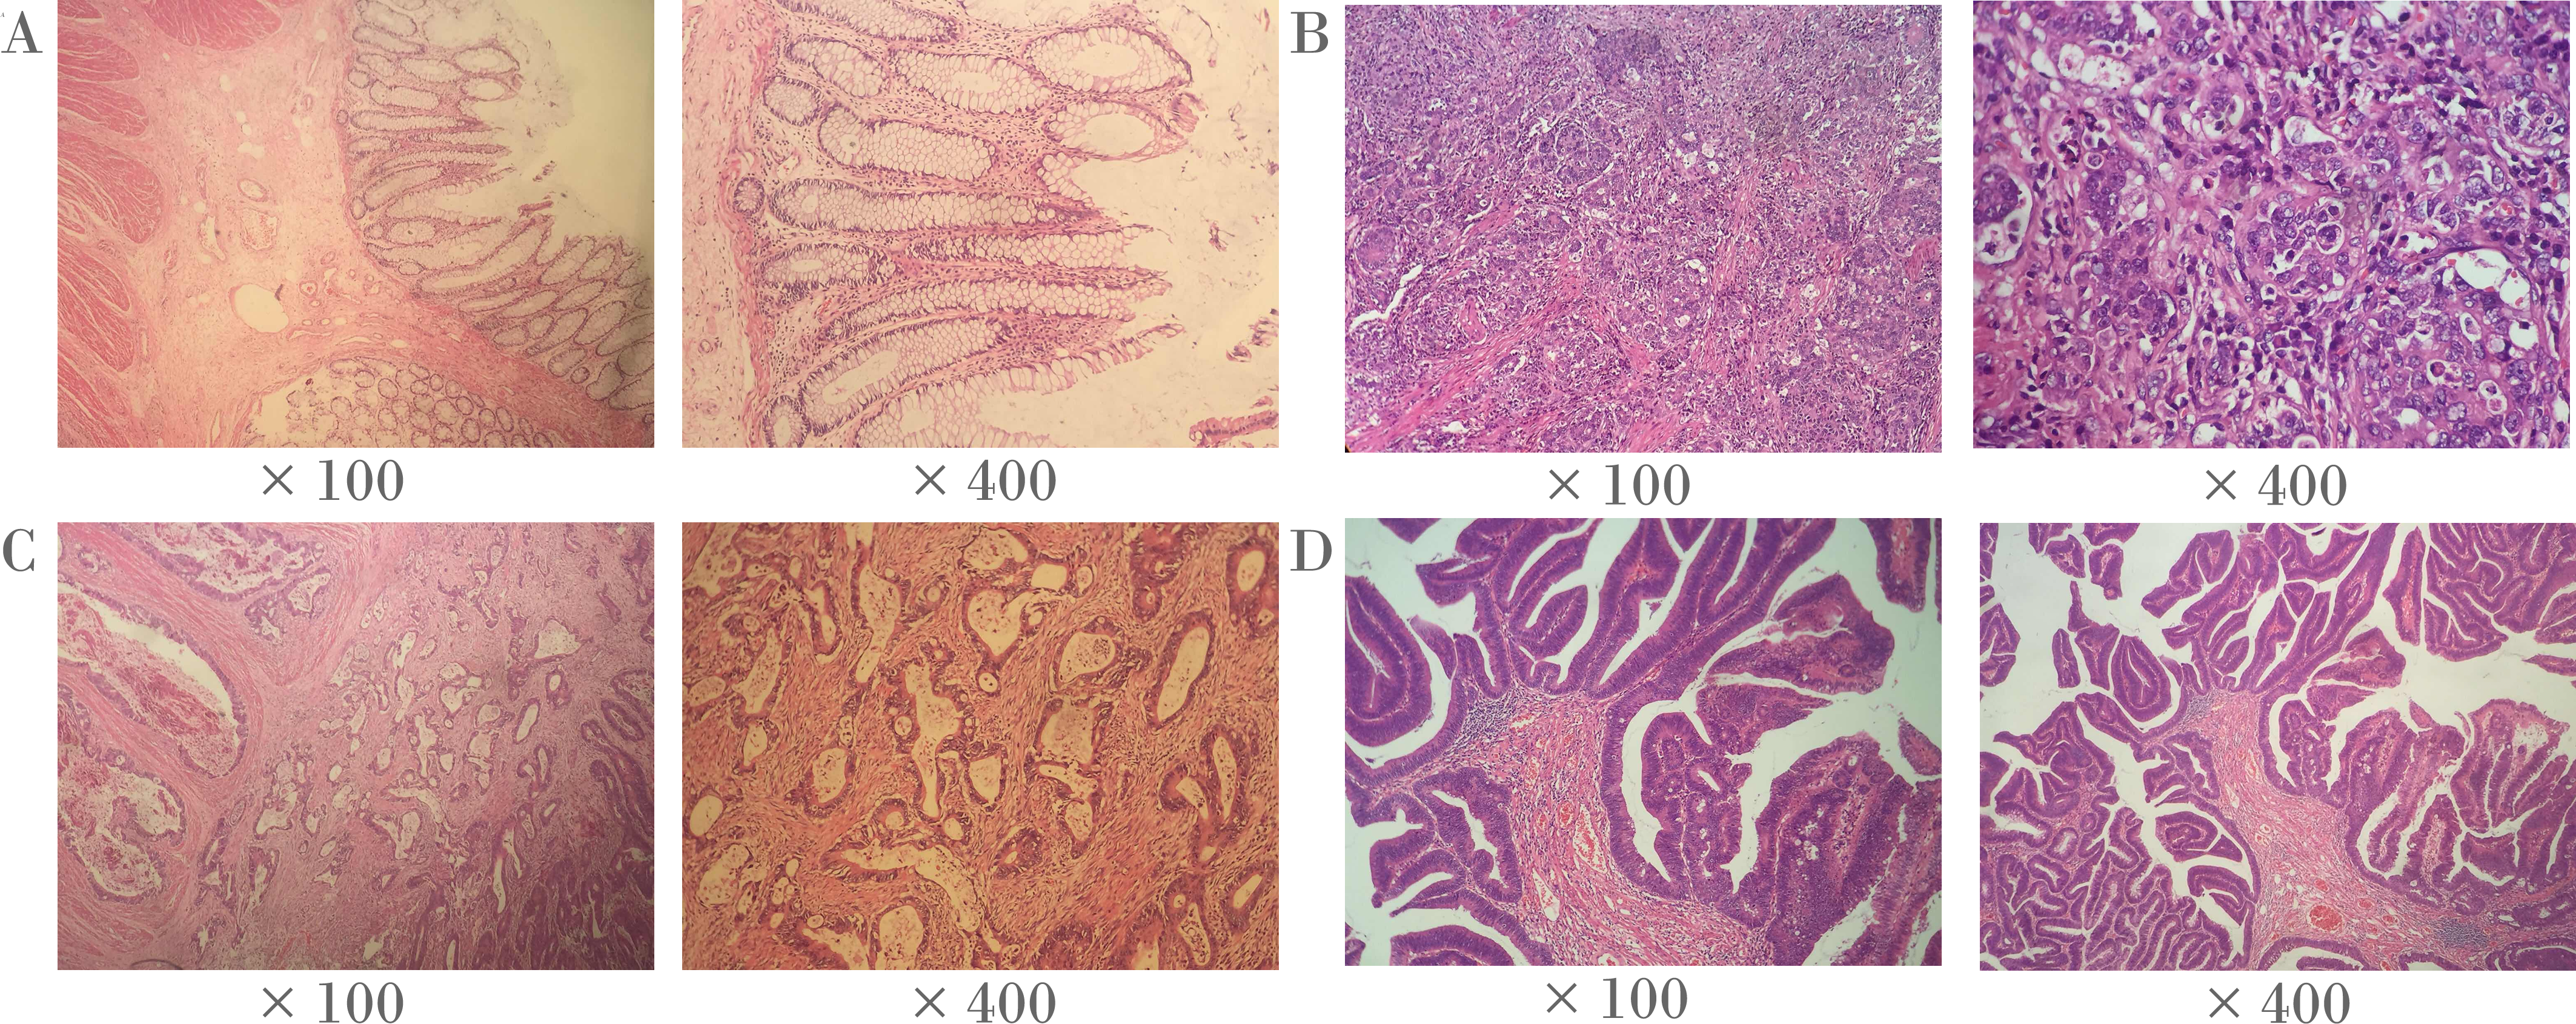
DNA extraction and bisulphite conversion
We strictly followed the instructions of the EZNATM Tissue DNA Kit (Omega Bio-Tek, Norcross, GA, USA) to extract the DNA from the tissue samples, and determined the DNA concentration using a Nanodrop 2000 spectrophotometer (Thermal Scientific Co. Ltd., Wilmington, MA, USA). The DNA solution was stored at −20 °C refrigerator for use. Genomic DNA was bisulphite converted using the EZ DNA Methylation-Gold Kit™ (Zymo Research, Orange, CA, USA). Generally, 500 ng of the original DNA was denatured by NaOH and the bisulphite was used to convert the unmethylated cytosine to uracil, while the methylated cytosine remains unchanged.
Quantitative methylation specific PCR (qMSP)
Methylation-specific PCR (MSP) is a classic method to detect gene methylation, but it is error-prone as PCR product needs to be removed from tubes for further analysis, which tends to contaminate the work environment (Switzeny et al., 2016). Quantitative methylation specific PCR (qMSP) in the current study is a closed-tube technique which is one of the novel methylation quantitative methods.
In this study, a SYBR-GREEN based qMSP method was used to determine the gene methylation level of the sample. It has advantages such as rapidity, simplicity, low cost, and accurate quantification. ACTB was used as an internal reference. Normal human sperm DNA treated with SssI methyltransferase (Thermo Fisher Scientiific, Uppsala, Sweden) was used as a positive control, and enzyme-free water was used as a blank control. The qMSP assay uses bisulphite-modified DNA as a template to create a 20 µl qMSP system consisting of 10 µl of SYBR Green I Master mix (Roche, Basel, Switzerland), 0.5 µl of each of the upstream and downstream primers, and 1.0 µl of the DNA template, and the rest volumn was filed by ddH2O. The upstream qMSP primer of TNFRSF10C was 5′-AGGTGCGACCCAGCCCAG-3′, the downstream qMSP primer of TNFRSF10C was 5′-CGATAACGACGAACTT-3′, the upstream qMSP primer of ACTB was 5′-TGGTGATGGAGGAGGTTTAGTAAGT-3′, the downstream qMSP primer of ACTB was 5′-AACCAATAAAACCTACTCCTCCCTTAA-3′. The PMR (percentage of methylated reference) in each sample was calculated by 2−ΔΔCt quantification approach (Kristensen et al., 2008). Specifically, the PMR of TNFRSF10C was calculated by this equation [PMR =2−ΔΔCt ×100%, ΔΔCt = sample DNA (CtTNFRSF10C–CtACTB) − fully methylated DNA (CtTNFRSF10C–CtACTB)].
Sanger sequencing and capillary electrophoresis of qMSP product
We randomly selected sodium bisulphite-modified DNA for Sanger sequencing. If compared with the original sequence, the uracil converted by bisulphite modification is completely converted to thymine, and the methylated cytosine remains unchanged, then the transformation process is verified thoroughly. In addition, the qMSP product was analyzed by a fully automated high resolution capillary electrophoresis apparatus (Bioptic, Taiwan, China) to verify that the fragment size of the product matches the theoretical fragment length.
Dual-luciferase reporter gene assay
Previous studies indicated that a high correlation between methylation levels of neighboring CpG sites has been observed in CRC (Hu et al., 2017). Thus, the methylation profiles of adjacent CpG sites are often similar. To be noted, since the 85 bp fragment (nucleotides from +79 to +163 bp) in the methylation assay was too short to be constructed, we alternatively used a 485 bp fragment (nucleotides from −121 to +363 bp) that contains a 85 bp fragment (nucleotides from +79 to +163 bp) for the dual-luciferase assay. In accordance with UCSC Genome Browser, the selected fragment overlapped with multiple transcription factor binding sites, including CCCTC binding factor (CTCF) which played a vital role in gene regulation including promoter activation and repression (Rakha et al., 2004). For the above reasons, we chose the 485 bp fragment to test its promoter activity.
The human HEK293T cell line, obtained from the cell bank of the Chinese Academy of Sciences (Shanghai, China), was cultured and constructed recombinant plasmids. The fragment of TNFRSF10C promoter (−121 bp to +363 bp) was chemically synthesized. The cells were cultured on 24-well plates. After 12 h, 0.5 × 10⁵ cells per well were transfected with recombinant plasmid according to the manufacturer’s protocol (TransLipid HL Transfection Reagent, TransGen Biotech, Beijing, China). After 36 h of 293T cells transfection, we used SpectraMax 190 (Molecular Devices, Sunnyvale, CA, USA) to measure renilla and firefly luciferase activity. Reporter gene activity was assessed according to the manufacturer’s protocol (Dual-Luciferase® Reporter Assay Systems, Promega, Madison city, WI, USA).
Bioinformatics analyses
Methylation data from a total of 443 colorectal adenocarcinoma patients were extracted from the TCGA database (Methylation450k, https://genome-cancer.ucsc.edu/). Meanwhile, to evaluate the association between mRNA expression and TNFRSF10C methylation, an effective dataset of TCGA colorectal adenocarcinoma group containing 633 samples was downloaded from cBioPortal (http://www.cbioportal.org/). We compared on the expression changes of TNFRSF10C in two CRC cell lines (COLO320 and HT29) with and without 5′-AZA-deoxycytidine treatment, which derived from the Gene Expression Omnibus (GEO) database (http://www.ncbi.nlm.nih.gov/geo, accession no. GSE32323).
Statistical analysis
Nonparametric Wilcoxon paired test was used to assess the methylation differences between tumor and paired adjacent non-tumor tissues. Nonparametric Wilcoxon paired test and paired samples t test were used to perform subgroup analysis of TNFRSF10C methylation and clinical characteristics. Spearman Correlation rank test was used to assess the correlation between TNFRSF10C methylation and TNFRSF10C expression. Furthermore, Kaplan–Meier survival analysis was implemented to assess the difference of overall survival between CRC patients with hypermethylated and hypomethylated TNFRSF10C promoters. A two-sided P < 0.05 indicated a significant difference.
Results
In the current study, we recruited 107 CRC patients to study the relationship between TNFRSF10C methylation and CRC (Table 1). There were 30 prominent types, 72 ulcerative types, and five infiltrating types. The average age of CRC patients was 61 years (range: 28–86 years old).
| Variables | Stage-one experiment | Stage-two experiment | Total |
|---|---|---|---|
| Number | 38 | 69 | 107 |
| Age (years) | 65.0 (57.0, 71.0)a | 59.0 (52.0, 67.5) | 61.0 (54.5, 71.0)a |
| Gender (F/M) | 10/27a | 24/45 | 34/72a |
| Tumor size (cm) | 4.54 ± 1.49 | 4.94 ± 1.89 | 4.79 ± 1.77 |
| Differentiation (Well/Poor) | 34/4 | 55/14 | 99/18 |
| Lymph node metastasis (+∕ − ) | 18/20 | 39/30 | 57/50 |
| TNM stage (I + II/III + IV) | – | 34/35 | 34/35 |
| Pathological types (P/ U/ I) | 8∕28∕2 | 22∕44∕3 | 30∕72∕5 |
Notes:
- F
-
stood for female and M stood for male
- Well
-
comprised high and medium differentiation
- Poor
-
comprised low and none differentiation
- P
-
protrude type
- U
-
ulcerative type
- I
-
infiltrating type
Aberrant methylation of promoter CpG island is associated with transcriptional inactivation of gene (Teodoridis, Strathdee & Brown, 2004). Since methylation often occurs at the position of CpG dinucleotides, we selected sites at the CpG island position in the promoter region (+79 ∼+163, 85 bp, chr8: 22960393–22960677) in the current study (Fig. S1). Two Methyl450 CpG sites (cg23965061 and cg14015044) in TCGA data were presented in the amplification fragment (Fig. 2A). Our Sanger sequencing result showed that the amplified fragment matched the target sequence and the bisulphite conversion was well performed (Fig. 2B). Capillary electrophoresis (Fig. 2C) verified that the length of amplified product was 85 bp as we expected.
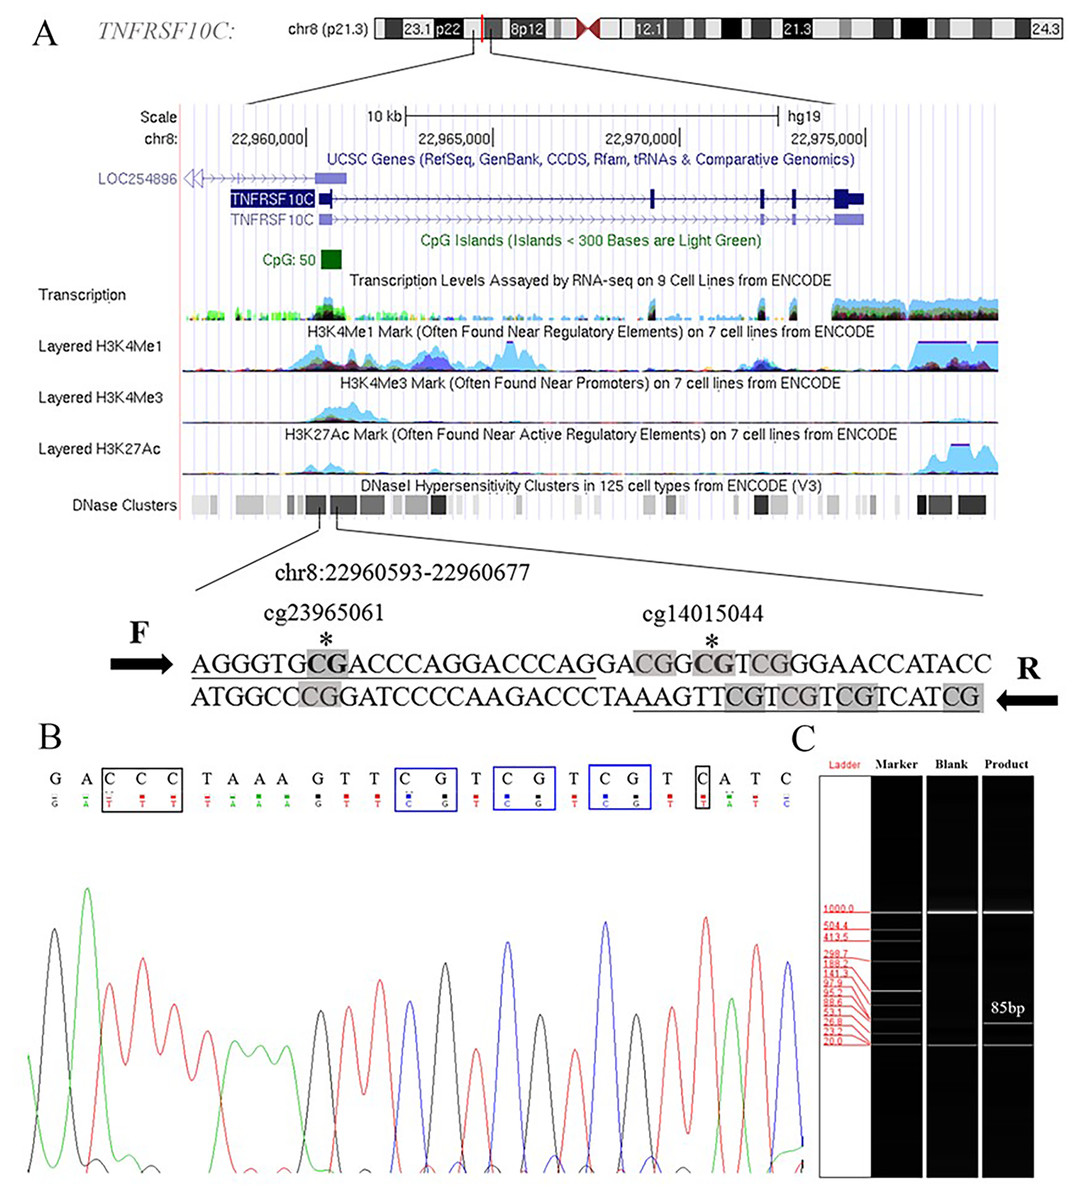
Figure 2: Primers and target amplification sequence in TNFRSF10C promoter CpG island (CGI) region.
(A) F and R were forward and reverse primers, respectively. CpG sites in amplified sequences were signed in grey; Bold CpG sites marked with * were the probes (cg23965061 and cg14015044) detected in Methylation 450k microarray. (B) The top row of the sequence represents the original sequence of the target fragment, and the second row shows the converted sequences; CG dinucleotides which remained unchanged were outlined in blue, and C with corresponding converted T were outlined in black. (C) The result of capillary electrophoresis for amplification fragment (85 bp).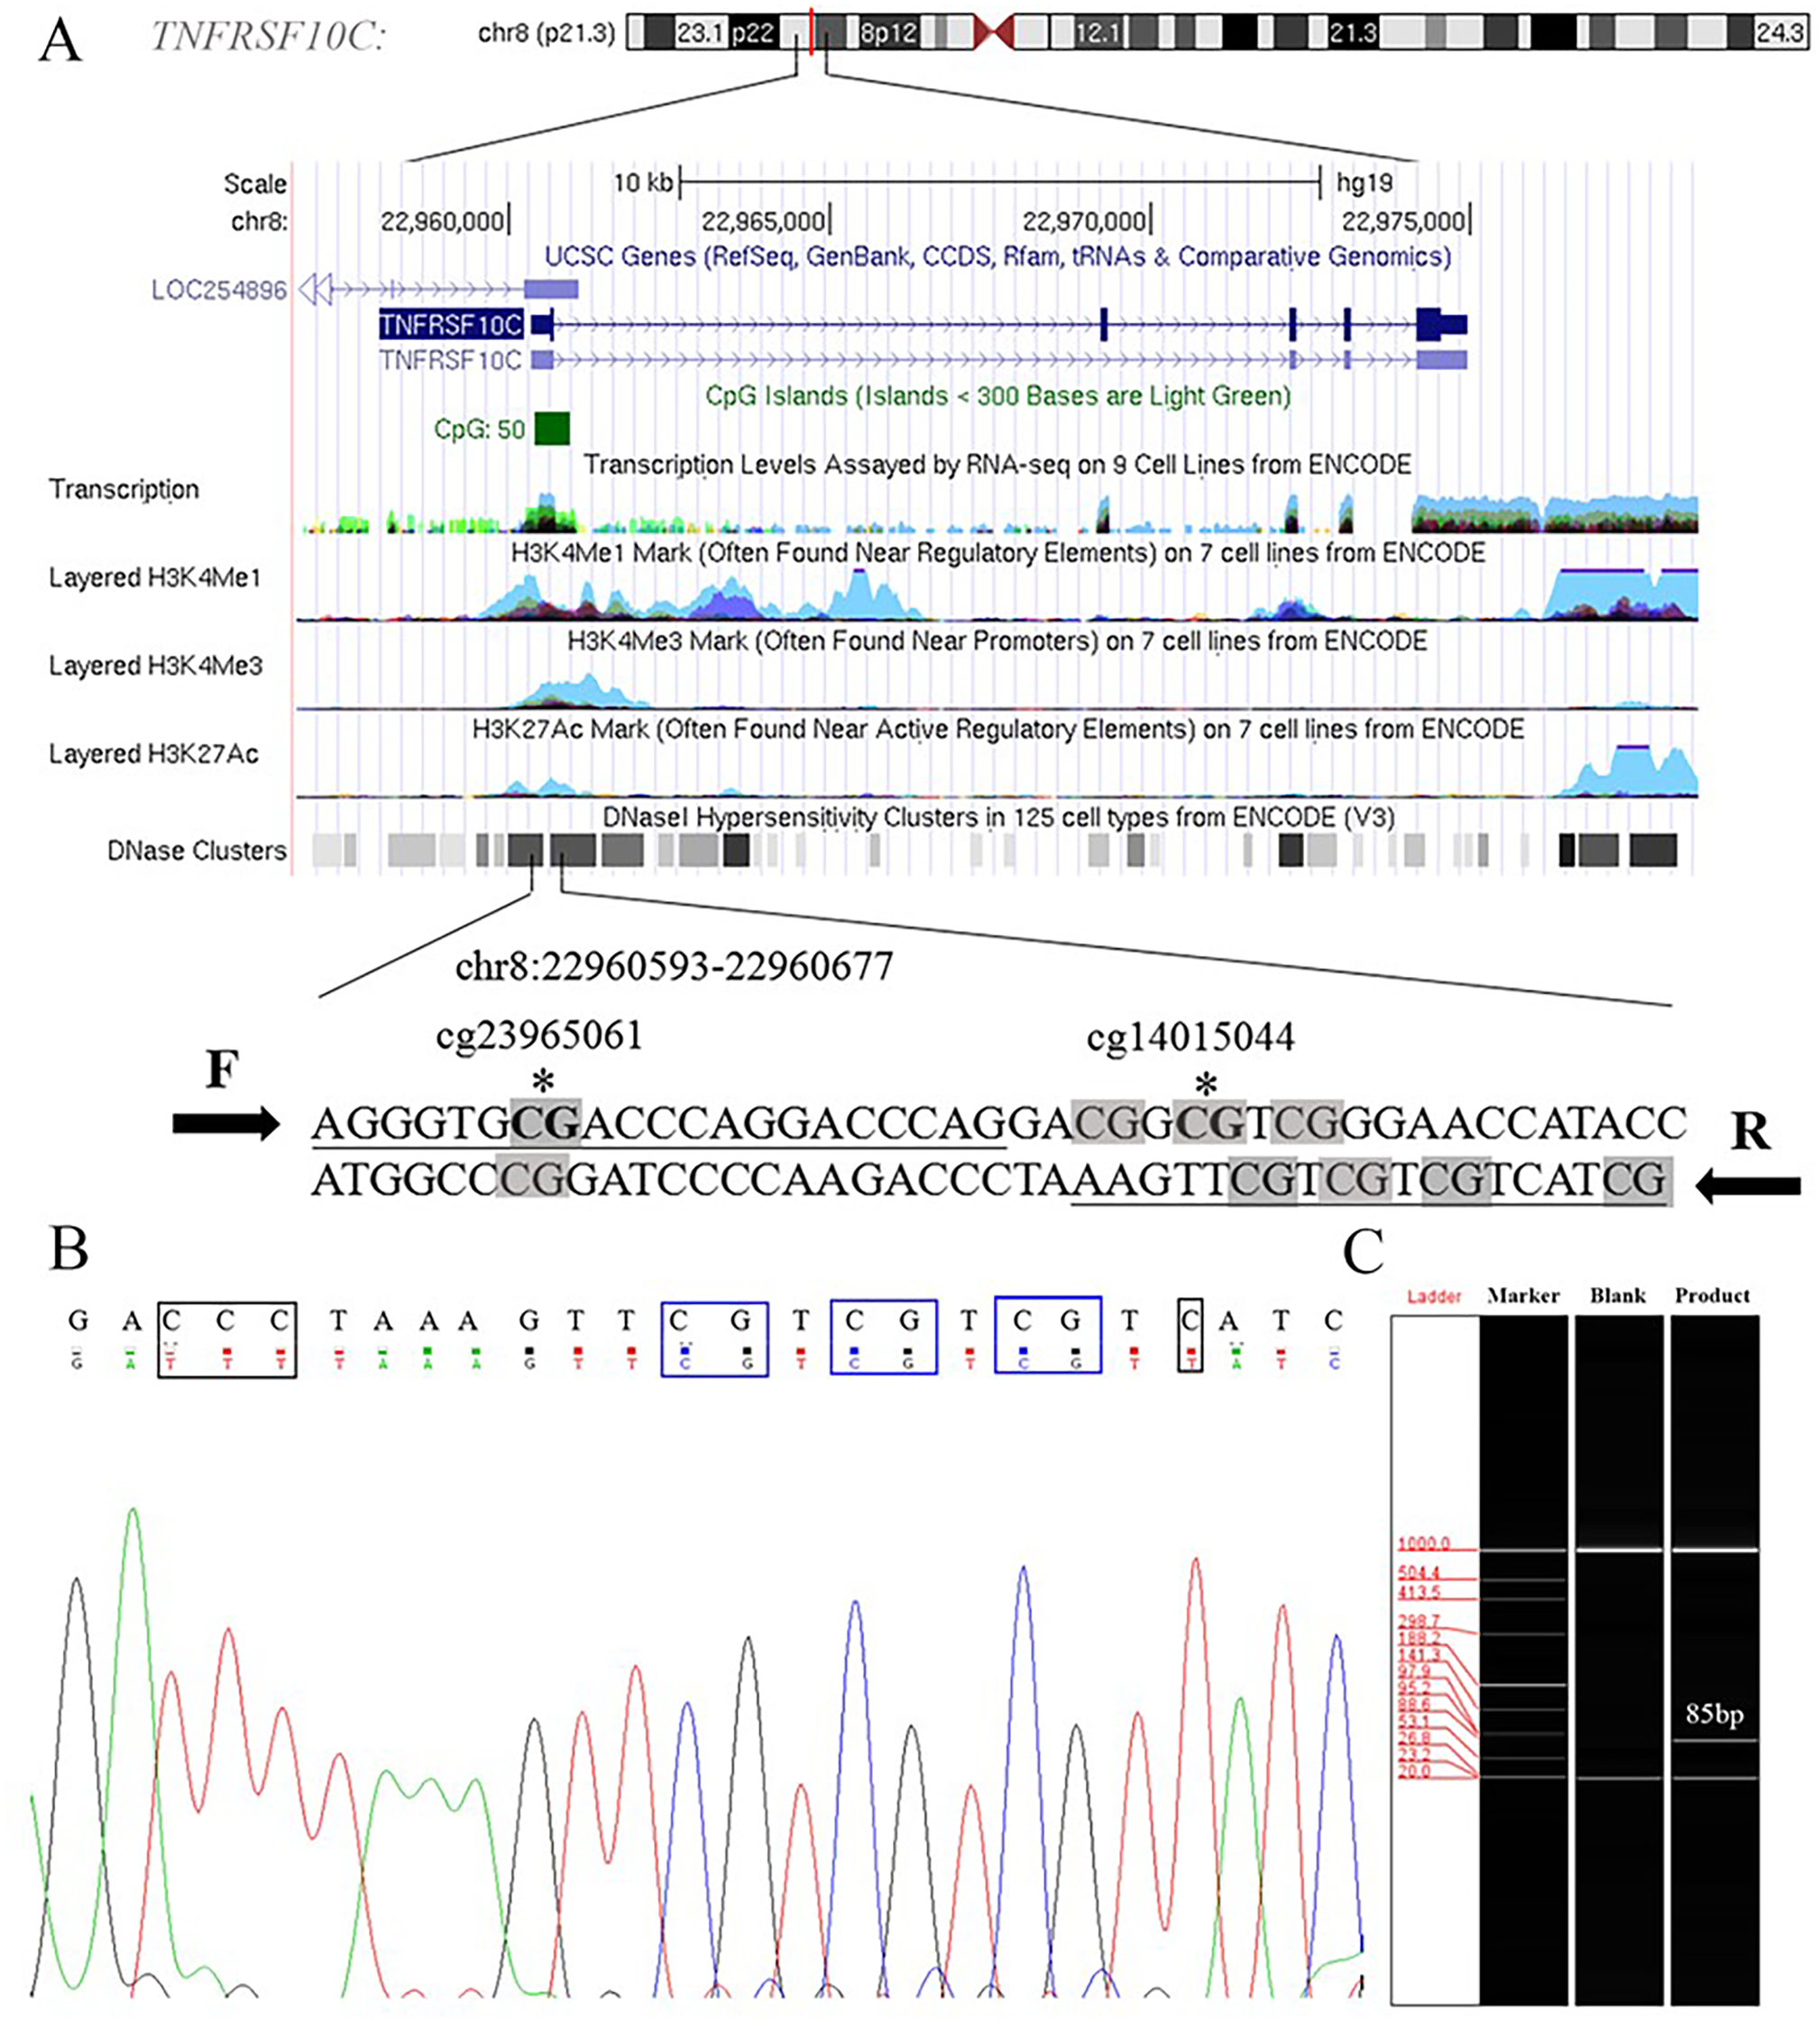
Our two-stage association study comprised a total of 38 CRC patients in the discovery stage and 69 CRC patients in the validation stage. Our discovery-stage results showed that TNFRSF10C methylation was significantly increased in tumor tissues than in paired adjacent non-tumor tissues (mean PMR with standard error (SE), 24.67 ± 7.52 versus 3.36 ± 0.89, P = 0.003). And this association result was further confirmed in the validation-stage analysis (mean PMR with SE, 31.21 ± 12.48 in tumor tissues versus 4.52 ± 1.47 in paired adjacent non-tumor tissues, P = 0.0005, Fig. 3A).
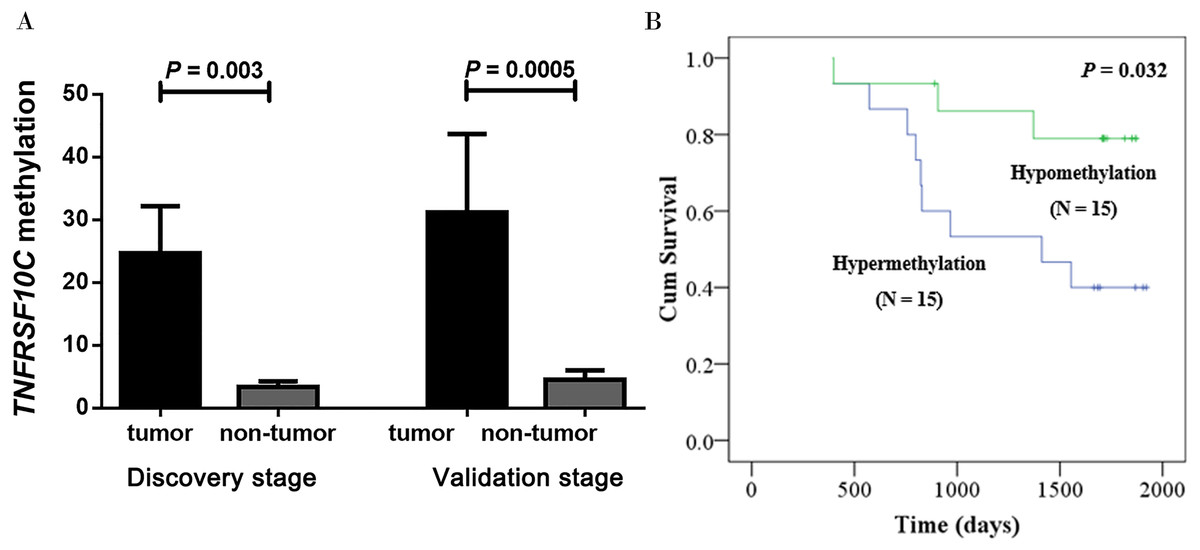
Figure 3: Hypermethylation of TNFRSF10C and its prognostic value.
(A) Comparisons of TNFRSF10C methylation levels between tumor tissues and paired adjacent non-tumor tissues. The plot described as mean with SE. (B) The relationship between TNFRSF10C promoter methylation and overall survival in CRC patients.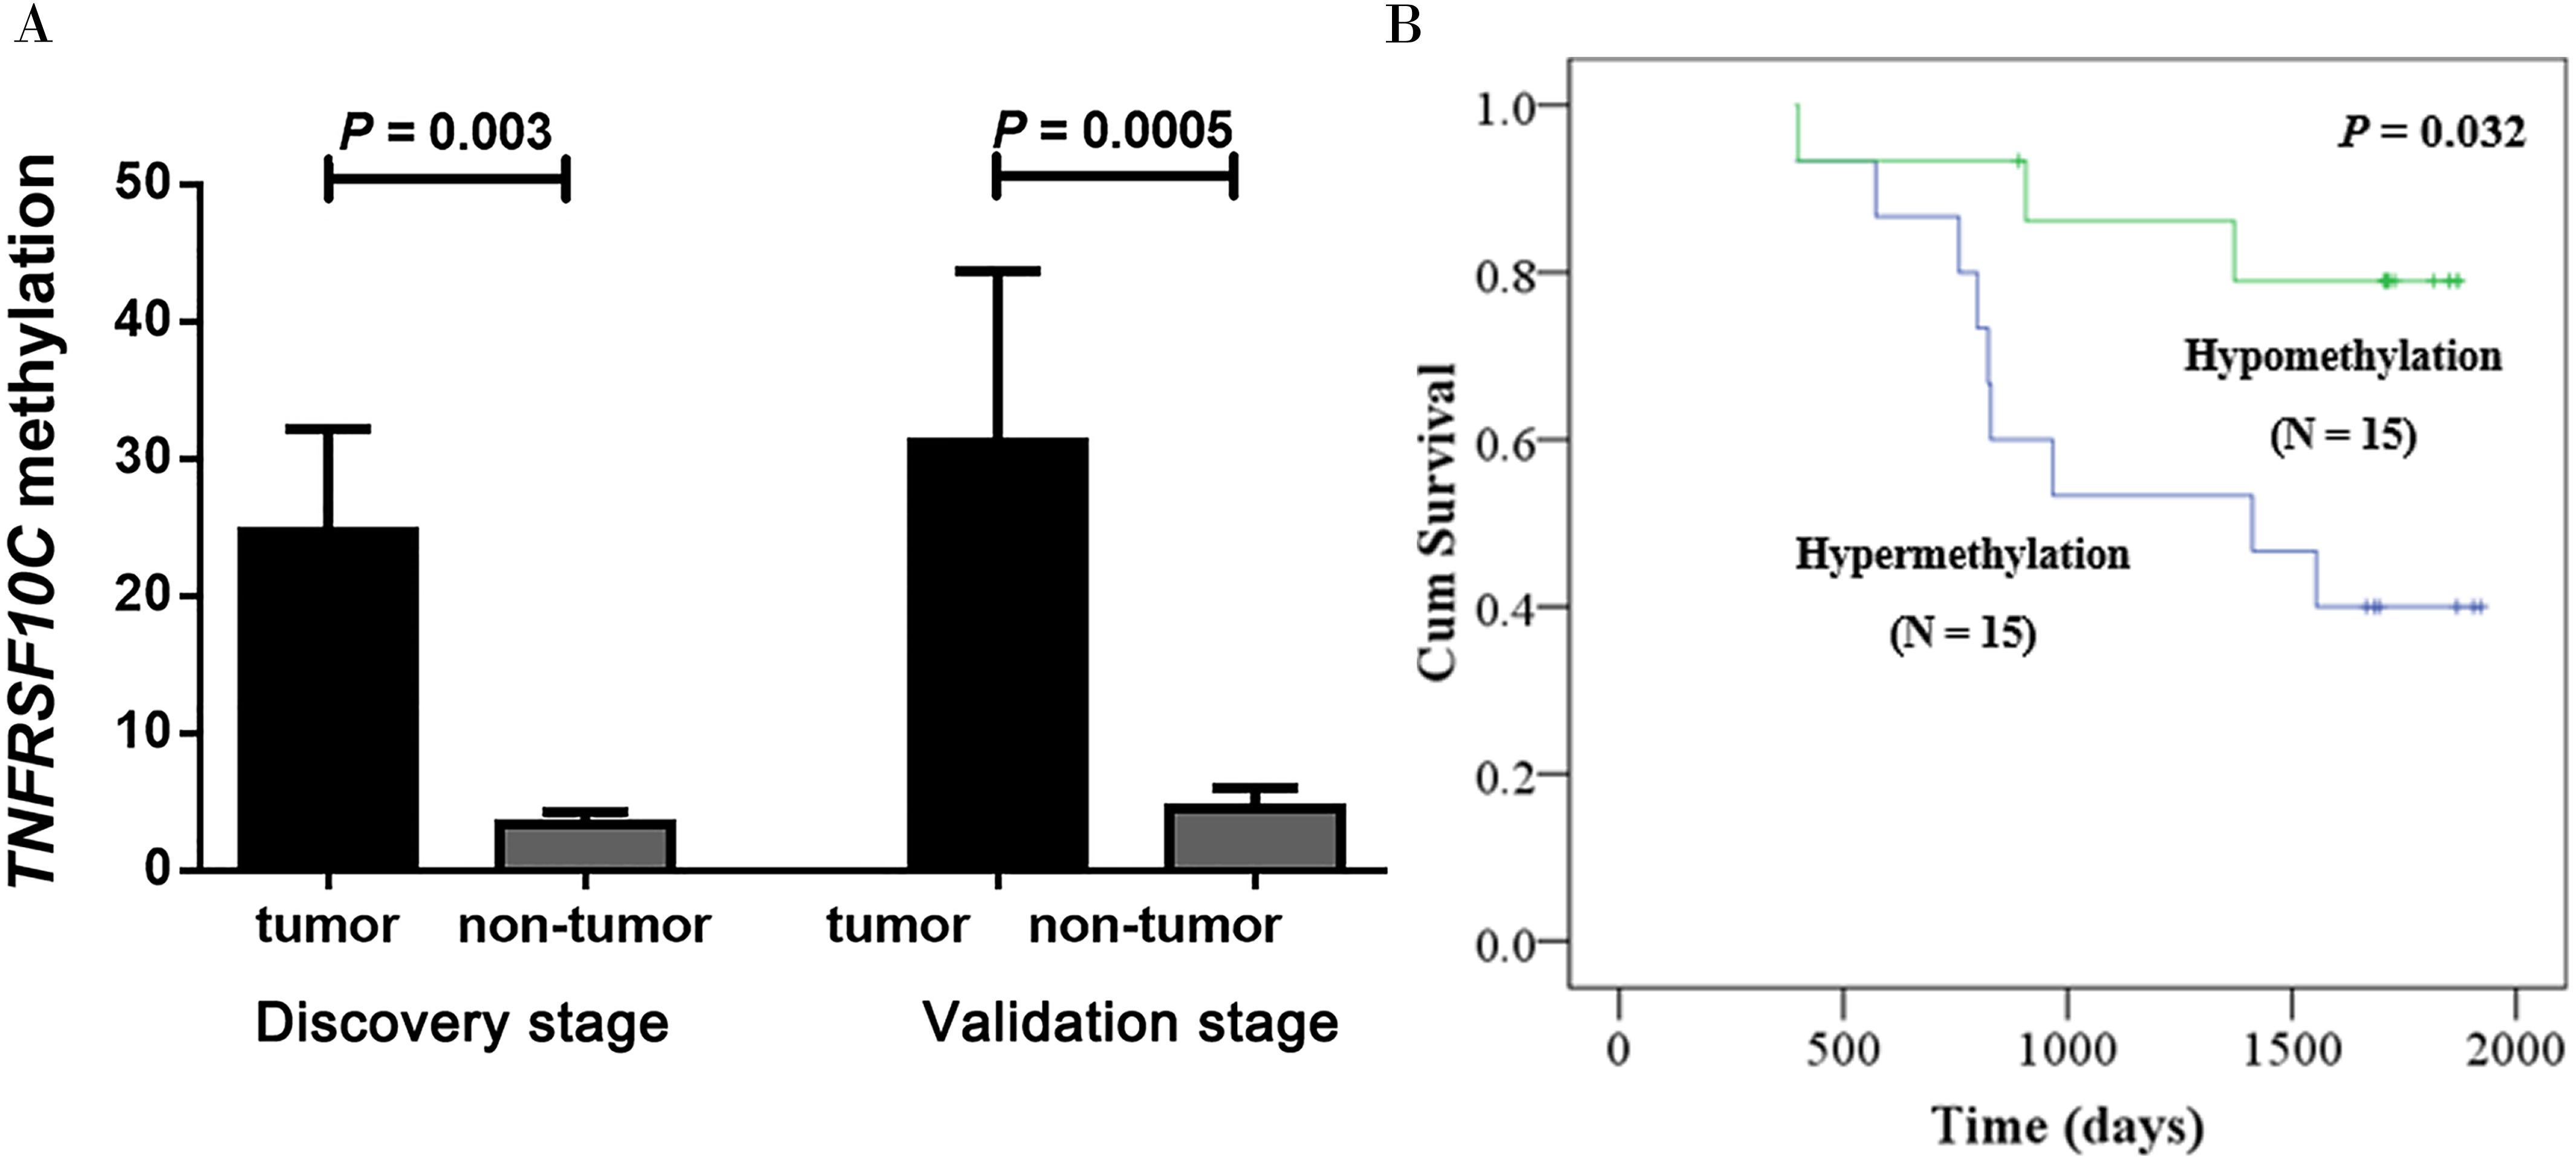
Fortunately, there were 30 patients’ survival data obtained from the medical card in our cohort. Kaplan–Meier analysis was implemented to assess the prognostic effect of TNFRSF10C methylation in our cohort. Our results confirmed that CRC patients with methylated TNFRSF10C promoter had a poorer overall survival (OS) than those with unmethylated TNFRSF10C promoter (P = 0.032, Fig. 3B). Therefore, it could be a potentially clinical biomarker for better prognosis of CRC patients.
As shown in Table 2, we performed subgroup analysis between TNFRSF10C methylation and corresponding clinical information in CRC. Subgroup analysis was performed in the combined samples of discovery stage and validation stage. Our results revealed that the association of TNFRSF10C hypermethylation with CRC was specific to patients with TNM stage I + II tumors (P = 0.002) and patients with high and medium differentiation tumors (P = 4E − 5).
We constructed a luciferase reporter vector containing synthetic TNFRSF10C promoter fragment. Our dual-luciferase reporter gene assay showed TNFRSF10C fragment (-121 bp to +363 bp) had a promoter activity, which was inferred by the comparison of reporter gene expression between insert-containing pGL3-basic vector group and pGL-3-basic vector group (Fold change = 2.375, P = 0.013, Fig. 4).
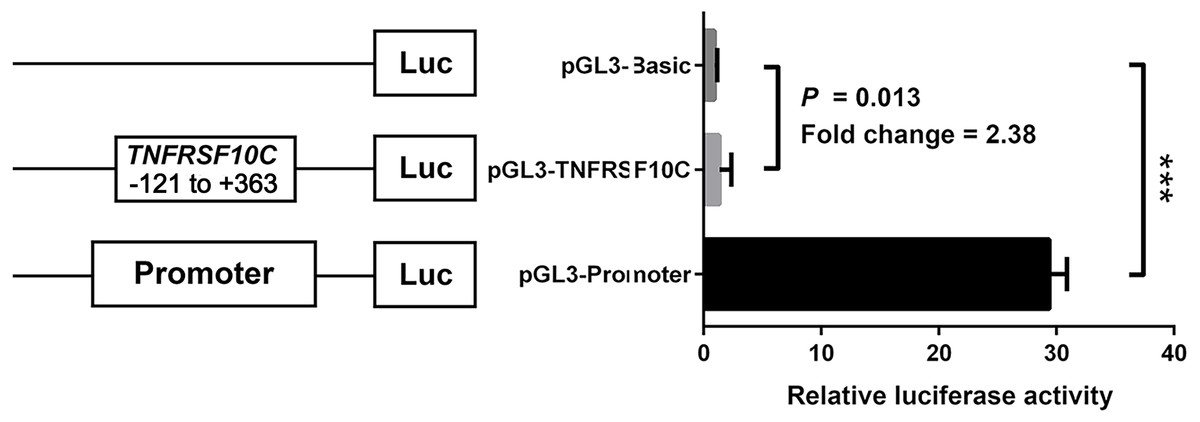
Figure 4: Dual-luciferase reporter gene assay in HEK-293T cell line.
The pGL3-Basic and pGL3-Promoter vectors were constructed as negative and positive controls, respectively. Bars represented the means with standard deviations of three independent experiments.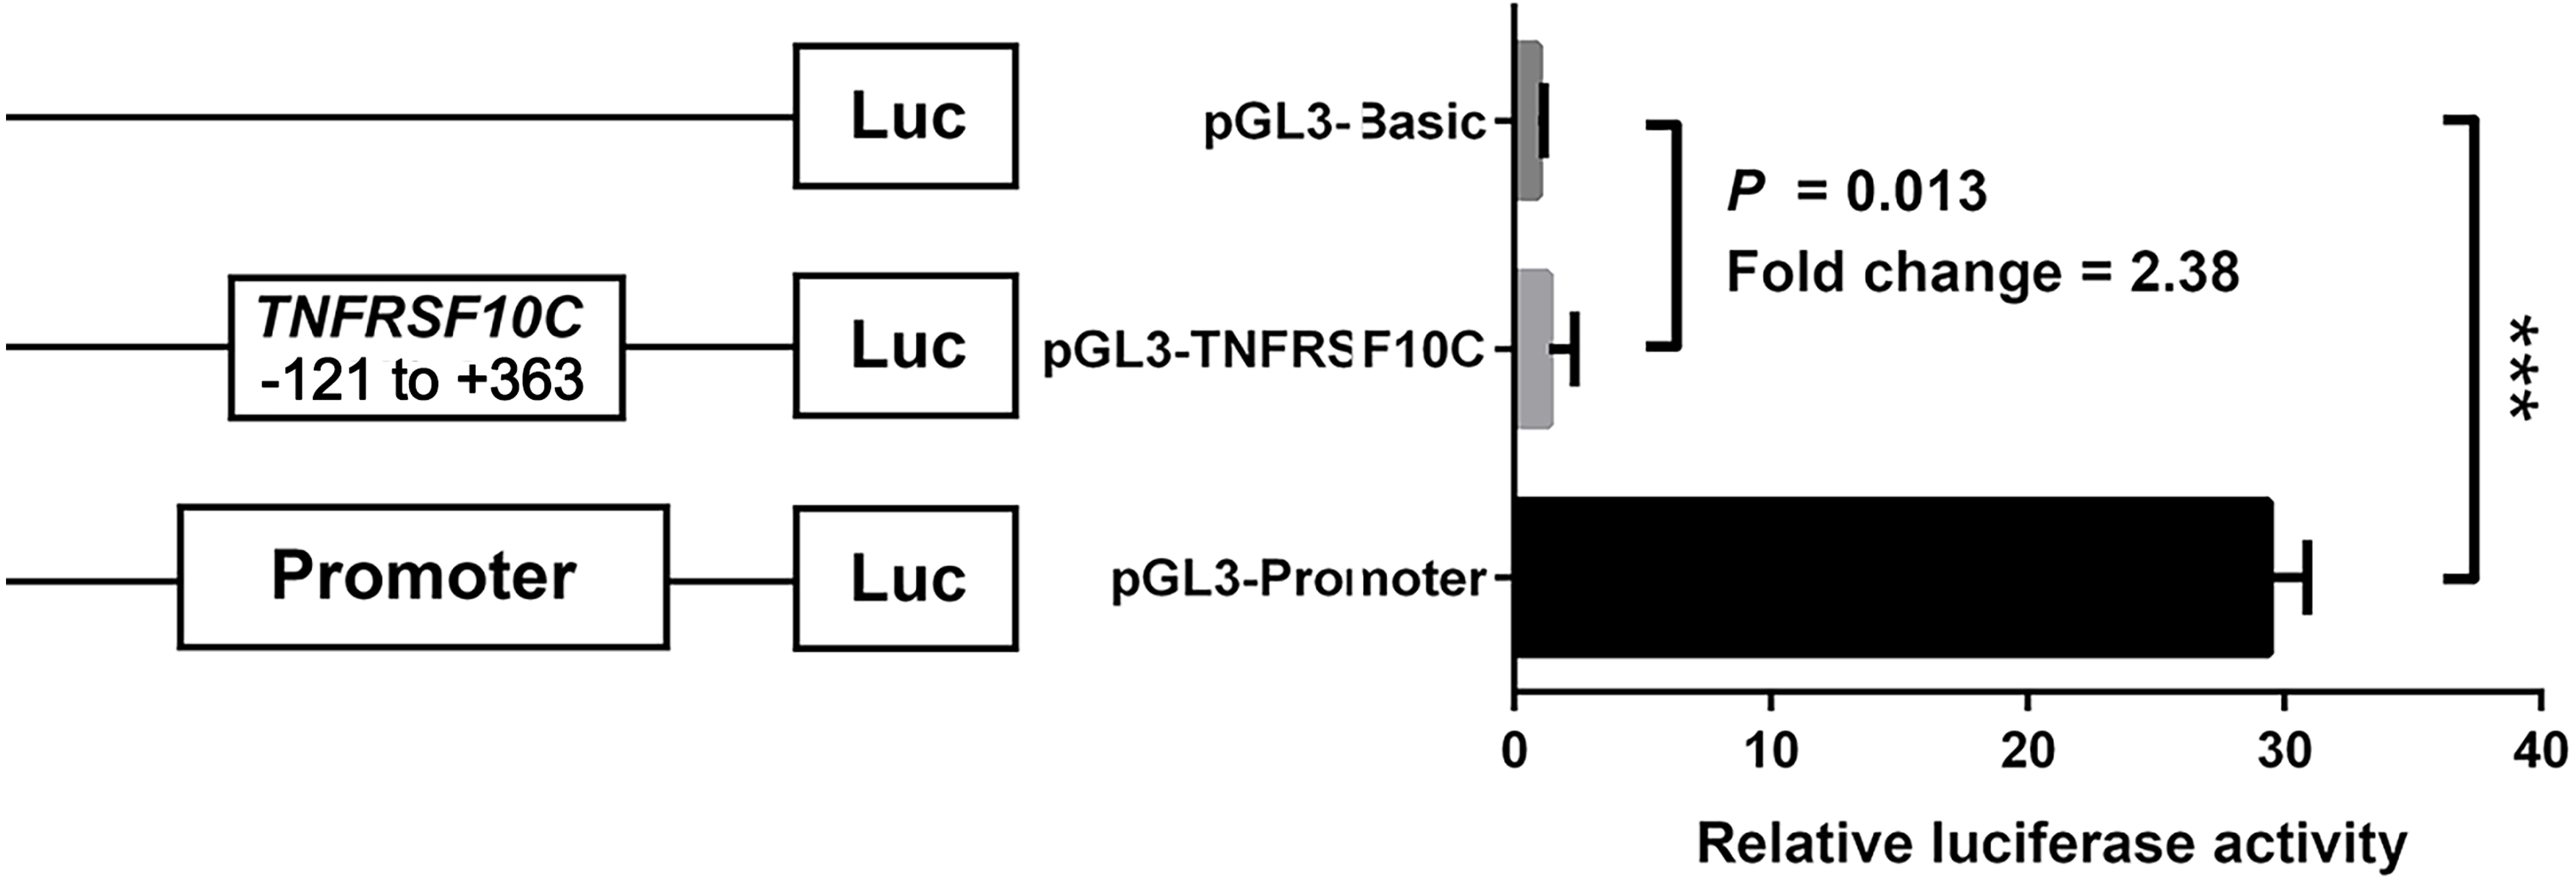
| Variables | N (Pairs) | PMR (T) | PMR (N) | P |
|---|---|---|---|---|
| Differentiation | ||||
| High and medium | 89 | 3.56 (0.35, 21.28) | 1.64 (0.63, 3.31) | 4E−5 |
| Low and none | 18 | 1.41 (0.39, 12.53) | 1.23 (0.35, 2.85) | 0.050 |
| TNM stage | ||||
| I + II | 34 | 5.27 (0.67.30.75) | 1.49 (0.56, 3.35) | 0.002 |
| III + IV | 35 | 1.09 (0.14, 11.05) | 1.55 (0.40, 2.98) | 0.095 |
| Lymph node metastasis | ||||
| Positive | 57 | 1.65 (0.26, 15.95) | 1.63 (0.64, 3.41) | 0.009 |
| Negative | 50 | 5.27 (0.57, 24.16) | 1.58 (0.59, 2.89) | 0.0003 |
Notes:
Stage-one experiment didn’t collect TNM stage information, with only 69 pairs of samples from stage-two experiment were enrolled for the subgroup analysis. PMR referred to the percentage of methylated reference. T referred to the group of tumors, N referred to the group of non-tumors. P value was calculated by nonparametric Wilcoxon paired tests. Bold value indicated a statistical significance.
Additionally, TCGA data analysis confirmed a significantly increased TNFRSF10C methylation of the promoter fragment in CRC tumor tissues (cg23965061: P = 4E − 6, cg14015044: P = 1E − 7, Fig. 5A). All the above evidence indicated that TNFRSF10C hypermethylation could be a risk factor of CRC. Analyses among 633 TCGA colorectal adenocarcinoma samples showed a significantly inverse correlation between TNFRSF10C methylation and TNFRSF10C expression (r = − 0.379, P = 4E-14, Fig. 5B). Further data mining of GEO data indicated that TNFRSF10C expression was significantly increased in two CRC cell lines after 5′-AZA-deoxycytidine treatment (COLO320, fold change = 1.36; HT29, fold change = 1.06, Fig. 5C).
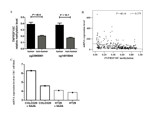
Figure 5: TNFRSF10C methylation and TNFRSF10C expression.
(A) Methylation levels of cg23965061 and cg14015044 among 443 pairs of tumor and non-tumor tissues from TCGA colon and rectum adenocarcinoma database. The plot described as mean with SE. (B) Significant inverse correlation between TNFRSF10C methylation and expression among 633 individuals from TCGA colorectal adenocarcinoma database (r = − 0.379, P = 4E − 14); (C) The changes of mRNA expression levels in a CRC cell line (SW48) with and without 5′-AZA-deoxycytidine treatment from GEO database (accession number GSE32323).
Discussion
In the present study, we explored the association between TNFRSF10C methylation and CRC in the Chinese population. By carrying out a two-stage study, we found a significant association between TNFRSF10C hypermethylation and CRC. Similarly, analysis of TCGA database supported that TNFRSF10C was significantly hypermethylated in CRC tumor tissues.
Although abnormal methylation of TNFRSF10C has been reported in other human cancers, our study has the following advantages. First, most of the previous studies used MSP, a technique that is difficult to quantify DNA methylation levels (Malpeli et al., 2011). In this study, we applied a qMSP method that is more suitable for molecular diagnostics (Hibi et al., 2011). Previous studies showed that gastric cancer (GC) and CRC shared several molecular characteristics, including abnormal methylation of tumor suppressor genes, microsatellite instability, and gene mutations (Hu et al., 2017). Dauksa et al. (2014) showed that the average methylation level of TNFRSF10C was significantly higher in GC patients than in the control group. However, there is no study on TNFRSF10C methylation in CRC. In this study, a two-stage study was performed to test the association of TNFRSF10C methylation with CRC, thus improving the reliability of the conclusions. Finally, a dual luciferase reporter gene assay was used to evaluate the potential regulatory mechanisms of TNFRSF10C methylation on gene expression. In conclusion, our study provides a better understanding of the relationship between TNFRSF10C methylation and CRC.
TNM stage is the most important prognostic factor for patients with CRC (Wei et al., 2015), and stage I+II often indicates the early stage with a favorable prognosis (Compton et al., 2000). Additionally, subgroup analyses by clinical phenotypes indicated that the association of TNFRSF10C hypermethylation with CRC was specific to patients with TNM stage I+II tumors. Therefore, TNFRSF10C hypermethylation could be served as an early diagnostic biomarker for CRC. Moreover, differentiation levels of cancer cells are often inversely correlated with the malignancy of tumors (Jogi et al., 2012). Significant association of TNFRSF10C hypermethylation with CRC was only found in patients with high and medium differentiation tumors. Above all, we speculated that TNFRSF10C hypermethylation might be an early event occurring in CRC carcinogenesis.
In the current study, there were significant differences in survival rate between TNFRSF10C-hypomethylated and TNFRSF10C-hypermethylated patients. TNFRSF10C promoter methylation is shown to be a significant predictive factor. Future work with a larger number and in various ethnic groups is warranted in order to confirm that TNFRSF10C promoter methylation as a commonly candidate biomarker on prognosis prediction.
TNFRSF10C methylation inversely associated with mRNA expression (Cai et al., 2011; Cheng et al., 2009; Shin et al., 2010; Vaitkiene et al., 2013) and protein expression (Sriraksa et al., 2011; Venza et al., 2013). Due to the limited amount of tissues, sufficient mRNA could not be obtained for additional gene expression assay. And the relationship between TNFRSF10C methylation and expression should be verified in subsequent experiments. Subsequently, TCGA analysis of 633 CRC samples confirmed that TNFRSF10C methylation was inversely correlated with mRNA expression. Our dual luciferase reporter assay revealed that the fragment of TNFRSF10C in the methylation assay was able to promote gene expression. Promoter hypermethylation of protein coding gene often induces expression silencing (Mohn et al., 2008; Moore, Le & Fan, 2013). However, there are two potential mechanisms of TNFRSF10C in the pathogenesis of cancer. As a TRAIL receptor, TNFRSF10C primarily activates the NF-κb pathway of cancer cells (Murphy, Perry & Lawler, 2008). The NF-κB pathway is pro-apoptotic, which is implicated in the pathogenesis of many human malignancies (Gilmore et al., 1996). Therefore, we inferred that CRC could use the promoter CGI methylation to silence TNFRSF10C expression to obtain the proliferation ability of cancer cells. And another mechanism suggests that TNFRSF10C can inhibit apoptosis induction (Murphy, Perry & Lawler, 2008) by competing the binding of TRAIL with TNFRSF10A and TNFRSF10B. TNFRSF10C’s down regulation will reduce its resistance to apoptosis and represent a protective response to tumor progression (Cheng et al., 2009), which is contrary to our observation. Therefore, future research needs to explore the exact mechanism of TNFRSF10C methylation in the pathogenesis of cancer.
Previous prostate cancer-related studies showed that the TNFRSF10C promoter methylation or deletion could regulate its gene expression in a dose-dependent manner (Cheng et al., 2009). However, compared with tumor patients without TNFRSF10C deletion, the frequency of promoter CGI hypermethylation was not significantly increased in TNFRSF10C-deficient tumor patients. Therefore, we speculated that TNFRSF10C promoter methylation and TNFRSF10C deletion may have different regulatory mechanisms for gene expression. Unfortunately, our study was based on a candidate gene approach, and we focused only on the role of TNFRSF10C promoter CGI methylation in CRC. More studies should be conducted in the future to investigate the interaction between CGI methylation and deletion in the TNFRSF10C promoter in CRC.
In conclusion, our results suggested a significant association of TNFRSF10C promoter hypermethylation with CRC. TNFRSF10C hypermethylation might contribute to the decreased expression of TNFRSF10C in CRC. However, the exact mechanism between the aberrant methylation and gene silencing of TNFRSF10C in CRC should be explored in the future.
Supplemental Information
Original data in the current study
LN refers to lymphatic metastasis.
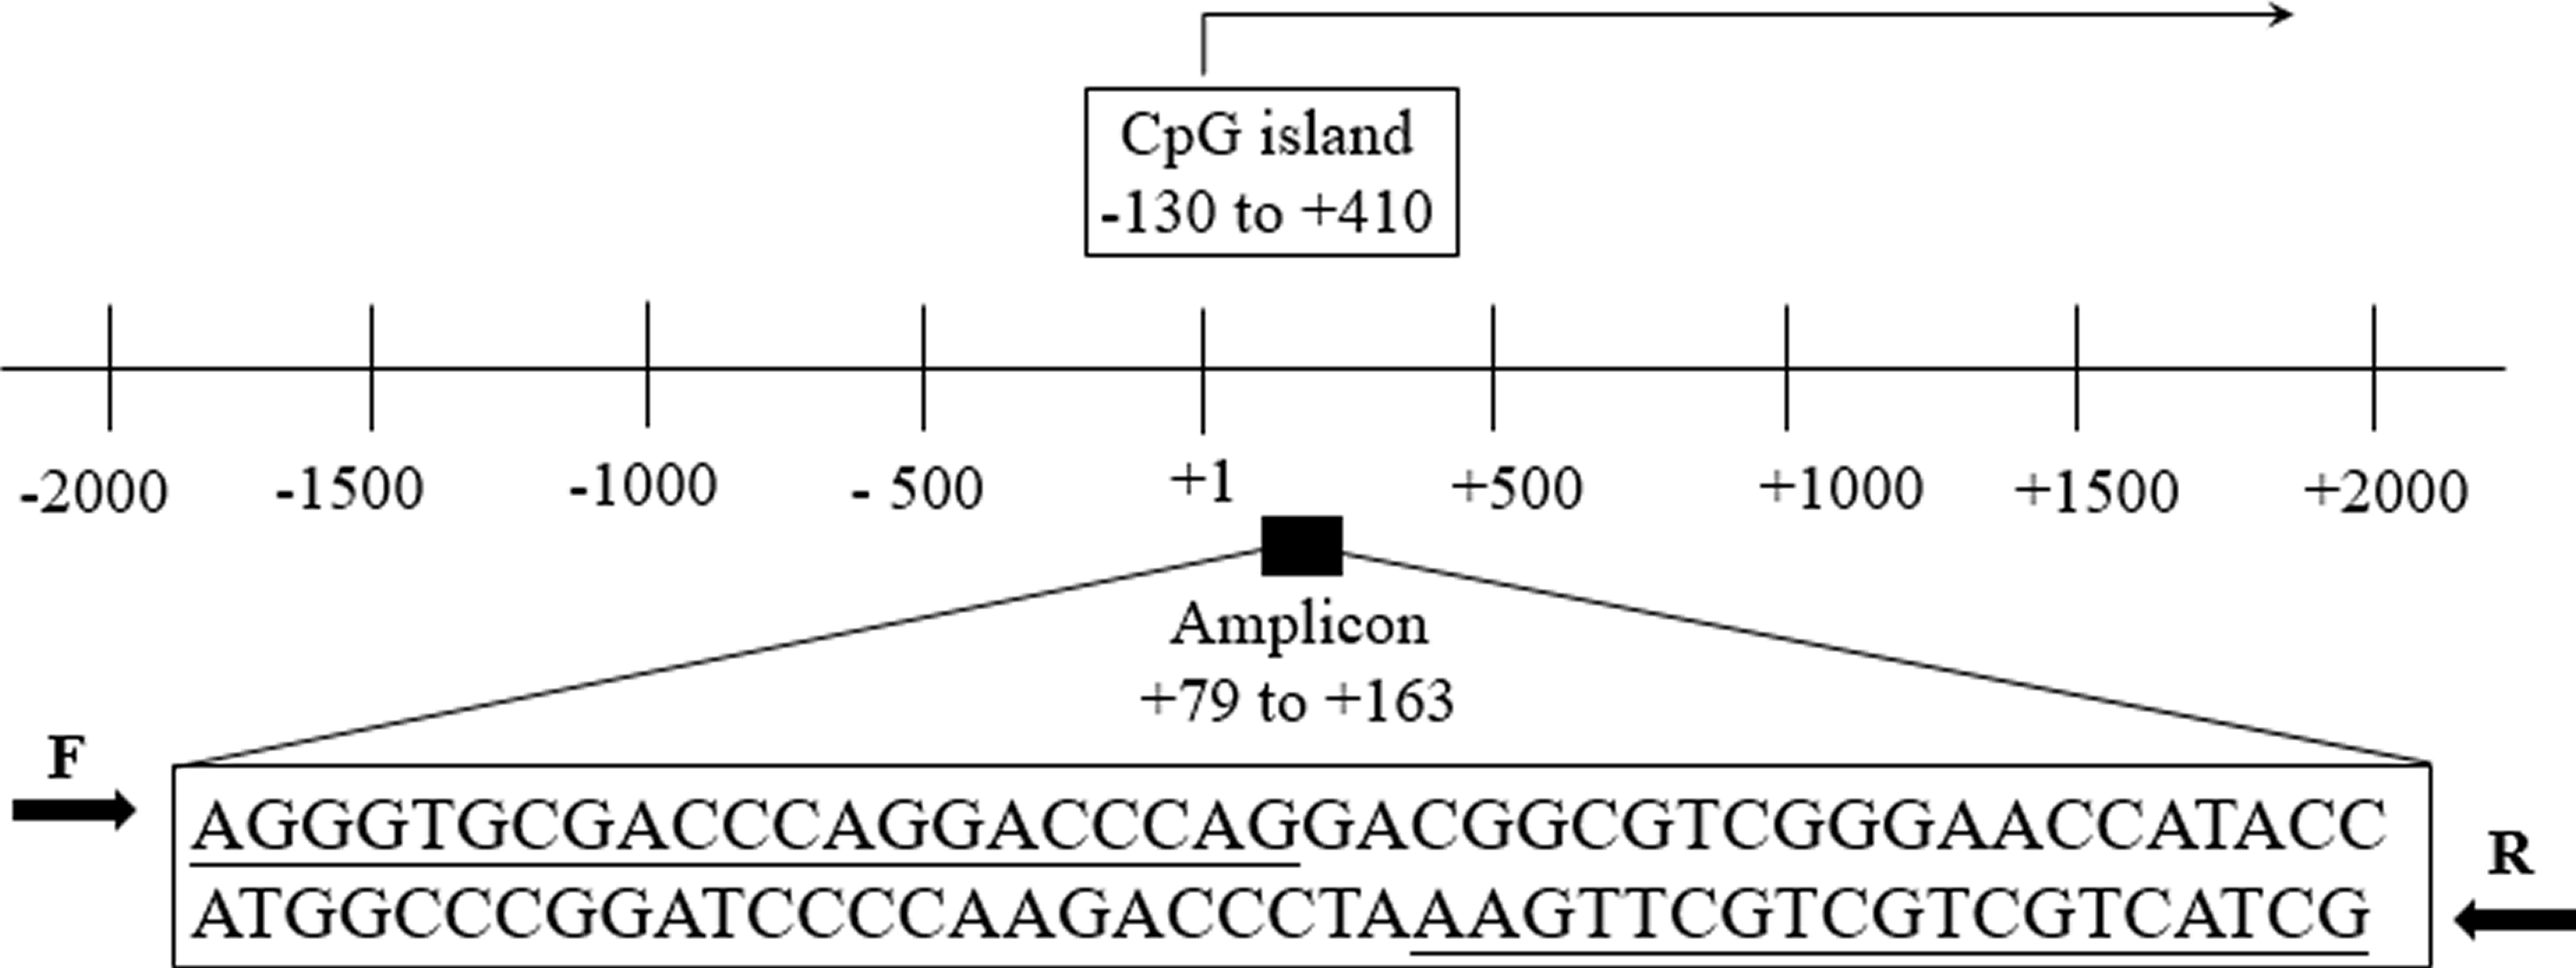
Schematic representation of the TNFRSF10C promoter region
The TNFRSF10C transcription start site was marked with a +1 and an arrow. Our qMSP amplicon (+79 ∼+163) and CpG island (−130 ∼+413) were located in the TNFRSF10C promoter region.