
DNA barcoding of marine fish species from Rongcheng Bay, China
- Published
- Accepted
- Received
- Academic Editor
- Antonio Amorim
- Subject Areas
- Aquaculture, Fisheries and Fish Science, Biodiversity, Genetics, Marine Biology
- Keywords
- Cytochrome c oxidase subunit I (COI), DNA barcoding, Fish identification, Rongcheng Bay
- Copyright
- © 2018 Wang et al.
- Licence
- This is an open access article distributed under the terms of the Creative Commons Attribution License, which permits unrestricted use, distribution, reproduction and adaptation in any medium and for any purpose provided that it is properly attributed. For attribution, the original author(s), title, publication source (PeerJ) and either DOI or URL of the article must be cited.
- Cite this article
- 2018. DNA barcoding of marine fish species from Rongcheng Bay, China. PeerJ 6:e5013 https://doi.org/10.7717/peerj.5013
Abstract
Rongcheng Bay is a coastal bay of the Northern Yellow Sea, China. To investigate and monitor the fish resources in Rongcheng Bay, 187 specimens from 41 different species belonging to 28 families in nine orders were DNA-barcoded using the mitochondrial cytochrome c oxidase subunit I gene (COI). Most of the fish species could be discriminated using this COI sequence with the exception of Cynoglossus joyneri and Cynoglossus lighti. The average GC% content of the 41 fish species was 47.3%. The average Kimura 2-parameter genetic distances within the species, genera, families, and orders were 0.21%, 5.28%, 21.30%, and 23.63%, respectively. Our results confirmed that the use of combined morphological and DNA barcoding identification methods facilitated fish species identification in Rongcheng Bay, and also established a reliable DNA barcode reference library for these fish. DNA barcodes will contribute to future efforts to achieve better monitoring, conservation, and management of fisheries in this area.
Introduction
There are approximately 30,000 fish species worldwide, constituting slightly more than one-half of the recognized living vertebrates (Nelson, Grande & Wilson, 2016). The Chinese fish fauna also has high species richness, with more than 3,200 marine species described from Chinese coastal waters (Liu, 2011). Owing to dramatic expansion in fish production, particularly from aquaculture, fish availability in China has grown steadily, with apparent per capita fish consumption increasing by an average of 6% annually in the period 1990–2010 (FAO, 2014). It is imperative that the ichthyofauna of China be well studied for effective conservation and resource management. Accurate and unambiguous identification of fish will assist in managing fisheries for long-term sustainability, and will improve ecosystem research and conservation.
However, this presents a resource challenge. Traditional determination methods, such as morphological identification, require a considerable amount of taxonomic expertise. The DNA-based barcoding method has been proven to be a valuable molecular tool for species identification and it is accessible to non-specialists (Hebert, Ratnasingham & Dewaard, 2003; Frézal & Leblois, 2008; Leray & Knowlton, 2015). A number of international campaigns are focused on DNA barcoding whole biota, including fish; FISH-BOL (http://www.fishbol.org), for example, is now well established and aims at DNA barcoding all the fishes of the world (Ward, Hanner & Hebert, 2009). DNA barcoding is useful not only for the identification of whole fish but also for the identification of larvae, eggs, fillets, fins, and other fragments of the body that are difficult to identify based on morphology (Trivedi et al., 2016). The mitochondrial COI gene has been accepted as the standard region for DNA barcoding (Hebert, Ratnasingham & Dewaard, 2003; Hajibabaei et al., 2007a; Hajibabaei et al., 2007b) and it is extremely effective at discriminating fish species (Ward et al., 2005; Hubert et al., 2008; Valdez-Moreno et al., 2009). Approximately 98% of reported marine fish species can be distinguished by COI barcoding, and this approach has been used to catalogue and record fish in many geographic regions (Aquilino et al., 2011; Asgharian et al., 2011; Cawthorn, Steinman & Witthuhn, 2011; Lakra et al., 2011; Becker et al., 2015). However, there have been only a few DNA barcoding studies of the marine fish resources of China, and most of them have focused on the South China Sea (Zhang, 2011; Wang et al., 2012; Zhang & Hanner, 2012).
Rongcheng Bay is a coastal bay of the Northern Yellow Sea in Shandong Province, China, and it is one of the most important coastal regions for fisheries in China. The fisheries in this area are a major source of food and have helped coastal communities to maintain their livelihoods and community structure. Although it is an important spawning and nursery area for many marine species, scant information is available on fish species richness, barring two reports by Yu et al. (2013) and Wang et al. (2016). These investigators studied species composition and seasonal variation in community structure and reported the length–weight relationships of 13 fish species in Rongcheng Bay, but they did not undertake systematic DNA barcoding or other molecular data collection. Our study aimed to complement their dataset using DNA barcoding in order to better investigate and monitor fish resources and implement conservation efforts.
Materials and methods
Ethics statement
The study was conducted in accordance with the guidelines and regulations established by China Government Principles for the Utilization and Care of Animals Used in Testing, Research, and Training. All other applicable international, national, and institutional guidelines for the care and use of animals were followed by the authors. The animal work and animal protocols were approved by Institute of Oceanology, Chinese Academy of Science. Permits and approval of field studies have been obtained by the authors from the Institute of Oceanology, Chinese Academy of Sciences (201305043 and 200805069).
Fish samples
Fish samples were collected from Rongcheng Bay, Northern Yellow Sea (37°12′–37°24′N, 122°33′–122°48′E) (Fig. 1), using bottom trawl nets and stake nets from spring 2011 to winter 2014. One to 10 individual specimens were collected for each fish species. All captured fish samples were immediately stored on ice and transported to the laboratory for identification. Whole-specimen vouchers were deposited in the Key Laboratory of Experimental Marine Biology, Institute of Oceanology, Chinese Academy of Sciences. All specimens were identified to the species level based on morphology by consulting a standard fish reference (Cheng & Zheng, 1987) and FishBase (http://www.fishbase.org). Muscle tissue was excised from each specimen and stored at −20 °C until use. To avoid cross-contamination between fish samples, the inner part muscle of each individual was collected with tweezers and scissors, which were sterilized with alcohol and alcohol lamp. Every sample was collected by using a separate tool set.
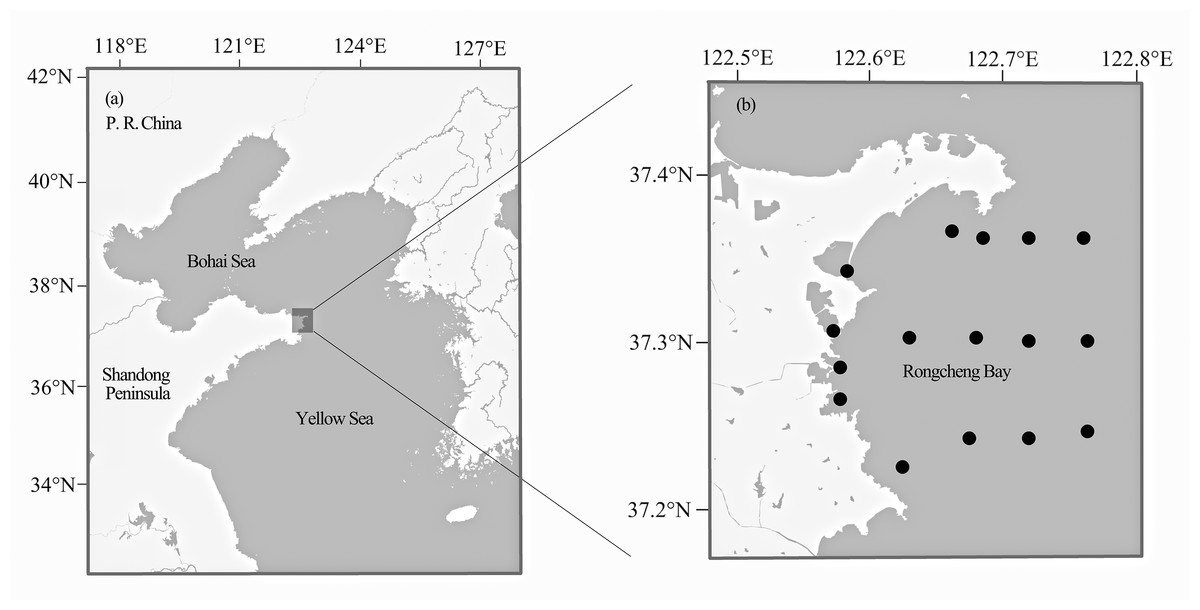
Figure 1: Map of Rongcheng Bay showing sampling sites.
Locations of Rongcheng Bay (A) and sampling sites (B).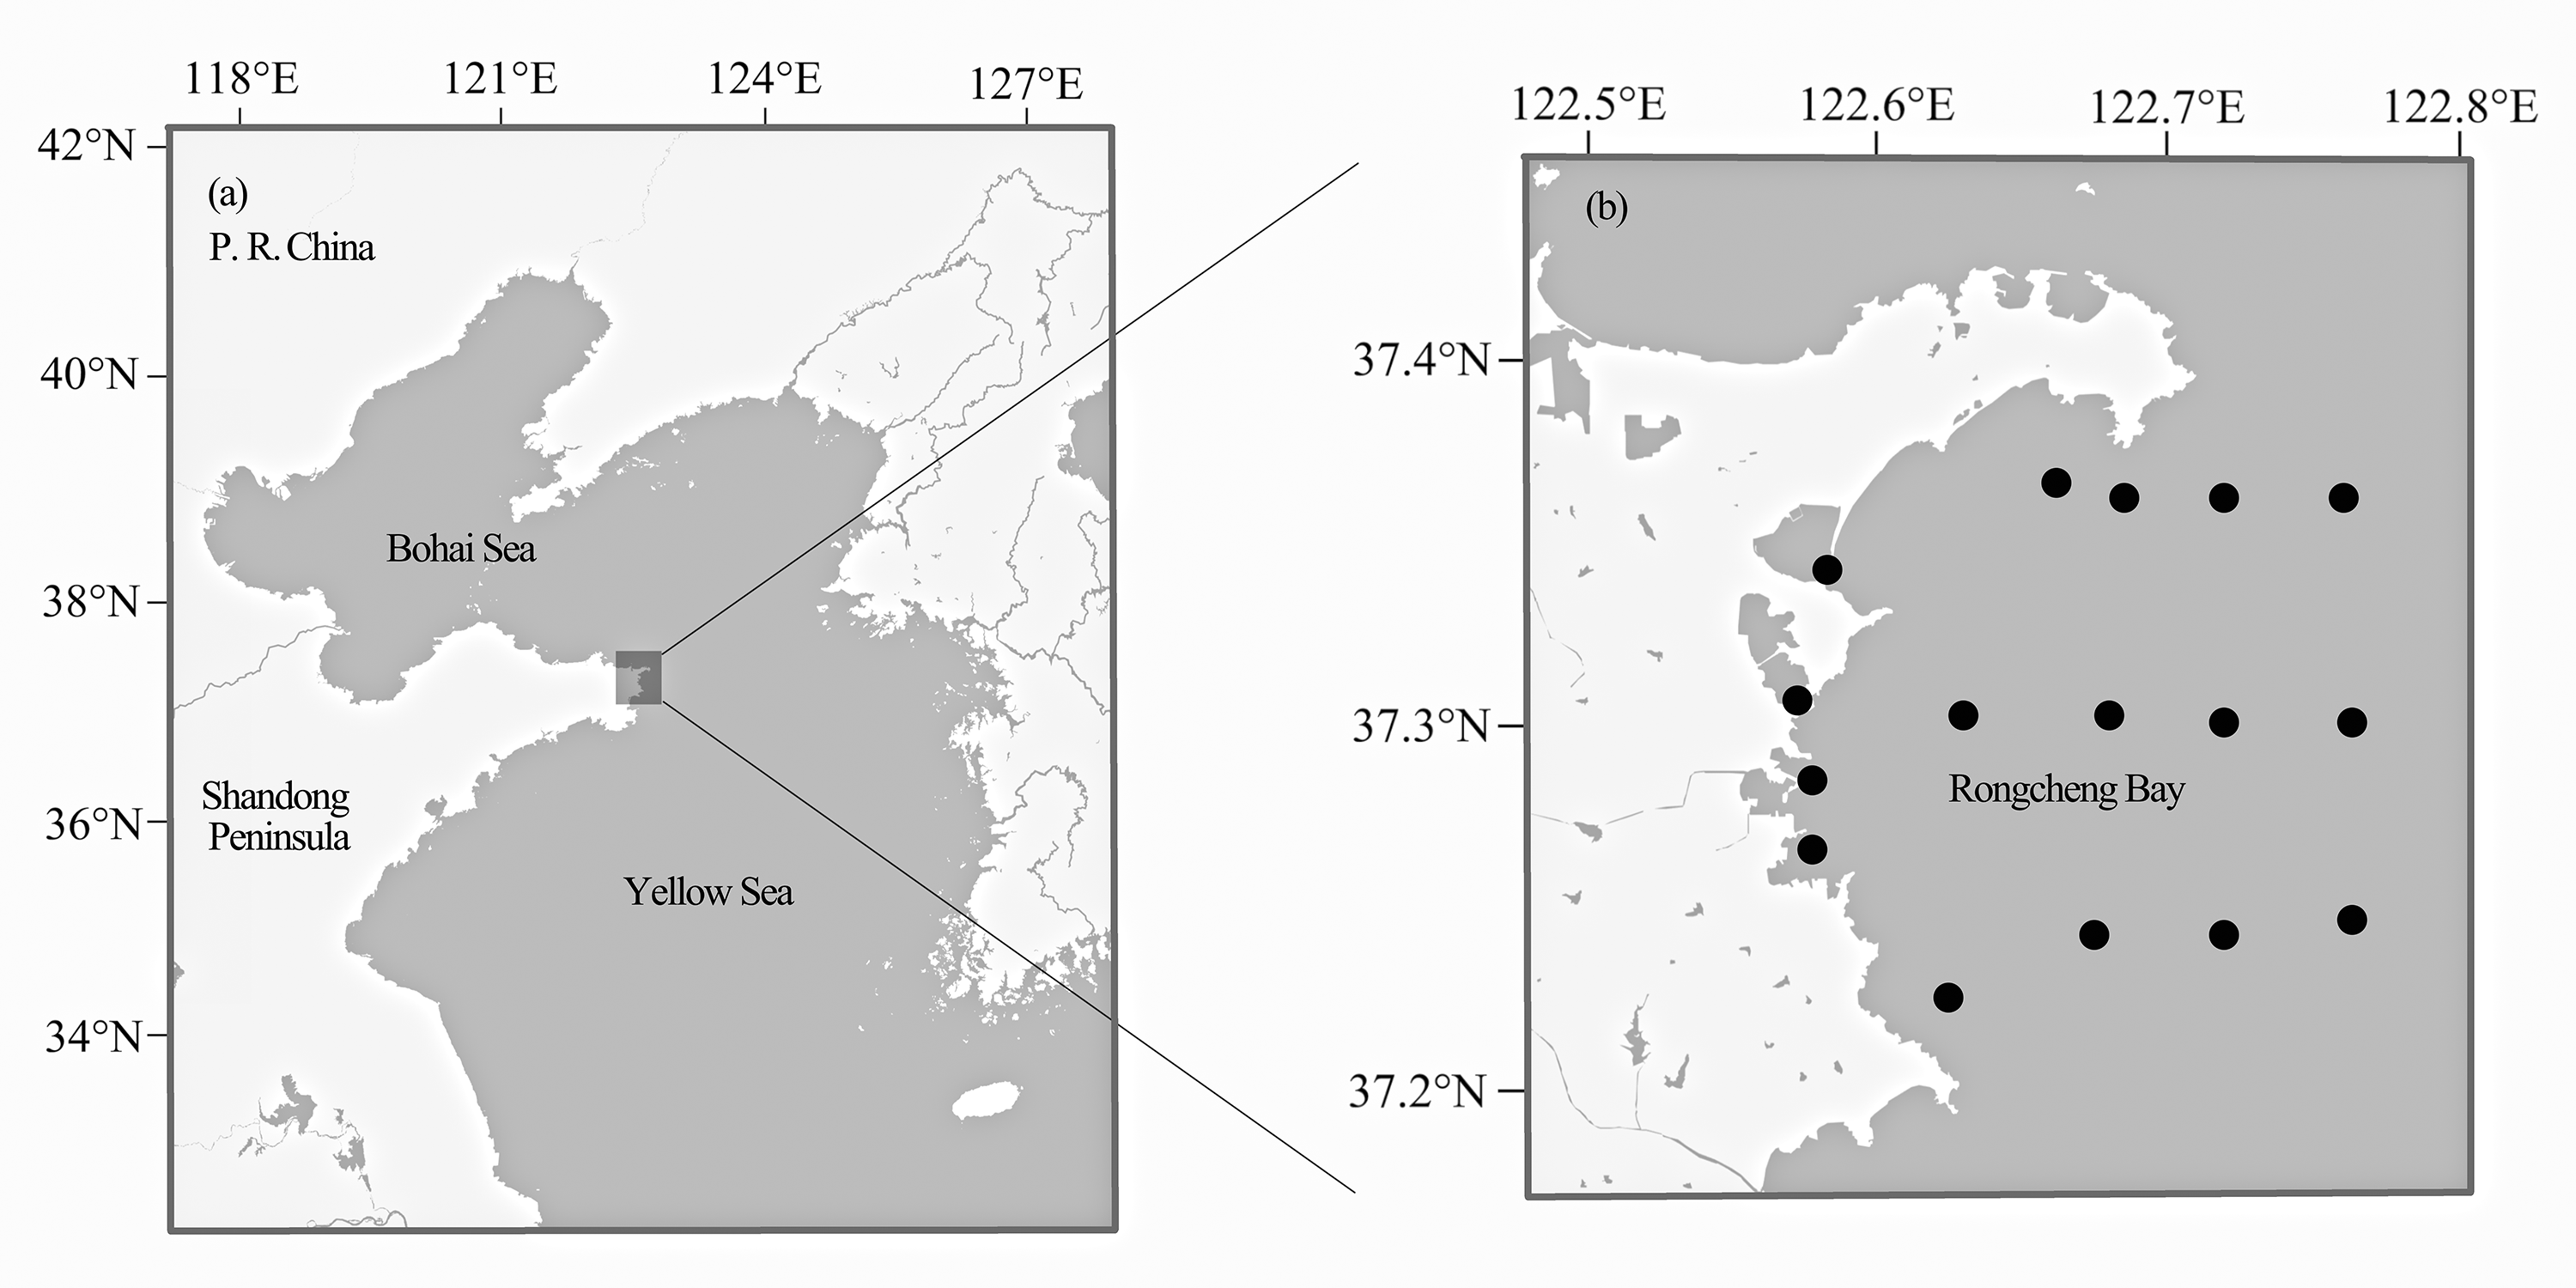
DNA extraction and PCR amplification
Total genomic DNA was extracted from muscle tissue by salt extraction (Aljanabi & Martinez, 1997). Concentration and purity of the extracted DNA were measured using a NanoDrop 2000 spectrophotometer (Thermo Scientific, Wilmington, DE, USA). Approximately 650 bp was amplified from the 5′ region of the mitochondrial COI gene using different combinations of the following primers designed by Ward et al. (2005).
FishF1 5′-TCAACCAACCACAAAGACATTGGCAC-3′
FishF2 5′-TCGACTAATCATAAAGATATCGGCAC-3′
FishR1 5′-TAGACTTCTGGGTGGCCAAAGAATCA-3′
FishR2 5′-ACTTCAGGGTGACCGAAGAATCAGAA-3′
The 50-µl PCR mixtures included 5 µl of 10 × PCR buffer, 2.5 µl of MgCl2 (50 mM), 1 µl of dNTP (0.05 mM), 2 µl of each primer (0.01 mM), 0.125µl of each dNTP (0.05 mM), 1.25 U of Taq polymerase, 2.0 µl of DNA template, and ultrapure water to 50 µl. The amplification procedure consisted of an initial denaturation step at 95 °C for 5 min, followed by 35 cycles at 95 °C for 30 s, 52 °C 30 s, and 72 °C for 60 s, then a final extension at 72 °C for 10 min. PCR products were visualized on 1.2% agarose gels and purified by the EZNA TM gel extraction kit (Omega Bio-Tek, Norcross, GA, USA). The purified PCR products were sent to Shanghai Sunny Biotechnology Co. Ltd., China, for bidirectional sequencing using an ABI 3730 capillary sequencer (Applied Biosystems, Foster City, CA, USA).
DNA sequence analysis
The DNA sequences were assembled, aligned, and annotated using BioEdit software (Hall, 1999). The obtained sequences were double compared to sequences of fishes in both GenBank and BOLD databases, and the similarity index with available sequences of same fish species from databases were over 98% for all sequences. Distance-and character-based DNA barcoding methods for species discrimination were used in this study. Pairwise genetic distances were calculated using the Kimura 2-parameter (K2P) distance model (Kimura, 1980). Neighbor-joining (NJ) trees of K2P distances with 1,000 bootstrap replications (Saitou & Nei, 1987) were generated to provide a graphic representation of the patterning of divergence between species. The K2P distance and the neighbor-joining (NJ) tree were calculated and generated using MEGA version 5 (Tamura et al., 2011). BLOG 2.0 (Weitschek et al., 2013) was used for character-based identification of fish species represented by more than two individuals. The COI sequences of Cynoglossus joyneri and Cynoglossus lighti downloaded from GenBank (accession numbers: GU479053.1, JQ738602.1, JQ738613.1, DQ116752.1, JQ738430.1, JQ738456.1, JQ738468.1, KF979127.1, HQ711865.1) together with the sequences generated from this study were used to construct the NJ tree with 1000 bootstrap replications by using MEGA.
Results
A total of 187 COI sequences (GenBank accession numbers: KU236800–KU236892 and KY275270–KY275363) were obtained from 41 fish species belonging to 28 families and nine orders (Table 1). Sequence lengths ranged from 605 to 655 bp, with an average of 635 bp. No stop codons, insertions, or deletions were observed in any of the amplified sequences. The overall average nucleotide composition of the sequences was 23.5% A, 29.2% T, 18.7% G, and 28.5% C, with an A + T bias (Table 2). The percent GC content of five fish species, namely Chelidonichthys kumu, Neosalanx anderssoni, Lateolabrax japonicus, Saurida elongata, and Zoarces elongatus, was found to be more than 50% (Table 3). Among these, N. anderssoni (Osmeriformes) showed the highest GC content (53.4%). Among the other 36 species, Pterogobius zacalles (Perciformes) showed the lowest GC content (41.4%).
| Order | Family | Species | N | GenBank Accession no. |
|---|---|---|---|---|
| Scorpaeniformes | Sebastidae | Sebastes schlegelii | 10 | KU236800, KU236801, KU236802, KU236803, KU236804, KU236805, KU236806, KU236807, KU236808, KY275270 |
| Sebastes koreanus | 10 | KY275271, KY275272, KY275273, KY275274, KY275275, KY275276, KY275277, KY275278, KY275279, KY275280 | ||
| Liparidae | Liparis tanakae | 3 | KU236809, KU236810, KY275281 | |
| Liparis chefuensis | 1 | KY275282 | ||
| Hemitripteridae | Hemitripterus villosus | 3 | KU236811, KU236812, KU236813 | |
| Platycephalidae | Platycephalus indicus | 1 | KU236814 | |
| Triglidae | Chelidonichthys kumu | 5 | KU236815, KU236816, KU236817, KU236818, KU236819 | |
| Hexagrammidae | Hexagrammos otakii | 10 | KU236820, KU236821, KU236822, KU236823, KY275283, KY275284, KY275285, KY275286, KY275287, KY275288 | |
| Hexagrammos agrammus | 10 | KY275289, KY275290, KY275291, KY275292, KY275293, KY275294, KY275295, KY275296, KY275297, KY275298 | ||
| Pleuronectiformes | Pleuronectidae | Kareius bicoloratus | 3 | KU236824, KU236825, KU236826 |
| Pseudopleuronectes yokohamae | 3 | KY275299, KY275300, KY275301 | ||
| Paralichthyidae | Paralichthys olivaceus | 7 | KU236827, KU236828, KU236829, KU236830, KU236831, KU236832, KU236833 | |
| Cynoglossidae | Cynoglossus joyneri | 5 | KU236834, KU236835, KY275302, KY275303, KY275304 | |
| Cynoglossus lighti | 3 | KU236836, KU236837, KU236838 | ||
| Perciformes | Ammodytidae | Ammodytes personatus | 1 | KU236839 |
| Pholidae | Pholis fangi | 6 | KU236840, KU236841, KU236842, KU236843, KU236844, KU236845 | |
| Pholis crassispina | 10 | KY275305, KY275306, KY275307, KY275308, KY275309, KY275310, KY275311, KY275312, KY275313, KY275314 | ||
| Stichaeidae | Chirolophis japonicus | 10 | KU236846, KU236847, KU236848, KY275315, KY275316, KY275317, KY275318, KY275319, KY275320, KY275321 | |
| Ernogrammus hexagrammus | 1 | KY275322 | ||
| Zoarcidae | Zoarces elongatus | 10 | KU236849, KU236850, KU236851, KU236852, KU236853, KU236854, KY275323, KY275324, KY275325, KY275326 | |
| Gobiidae | Chaeturichthys stigmatias | 8 | KU236855, KU236856, KY275327, KY275328, KY275329, KY275330, KY275331, KY275332 | |
| Synechogobius ommaturus | 10 | KY275333, KY275334, KY275335, KY275336, KY275337, KY275338, KY275339, KY275340, KY275341, KY275342 | ||
| Acanthogobius flavimanus | 6 | KY275343, KY275344, KY275345, KY275346, KY275347, KY275348 | ||
| Pterogobius zacalles | 5 | KY275349, KY275350, KY275351, KY275352, KY275353 | ||
| Sciaenidae | Larimichthys polyactis | 1 | KU236857 | |
| Pennahia argentata | 5 | KU236858, KU236859, KU236860, KU236861, KU236862 | ||
| Sillaginidae | Sillago japonica | 1 | KU236863 | |
| Apogonidae | Apogon lineatus | 3 | KU236864, KU236865, KU236866 | |
| Sparidae | Acanthopagrus schlegelii | 2 | KU236867, KY275354 | |
| Scombridae | Scomber japonicus | 1 | KU236868 | |
| Saurida elongata | 1 | KU236869 | ||
| Percichthyidae | Lateolabrax japonicus | 3 | KY275355, KY275356, KY275357 | |
| Anguilliformes | Congridae | Conger myriaster | 10 | KU236870, KU236871, KU236872, KU236873, KU236874, KY275358, KY275359, KY275360, KY275361, KY275362 |
| Osmeriformes | Salangidae | Neosalanx anderssoni | 1 | KU236875 |
| Lophiiformes | Lophiidae | Lophius litulon | 2 | KU236876, KU236877 |
| Tetraodontiformes | Monacanthidae | Thamnaconus modestus | 1 | KU236878 |
| Tetraodontidae | Takifugu niphobles | 1 | KY275363 | |
| Clupeiformes | Clupeidae | Konosirus punctatus | 2 | KU236879, KU236880 |
| Engraulidae | Engraulis japonicus | 1 | KU236881 | |
| Thryssa kammalensis | 5 | KU236882, KU236883, KU236884, KU236885, KU236886 | ||
| Rajiformes | Rajidae | Okamejei kenojei | 6 | KU236887, KU236888, KU236889, KU236890, KU236891, KU236892 |
Notes:
- N
-
number of specimens
| Mean | Minimum | Maximum | Standard error | |
|---|---|---|---|---|
| A% | 23.5 | 20.6 | 26.8 | 0.1098 |
| T% | 29.2 | 25.7 | 34.3 | 0.1475 |
| C% | 28.5 | 24.3 | 34.4 | 0.1475 |
| G% | 18.7 | 16.2 | 21.0 | 0.0694 |
| GC% | 47.3 | 41.4 | 53.4 | 0.1912 |
| GC% codon 1st position | 56.6 | 54.1 | 58.9 | 0.3626 |
| GC% codon 2nd position | 43.0 | 41.5 | 44.7 | 0.0401 |
| GC% codon 3rd position | 42.2 | 24.8 | 60.3 | 0.5717 |
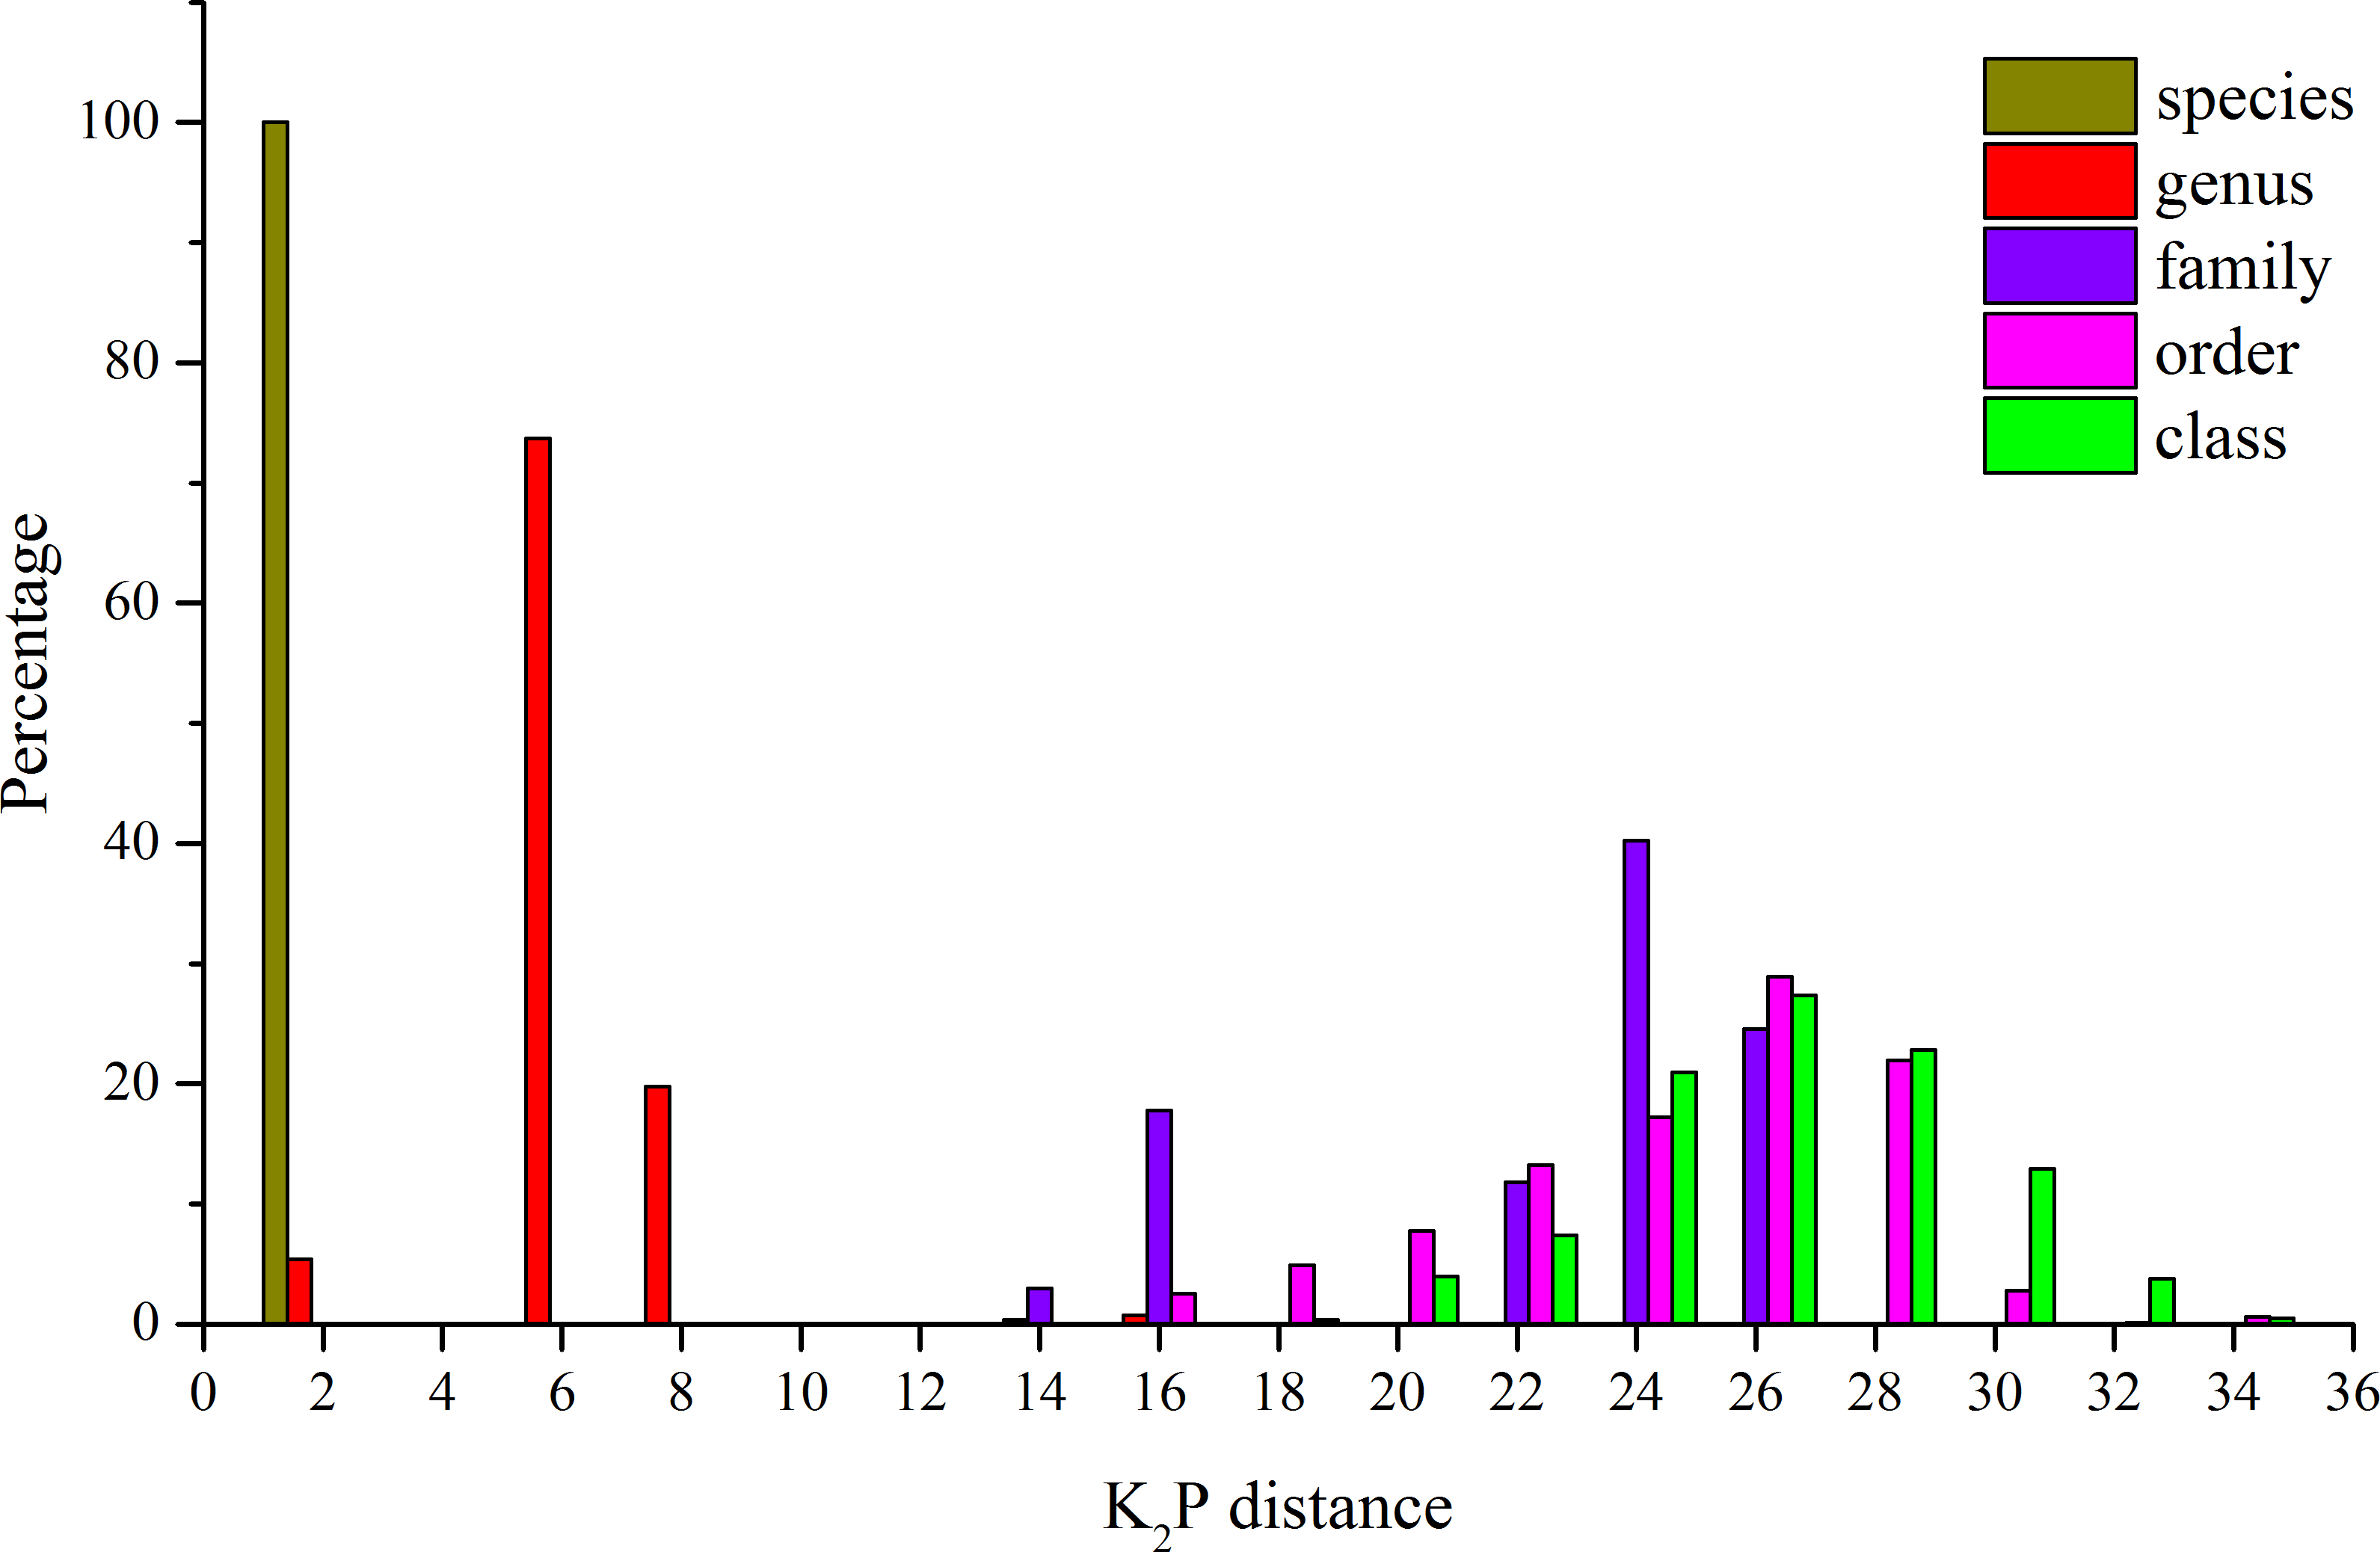
The K2P genetic distances within each taxonomic level are summarized in Table 4. The average genetic distance using K2P analysis of individuals within species was 0.21% (Table 4). Within genera, families, and orders, the distances were 5.28%, 21.30%, and 23.63%, respectively (Table 4). An increase in genetic variation at increasing taxonomic levels was observed, but the rate of increase declined in the higher taxonomic categories (Fig. 2). In this study, some species were represented by a single specimen, but for the majority of the species (29), multiple specimens were analyzed (Table 1) and character-based analyses successfully identified those species. The BLOG method of species diagnosis is based only on nucleotides of specific sites in particular taxa, and these diagnostic sites are referred to as nucleotide diagnostics (ND). Thirteen species were identified with two ND, while the other species were diagnosed using an ND of three to four nucleotide positions in combination (Table 5).
| Species | T | C | A | G | GC |
|---|---|---|---|---|---|
| Sebastes schlegelii | 28.96 ± 0.05 | 28.52 ± 0.05 | 23.90 ± 0.05 | 18.61 ± 0.05 | 47.13 ± 0.08 |
| Sebastes koreanus | 28.99 ± 0.09 | 28.99 ± 0.05 | 23.86 ± 0.10 | 18.17 ± 0.08 | 47.15 ± 0.09 |
| Liparis tanakae | 29.25 ± 0.00 | 29.25 ± 0.00 | 23.48 ± 0.09 | 18.02 ± 0.09 | 47.27 ± 0.09 |
| Liparis chefuensis | 31.88 ± 0.00 | 26.86 ± 0.00 | 23.95 ± 0.00 | 17.31 ± 0.00 | 44.17 ± 0.00 |
| Hemitripterus villosus | 28.25 ± 0.00 | 30.16 ± 0.00 | 22.38 ± 0.00 | 19.21 ± 0.00 | 49.37 ± 0.00 |
| Platycephalus indicus | 27.45 ± 0.00 | 30.52 ± 0.00 | 22.85 ± 0.00 | 19.17 ± 0.00 | 49.69 ± 0.00 |
| Chelidonichthys kumu | 26.73 ± 0.00 | 32.50 ± 0.10 | 21.30 ± 0.20 | 19.50 ± 0.20 | 52.00 ± 0.20 |
| Hexagrammos otakii | 29.59 ± 0.07 | 28.96 ± 0.07 | 21.88 ± 0.11 | 19.57 ± 0.11 | 48.53 ± 0.08 |
| Hexagrammos agrammus | 29.66 ± 0.00 | 29.06 ± 0.00 | 22.06 ± 0.07 | 19.23 ± 0.07 | 48.29 ± 0.07 |
| Kareius bicoloratus | 26.42 ± 0.00 | 29.25 ± 0.00 | 24.00 ± 0.09 | 20.34 ± 0.09 | 49.58 ± 0.09 |
| Pseudopleuronectes yokohamae | 26.56 ± 0.00 | 30.08 ±0.00 | 24.68 ± 0.09 | 18.68 ± 0.09 | 48.75 ± 0.09 |
| Paralichthys olivaceus | 28.34 ± 0.08 | 29.70 ± 0.06 | 24.03 ± 0.09 | 17.93 ± 0.06 | 47.63 ± 0.12 |
| Cynoglossus joyneri | 30.46 ± 0.14 | 26.58 ± 0.07 | 26.23 ± 0.10 | 16.73 ± 0.11 | 43.31 ± 0.15 |
| Cynoglossus lighti | 29.89 ± 0.00 | 26.55 ± 0.00 | 26.34 ± 0.09 | 17.22 ± 0.09 | 43.77 ± 0.09 |
| Ammodytes personatus | 30.20 ± 0.00 | 28.79 ± 0.00 | 22.22 ± 0.00 | 18.78 ± 0.00 | 47.57 ± 0.00 |
| Pholis fangi | 29.74 ± 0.07 | 28.73 ± 0.12 | 21.70 ± 0.07 | 19.83 ± 0.07 | 48.56 ± 0.10 |
| Pholis crassispina | 30.71 ± 0.13 | 27.58 ± 0.13 | 21.93 ± 0.08 | 19.79 ± 0.15 | 47.37 ± 0.15 |
| Chirolophis japonicus | 29.83 ± 0.08 | 27.92 ± 0.08 | 22.91 ± 0.11 | 19.34 ± 0.11 | 47.26 ± 0.00 |
| Ernogrammus hexagrammus | 29.67 ± 0.00 | 28.26 ± 0.00 | 24.02 ± 0.00 | 18.05 ± 0.00 | 46.31 ± 0.00 |
| Zoarces elongatus | 26.01 ± 0.19 | 32.81 ± 0.16 | 21.71 ± 0.17 | 19.47 ± 0.19 | 52.28 ± 0.23 |
| Chaeturichthys stigmatias | 31.10 ± 0.23 | 27.75 ± 0.23 | 23.76 ± 0.00 | 17.38 ± 0.00 | 45.14 ± 0.23 |
| Synechogobius ommaturus | 30.25 ± 0.09 | 27.28 ± 0.05 | 23.58 ± 0.06 | 18.89 ± 0.10 | 46.17 ± 0.11 |
| Acanthogobius flavimanus | 28.08 ± 0.00 | 28.71 ± 0.00 | 24.13 ± 0.00 | 19.09 ± 0.00 | 47.97 ± 0.00 |
| Pterogobius zacalles | 34.30 ± 0.00 | 25.24±0.00 | 24.27 ± 0.00 | 16.18 ± 0.00 | 41.42 ± 0.00 |
| Larimichthys polyactis | 26.11 ± 0.00 | 30.38 ± 0.00 | 24.53 ± 0.00 | 18.99 ± 0.00 | 49.37 ± 0.00 |
| Pennahia argentata | 28.30 ± 0.20 | 29.70 ±0.30 | 23.60 ± 0.10 | 18.40 ± 0.10 | 48.00 ± 0.20 |
| Sillago japonica | 30.00 ± 0.00 | 27.80 ± 0.00 | 22.60 ± 0.00 | 19.60 ± 0.00 | 47.40 ± 0.00 |
| Apogon lineatus | 29.62 ± 0.00 | 27.87 ± 0.00 | 24.36 ± 0.00 | 18.15 ± 0.00 | 46.02 ± 0.00 |
| Acanthopagrus schlegelii | 31.00 ± 0.13 | 26.63±0.32 | 24.49 ± 0.16 | 17.88 ± 0.34 | 44.51 ± 0.02 |
| Scomber japonicus | 27.40 ± 0.00 | 30.20 ± 0.00 | 22.60 ± 0.00 | 19.80 ± 0.00 | 50.00 ± 0.00 |
| Saurida elongata | 28.97 ± 0.00 | 30.53 ± 0.00 | 20.56 ± 0.00 | 19.94 ± 0.00 | 50.47 ± 0.00 |
| Lateolabrax japonicus | 26.71 ± 0.09 | 31.94 ± 0.09 | 22.60 ± 0.28 | 18.75 ± 0.28 | 50.69 ± 0.37 |
| Conger myriaster | 31.39 ± 0.00 | 24.35 ± 0.00 | 26.68 ± 0.06 | 17.58 ± 0.08 | 41.93 ± 0.06 |
| Neosalanx anderssoni | 25.80 ± 0.00 | 34.35 ± 0.00 | 20.76 ± 0.00 | 19.08 ± 0.00 | 53.44 ± 0.00 |
| Lophius litulon | 27.04 ± 0.00 | 29.40 ± 0.00 | 24.37 ± 0.00 | 19.18 ± 0.00 | 48.58 ± 0.00 |
| Thamnaconus modestus | 29.13 ± 0.00 | 28.80 ± 0.00 | 23.14 ± 0.00 | 18.93 ± 0.00 | 47.73 ± 0.00 |
| Takifugu niphobles | 28.06 ± 0.00 | 29.39 ± 0.00 | 24.52 ± 0.00 | 18.02 ± 0.00 | 47.42 ± 0.00 |
| Konosirus punctatus | 28.03 ± 0.00 | 28.82 ± 0.00 | 22.13 ± 0.00 | 21.02 ± 0.00 | 49.84 ± 0.00 |
| Engraulis japonicus | 25.96 ± 0.22 | 32.82 ± 0.19 | 21.73 ± 0.22 | 19.49 ± 0.17 | 52.32 ± 0.28 |
| Thryssa kammalensis | 29.72 ± 0.22 | 25.63 ± 0.11 | 26.26 ± 0.00 | 18.40 ± 0.00 | 44.03 ± 0.11 |
| Okamejei kenojei | 27.12 ± 0.06 | 29.74 ± 0.08 | 24.87 ± 0.16 | 18.28 ± 0.19 | 48.02 ± 0.22 |
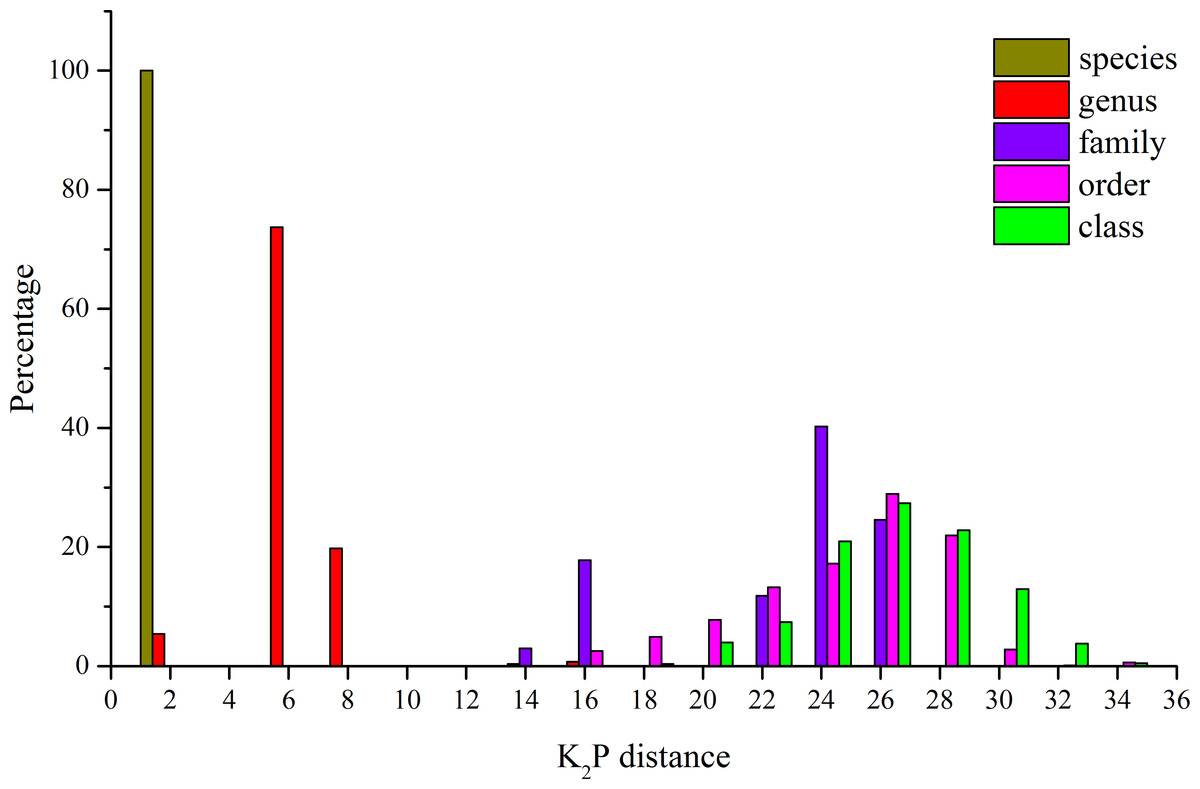
Figure 2: Distribution of K2P distances (percent) for mitochondrial COI at different taxonomic levels for the 41 species analyzed.
| Comparisons within | Distance | Standard error | ||
|---|---|---|---|---|
| Mean | Minimum | Maximum | ||
| Species | 0.21 | 0.00 | 1.91 | 0.0120 |
| Genera | 5.28 | 0.00 | 14.05 | 0.0965 |
| Families | 21.30 | 7.45 | 25.72 | 0.2325 |
| Orders | 23.63 | 14.41 | 33.05 | 0.0506 |
| Classes | 25.24 | 17.54 | 33.88 | 0.0265 |
A phylogenetic NJ tree was generated based on all individuals’ DNA barcode sequences (Fig. 3). Most individuals from each species belonged to single monophyletic clusters, except for Cynoglossus joyneri and Cynoglossus lighti. Instead of forming two separate branches, these individuals clustered under a single node. In order to validate our sequences, additional COI sequences of these species were downloaded from GenBank and analyzed together with the sequences generated from our study. The resulting NJ tree (Fig. 4) showed that the C. joyneri and C. lighti voucher sequences were also non-monophyletic. The K2P distances within C. joyneri ranged from 0% to 1.23%, with an average value of 0.48%, and the values within C. lighti ranged from 0.35% to 0.70%, with an average value of 0.53%. The minimum, maximum, and average K2P distances between C. joyneri and C. lighti were 0%, 1.23%, and 0.48%, respectively.
Figure 3: Neighbor-joining (NJ) tree of 187 COI sequences from 41 fish species, using K2P distances.
This phylogenetic tree was constructed using the NJ method, and bootstrap analysis with 1,000 replicates was used to assess the strength of the nodes.
Figure 4: NJ tree using K2P distances of COI sequences of Cynoglossus joyneri and Cynoglossus lighti.
This phylogenetic tree was constructed using the NJ method, and bootstrap analysis with 1,000 replicates was used to assess the strength of the nodes.
| Species | NDs |
|---|---|
| Sebastes schlegelii | C-250+A-286+A-493 |
| Sebastes koreanus | T-206+C-T-231+A-474 |
| Liparis tanakae | T-251+A-287+T-494 |
| Hemitripterus villosus | C-252+A-288+T-495 |
| Chelidonichthys kumu | C-327+G-501 |
| Hexagrammos otakii | C-251+T-320+A-494 |
| Hexagrammos agrammus | T-251+T-287+T-320+A-494 |
| Kareius bicoloratus | C-291+A-327+A-501 |
| Pseudopleuronectes yokohamae | C-274+T-310+A-343 |
| Paralichthys olivaceus | A-242+C-311 |
| Cynoglossus joyneri | C-276+T-309+T-483 |
| Cynoglossus lighti | T-320+C-494 |
| Pholis fangi | A-284+C-491 |
| Pholis crassispina | G-310+C-517 |
| Chirolophis japonicus | T-259+G-295+T-502 |
| Zoarces elongatus | C-241+G-277+T-484 |
| Chaeturichthys stigmatias | T-249+C-285+C-318 |
| Synechogobius ommaturus | T-296+G-329 |
| Acanthogobius flavimanus | A-253+G-322 |
| Pterogobius zacalles | C-240+T-256+C-309 |
| Pennahia argentata | G-286+G-493 |
| Apogon lineatus | C-286+T-319+A-493 |
| Acanthopagrus schlegelii | T-179+A-259 |
| Lateolabrax japonicus | T-163+C-279+A-486 |
| Conger myriaster | A-274+A-310 |
| Lophius litulon | T-250+C-286+G-319 |
| Konosirus punctatus | T-286+A-493 |
| Thryssa kammalensis | A-294+G-501 |
| Okamejei kenojei | A-321+T-495 |
Discussion
Traditional morphological species identification requires experienced taxonomists, and the phenotypic plasticity of taxa may lead to misidentifications. The DNA barcoding method has been proven to be an effective tool for species identification, particularly with specimens that are damaged, incomplete, or consisting of several morphologically distinct stages. Nevertheless, DNA barcoding also has limitations. In some cases, related species may present identical sequences making DNA barcodes useless for species discrimination. Therefore, DNA barcoding can serve as a complementary tool for the identification of species, but it cannot replace morphological taxonomic analyses (Pečnikar & Buzan, 2014). In this study, DNA barcode analysis based on the COI gene was able to identify most fishes in Rongcheng Bay, and the identification results were in agreement with that of morphological identification. DNA barcoding was successfully used to identify the marine ichthyofauna assignment in other geographic regions (for example, the Mediterranean Sea, Landi et al., 2014). In this study, a reliable DNA barcode reference library for the fish in Rongcheng Bay was established, which could be used to assign fish species by screening sequences against it in the future. This would contribute to achieving better monitoring, conservation, and management of fisheries in this area.
The variation of GC content affects different codon positions. Generally, the second codon position shows the lowest variation and the third codon position shows the largest range of variation (Min & Hickey, 2007), which is consistent with our results (Table 2). These differences between the codon positions may reflect the degree of selective constraint, therefore GC content could provide a significant insight into the nature of selective pressures impacting nucleotide usage (Clare et al., 2008). GC content was also proved to be correlated with some bio-functions, such as DNA helix (Vinogradov, 2003) and gene expression (Quax et al., 2015). The mitochondrial GC shifts in nucleotide composition can be explained by mutational biases, natural selection (Mooers & Holmes, 2000) and other factors, such as environmental temperature (Bernardi & Bernardi, 1986) and amino acid content (Foster & Hickey, 1999). The sequences obtained in this study, together with other datasets, may facilitate further investigation of these hypotheses.
Although it is highly controversial (Srivathsan & Meier, 2012), the distance-based technique remains as the standard approach in DNA barcoding (Reid et al., 2011). In this study, the K2P model was used in this study to ensure consistency and comparability with other barcoding studies. The intraspecific genetic divergence (about 0.2%) was much smaller than the interspecific genetic divergence (about 10%) in Rongcheng Bay (with the exception of C. joyneri and C. lighti). These results indicate that using COI gene sequences as DNA barcodes to discriminate fish species in Rongcheng Bay is feasible. Increasing average genetic distance values were obtained at increasing taxonomic levels in this study. The average genetic distances between individuals within species, genera, families, and orders were 0.21%, 5.28%, 21.3%, and 23.63%, respectively, consistent with the patterns observed in other fish barcoding studies. For example, the K2P values of Australian fish within species, families, and orders were 0.39%, 15.46%, and 22.18%, respectively (Ward et al., 2005); the values of Indian marine fishes were 0.30% within species, 9.91% within families, and 16.00% within orders (Lakra et al., 2011); and the values of fishes from South China Sea within species, families, and orders were 0.32%, 20.20%, and 24.66%, respectively (Zhang, 2011).
Most of the 41 fishes in this study have been recorded previously in the Yellow Sea (Liu & Ning, 2011; Yu et al., 2013; Wang et al., 2016). According to Liu & Ning (2011), five of these fish are warm water species, 20 are warm-temperate species, and 16 are cold-temperate species (Table 6). No cold-water species were present. However, cold-temperate fish accounted for a high proportion of the species were observed (39% of the total) in this study. This may be a result of the Yellow Sea cold water mass, wherein a 70-80 meter depression in the central part of the Yellow Sea (He, Wang & Lei, 1959), holds cold water throughout the year and provides an important habitat for cold-temperate fish. Based on the literature and fish databases (Froese & Pauly, 1998; Liu & Ning, 2011; Shao, 2011), the habitat preferences of these 41 fish species can be grouped into five categories. In the most dominant category, 31 were associated with continental shelf demersal habitats. The other species sampled included two continental shelf reef-associated species, four continental shelf pelagic-neritic species, three oceanic pelagic species, and one oceanic bathydemersal species. The species composition in Rongcheng Bay is similar to that in other bays along the coast of the Yellow Sea, such as Laizhou Bay and Jiaozhou Bay (Xu et al., 2013; Sun et al., 2014). However, these regions do not yet have an analogous DNA barcoding database for comparison with our study.
| Species | Economic value | Suitable temperature | Habitat type | Occurrence Seasons | |||
|---|---|---|---|---|---|---|---|
| Spring | Summer | Autumn | Winter | ||||
| Sebastes schlegelii | H | CT | CD | + | + | + | + |
| Sebastes koreanus | N | CT | CD | + | + | + | |
| Liparis tanakae | L | CT | CD | + | + | + | + |
| Liparis chefuensis | L | CT | CD | + | |||
| Hemitripterus villosus | N | CT | CD | + | |||
| Platycephalus indicus | H | WW | CRA | + | + | + | |
| Chelidonichthys kumu | N | WT | CD | + | + | ||
| Hexagrammos otakii | H | CT | CD | + | + | + | + |
| Hexagrammos agrammus | N | CT | CD | + | + | + | + |
| Kareius bicoloratus | H | CT | CD | + | + | + | |
| Pseudopleuronectes yokohamae | H | CT | CD | ||||
| Paralichthys olivaceus | H | WT | CD | + | + | ||
| Cynoglossus joyneri | N | WT | CD | + | + | + | + |
| Cynoglossus lighti | N | WT | CD | + | + | ||
| Ammodytes personatus | N | CT | CD | + | + | + | + |
| Pholis fangi | L | CT | CD | + | + | + | |
| Pholis crassispina | L | CT | CD | + | + | + | + |
| Chirolophis japonicus | N | CT | CD | + | |||
| Ernogrammus hexagrammus | L | CT | CD | + | |||
| Zoarces elongatus | N | CT | CD | + | + | + | |
| Chaeturichthys stigmatias | L | WT | CD | + | + | + | |
| Synechogobius ommaturus | N | WT | CD | + | + | + | + |
| Acanthogobius flavimanus | L | CT | CD | + | + | + | + |
| Pterogobius zacalles | L | WT | CD | + | + | + | |
| Larimichthys polyactis | H | WT | CBD | + | |||
| Pennahia argentata | H | WW | CBD | + | |||
| Sillago japonica | N | WW | CD | + | |||
| Apogon lineatus | L | WT | CD | + | |||
| Acanthopagrus schlegelii | H | WT | CD | + | |||
| Scomber japonicus | H | WW | CPN | + | |||
| Saurida elongata | H | WT | CD | + | |||
| Lateolabrax japonicus | H | WT | CRA | + | + | ||
| Conger myriaster | H | WT | CD | + | + | + | |
| Neosalanx anderssoni | N | WT | CD | + | |||
| Lophius litulon | N | WT | OMP | + | + | ||
| Thamnaconus modestus | N | WT | CRA | + | |||
| Takifugu niphobles | N | WT | CD | + | |||
| Konosirus punctatus | N | WT | CPN | + | |||
| Engraulis japonicus | N | WT | CPN | + | |||
| Thryssa kammalensis | N | WW | CPN | + | |||
| Okamejei kenojei | H | WT | CD | + | + | + | + |
Notes:
- H
-
high economic value species
- N
-
normal economic value species
- L
-
low economic value species
- WT
-
warm-temperate species
- WW
-
warm water species
- CT
-
cold-temperate species
- CW
-
cold water species
- CD
-
continental shelf demersal fish
- CBD
-
continental shelf benthopelagic fish
- CPN
-
continental shelf pelagic-neritic fish
- CRA
-
continental shelf reef-associated fish
- OMP
-
oceanic bathydemersal fish
Of the 41 species sampled in this study, there are 14 with high commercial value (Table 6). Some traditionally and economically important fishes, such as Larimichthys polyactis and Scomber japonicus, were caught seldom or only once during our investigation. Meanwhile, some less-valuable species have become dominant, implying that fish species assemblages and population sizes in this area have changed in keeping with other reports (Jin & Tang, 1996; Jin, 2003; Xu & Jin, 2005). Therefore, the economically valuable fish species should be better protected, and DNA barcoding of the ichthyofauna of this bay has contributed additional information toward this goal.
Finally, our study has brought to light an interesting relationship between two species belonging to the subfamily Cynoglossinae, C. joyneri and C. lighti, which exhibited genetic distances that were very small (from 0% to 1.23%). The resulting NJ tree showed that these two fishes did not form distinct monophyletic clusters and were not clearly separated from each other. Voucher sequences from GenBank were consistent with these findings. Moreover, the morphological taxonomy in the subfamily Cynoglossinae is contentious, and several disputes about species delimitation have arisen (Matsubara, 1955; Ochiai, 1963; Li & Wang, 1995). It is difficult to morphologically distinguish C. joyneri from C. lighti. The appearance of these two fishes is very similar, and the main differences are the number of lateral-line scales and the head to tail length ratio (Li & Wang, 1995). On a molecular level, our study did not find sufficient interspecific genetic differentiation to regard these species as truly separate. These results support the findings of Liu et al. (2010), who analyzed genetic differentiation among individuals of these two species using partial 16S rRNA and Cyt b mitochondrial gene sequences, and found that genetic differentiation in these gene sequences was small. On this basis, they hypothesized that C. joyneri and C. lighti are probably the same species. Owing to the limited number of samples and genes surveyed in our study we hesitate to say conclusively that they are conspecific, however. Further investigation combining morphological data and the divergence of multiple molecular markers, including nuclear genes, will be required to confirm the taxonomic status of C. joyneri and C. lighti.
Conclusions
Rongcheng Bay is a coastal bay of the Northern Yellow Sea, China, and its ichthyofauna has its own unique features. Therefore, it is very important to identify the fish species from this area. DNA barcoding is a molecular method that uses a short standardized DNA sequence of the mitochondrial COI as a species identification tool. In this study, 187 specimens from 41 different species belonging to 28 families in nine orders were DNA-barcoded. The average genetic distance using K2P analysis of individuals within species, genera, families, and orders were 0.21%, 5.28%, 21.30%, and 23.63%, respectively. There are no overlaps of pairwise genetic variations between conspecific and interspecific comparisons apart from the species Cynoglossus joyneri and Cynoglossus lighti in genus Cynoglossus. Our results confirm that DNA barcoding can be used as an effective tool for fast and accurate fish identification in Rongcheng Bay.