
The distribution shifts of Pinus armandii and its response to temperature and precipitation in China
- Published
- Accepted
- Received
- Academic Editor
- Hannah Buckley
- Subject Areas
- Climate Change Biology, Ecology, Ecosystem Science, Environmental Sciences, Plant Science
- Keywords
- Elevation, Pinus armandii, Tree distribution shift, Precipitation, Changing climate, Temperature
- Copyright
- © 2017 Zheng et al.
- Licence
- This is an open access article distributed under the terms of the Creative Commons Attribution License, which permits unrestricted use, distribution, reproduction and adaptation in any medium and for any purpose provided that it is properly attributed. For attribution, the original author(s), title, publication source (PeerJ) and either DOI or URL of the article must be cited.
- Cite this article
- 2017. The distribution shifts of Pinus armandii and its response to temperature and precipitation in China. PeerJ 5:e3807 https://doi.org/10.7717/peerj.3807
Abstract
Background
The changing climate, particularly in regard to temperature and precipitation, is already affecting tree species’ distributions. Pinus armandii, which dominates on the Yungui Plateau and in the Qinba Mountains in China, is of economic, cultural and ecological value. We wish to test the correlations between the distribution shift of P. armandii and changing climate, and figure out how it tracks future climate change.
Methods
We sampled the surface soil at sites throughout the distribution of P. armandii to compare the relative abundance of pollen to the current percent cover of plant species. This was used to determine possible changes in the distribution P. armandii. Given the hilly terrain, elevation was considered together with temperature and precipitation as variables correlated with distribution shifts of P. armandii.
Results
We show that P. armandii is undergoing change in its geographic range, including retraction, a shift to more northern areas and from the upper high part of the mountains to a lower-altitude part in hilly areas. Temperature was the strongest correlate of this distribution shift. Elevation and precipitation were also both significantly correlated with distribution change of P. armandii, but to a lesser degree than temperature.
Conclusion
The geographic range of P. armandii has been gradually decreasing under the influence of climate change. This provides evidence of the effect of climate change on trees at the species level and suggests that at least some species will have a limited ability to track the changing climate.
Introduction
Multiple lines of scientific study show that climate change strongly and rapidly affects the global ecosystem (Walther et al., 2002; Peñuelas & Filella, 2001), as well as animals and plants (Root et al., 2003). Forests in particular are an important part of the terrestrial ecosystem that are sensitive to climate change (Aber et al., 2001). Climate change will inevitably have an impact on forests, and considerable changes will occur in forests due to climate change (Parmesan, 2006). Climate change, including increasing temperature and precipitation, has also been identified as the primary regulator of plant distribution (Box, 1981) in altitudinal ranges (Parmesan, 2006; Groom, 2013).
P. armandii is a pine species native to China that occurs in southern Shaanxi, southern Gansu, western Sichuan, Yunnan and western Guizhou provinces. Its timber can be used for general building purposes, and the nuts and pollen powder are also of great economic value. P. armandii is the dominant pine tree species, and one of the most widely distributed tree species in natural forests and important forestry plantations in these areas. Obvious changes in temperature and precipitation have been observed and reported in these areas based on the climate data of the China Meteorological Administration; some researchers have cited these changes in their publications (Wang et al., 2004; Song, Yan & Ma, 2011; You, He & Duan, 2005; Ren et al., 2005). Forests are faced with the threat of deforestation (Malhi et al., 2008) and/or migration, starting with changes in the distribution of other tree species.
Climate-environment relationship models for different scenarios have been established to quantify the current influence of climate on plant distribution and to forecast their evolution (Heikkinen et al., 2006; Pearson et al., 2006) based on rigorous data and thorough validation assessments. Hutchinson (1957) developed a bioclimate envelope to define climatic components of an ecological niche that includes all the environmental variables affecting a species. The Spatial Evaluator of Climate Impacts on the Envelope of Species (SPECIES), by Pearson, Dawson & Berry (2002), employs an artificial neural network (ANN) to characterize bioclimate envelopes based on observed species distributions and five environmental inputs (derived primarily from climatic data and including a measure of the soil type). These ecosystem-climate modeling approaches require thoroughly assessed validation and strong databases, which makes it very difficult to employ the relevant models in regions with poor databases.
Surface pollen analysis essentially reflects the modern vegetation composition (Minckley & Whitlock, 2000), to some extent based on the pollen-vegetation calibration. Luo et al. (2009) presented a modern pollen–vegetation dataset based on surface soil samples in the mountainous areas of China. Their results indicated that surface pollen was correlated with the dominant vegetation community in the study regions. Understanding the relationship between modern pollen and vegetation is of great significance in detecting the impacts of climate on regional vegetation shift, including both temperature and precipitation (Zhang et al., 2010).
Hence, based on the surface pollen analysis, we were interested in the following:
-
Whether the distribution of P. armandii has been changing.
-
If it has been changing, what environmental variables are correlated with this change.
-
A rough forecast of future change in distribution.
Studying change in the geographic and altitudinal distribution of tree species in a mountain forest ecosystem in response to climate factors, mainly temperature and precipitation is meaningful for our understanding of both forests and the global ecosystem. We hope that our study of the distribution of P. armandii contributes to future studies on ecosystem structure and community succession.
Methods
Study area
The study area ranges from 101°33′ to 108°21′E and from 22°59′ to 34°34′N, encompassing the Yungui Plateau and the Qinba Mountains and including Shaanxi, Gansu, Sichuan, Yunnan and Guizhou provinces in the eastern part of western China. The Qinling Mountains consist of a deciduous forest region (Olson et al., 2001) across the 800-mm precipitation line of China. The common forest species are Pinus, Quercus, Picea, Ulmus, Larix, Acer, Fraxinus, Castanopsis, Celtis, Betula, Carpinus, and Abies, among others. The rainy climate and high altitude of the Yungui Plateau result in dense forests. Coniferous species such as Pinus, Larix, Tsuga, Picea, and Abies and evergreen families such as Magnoliaceae, Hamamelidaceae, Lauraceae, Theaceae, and Fagaceae are all widely distributed. Fifteen locations were determined to contain a natural Pinus distribution (Fig. 1).
Figure 1: Location of the study locations.
Field work
The detailed sampling features of each location are shown in Table 1. Most of the forests are in mountainous areas, so we performed distribution-centered vertical sampling. Surface pollen samplings were collected from all of the 297,20 × 20 m plots chosen by the natural distribution. The samples originated from pure and mixed forests in which Pinus is in or around. We chose the sampling point to be the center of the corresponding plot. All samplings occurred away from roadside, where human disturbance was negligible. The plant coverage of Pinus was calculated separately in each plot, using the number of Pinus trees divided by total arbor number, including shrubs higher than 2 m.
| Location | Number of plot | Province | Coordinate | Coverage range (elevation) |
|---|---|---|---|---|
| Maiji mountain | 15 | Gansu | 34°34′N 105°52′E | 1,200 m–1,700 m |
| Taibai Mountain | 15 | Shaanxi | 33°57′N 107°45′E | 1,500 m–2,300 m |
| Huoditang | 24 | Shaanxi | 33°18′N 108°21′E | 1,500 m–2,100 m |
| Mount Hua | 20 | Shaanxi | 34°25′N 109°57′E | 1,200 m–1,800 m |
| Jiuzhaigou | 15 | Sichuan | 32°54′N 103°46′E | 2,000 m–2,200 m |
| Aba | 15 | Sichuan | 32°01′N 102°34′E | 2,100 m–2,300 m |
| Zoige | 9 | Sichuan | 33°29′N 103°31′E | 2,400 m–2,500 m |
| Chuxiong | 24 | Yunnan | 25°02′N 101°33′E | 1,000 m–2,800 m |
| Pingbian | 24 | Yunnan | 22°59′N 103°41′E | 800 m–1,400 m |
| Zhanyi | 24 | Yunnan | 25°41′N 103°50′E | 1,000 m–2,100 m |
| Yiliang | 16 | Yunnan | 24°55′N 103°11′E | 1,000 m–3,400 m |
| Weining | 24 | Guizhou | 26°52′N 104°17′E | 1,400 m–2,300 m |
| Panxian | 24 | Guizhou | 25°43′N 104°28′E | 1,000 m–2,500 m |
| Qianxi | 24 | Guizhou | 27°02′N 106°01′E | 1,200 m–1,600 m |
| Ziyun | 24 | Guizhou | 25°26′N 105°46′E | 1,000 m–1,400 m |
Laboratory and data analysis
Pinus has an overrepresented pollen type, which means that the percentage of pollen is larger than that of the plant cover; however, its pollen percentage is still related to plant cover (Xu et al., 2007). According to Li & Yao (1990), Pinus individuals should be found in plots where the percentage of Pinus surface pollen is higher than 30%, considering the Pinus pollen dispersal kernels, including wind and other population sources, which is to say: “Plant Cover = 0” + “Surface Pollen Percentage > 30%” = “a post retreat”. Comparing the surface pollen analysis with the results of the vegetation investigation could reveal the status of distribution/coverage.
Twenty grams of soil was weighed to extract pollen. The pollen analysis method followed that of Faegri, Kaland & Krzywinski (1989). The specific steps involved taking Lycopodium (27,637 ± 563 grains) liquid for tracers, using a 200-µm strainer to remove the larger plant fragments or other impurities, adding 10% HCl and 10% NaOH solutions and, finally, floating the pollen in a specific-gravity solution (1.9–2.2). Only the Pinus pollen was identified and counted using a 400×-magnification light microscope. The pollen percentage was calculated using the number of Lycopodium grains as a base value in this study.
Based on the collected climate data, the regular patterns of mean annual precipitation and mean annual temperature in the distribution areas of P. armandii in its naturally occurring distribution regions could help identify the main driver leading the change. Ordination analysis reveals the relationship of environmental factors and P. armandii distribution locations and can potentially be used to forecast the future distribution of P. armandii.
Principal component analysis was conducted to explain the contributions of each climate parameter to environmental variation among the sites. Most sampling districts were hilly terrain where the climate conditions, including temperature and precipitation, are clearly affected throughout the change in elevation (Giorgi et al., 1997). We took elevation together with temperature and precipitation as an explanatory factor parameter in this study and explored its regional influence. The average temperature and precipitation data within the study area were collected from the local weather bureau or meteorological station. Ordination analysis was conducted to characterise the relationship between the environmental parameters and the individual study areas; specifically, redundancy analysis (RDA) was conducted due to the short gradient lengths calculated by the detrended correspondence analysis (DCA). R version 3.3.3 (R Core Team, 2017) and Canoco for Windows 4.5 (Ter Braak & Smilauer, 2002) were used to perform the data analysis and to construct the figures.
Results
Change in the distribution of P. armandii
We investigated and organized the main types of Pinus forests of the Qinba Mountains and Yungui Plateau; the results are shown in Text S1. In the field investigation, we found many samples with no Pinus trees, despite the Pinus pollen percentage being higher than 30% in all the sampling districts. The relationship between Pinus pollen percentage and Pinus cover is shown in Fig. 2, categorized by regions. 11 (out of 15) intercepts of the regression lines on the Y axis of the Pinus percentage and plant cover regions are higher than 30%, except for those of Maiji Mountain, Taibai Mountain, Jiuzhaigou and Aba; these study regions had intercepts lower than 30%. Huoditang and Zoige had the largest intercepts, even higher than 40%. The results indicate that P. armandii cover has undergone a distributional decline or a general shift in these regions. The distribution dispersal status on Maiji Mountain and Taibai Mountain, as well as in Jiuzhaigou and Aba, were unclear.
Figure 2: The pollen percentage and plant cover.
X axis represents the Pinus tree cover; Y axis represents the Pinus pollen percentage. Sites with no Pinus trees found during the investigation are located on the vertical dotted line. The horizontal dotted line is the 30% Pinus pollen percentage line, which is the boundary line. If the no-Pinus-tree sites are beyond the boundary line, a decline of Pinus distribution can be inferred.
Environmental correlates of change in the distribution of P. armandii
The results of principal component analysis demonstrating the regional influence of climate factors are shown in Table 2. Mean annual temperature, elevation and mean annual precipitation all seem to impact the distribution shift of P. armandii. Mean annual temperature is the primary environmental factor correlated with distribution change across the study areas, followed by elevation, then mean annual precipitation. Mean annual temperature was the most important correlate of change in the distribution of P. armandii, with a proportion up to 67.72%, while elevation and mean annual precipitation were 19.80% and 12.48%.
| Component | Initial eigenvalues | Extraction sums of squared loadings | |||
|---|---|---|---|---|---|
| Total | % of variance | Cumulative (%) | Total | % of variance | |
| Temperature | 2.03 | 67.72 | 67.72 | 2.03 | 67.72 |
| Elevation | 0.59 | 19.80 | 87.52 | 0.59 | 19.80 |
| Precipitation | 0.37 | 12.48 | 100 | 0.37 | 12.48 |
A rough forecast of change in the distribution of P. armandii
The DCA of the location and environment in Table 3 helped us choose the ordination analysis method. The first two eigenvalues of the DCA are high, implying that the first two axes represent a strong gradient, while the third and fourth axes are much weaker. All axis gradient lengths in the results from the location-environment DCA were less than 3, so RDA was chosen for the ordination. The results of the RDA of the climate parameters and the study districts are shown in Fig. 3. The mean annual precipitation and mean annual temperature increases are from left to right along the first axis of the redundancy analysis ordination diagram, while the elevation decreases concurrently.
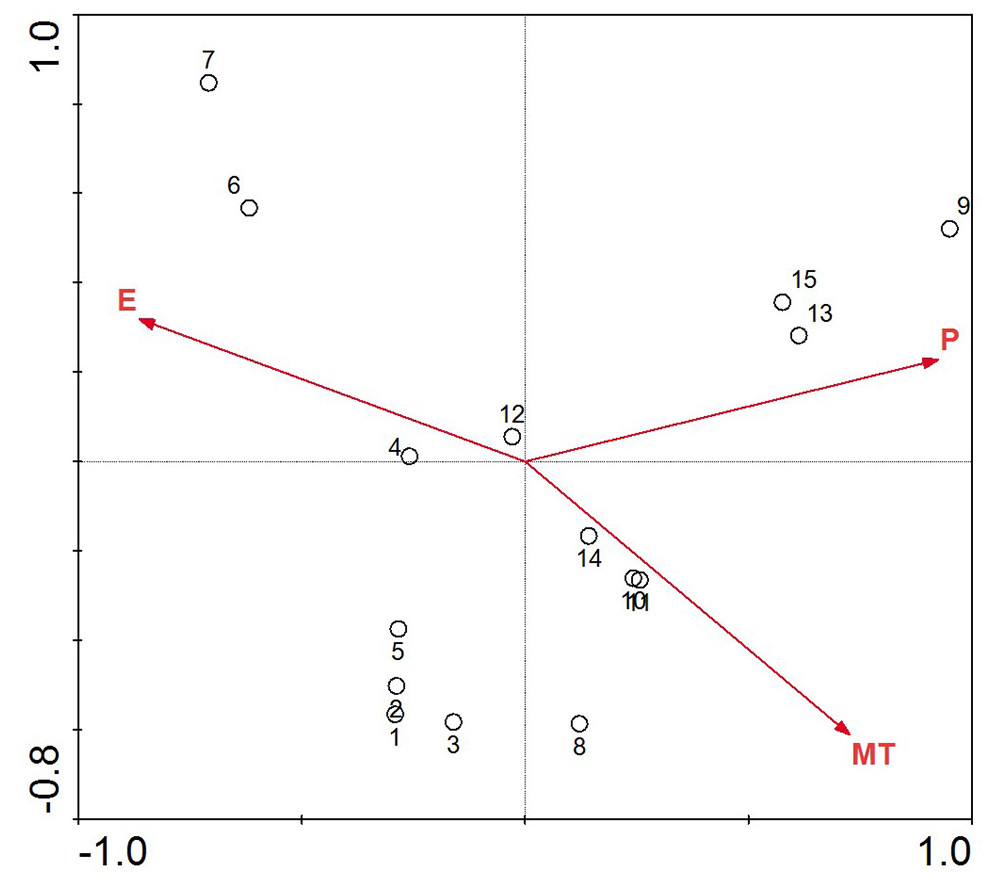
Figure 3: Redundancy analysis ordination biplot showing the relationship between environmental variables and location.
The points with Arabic numerals represent the location, and the arrow lines with capital letters represent the environmental parameter (1, Maiji Mountain; 2, Taibai Mountain; 3, Huoditang; 4, Mount Hua; 5, Jiuzhaigou; 6, Aba; 7, Zoige; 8, Chuxiong; 9, Pingbian; 10, Zhanyi; 11, Yiliang; 12, Weining; 13, Panxian; 14, Qianxi; 15, Ziyun; P, mean annual precipitation; MT, mean annual temperature; E, elevation).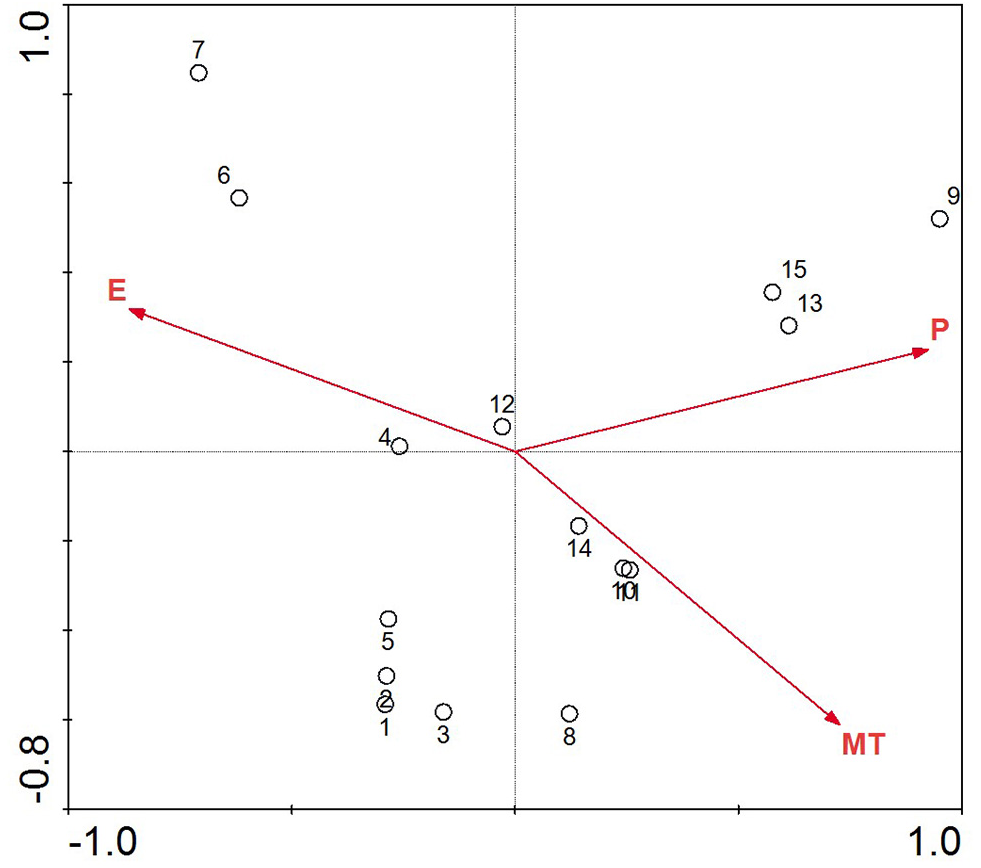
| Axes | 1 | 2 | 3 | 4 | Total inertia |
|---|---|---|---|---|---|
| Eigenvalues | 0.26 | 0.32 | 0.01 | 0.01 | 0.58 |
| Lengths of gradient | 0.69 | 0.69 | 0.62 | 0.54 | |
| Location-environment correlations | 0.99 | 0.99 | 0 | 0 | |
| Cumulative percentage variance: | |||||
| of location data | 98.50 | 99.10 | 100 | 100 | |
| of location-environment relation | 99.40 | 100 | 0 | 0 |
Along the direction-of-temperature arrow, the majority locations appear, except Aba and Zoige; the narrow biotope with high elevation in these two locations makes them different (Table 1). The vertical projects of other sample locations on the temperature variable line are close and concentrated; these samples will be intensively influenced by the mean annual temperature. P. armandii in these study locations will be strongly affected by changing temperature, and along the temperature arrow, increasing temperature will limit the distribution in future. On the precipitation and elevation line, the vertical projects are well distributed. P. armandii in the Pingbian, Panxian and Ziyun will be challenged intensely as the precipitation increases, and P. armandii in Maiji Mountain is prone to increasing precipitation. As to elevation, Aba and Zoige are more sensitive to high elevation, while Pingbian is more sensitive to low elevation. These results can be explained by the narrow elevation coverage and relatively low elevation scope (Table 1). P. armandii in the rest of the study locations have different capacity to the current precipitation status and elevation range. Both elevation and mean annual precipitation have an even impact power on these sites, unlike the mean annual temperature.
Discussion
In this study, we verified that the distribution of Pinus armandii will tend to shrink under the influence of climate change in the future. A study in America demonstrated the existence of an impact at the tree species level: P. albicaulis will be extirpated from most of its current range as temperatures rise (McLane & Aitken, 2012). Temperature is one of the most important factors controlling the change of geographical ranges of species (Ellenberg, 1988). Studies that have employed bioclimatic envelope models to estimate species distribution changes also show that temperature has determined plant species distributions (Hirota et al., 2011; Toledo, 2012). Thus, increased temperatures due to climate change are likely to have been causing tree distribution shifts to higher elevations (Tewksbury, Sheldon & Ettinger, 2011) similar to that observed in this study. Further, elevation is correlated with temperature in that lower elevation and lower latitude sites are warmer. Therefore, a much stronger impact by increasing temperature on tree distribution shift is expected. This result is in line with the main evidence of the ecological impacts of climate change. Climate change has been demonstrated to be a strong factor on tree distribution (Canham & Thomas, 2010), which means that climate change will have a profound influence on the range of expansion and contraction (Walther et al., 2002). As a part of the forest ecosystem, P. armandii is influenced by the climate.
When exploring the main factors affecting shifts in species distributions due to climate change, some scientific researchers have focused on the warming climate, i.e., temperature (Beckage, Osborne & Gavin, 2008), and some have considered both temperature and precipitation (Kelly & Goulden, 2008). The main causal factors may differ by ecological niche. Our results suggest that precipitation also influences the distribution shift of Pinus, though in a supplementary, rather than primary, way. The rare high mean annual precipitation on Yungui Plateau, which ranges from 1,500 to 1,700 mm, further weakened the influence of precipitation across this study.
As a rough forecasting method, this study cannot determine the precise timeline of future change and can only speculate on direction of shift in distribution. The rate of future climate change will be hundreds of times faster than the rate in the past century (Lee et al., 2016). Global and regional ecosystems are predicted to experience rapid change to a drier and warmer future (Guan, 2009).
A limitation of this study is the accuracy with which the percentage of Pinus can be inferred in the pollen assemblages (>30%); this is achieved by estimating quantitative standard using power regression. Although it is relatively consistent, the complex dispersal characters of Pinus may cause bias in reconstructing accurate relative abundances at sites. Further, in this study we ignored other minor Pinus species, such as P. tabulaeformis and P. massoniana in the Qinba Mountains, and P. yunnanensis and P. densata on the Yungui Plateau, which were also present in the study areas. However, we argue here that the approach we have taken in this analysis can be used to understand change in the distribution dominant tree species under the effects of climate change. If the pollen assemblages of sites can be used to accurately reconstruct the past vegetation, such as Larix, Picea and Juglans (Xu et al., 2007), the results can be rigorous.
Conclusions
The relationship of the pollen percentage of Pinus and the corresponding plant cover reveals that P. armandii has been experiencing a range contraction within the study area. Increasing temperature is the main correlate of this change, and we predict that a drier future will continue to contribute to further shifts. P. armandii in high-elevation districts tend to disperse in a downhill direction to lower-elevation locations. Regions of lower temperature and lower altitude will be characteristic of P. armandii habitat in the future.