
Comparative molecular analyses of select pH- and osmoregulatory genes in three freshwater crayfish Cherax quadricarinatus, C. destructor and C. cainii
- Published
- Accepted
- Received
- Academic Editor
- Kristin Hamre
- Subject Areas
- Aquaculture, Fisheries and Fish Science, Genetics, Genomics, Marine Biology, Freshwater Biology
- Keywords
- Redclaw, Yabby, Marron, Osmoregulatory genes, V-type H+-ATPase, Carbonic anhydrase, Na+/K+-ATPase
- Copyright
- © 2017 Ali et al.
- Licence
- This is an open access article distributed under the terms of the Creative Commons Attribution License, which permits unrestricted use, distribution, reproduction and adaptation in any medium and for any purpose provided that it is properly attributed. For attribution, the original author(s), title, publication source (PeerJ) and either DOI or URL of the article must be cited.
- Cite this article
- 2017. Comparative molecular analyses of select pH- and osmoregulatory genes in three freshwater crayfish Cherax quadricarinatus, C. destructor and C. cainii. PeerJ 5:e3623 https://doi.org/10.7717/peerj.3623
Abstract
Systemic acid-base balance and osmotic/ionic regulation in decapod crustaceans are in part maintained by a set of transport-related enzymes such as carbonic anhydrase (CA), Na+/K+-ATPase (NKA), H+-ATPase (HAT), Na+/K+/2Cl− cotransporter (NKCC), Na+/Cl−/HCO cotransporter (NBC), Na+/H+ exchanger (NHE), Arginine kinase (AK), Sarcoplasmic Ca+2-ATPase (SERCA) and Calreticulin (CRT). We carried out a comparative molecular analysis of these genes in three commercially important yet eco-physiologically distinct freshwater crayfish, Cherax quadricarinatus, C. destructor and C. cainii, with the aim to identify mutations in these genes and determine if observed patterns of mutations were consistent with the action of natural selection. We also conducted a tissue-specific expression analysis of these genes across seven different organs, including gills, hepatopancreas, heart, kidney, liver, nerve and testes using NGS transcriptome data. The molecular analysis of the candidate genes revealed a high level of sequence conservation across the three Cherax sp. Hyphy analysis revealed that all candidate genes showed patterns of molecular variation consistent with neutral evolution. The tissue-specific expression analysis showed that 46% of candidate genes were expressed in all tissue types examined, while approximately 10% of candidate genes were only expressed in a single tissue type. The largest number of genes was observed in nerve (84%) and gills (78%) and the lowest in testes (66%). The tissue-specific expression analysis also revealed that most of the master genes regulating pH and osmoregulation (CA, NKA, HAT, NKCC, NBC, NHE) were expressed in all tissue types indicating an important physiological role for these genes outside of osmoregulation in other tissue types. The high level of sequence conservation observed in the candidate genes may be explained by the important role of these genes as well as potentially having a number of other basic physiological functions in different tissue types.
Introduction
In decapod crustaceans, systematic acid–base balance and ion-regulation are processes that are largely controlled by a set of transport-related enzymes. These enzymes include carbonic anhydrase (CA), Na+/K+-ATPase (NKA), Vacuolar-type H+-ATPase (HAT), Na+/K+/2Cl− cotransporter (NKCC), Na+/HCO cotransporter (NBC), Arginine kinase (AK), Calreticulin (CRT), Sarco/endoplasmic reticulum Ca2+ATPase (SERCA), Na+/H+ exchanger (NHE) and Na+/Ca+2 exchanger (NCX) (Pan, Zhang & Liu, 2007; Serrano, Halanych & Henry, 2007; Freire, Onken & McNamara, 2008; Henry et al., 2012; McNamara & Faria, 2012; Romano & Zeng, 2012; Havird, Henry & Wilson, 2013). The expression patterns and activities of these genes/enzymes have been reported in a number of decapod crustaceans (for example; CA (Serrano, Halanych & Henry, 2007; Pongsomboon et al., 2009; Ali et al., 2015b; Liu et al., 2015); NKA (Chaudhari et al., 2015; Han et al., 2015; Leone et al., in press); HAT (Pan, Zhang & Liu, 2007; Wang et al., 2012; Havird, Santos & Henry, 2014; Ali et al., 2015b); NKCC (Towle et al., 1997; Havird, Henry & Wilson, 2013; Havird, Santos & Henry, 2014); NHE (Towle & Weihrauch, 2001; Weihrauch et al., 2004; Ren et al., 2015); NCX (Flik et al., 1994; Lucu & Flik, 1999; Flik & Haond, 2000) AK (Serrano, Halanych & Henry, 2007; Havird, Santos & Henry, 2014; Ali et al., 2015b); CRT (Luana et al., 2007; Visudtiphole et al., 2010; Watthanasurorot et al., 2013; Duan et al., 2014). Despite this, we know little about the molecular evolution of these key gene classes or their patterns of tissue specific expression in decapod crustaceans.
Cherax quadricarinatus (Redclaw), Cherax destructor (Yabby) and Cherax cainii (Marron) are commercially important freshwater crayfish, endemic to Australia. These species occur in a diverse range of aquatic environments and can tolerate wide fluctuations in a range of water parameters such as pH, salinity, dissolved oxygen and temperature (Bryant & Papas, 2007; McCormack, 2014). This indicates that these crayfish species have a great capacity to cope with highly variable aquatic environments. Consequently, because of the physiological robustness of these animals and their economic significance, it has led to their use in physiological genomic research in crustaceans.
In previous studies we have identified a number of the above mentioned ion-transport related genes in C. quadricarinatus, C. destructor and C. cainii (Ali et al., 2015a; Ali et al., 2015b). In the present study, we undertook an in-depth molecular analysis of candidate systemic acid–base and ion-transport related genes across these three freshwater crayfish species. In addition, we have performed comparative and evolutionary genomic analysis of these genes across other related arthropod species. The main focus of this study was to identify synonymous and non-synonymous mutations in these genes and to determine if the observed patterns of mutations were consistent with the action of natural selection or neutral evolution. This study also investigated patterns of tissue-specific expression of candidate pH and ion/osmoregulatory genes in the gills, hepatopancreas, heart, kidney, liver, nervous system and testes using publically available and newly generated transcriptome metadata.
Material and Methods
We sequenced gills and hepatopancreas in your lab and other data came from other sources.
Sample collection and preparation
Live redclaw crayfish (C. quadricarinatus) were obtained from Theebine, in Queensland, Australia; yabby (C. destructor) were sourced from New South Wales, Australia; and Marron (C. cainii) from Mudgee, Western Australia, Australia. Culture conditions for C. quadricarinatus has already been described in (Ali et al., 2015b). Cherax destructor and C. cainii were housed at QUT aquaculture facility under standard culture conditions. Animals were acclimated to lab conditions for three weeks (21 °C, pH 7 and conductivity 1700 µS/cm). Before tissue collection, three C. cainii (body length 11 ± 0.9 cm and wet body weight 57 ± 5g) and three C. destructor (9 ± 0.7 cm and 45 ± 3g) were exposed to pH 6, 7 and 8 (for 6 h); a natural pH tolerance range of Cherax species (Macaranas et al., 1995; Bryant & Papas, 2007). The animals were exposed to different pH for 6 h because our previous study shows that different isoforms of some the genes of our interest (for example, cytoplasmic isoform of Carbonic anhydrase CAc and membrane-associated isoform CAg) expressed differently after approximately 6 h (Ali et al., 2015b).
RNA extraction, cDNA synthesis and sequencing
Gills were excised from C. destructor and C. cainii samples, immediately following euthanisation in ice for 5–10 min. Tissues were extracted after six hours at each treatment, following euthanisation in ice-water. Tissue samples across the three treatments were pooled for each species separately and crushed in liquid nitrogen before total RNA was extracted using an existing protocol (Prentis & Pavasovic, 2014). Genomic DNA was digested with Turbo DNA-free kit (Life Technologies, Carlsbad, CA, USA) and RNA quality and concentration was determined using both Bioanalyzer 2100 RNA nanochip (Agilent Technologies, Santa Clara, CA, USA) and NanoDrop 2000 (Thermo Scientific, Waltham, MA, USA). RNASeq library preparation and paired-end sequencing were undertaken on an Illumina NextSeq 500 (150 bp pair-end chemistry) according to the manufacturer’s protocol for stranded library preparation.
Six individual hepatopancreas samples from C. quadricarinatus were dissected and homogenised in liquid N2 before total RNA was extracted using the protocol of Prentis & Pavasovic (2014). Genomic DNA was digested with Turbo DNA-free kit (REF-AM1907, Ambion RNA; Life Technologies, Carlsbad, CA, USA) and RNA quality and concentration were checked using the Bioanalyzer 2100 (Agilent Technologies, Santa Clara, CA, USA). RNASeq library preparation and sequencing were undertaken according to the Ion Proton 200 bp library preparation and sequencing protocol (Thermo Fisher, see Amin et al., 2014). Raw Illumina sequence read data for heart, kidney, liver, nerve and testes were downloaded from NCBI Sequence Read Archive database as FastQ files (Accession SRA: ERR391748 –ERR391752 Tan et al., 2016).
Assembly, functional annotation and gene identification
Reads which did not meet our quality criteria (Q>30, N bases <1%) were removed before assembly using Trimmomatic (Version 0.32; Bolger, Lohse & Usadel, 2014). These filtered reads were assembled with the Trinity short read de novo assembler using the stranded option for Illumina data (Version 2014-04-13p1; Haas et al., 2013) and the unstranded option for Ion Torrent data. Contigs with >95% sequence similarity were clustered into gene families using CD-HIT (Version 4.6.1; Huang et al., 2010). Coding sequences representing open reading frames (ORFs) from the transcripts were determined using Transdecoder (Version r20140704; Haas et al., 2013).
Assembled data were used as BLASTx queries against the NCBI NR protein database using BLAST+ (Version 2.2.29; Camacho et al., 2009) with a stringency of 10 × e−5. Gene ontology (GO) terms were assigned to annotated transcripts using Blast2Go Pro (Version 3.0; Conesa et al., 2005). Candidate genes were identified based on literature searches, PFAM domains, and GO terms (Henry et al., 2012; Eissa & Wang, 2014; Ali et al., 2015b).
Molecular analyses
Comparative molecular analyses were carried out on the candidate genes previously reported to have important role in pH balance and/or ion-/osmo-regulation. The translated amino acids sequences from translated ORFs were used as BLASTp queries against the NCBI NR database. The top BLAST hits were downloaded for each gene and sequences were aligned in BioEdit (version 7.2.5; Hall, 1999) using a ClustalW alignment (Larkin et al., 2007). Neighbour Joining trees based on amino acid data were generated in Geneious (version 8.0.4) using the Jukes Cantor method with 10,000 bootstraps (Kearse et al., 2012). Important functional residues and PFAM domains in the predicted amino acid sequences for each candidate gene were determined using SMART (Schultz et al., 1998), PROSITE (Sigrist et al., 2013) and NCBI’s Conserved Domain Database (Marchler-Bauer et al., 2015). Putative signal peptides, functional motifs and potential cleavage sites of signal peptides were predicted using PrediSi (PrediSI, 2014) and SignalP 4.0 (Petersen et al., 2011). N-linked glycosylation sites were predicted with N-GlycoSite (Zhang et al., 2004) using the NXS/T model (where N, Aspargine; S, Serine; T, Theronine and X, any amino acid).
Molecular evolutionary analyses for each of the gene sequences were generated using MEGA (version 6; Tamura et al., 2013). Estimates of natural selection for each codon (codon-by-codon) were determined using HyPHy analysis (hypothesis testing using phylogenies) according to (Sergei & Muse, 2005). In this analysis, estimates of the numbers of synonymous (s) and nonsynonymous (n) substitutions for each codon, and their respective potential numbers of synonymous (S) and nonsyonymous (N) sites were also determined. These estimates were calculated using joint Maximum Likelihood reconstructions of ancestral states under a Muse-Gaut model (Muse & Gaut, 1994) of codon substitution and a General Time Reversible model (Nei & Kumar, 2000). The differences between the nonsynonymous substitutions rate (per site) (dN = n/N) and synonymous substitutions rate (dS = s/S) were used for detecting the codons that had undergone positive selection. The null hypothesis of neutral evolution was rejected at p < 0.05 (Suzuki & Gojobori, 1999; Kosakovsky & Frost, 2005). All positions in the aligned sequences containing gaps and missing data were eliminated from the final analysis.
Estimates of evolutionary divergence between the sequences were conducted in MEGA6 using the Poisson correction model (Zuckerkandl & Pauling, 1965). The equality ofevolutionary rate between two sequences from two different species was conducted according to Tajima’s relative rate test using amino acid substitutions model (Tajima, 1993).
Tissue-specific expression
Transcriptomes were assembled separately for seven different C. quadricarinatus organs including gills, hepatopancreas, heart, kidney, liver, nerve and testes. This analysis examined the presence or absence of 80 important genes that are directly or indirectly involved in either acid–base balance or osmotic/ionic regulation across the seven different tissues. Two data sets (from gills and hepatopancreas) were generated in our lab and the remaining five were sourced from publicly available NGS-sequenced data archived in NCBI SRA data bank (Tan et al., 2016).
Results
Transcriptome assembly, annotation and gene identification
Transcriptomes of gills from Yabby and Marron
RNA libraries yielded more than 83 million (83,984,583) and 100 million (100,712,892) high quality (Q ≥ 30) 150 bp paired-end reads for C. cainii and C. destructor, respectively. Assemblies resulted in 147,101 contigs (C. cainii) and 136,622 contigs (C. destructor) ≥ 200 bp. Contigs with >70% protein sequence similarity were clustered into 18,325 and 18,113 gene families in C. cainii and C. destructor (Table 1). Average contig length (747 and 740) and the N50 statistic (1,380 and 1,326), which is a weighted median statistic where half of the entire assembly length is contained in contigs equal to or larger than this value, were similar in both assemblies. Average contig lengths from our assemblies were longer than that from other assemblies in crustaceans (e.g., 323 bp in Macrobrachium rosenbergii, (Mohd Shamsudin et al., 2013) and 492 bp in Euphausia superba (Clark et al., 2011)).
| Summary statistics | Redclaw | Yabby | Marron | ||||||
|---|---|---|---|---|---|---|---|---|---|
| Gills | Hepato- pancreas | Heart | Kidney | Liver | Nerve | Testes | Gills | Gills | |
| Total reads (million) | 72.3 | 65 | 47 | 63 | 51 | 64 | 62 | 100 | 83.9 |
| Number of total contigs | 87,290 | 67,401 | 38,938 | 66,308 | 47,166 | 66,564 | 63,924 | 136,622 | 147,101 |
| N50 | 725 | 398 | 720 | 1,033 | 705 | 1,190 | 995 | 1,326 | 1,380 |
| Mean contig length | 563 | 386 | 554 | 663 | 548 | 716 | 653 | 740 | 747 |
| Length of the longest contig | 15,028 | 9,532 | 16,343 | 15,021 | 17,690 | 20,121 | 16,889 | 17,725 | 22,324 |
| Number of contigs longer than 500 bp | 27,973 | 12,055 | 10,129 | 22,622 | 13,665 | 23,290 | 19,642 | 49,678 | 52,459 |
| Number of contigs longer than 1,500 bp | 5,274 | 0 | 2,048 | 6,264 | 2,867 | 6,670 | 5,050 | 16,178 | 17,486 |
| Number of clusters | 24,123 | 21,732 | 23,127 | 19,816 | 22,963 | 22,837 | 22,989 | 18,113 | 18,325 |
| Blast Success rate (%) | 25.3 | 35 | 31.2 | 25.9 | 27.7 | 27.1 | 27.4 | 17 | 18 |
More than 23,000 contigs for each species received significant BLASTx hits against the NR database with a stringency of e-5. The percentage BLAST success attained for the two transcriptomes (17–18%) were lower compared to other freshwater crayfish; Procambarus clarkii (36%; Shen et al., 2014) and C. quadricarinatus (37%, Ali et al., 2015b).
Transcriptomes of different organs from Redclaw (C. quadricarinatus)
The seven transcriptome libraries, when combined, constituted a data set of 608 million high quality (Q ≥ 30) reads. RNA libraries for gills yielded more than 72 million (72,382,710), 83 million (83,984,583) and 100 million (100,712,892) high quality reads for C. quadricarinatus, C. cainii and C. destructor, respectively. The hepatopancreas transcriptome from Redclaw yielded ≈65 million reads and 67,401 transcripts (Table 1). The detailed statistics of raw reads, assembled contigs and BLAST success are presented in Table 1. Our genes of interest were identified and characterised for the three species (Table 2). Most transcripts of interest from the three Cherax species were highly conserved at the nucleotide level and had predicted proteins of similar size and sequence composition (Table 2).
| Redclaw | Yabby | Marron | |||||||||||
|---|---|---|---|---|---|---|---|---|---|---|---|---|---|
| Genes | Enzymes | Gene ID | Contig length Bp | Protein length (aa) | Accession # | Gene ID | Contig length Bp | Protein length (aa) | Accession # | Gene ID | Contig length Bp | Protein length (aa) | Accession # |
| CAc | Carbonic anhydrase alpha | CqCAc | 1,527 | 271 | KM538165 | CdCAc | 1,589 | 271 | KP299962 | CcCAc | 2,795 | 271 | KP221715 |
| CAg | Carbonic anhydrase GPI-linked | CqCAg | 3,352 | 310 | KM538166 | CdCAg | 2,465 | 289 | KP299963 | CcCAg | 4,774 | 310 | KP221716 |
| CAb | Beta carbonic anhydrase | CqCAb | 927 | 257 | KM538167 | CdCAb | 2,459 | 257 | KP299965 | CcCAb | 4,163 | 257 | KP221717 |
| NKA- α | Sodium/potassium ATPase alpha subunit | CqNKA- α | 4,351 | 1,038 | KR270438 | CdNKA- α | 5,500 | 1,038 | KP299966 | CcNKA- α | 3,888 | 1,038 | KP221718 |
| NKA- β | Sodium/potassium ATPase beta subunit | CqNKA- β | 1,662 | 316 | KP221719 | CdNKA- β | 1,601 | 316 | KP299967 | CcNKA- β | 1,551 | 316 | KP221719 |
| HAT-c | V-type H+-ATPase Catalytic subunit A | CqHATc | 2,626 | 622 | KM538169 | CdHATc | 2,760 | 622 | KP299968 | CcHATc | 2,678 | 622 | KP221720 |
| HAT | V-type H+-ATPase 116 kda subunit A | CqHAT | 3,184 | 831 | KM610229 | CdHAT | 2,810 | 838 | KP299969 | CcHAT | 2,908 | 838 | KP221721 |
| AK | Arginine kinase | CqAK | 1,432 | 357 | KM610226 | CdAK | 1,477 | 357 | KP299970 | CcAK | 1,421 | 357 | KP221722 |
| CRT | Calreticulin | CqCRT | 1,722 | 402 | KM538170 | CdCRT | 1,708 | 403 | KP299971 | CcCRT | 1,739 | 402 | KP221723 |
| SERCA | Sarco/endoplasmic reticulum Ca+2 ATPase | CqSERCA | 4,631 | 1,020 | KM538171 | CdSERCA | 4,344 | 1,002 | KP299972 | CcSERCA | 6,255 | 1,020 | KP221724 |
| SEPHS | Selenophosphate synthetase | CqSEPHS | 2,142 | 326 | KP299975 | CdSEPHS | 2,160 | 326 | KP299975 | CcSEPHS | 2,186 | 326 | KP221726 |
| NKCC | Sodium/chloride cotransporter | CqNKCC | 4,643 | 1,061 | KP299986 | CdNKCC | 4,524 | 909 | KP299986 | CcNKCC | 4,728 | 1,074 | KP221733 |
| NHE3 | Sodium/hydrogen exchanger 3 | CqNHE3 | 3,578 | 943 | KM880153 | CdNHE3 | 3,308 | 943 | KP299982 | CcNHE3 | 4,271 | 986 | KP221730 |
| NBC | Sodium/bicarbonate cotransporter isoform 4 | CqNBCi4 | 5,217 | 1,133 | KP299993 | CdNBCi4 | 5,023 | 1,134 | KP299979 | CcNBCi4 | 4,986 | 1,133 | KP299993 |
| NBC | Sodium/bicarbonate cotransporter isoform 5 | CqNBCi5 | 4,855 | 1,114 | KP299994 | CdNBCi5 | 5,188 | 1,115 | KP299980 | CcNBCi5 | 4,915 | 1,114 | KP299994 |
| NCX1 | Sodium/calcium exchanger 1 | CqNCX1 | 4,895 | 846 | KM880154 | CdNCX1 | 4,148 | 849 | KP299983 | CcNCX1 | 4,289 | 848 | KP221731 |
Sequences alignment, domain analysis and phylogenetic relationships
Multiple protein alignments were performed for CA, NKA and HAT, as these genes are considered important candidate genes responsible for pH balance and osmoregulation in crustaceans.
Carbonic anhydrase
Cytoplasmic CA from C. quadricarinatus, C. destructor and C. cainii (CqCAc, CdCAc and CcCAc) encoded a predicted protein of 271 aa (Table 2). No cytoplasmic CA sequences contained a signal peptide; but all predicted proteins had two putative N-glycosylation motifs: (NKS at 122 aa. and NGS at 187 aa. position). Protein alignment revealed that cytoplasmic CAs obtained from C. quadricarinatus, C. destructor and C. cainii had greatest similarity to one another and shared 97–98% identity at the amino acid level (Table S1). BLASTp analysis (homologous protein analysis) showed that the cytoplasmic CAs from C. quadricarinatus, C. destructor and C. cainii were highly conserved with other decapod crustaceans and had greatest similarity with cytoplasmic CA forms from Penaeus monodon (75–76% identity, EF672697), Litopenaeus vannamei (74–76% identity, HM991703), and Callinectes sapidus (72–74% identity, EF375490).
Glycosyl-phosphatidylinositol (GPI)-linked CA forms; CqCAg and CcCAg contained a predicted protein with 310 aa (CdCAg had a partial CD of 289 aa). These predicted protein sequences (CqCAg, CdCAg and CcCAg) all contained a N-terminal signal peptide of 22 amino acids (Met1 to Gly22). The membrane-associated CA (CAg) obtained from all Cherax species shared strong similarity with the CAg forms identified in other crustacean species (for example: 73–74% identity with C. sapidus, EF375491; 71–73% identity with L. vannamei, JX975725; 72–73% identity with P. trituberculatus, JX524150); and the similarity among the three Cherax species ranged between 97–99% protein identity Table S1).
The β-CA (257 aa) had moderate to high sequence similarity to β-CA proteins obtained from other arthropod species (for example; 64–65% identity with Acyrthosiphon pisum, XP_001943693; 61–63% identity with D. pulex, EFX79480 (Colbourne et al., 2011) and62–64% identity with Nasonia vitripennis, XP_001606972). Cherax quadricarinatus, C. destructor and C. cainii shared between 98–99% amino acid sequence identity (Table S1).
Multiple alignment of all three forms of CAs with their homologous proteins in arthropods revealed that all active sites, including the zinc binding sites and the hydrogen bonding sites around the active sites are conserved (Fig. 1). A Neighbour Joining phylogenetic tree showed that the β-CA proteins formed a separate and well resolved clade from the alpha CA proteins (CAc and CAg). The three Cherax species formed a separate group in the β-CA clade that was sister to the same protein from insects. Within the large alpha CA clade, both the CAg and CAc proteins formed distinct well resolved clades. For the CAg clade, the three Cherax species formed a monophyletic group that was sister to a group comprised of crabs Carcinus maenas (ABX71209, Serrano & Henry, 2008), Callinectes sapidus (ABN51214, Serrano, Halanych & Henry, 2007) and Portunus trituberculatus (AFV46145, Xu & Liu, 2011); with shrimps being more distantly related Litopenaeus vannamei (AGC70493, Liu et al., 2015) and Halocaridina rubra (AIM43573, Havird, Santos & Henry, 2014). The CAc clade clustered according to taxonomic affinity where vertebrate species formed a separate group from the arthropod species. Within the arthropod clade, insects species Drosophila melanogaster (NP_523561, Hoskins et al., 2007), Apis florea (XM_003696244) and Bombus terrestris (XP_003395501) formed a separate and well supported group from decapod crustacean species including Callinectes sapidus, (ABN51213, Serrano, Halanych & Henry, 2007) and Portunus trituberculatus (AFV46144, Xu & Liu, 2011), and shrimp species Halocaridina rubra (AIM43574, Havird, Santos & Henry, 2014), Litopenaeus vannamei (ADM16544, Liu et al., 2015), Penaeus monodon (ABV65904, Pongsomboon et al., 2009) (Fig. 2). The three Cherax species clustered together in a discrete group which was sister to the other decapod species.
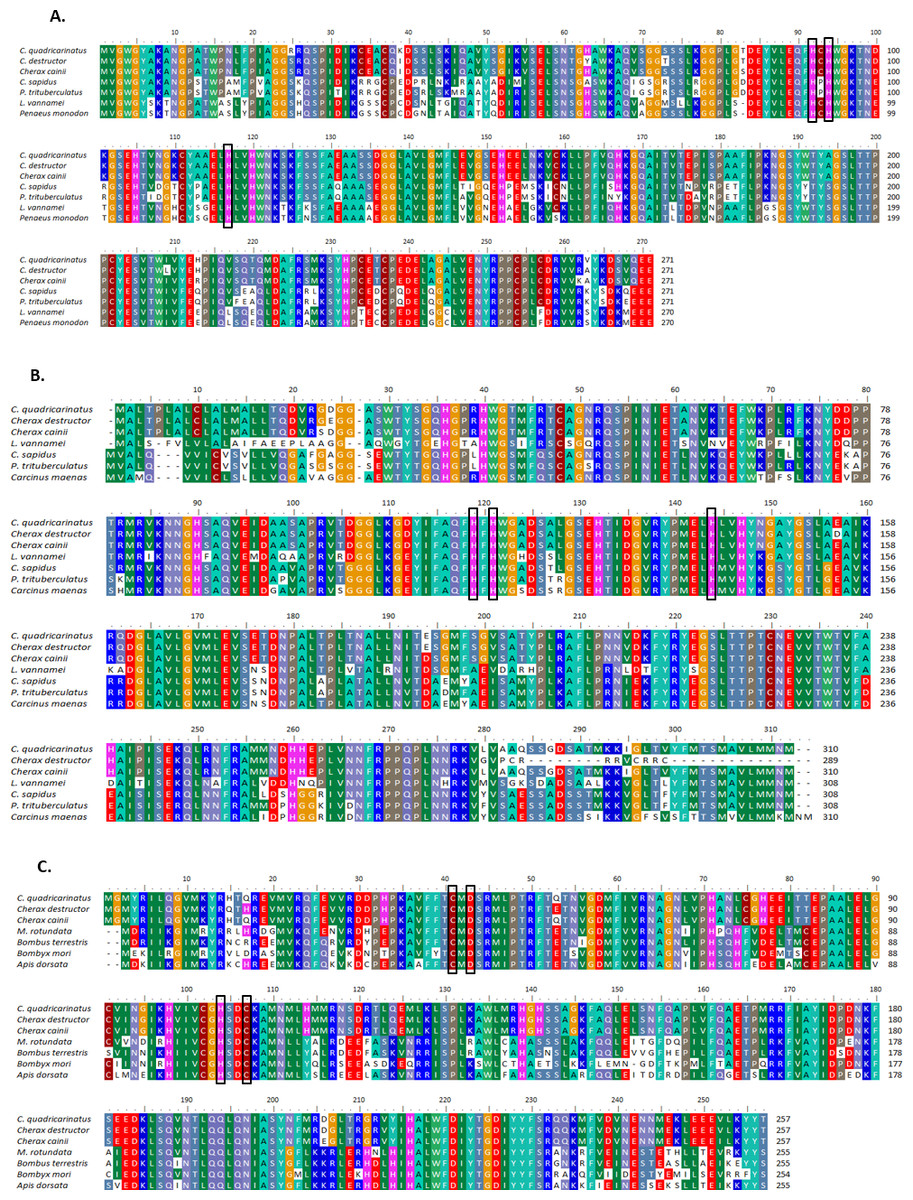
Figure 1: Multiple alignments of amino acid sequences from three Cherax Carbonic anhydrase (CA) with other species.
Multiple alignments of amino acid sequences from three Cherax Carbonic anhydrase (CA) with other species. Colours indicate the similarity. The black-boxed indicate the predicted active-sites, Zinc-binding residues. (A) Multiple alignment of cytoplasmic CA (B) Multiple alignment of membrane associated CA, and (C) Multiple alignment of β-CA.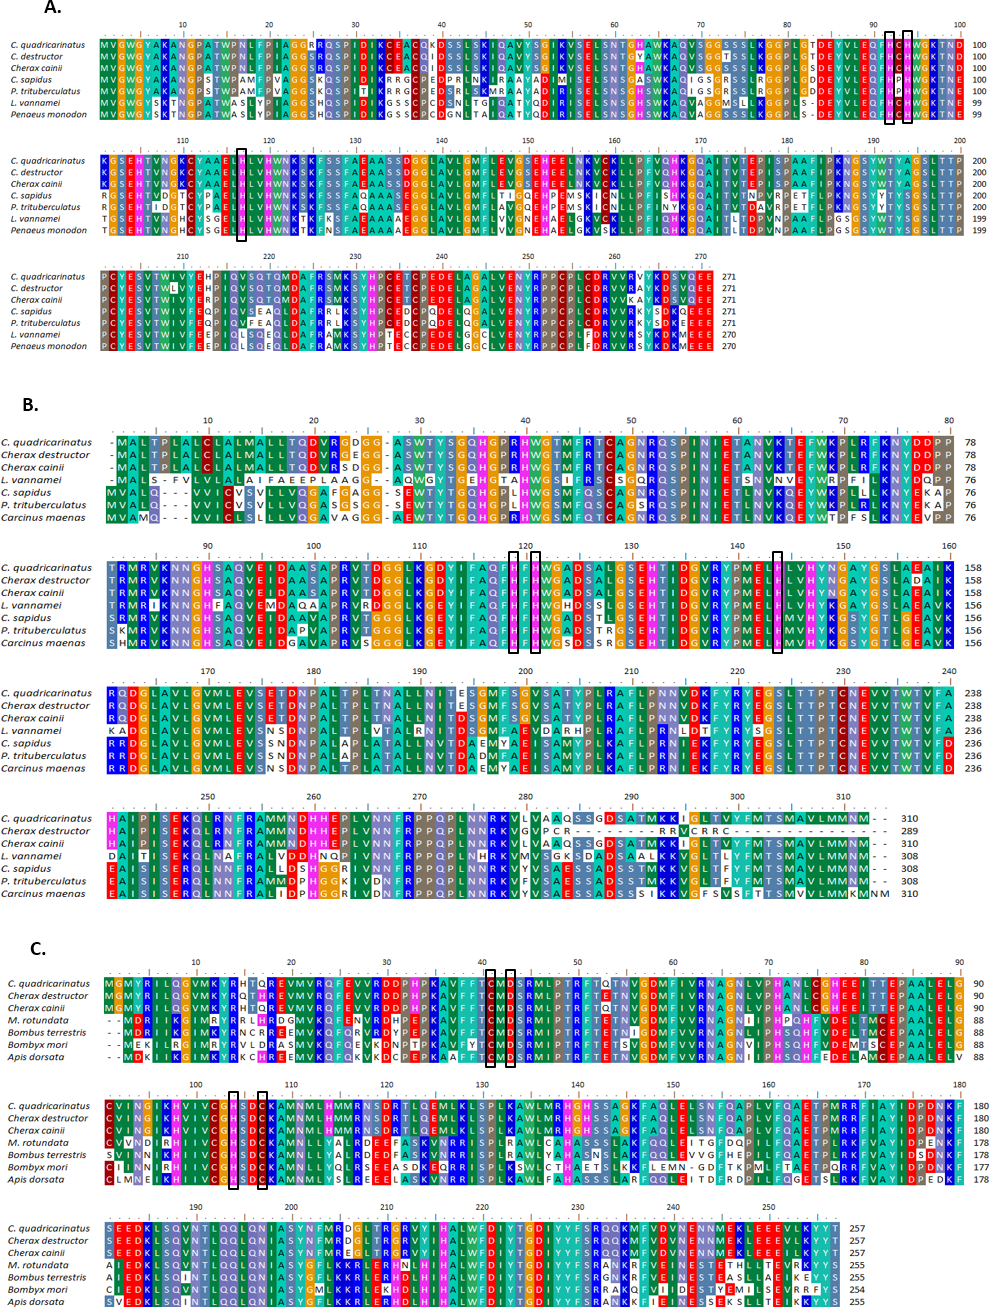
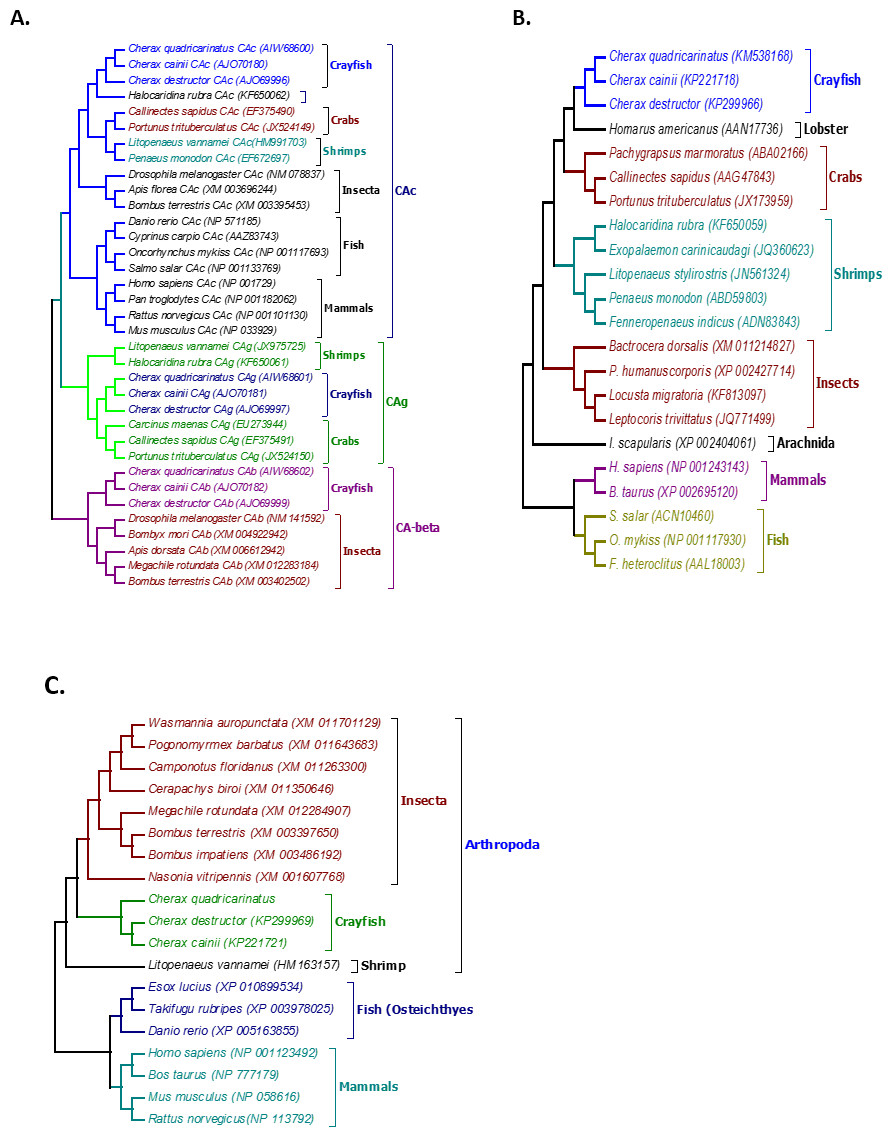
Figure 2: Phylogenetic relationships between the three Cherax crayfish with other organisms.
Bootstrapped Neighbour-joining tree showing the phylogenetic relationships between the three Cherax crayfish with other organisms on the basis of the amino acid sequences. Accession numbers are placed in brackets. (A) Phylogenetic tree of Carbonic Anhydrase proteins (CA) (B) Phylogenetic tree of Na+/K+-ATPase α-subunit (NKA) (C) Phylogenetic tree of V-type-H+-ATPase 116 kDa subunit a (HAT-A).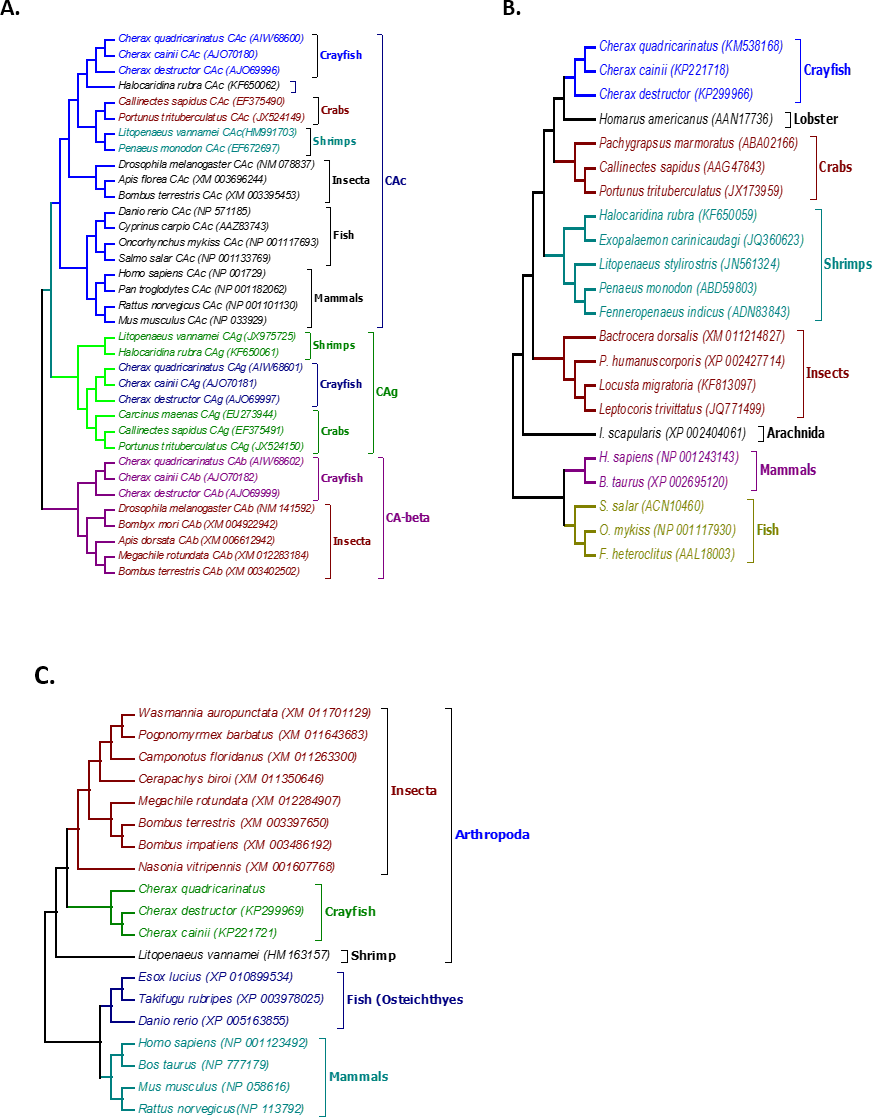
Na+/K+-ATPase (NKA)
Full-length nucleotide sequences and predicted aa sequences of the Na+/K+-ATPase alpha subunit from C. quadricarinatus, C. destructor and C. cainii (CqNKA, CdNKA and CcNKA) were functionally characterised (Table 2). The CqNKA, CdNKA and CcNKA ORFs all produced a predicted protein of 1,038 aa in length. No signal-peptide was present, but eight transmembrane domains were detected through hydrophobicity analysis of the sequences (Fig. 3).
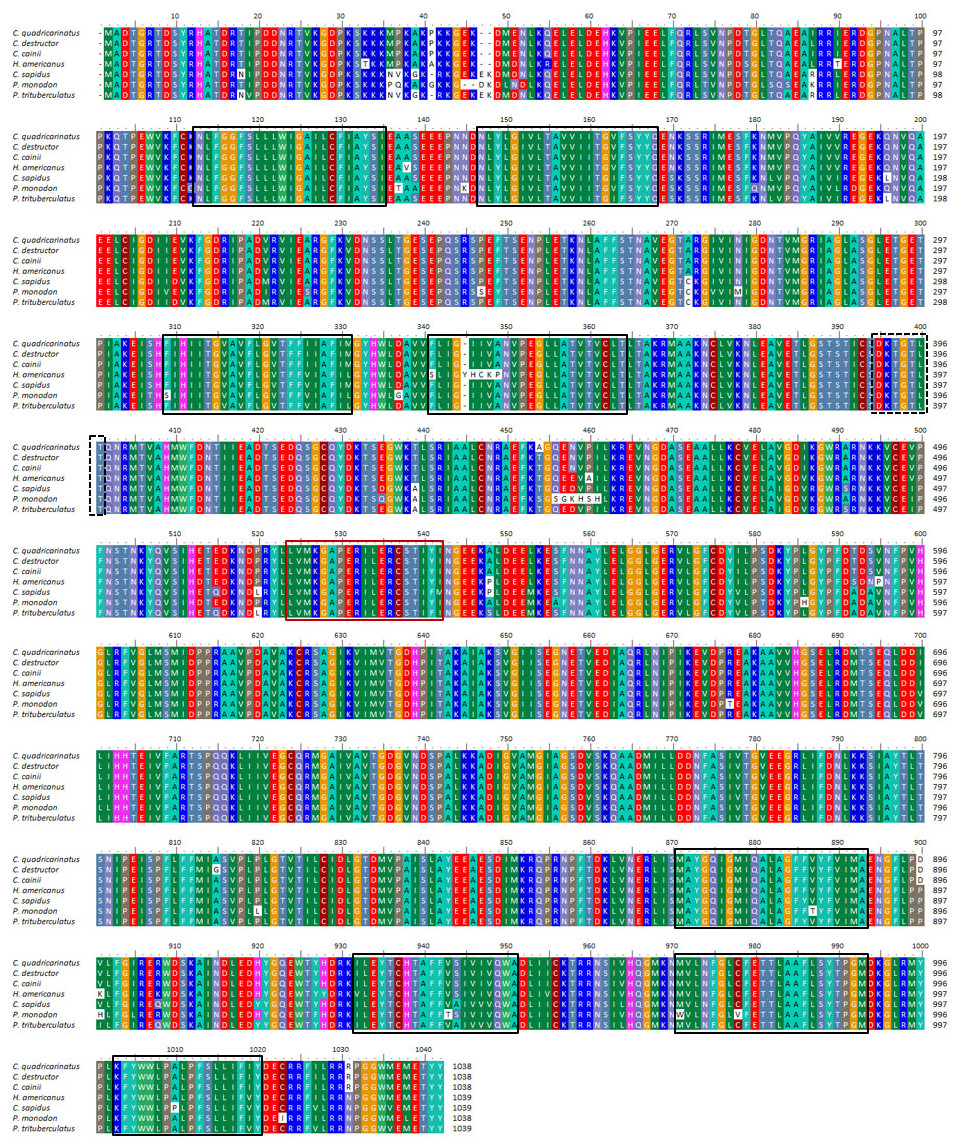
Figure 3: Multiple alignment of three Cherax Na+/K+-ATPase α-subunit amino acid sequences with other crustaceans.
Multiple alignment of three Cherax Na+/K+-ATPase α-subunit amino acid sequences with other crustaceans; Cherax quadricarinatus (), C. destructor (), C. cainii (), Homarus americanus (AAN17736), Callinectes sapidus (AAG47843), Paeneus monodon (ABD59803) and Portunus trituberculatus (AGF90965). Putative transmembrane domains are marked by black-boxed; likely ATP-binding site, by red-boxed; and phosphorylation site, by dashed-black boxed.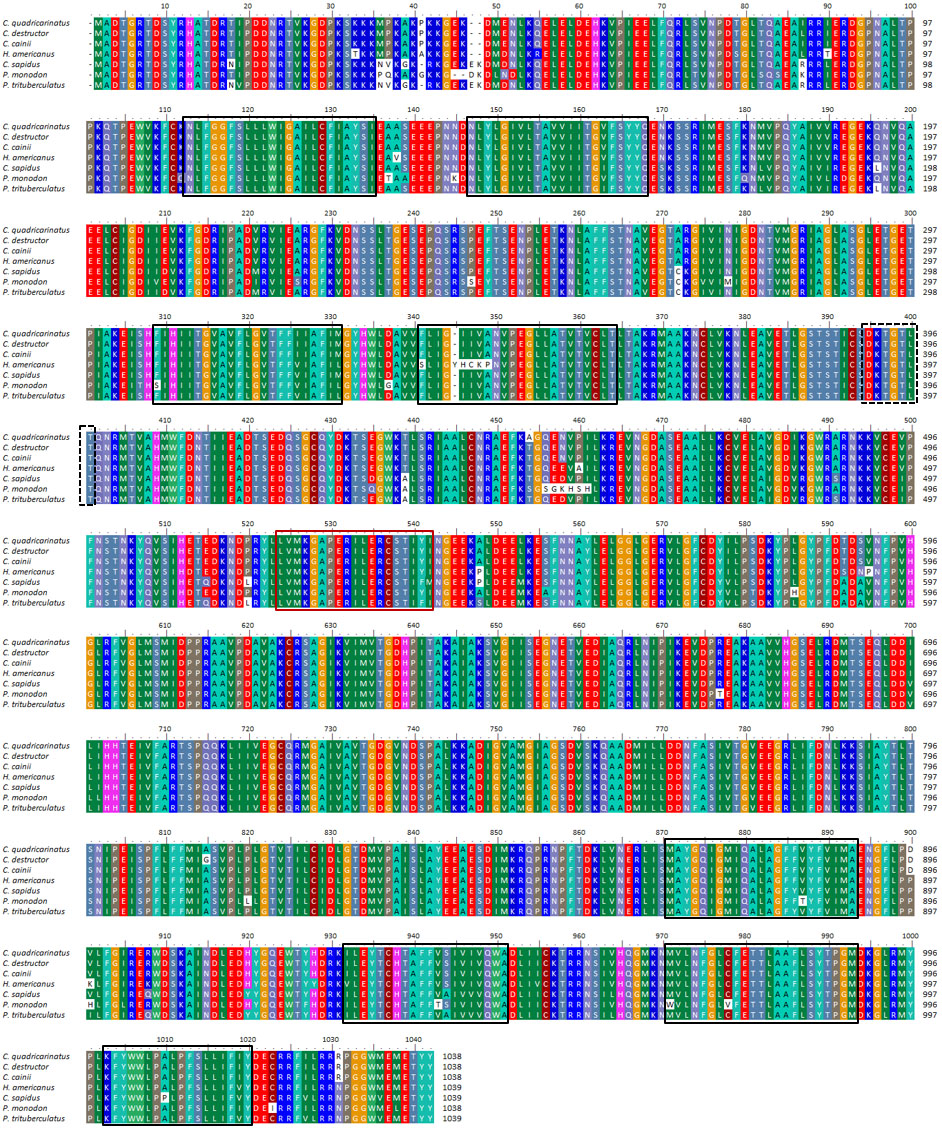
The NKA proteins from Cherax species were highly conserved (97–99% aa identity) and showed greatest similarity to NKA from other decapod crustacean species (for example; 96% with Homarus americanus (AY140650); 95% with Eriocheir sinensis (KC691291); 95% with C. sapidus (AF327439) and 93% with P. monodon (DQ399797).
Multiple alignment of NKA with the homologous proteins of other crustaceans revealed that all active sites are highly conserved (Fig. 3). The phylogenetic tree based on the α-subunit of NKA showed the existence of three distinct groups; arthropods, mammals, and osteichthyes (Fig. 2). The arthropods further clustered into three clades; crustaceans, insects and arachnids. All the NKA α-subunit sequence obtained from C. quadricarinatus, C. destructor and C. cainii formed a distinct monophyletic group that was sister to a Homarus americanus sequence (AAN17736). Crayfish sequences were more closely related to those of the crab species Callinectes sapidus (AAG47843), Portunus trituberculatus (JX173959) and Pachygrapsus marmoratus (ABA02166) than to shrimp species Penaeus monodon (ABD59803), Fenneropenaeus indicus (ADN83843), Halocaridina rubra (KF650059), Litopenaeus stylirostris (JN561324) and Exopalaemon carinicaudagi (JQ360623) (Fig. 2).
V-type H+ATPase (HAT)
In the Cherax datasets, multiple H+-ATPase (HAT) subunits were identified (Table 2), however, only HAT 116 kDa subunit A was used in phylogenetic analyses. Subunit A was chosen as it is the main catalytic subunit in proton translocation. Translation of ORFS revealed that the predicted proteins from HAT 116 kda subunit A transcripts were the same length across the three Cherax species (831 aa, Table 2).
Conserved domains were identified in HAT subunit A including V_ATPase_I domain between 26–818 aa (protein family: pfam01496). Another predicted feature of the HAT-A predicted protein was seven putative transmembrane regions at positions: 398–420, 441–461, 532–550, 567–587, 640–660, 733–751 and 765–785 aa.
The HAT-A predicted protein was highly conserved in C. quadricarinatus, C. destructor and C. cainii (97–98% aa identity), as well as across arthropods in general (Fig. 4). The HAT-A from Cherax species had the greatest similarity with the HAT-116 kDA from other arthropods (for examples; 63–64% with L. vannamei (AEE25939); 71–72% with B. terrestris (XP_003397698); 70–71% with M. rotundata (XP_012140297); and 70–71% with C. floridanus (XP_011261602)).

Figure 4: Multiple alignment of three Cherax V-type-H+-ATPase subunit-a amino acid sequences with other species.
Multiple alignment of three Cherax V-type- H+-ATPase 116 kDa subunit-a amino acid sequences with other closely related species. Putative transmembrane domains are marked by black-boxed.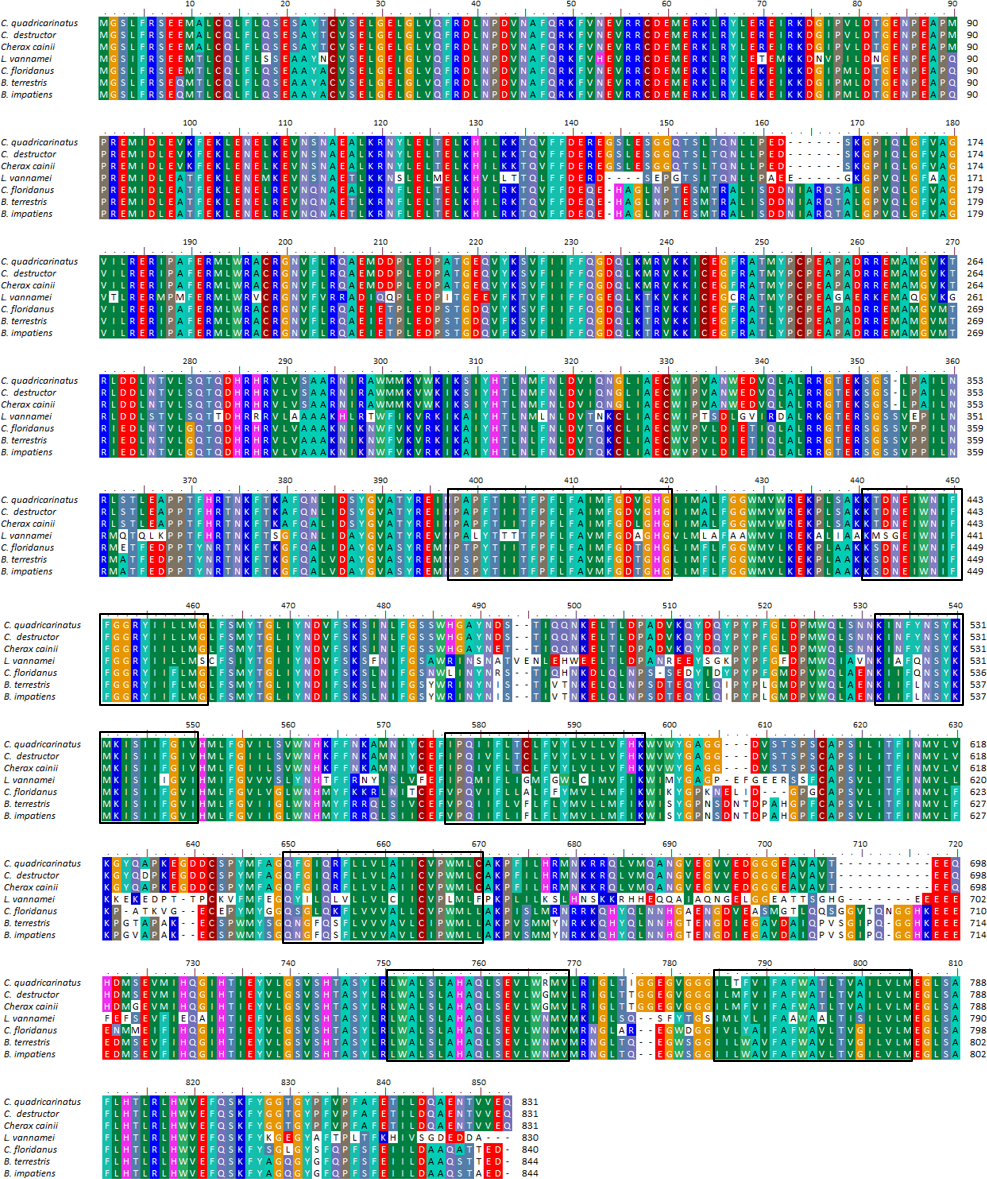
The phylogenetic tree based on the translated amino acid sequences revealed that V-type-H+-ATPase subunit-A formed three distinct groups; arthropods, fish and mammals. Arthropods further clustered into two clades; decapod crustaceans and insects. All crayfish species, C. quadricarinatus, C. destructor and C. cainii formed a monophyletic group that was sister to a group comprised of insects; and were distantly related to the shrimp L. vannamei, (AEE25939, Wang et al., 2012). The arthropod clade was distinct from a second well resolved clade of vertebrates (Fig. 2).
Other genes
Comparative sequence analyses showed that all genes including Na+/K+/2Cl− cotransporter (NKCC), Na+/Cl−/HCO3− cotransporter (NBC), Na+/H+ exchanger 3 (NHE3), Na+/Ca+2 exchanger 1 (NCX1), Arginine kinase (AK), Sarcoplasmic Ca+2-ATase (SERCA) and Calreticulin (CRT) had the putative proteins (the deduced amino acid composition) similar in length and weight across the three species (Table 2). All predicted proteins shared about 97–99% amino acid identity with the corresponding genes across the Cherax species (Table S1) and all the functional sites were conserved in the predicted proteins (Table 2 and Table S1).
Comparative molecular evolutionary analyses
Evolutionary analyses of ion transport genes in Cherax sp.
The molecular evolutionary analyses at the codon level between C. quadricarinatus, C. destructor and C. cainii showed that all candidate genes had a number of synonymous substitutions (Table 3). In terms of protein changing mutations, CAc, CAg and β-CA contained 9, 4 and 5 nonsynonymous mutations, respectively (Table 3). The other candidate genes examined in detail, NKA, HAT-A, NKCC, NBC, NHE3, NCX1, AK, SERCA, CRT had 3, 12, 37, 24, 91, 15, 10, 23 and 7 nonsynonymous mutations, respectively (Table 3). Relative evolutionary analysis showed that C. quadricarinatus, C. destructor and C. cainii have had an equal evolutionary rate for all of the candidate genes (the null hypothesis of unequal evolutionary rate was rejected at p < 0.05 (Table 3)).
| CAc | CAg | CAb | NKA | HAT-116k | NKCC | NBC | NHE3 | NCX1 | AK | SERCA | CRT | |
|---|---|---|---|---|---|---|---|---|---|---|---|---|
| Total sites/positions in analysis | 271 | 277 | 257 | 1,038 | 831 | 848 | 1,145 | 921 | 846 | 357 | 1,002 | 402 |
| Identical sites in all three species | 262 | 273 | 252 | 1,035 | 819 | 811 | 1,121 | 830 | 831 | 347 | 979 | 395 |
| Nonsynonymous sites | 9 | 4 | 5 | 3 | 12 | 37 | 24 | 91 | 15 | 10 | 23 | 7 |
| Synonymous substitutions at codon | 54 | 57 | 18 | 71 | 85 | 506 | 107 | 143 | 91 | 26 | 55 | 39 |
| Divergent sites in all three species | 0 | 0 | 0 | 0 | 0 | 1 | 1 | 9 | 1 | 1 | 1 | 0 |
| Unique differences in Redclaw | 3 | 0 | 0 | 1 | 6 | 11 | 7 | 29 | 7 | 1 | 6 | 1 |
| Unique differences in Yabby | 3 | 2 | 3 | 2 | 1 | 14 | 7 | 20 | 2 | 3 | 9 | 3 |
| Unique differences in Marron | 3 | 2 | 2 | 0 | 5 | 11 | 9 | 33 | 5 | 5 | 7 | 3 |
| Equal evolutionary rate between Redclaw & Yabby? | Yes (1.00)a | Yes (0.16) | Yes (0.08) | Yes (0.56) | Yes (0.06) | Yes (0.55) | Yes (0.8) | Yes (0.20) | Yes (0.10) | Yes (0.32) | Yes (0.44) | Yes (0.32) |
| Equal evolutionary rate between Redclaw &Marron? | Yes (1.0) | Yes (0.16) | Yes (0.16) | Yes (0.32) | Yes (0.76) | Yes (1) | Yes (0.8) | Yes (0.61) | Yes (0.56) | Yes (0.10) | Yes (0.78) | Yes (0.32) |
| Equal evolutionary rate between Yabby & Marron? | Yes (1.0) | Yes (1.00) | Yes (0.65) | Yes (0.16) | Yes (0.10) | Yes (0.55) | Yes (0.6) | Yes (0.07) | Yes (0.26) | Yes (0.48) | Yes (0.62) | Yes (1.0) |
| Average evolutionary divergence | 0.022 | 0.010 | 0.013 | 0.002 | 0.010 | 0.03 | 0.05 | 0.072 | 0.012 | 0.02 | 0.016 | 0.012 |
Notes:
- CAc
-
Cytoplasmic carbonic anhydrase
- CAg
-
GPI-linked carbonic anhydrase
- CAb
-
Beta carbonic anhydrase
- NKA
-
Na+/K+-ATPase alpha subunit
- HAT-116k
-
Vacuolar type H+-ATPase 116 kda
- NKCC
-
Na+/K+/2Cl− cotransporter
- NBC
-
Na+/HCOcotransporter
- NHE3
-
Na+/H+ exchanger 3
- NCX1
-
Na+/Ca+2 exchanger 1
- AK
-
Arginine kinase
- SERCA
-
Sarco/endoplasmic reticulum Ca+2-ATPase
- CRT
-
Calreticulin
Evolutionary analyses across crustacean species
Comparative analyses across arthropods, which included mostly crustacean species (around 15 species including three Cherax sp.), revealed a large number of non-synonymous mutations in all the sequences (173 in CAc, 128 in CAg, 143 in CAb, 243 in NKA, 355 in HAT-116k, 586 in NKCC, 506 in NBC, 504 in NHE3, 529 in NCX1, 78 in AK, 276 in SERCA and 193 in CRT) (see Table 4). Despite a large number of nonsynonymous mutations, HyPHy analysis (codon-by-codon natural selection estimations) detected that no candidate genes showed patterns of nucleotide variation consistent with the action of natural selection (p < 0.05).
| Enzymes | Gene | No. of species/ Sequences in analysis | Total sites in analysis | Total segregating sites | Total Identical sites | Rate of segregation/ site | Nucleotide diversity | In-Del |
|---|---|---|---|---|---|---|---|---|
| Cytoplasmic carbonic anhydrase | CAc | 15 | 265 | 173 | 92 | 0.65283 | 0.38225 | 0 |
| GPI-linked carbonic anhydrase | CAg | 8 | 287 | 128 | 159 | 0.445993 | 0.24029 | 0 |
| Beta carbonic anhydrase | CAb | 16 | 254 | 143 | 111 | 0.562992 | 0.2691 | 0 |
| Na+/K+-ATPase alpha subunit | NKA | 16 | 1,001 | 243 | 758 | 0.242757 | 0.08577 | 0 |
| Vacuolar type H+-ATPase 116 kda | HAT-116k | 15 | 803 | 355 | 448 | 0.442092 | 0.19255 | 0 |
| Na+/K+/2Cl− cotransporter | NKCC | 16 | 838 | 586 | 252 | 0.699284 | 0.39172 | 0 |
| Na+/HCO cotransporter | NBC | 16 | 1,033 | 506 | 527 | 0.489835 | 0.23662 | 0 |
| Na+/H+ exchanger 3 | NHE3 | 15 | 843 | 504 | 339 | 0.597865 | 0.25904 | 0 |
| Na+/Ca+2 exchanger 1 | NCX1 | 15 | 793 | 529 | 264 | 0.667087 | 0.28318 | 0 |
| Arginine kinase | AK | 15 | 355 | 78 | 277 | 0.219718 | 0.07329 | 0 |
| Sarco/endoplasmic reticulum Ca+2-ATPase | SERCA | 15 | 989 | 276 | 713 | 0.27907 | 0.12366 | 0 |
| Calreticulin | CRT | 15 | 396 | 193 | 203 | 0.487374 | 0.212 | 0 |
Tissue-specific expression analyses
The expression of a total of 80 important genes that are directly or indirectly associated with either acid–base balance or osmotic/ionic regulation was investigated in seven different tissue types (gills, hepatopancreas, heart, kidney, liver, nerve and testes) in C. quadricarinatus (Table S2). The results showed that 46% of the genes (37) were expressed in all types of tissues; 11% (nine genes) in six tissue types, 5% (four genes) in five tissue types, 8% (six genes) in four tissue types; 6% (five genes) in three tissue types; 14% (11 genes) in two tissue types (Fig. 5). Approximately 10% of the genes (eight) were expressed in only one tissue type, i.e., they were unique in that particular type of tissue. The highest number of genes were observed in the nerve (84%, 67 genes) followed by the gills (78%, 62 genes). The percentage of genes expressed in other tissues are 70% for heart (56 genes), 70% for kidney (56 genes), 69% for liver (55 genes), 67.5% for hepatopancreas (54 genes), and 66% for testes (53 genes) (Fig. 5).
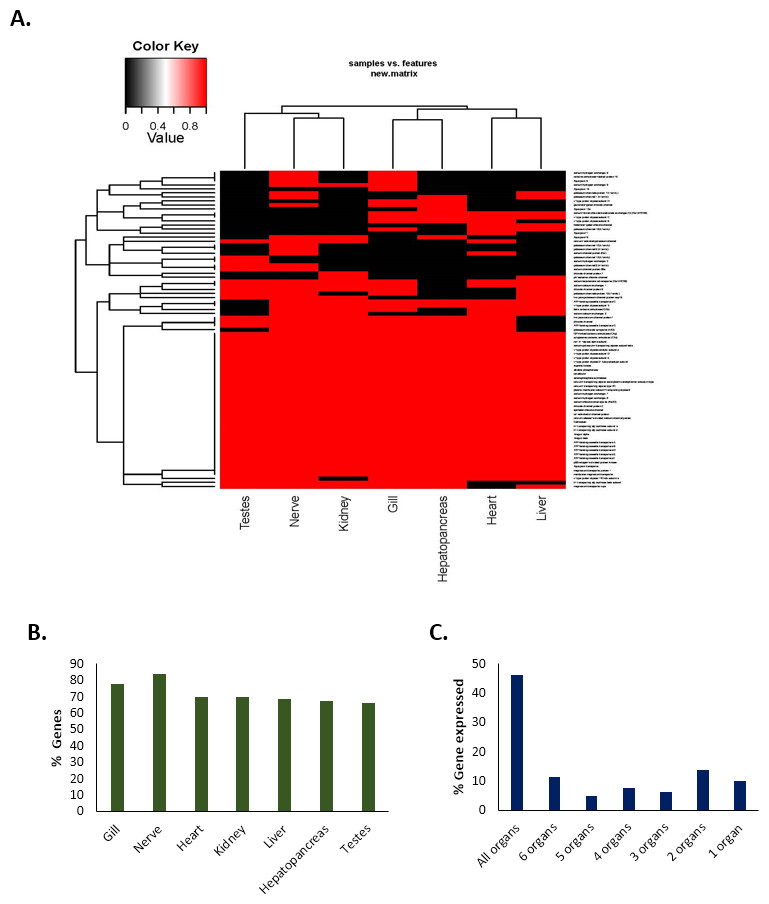
Figure 5: Tissue-specific expression/occurrences of important genes associated with pH balance or ion-regulation in Redclaw crayfish (Cherax quadricarinatus).
(A) Presence-absence heat-map (B) Tissue-specific percentage of genes expressed (C) Maximum types of organs with % of genes expressed therein.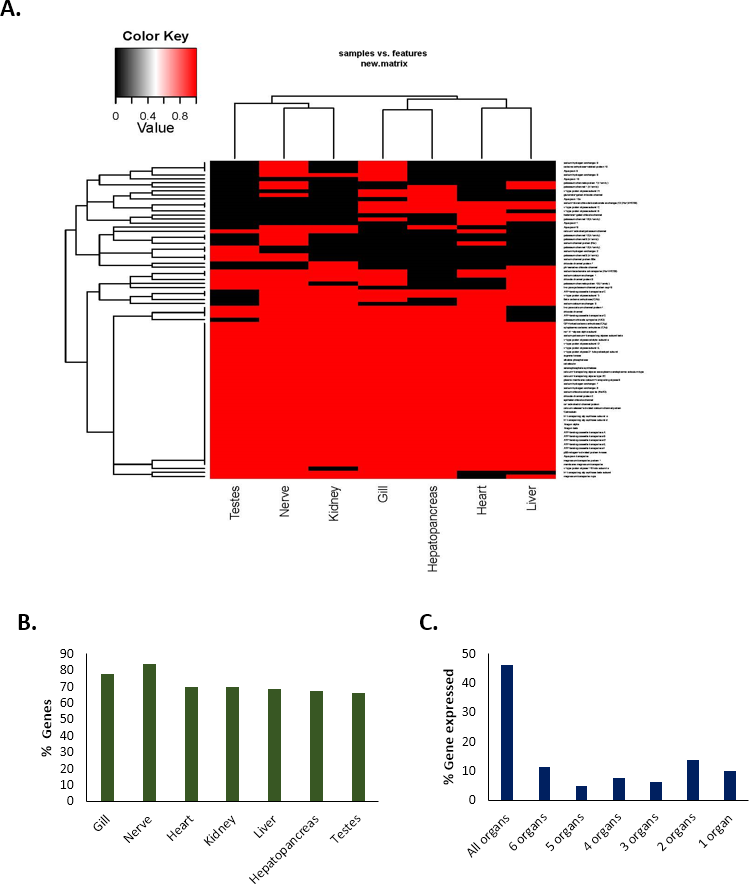
Discussion
Overall this study has demonstrated that most of the candidate genes involved in systemic acid–base balance and/or ion transport are highly conserved in the genus Cherax and in crustacean species in general. While these genes showed little variation across the three target species, we found no evidence of purifying selection shaping nucleotide variation in any of the genes.
Comparative molecular analyses
Carbonic anhydrase
Comparative analysis across the three Cherax species showed that both cytoplasmic and membrane linked CA were highly conserved, which may be explained by the conserved function of CA. The molecular structure of CA comprises four primary components: the Zn binding sites, the substrate association pocket, the threonine-199 loop and the proton shuttling mechanism (Christianson & Alexander, 1989; Merz, 1990; Krebs et al., 1993). In our study, we did not find any mutations in these important functional sites at the amino acid level in both cytoplasmic and membrane-associated isoforms of CA across the Cherax species. We did, however, find amino acid replacements outside of these functional sites and these may be important for adaptation to different pH environments in Cherax species.
Previous research has shown that many Cherax species, including C. quadricarinatus, C. destructor and C. cainii, naturally occur in locations with water of different pH levels (Macaranas et al., 1995; Bryant & Papas, 2007; Baker, De Bruyn & Mather (2008). Our recent study shows that cytoplasmic and membrane-associated isoforms of carbonic anhydrase gene expressed differentially at different pH levels (Ali et al., 2015b). Therefore, amino acid replacements in cytoplasmic and membrane linked CA may be associated with the differences in water chemistry experienced by different species.
Na+/K+-ATPase
All the expected features of NKA were highly conserved in the three Cherax species, including eight transmembrane domains (Mitsunaga-Nakatsubo et al., 1996), the putative ATP-binding site (Horisberger et al., 1991) and a phosphorylation site. In fact, only two conservative amino acid replacements were observed among the three Cherax species, an alanine to glycine replacement in C. destructor and an alanine to threonine replacement in C. quadricarinatus. Given that these Cherax species are naturally distributed in environments with diverse salinity and pH ranges (Bryant & Papas, 2007), you might expect to find more amino acid replacements in this gene. The lack of variation at the amino acid level may indicate other mechanisms are important for the response to salinity and pH changes in Cherax species. Changes in the level of expression of NKA associated with salinity or pH changes may be a plausible hypothesis for this lack of amino acid variation among Cherax species. A number of studies have demonstrated that NKA expression is strongly induced by changes in salinity and/or pH in the gills of decapod crustaceans lending support to this hypothesis (Luquet et al., 2005; Serrano & Henry, 2008; Wang et al., 2012; Han et al., 2015; Leone et al., in press; Li et al., 2015). This hypothesis needs to be further tested, however, before it can be supported.
H+-ATPase
Inter-species evolutionary analyses between the three Cherax crayfish and other arthropod species showed that V-H+-ATPase subunit A (HAT-A) was largely conserved at the protein sequence level, but had patterns of nucleotide variation consistent with neutral evolution. The small amount of amino acid variation found at this enzyme in Cherax species is probably because of its conserved function, as it is one of key enzymes via which many crustaceans maintain their internal acid–base balance (Kitagawa et al., 2008; Faleiros et al., 2010; Lee et al., 2011; Muench, Trinick & Harrison, 2011; Towle, Henry & Terwilliger, 2011; Wang et al., 2012; Boudour-Boucheker et al., 2014; Marshansky, Rubinstein & Grüber, 2014; Lucena et al., 2015; Rawson et al., 2015). As the maintenance of acid–base balance is very important in aquatic crustaceans, amino acid replacements in important functional domains might have a deleterious effect on the function and activity of this enzyme. Alternatively, amino acid replacements in V-H+-ATPase subunit A that increase its activity under different pH conditions may be beneficial to the different Cherax species.
Other genes
The comparative molecular analyses showed that most other genes including Na+/K+/2Cl− cotransporter (NKCC), Na+/Cl−/HCO3− cotransporter (NBC), Na+/H+ exchanger 3 (NHE3), Na+/Ca+2 exchanger 1 (NCX1), Arginine kinase (AK), Sarcoplasmic Ca+2-ATase (SERCA) and Calreticulin (CRT) were conserved across the three Cherax crayfish (Tables 3 and 4). The underlying reason may be that the these genes encode a set of enzymes that are actively or passively associated with the fundamental and common physiological processes of ion-regulation in crustaceans (Lucu, 1989; Onken, Graszynski & Zeiske, 1991; Onken, Tresguerres & Luquet, 2003; Ahearn, Mandal & Mandal, 2004; Serrano, Halanych & Henry, 2007; Mandal et al., 2009; Lv et al., 2015; Ren et al., 2015; Xu et al., 2015). The high level of amino acid conservation in these predicted proteins may be attributed to the fact that they are found in important biochemical pathways that influence systemic acid–base balance and/or ion transport (Uda et al., 2006; Hwang, Lee & Lin, 2011; Hiroi & McCormick, 2012; McNamara & Faria, 2012). These genes have previously been demonstrated to function as important enzymes involved in osmoregulatory organs such as gills and epipodites in a number of crustaceans (Towle & Weihrauch, 2001; Weihrauch et al., 2004; Freire, Onken & McNamara, 2008; Mandal et al., 2009). In fact, gene expression data for Na+/K +/2Cl− cotransporter (Luquet et al., 2005; Havird, Henry & Wilson, 2013) and Calreticulin (Luana et al., 2007; Lv et al., 2015; Xu et al., 2015) show that they are induced under different ionic conditions and arginine kinase has also been shown to be induced under different pH and salinity conditions (Serrano, Halanych & Henry, 2007; Xie et al., 2014; Ali et al., 2015b).
Tissue-specific expression analyses
Tissue-specific expression of the candidate genes involved in systemic acid–base balance revealed that most of the major genes involved in this process including carbonic anhydrase (CA), Na+/K+-ATPase (NKA), Vacuolar type H+-ATPase (HAT), Na+/H+ exchanger (NHE), Na+/K+/2Cl− cotransporter (NKCC), Na+/Cl−/HCOcotransporter, Arginine kinase (AK) and Sarco/endoplasmic reticulum Ca+2-ATPase (SERCA) were expressed in most tissue types. This indicates that the majority of ion transport genes are expressed in most tissue types in freshwater crayfish and is something that needs to be taken into account in future gene expression studies of osmoregulation genes in specific tissues such as gills. As all the major genes were expressed in tissues other than gills, it implies an important physiological role for these genes outside of osmoregulation. For example Na+/K+-ATPase, an important osmoregulatory gene, has other important functions including as a signal transducer/integrator that regulates the mitogen activated stress kinase pathway, intracellular calcium concentrations and reactive oxygen species (Xie & Askari, 2002; Yuan et al., 2005; Bhavsar et al., 2014). As many osmoregulation pH balance genes potentially encode for multifunctional proteins that are required to perform important functions their expression across multiple tissue types is probably not surprising.
The two tissue types with highest number of candidate genes expressed were the gills and nervous system. A large number of genes involved in acid–base balance and osmic-/ionic-regulation expressed in the gills was expected based on previous research in decapod crustaceans (Freire, Onken & McNamara, 2008; Romano & Zeng, 2012). The largest number of ion transport and pH balance candidate genes were expressed in nervous tissue and this data is supported by recent research on the American lobster Homarus americanus (McGrath et al., 2016). In this paper the authors found that a large number of ion channel gene families were over expressed in nerve tissues relative to heart and abdominal muscle. This pattern is not surprising as many ion transport related genes are highly expressed in nervous tissue as they play an important role in generating action potential (Fry & Jabr, 2010; Benarroch, 2011; Deval & Lingueglia, 2015; Hertz et al., 2015; Shrivastava et al., 2015; Wu et al., 2015; Zhang et al., 2015).
Conclusions
We analysed the molecular differences at amino acid and nucleotide levels in most of the major genes involved in acid–base balance and osmotic/ionic regulation in three freshwater crayfish of the genus Cherax. The majority of these genes were expressed across most tissue types and were highly conserved at the amino-acid level. These findings indicate that these genes are important and probably have diverse functions related to ion exchange and pH balance across different tissues in freshwater crayfish.
Supplemental Information
Identity matrix across species based on amino acid compositions
Identity matrix based on amino acid composition between three Cherax species (Cherax quadricarnatus, Cherax cainii and Cherax destructor) and other crustaceans. The first row and first column indicate species. Values in the cells indicate identity in percentage. CAc, Cytoplasmic carbonic anhydrase; CAg, GPI-linked carbonic anhydrase; CAb, Beta carbonic anhydrase; NKA, Na+/K+-ATPase alpha subunit; HAT, Vacuolar type H+-ATPase 116 kda; NKCC, Na+/K+/2Cl− cotransporter; NBC, Na+/HCO cotransporter; NHE, Na+/H+ exchanger 3; NCX, Na+/Ca+2 exchanger 1; AK, Arginine kinase; and CRT, Calreticulin.
Tissue-specific expression of major pH- and osmoregulatory genes in Redclaw crayfish Cherax quadricarinatus
Information on whether the genes are present or not in particular tissue. ‘p’ in the celll indicates present and ‘a’ indicates absent. A total of eighty (80) most important genes associated with pH balance and osmo-regulation were observed.
Contig information—Gills
Annotated information of all the assembled contings obtained from Gills of freshwater crayfish Cherax quadricarinatus. Reads which met our quality criteria (Q > 30, N bases <1%) were accepted for assembly. The filtered reads were assembled with the Trinity short read de novo assembler using the stranded option for Illumina data (Version 2014-04-13p1) and the unstranded option for Ion Torrent data. Assembled data were used as BLASTx queries against the NCBI NR protein database using BLAST + (Version 2.2.29) with a stringency of 10 × e−5. First row contains information on: number of original contigs, sequence length (contig length bp), seq. description (gene names), number of HITs and mean e-values (stringency).
Contig information—Heart
Annotated information of all the assembled contings obtained from Heart of freshwater crayfish Cherax quadricarinatus. Reads which met our quality criteria (Q > 30, N bases <1%) were accepted for assembly. The filtered reads were assembled with the Trinity short read de novo assembler using the stranded option for Illumina data (Version 2014-04-13p1) and the unstranded option for Ion Torrent data. Assembled data were used as BLASTx queries against the NCBI NR protein database using BLAST + (Version 2.2.29) with a stringency of 10 × e−5. First row contains information on: number of original contigs, sequence length (contig length bp), seq. description (gene names), number of HITs and mean e-values (stringency).
Contig information—Kidney
Annotated information of all the assembled contings obtained from Kidneys of freshwater crayfish Cherax quadricarinatus. Reads which met our quality criteria (Q > 30, N bases <1%) were accepted for assembly. The filtered reads were assembled with the Trinity short read de novo assembler using the stranded option for Illumina data (Version 2014-04-13p1) and the unstranded option for Ion Torrent data. Assembled data were used as BLASTx queries against the NCBI NR protein database using BLAST + (Version 2.2.29) with a stringency of 10 × e−5. First row contains information on: number of original contigs, sequence length (contig length bp), seq. description (gene names), number of HITs and mean e-values (stringency).
Contig information—Liver
Annotated information of all the assembled contings obtained from liver of freshwater crayfish Cherax quadricarinatus. Reads which met our quality criteria (Q > 30, N bases <1%) were accepted for assembly. The filtered reads were assembled with the Trinity short read de novo assembler using the stranded option for Illumina data (Version 2014-04-13p1) and the unstranded option for Ion Torrent data. Assembled data were used as BLASTx queries against the NCBI NR protein database using BLAST + (Version 2.2.29) with a stringency of 10 × e−5. First row contains information on: number of original contigs, sequence length (contig length bp), seq. description (gene names), number of HITs and mean e-values (stringency).
Contig information—Nerve
Annotated information of all the assembled contings obtained from nerves of freshwater crayfish Cherax quadricarinatus. Reads which met our quality criteria (Q > 30, N bases <1%) were accepted for assembly. The filtered reads were assembled with the Trinity short read de novo assembler using the stranded option for Illumina data (Version 2014-04-13p1) and the unstranded option for Ion Torrent data. Assembled data were used as BLASTx queries against the NCBI NR protein database using BLAST + (Version 2.2.29) with a stringency of 10 × e−5. First row contains information on: number of original contigs, sequence length (contig length bp), seq. description (gene names), number of HITs and mean e-values (stringency).
Contig information—Testes
Annotated information of all the assembled contings obtained from Testes of freshwater crayfish Cherax quadricarinatus. Reads which met our quality criteria (Q > 30, N bases <1%) were accepted for assembly. The filtered reads were assembled with the Trinity short read de novo assembler using the stranded option for Illumina data (Version 2014-04-13p1) and the unstranded option for Ion Torrent data. Assembled data were used as BLASTx queries against the NCBI NR protein database using BLAST+ (Version 2.2.29) with a stringency of 10 × e−5. First row contains information on: number of original contigs, sequence length (contig length bp), seq. description (gene names), number of HITs and mean e-values (stringency).
Contig information—Hepatopancreas
Annotated information of all the assembled contings obtained from Hepatopancreas of freshwater crayfish Cherax quadricarinatus. Reads which met our quality criteria (Q > 30, N bases <1%) were accepted for assembly. The filtered reads were assembled with the Trinity short read de novo assembler using the stranded option for Illumina data (Version 2014-04-13p1) and the unstranded option for Ion Torrent data. Assembled data were used as BLASTx queries against the NCBI NR protein database using BLAST + (Version 2.2.29) with a stringency of 10 × e−5. First row contains information on: number of original contigs, sequence length (contig length bp), seq. description (gene names), number of HITs and mean e-values (stringency).