
Quantitative real-time PCR analysis of Anopheles dirus TEP1 and NOS during Plasmodium berghei infection, using three reference genes
- Published
- Accepted
- Received
- Academic Editor
- Erika Braga
- Subject Areas
- Molecular Biology, Parasitology
- Keywords
- Anopheles dirus, Plasmodium berghei, TEP1, NOS, Reference genes, Normalization
- Copyright
- © 2017 Liew et al.
- Licence
- This is an open access article distributed under the terms of the Creative Commons Attribution License, which permits unrestricted use, distribution, reproduction and adaptation in any medium and for any purpose provided that it is properly attributed. For attribution, the original author(s), title, publication source (PeerJ) and either DOI or URL of the article must be cited.
- Cite this article
- 2017. Quantitative real-time PCR analysis of Anopheles dirus TEP1 and NOS during Plasmodium berghei infection, using three reference genes. PeerJ 5:e3577 https://doi.org/10.7717/peerj.3577
Abstract
Quantitative reverse transcription PCR (qRT-PCR) has been an integral part of characterizing the immunity of Anopheles mosquitoes towards Plasmodium invasion. Two anti-Plasmodium factors of Anopheles, thioester-containing protein 1 (TEP1) and nitric oxide synthase (NOS), play a role in the refractoriness of Anopheles towards Plasmodium infection and are generally expressed during infection. However, these are less studied in Anopheles dirus, a dominant malaria vector in Southeast Asia. Furthermore, most studies used a single reference gene for normalization during gene expression analysis without proper validation. This may lead to erroneous quantification of expression levels. Therefore, the present study characterized and investigated the expression profiles of TEP1 and NOS of Anopheles dirus during P. berghei infection. Prior to that, the elongation factor 1-alpha (EF1), actin 1 (Act) and ribosomal protein S7 (S7) genes were validated for their suitability as a set of reference genes. TEP1 and NOS expressions in An. dirus were found to be significantly induced after P. berghei infection.
Introduction
Advances in molecular biology and gene expression techniques have enabled researchers to identify genes involved in the immunological response of Anopheles mosquitoes towards Plasmodium infection (Chen, Mathur & James, 2008; Volohonsky et al., 2017). Understanding of this immunity complex may lead to development of novel approaches for controlling malaria transmission, such as transgenic mosquitoes and inhibition of parasite development in the mosquito. The immunological changes caused by Plasmodium infection at the transcriptome level can be captured in microarray gene expression and quantitative reverse transcription PCR (qRT-PCR) analyses (Aguilar et al., 2005). The qRT-PCR is used as a tool to validate expression data from microarray analyses and to detect changes in the expression levels of target genes.
Thioester-containing protein 1 (TEP1) has been shown to mediate anti-Plasmodium responses in various mosquito species (Clayton, Dong & Dimopoulos, 2014; Jaramillo-Gutierrez et al., 2009). In the hemolymph of the mosquito, TEP1, leucine-rich repeat immune protein 1 (LRIM1) and Anopheles-Plasmodium-responsive leucine-rich repeat 1 (APL1) protein combine to form a stable complex (Fraiture et al., 2009; Povelones et al., 2011). The precise mode of action of this TEP1-associated complex is not known but it has been implicated in the vector competence of An. gambiae (Blandin et al., 2004; Fraiture et al., 2009) and An. quadrinnulatus (Habtewold et al., 2008). Silencing of the TEP1, LRIM1 or APL1 gene abolishes parasite melanization and converts refractory or non-compatible Anopheles strain into a susceptible one.
Nitric oxide synthase (NOS) catalyzes the conversion of L-arginine to L-citrulline in the mosquito, producing nitric oxide which is toxic to the parasite (Clayton, Dong & Dimopoulos, 2014). The generated nitric oxide in the midgut cells and subsequent tyrosine nitration kill the parasite ookinetes as they traverse the midgut epithelial cells (Kumar et al., 2004). Furthermore, NOS plays a role in hemocyte-mediated immune responses in the hemocoel of the mosquito and is expressed in the hemocytes and fat body (Hillyer & Estevez-Lao, 2010). Elevated levels of NOS gene expression have been observed in the midgut epithelial cells of An. stephensi invaded by P. berghei ookinetes (Han et al., 2000). Moreover, chemical inhibition of NOS resulted in an increase in the number of oocysts in infected An. stephensi (Luckhart et al., 1998) and An. culicifacies B (Vijay et al., 2011). These findings indicate that NOS is also a determinant of vector refractoriness in Anopheles mosquitoes (Vijay et al., 2011). Interestingly, a study has shown that some NOS activity is required for survival of the Plasmodium at the early developmental stages but it has an opposite effect at a later stage by limiting oocyst survival in the mosquito (Gupta et al., 2009).
The TEP1 and NOS may be working in concert to eliminate parasites in the mosquito. The heme peroxidase (HPX2)/NADPH oxidase 5 (NOX5) system of An. gambiae, along with NOS, mediates nitration of the midgut epithelial cells and potentiates nitric oxide toxicity against P. berghei. Evidence shows that epithelial nitration precedes TEP1-mediated lysis. De Almeida Oliveira, Lieberman & Barillas-Mury (2012) proposed that epithelial nitration is needed for effective TEP1-mediated lysis of ookinetes. Furthermore, silencing the TEP1, leucine-rich repeat proteins and HPX2/NOX5, renders the resistant An. gambiae L3-5 strain susceptible to P. berghei infection. These findings demonstrate the concerted roles of the proteins in the defense mechanism of Anopheles mosquitoes (Eldering et al., 2016).
It is evident that these studies have greatly advanced our understanding of Anopheles immunity and qRT-PCR has been featured as an important investigative tool in these informative studies. However, most of the investigations used only one reference gene (often, the ribosomal protein S7 gene) for normalization of expression data and no validation was documented. As robust as qRT-PCR is, it may still be subjected to systematic error from technical and biological limitations (Kozera & Rapacz, 2013; Omondi et al., 2015). Thus, proper normalization is crucial to ensure an accurate result. It is recommended that at least three different reference genes be used for normalization as this will increase accuracy and resolution. Furthermore, the reference genes for normalization should be validated for different experimental designs to obtain reliable gene expression results (Bustin et al., 2009; Derveaux, Vandesompele & Hellemans, 2010; Ponton et al., 2011).
Anopheles dirus is the primary malaria vector in Southeast Asia and is capable of transmitting all human malaria parasites (Coatney et al., 1971; Manguin et al., 2008; Marchand et al., 2011; Nakazawa et al., 2009; Vythilingam et al., 2005). However, molecular understanding of immune responses in An. dirus is still lacking. The recent availability of the An. dirus genome sequence (Neafsey et al., 2015) should facilitate and enhance research on its immune response mechanisms. Given the important roles TEP1 and NOS play in the immune defense of An. gambiae and An. stephensi against Plasmodium, we postulate that both immune factors in An. dirus would play similar roles against the parasites.
Thus, the current study aims to have better understanding of the molecular immune responses in an important Southeast Asian malaria vector. The implementation of a proper qRT-PCR assay is also important to yield data that is more comparable and reliable. Indeed, these will advance the characterization of immune traits and transmission mechanisms of major malaria vectors in a local context. Aside from a few of studies reporting the use of the An. dirus/P. berghei model (Fracisco et al., 2010; Lapcharoen et al., 2012), An. dirus has been determined to be permissive to P. berghei infection in the laboratory (JWK Liew, 2017, unpublished data). Hence, the current study validated elongation factor 1-alpha (EF1), actin 1 (Act) and S7 as reference genes for normalization in qRT-PCR, followed by investigation on TEP1 and NOS expression profiles in An. dirus during P. berghei ANKA infection.
Materials and Methods
Total RNA extraction of whole mosquitoes and cDNA synthesis
Total RNA was extracted from pooled whole mosquitoes as previously described (Khan et al., 2016). Each batch of RNA was extracted from three female mosquitoes using ReliaPrep™ RNA Tissue Miniprep System (Promega, Madison, WI, USA). The pooled mosquitoes were first cold-anesthetized before homogenization in cold lysis buffer using the handheld homogenizer, BioMasher-II (Nippi, Tokyo, Japan). The total RNA was then rendered DNA-free using TURBO DNA-free™ kit (Ambion, Vilnius, Lithuania). cDNA was synthesized from 150 ng of total RNA using the qPCRBIO cDNA synthesis kit (PCR Biosystems, London, UK).
PCR amplification of AdTEP1 and AdNOS coding sequences and of AdEF1 and AdAct partial sequences
At the time of this study, the An. dirus genome was not sequenced. Only An. dirus TEP1 (GenBank: FJ263422) and S7 (GenBank: AY369135.2) partial sequences were available. Thus, rapid amplification of cDNA ends (RACE), using the SMARTer™ RACE cDNA Amplification kit (Clontech, California, USA) was performed to obtain full length coding sequences of AdTEP1 and AdNOS. Nested RACE PCR was carried out according to the manufacturer’s instructions. For elongation factor 1-alpha, AdEF1 was amplified using degenerate primers designed based on aligned sequences of Aedes aegypti (GenBank: DQ440206), Culex quinquefasciatus (GenBank: XM_001850793) and An. gambiae (GenBank: XM_308429.3), while partial sequence of AdAct was amplified using universal primers designed by Staley et al. (2010). These PCR amplifications were performed using DreamTaq Green DNA polymerase (Thermo Fisher Scientific, Waltham, MA, USA). All amplicons were cloned into pGEM®-T vector (Promega, Madison, USA) and sequenced. The primers used for both PCR are shown in Table 1.
| Primer | Sequence (5′–3′) |
|---|---|
| TEP1 | |
| GSP1: Ad5RaTEP1 | GTCCTAGAACCCTGATGCTCCAGCAGTGC |
| NGSP1: Ad5RaTEP1N1 | CGATGTCAGCGCTACACCATTCCGCAGACC |
| GSP2: Ad3RaTEP1 | CAAGCAGACGGCTCCTTCGGTGTGTGG |
| NGSP2: Ad3RaTEP1N2 | GCTGGTTGAGAGGGCATACGAGTGGCTCG |
| NOS | |
| GSP1: AdNOS5Ra | CCTCGCGCGACAGTGCGAGGAACACCCG |
| NGSP1: Ad5RaNOSN1 | CTGGACCATCTCCTGCTTCTCGTCCCGG |
| GSP2: AdNOS3Ra | GTGCGCAGCGCACCGTCGTTCCACATGTCG |
| NGSP2: Ad3RaNOSN2 | CCGACCAAGCCGGTCATCCTGATCGGTC |
| EF1 | |
| EF1-F1 | ATGGGTAAGGARAAGACTCA |
| EF1-R1 | GACCTTCTCCTTGATYTCG |
| Act | |
| Act-2F | ATGGTCGGYATGGGNCAGAAGGACTC |
| Act-8R | GATTCCATACCCAGGAAGGADGG |
Molecular and phylogenetic analysis of AdTEP1 and AdNOS
The AdTEP1 and AdNOS consensus sequences were formed from the 5′-RACE and 3′-RACE PCR products of each gene using BioEdit Sequence Alignment Editor v7.2.3. BLAST (Johnson et al., 2008) and Open Reading Frame Finder (ORFfinder) programs from NCBI were used to obtain and analyze the coding sequences of AdTEP1 and AdNOS. Putative conserved domains and protein structure were analyzed using BLASTP. The TEP1 and NOS sequences of several insects were aligned using Clustal Omega and phylogenetic trees were constructed (Jukes-Cantor model; neighbor-joining method; 1,000 bootstrap value) using MEGA 7.0.21 software. All sequences were submitted to GenBank.
Plasmodium berghei infection of An. dirus mosquitoes
Anopheles dirus WRAIR2 strain was reared at a temperature of 25–27 °C, 70–80% humidity and 12:12 h light-dark photoperiod. In every experimental replicate, five- to seven-day old female An. dirus mosquitoes, emerged from the same larva tray were used. The mosquitoes were placed in the same cage and given 10% sugar solution supplemented with Vitamin B complex, ad libitum. One night before blood feeding on a P. berghei ANKA-infected BALB/c female mouse, female mosquitoes were starved in an ambient temperature of 20 ± 1 °C and 80% humidity. Subsequently, blood feeding and containment of engorged mosquitoes were performed in the same environmental conditions. Female mosquitoes fed on healthy mouse were used as controls. All mosquito infections were performed at gametocytemia of 0.42–0.64% (parasitemia: 5.86–6.36%). It was found that fully engorged mosquitoes which fed on such levels of parasites, will have a substantial number of oocysts in their midguts and are 100% prevalent with sporozoites present in their salivary glands(JWK Liew, 2017, unpublished data). Ethical approval for the study was obtained from the Faculty of Medicine Institutional Animal Care and Use Committee, University of Malaya, Malaysia (Ethics Reference no.: 20150407/PARA/R/MBK).
Quantitative reverse transcription PCR of AdTEP1 and AdNOS post P. berghei infection
Total RNA was extracted at 12 h, 24 h, 48 h and Day 5 post infection (PI) and reverse transcribed. The PCR conditions were the same for all primers (Table 2) i.e., 95 ° C for 30 s, 40 cycles of 95 °C for 10 s and 57.6 °C for 25 s; and a melt curve step from 65 to 95 °C, with increment of 0.5 °C every 5 s. The qPCR was performed using SsoAdvanced™ Universal SYBR® Green Supermix (Bio-Rad, Hercules, CA, USA) on Bio-Rad CFX96™ Real-Time System. The primers were designed using the online PrimerQuest tool on Integrated DNA Technologies website, following the suggestions in the SsoAdvanced™ Universal SYBR® Green Supermix instruction manual. A 20 µL reaction contained 312.5 nM of each forward and reverse primer and 6 ng of cDNA. Results of the PCR were analyzed by the Bio-Rad CFX Manager™ 3.1 software. Expression levels were normalized against those of EF1, Act and S7. Relative expression was calculated using the 2−ΔΔCT formula, compared to the controls. The experiment was repeated 4 times.
| Primer | Sequence (5′–3′) | Expected size (bp) | PCR efficiency |
|---|---|---|---|
| TEP1 | |||
| AdrtTEP1F3 | GGCAAAGTCCATGCAAAC | 126 | 103.3 |
| AdrtTEP1R3 | ATAACGGAACCAACCTCATC | ||
| NOS | |||
| AdrtNOSF2 | GGAGAAAGCGCACATCTAC | 116 | 109.2 |
| AdrtNOSR2 | ACTTCTCCATTTCCGTTTCC | ||
| EF1 | |||
| AdrtEF1F1 | CCGGACATCGTGATTTCAT | 118 | 102.8 |
| AdrtEF1R1 | TGGCCGTTCTTGGAGATA | ||
| Act | |||
| AdrtACTF2 | TCTGACCGACTACCTGAT | 130 | 100.0 |
| AdrtACTR2 | CATCTCCTGCTCGAAGTC | ||
| S7 | |||
| AdrtS7F1 | GAGGTCGAGTTCAACAACAA | 132 | 108.4 |
| AdrtS7R1 | GAACACGACGTGCTTACC |
Gene expression stabilities and statistical analysis
To determine the gene expression stabilities of AdEF1, AdAct and AdS7, NormFinder v0.953 Microsoft Excel add-in (Andersen, Jensen & Orntoft, 2004) and Bio-Rad CFX Manager™ 3.1 software were used. The CFX manager software determines the target stability values by adopting the pairwise variation strategy as in geNorm (Vandesompele et al., 2002). Additionally, the comparative delta-Ct method (Silver et al., 2006) was also employed toestablish gene stability. For statistical analysis, one-way ANOVA with multiple comparisons of Tukey was performed with 95% confidence intervals (alpha = 0.05) using GraphPad Prism version 5.01.
Results
Molecular and phylogenetic analyses of AdTEP1 and AdNOS proteins
Details of the proteins are shown in Table 3. The AdTEP1 coding sequence has 71% and 98% similarity to An. gambiae TEP-1 mRNA (GenBank: AF291654.1) and An. dirus strain WRAIR2 contig 1.4921, whole genome shotgun (WGS) sequence (GenBank: APCL01004922.1), respectively. Putative conserved domains detected on the protein include alpha-2 macroglobulin associated components (A2M-N-2, A2M receptor, A2M complement component), thioester regions and isoprene C2-like family (Fig. 1). As for AdNOS, it is shown to be 89% similar to An. gambiae str. PEST AGAP008255-PA mRNA (GenBank: XM_317213.1) and 99% similar to An. dirus strain WRAIR2 contig 1.1607, WGS sequence (GenBank: APCL01001608.1). BLASTP detected typical conserved domains of NOS proteins in the protein sequence (Fig. 1).
| Gene | Total base pairs (bp) | Protein length (amino acids) | GenBank accession no. | Isoelectric pointa | Molecular weight (Dalton)a |
|---|---|---|---|---|---|
| TEP1 | 2,733 | 910 | KY465474 | 6.91 | 102644.20 |
| NOS | 3,006 | 1,001 | KY465473 | 6.22 | 114212.80 |
| EF1 | 1,137 | – | KY022437 | – | – |
| Act | 683 | – | KY022436 | – | – |
Notes:
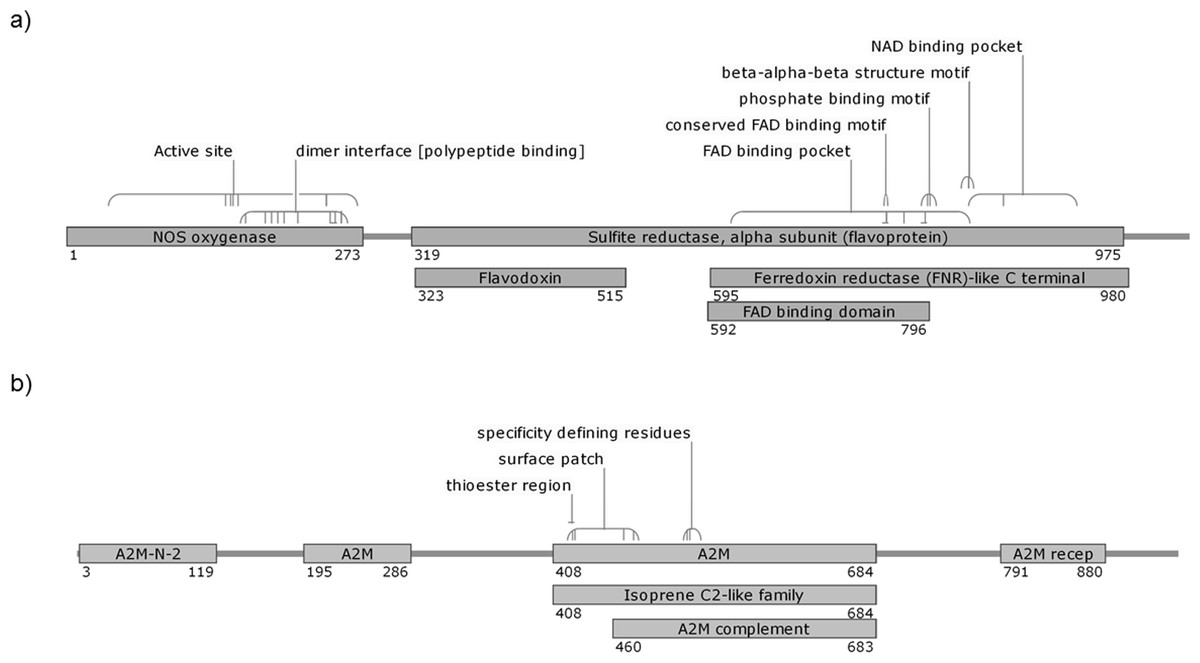
Figure 1: Putative conserved domains of An. dirus (A) NOS and (B) TEP1 protein detected by BLASTP.
The numbers denote the region of the domains on the protein sequence. The diagrams are not drawn to scale. FAD, flavine adenine dinucleotide; NAD, nicotinamide adenine dinucleotide; A2M-N-2, Alpha-2-macroglobulin family N-terminal region; A2M, Protein similar to Alpha-2-macroglobulin; A2M recep, Alpha-2-macroglobulin receptor; A2M complement, Alpha-2-macroglobulin complement component.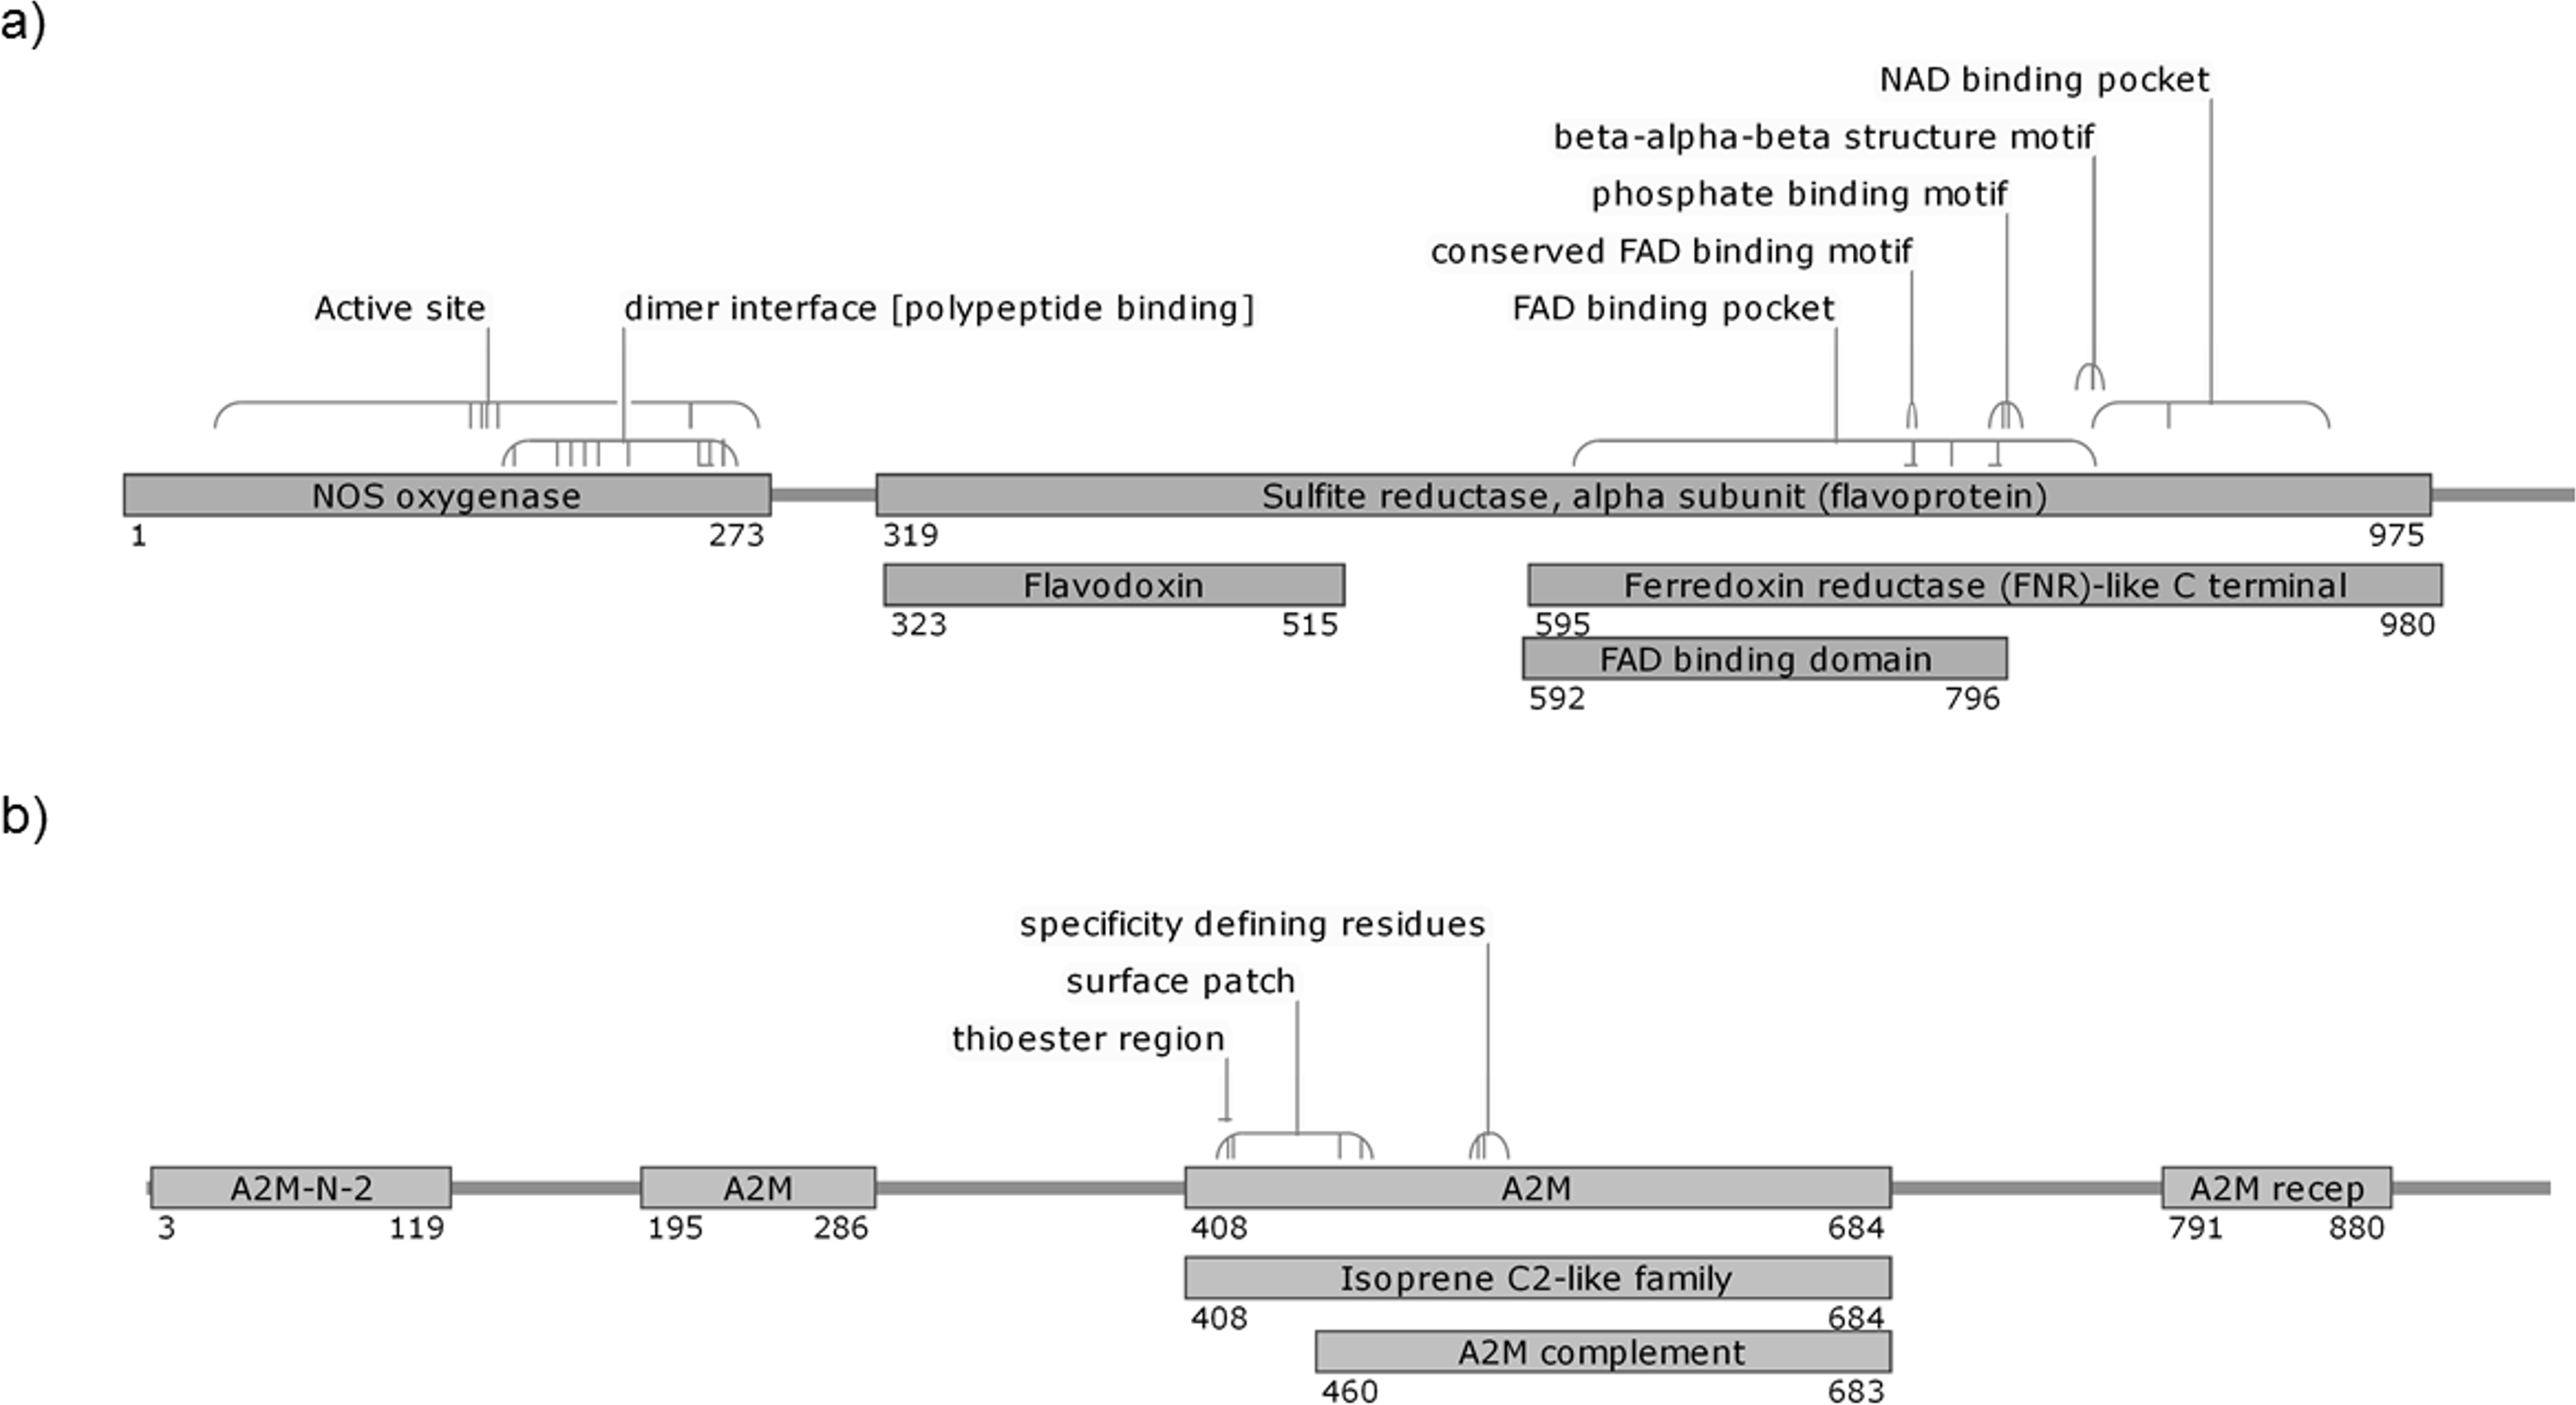
The NOS protein is typically conserved among insect species, demonstrating high sequence similarity, especially among the anopheline mosquitoes. On the other hand, the insects’ TEP1 protein sequences are considerably conserved, but do not exhibit high sequence identity as that of NOS protein (Table 4). Multiple sequence alignment (File S1) showed that the TEP1 protein sequences vary among the insects, albeit are more similar within the Anopheles genus. AdTEP1 is closer in homology to that of An. gambiae and An. arabiensis. This is also reflected in the phylogenetic tree (Fig. 2).
| Organism | GenBank accession no. | % Identity |
|---|---|---|
| TEP1 | ||
| An. gambiae | AAG00600 | 72.28 |
| An. arabiensis | ACG68535 | 72.28 |
| An. sinensis | KFB36250 | 61.67 |
| An. darlingi | ETN59728 | 54.71 |
| Ae. aegypti | XP_001660377 | 42.54 |
| Cx. quinquefasciatus | XP_001842016 | 41.48 |
| D. melanogaster | NP_523578 | 28.17 |
| NOS | ||
| An. stephensi | O61608.2 | 97.60 |
| An. gambiae | XP_317213 | 96.20 |
| An. sinensis | KFB45232 | 95.10 |
| An. darlingi | ETN60994 | 85.47 |
| An. aquasalis | AEK26396 | 78.21 |
| Ae. aegypti | XP_001660328 | 88.50 |
| Cx. quinquefasciatus | XP_001842036 | 75.88 |
| D. melanogaster | NP_001027243.2 | 73.75 |
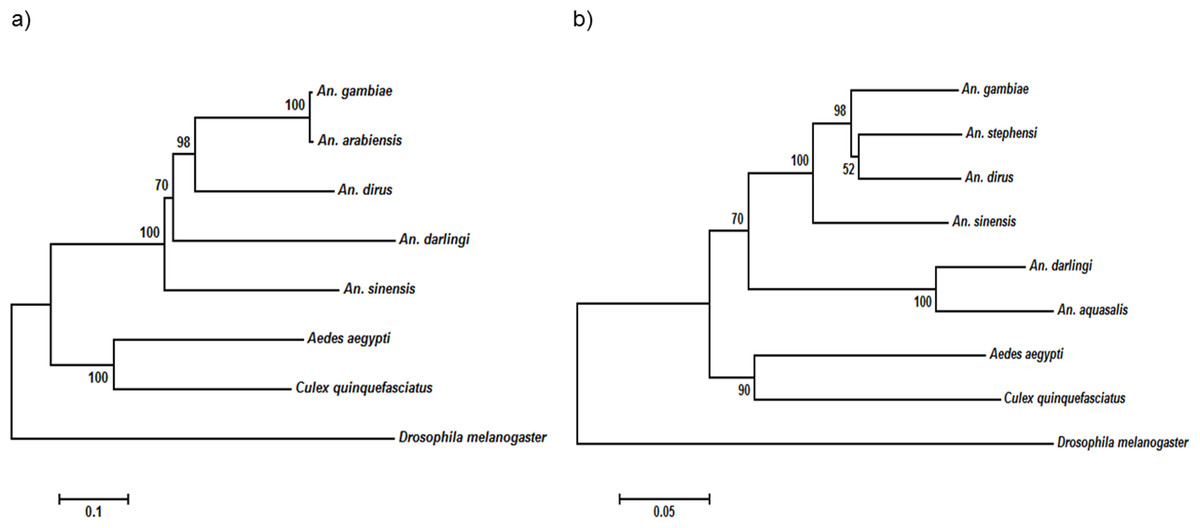
Figure 2: Phylogenetic tree of (A) TEP1 gene and (B) NOS gene.
The scale bar at the bottom are in the units of number of base substitutions per site.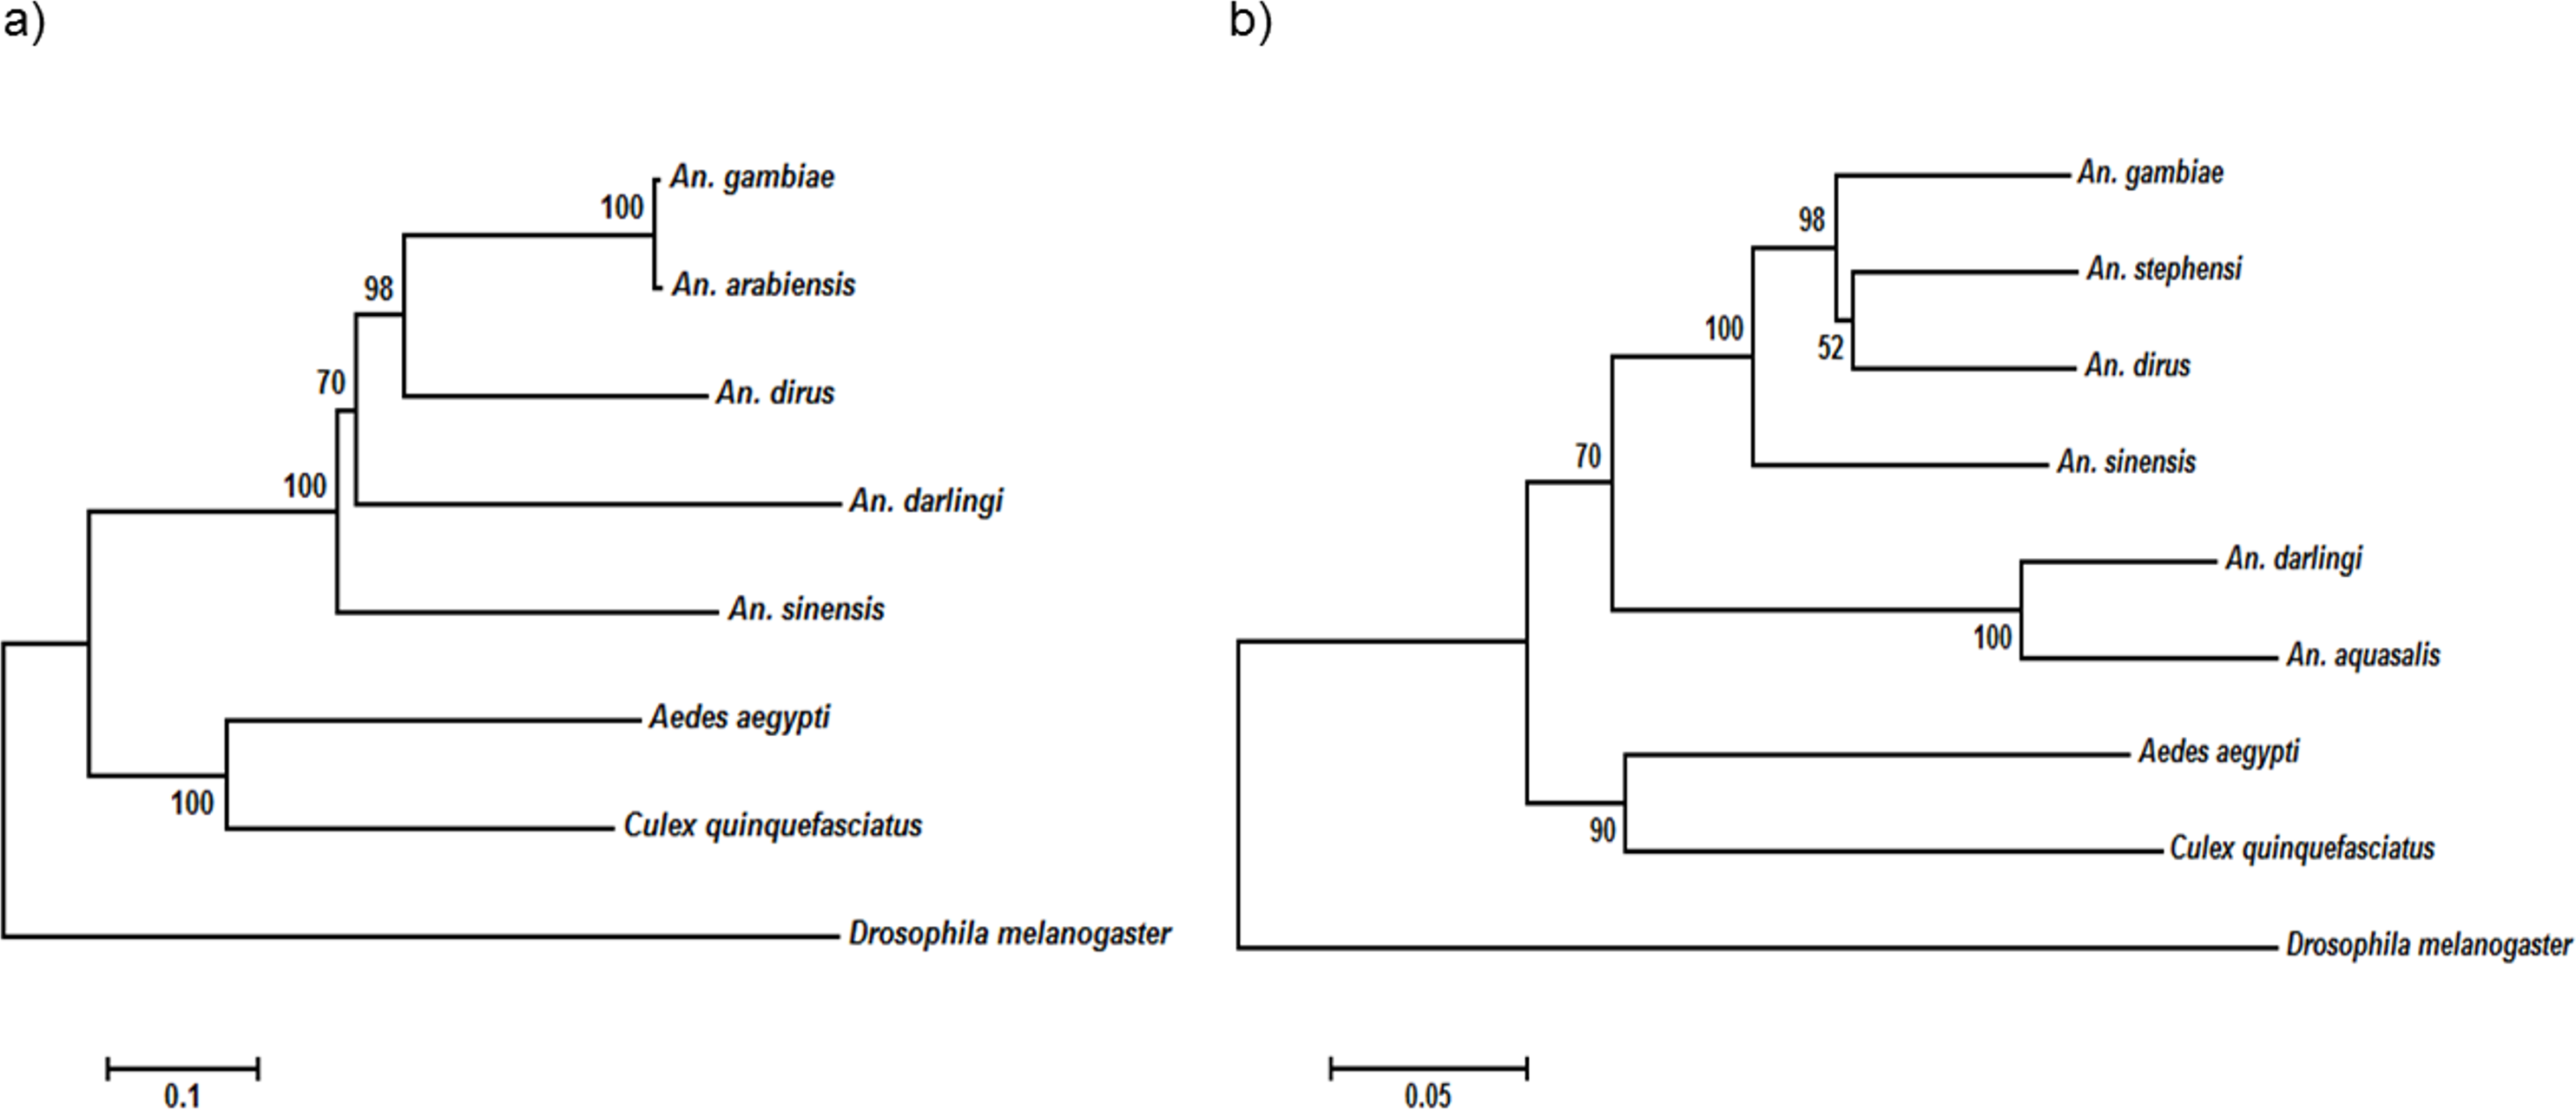
EF1, Act and S7 are suitable reference genes for the study
The suitability of EF1, Act and S7 as reference genes for gene expression analysis of P. berghei-infected An. dirus was addressed under the experimental conditions of this study, in conjunction with the SYBR green intercalating dye chemistry. The stability values of the three genes, as analyzed by the Bio-Rad CFX Manager software showed that they were stably expressed as the values were in the acceptable range. When all three genes were collectively used across 16 separate qRT-PCR reactions (4 time points × 4 replicates), the average mean coefficient of variance (CV) was 0.109 (SD: 0.053) while the average meanM value was 0.271 (SD: 0.133). Stably expressed reference genes of homogeneous samples should exhibit a mean CV of <0.25 and expression stability, M value of <0.5 (Hellemans et al., 2007).
NormFinder identified Act as the best reference gene and Act/S7 (stability value: 0.040) as the best combination when comparing normal blood fed and infected groups. Whereas, in experiments comparing between timepoints, Act was also the best gene but the best combination of two genes was EF1/Act (stability value: 0.095). Using the comparative delta-Ct method, the best combinations in descending order were Act/S7, EF1/Act, EF1/S7 (Fig. 3). geNORM also identified combination Act/S7 (M value: 0.023) as the best, followed by EF1/Act (M value: 0.028) and EF1/S7 (M value: 0.041). Furthermore, the relative expressions of AdTEP1 and AdNOS were compared when a single or combination of reference genes were used for normalization (Table 5). Variation could be seen when expression was normalized against a single reference gene. Nevertheless, to adhere to the MIQE guidelines (Bustin et al., 2009), these three reference genes were used together in the current gene expression study.
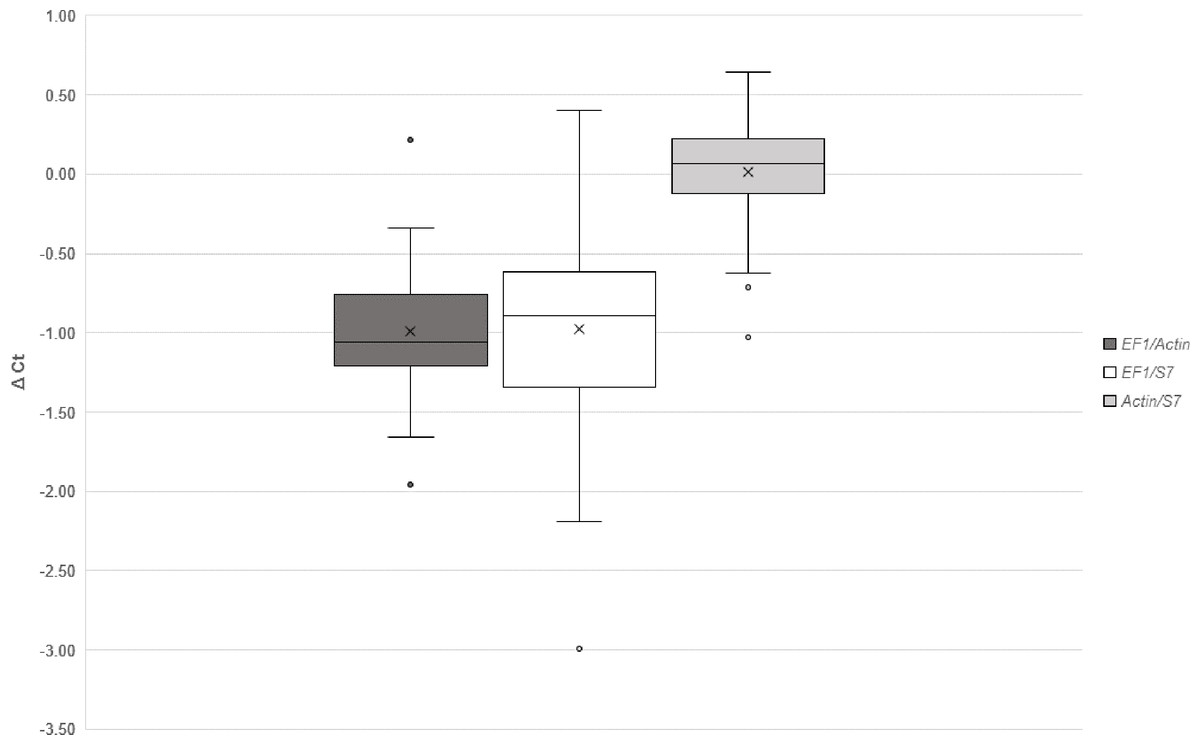
Figure 3: Comparative ΔCt method for selection of reference genes.
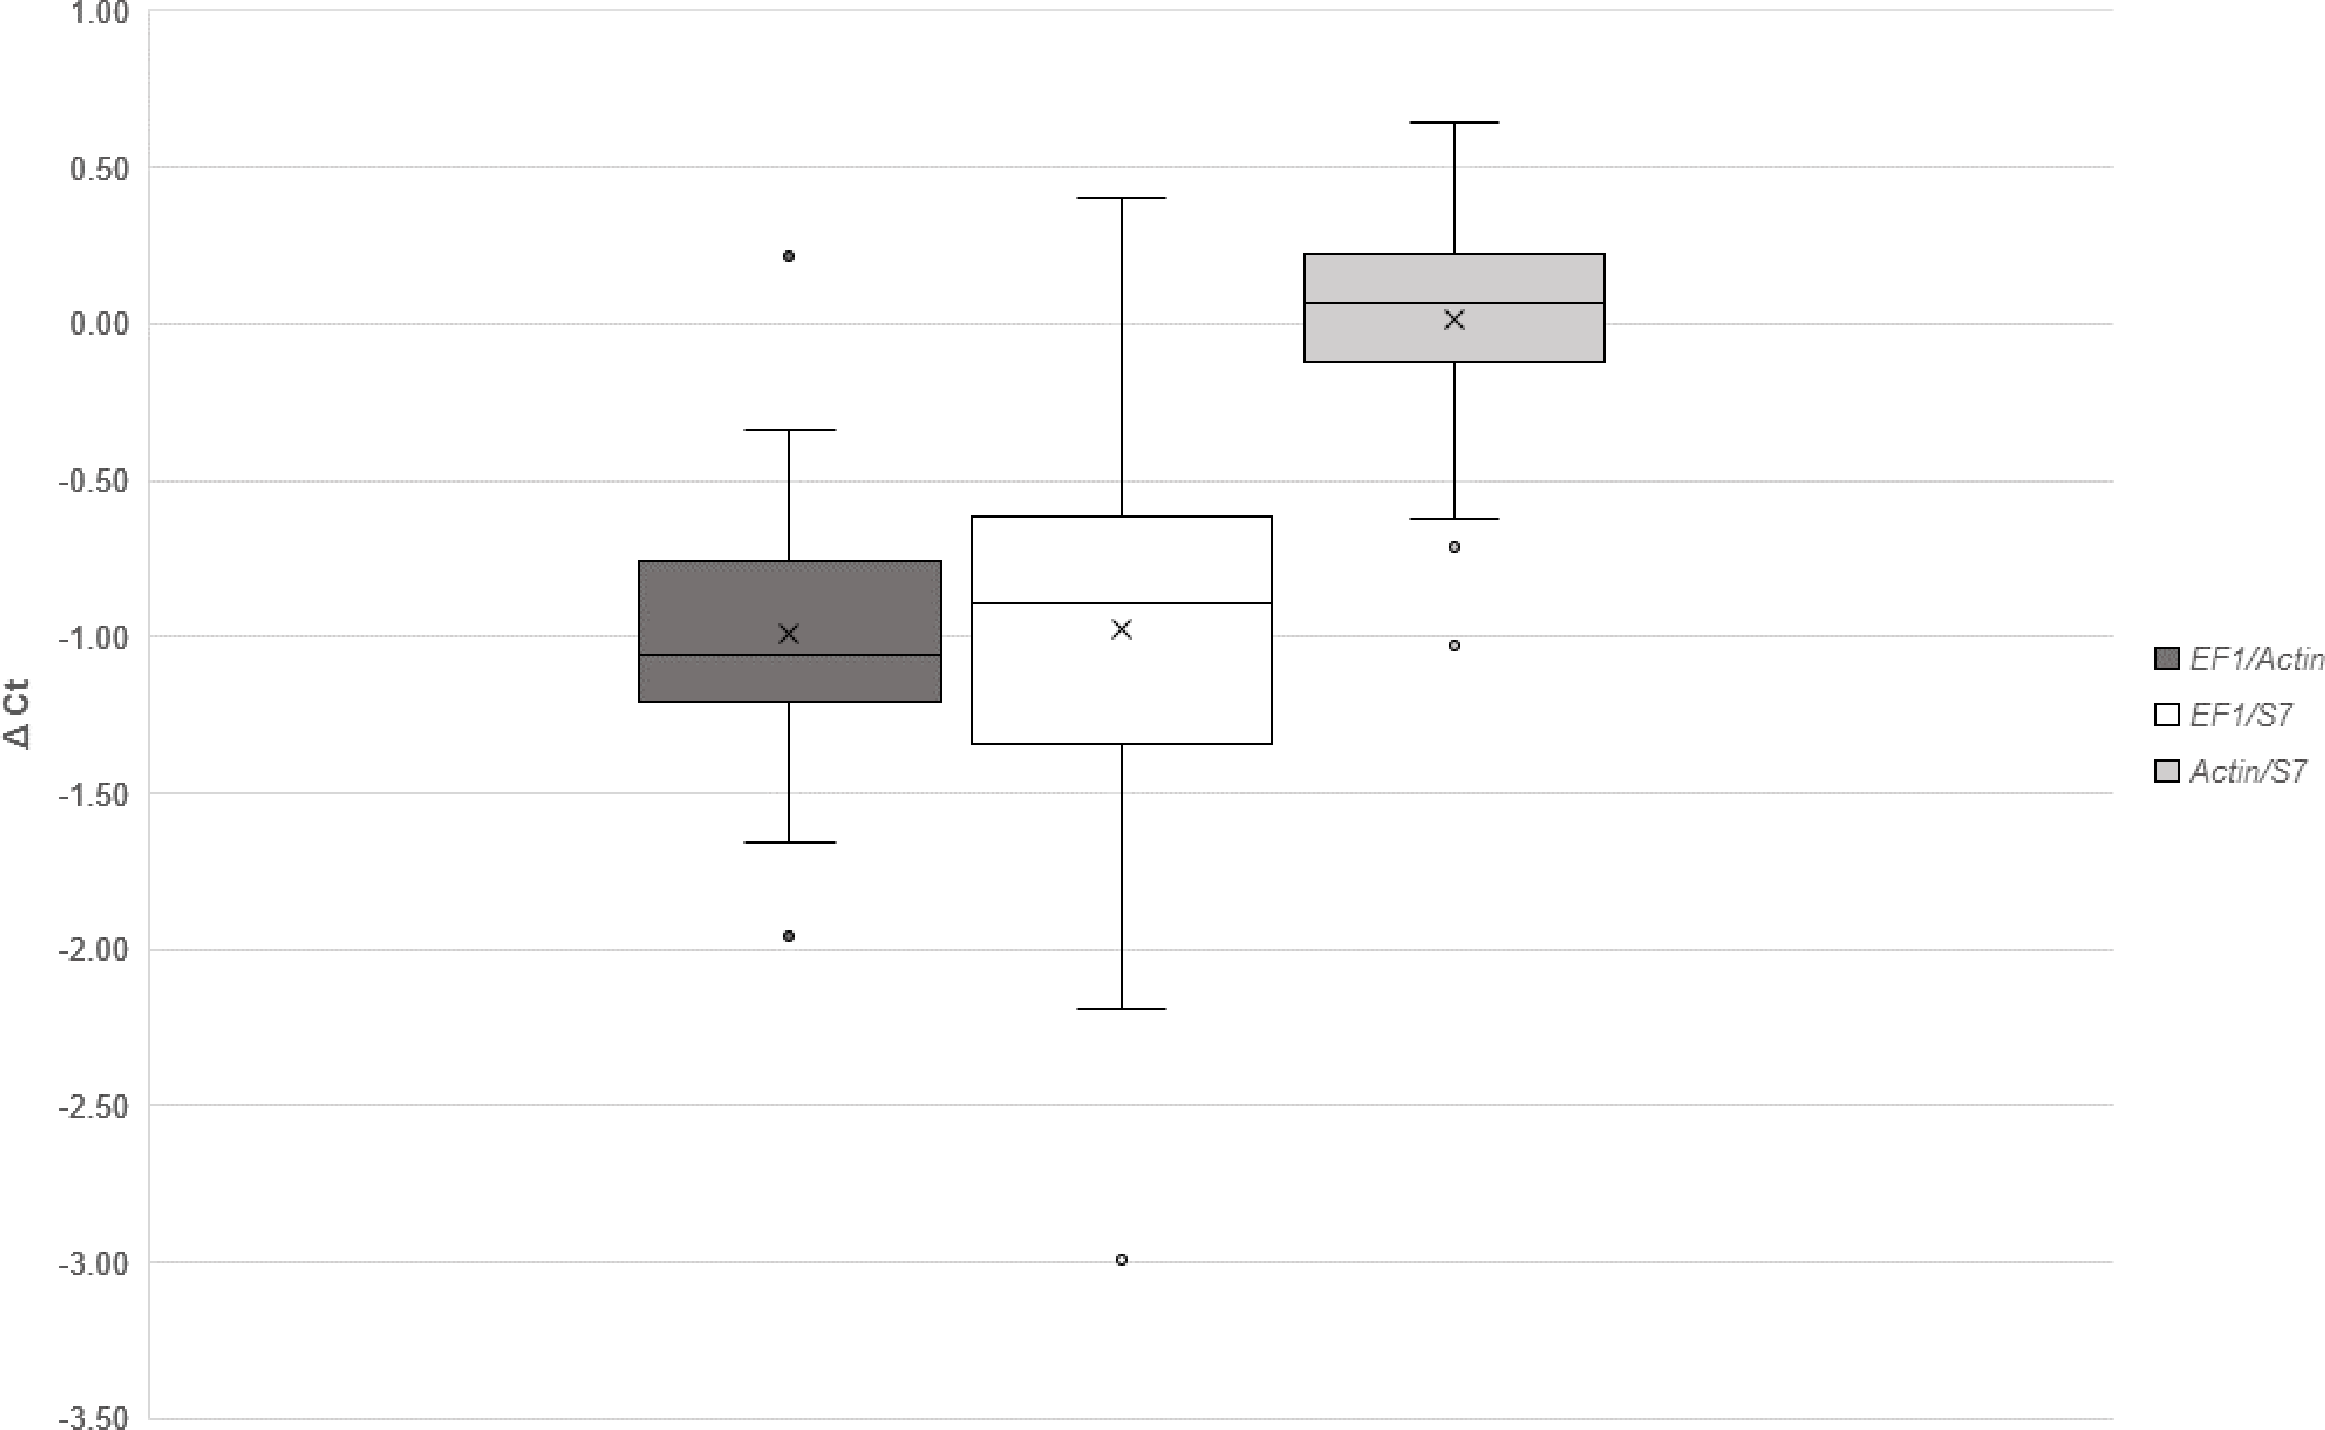
| Gene | Reference gene | 24 h PI | 48 h PI |
|---|---|---|---|
| TEP1 | EF1 | 3.533 | 1.091 |
| Act | 2.685 | 1.499 | |
| S7 | 3.187 | 1.435 | |
| Act/S7 | 2.925 | 1.467 | |
| EF1/Act | 3.08 | 1.278 | |
| EF1/S7 | 3.356 | 1.251 | |
| EF1/Act/S7 | 3.115 | 1.329 | |
| NOS | EF1 | 1.305 | 1.446 |
| Act | 0.992 | 1.987 | |
| S7 | 1.178 | 1.903 | |
| Act/S7 | 1.081 | 1.945 | |
| EF1/Act | 1.138 | 1.695 | |
| EF1/S7 | 1.240 | 1.659 | |
| EF1/Act/S7 | 1.151 | 1.762 |
AdTEP1 and AdNOS are transcriptionally induced during P. berghei infection
The gene expressions of AdTEP1 and AdNOS at different intervals (12 h, 24 h, 48 h and Day 5) PI were studied in quadruplicates. The time points were chosen to coincide with developmental stages of the parasite: 12 h—ookinete; 24 h—early infected stage; 48 h—early oocyst; Day 5—intermediate oocyst stage (Xu et al., 2005). The control group consisted of mosquitoes which took a normal blood meal. The relative expressions of these genes are shown in Fig. 4. Transcription of AdNOS gene peaked to about 2-fold at 48 h PI and returned to basal level at Day 5 PI. Whereas for AdTEP1, there was an approximately 3-fold increase in expression 24 h PI. The upregulation of AdNOS and AdTEP1 was significant but other than their respective peaks at 48 h and 24 h PI, the genes exhibited almost basal expression at all other time points.
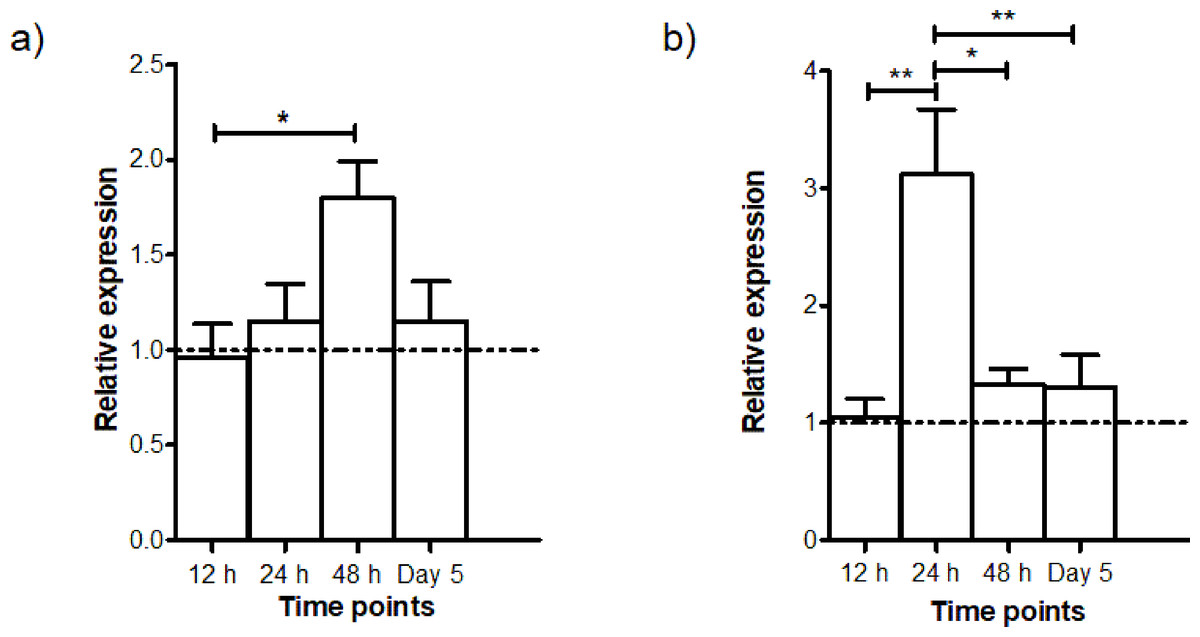
Figure 4: Time-point gene expression post infection (mean ± SEM) of (A) AdNOS and (B) AdTEP1 in P. berghei ANKA-infected An. dirus.
The dotted lines at the relative expression axes indicate the expression levels of the control group (normal blood meal). ∗significant (0.01 < p < 0.05); ∗∗very significant (0.001 < p < 0.01).
Discussion
AdTEP1 and AdNOS proteins are homologous with those of other Anopheles. Structurally, AdNOS protein possesses the N-terminal oxygenase domain which contains a putative heme; calmodulin which links the N-terminal and C-terminal; and the C-terminal FAD/NADPH cofactor-binding domain. These have been reported to be evolutionarily conserved (Luckhart & Rosenberg, 1999). There are in fact, multiple transcripts of NOS in An. stephensi from a single copy of the gene, suggesting alternative splicing and alternative initiation events (Luckhart & Li, 2001). Investigation is underway to determine if this is also the case for An. dirus. On the other hand, TEP1 is structurally homologous to human complement factor C3 and contains an α-helical thioester region (Baxter et al., 2007). It is secreted as a full-length protein and is proteolytically cleaved to produce mature and active TEP1 (Volohonsky et al., 2017). As principal components of immunity, both NOS and TEP1 genes are under selective pressure which leads to polymorphism (Le et al., 2012; Luckhart & Rosenberg, 1999). Polymorphism at the TEP1 locus gave rise to the Plasmodium refractory (R) and susceptible (S) strains of An. gambiae. R strain is homozygous for TEP1*R1 allele, while S strains contain TEP1*S1/S2/R2 alleles (Eldering et al., 2016). The TEP1 alleles segregate in wild An. gambiae and An. arabiensis populations (White et al., 2011). It is unknown if this is also the case for An. dirus.
There are no universal reference genes or normalization method for qRT-PCR (Hellemans et al., 2007; Ponton et al., 2011). At least three reference genes have to be validated for their stabilities under different experimental conditions (Bustin et al., 2009; Derveaux, Vandesompele & Hellemans, 2010). Anopheles ribosomal protein S7 is routinely used as a reference gene in studies similar to this. There are also gene expression studies of Anopheles using actin (Li et al., 2014; Luckhart et al., 1998) or EF1 (Omondi, Majeed & Ignell, 2015) as a reference gene. However, most of these investigations utilized only a single reference gene for normalization, which is not recommended (Bustin et al., 2009; Vandesompele et al., 2002). Moreover, expression of S7 of An. stephensi was significantly influenced by different temperature treatments (Murdock et al., 2012). Thus, total RNA concentration was included as control for background expression levels in that study. Elongation factor 1-alpha expression also fluctuates under temperature stress in the diamondback moth, Plutella xylostella, which is otherwise stably expressed (Fu et al., 2013). Hence, proper validation of reference genes for qRT-PCR normalization is crucial for accurate result. The three reference genes in this study were selected for validation based on previous studies. Although more candidate genes of different functional classes should be assessed (Vandesompele et al., 2002), results showed that EF1, Act and S7 were an appropriate set of reference genes for gene expression analysis of P. berghei-infected An. dirus in this study. Since mosquitoes used in this study were of similar age, it is unlikely that the validities are confounded by ageing. Furthermore EF1, Act and S7 have been reported to be reliable reference genes for studies on candidate age-grading genes and on different developmental stages in the parasitoid Dastarcus helophoroides, butterfly Bicyclus anynana, Aedes aegypti and An. gambiae (Dzaki et al., 2017; Pijpe et al., 2011; Wang et al., 2013a; Zhang et al., 2016).
The upregulation in AdTEP1 expression at 24 h P. berghei infection corroborated well with that of another study using the An. dirus/P. yoelii model (Wang et al., 2013b). It is also similar to that of An. gambiae during Plasmodium infection. In An. gambiae, TEP1 is constitutively expressed prior infection and is upregulated by 1.8–2.5-fold at 24 h post P. berghei infection (Blandin et al., 2004; Gupta et al., 2009). Then at 48 h PI, the TEP1 transcript level falls back to as it was before infection (Frolet et al., 2006). The same pattern is observed in An. dirus (Fig. 4B). In another study, the expression depressed and peaked again at Day 4 PI. The expressions coincide with the traverse of ookinetes through the midgut cells and the development of early oocysts (Blandin et al., 2004). Since TEP1 binds to and kills P. berghei and P. falciparum midgut stages (Blandin et al., 2004), it is postulated that TEP1 expression is induced in the fat body to replenish the protein in the hemolymph after infection (Gupta et al., 2009; Volohonsky et al., 2017).
The function and regulatory pathway of nitric oxide production in Anopheles are evolutionarily conserved and are shared with the vertebrates (Hillyer & Estevez-Lao, 2010). This study found that AdNOS expression was highest at 48 h PI while having almost basal expression at all other time points. Similarly, An. stephensi infected with P. yoelli exhibited increased mean NOS expression at 24 h PI which reached peak expression levels at 48 h PI and declined at later stages of oocyst development (Murdock et al., 2014). The repression of NOS mRNA levels through nitric oxide feedback reduces NOS protein levels to protect the host from self-induced damage (Peterson & Luckhart, 2006). Nitric oxide synthase gene expression in An. stephensi appears to follow the development of P. berghei or P. falciparum in the mosquito. Within 1–3 days post infection, NOS was transcriptionally induced coinciding with invasion and early oocyst development, while no induction was recorded on Day 6 PI when oocyst was developing. By Day 9 PI, expression was elevated and persisted till Day 14 possibly when sporozoite penetration of the salivary gland was complete (Luckhart et al., 1998). Midgut NOS expression was also induced in An. culicifacies infected with P. vivax, starting Day 1 until Day 15 PI (Vijay et al., 2011). In An. aquasalis infected with P. vivax, NOS expression was significantly induced 36 h PI, with NOS protein found mostly in midgut epithelial cells 24 h PI (Bahia et al., 2011).
The Anopheles immune defenses against Plasmodium infections have been extensively studied over the past decades, mostly using the An. gambiae and An. stephensi/P. berghei and P. falciparum infection models (Cirimotich et al., 2010; Clayton, Dong & Dimopoulos, 2014; Crompton et al., 2014). It is believed that there is a broad range of compatibility between different Plasmodium and mosquito strains. In addition, infection intensities and different mosquito/Plasmodium model influence gene expression and anti-Plasmodium responses, except for TEP1 activity that is not affected by infection intensity (Aguilar et al., 2005; Garver et al., 2012). Therefore, comparisons of results between studies have to be conducted with care. For example, TEP1 silencing in An. gambiae (Keele strain) only doubled the median number of P. falciparum NF54 oocysts while P. berghei oocysts number increased 4–5-fold (Jaramillo-Gutierrez et al., 2009). Silencing the leucine-rich repeat protein genes of An. gambiae showed a profound effect on P. berghei infection but has no effect on the development of sympatric P. falciparum field isolates (Cohuet et al., 2006). Furthermore, paralog APL1A is found to be responsible for protection against P. falciparum while paralog APL1C is needed to protect against P. berghei and P. yoelii in An. gambiae (Garver, Dong & Dimopoulos, 2009; Mitri et al., 2009). Thus, distinct immune responses are elicited in response to human and rodent malaria parasite. However, the use of the less compatible Anopheles/Plasmodium berghei combination, such as the An. dirus/P. berghei model in this study, have contributed immensely to our knowledge on mosquito infection responses (Aguilar et al., 2005). Following that, more detailed studies can then be designed to investigate the efficiency and potential of these antiplasmodial responses in natural vector/parasite combinations.
Interpretation of results from this and other infection studies is further complicated by the fact that environmental temperature has significant and diverse effects on mosquito immune responses and vector competence. This temperature factor also forms complex interactions with factors such as nature of immune challenge, diet and time (Murdock et al., 2012). This makes comparison of human and rodent malaria infection difficult as their experimental temperatures (P. berghei: 19–21 °C; P. falciparum: 27 °C), optimum temperature for development and rates of development are different (Mordecai et al., 2013; Paaijmans et al., 2012). This raise the question of whether the reported disparities in immune responses are, in fact, consequences of parasitic infection, differential temperatures or both. It has been demonstrated that An. stephensi NOS expression is significantly affected by sampling time point and temperature. The NOS transcript level increased earlier at 24 h post P. yoelii infection when mosquitoes were maintained at warmer temperatures of 26–28 °C (Murdock et al., 2014). Besides, when An. stephensi was exposed to different rearing temperature, NOS expression was found to be induced and peaked at a later time point (24 h vs 18 h post exposure) when housed at cooler temperature (18 °C vs 22 °C) (Murdock et al., 2012). This may be a limitation of our study as the mosquitoes were placed at 20 ± 1 °C from a rearing temperature of 25–27 °C, 16–18 h prior to blood feeding. Proper studies will need to be planned to investigate and confirm this. Nonetheless, the AdNOS gene expression profile in the current study showed that the gene expression was basal at 12 h PI before the upregulation at 48 h PI. Additionally, complex environment drivers such as fluctuation in diurnal temperature, ambient temperature, and time of infection need to be evaluated for their effects on immunity and resistance of An. dirus. It has been shown that, complex interplay of these factors affects NOS expression in response to immune challenge (Murdock, Moller-Jacobs & Thomas, 2013).
Nevertheless, the current study demonstrates that An. dirus express and mount TEP1 and NOS immune responses towards P. berghei infection, similar to the other Anopheles. Although the use of a rodent malaria parasite model does not necessarily reflect the temperature dependencies of the human malarias and their actual interactions with Anopheles, it is useful for preliminary identification and characterization of immune responses in the mosquito (Jaramillo-Gutierrez et al., 2009). Interesting findings from initial experiments using P. berghei in the laboratory can be subsequently validated with natural An. dirus/Plasmodium combinations. Nonetheless, our study concerning the gene expressions of TEP1 and NOS is at a preliminary stage and no protein activity was measured. More functional assays and experiments are underway to further understand the TEP1 and NOS immune responses in An. dirus.
Conclusion
AdTEP1 and AdNOS are homologous among the Anopheles. For studies comparing the gene expression of P. berghei-infected and normal blood fed An. dirus, the genes EF1, Act and S7 are appropriate normalization controls in qRT-PCR. Using these validated reference genes, we found that AdTEP1 and AdNOS expressions were highly induced respectively at 24 h and 48 h post P. berghei infection. Expression of TEP1 and NOS in response to Plasmodium infection is common among the anophelines. The study employed the An. dirus/P. berghei model to characterize immune factors that could limit malaria transmission. A more comprehensive look into the Anopheles in different parts of the world, will enable better understanding of malaria transmission dynamics and rapid extrapolation of any novel transmission blocking strategies to allopatric Anopheles species.
Supplemental Information
Multiple sequence alignment of (A) TEP1 and (B) NOS protein, analyzed by Clustal Omega
Drosophila, Drosophila melanogaster; Culex, Culex quinquefasciatus; Aedes, Aedes aegypti; while the rest are all Anopheles species.