
In vivo function of Pgβglu-1 in the release of acetophenones in white spruce
- Published
- Accepted
- Received
- Academic Editor
- Marion Röder
- Subject Areas
- Biochemistry, Plant Science
- Keywords
- Picea glauca, Conifer defense, Spruce budworm, Beta-glucosidase, Transgenic spruce
- Copyright
- © 2017 Mageroy et al.
- Licence
- This is an open access article distributed under the terms of the Creative Commons Attribution License, which permits unrestricted use, distribution, reproduction and adaptation in any medium and for any purpose provided that it is properly attributed. For attribution, the original author(s), title, publication source (PeerJ) and either DOI or URL of the article must be cited.
- Cite this article
- 2017. In vivo function of Pgβglu-1 in the release of acetophenones in white spruce. PeerJ 5:e3535 https://doi.org/10.7717/peerj.3535
Abstract
Eastern spruce budworm (Choristoneura fumiferiana Clemens) (ESBW) is a major forest pest which feeds on young shoots of white spruce (Picea glauca) and can cause landscape level economic and ecological losses. Release of acetophenone metabolites, piceol and pungenol, from their corresponding glycosides, picein and pungenin, can confer natural resistance of spruce to ESBW. A beta-glucosidase gene, Pgβglu-1, was recently discovered and the encoded enzyme was characterized in vitro to function in the release of the defensive acetophenone aglycons. Here we describe overexpression of Pgβglu-1 in a white spruce genotype whose metabolome contains the glucosylated acetophenones, but no detectable amounts of the aglycons. Transgenic overexpression of Pgβglu-1 resulted in release of the acetophenone aglycons in planta. This work provides in vivo evidence for the function of Pgβglu-1.
Introduction
Eastern spruce budworm (Choristoneura fumiferiana Clemens) (ESBW) is considered the most detrimental pest of spruce and fir forests in eastern North America. While populations of ESBW usually persist at endemic levels, outbreaks can last for years incurring landscape level ecological changes and major economic losses (Chang et al., 2012; MacLean, 2016). With climate change, outbreaks of ESBW are predicted to increase in frequency and severity (Hennigar et al., 2013). Current forest management practices to control ESBW outbreak include costly aerial spraying of Bacillus thuringiensis (Bt) and the insect growth regulator Mimic® (NRCAN, 2016). The Bt cry1Ab gene has been successfully overexpressed in white spruce and shown to be effective against ESBW (Lachance et al., 2007); however, commercial deployment of transgenic trees is not permitted in Canada.
Recently, natural resistance to ESBW was discovered in white spruce (Picea glauca). Resistant genotypes accumulated the acetophenone aglycons piceol and pungenol as well as the corresponding glucosides picein and pungenin. Non-resistant genotypes only accumulated the acetophenone glucosides (Delvas et al., 2011). Parent et al. (2017) showed that the aglycons piceol and pungenol are the active defense compounds that contribute to resistance. We also showed that gene expression of Pgβglu-1 was positively correlated with resistance, and in in vitro assays the encoded PgβGLU-1 enzyme cleaved the acetophenone glucosides, picein and pungenin, producing the biologically active aglycons (Mageroy et al., 2015). However, function of PgβGLU-1 has not yet been proven in planta and remained a critical but elusive part of the proof of function.
Here we report the successful overexpression of Pgβglu-1 in a white spruce genotype Pg653. While wildtype Pg653 plants do not accumulate detectable amounts of the acetophenone aglycons, overexpression of Pgβglu-1 resulted in the in planta formation of piceol and pungenol.
Methods
Vector construction, Agrobacterium transformation and plant regeneration of Pgβglu-1 overexpression white spruce
The full-length cDNA of pgβglu-1 (GenBank KJ780719) or a modified green fluorescence protein (gfp) (Cambia) coding sequence were first cloned using the Gateway System (Invitrogen) into vector pMJM, containing the maize (Zea mays) ubiquitin promoter and the 35S terminator (Levée et al., 2009), then digested with SbfI and sub-cloned into the binary vector pCAMBIA2300 (Figs. S1 and S2). The resulting constructs were transformed into Agrobacterium tumefaciens strain C58 pMP90 (Hellens, Mullineaux & Klee, 2000). Agrobacterium transformation of white spruce somatic embryonal masses (line Pg653) and subsequent selection and growth of transformants was performed as described by Klimaszewska et al. (2001). Kanamycin resistance was used as the selection marker. Somatic embryo maturation, germination, acclimatization and transfer of somatic seedlings to soil were performed according to Klimaszewska, Rutledge & Séguin (2004).
LRE-qPCR of embryogenic tissue and somatic seedlings
Linear regression of efficiency (LRE) qPCR (Rutledge, 2011) was used to confirm transformation and to measure and compare absolute transcript abundance levels in both embryogenic tissue and somatic seedlings of 11 selected Pgβglu-1 and 11 gfp transformed lines. RNA was isolated from up to 100 mg fresh weight of embryogenic tissue or from the pooled epicotyls of two 2-months old somatic seedlings using the RNeasy Plant mini kit (Qiagen) with on-column RNase-Free DNase (Qiagen) treatment. Primers were designed as previously described (Foster et al., 2015) with primers PgβGLU1-f—5′-GCCATAAGGGAGGGAGCAG; PgβGLU1-r—5′-CTCGCCCACTCAAAGCCGT or GFP-f—5′- GCCCGACAACCACTACCTGA; GFP-r—5′-GCGGTCACGAACTCCAGCAG used to analyze the gβglu-1 and gfp lines respectively. cDNA synthesis, primer design, and PCR thermocycling conditions were conducted as described by Foster et al. (2015) with the exceptions that a two-step amplification protocol of 45 cycles was used with a 120 s annealing/elongation step at 65 °C. Gene expression was normalized using the two white spruce reference genes YLS8 and EF1α (Rutledge et al., 2013). Transcript abundance quantification was performed using a Java program based on linear regression of efficiency previously described (Rutledge, 2011).
Plant growth conditions
After growth on germination media for three months, somatic seedlings were planted into cones (Figs. 1C–1D) and maintained in a greenhouse under natural light and growth lights (16 h; 600 W HPS). Temperatures were set with a low of 19 °C and, within the limitations of a greenhouse that is not fully temperature controlled, to a high of 23.5 °C. Plants were allowed to grow for eight months and then placed at 4 °C with minimal light for two weeks to induce flushing. Plants were placed on the benchtop at 22 °C for one week to transition from the cold and then moved into a growth chamber with 16 h light at 22 °C and 8 h dark at 16 °C.
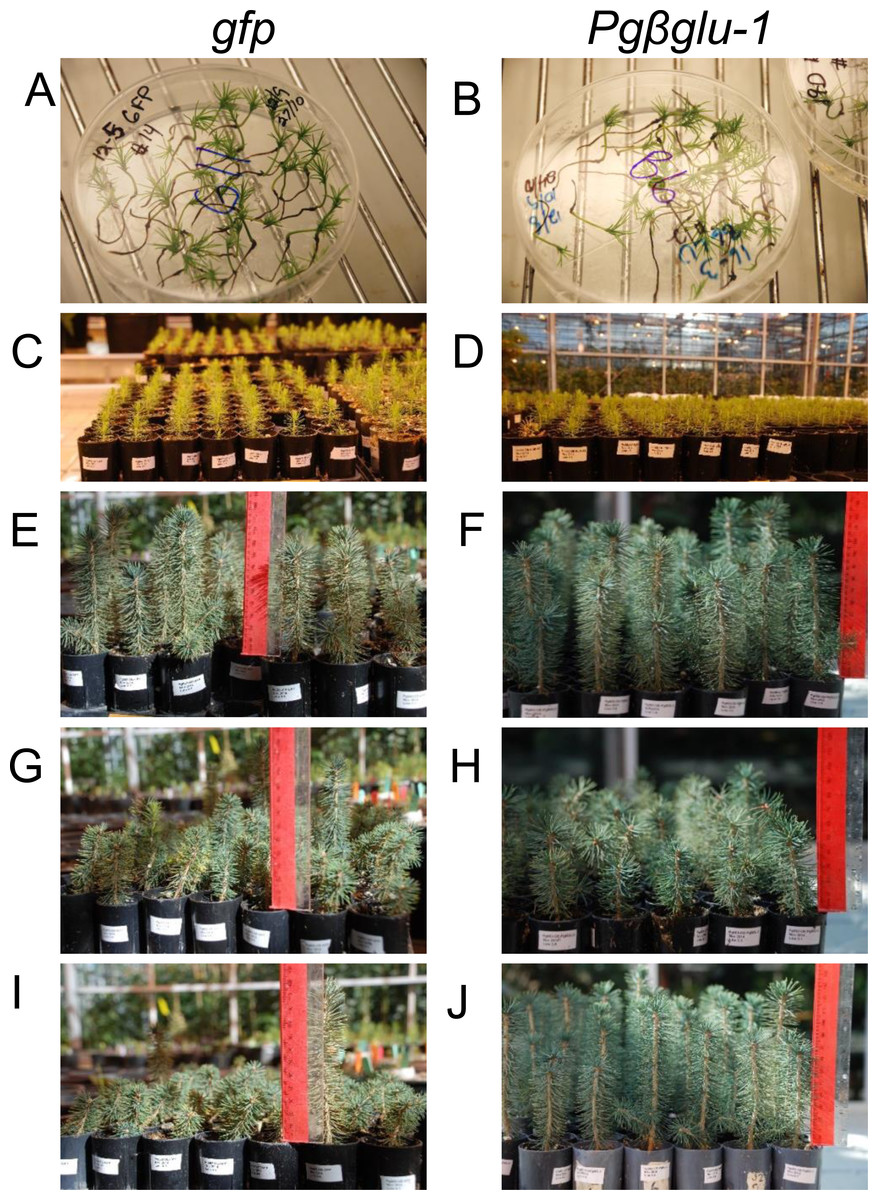
Figure 1: Transgenic white spruce seedlings.
(A), (C), (E), (G), and (I) show control white spruce seedlings expressing gfp. (B), (D), (F), (H), and (J) show white spruce seedlings overexpressing Pgβglu-1. (A–B) Transgenic white spruce somatic seedlings were grown on selective media for three months. (C–D) Plantlets were then transferred into cones and placed in the greenhouse. (E–J) After six months of growth, on average, the Pgβglu-1 overexpressing seedlings appeared healthier and taller.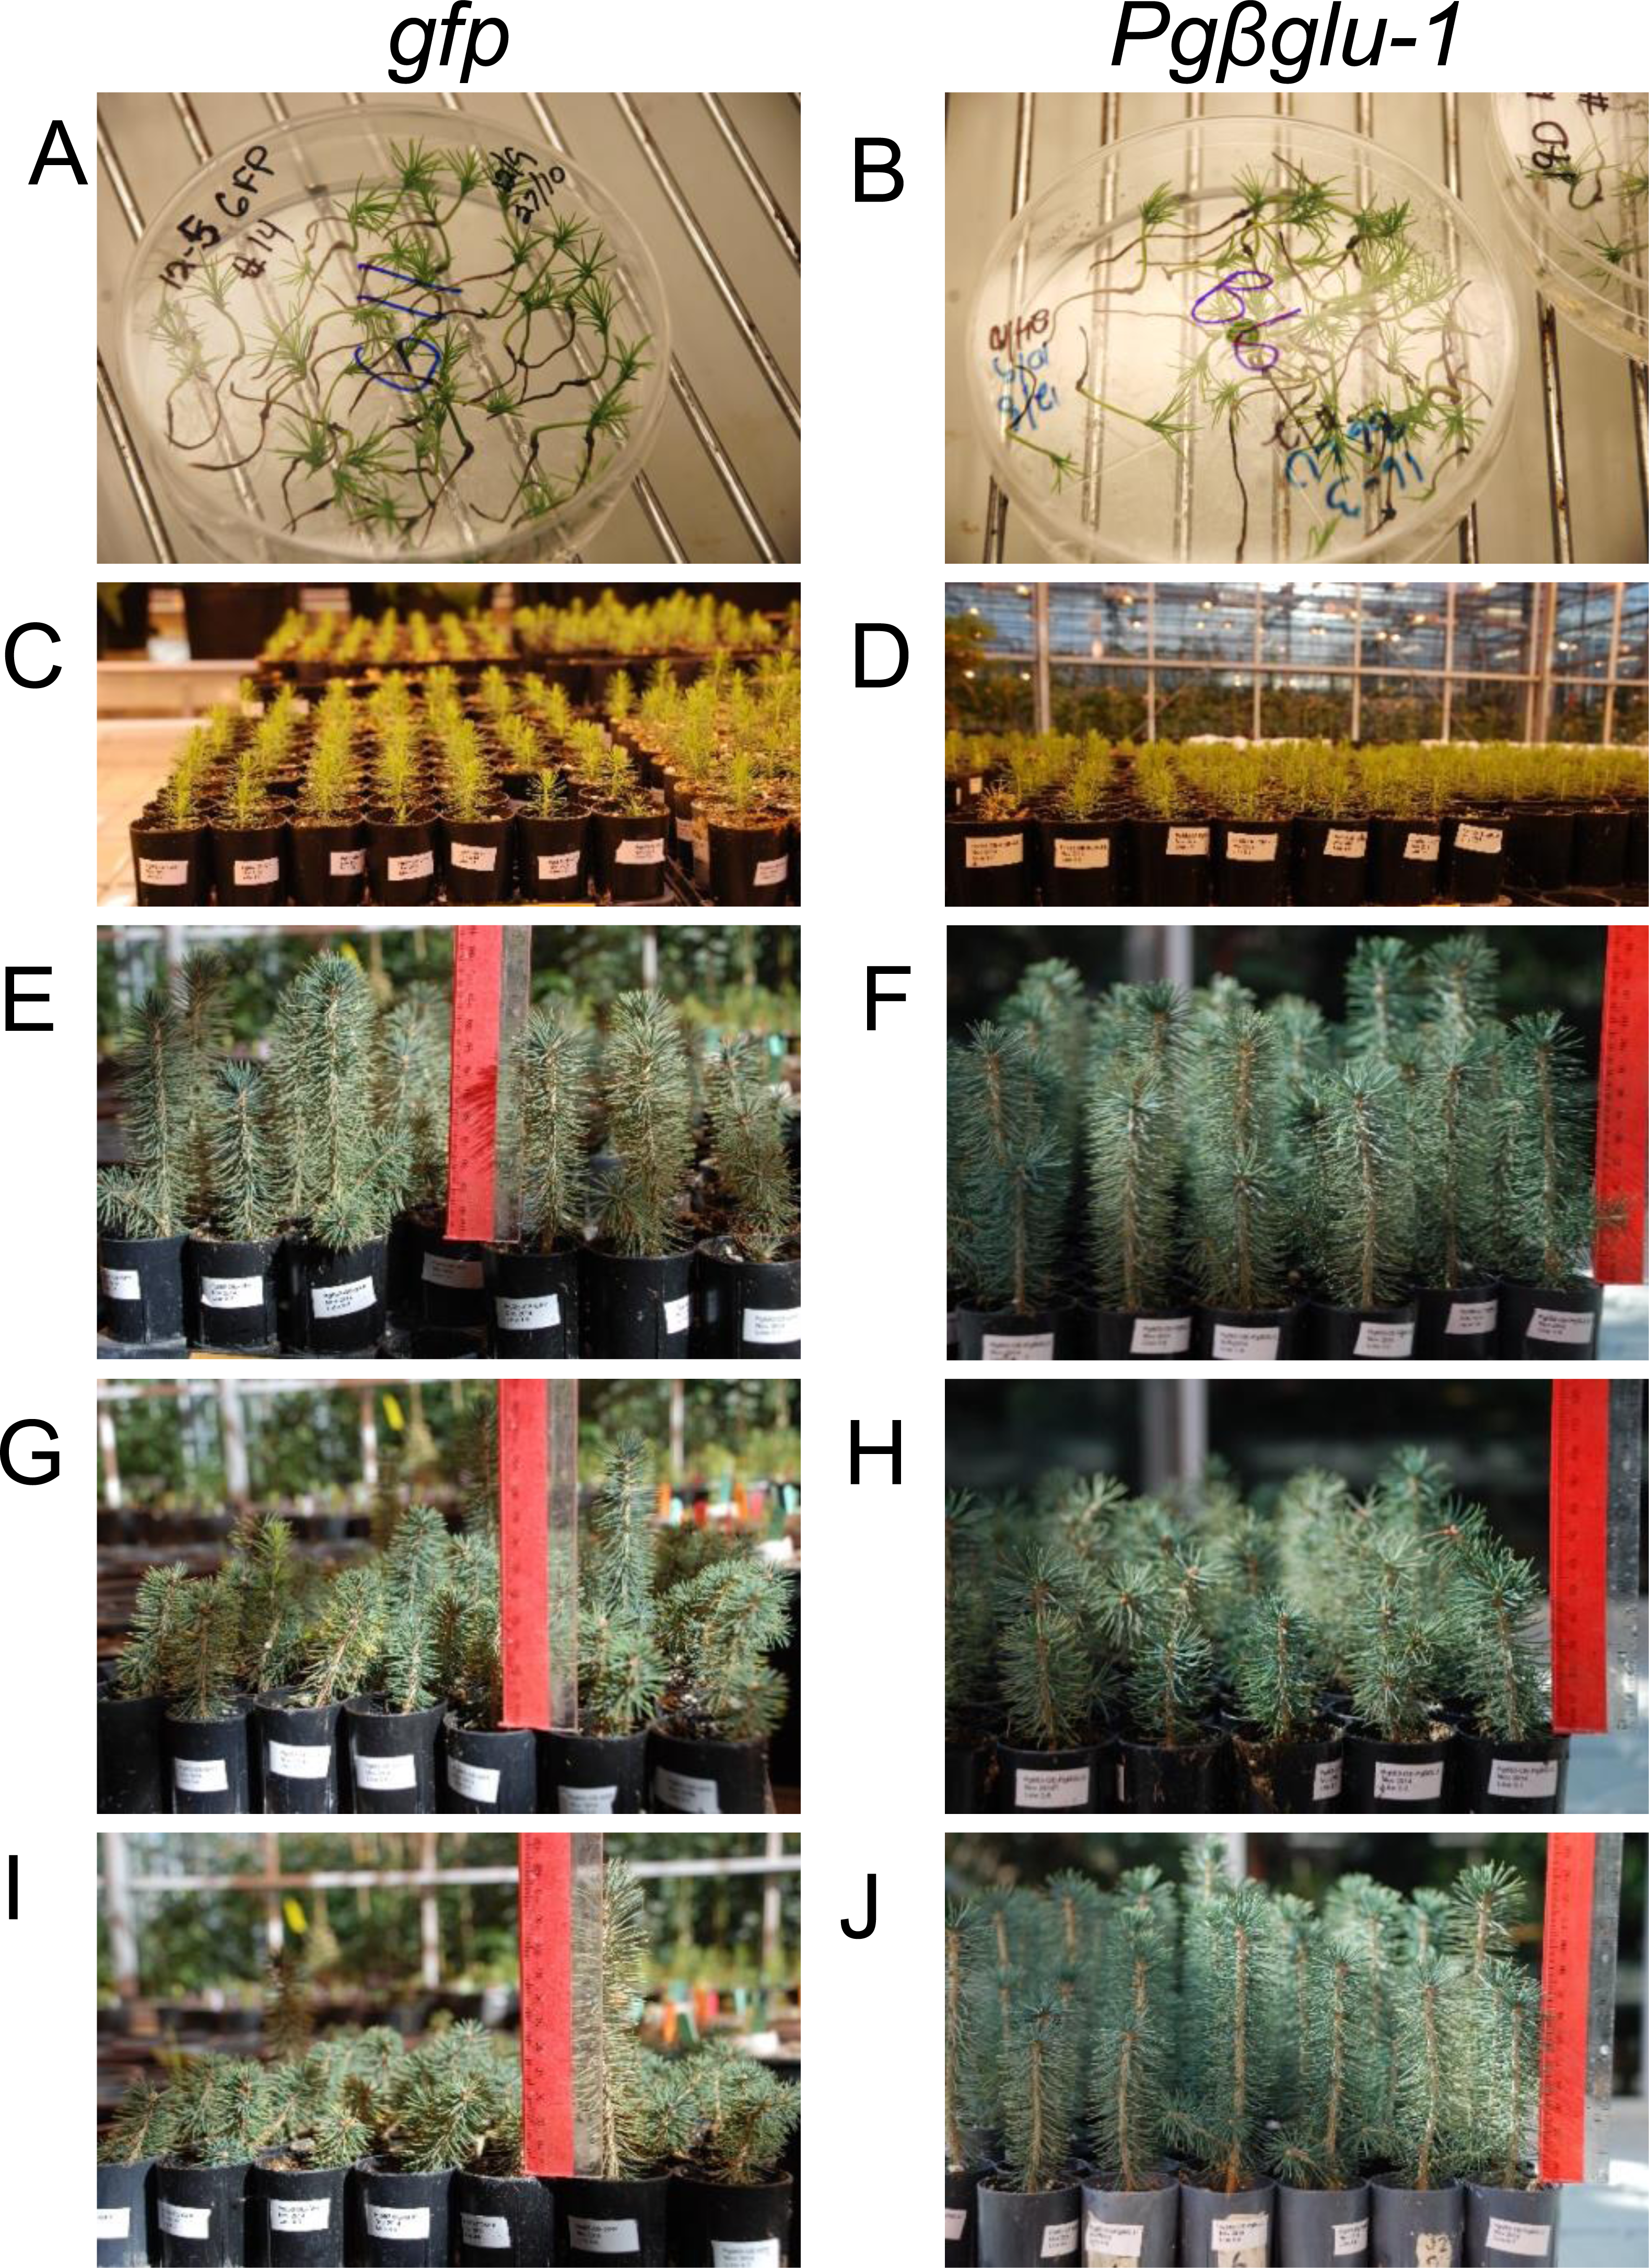
RT-qPCR of plants grown for six months
Total RNA was isolated from needles of plants grown for six months using PureLink® Plant RNA Reagent (ThermoFisher, Waltham, MA, USA) using approximately 100 mg tissue according to manufacturer’s instructions. RNA integrity and concentration was measured using Bioanalyzer 2100 RNA Nano chip assays (Agilent, Santa Clara, CA, USA) following the manufacturer’s protocol. Equal RNA amounts were used for cDNA synthesis with the iScript Reverse Transcription Supermix (Bio-Rad, Hercules, CA, USA). qRT-PCR reactions were performed on a Bio-Rad CFX96 Real-time system using the SsoFast kit (Bio-Rad, Hercules, CA, USA) in triplicate. Relative transcript abundance was calculated using efficiency corrected ΔCT and ΔΔCT values based on ELF-1α as the reference gene. Target-specific oligonucleotides were as follows: ELF-1α-f—5′-CCCTTCCTCACTCCAACTGCATA; ELF-1α-r—5′-TCGGCGGTGGCAGAGTTTACATTA; or PgβGLU1-f—5′-TTGGATCCTCTGAAGGT GT; PgβGLU1-r—5′-TCCCTCCCTTATGGCTTC. Target specificity was confirmed by sequence verification of representative amplicons.
Metabolite analysis
For the time course study of acetophenone glucoside deglycosylation, tissue was ground and left on the bench top for 4 h, 8 h, and 24 h before adding extraction solvent (100% methanol containing 1 mg/ml benzoic acid as the internal standard). For all other metabolite extractions, 100 mg of tissue was placed in a vial and 1 mL of extraction solvent was immediately added. The vial was capped and placed at 4 °C; with shaking overnight. The supernatant was removed and placed in a new vial. For liquid chromatography-mass spectrometry (LC-MS) analysis, samples were diluted 1:10 by diluting 100 μL of supernatant in 900 μL of 100% methanol. LC-MS analysis was performed using a LC-MSD-Trap-XCT_plus with a SB-C18, 15-cm column (Agilent, Santa Clara, CA, USA). An injection volume of 10 μL was used. Solvent A was water with 0.2% (v/v) formic acid; solvent B was 100% (v/v) acetonitrile with 0.2% (v/v) formic acid. The following gradient was used: increase to 5% solvent B from 0 to 0.5 min; increase to 22% solvent B from 0.5 to 5.0 min; increase to 35% solvent B from 5.0 to 10.0 min; increase to 50% solvent B from 10.0 to 13.0 min; increase to 95% solvent B from 13.0 to 16.0 min; holding 95% solvent B from 16.0 to 17.0 min; decrease to 5% solvent B from 17.0 to 17.1 min. Column flow rate was 0.8 mL min−1. Piceol and picein were identified using the extracted ion 135(−), the parent mass (−1) of piceol. Pungenol and pungenin were identified using the extracted ion 151(−), the parent mass (−1) of pungenol.
Results and Discussion
Overexpression of SBW defense gene Pgβglu-1
We overexpressed the cDNA of Pgβglu-1 in planta to validate the function of this gene and its encoded enzyme activity in the release of acetophenone aglycons from the corresponding glucosides in white spruce foliage (Fig. 1). We used the white spruce genotype Pg653 to test the effect of overexpression of Pgβglu-1 for two reasons: (1) Pg653 is a well-established somatic embryogenic line for white spruce transformations. (2) This line shows a metabolite phenotype that contains the acetophenone glucosides picein and pungenin, which are the proposed in vivo substrates for Pgβglu-1 enzyme activity, but contains minimal detectable amounts of the corresponding aglycons piceol and pungenol. Thus, Pg653 provides a suitable background for de novo formation of piceol and pungenol in transgenic plants. Agrobacterium transformation of the coding region of Pgβglu-1 driven under maize (Zea mays) ubiquitin promoter was used to produce transgenic white spruce lines. A gfp reporter gene was overexpressed in white spruce as a control.
Evaluation of possible negative effects of transgene overexpression
Levels of transgene gene expression were evaluated in both embryonal tissue and somatic seedlings using qPCR (Fig. 2). Overall transcript levels of the gfp transgene were higher in both sample types compared to the Pgβglu-1 transgene. The lower levels of Pgβglu-1 transcripts could indicate some phytotoxic effects, as toxic compounds are often glycosylated in plants for self-protection. However, Pgβglu-1 overexpressing young plants appeared to be healthier than gfp expressing plants (Figs. 1E–1J) under greenhouse conditions, including naturally occurring biotic and abiotic stresses. Although previous studies have shown gfp to be non-toxic in plants (Millwood, Moon & Stewart Jr, 2010; Tian et al., 1999), deleterious effects have been noted in mammalian cells (Liu et al., 1999). The observed plant growth difference may be due to physiological adaptations to cope with effects that may arise from high levels of gfp expression (Steward, 2001). For example, under stress conditions, which increase the production of free radicals, plant cells may not be able to compensate as well for high expression of gfp leading to negative growth effects.

Figure 2: LRE-qPCR quantification of transgene expression in embryonic tissue (ET) and somatic seedlings (SS) of transformed lines.
Transcript abundance was calculated as the number of transcripts in 5 ng of synthesized cDNA. Pg653 represent the untransformed control line. Overall, higher expression of gfp was observed in ET and SS than Pgβglu-1. Error bars represent standard deviation. N = 11.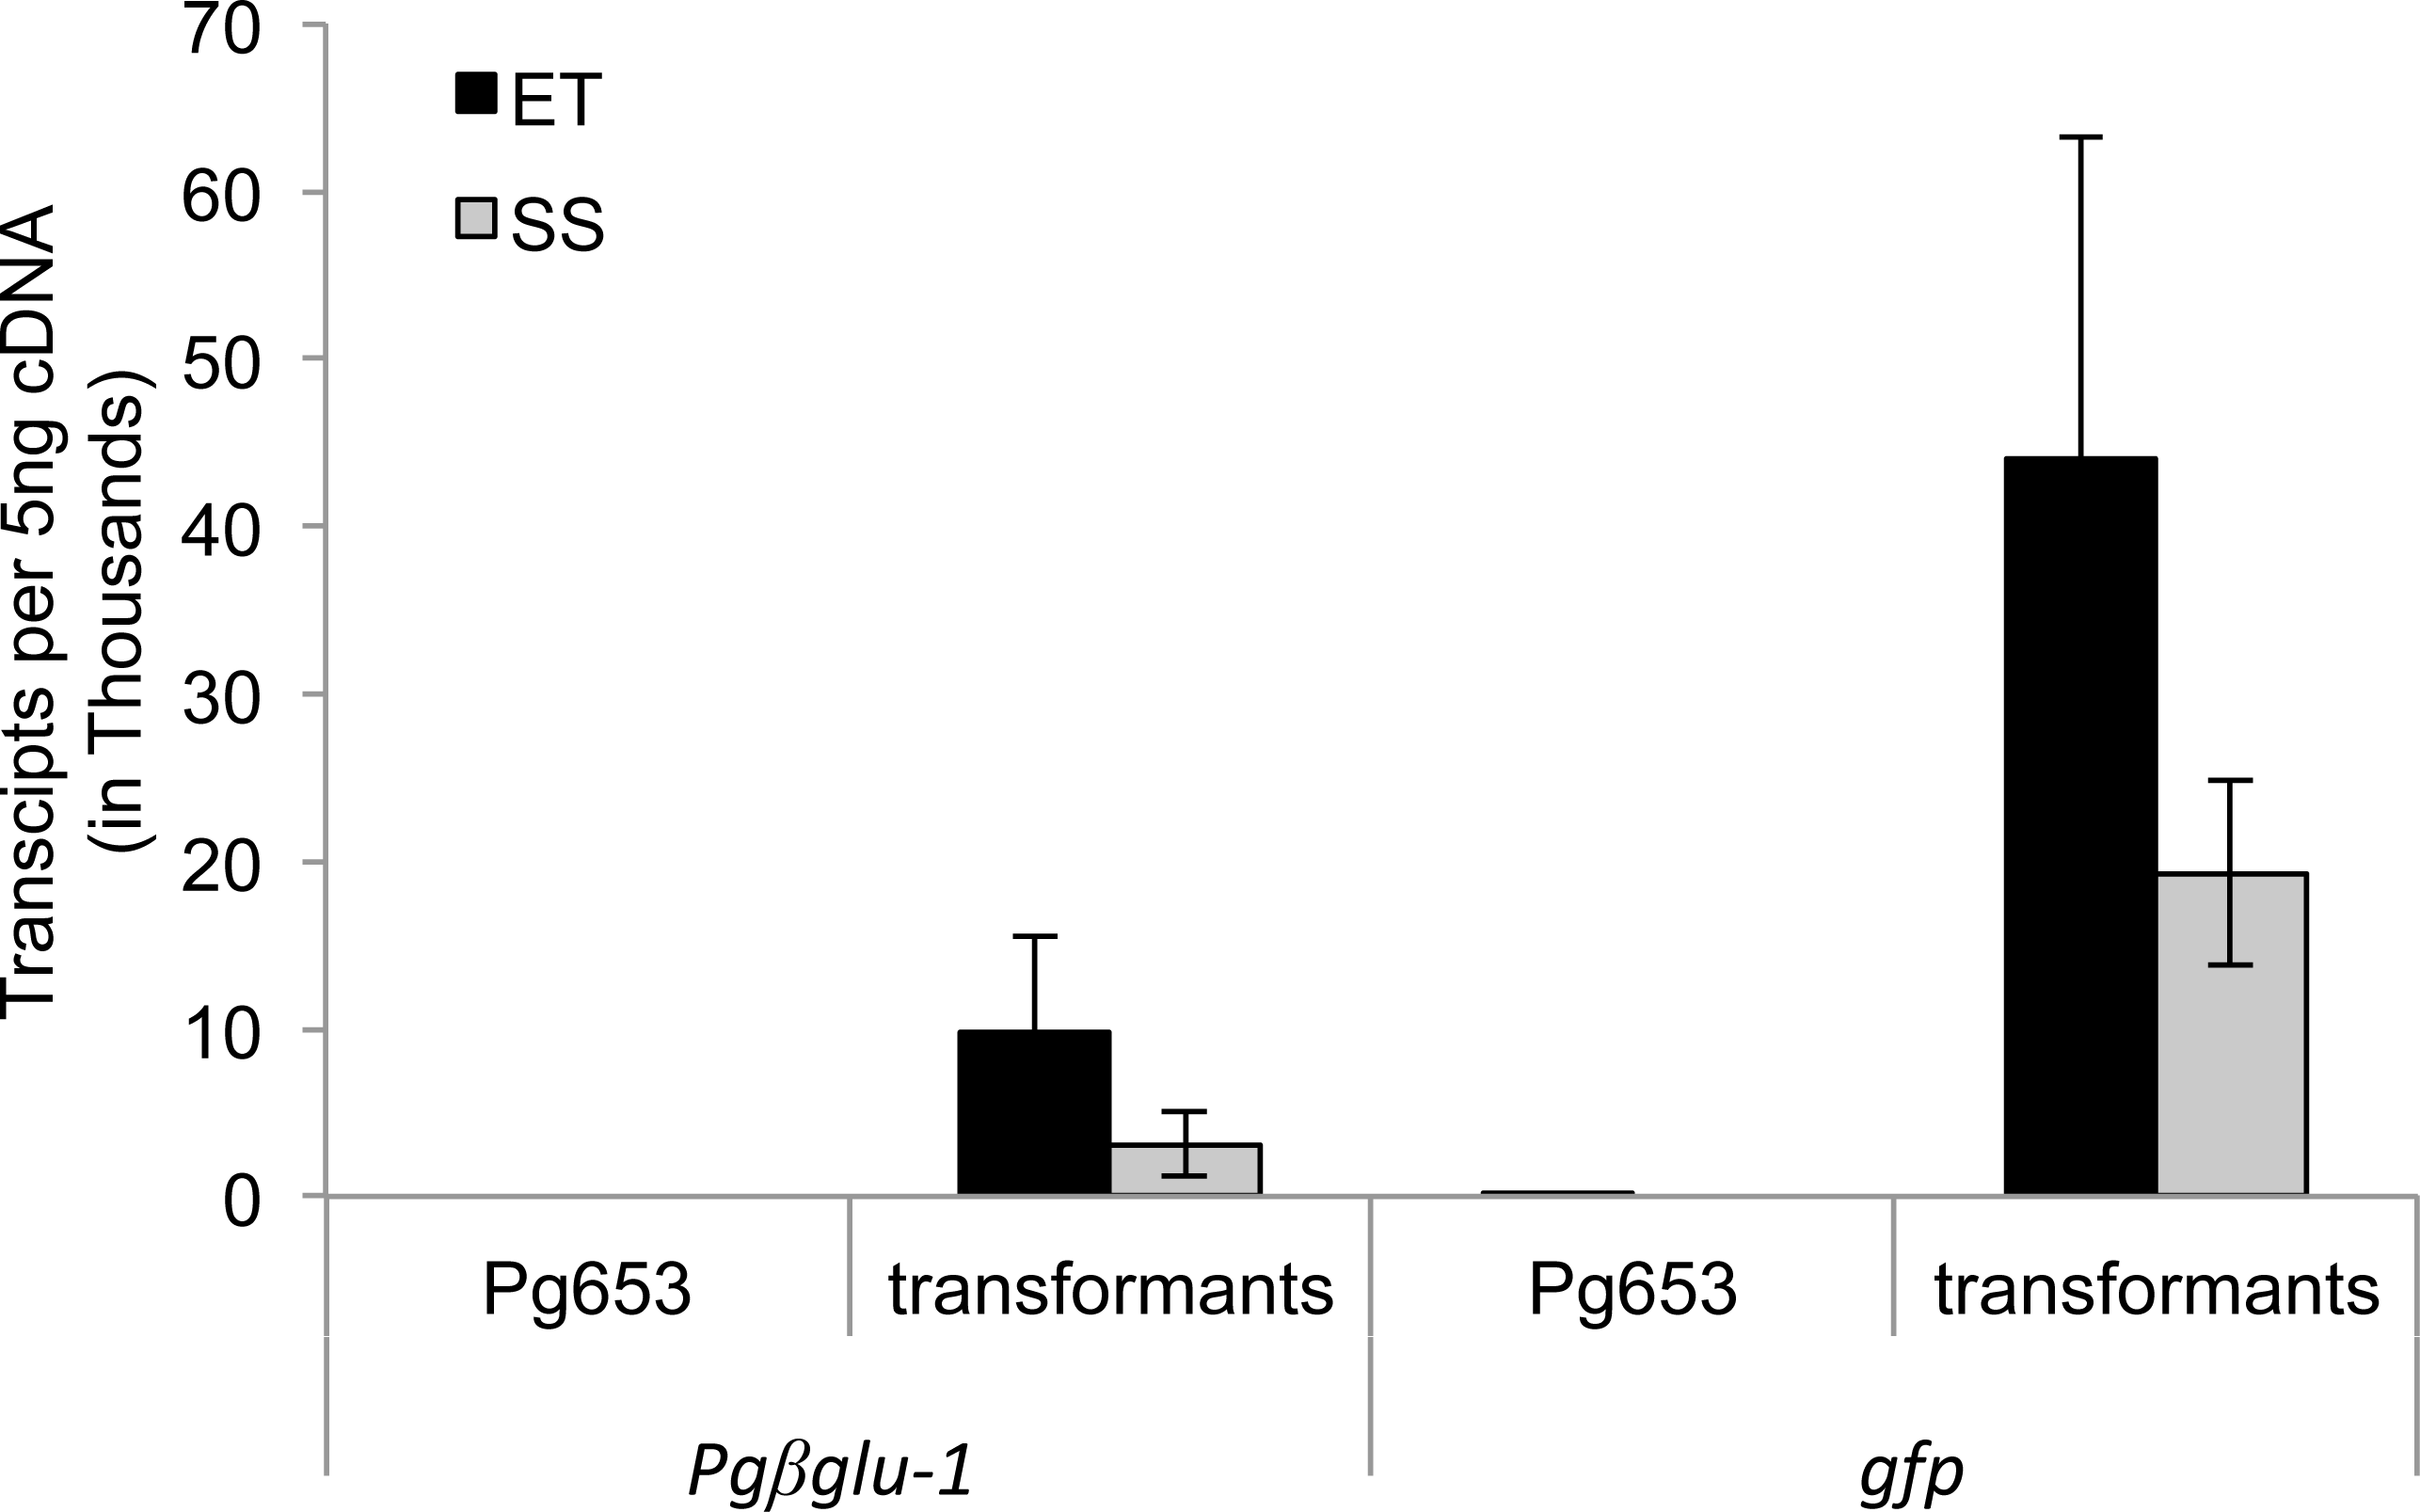
Young seedlings overexpressing Pgβglu-1 do not accumulate aceotophenone aglycons
No significant levels of acetophenone aglycons were observed in either gfp controls or Pgβglu-1 overexpressing transgenic seedlings after the first six months of growing in the greenhouse. To test if we could observe aglycon production in Pgβglu-1 overexpressing foliage when tissues were disrupted, we chose one high, one medium, and one low Pgβglu-1 expressing line based on transcript abundance in six-month old seedlings (Fig. 3A). Tissue was ground and the disrupted tissue left at room temperature for up to 24 h before metabolite extraction. In this time course test, we observed much greater release of the acetophenone aglycons piceol and pungenol in Pgβglu-1 overexpressing lines compared to gfp controls (Fig. 3B). In nature, acetophenone aglycons are produced in resistant white spruce foliage without tissue disturbance (Mageroy et al., 2015). The requirement of tissue disruption to produce the aglycons in the pgβglu-1 overexpressing lines may indicate that PgβGLU-1 protein is prevented from interacting with glucosides in the young seedlings, perhaps due to differential localization of the enzyme and the substrate or some reversible inhibition or inactivation of the enzyme. As Pgβglu-1 was expressed under a constitutive promoter it is plausible that this expression may be spatially and temporally amiss or that reversible protein modification rendered it inactive in young seedlings. However, the ability of Pgβglu-1 overexpressing lines to produce greater amounts of aglycon when tissue was disturbed provided additional proof for the function of this gene and its encoded protein. It is possible that this increased accumulation of acetophenone aglycons upon tissue distruption may contribute enhanced resistance in plants overexpressing Pgβglu-1. This remains to be tested in future work.

Figure 3: Analysis of transgene expression and β-glucosidase potential in 6-months old transgenic white spruce seedlings.
(A) After six months of growth in the greenhouse, qRT-PCR was used to determine the fold change in Pgβglu-1 expression between gfp expressing plants and three independent lines of Pgβglu-1 overexpressing plants. Representative low, medium and high Pgβglu-1 expressing lines were chosen for comparative metabolite analysis. GFP represents the average of four independent lines. Error bars represent standard deviation. N = 3. (B) To test if acetophenone glucoside could be released in Pgβglu-1 overexpressing seedlings, needles were grounds and the disrupted tissue left for 0 h, 4 h, 8 h, and 24 h before extracting metabolites. A much larger proportion of acetophenone aglycons was released in Pgβglu-1 overexpressing trees compared very small proportion of acetophenone aglycons released in gfp overexpressing tissue. Error bars represent standard error. N = 3. (C) The structures of glucosylated acetophenone and their aglycons with the catalytic function of PgβGLU-1.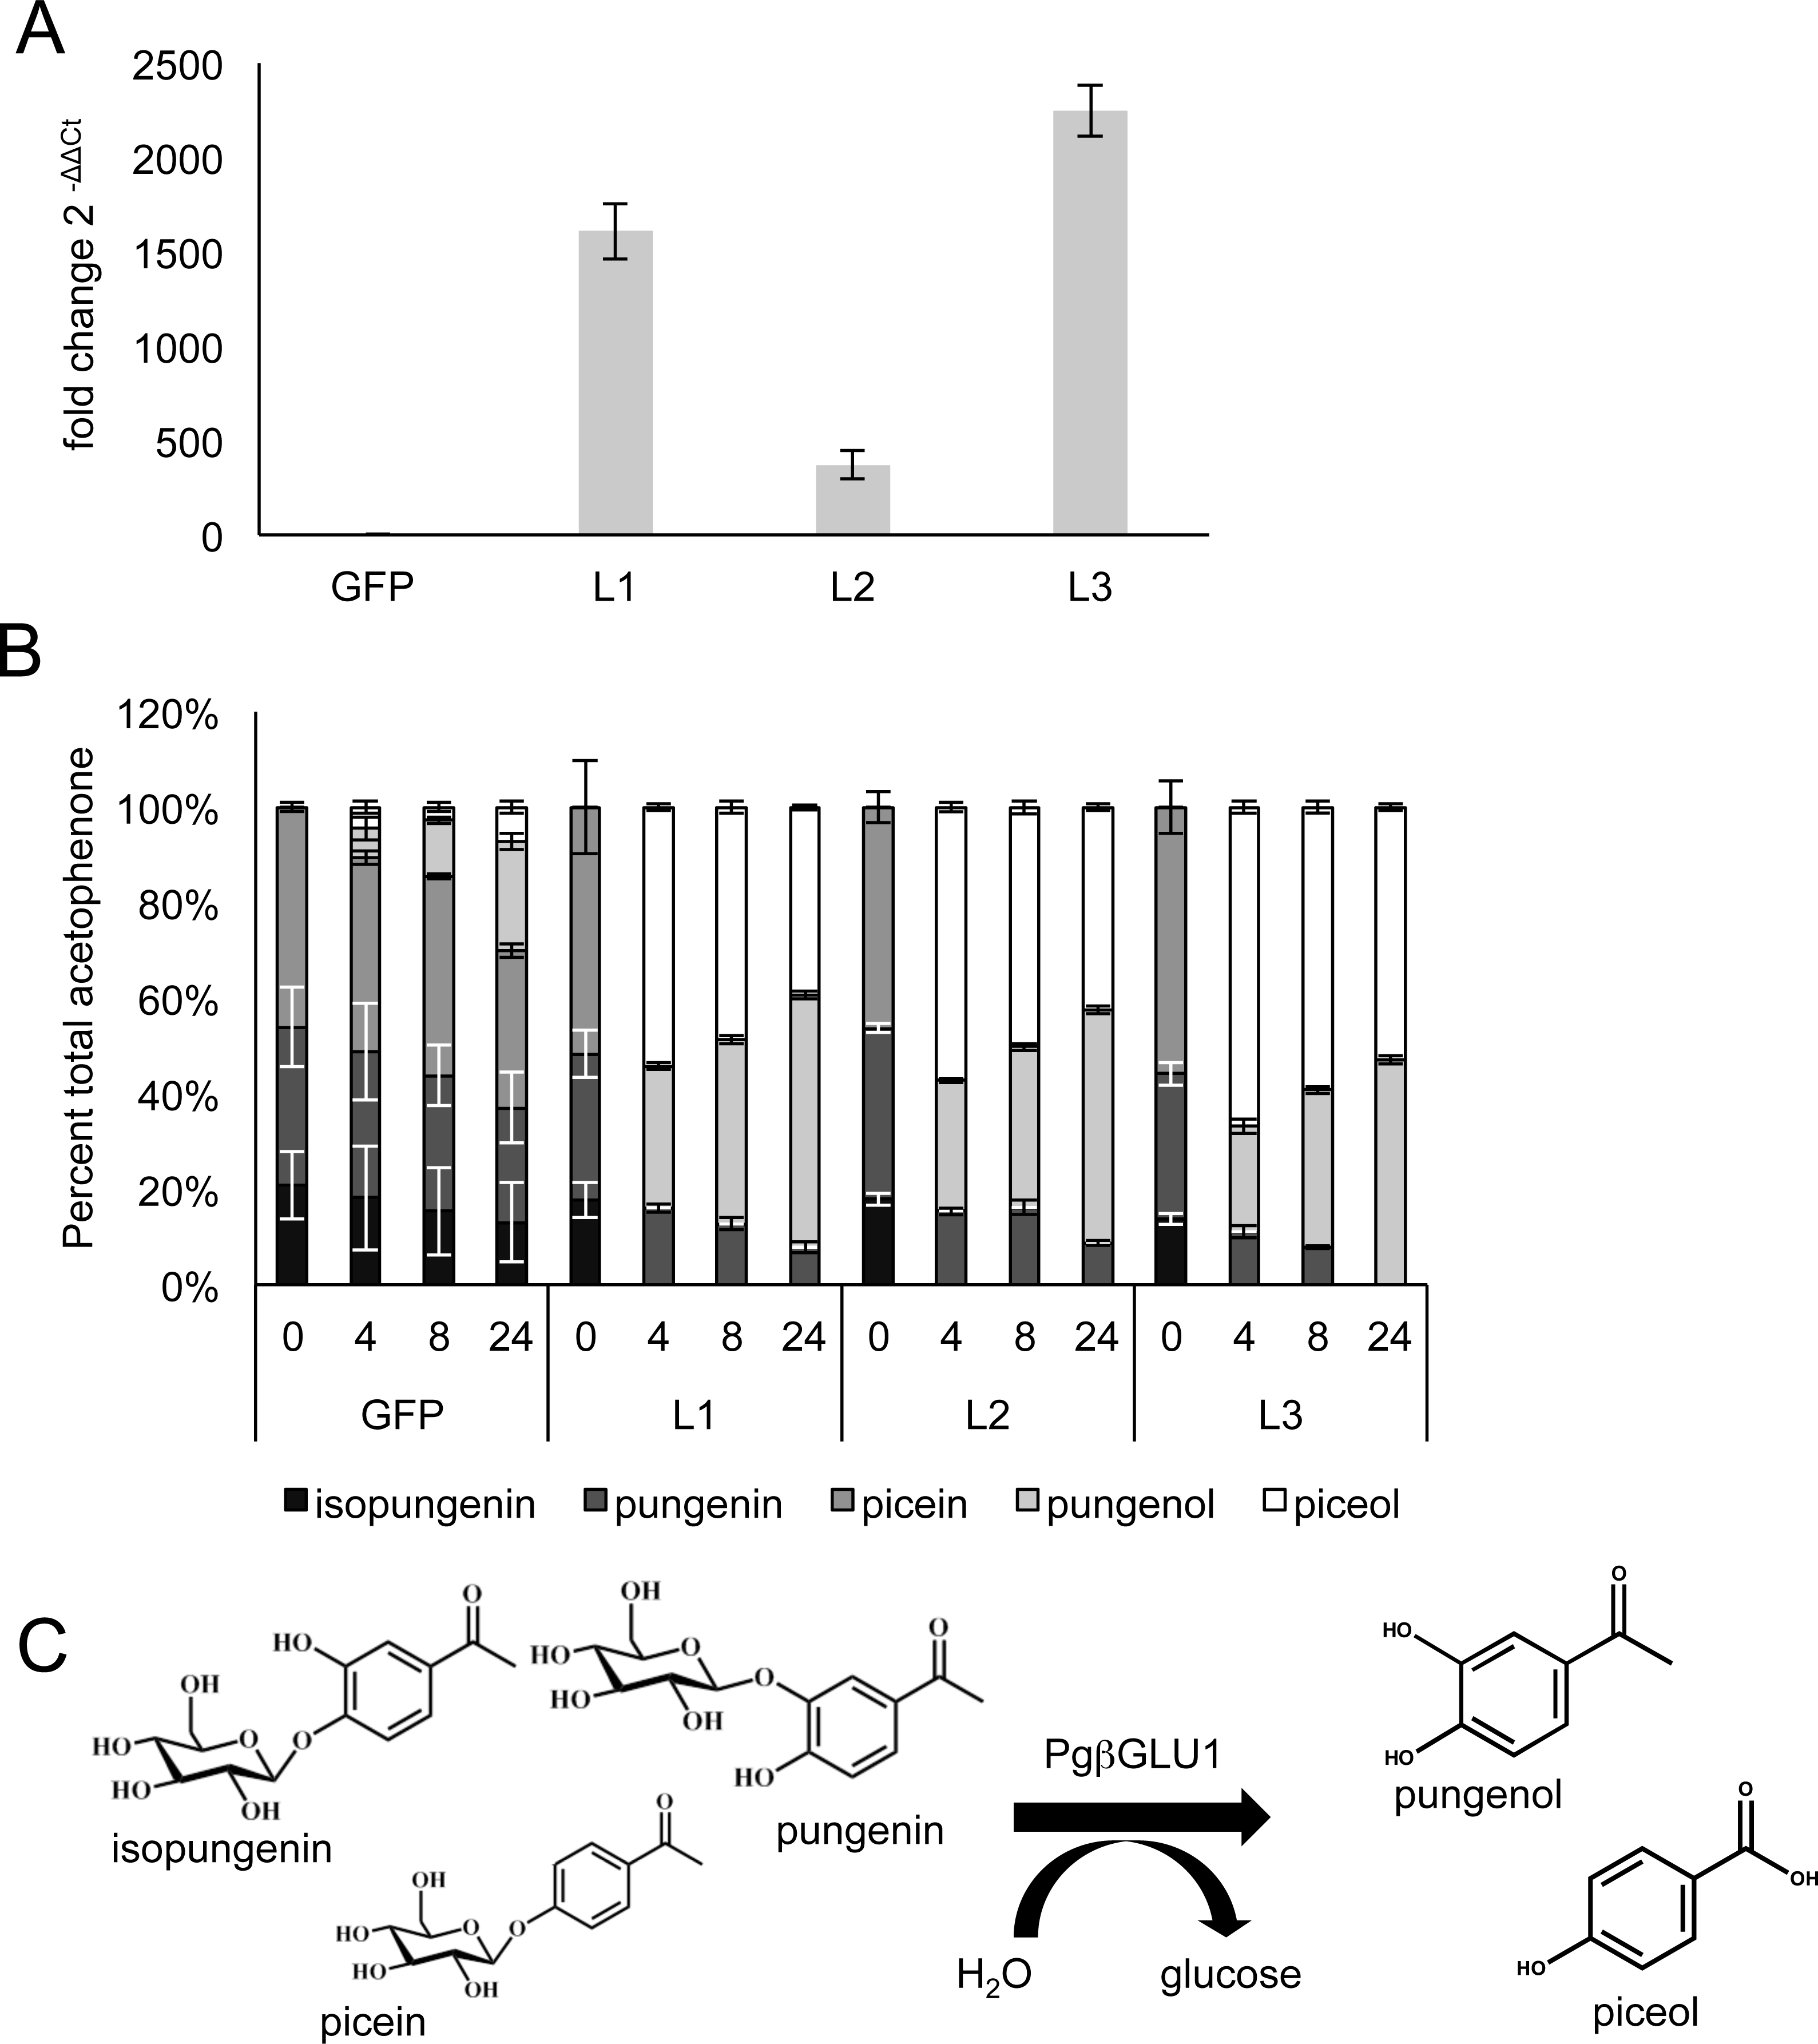
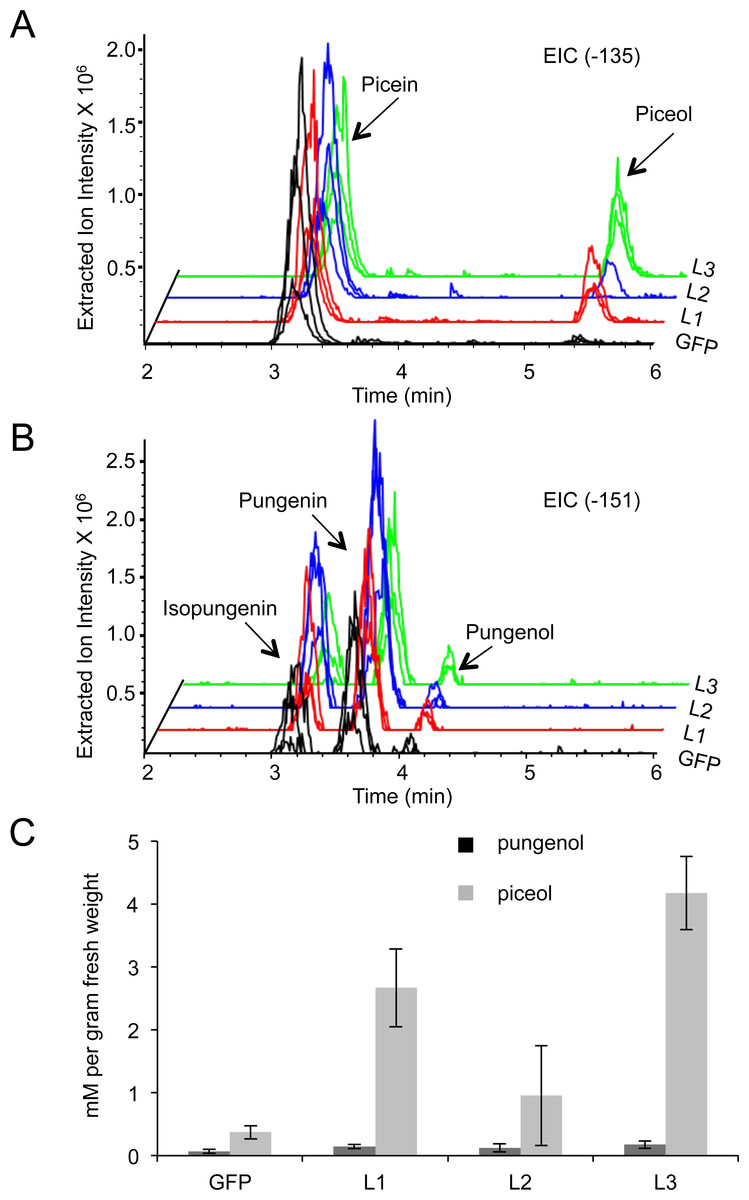
Figure 4: Altered acetophenone glucoside and aglycon profiles in new shoots of white spruce seedlings after bud flush.
Eight weeks after the beginning of bud flush, acetophenone aglycons were detected in extraction from intact Pgβglu-1 overexpressing shoots. (A) The extracted ion chromatogram (EIC) for the parent mass of piceol (−135). (B) The EIC for the parent mass of pungenol (−151). (C) Piceol and pungenol were quantified using authentic standards. A higher amount of piceol was released in Pgβglu-1 overexpressing shoots compared to the amount of pungenol. Error bars represent standard error. N = 3.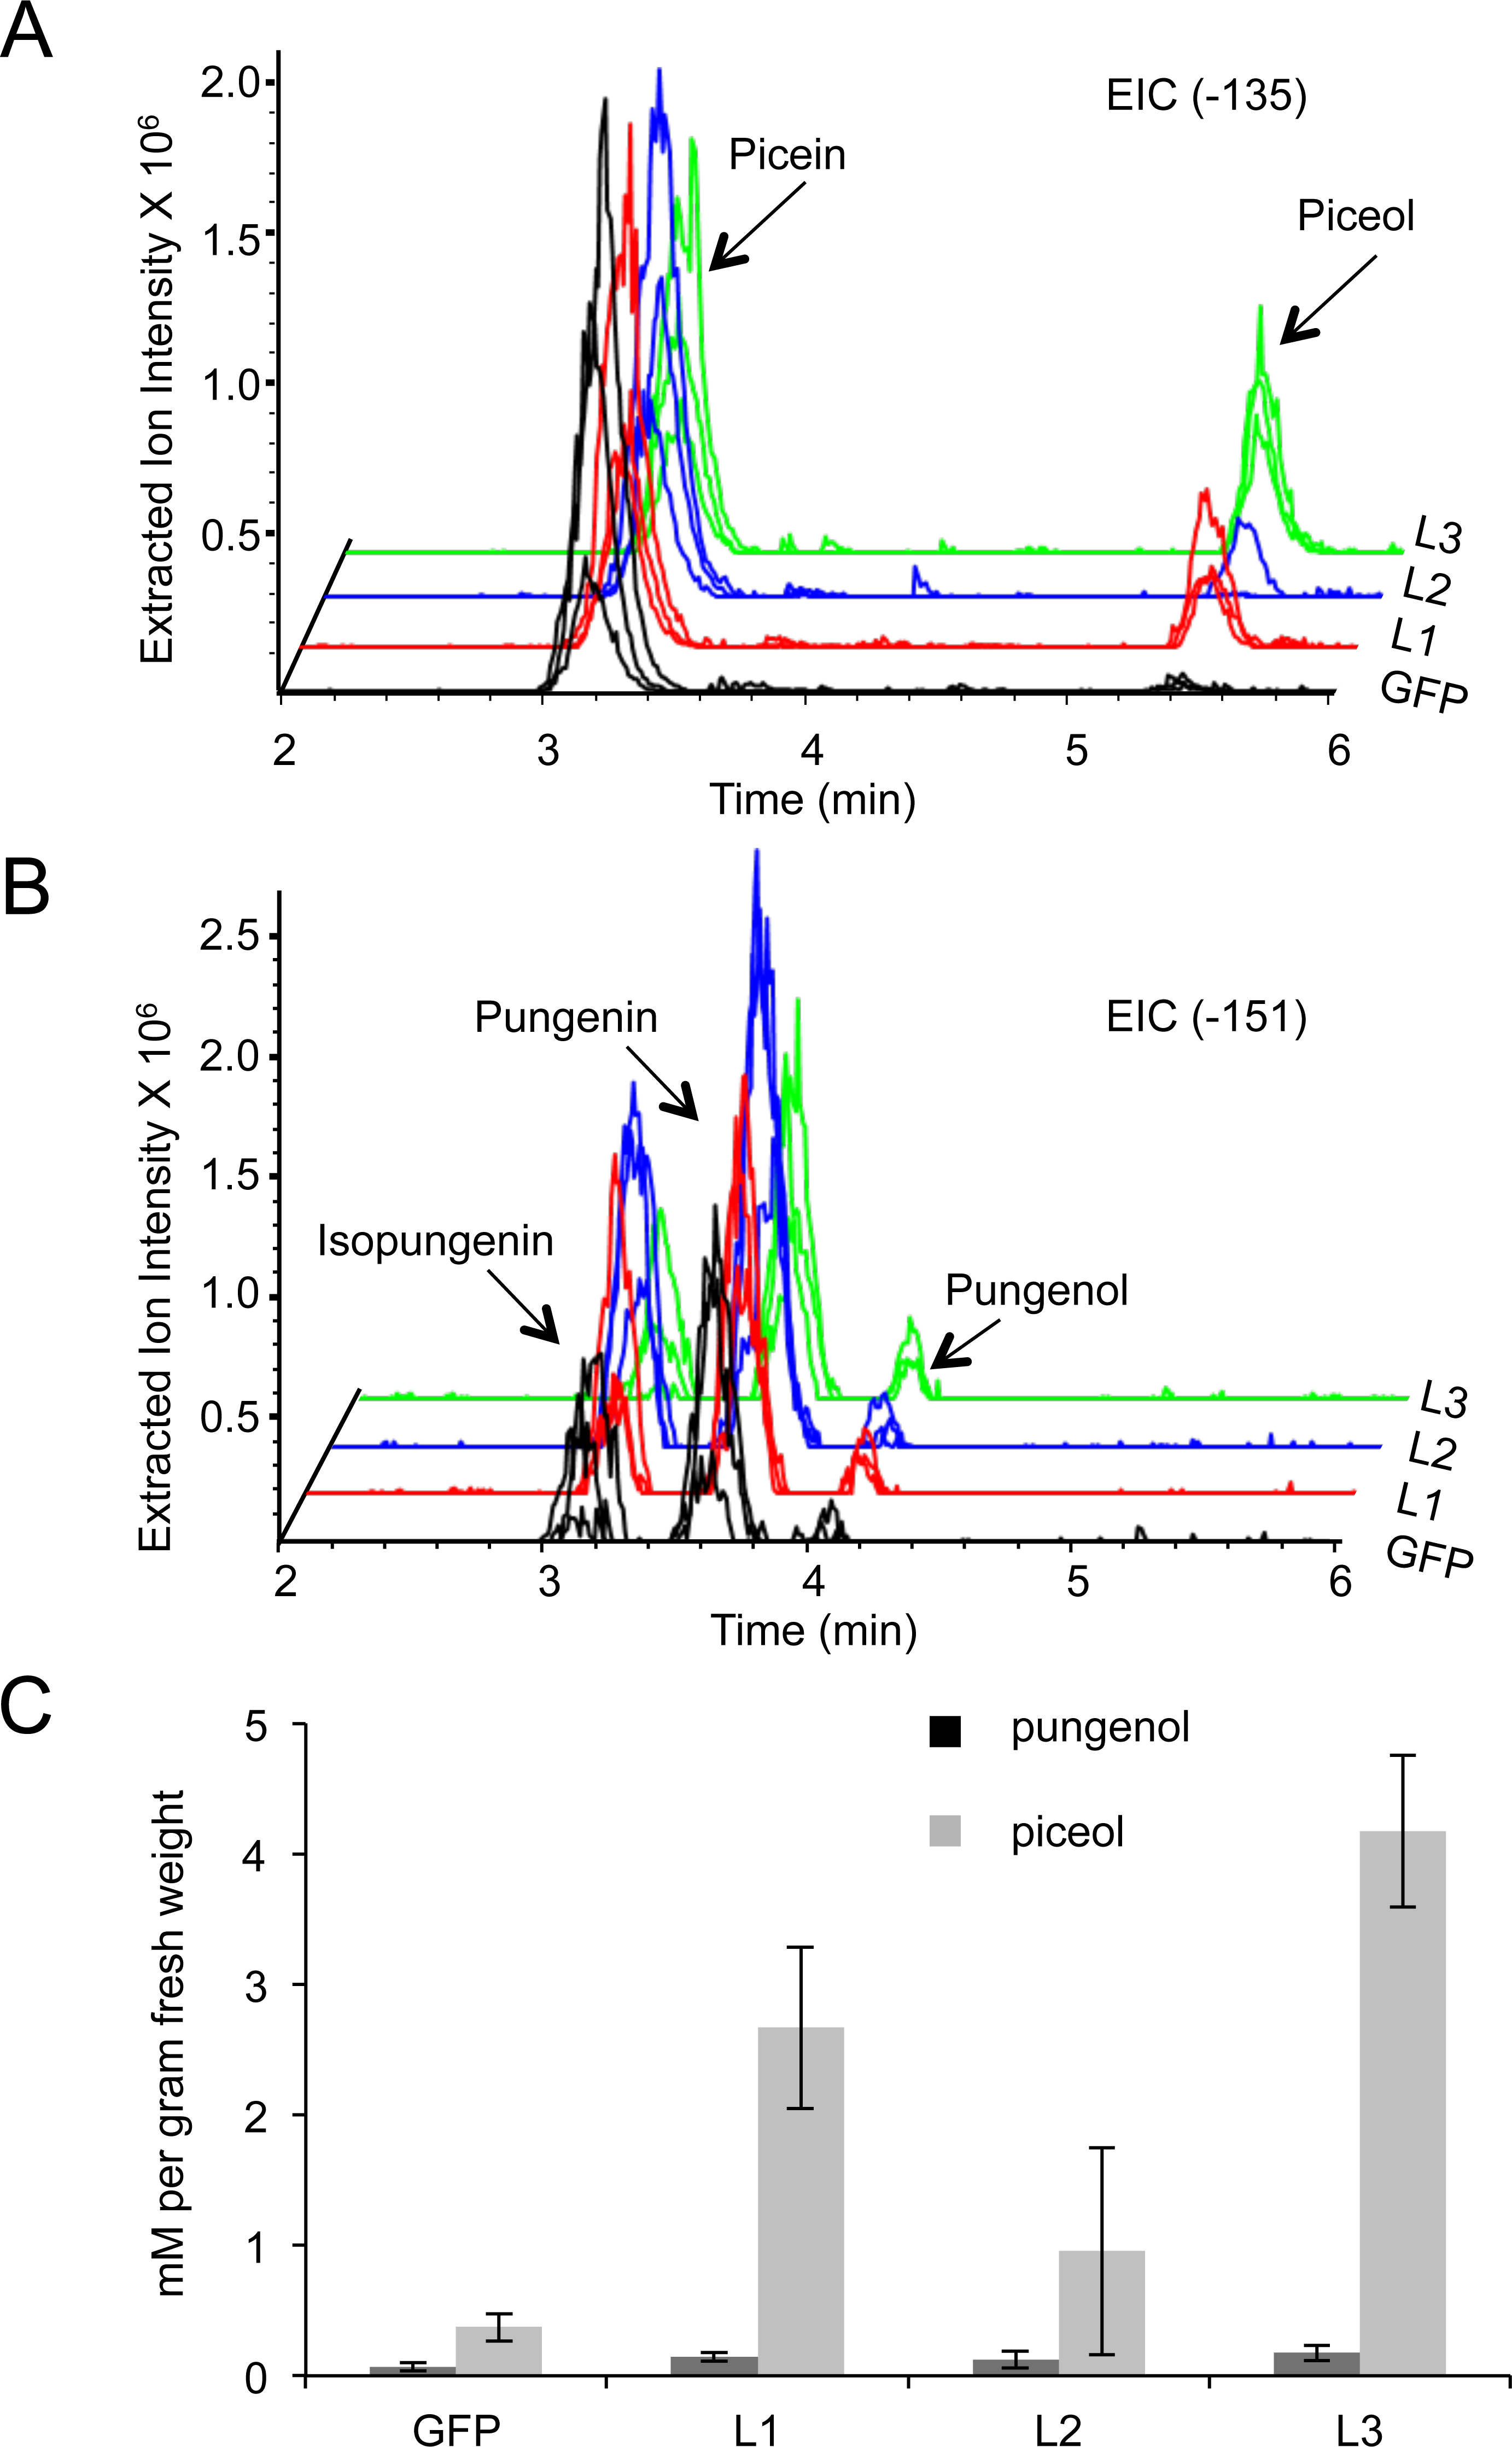
Seedlings overexpressing Pgβglu-1 accumulate acetophenone aglycons in newly growing shoot tissue after induced dormancy
Since white spruce is a perennial tree species, acetophenone production may be influenced by plant development beyond the first growth phase. We tested this possibility by carrying eight-month old seedlings through a simulated complete growth cycle including bud set, winter dormancy, and new bud flush, which involved a cold treatment in the dark and subsequent return to normal light and temperature conditions favorable to active vegetative growth. Bud flush began three weeks after returning trees to normal growth conditions. Following a gap period of no detectable levels of acetophenone glucosides and aglycons in the newly flushing shoots, accumulation of both acetophenone glucosides and the corresponding aglycons was detected at eight weeks after the beginning of new shoot growth (Figs. 4A–4B). While both the acetophenone glucosides and aglycons were observed in the Pgβglu-1 overexpressing seedlings, no substantial quantities of the aglycons were detected in the gfp transgenic control seedlings. Under these in planta conditions, overexpression of Pgβglu-1 led to higher amounts of the picein-derived aglycon piceol compared to the pungenol aglycon (Fig. 4B). Accumulation of piceol also correlated with the difference of Pgβglu-1 transcript levels in low, medium and high expressing lines (Figs. 3A and 4B). These results conclusively confirm in planta function of Pgβglu-1 in the release of acetophenone aglycons and their accumulation in intact plant tissue. In previous work, we reported the in vitro kinetic parameters of the PgβGLU-1 enzyme with picein as the substrate, but not for pungenin as this substrate is not a commercially available (Mageroy et al., 2015). The present results suggest that PgβGLU-1 is more active on picein, compared to pungenin, in planta.
Conclusions
We showed that overexpressing Pgβglu-1 in a white spruce genotype that does not naturally contain acetophenone aglycons leads to the in planta formation of the resistance metabolite piceol, and in disrupted tissues also the additional formation of pungenol. The results validate previously reported in vitro function of Pgβglu-1 and its encoded PgβGLU-1 enzyme. The different results obtained with young seedling before bud flush and seedlings that had passed through bud set and new bud flush point out the need for caution when evaluating phenotypes of young seedling overexpressing a transgene. As we found, the altered metabolite phenotype was not observable in intact tissue until after the first bud flush. Conditions of spruce metabolism that provide the precursors for altered metabolism may vary depending on the developmental stage of seedlings, where precursors for defense metabolism may only become fully accessible after the seedlings have gone through an initial growth phase or a dormancy phase. In future work, effects of the Pgβglu-1 transgene expression and altered acetophenone profiles in transgenic Pg653 trees will be tested with insect feeding test, which will require production and maturation of a larger number of young trees.