
Intervention effects of five cations and their correction on hemolytic activity of tentacle extract from the jellyfish Cyanea capillata
- Published
- Accepted
- Received
- Academic Editor
- Joao Rocha
- Subject Areas
- Cell Biology, Toxicology
- Keywords
- Jellyfish, Cation, Tentacle extract, Cyanea capillata, Hemolysis
- Copyright
- © 2017 Zhang et al.
- Licence
- This is an open access article distributed under the terms of the Creative Commons Attribution License, which permits unrestricted use, distribution, reproduction and adaptation in any medium and for any purpose provided that it is properly attributed. For attribution, the original author(s), title, publication source (PeerJ) and either DOI or URL of the article must be cited.
- Cite this article
- 2017. Intervention effects of five cations and their correction on hemolytic activity of tentacle extract from the jellyfish Cyanea capillata. PeerJ 5:e3338 https://doi.org/10.7717/peerj.3338
Abstract
Cations have generally been reported to prevent jellyfish venom-induced hemolysis through multiple mechanisms by spectrophotometry. Little attention has been paid to the potential interaction between cations and hemoglobin, potentially influencing the antagonistic effect of cations. Here, we explored the effects of five reported cations, La3+, Mn2+, Zn2+, Cu2+ and Fe2+, on a hemolytic test system and the absorbance of hemoglobin, which was further used to measure their effects on the hemolysis of tentacle extract (TE) from the jellyfish Cyanea capillata. All the cations displayed significant dose-dependent inhibitory effects on TE-induced hemolysis with various dissociation equilibrium constant (Kd) values as follows: La3+ 1.5 mM, Mn2+ 93.2 mM, Zn2+ 38.6 mM, Cu2+ 71.9 μM and Fe2+ 32.8 mM. The transparent non-selective pore blocker La3+ did not affect the absorbance of hemoglobin, while Mn2+ reduced it slightly. Other cations, including Zn2+, Cu2+ and Fe2+, greatly decreased the absorbance with Kd values of 35.9, 77.5 and 17.6 mM, respectively. After correction, the inhibitory Kd values were 1.4 mM, 45.8 mM, 128.5 μM and 53.1 mM for La3+, Zn2+, Cu2+ and Fe2+, respectively. Mn2+ did not inhibit TE-induced hemolysis. Moreover, the inhibitory extent at the maximal given dose of all cations except La3+ was also diminished. These corrected results from spectrophotometry were further confirmed by direct erythrocyte counting under microscopy. Our results indicate that the cations, except for La3+, can interfere with the absorbance of hemoglobin, which should be corrected when their inhibitory effects on hemolysis by jellyfish venoms are examined. The variation in the inhibitory effects of cations suggests that the hemolysis by jellyfish venom is mainly attributed to the formation of non-selective cation pore complexes over other potential mechanisms, such as phospholipases A2 (PLA2), polypeptides, protease and oxidation. Blocking the pore-forming complexes may be a primary strategy to improve the in vivo damage and mortality from jellyfish stings due to hemolytic toxicity.
Introduction
Jellyfish are free-swimming marine animals consisting of a gelatinous umbrella-shaped bell and trailing tentacles. While they are found in coastal water zones worldwide, jellyfish populations fluctuate greatly in accordance with ocean climate and, perhaps, other factors related to human interactions (Williamson et al., 1984; Winter et al., 2010). Jellyfish range from about 1 mm to nearly 2 m in bell height and diameter; the tentacles that rim the umbrella typically extend beyond their bell dimension. Contact with jellyfish tentacles, even when beached and dying, can trigger millions of nematocysts to pierce the skin and inject venom through inverted long spiny tubules, thereby causing toxic manifestations from no effect to extreme pain and even death (Carrette & Seymour, 2004).
The jellyfish venom in the nematocyst, similarly to many other types of venom, is a complex mixture of bioactive proteins and peptides that have demonstrated a wide spectrum of biological activities (Bloom, Burnett & Alderslade, 1998; Chung et al., 2001; Yanagihara et al., 2002; Sanchez-Rodriguez, Torrens & Segura-Puertas, 2006; Brinkman & Burnell, 2008), including dermonecrotic, cardiotoxic, neurotoxic, hemolytic, enzymatic, immunogenic and inflammatory effects. Despite over 50 years of research, the pathophysiological processes and mechanisms of the toxic proteins and peptides in this venom have yet to be elucidated. In general, the main cause of death is believed to be cardiotoxicity, while the hemolytic activity is considered a preliminary damage factor and offers an approach to disentangle the complex venom. However, it is reported that hemolysis can range from simple nuisance to serious pathological and lethal events, and is a frequent effect of a number of jellyfish venoms acting as lytic protein/peptides that alter cell permeability resulting in ion transport, cell swelling and osmotic lysis, whereas others are phospholipases inducing degradation of bilayer phospholipids or channel-forming agents embedded into the membrane (Mariottini, 2014).
Determining the optical absorbance of released hemoglobin from lysed erythrocytes at 414 or 545 nm by spectrophotometry is a simple method to test the hemolytic activity of jellyfish venom. This method is widely utilized in cytolytic activity evaluation, hemolytic compound purification and identification, and the identification of inhibitors necessary to explore the hemolytic mechanism and develop novel anti-hemolytic strategies. Dozens of compounds, including osmotic protectants, lipids, proteases, antioxidants and cations, have demonstrated the potential to prevent hemolysis induced by jellyfish venom by either impeding the destruction of membrane lipids or hindering the formation of pores on the cell membrane (Li et al., 2005; Marino et al., 2008; Marino, Morabito & La Spada, 2009; Morabito et al., 2014). Compared with various types of inhibitors, certain cations, such as La3+ (Bailey et al., 2005), Mn2+ (Li et al., 2005), Zn2+ (Yu et al., 2007), Cu2+ (Marino, Morabito & La Spada, 2009) and Fe2+ (Yu et al., 2007), are usually effective at millimolar concentrations, a relatively high dose that partially precipitates the jellyfish proteins, such as collagen and other toxic compounds. Cations that are colored in aqueous solutions, such as Cu2+ and Fe2+, may interfere with the absorbance of hemoglobin by spectrophotometry, raising concerns regarding whether this testing method reveals the true inhibitory effects of cations on the hemolytic activity of jellyfish venom. In the current study, we aim to determine the intervention effects of cations La3+, Mn2+, Zn2+, Cu2+ and Fe2+ on the hemolytic activity of jellyfish venom and to further exploit its possible mechanism underlying the hemolytic activity of jellyfish venom.
Materials and Methods
Preparation of tentacle extract from the jellyfish Cyanea capillata
Specimens of Cyanea capillata collected in June 2015 in the Sanmen Bay, East China Sea, were identified by Professor Huixin Hong from the Fisheries College of Jimei University, Xiamen, China. The isolated tentacles were placed in plastic bags with dry ice and immediately shipped to Shanghai, where the samples were stored in a −80 °C freezer until use. The tentacle extract (TE) preparation procedure has been described in previous reports (Wang et al., 2013a, 2013b, 2013c, 2013d, 2014; Zhang et al., 2014). Briefly, tentacles at −80 °C were thawed and immersed in seawater (28 g/L NaCl, 5 g/L MgCl2·6H2O, 0.8 g/L KCl, 1.033 g/L CaCl2) to allow tissue autolysis and stirred gently for four days. The autolyzed mixture was then centrifuged at 10,000g for 15 min, and the resultant supernatant liquid was collected as the TE. The TE was dialyzed against PBS (pH 7.4, 0.01 M) for 8 h before use. All the procedures were performed at 4 °C.
Erythrocyte suspension
Samples of blood were drawn through the tail vein of male Kunming mice (3–6 months) that were purchased from the Laboratory Animal Center of the Second Military Medical University (SMMU). The mice were provided with sufficient food and water, and all animal handlings were approved by the SMMU Ethics Committee. Fresh heparinized mouse blood (100 μL) was suspended in 10 mL 0.01 M phosphate buffer containing 0.9% NaCl (pH = 7.35, 300 mOsm/kgH20). To prepare a pure erythrocyte suspension, the diluted blood sample was centrifuged at 1,000g for 10 min. The supernatant buffy coat and blood serum were discarded, and the erythrocyte pellet was washed twice and suspended in the same buffer to a final concentration of 0.45% (v/v) (Kang et al., 2009; Li et al., 2013; Wang et al., 2013d).
Hemoglobin solution
In total, 10 mL of erythrocyte suspension were transferred to a 15 mL centrifugal tube and subjected to a series of sonication periods. After sonication for 60 s in total, the samples were allowed to cool for 10 s between ultrasound pulses, using a Misonix S-4000 sonicator (Qsonica, Newtown, CT, USA) set to 20 kHz and 25 W. The sonicated erythrocyte sample was centrifuged at 10,000g for 30 min to remove the fragmentized cell membrane and released organelles, and the resultant supernatant was hemoglobin solution.
Hemolytic test by spectrophotometry
The hemolytic activity of TE was first tested by spectrophotometry. Various concentrations of TE (30, 90, 180, 270, 360, 450 and 540 μg/mL) were added to the erythrocyte suspension (100 μL, 0.45% in 0.01 M phosphate buffer containing 0.9% NaCl, pH = 7.35, 300 mOsm/kgH20). The total volume of the test system was 200 μL. The samples were incubated at 37 °C for 30 min in a water bath accompanied by mild horizontal shaking. The intact erythrocytes and erythrocyte ghosts were removed by centrifugation at 2,000g for 5 min. A 150 μL portion of the supernatant fluid was transferred to a 96-well microplate, and its optical absorbance (OD) was measured at 415 nm by spectrophotometry. The concentration of the released hemoglobin from the lysed erythrocytes was taken as the index of the TE-induced hemolysis. The negative (0.01M phosphate buffer) and positive (30 μg/mL saponin) controls were taken as 0% and 100% hemolysis, respectively. The hemolytic activity of TE was expressed as % absorbance, compared to the positive control group.
Cation interventions
Different amounts of LaCl3 (1.2, 1.4, 1.6 and 1.8 mM), MnCl2 (20, 40, 50, 100 and 400 mM), ZnCl2 (10, 20, 40 and 100 mM), CuCl2 (30, 60, 90 and 120 μM) and FeSO4 (20, 40, 80 and 120 mM) dissolved in 0.01 M phosphate buffer were added to an erythrocyte suspension (100 μL, 0.45% in 0.01 M phosphate buffer containing 0.9% NaCl, pH = 7.35, 300 mOsm/kgH20), followed by the addition of 360 μg/mL TE, to test their inhibitory effect on TE-induced hemolysis. Similarly, the same cation solutions were added to 100 μL of hemoglobin suspension to determine the effect of the cations on the absorbance of hemoglobin at 414 nm. A Nanodrop 1000 (Thermo, Waltham, MA, USA) was used to measure the UV–Vis spectra of hemoglobin solution ranging from 220 to 750 nm in the presence of Cu2+ (30, 60 and 120 μM) and Fe2+ (20, 40 and 120 mM).
Confocal laser scanning microscopy
Direct erythrocyte counting was also carried out using confocal laser scanning microscopy (CLSM). To determine the effect of cations on TE-induced hemolysis, LaCl3 (1.8 mM), MnCl2 (400 mM), ZnCl2 (100 mM), CuCl2 (120 μM) or FeSO4 (120 mM) were added to the erythrocyte solution, followed by 360 μg/mL TE. After incubation at 37 °C for 30 min in a water bath, accompanied by mild horizontal shaking, the erythrocyte suspension was mixed and transferred to a confocal dish for cell counting.
Data analysis
All the quantitative data are expressed as the mean ± SD. Statistical analyses were performed using one-way ANOVA and followed by Student–Newman–Keuls test with the SPSS 22.0 software. The pictures were depicted with the Origin software. A 0.05 level of probability was used as the level of significance.
Ethical statement
The investigation was carried out in conformity with the requirements of the Ethics Committee of the Second Military Medical University and National Institutes of Health (NIH) guide for care and use of Laboratory animals (NIH Publications No. 8023). Jellyfish catching was permitted by the East China Sea Branch, State Oceanic Administration, People’s Republic of China.
Results
Dose-dependent TE hemolysis by spectrophotometry
Using current spectrophotometric methods, we examined the dose-dependent relationship of hemolysis by TE from the jellyfish Cyanea capillata. Figure 1 shows a dose–response curve depicted by the Hill equation within the TE dose of 540 μg/mL. The dissociation equilibrium constant (Kd) value (Tomasi et al., 2013; Dupin et al., 2015) was 176.2 ± 8.2 μg/mL. The hemolytic curve slowly increased up to 90 μg/mL, reaching values of less than 10%, and then sharply increased to 360 μg/mL, reaching the value of approximately 90%. When the exposure concentrations were greater than 360 μg/mL, the curve began to reach the maximal plateau. Thus, for all future experiments, we uniformly utilized the TE concentration of 360 μg/mL to evaluate TE hemolysis.
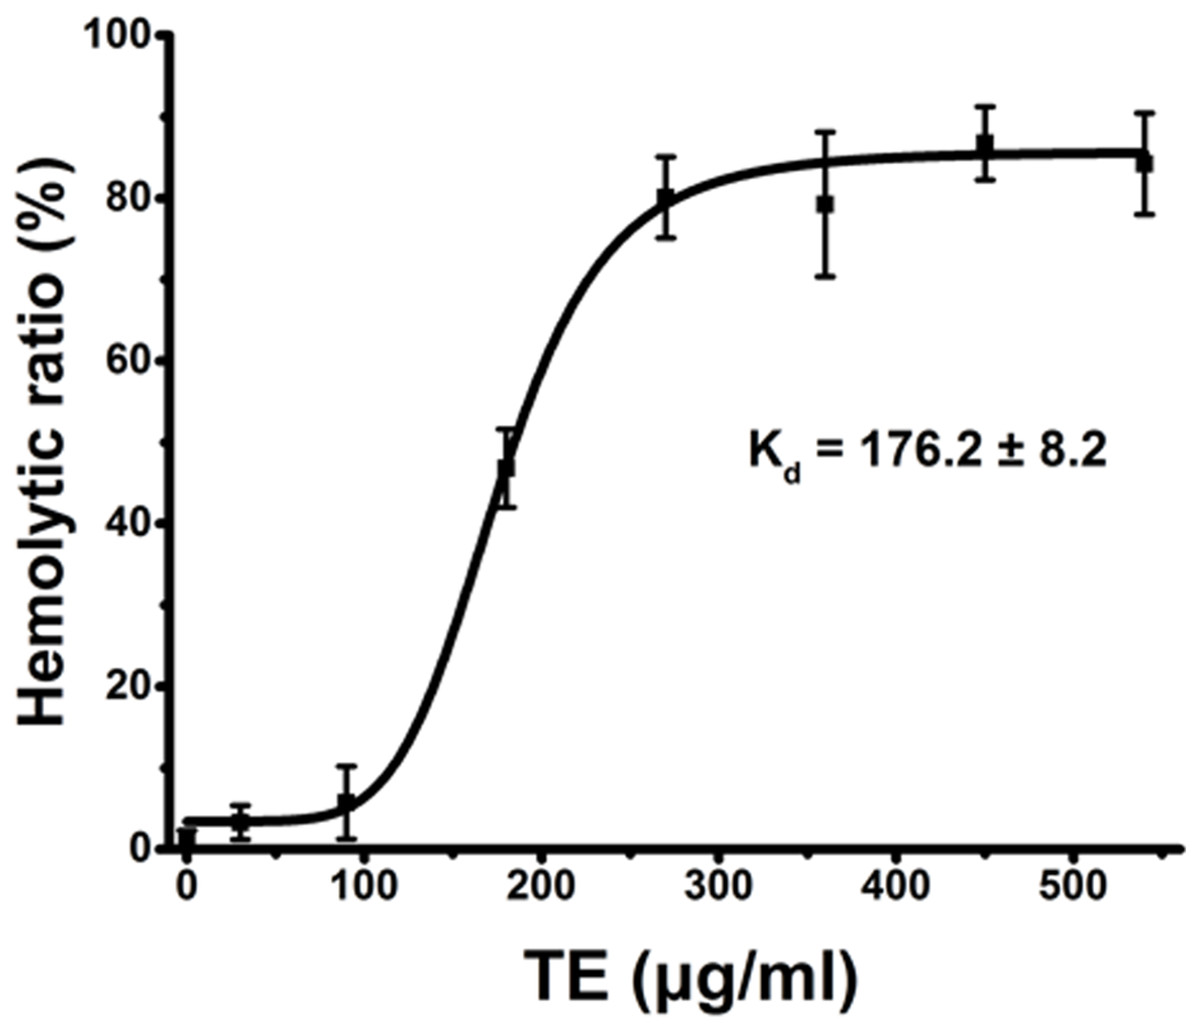
Figure 1: Hemolysis ratio (%) after 30 min of treatment with varying TE concentrations.
The dose–response curve is depicted based on Hill’s co-operation analysis. All data are presented as the mean ± SD (n = 3).
Inhibitory effects of cations on TE-induced hemolysis by spectrophotometry
Several studies (Rosenthal et al., 1990; Edwards & Hessinger, 2000; Bailey et al., 2005) have previously reported that the cations La3+, Mn2+, Cu2+, Zn2+ and Fe2+ antagonize hemolysis induced by nematocyst venom or jellyfish TE by either blocking the venom-formed membrane pore or stabilizing the cell membrane. We, therefore, examined the anti-hemolytic effects of the above cations on TE-induced hemolysis using traditional spectrophotometric methods. As expected, all cations displayed significant dose-dependent anti-hemolytic effects on TE-induced hemolysis, although with differing inhibitory concentrations and Kd values (Figs. 2A–2E). The effective inhibitory concentrations of the non-specific ion channel blocker La3+ were between 1 and 1.8 mM, with a Kd value 1.5 ± 0.01 mM. Cu2+ displayed an even stronger suppression of TE-induced hemolysis; its inhibitory concentration was less than 120 μM, and the Kd value was 71.9 ± 6.5 μM. Other bivalent cations, including Mn2+, Zn2+ and Fe2+, displayed relatively weaker suppressive effects on TE-induced hemolysis compared with La3+ and Cu2+. Their ranges of inhibitory concentrations were ∼400, ∼120 and ∼100 mM, with Kd values of 93.2 ± 7.0 mM, 38.6 ± 36.3 mM and 32.8 ± 76.1 mM, respectively. Moreover, to show the anti-hemolysis effects of cations more distinctly, we compared the respective maximal suppressive extents of the five cations with TE treatment group (Fig. 2F). According to the spectrophotometric values, La3+, Cu2+, Zn2+ and Fe2+ resulted in complete inhibitions of less than 10%, while Mn2+ showed partial suppression with a maximum inhibition of approximately 40%. Therefore, our results showed that the inhibitory effects of cations on TE-induced hemolysis were in accordance with previous investigations.
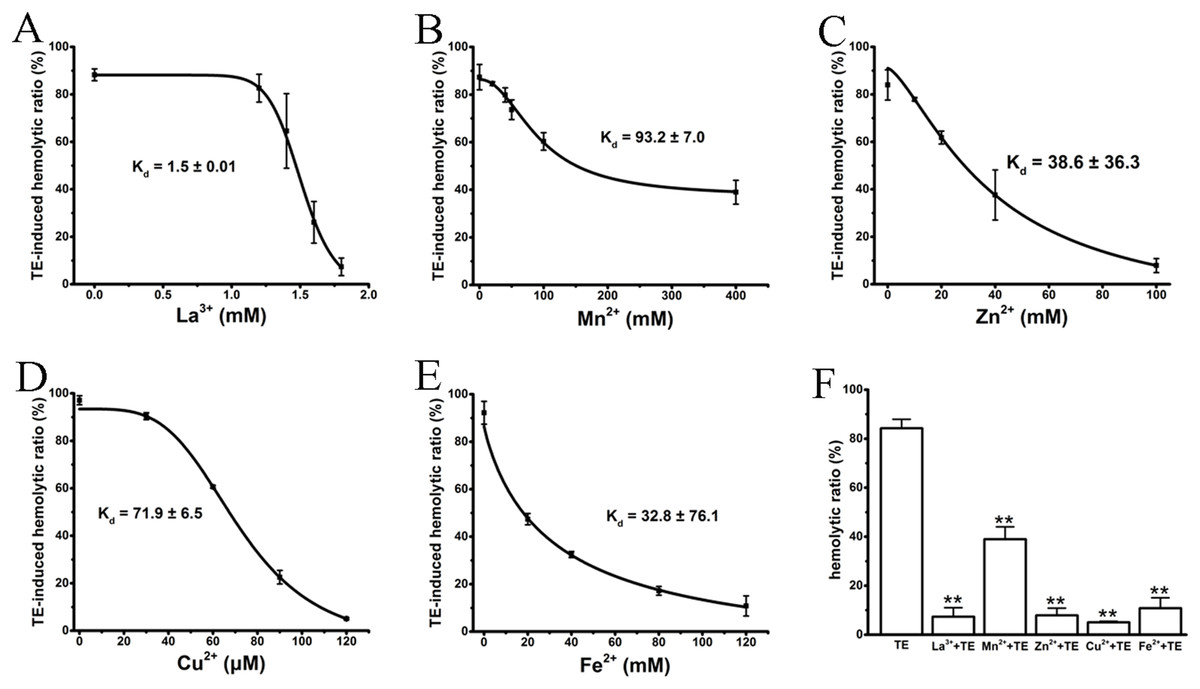
Figure 2: Intervention of various cations on TE-induced hemolysis.
The cations La3+ (A); Mn2+ (B); Zn2+ (C); Cu2+ (D) and Fe2+ (E) were pre-incubated with a 0.45% erythrocyte suspension for 30 min before the administration of 360 μg/mL TE. The corresponding dose–response curves are depicted based on Hill’s co-operation analysis. (F) Comparison of the changes of TE-induced hemolysis ratio (%) under the maximum anti-hemolytic concentrations La3+ (1.8 mM); Mn2+ (400 mM); Zn2+ (100 mM); Cu2+ (120 μM) and Fe2+ (120 mM). All data are demonstrated as the mean ± SD (n = 3). *p < 0.05, compared to the TE-treatment group.
Influences of cations on the hemolytic test system by spectrophotometry
In the process of spectrophotometric hemolysis determination, we observed that some cations resulted in colored aqueous solutions, such as Cu2+ (green), Fe2+ (aqua) and Mn2+ (red); in addition, the Zn2+ solution was slightly ivory as a result of the high concentration-induced hydrolysis. Although erythrocytes and hemoglobin exhibit specific absorbance peaks at 414 and 545 nm, we were interested whether these colorful cations influenced the test system, thereby complicating an analysis of their effects on TE-induced hemolysis. We first compared the absorbance values of the colored cation solutions at their maximum anti-hemolytic concentrations at 415 nm (Fig. 3A). La3+, Mn2+ and Cu2+ displayed similar values to that of control, while Zn2+ and Fe2+ showed small increases. We then tested the effects of the cations on the 0.45% erythrocyte solutions (Fig. 3B). As expected, the colorful Zn2+, Cu2+ and Fe2+ cations resulted in a decrease in the absorbance values of the erythrocytes, while Mn2+ increased the absorbance values and the transparent La3+ had little effect, suggesting that the cation colors might interfere with the absorbance spectrum of hemoglobin.
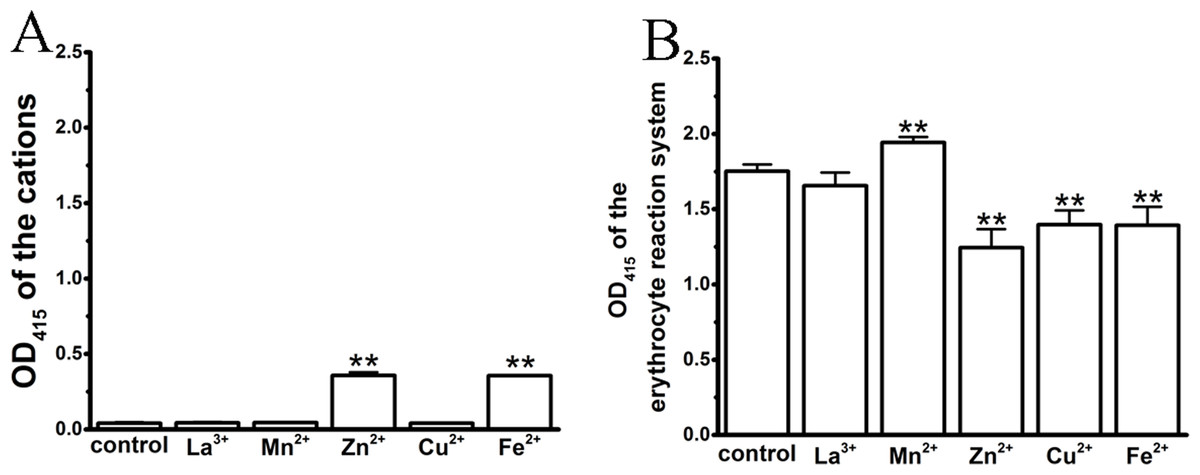
Figure 3: Effects of the cations on an erythrocyte reaction system by spectrophotometry, where the maximal anti-hemolytic concentrations of the cations were used.
(A) Optical absorbance (OD) of cations at 415 nm. Control (0.9% NaCl), La3+ (1.8 mM), Mn2+ (400 mM), Zn2+ (100 mM), Cu2+ (120 μM) and Fe2+ (120 mM). (B) Optical absorbance (OD) of the erythrocyte reaction system at 415 nm upon treatment with cations. Control (0.9% NaCl); La3+ (1.8 mM); Mn2+ (400 mM); Zn2+ (100 mM); Cu2+ (120 μM) and Fe2+ (120 mM). All data are demonstrated as the mean ± SD (n = 3). *p < 0.05, compared to the control group.
Effect of cations on the hemoglobin solution
We tested the effects of cations, at the same concentrations used above, on released hemoglobin from a 0.45% erythrocyte suspension (Fig. 4). We did not see any effect by the transparent La3+ on the hemoglobin solutions (Fig. 4A). The Mn2+ solution displayed a small decrease in the absorbance values (Fig. 4B). The colorful Zn2+, Cu2+ and Fe2+ greatly diminished the absorbance values of hemoglobin at the given concentrations; the resulting Kd values were 35.9 ± 25.6 mM, 77.5 ± 7.7 μM and 17.6 ± 66.4 mM, respectively (Figs. 4C–4E). Cu2+ is the only one of the five cations that was used in μM/L and Fe2+ has a millimolar concentration in blood, so we measured the UV–Vis spectra of hemoglobin solution in the presence of Cu2+ (30, 60 and 120 μM) and Fe2+ (20, 40 and 120 mM) (Fig. 5). The results showed that, at 415 nm where hemoglobin has a peak absorption, Cu2+ (30, 60 and 120 μM) (Fig. 5A) and Fe2+ (120 mM) (Fig. 5B) obviously decreased the absorbance value of hemoglobin. These experiments indicate that the colorful cations can change the absorbance values of erythrocytes and hemoglobin at 415 nm, thereby influencing the hemolytic test system.
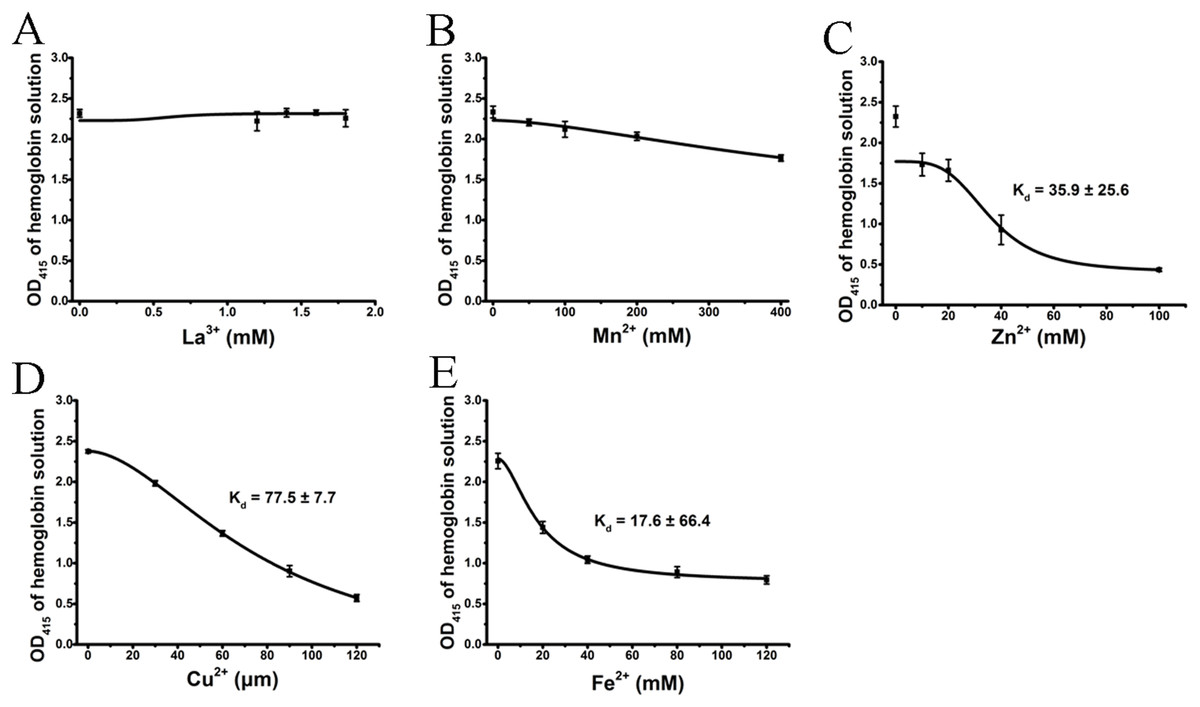
Figure 4: Effects of the cations on a hemoglobin solution by spectrophotometry.
The hemoglobin solution was obtained by sonicating a 0.45% erythrocyte suspension. La3+ (A); Mn2+ (B); Zn2+ (C); Cu2+ (D) and Fe2+ (E) are displayed. Corresponding dose–response curves are depicted based on Hill’s co-operation analysis. All data are demonstrated as the mean ± SD (n = 3).
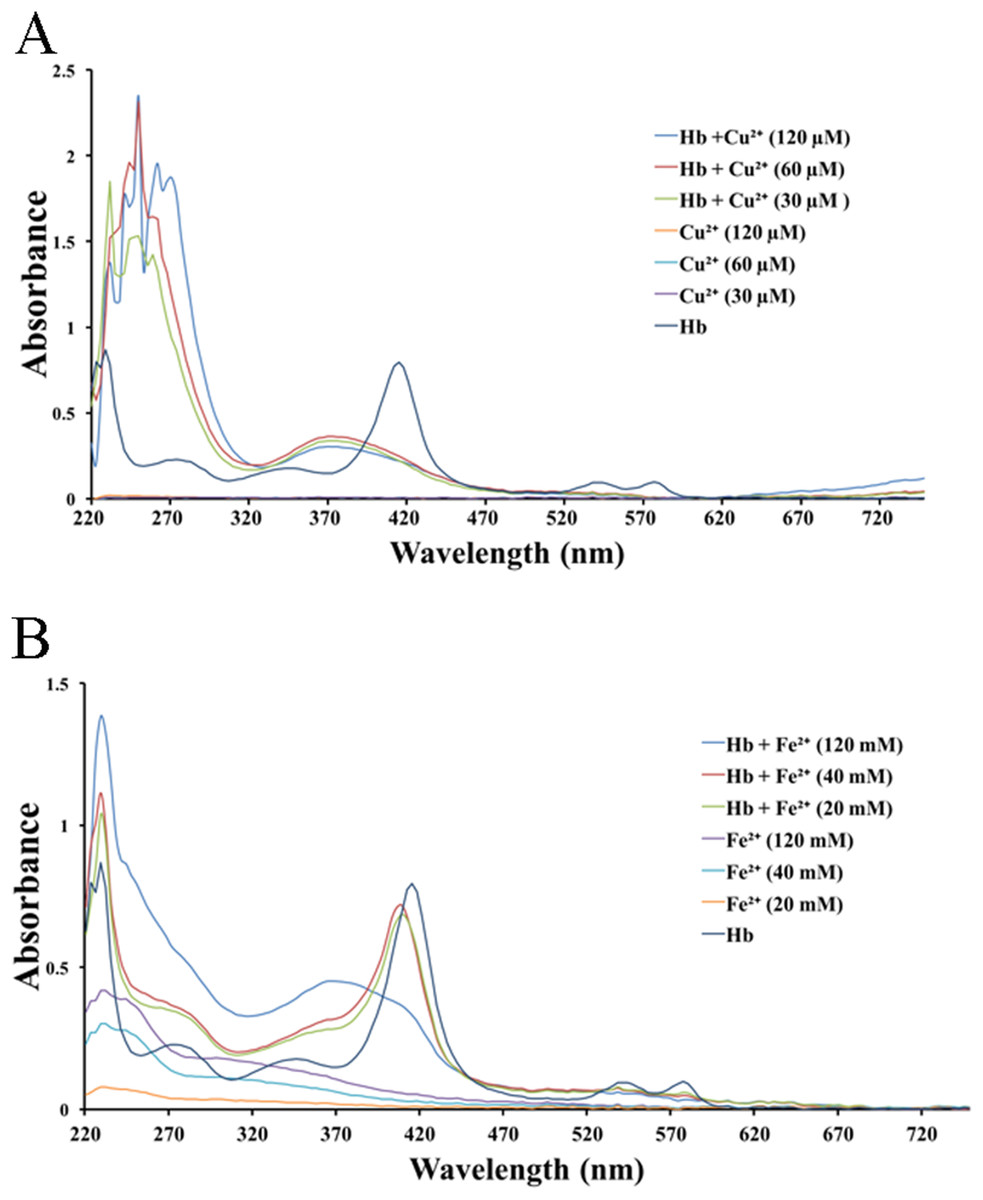
Figure 5: UV–Vis spectroscopy of hemoglobin solution.
(A) UV–Vis spectroscopy of hemoglobin solution in the presence of Cu2+ (30, 60 and 120 μM). (B) UV–Vis spectroscopy of hemoglobin solution in the presence of Fe2+ (20, 40 and 120 mM).
Correction of the inhibitory effects of cations on TE-induced hemolysis
Therefore, the hemolytic effects of the colored cations can be separated into two effects. The first is the true inhibition of TE-induced hemolysis, and the other is a false positive effect caused by the modulation of the hemoglobin absorbance by the colored cation solution. Because the absorbance values of hemoglobin were modified in proportion to the cation concentration, and every tested concentration was determined, we used the equation “y = ax” to adjust the hemolytic ratio at every given concentration, where “y” is the real hemolytic ratio, “x” is the determined hemolytic ratio and “a” is an adjustment coefficient that is the inverse of the ratio of cations at the corresponding concentration. Except for the transparent La3+ (Fig. 6A), the anti-hemolysis curves of four other cations were right-shifted. The corrected Kd values were 1.4 ± 6.5 mM, 45.8 ± 15 mM, 128.5 ± 130 μM and 53.1 ± 111.3 mM for La3+, Zn2+, Cu2+ and Fe2+, respectively (Fig. 6). To our surprise, Mn2+ did not show any inhibition after correction (Fig. 6B). Meanwhile, all cations at the given maximal concentrations displayed much smaller inhibitory effects on TE-induced hemolysis although the differences were still significant. Thus, the correction indicated that the anti-hemolytic effects of cations Mn2+, Cu2+, Zn2+ and Fe2+ (Figs. 6B–6E) on TE-induced hemolysis were over-estimated and must be corrected using their respective cation–hemoglobin concentration curves.
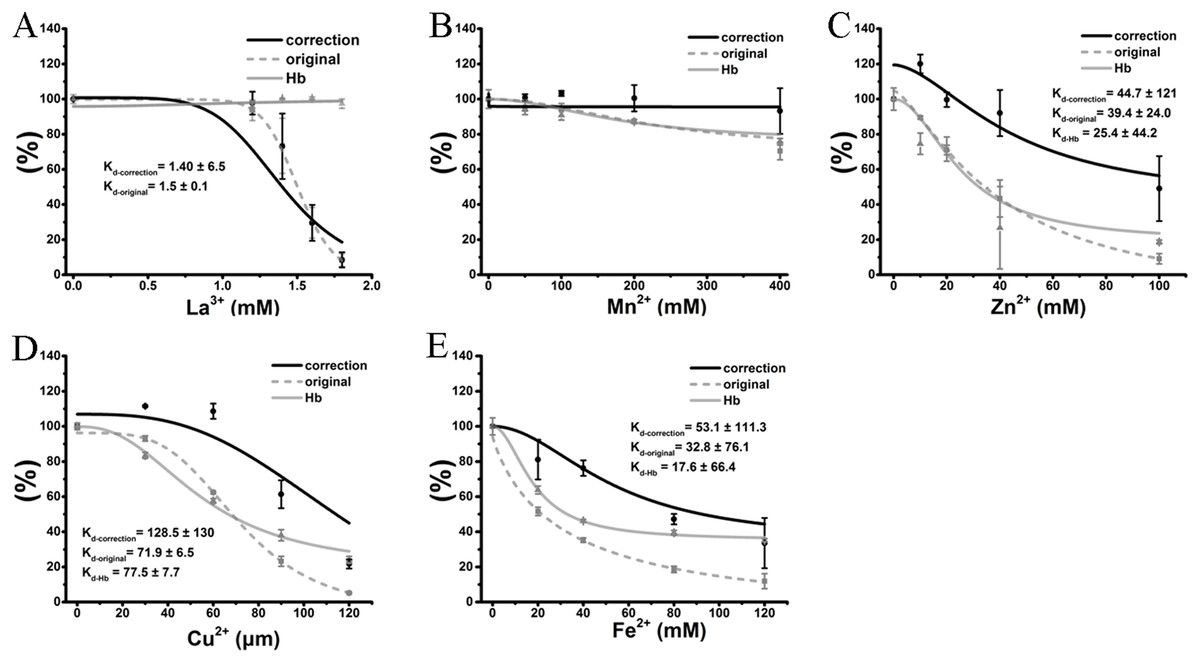
Figure 6: Correction of cation inhibitory effects on TE-induced hemolysis.
La3+ (A); Mn2+ (B); Zn2+ (C); Cu2+ (D) and Fe2+ (E) are displayed. The curves marked “correction” were adjusted according to the equation “y = ax”, where “y” is the real hemolytic ratio, “x” is the determined hemolytic ratio and “a” is the adjustment coefficient, i.e., the inverse of the ratio of cations at the corresponding concentration on the absorbance values of hemoglobin. The curves marked “original” were adjusted according to the determined hemolytic ratio (Fig. 2). The curves marked “Hb” were adjusted according to the OD415 of cations on the released hemoglobin from a 0.45% erythrocyte suspension by spectrophotometry (Fig. 4). Kd-correction, Kd-original, Kd-Hb are all listed, respectively. Corresponding dose–response curves were depicted based on Hill’s co-operation analysis. All data are demonstrated as the mean ± SD (n = 3).
Effects of the cations on TE-induced hemolysis under microscopy
To further confirm our results, we counted the erythrocytes under a microscope after the co-incubation with cations alone or cations in the presence of TE, and compared the erythrocyte numbers before and after TE treatment to give the “Erythrocyte amount (%)” (Fig. 7). The number of erythrocytes was significantly decreased in the TE group, and their shape was changed from the typical biconcave discoid to convex and rounded. In all cation groups, the internal cations did not change the number or the shapes of the erythrocytes. To our surprise, a large amount of floccule was observed encircling the erythrocytes, especially in the La3+, Zn2+, Fe2+ and Cu2+ groups, which might be due to the interaction of cations with the collagen in jellyfish TE. In the La3+, Zn2+, Fe2+ and Cu2+ groups, more erythrocytes were present than in the TE-alone positive control group. No change in the erythrocyte amount was observed in the La3+ group, suggesting the obvious inhibitory effect of La3+ on TE-induced hemolysis. Cu2+, Zn2+ and Fe2+ also displayed strong anti-hemolytic effects, while the erythrocyte count in the Mn2+ group was the lowest, indicating the weakest, or absence of, anti-hemolytic effects. These results indicate that the inhibitory effects of the cations on TE-induced hemolysis, as examined under microscopy, were roughly consistent with the determination by spectrophotometry after correction.
![Effects of the cations on TE-induced hemolysis by direct erythrocyte counting under microscopy using the maximal anti-hemolytic concentrations of cations [La3+ (1.8 mM); Mn2+ (400 mM); Zn2+ (100 mM); Cu2+ (120 μM) and Fe2+ (120 mM)].](https://dfzljdn9uc3pi.cloudfront.net/2017/3338/1/fig-7-2x.jpg)
Figure 7: Effects of the cations on TE-induced hemolysis by direct erythrocyte counting under microscopy using the maximal anti-hemolytic concentrations of cations [La3+ (1.8 mM); Mn2+ (400 mM); Zn2+ (100 mM); Cu2+ (120 μM) and Fe2+ (120 mM)].
The erythrocyte amount (%) means the ratio of cell numbers in different cations plus TE groups versus cation-only groups. All data are demonstrated as the mean ± SD (n = 3). *p < 0.05, compared to the TE-treatment group.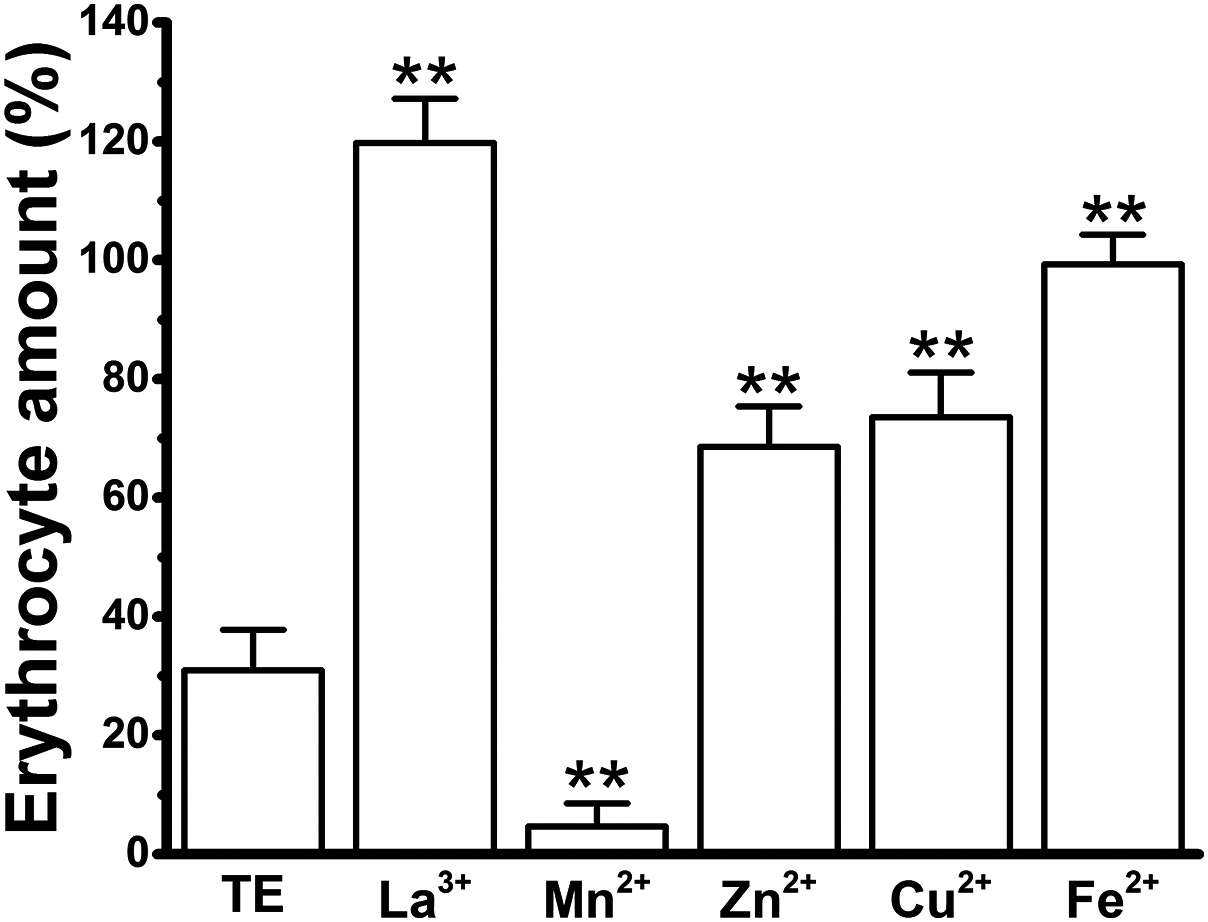
Discussion
We have examined the anti-hemolytic effects of five cations with reported inhibitory effects on the TE-induced hemolysis from the jellyfish Cyanea capillata. All the cations, except the transparent La3+, were found to significantly influence the erythrocyte test system and the hemoglobin system by virtue of their colored aqueous solutions. The true antagonistic effects of the cations on TE-induced hemolysis were actually weaker than those tested by in previous spectrophotometry studies. For this study, corrected inhibitions were calculated from the effect of colored solutions on hemoglobin absorbance under the same conditions; these corrected values were supported by direct counting of erythrocytes under microscopy.
Hemolytic determination and intervention
Hemolysis is a frequent effect of jellyfish stings. This dangerous condition is known to be caused by the jellyfish venom and can be lethal. Mature mammalian erythrocytes are highly differentiated cells that possess a large amount of hemoglobin without intracellular organelles, such as mitochondria and a nucleus; thus, the concentration of released hemoglobin at 414 nm (Chung et al., 2001; Garcia-Arredondo et al., 2014; Kang et al., 2014; Morabito et al., 2014) or 545 nm (Kang et al., 2009) is normally proportional to the number of lysed erythrocytes and reflects the hemolytic activity. This simple method for determination of hemolysis is widely used to compare hemolytic potencies, explore molecular mechanisms and search for potential interventions (Long & Burnett, 1989). Concentrations inducing 50% hemolysis by jellyfish venoms vary from “∼ng/mL” to “∼mg/mL” depending on the jellyfish species and sample extraction methods (Mariottini, 2014). The hemolytic activity of crude venom from isolated nematocysts of the Hawaiian box jellyfish Carybdea alata was 1–10 μg/mL and was reduced after exposure to proteolytic enzymes (trypsin, collagenase and papain), carbohydrates (d-lactulose and d-galactose, among others), EDTA and cations (K+ and Mn2+) but was increased by other cations, including Mg2+, Ca2+ and Zn2+ (Chung et al., 2001). In another study, the hemolytic activity of the full venom of Rhopilema esculentum Kishinouye was 3.4 μg/mL and was affected by pH, temperature, EDTA, (NH4)2SO4 and all tested divalent cations (Mg2+, Cu2+, Zn2+, Fe2+, Ca2+ and Mn2+) (Yu et al., 2007). Hemolysis by the crude venom of Aiptasia mutabilis was prevented by Ca2+, Ba2+ and Cu2+, and suppressed to a minor extent by Mg2+ and K+ (Marino, Morabito & La Spada, 2009). In our previous study (Lu et al., 2012), the hemolytic activity of TE from the jellyfish Cyanea capillata was inhibited by Mn2+, Zn2+, La3+, Cu2+ and Fe2+, while the hemolytic activity was increased in the presence of K+, Ca2+, Mg2+ and NH4+.
Except for K+, Ca2+ and Mg2+, it appears that other tested cations, including Mn2+, Zn2+, La3+, Cu2+ and Fe2+, have an antagonistic effect on hemolysis by jellyfish venoms (Lu et al., 2012). Because traditional spectrophotometric methods test the absorbance of hemoglobin, which indirectly reflects the extent of erythrocyte hemolysis, cations interacting with hemoglobin or interfering with the absorbance of hemoglobin will lead to a false positive. Though the antagonist effects have been demonstrated to be reproducible, the colors of some cations, such as Cu2+ and Fe2+, should lead researchers to be more cautious in judging their effects. Our initial results suggested that all tested cations, except for the transparent La3+, significantly shifted the absorbance curves of hemoglobin to the right. Accordingly, the corrected antagonistic effects were right-shifted, except in the cases of La3+ and Mn2+. La3+ displayed no effect on the curve, and Mn2+ showed no antagonistic effect after correction, which came as a surprise to us. Notwithstanding the Kd values, the maximum inhibitory values were also decreased in Zn2+, Cu2+ and Fe2+. These results were further supported by the direct counting of erythrocytes using confocal microscopy.
Hemolytic mechanism and compounds
Ever since hemolytic proteins were first purified and identified as CrTX-A and CrTX-B from the venom of the jellyfish Carybdea rastoni (Nagai et al., 2000), jellyfish hemolytic proteins have been developed as a novel family of taxonomically restricted cnidarian toxins (42–46 kDa) in the jellyfish species Chironex fleckeri, Cyanea nozakii Kishinouye, Chironex yamaguchii (as Chiropsalmus quadrigatus), and Alatina moseri (as Carybdea alata) (Chung et al., 2001; Nagai et al., 2002; Brinkman et al., 2014; Mariottini, 2014; Strobos, 2014). These hemolytic proteins were identified as pore-forming toxins by bioinformatics, leading to the hemolytic activity of jellyfish venom. In addition to the non-selective formation of pore complexes, at least the following four other factors have been shown to cause the hemolytic effects of jellyfish venom: (1) Protease and collagenase that are able to break the cell membrane via digestion of membrane proteins (Li et al., 2014, 2016). (2) Phospholipase A2 (PLA2), the activity of which, in jellyfish venom, was discovered long ago. Several phospholipases have been identified recently using transcriptomic and proteomic analyses (Nevalainen et al., 2004; Weston et al., 2013; Heo et al., 2016). (3) Polypeptides: two novel cytolysins, designated oshem1 and oshem2, with respective molecular weights of 3 and 3.4 kDa, were identified from the tentacle of the Hydrozoan Olindias sambaquiensis (Junior et al., 2014). (4) Oxidizing compounds: we have previously reported that lipid peroxidation is a potential mechanism besides pore formation underlying hemolysis by TE from the jellyfish Cyanea capillata (Ayed et al., 2011; Wang et al., 2013d). Therefore, the hemolytic activity of jellyfish venom is a combined effect by hemolysins, proteases, phospholipases, polypeptides and oxidizing materials. The major factors leading to hemolysis vary greatly between jellyfish species. Interestingly, functional assays of two pairs of structurally similar hemolytic proteins from Chironex feckeri, CfTX-1/2 and CfTX-A/B, demonstrated that CfTX-1/2 causes profound effects on the cardiovascular system of anesthetized rats, whereas CfTX-A/B elicits only minor cardiovascular effects but possesses a hemolytic activity at least 30 times greater than that of CfTX-1/2, indicating that the hemolytic proteins of jellyfish venoms have diversified structurally and functionally during evolution (Brinkman et al., 2014).
Our results showed that the antagonistic curves of the cations significantly right-shifted, except for La3+, with respect to the hemolytic activity of jellyfish venom. The following four factors may also contribute to the partial inhibition of TE hemolytic activity (except in the case of Mn2+): (1) Direct inhibition of the non-selective cation channel. La3+ is a well-known non-selective cation channel blocker that also functions as the best antagonist of the hemolytic activity of jellyfish venom (Rosenthal et al., 1990; Bailey et al., 2005). The potent anti-hemolytic activity of La3+ suggests that pore formation is a major mechanism of hemolysis by jellyfish venoms (Wang et al., 2013d; Ponce et al., 2016). (2) Competition between the active cations and those essential for hemolytic activity. It was reported that the hemolytic activity of crude venom from Carybdea alata was dependent on the presence of divalent cations, and Ca2+ or Mg2+ was necessary for hemolytic activity, which might be essential for the activity of venom proteases, collagenases and PLA2 (Chung et al., 2001; Helmholz et al., 2007). (3) Stabilization of the cell membrane. It has been reported that Zn2+ and Cu2+ influence membrane fluidity and stability (Razin, 1972; Rice-Evans, 1994) and increase resistance to hemolysis (Lu et al., 2012). The antioxidant effects of cations such as Fe2+ might also hinder pore-formation via oxidation. The variability in the anti-hemolytic effects of cations suggests that the non-selective pore blocked by La3+ contributes the most to the hemolysis of jellyfish venoms, which could be favored by other active components such as proteases, PLA2 and oxidative materials.
In vivo hemolysis and pathophysiological effect
In vivo hemolysis can occur following a jellyfish sting. Via intravenous administration of TE from jellyfish Cyanea capillata, we showed that in vivo hemolysis consists of the following two phases: a rapid and severe hemolysis in the first 10 min, followed by a gradual hemolysis over 3 h. Correspondingly, the indirect indexes of K+ and lactic acid increased, reaching their maximum within 10 min, then recovering to levels higher than normal because of the in vivo compensation mechanism. Although the increase in hemolytic activity occurs quickly, the extent of in vivo hemolysis seemed to be much smaller than that in vitro. We have previously confirmed that the hemolytic activity of TE in diluted blood was much weaker than that in an erythrocyte suspension with the same erythrocyte ration. Both blood serum and albumin dose-dependently inhibited the hemolysis of TE (Xiao et al., 2010; Wang et al., 2012).
Despite the significant prevention from blood serum and albumin, the hemolytic activity of jellyfish is still able to damage the internal organs in direct and indirect ways. As is well known, hemolytic activity usually stems from breaks in the cell membrane and non-specific cytotoxicity, since mature mammalian erythrocytes do not have organelles. Although we do not exclude the existence of components that specifically damage important tissues and organs, the known non-specific cytotoxicity results in a basal toxicity level that can cause direct injuries to all effected organs, including the heart, liver, kidneys and lungs. The hemolytic proteins CfTX-1 and 2 (Brinkman & Burnell, 2007), isolated from Chironex fleckeri venom, possess sequence and structural similarity to the two hemolytic proteins CfTX-A and B (Brinkman et al., 2014; Jouiaei et al., 2015), also from Chironex fleckeri venom, which cause profound effects on the cardiovascular system but much smaller effects on erythrocytes. The relationship between these hemolytic proteins indicates the evolutional functional diversification of jellyfish hemolytic proteins with high cardiovascular specificity. We have confirmed that the in vivo hemolysis is not strong enough to cause hypoxia in blood. The hypoxia in tissue and organs mainly stems from insufficient blood perfusion due to heart failure and vascular contraction caused by jellyfish venom.
The indirect damage of hemolysis mainly comes from released products from erythrocytes and cells. The release of large amounts of lactic acid from the erythrocytes significantly lowers the blood pH, leading to severe metabolic acidosis, which can further cause clinical manifestations such as cardiac arrhythmia, respiratory disorders and gastrointestinal symptoms. Another important factor is the elevation of blood potassium from intra-erythrocyte K+ release, H+–K+ exchange and intracellular K+ release. It has been reported that hyperkalemia is one of the main causes of cardiovascular collapse and mortality by Chironex fleckeri venom; this effect can be improved by zinc gluconate (Yanagihara & Shohet, 2012). The complete inhibition of hemolysis by the non-specific channel blocker La3+, in addition to the partial inhibition by other cations following different mechanisms, supports the hypothesis that the lethal hemolytic mechanism is due to pore formation in cell membrane, favored over other mechanisms, and suggests an important strategy to antagonize hemolysis via pore blockage by cations, channel blockers and other antagonists.
In conclusion, we have repeated and corrected the inhibitory effects of five cations on hemolysis induced by jellyfish venom using spectrophotometric methods, and the results were further confirmed by direct erythrocyte counting under microscopy. With the exception of the transparent non-selective cation channel inhibitor La3+, which displayed complete inhibition, the inhibitory effects of Cu2+, Zn2+ and Fe2+ were right-shifted and actually weaker than those reported previously. Mn2+ did not have any significant antagonistic effects after the correction was applied. Our results indicate that the cations, except in the case of La3+, interfere with the absorbance of hemoglobin, which should be corrected when their inhibitory effects on the hemolytic activity of jellyfish venoms are tested. The variability in the inhibitory effects by cations supports the hypothesis that hemolysis by jellyfish venom can be attributed to the formation of non-selective cation pore complexes over other potential mechanisms, such as PLA2 (Helmholz et al., 2007), polypeptides, proteases and oxidation. Blocking the formation of pore complexes may be a useful strategy to improve in vivo damage and mortality of jellyfish stings caused by hemolytic toxicity.
Supplemental Information
Hemolysis ratio (%) after 30 min of treatment with varying TE concentrations.
The dose-response curve is depicted based on Hill’s co-operation analysis. All data are presented as the mean ± SD (n = 3).