
Jaguar interactions with pumas and prey at the northern edge of jaguars’ range
- Published
- Accepted
- Received
- Academic Editor
- Michael Somers
- Subject Areas
- Conservation Biology, Ecology, Zoology
- Keywords
- Panthera onca, Puma concolor, Sonora, México, Two species conditional occupancy model, Species interaction factor, Jaguar, Puma, Activity patterns
- Copyright
- © 2017 Gutiérrez-González and López-González
- Licence
- This is an open access article distributed under the terms of the Creative Commons Attribution License, which permits unrestricted use, distribution, reproduction and adaptation in any medium and for any purpose provided that it is properly attributed. For attribution, the original author(s), title, publication source (PeerJ) and either DOI or URL of the article must be cited.
- Cite this article
- 2017. Jaguar interactions with pumas and prey at the northern edge of jaguars’ range. PeerJ 5:e2886 https://doi.org/10.7717/peerj.2886
Abstract
We present the first study that evaluates jaguar-puma interactions in the arid lands of northern Mexico, where jaguars have their northernmost breeding population and both predators are persecuted for livestock depredation. We tested whether jaguars are the dominant species in this unique ecosystem, where: (1) pumas outnumber jaguars, (2) pumas are better adapted to arid environments, and (3) jaguars and pumas are of similar size. We analyzed four years of data with two approaches; a two species conditional occupancy model and an activity patterns analysis. We used camera location and prey presence as covariates for jaguar and puma detection and presence probabilities. We also explored overlap in activities of predators and prey. Where both species were detected, peccary presence was positively correlated with both jaguar and puma presence, whereas in areas where jaguars were detected but pumas were not, deer presence explained the probability of jaguar presence. We found that both predators were more likely to co-occur together than to be found independently, and so we rejected the hypothesis that jaguars were the dominant species in our study area. Predators were mainly nocturnal and their activity patterns overlapped by 60%. Jaguar, as compared with puma, overlapped more with deer and calves; puma overlapped with calves more than with other prey, suggesting a preference. We believe exploring predator relationships at different scales may help elucidate mechanisms that regulate their coexistence.
Introduction
Jaguars (Panthera onca Linnaeus, 1758) and pumas (Puma concolor Linnaeus, 1771) are the two largest felids in the Americas (Iriarte et al., 1990). Jaguar range overlaps entirely with puma range (Haines, 2006) and their diets also overlap (Nuñez, Miller & Lindzey, 2000; Oliveira, 2002; Scognamillo et al., 2003; Gómez-Ortiz, 2010), especially when prey are abundant (Polisar et al., 2003). Species with overlapping energetic and resource requirements are assumed to have co-evolved mechanisms to minimize competition (Ramesh et al., 2012). Some authors suggest that jaguar and puma coexistence is possible due to dietary segregation (Cascelli de Azevedo, 2008; Foster, Harmsen & Doncaster, 2010). When they overlap, jaguars tend to consume larger prey than pumas, and pumas tend to have a more diverse diet (Iriarte et al., 1990; Polisar et al., 2003; Scognamillo et al., 2003). However, this theory has not been supported in all studies (Nuñez, Miller & Lindzey, 2000; Harmsen et al., 2009).
Studies on feeding ecology of both species have revealed high dietary overlap, but with a higher specialization by jaguars for peccary species (collared peccary, Pecari tajacu Linnaeus, 1758 and white-lipped peccary, Tayassu pecari Link, 1795) (Oliveira, 2002; Cascelli de Azevedo, 2008) and pumas for deer species (e.g., Odocoileus spp.) (Iriarte et al., 1990). Cattle (Bos taurus Linnaeus, 1758), especially calves, have also been documented as important prey for both species (Cascelli de Azevedo & Murray, 2007; Rosas-Rosas & Valdez, 2010), leading to conflicts with humans (Cascelli de Azevedo, 2008). Calves are especially vulnerable because they lack natural defensive behaviors, usually roam freely, and represent an easier prey for predators compared with natural prey (Sunquist & Sunquist, 2002; Cascelli de Azevedo & Murray, 2007; Cascelli de Azevedo, 2008; Laundré & Hernández, 2010). López-González & Miller (2002) concluded that jaguars can use both medium and large-sized prey if such prey are available and behaviorally vulnerable; this would include cattle as potential prey.
Temporal segregation has also been suggested as one of the mechanisms that facilitate coexistence (Emmons, 1987; Harmsen et al., 2009). Some authors have found that jaguars are more nocturnal than pumas (Romero-Muñoz et al., 2010; Hernández-Saintmartín et al., 2013), but others have not found differences in their activity patterns (Scognamillo et al., 2003; Harmsen et al., 2009; Paviolo et al., 2009; Foster et al., 2013). This latter theory suggests that predators match the activity of their main prey (Mendes Pontes & Chivers, 2007; Romero-Muñoz et al., 2010); consequently, prey specialization would allow different predators to coexist (Scognamillo et al., 2003).
One hypothesis of competition suggests that larger predators are dominant over smaller-bodied predators. Body size influences the outcomes of interference interactions, with large-bodied carnivores dominating by means of displacing smaller ones from prey abundant habitat patches or prey carcasses (Donadio & Buskirk, 2006). Jaguars living in wet tropical forests are bigger than pumas (Emmons, 1987), and therefore assumed to be the dominant species, especially when jaguars dominate in abundance (Sollmann et al., 2012) and pumas tend to avoid them (Scognamillo et al., 2003). In a dry forest of Bolivia, Romero-Muñoz et al. (2010) evaluated the temporal separation between jaguars and pumas and found that they showed temporal partitioning and that pumas were more abundant than jaguars. They concluded, based on their results, that jaguars did not dominate pumas in three of four study sites probably because of the high densities of pumas in the area and their better adaptation to arid environments.
The interaction patterns for puma and jaguar have been poorly studied in Mexico (Hernández-Saintmartín et al., 2013), but determining patterns that explain their coexistence is important for areas of conservation concern. Northwestern Mexico holds the northernmost reproductive jaguar population reported in the Americas (Brown & López-González, 2001). In this area, the jaguar population has the lowest density reported for the species (Gutiérrez-González et al., 2012) and is subject to extreme environmental conditions (Brown & López-González, 2001) with low survival rates (Gutiérrez-González et al., 2015). Pumas are better adapted to arid environments (Logan & Sweanor, 2001), they outnumber jaguars in this region (Brown & López-González, 2001), and their body size is almost the same as jaguars (Sunquist & Sunquist, 2002). Under the described scenario, we expect pumas to have an advantage over jaguars rather than for jaguars to dominate pumas. Thus, our objective was to evaluate the jaguars’ dominance over pumas in the arid regions of northern Mexico, where we tested for spatial and temporal overlap, and prey activity as explanatory variables for their presence and activity patterns.
Methods
Study area
We conducted our study on a privately owned protected area, the Northern Jaguar Reserve, surrounded by privately owned cattle ranches between the coordinates 29°32.4′N–109°14.4′W and 29°12′N–108°58.8′W in northeastern Sonora, Mexico. The area presents altitudes ranging from 370 to 1,600 m and is surrounded by two major rivers (Fig. 1). Annual precipitation ranges between 400 and 800 mm (CONABIO, 2004) and mean temperature is over 18 °C with extreme cold and hot temperatures in winter and summer, −7 °C–46 °C respectively. Vegetation types include desert scrub and thornscrub with tropical affinity (Felger, Johnson & Wilson, 2001). Tropical deciduous forest is present in some canyons and shaded hillsides. Oak woodlands (Quercus spp.) are found at elevations >1,000 m and in moist shaded canyons. Native vegetation is mixed with human-induced grassland patches as well as Dodonaea viscosa (Felger, Johnson & Wilson, 2001; CONAFOR, 2014).
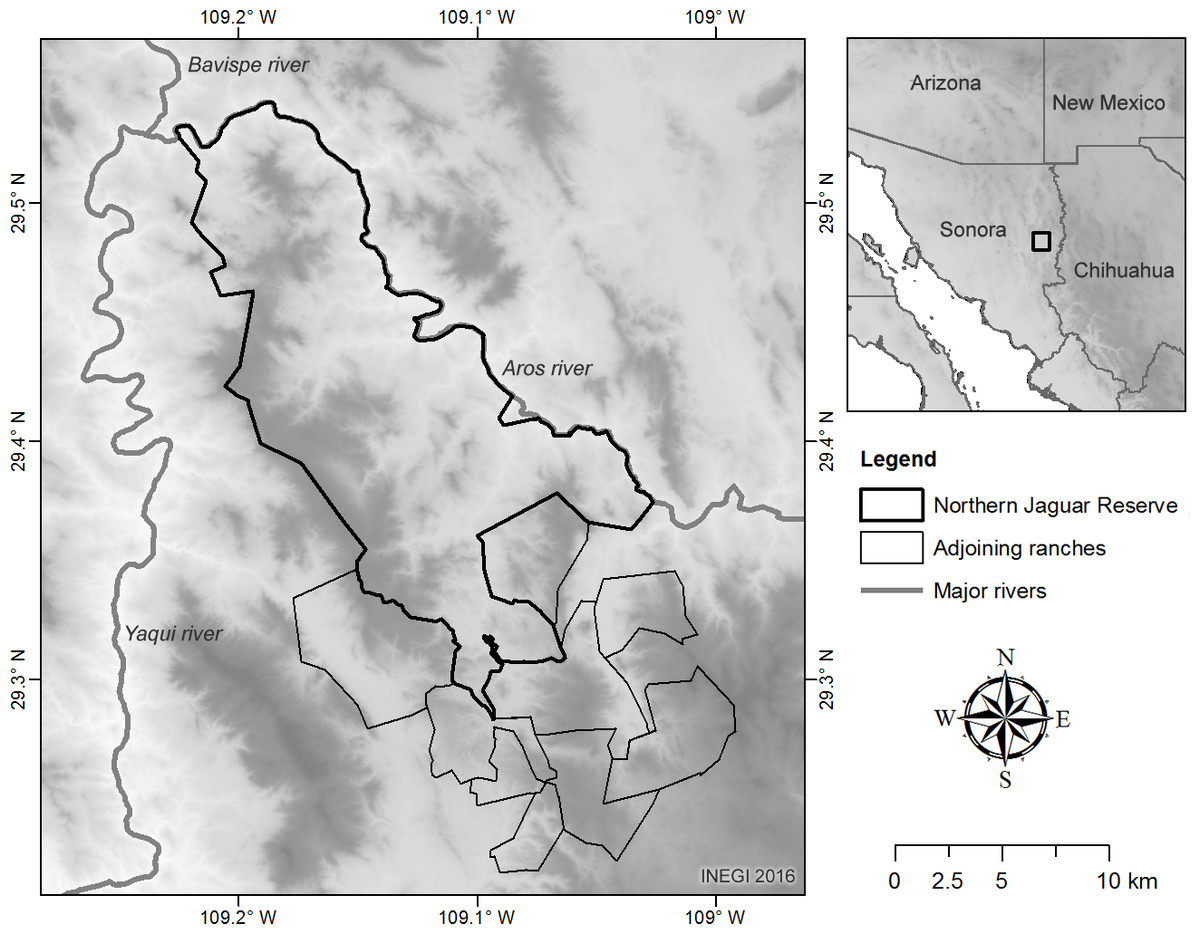
Figure 1: Study area.
The study area was composed by the Northern Jaguar Reserve and 10 private cattle ranches. Because of the proximity of the cattle ranches with the private reserve, we considered all properties as a unique study area. The DEM used in this figure can be freely downloaded from www.inegi.gob.mx.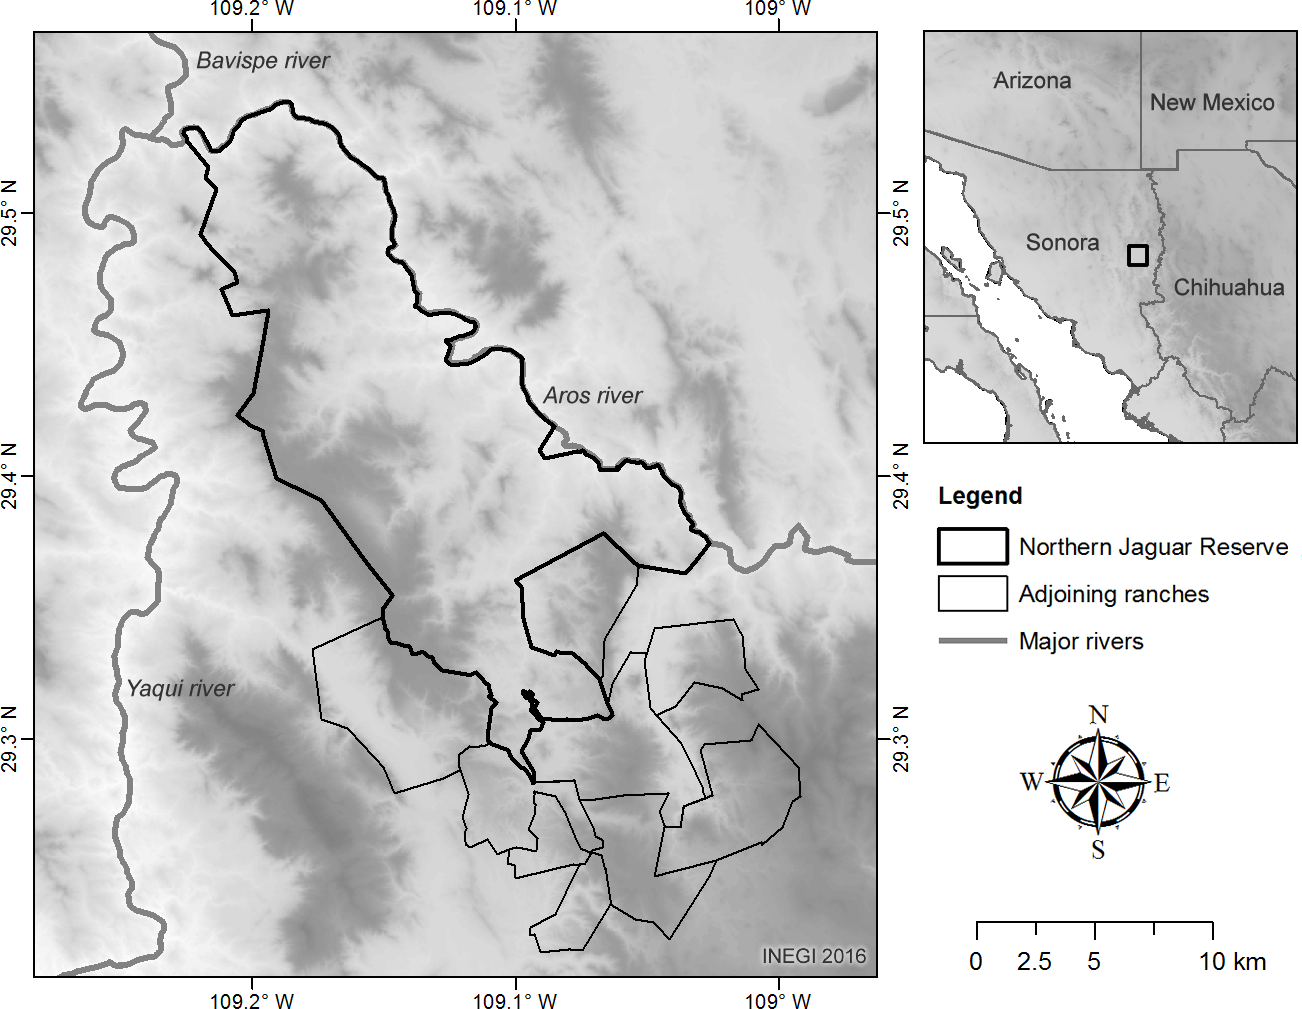
The private wildlife reserve was created in 2003 with binational collaboration from a Mexican NGO, Naturalia A.C., and an American NGO, the Northern Jaguar Project. In 2007, some cattle ranches also signed a conservation agreement to protect wildlife. Inclusive of the cattle ranches and the private reserve, our study area was approximately 33,000 ha.
Field work
For the present study we used camera trap data gathered from 2009 to 2012. Camera availability, number, type, and model of camera used in the field changed from year to year (Table 1). Camera traps were separated by ≥1 km and placed in streams, roads, and trails used by wildlife. We changed the location of cameras throughout the study to maximize detections. We set all cameras to have a five-minute delay between capture events and recorded photos 24 h a day. When camera availability allowed, we placed cameras in pairs. No bait or lures were used during the study. We checked cameras monthly.
| Camera model | 2009 | 2010 | 2011 | 2012 | |
|---|---|---|---|---|---|
| Camtrakker® 35 mm | Film camera | 18 | 10 | – | – |
| Cuddeback® | Digital camera | 17 | 67 | 85 | 93 |
| Moultrie® | Digital camera | 3 | – | – | – |
| Wildview® | Digital camera | 38 | 31 | 12 | 26 |
Data analysis
Wildlife and livestock pictures from January 2009 to September 2012 were archived in an Excel® database for analysis.
Two species occupancy model
Jaguar and puma spatial interaction analysis was performed using a single season conditional two species occupancy model. This approach requires the designation of one species as dominant. Following assumptions in the literature, we selected jaguar as the dominant species (species A). The two species conditional occupancy model (Richmond, Hines & Beissinger, 2010) includes eight types of parameters that can be separated into (1) occupancy parameters: ψA is the probability of occupancy for species A; ψBA is the probability of occupancy for species B, given species A is present; ψBa is the probability of occupancy for species B, given species A is absent, and (2) detection parameters: pA is the probability of detection for species A, given species B is absent; pB is the probability of detection for species B, given species A is absent; rA is the probability of detection for species A, given both species are present; rBA is the probability of detection for species B, given both species are present and species A is detected; rBa is the probability of detection for species B, given both species are present and species A is not detected.
The Species Interaction Factor (SIF) is obtained as a derived parameter. If the SIF = 1, the two species occur independently; if SIF <1, species B is less likely to co-occur with species A than expected under a hypothesis of independence. If SIF >1, species B is more likely to co-occur with species A than expected under a hypothesis of independence (Richmond, Hines & Beissinger, 2010).
In order to meet the demographic closure assumption (Richmond, Hines & Beissinger, 2010), we selected one month from each year to develop the capture histories and considered each day as a sampling session. Other authors have used one sampling month with camera traps for spatial–temporal feline pattern analysis (Carter et al., 2015).
Due to low jaguar detection (Table 2), we pooled sex information and chose the month with the most jaguar records for our analysis. In order to increase our sample size, we considered each camera station as a sampling location; however we recognize that using this approach violates the geographic closure assumption of occupancy models. Therefore, we will refer to presence instead of occupancy in the area (Mackenzie et al., 2006). As occupancy models do not require individual identification, we considered one picture of each species for each surveyed day as a single detection (Sollmann et al., 2012). Each sampling year was modeled as a group. Changes in camera location between years prevented us from using a robust design model (Miller et al., 2012).
| Year | Panthera onca | Puma concolor | Odocoileus virginianus | Pecari tajacu | Bos taurusa |
|---|---|---|---|---|---|
| 2009 | 11 (7) | 26 (22) | 80 (66) | 7 (3) | 12 (15) |
| 2010 | 12 (10) | 80 (68) | 183 (157) | 7 (6) | 28 (25) |
| 2011 | 18 (31) | 72 (59) | 268 (240) | 13 (13) | 178 (148) |
| 2012 | 39 (28) | 71 (60) | 152 (124) | 18 (18) | 49 (37) |
Notes:
We used camera location and prey species as covariates that could explain puma or jaguar detection and presence: Camera location—We used this as a dummy covariate in order to account for possible bias in species detection due to its location on roads (Maffei et al., 2011). Prey species—For each prey species, we used the proportion of the days with pictures by sampling unit by year as a measure of species presence in the site (O’Brien, 2011; Ramesh et al., 2012; Carter et al., 2015). White-tailed deer (Odocoileus virginianus Zimmermann, 1780) and collared peccary have been described as the main prey species for pumas and jaguars in areas where they coexist (Oliveira, 2002; Cascelli de Azevedo, 2008). We also included calves as a potential prey for both species (Brown & López-González, 2001; Rosas-Rosas & Valdez, 2010). Felids prefer calves to adult cows (Shaw, 1977; Tortato et al., 2015).
We used an ad hoc, stepwise approach for model construction (Richmond, Hines & Beissinger, 2010). We assumed that the detection of one species did not vary in the sampling month, and that our models were time-constant for all detection probabilities.
We tested hypotheses regarding the co-occurrence and detection of puma and jaguar. Specifically, we addressed (1) whether the species co-occurred independently or if there was evidence of competitive exclusion of pumas from sites used by jaguars, (2) if the detection process was independent between species, and (3) if the presence of one species influenced the detection of the second species.
We first evaluated those models that may be related to the detection probabilities by each species (Sollmann et al., 2012). After we had a best adjusted model for detection, we started modeling occupancy parameters, first for jaguar and then for puma. For a full list of models and hypotheses see Table S1. Model selection was based on AICc criteria (Burnham & Anderson, 2002). All models construction was performed using program MARK 8.0 (White & Burnham, 1999).
Activity patterns
We compared activity patterns of jaguar, puma and three prey species, using the same dataset for occupancy analysis. To avoid autocorrelation, when it was not possible to identify individuals, we considered one hour between photographs as independent events (Paviolo et al., 2009). We determined the exact time of sunset and sunrise, using the time of the day, the Julian date, and the camera location. We calculated solar time using sunset and sunrise information by year (Perpiñán, 2012).
We used kernel density estimates (Ridout & Linkie, 2009) to generate the activity pattern for each species by year. We classified the activity into three categories by integrating the area under the curve for each period: diurnal (activity predominantly between 1 h after sunrise and 1 h before sunset), nocturnal (activity predominantly between 1 h after sunset and 1 h before sunrise), and crepuscular (activity from 1 h before and after sunrise and sunset) (Foster et al., 2013; Hernández-Saintmartín et al., 2013). This classification corresponded to the probability of observing the animal during that time period (Linkie & Ridout, 2011).
Then, we calculated the coefficient of overlap (Δ1) and its 95% confidence intervals from 10,000 bootstrap samples (Meredith & Ridout, 2014) for each pair of species (jaguar-puma, jaguar-prey, puma-prey) by year. Overlap values range from 0 (no overlap) to 1 (complete overlap). All activity pattern analysis were conducted in program R (R Development Core Team, 2015) using the packages RAtmosphere (Biavati, 2014), solaR (Perpiñán, 2012), and overlap (Meredith & Ridout, 2014).
Results
We obtained a total of 39,167 pictures from all five species (jaguar, puma, calves, deer, and peccary). With the one month selection criteria, we used 1,324 pictures for the occupancy analysis and 1,137 pictures for the activity patterns analysis (Table 2).
Two species occupancy model
We generated 32 models (Table 3) and found:
| Model | AICc | Δ AICc | AICc Weights | Model Likelihood | Number of parameters |
|---|---|---|---|---|---|
| ΨA(deer) ΨBA(y*peccary) ΨBa(y*peccary) pA =rA(.) pB =rBA =rBa(.) | 2368.11 | 0 | 0.89 | 1 | 8 |
| ΨA(deer) ΨBA(y*peccary) ΨBa(y*calf) pA =rA(.) pB =rBA =rBa(.) | 2373.42 | 5.30 | 0.06 | 0.07 | 9 |
| ΨA(deer) ΨBA(y*peccary) ΨBa(.) pA =rA(.) pB =rBA =rBa(.) | 2377.57 | 9.45 | <0.01 | <0.01 | 6 |
| ΨA(deer) ΨBA(y*peccary) ΨBa(deer) pA =rA(.) pB =rBA =rBa(.) | 2377.69 | 9.57 | <0.01 | <0.01 | 7 |
| ΨA(deer) ΨBA(y*peccary) ΨBa(calf) pA =rA(.) pB =rBA =rBa(.) | 2378.74 | 10.62 | <0.01 | <0.01 | 7 |
Notes:
Ψ Occupancy probability. We refer to the proportion of sites used by the species because we violated assumption related to geographic closure. ΨA proportion of sites used by species A. ΨBAproportion of sites used by species B when species A is also present. ΨBa proportion of sites used by species B when species A is absent. pA detection probability of species A when species B is absent. pB detection probability of species B when species A is absent. rA detection probability when both species are present. rBAdetection probability when both species are present but only species A is detected. rBadetection probability due both species are present but species A is not detected. (y) corresponds to each year (modeled as group), (peccary, calf and deer) correspond to the proportion of the days each species was detected. (y*) represents the interaction of the year with each covariate. (.) represents no time or covariate effect for the parameter.
Detection probabilities
Puma and jaguar detection probabilities were independent of the presence of the other species and were constant across years.
Presence probabilities
Puma presence was dependent on jaguar presence. White-tailed deer was important for jaguar presence in all years. Peccary had a different influence on puma presence by year, even if the jaguar was not present. The SIF value showed that the two predator species were more likely to be detected in the same site than separately, except for 2011 when both species were independent (Table 4).
| Parameter | 2009 | 2010 | 2011 | 2012 |
|---|---|---|---|---|
| ΨA | 0.28 ± 0.05 | 0.28 ± 0.05 | 0.28 ± 0.05 | 0.28 ± 0.05 |
| ΨBA | 1.00 ± 0.0 | 1.00 ± 0.0 | 1.00 ± 0.0 | 1.00 ± 0.0 |
| ΨBa | 0.28 ± 0.04 | 0.91 ± 0.03 | 1.00 ± 0.0 | 0.28 ± 0.04 |
| Ψ2 | 0.28 ± 0.04 | 0.28 ± 0.04 | 0.28 ± 0.04 | 0.28 ± 0.04 |
| pA | 0.03 ± 0.01 | 0.03 ± 0.01 | 0.03 ± 0.01 | 0.03 ± 0.01 |
| pB | 0.04 ± 0.003 | 0.04 ± 0.003 | 0.04 ± 0.003 | 0.04 ± 0.003 |
| rA | 0.03 ± 0.01 | 0.03 ± 0.01 | 0.03 ± 0.01 | 0.03 ± 0.01 |
| rBA | 0.04 ± 0.003 | 0.04 ± 0.003 | 0.04 ± 0.003 | 0.04 ± 0.003 |
| rBa | 0.04 ± 0.003 | 0.04 ± 0.003 | 0.04 ± 0.003 | 0.04 ± 0.003 |
| SIF | 3.53 ± 0.59 | 1.09 ± 0.03 | 1.00 ± 0.0 | 3.53 ± 0.59 |
Notes:
ΨA proportion of sites used by species A. ΨBA proportion of sites used by species B when species A is also present. ΨBa proportion of sites used by species B when species A is ausent. Ψ2 proportion of sites used by both species at the same time. pA detection probability of species A when species B is absent. pB detection probability of species B when species A is absent. rA detection probability when both species are present. rBA detection probability when both species are present but only species A is detected. rBa detection probability when both species are present but species A is not detected. SIF, species interaction factor. Species A is the dominant species, jaguar, species B is the subordinate species, puma.
Activity patterns
Puma and jaguar showed nocturnal activity patterns (Fig. 2), while prey showed mainly diurnal activity, except for 2009 when peccary was more crepuscular than diurnal. Overlapping coefficients for jaguar and puma were on average 0.60 for all years (Fig. 2). Jaguar activity overlapped more with deer activity (mean Δ1 = 0.43) than with peccary (mean Δ1 = 0.26) or calf (mean Δ1 = 0.41) activities in all years (Fig. 3). Puma activity overlapped more with calf activity (mean Δ1 = 0.64) than with deer (mean Δ1 = 0.58) or peccary activity (mean Δ1 = 0.44) (Fig. 4).
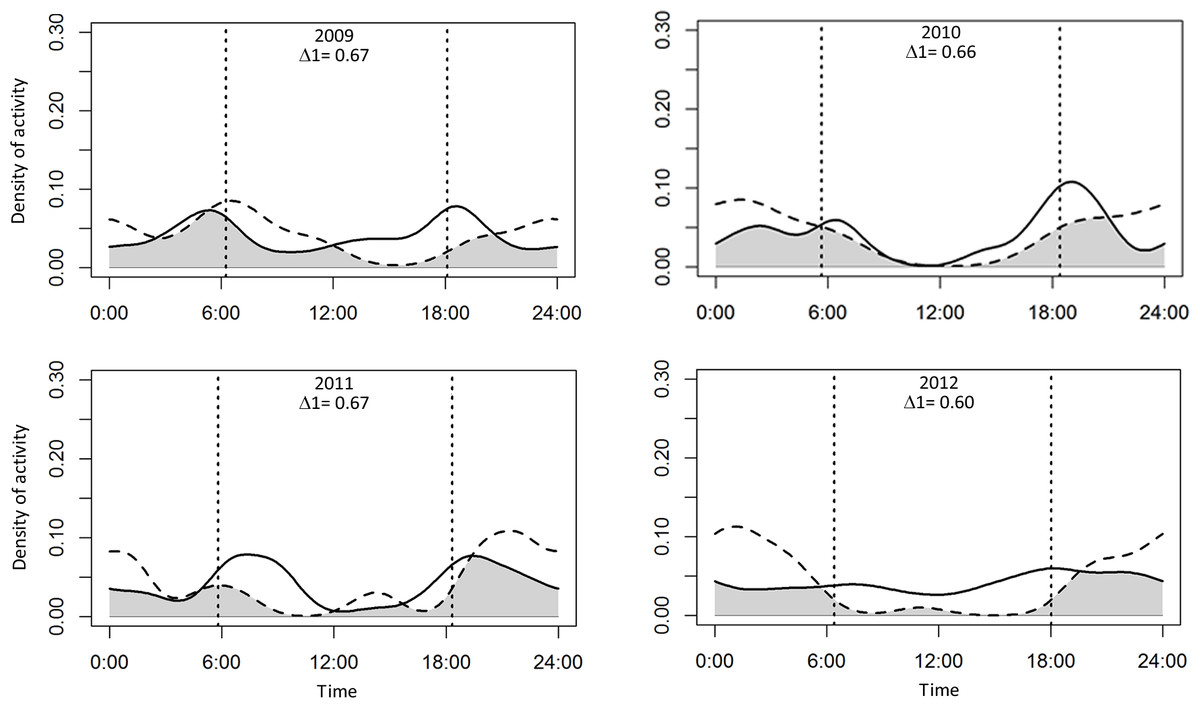
Figure 2: Overlap of daily activity patterns between pumas and jaguars in Sonora, Mexico by year.
Overlap is represented by the shaded area. Solid lines represent the activity pattern of pumas and dashed lines represent the activity pattern of jaguars. The vertical dashed lines represent the mean time of sunrise and sunset. Δ1 corresponds to the overlapping coefficient between species activity patterns.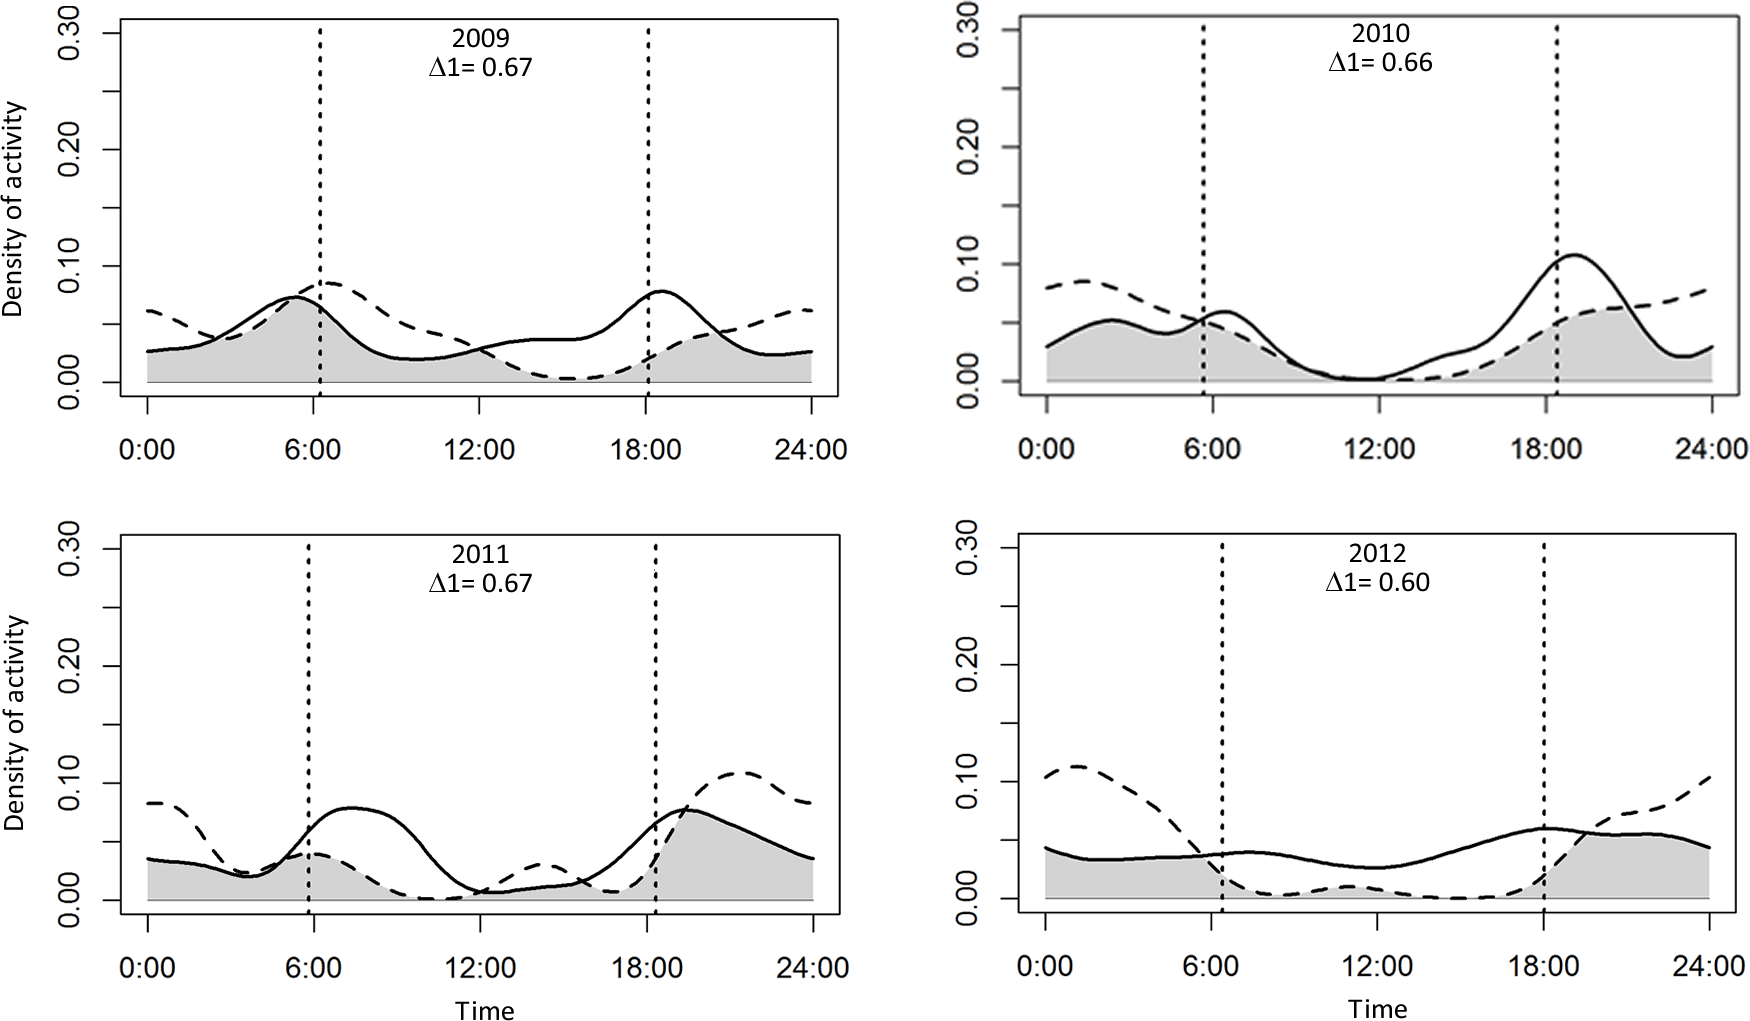

Figure 3: Overlap of daily activity patterns between the jaguar and its main preys in Sonora, Mexico by year.
Overlap is represented by the shaded area. Solid lines represent jaguar activity pattern and dashed lines represent the prey activity patterns. Each column corresponds to one prey species and each row corresponds to the sampling year. The vertical dashed lines represent the mean time of sunrise and sunset. Δ1 corresponds to the overlapping coefficient between species activity patterns.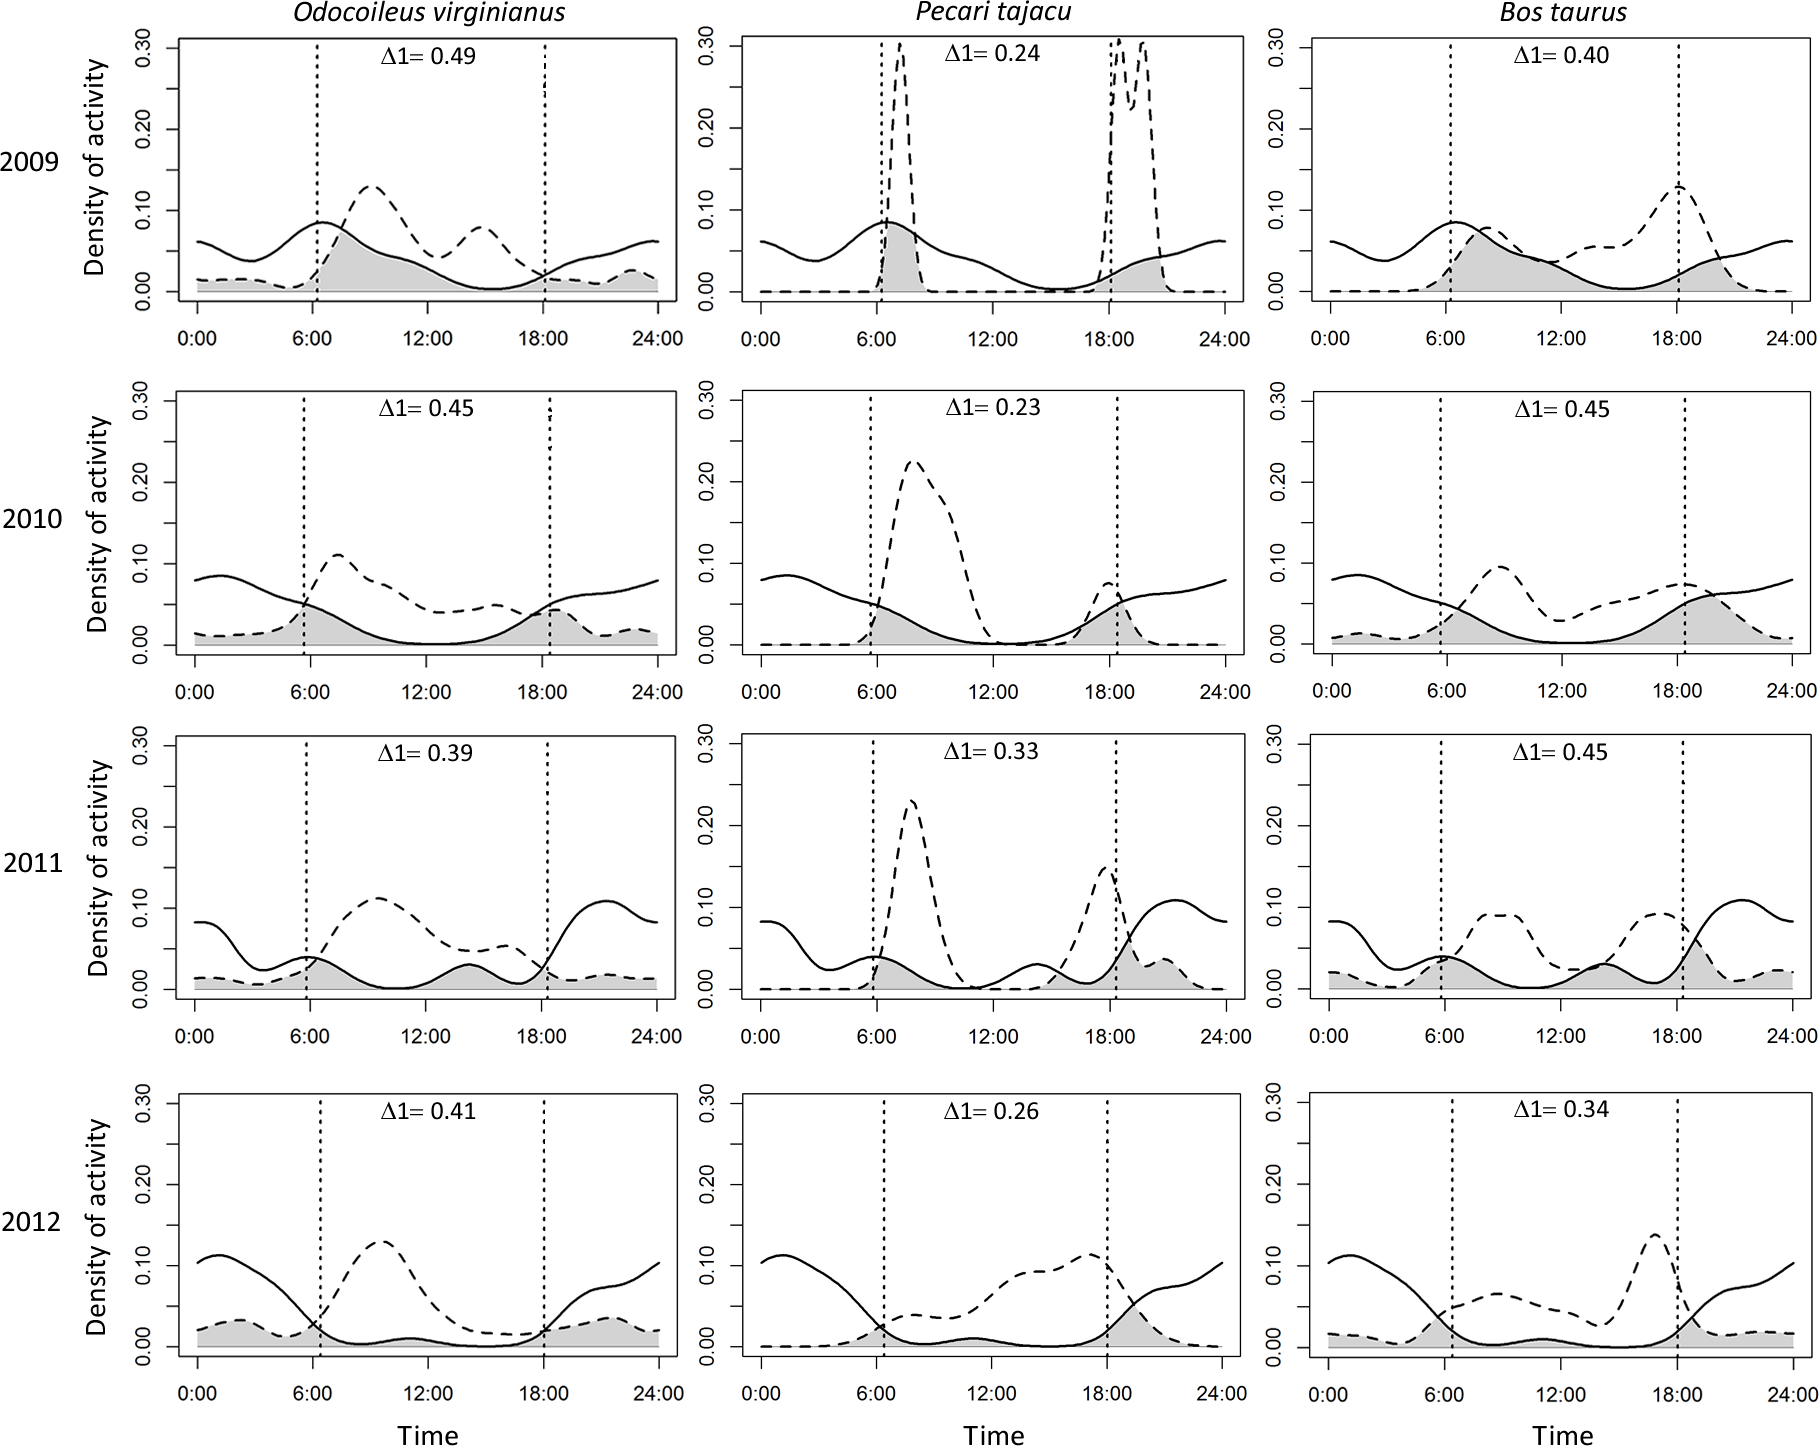
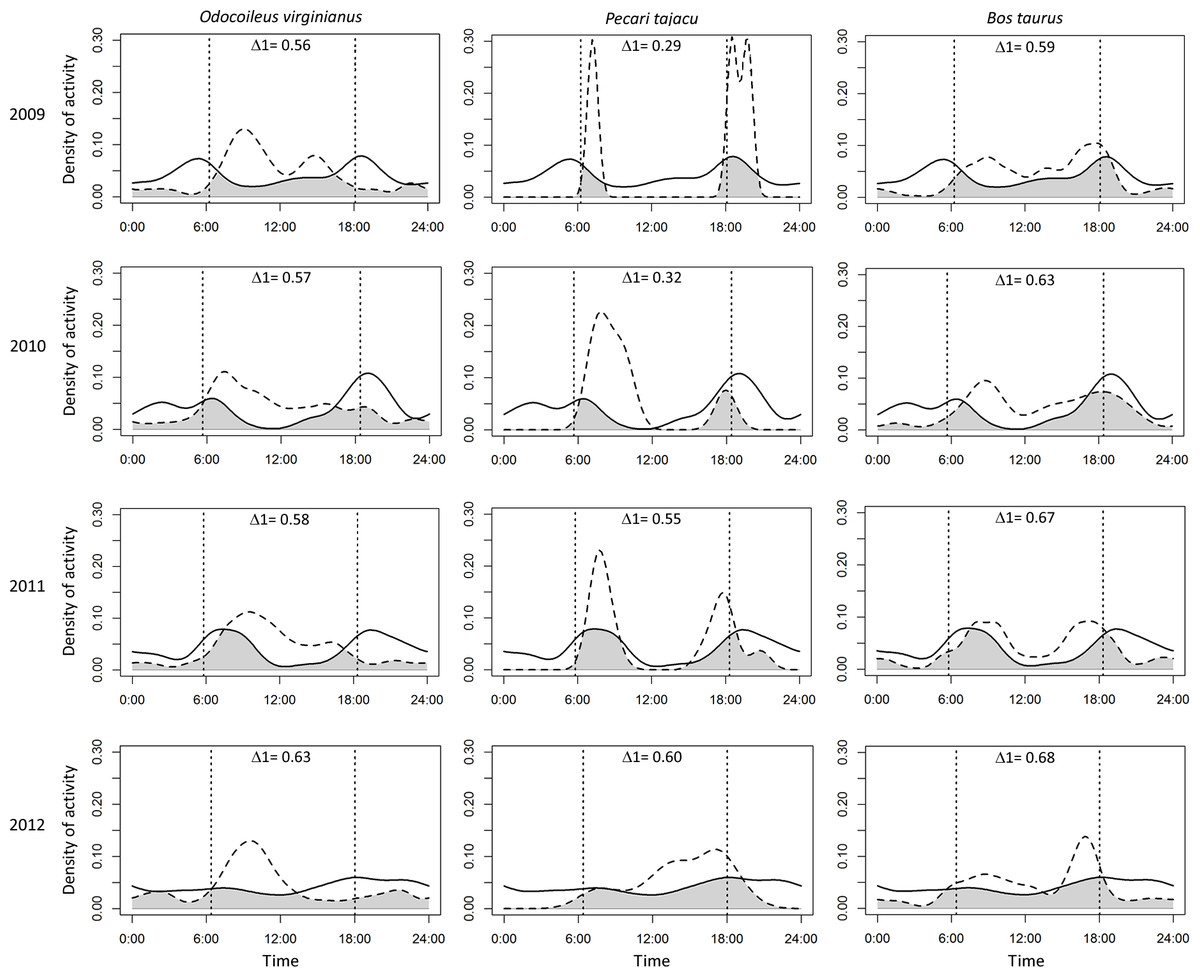
Figure 4: Overlap of daily activity patterns between the puma and its main preys in Sonora, Mexico by year.
Overlap is represented by the shaded area. Solid lines represent puma activity pattern and dashed lines represent the prey activity patterns. Each column corresponds to one prey species and each row corresponds to the sampling year. The vertical dashed lines represent the mean time of sunrise and sunset. Δ1 corresponds to the overlapping coefficient between species activity patterns.
Discussion
We concluded that jaguars were not dominant over pumas in our study area, in contrast to other areas where the species exhibit clear temporal, spatial, or behavioral differences (Novack et al., 2005; Harmsen et al., 2009; Romero-Muñoz et al., 2010). When competitors from different species have similar body sizes and similar diet, encounters and physical confrontations tend to be avoided since an attack carries high risks for both species, even when potential benefits are large (Donadio & Buskirk, 2006; Ramesh et al., 2012; Vanak et al., 2013). Similar-sized competitor species that hunt at the same time of the day can coexist if they hunt in different areas (Ruth & Murphy, 2010). If pumas and jaguars are partitioning the space throughout the day, encounter probabilities decrease and may allow coexistence (Ruth & Murphy, 2010). Large prey species abundance is also an important habitat component that favors the coexistence of large carnivores (Odden, Wegge & Fredriksen, 2010; Mitchell & Hebblewhite, 2012; Carter et al., 2015), and may have supported coexistence in our study area.
Similar to the results of Romero-Muñoz et al. (2010) in a dry tropical forest in Bolivia, we found evidence that pumas were likely to co-occur with jaguars more than expected by chance or that both species were behaving independently (SIF values, Table 4). Our spatial analysis provide stronger evidence that pumas are not avoiding jaguars in dry areas. Further, both pumas and jaguars were active throughout the day (Fig. 2). Similar patterns have also been documented between jaguars and pumas in tropical wet areas of Central America (Davis, Kelly & Stauffer, 2011), as well as between cheetahs (Acinonyx jubatus Schreber, 1775) and leopards (Panthera pardus Linnaeus, 1758, Vanak et al., 2013), and between tigers (Panthera tigris Linnaeus, 1758) and leopards (Carter et al., 2015). Vanak et al. (2013) suggested that interactions between large carnivores were better explained by habitat type and seasonality than the presence of competitive carnivore species.
Although we expected that jaguar activity would be closely related to peccary activity and pumas to be more related to deer activity (Mendes Pontes & Chivers, 2007; Romero-Muñoz et al., 2010), the high overlap of both predators with deer and calf activity is possibly related to a higher abundance of these species in the area (Table 2) (Laundré & Hernández, 2010; Ruth & Murphy, 2010; Hayward et al., 2016). Further, the social behavior of peccaries and their defensive herding strategy may make deer and calves easier prey for both felines (Eisenberg & McKay, 1974; Sunquist & Sunquist, 2002; Scognamillo et al., 2003; Cascelli de Azevedo, 2008). Jaguars can adapt their diet according to prey availability (Cascelli de Azevedo, 2008), and up to 111 species are known to constitute its food habits (Hayward et al., 2016). López-González & Miller (2002) proposed that jaguars consume larger prey size when they are farther north of the Equator. However, a recent analysis proposed that jaguars select prey based on their abundance and herd size rather than their body size (Hayward et al., 2016). When one prey species is more abundant than the other, overlap between predators increases because of the switch in the prey selection of one predator (Ruth & Murphy, 2010; Hayward et al., 2016). But if there is enough prey diversity, the subordinate competitor has no need to avoid the dominant species (Carter et al., 2015).
Pumas have a greater flexibility in prey selection in comparison with jaguars (Iriarte et al., 1990; Polisar et al., 2003; Scognamillo et al., 2003). Due to their flexible diet and better adaptation to arid environments, pumas may exploit a wider array of resources than jaguars, supporting coexistence (Ruth & Murphy, 2010). Predators can also develop different hunting strategies for the same prey species (e.g., selecting individuals of different size) (Murphy & Ruth, 2010; Ruth & Murphy, 2010). Due to the domestication of cattle, jaguars can depredate larger-sized individuals in comparison to their natural prey (Hayward et al., 2016), and pumas tend to select young adults or juveniles (Murphy & Ruth, 2010). Calves have a higher predation risk, especially in places where cattle are allowed to roam loose, and become easier prey for felines than deer (Cascelli de Azevedo & Murray, 2007). Even though puma activity patterns overlapped more with calves (mean Δ1 = 0.64) than did jaguars, we found an overlap of 0.40 on average for jaguars and calves, almost the same overlap that jaguars presented with deer (mean Δ1 = 0.43). Jaguars could be selecting calves and deer in the same proportion if cattle are available and vulnerable in the area (López-González & Miller, 2002; Tortato et al., 2015).
In this study area, as in most ranching areas of Latin America, cattle move freely and unsupervised within the property boundaries without an established breeding season, making calves available throughout the year and more vulnerable to depredation (Laundré & Hernández, 2010; Tortato et al., 2015). Based on the theory that felines tend to follow the activity and movement patterns of their prey (Mendes Pontes & Chivers, 2007; Carrillo, Fuller & Saenz, 2009), the high overlap of puma and jaguar with calves suggest that cattle could be an important element in their diet (Rabinowitz & Nottingham Jr, 1986).
Understanding the mechanisms that regulate the coexistence of pumas and jaguars is especially important in areas where jaguar densities are low because human-feline conflicts often result in retaliatory acts on jaguars, even when pumas were responsible for depredation events (Brown & López-González, 2001). In our study area, jaguars are blamed for predation events and, based on our results, these events could be more related to puma attacks than jaguars.
The two species occupancy model provided us more detailed information about jaguar and puma interactions and their association with prey than activity patterns. Although we found spatial and temporal evidence that pumas are not subordinate to jaguars, and that prey presence and activity patterns played an important role in explaining the presence of both species, we lacked data on actual prey densities or carnivore diet. Based on their detections (Table 2), we considered that prey relative abundance was high and that this factor likely contributed to feline coexistence in our study area (Polisar et al., 2003). An important next step is to study diet overlap in these two top carnivores. For now, however, strategies in the area should be implemented individually for both species taking into consideration our results about prey and predator associations.
Supplemental Information
Activity data
Information of activity hour and date for each of the five species studied.
Two species conditional occupancy capture history
Sheet 1 includes jaguar-puma detection history used for the analysis. The sheed includes covariate information (deer, cattle, peccary and road).