
Proteomic profiling analysis reveals that glutathione system plays important roles responding to osmotic stress in wheat (Triticum aestivum L.) roots
- Published
- Accepted
- Received
- Academic Editor
- Savithramma Dinesh-Kumar
- Subject Areas
- Agricultural Science, Genomics, Plant Science
- Keywords
- Triticum aestivum L., Root, iTRAQ, Osmotic stress, Glutathione
- Copyright
- © 2016 Ma et al.
- Licence
- This is an open access article distributed under the terms of the Creative Commons Attribution License, which permits unrestricted use, distribution, reproduction and adaptation in any medium and for any purpose provided that it is properly attributed. For attribution, the original author(s), title, publication source (PeerJ) and either DOI or URL of the article must be cited.
- Cite this article
- 2016. Proteomic profiling analysis reveals that glutathione system plays important roles responding to osmotic stress in wheat (Triticum aestivum L.) roots. PeerJ 4:e2334 https://doi.org/10.7717/peerj.2334
Abstract
Wheat is one of the most important crops in the world, and osmotic stress has become one of the main factors affecting wheat production. Understanding the mechanism of the response of wheat to osmotic stress would be greatly significant. In the present study, isobaric tag for relative and absolute quantification (iTRAQ) was used to analyze the changes of protein expression in the wheat roots exposed to different osmotic stresses. A total of 2,228 expressed proteins, including 81 differentially expressed proteins, between osmotic stress and control, were found. The comprehensive analysis of these differentially expressed proteins revealed that osmotic stress increased the variety of expressed proteins and suppressed the quantity of expressed proteins in wheat roots. Furthermore, the proteins for detoxifying and reactive oxygen species scavenging, especially the glutathione system, played important roles in maintaining organism balance in response to osmotic stress in wheat roots. Thus, the present study comprehensively describes the protein expression changes in wheat roots in response to osmotic stress, providing firmer foundation to further study the mechanism of osmotic resistance in wheat.
Osmotic stress, primarily resulting from drought or excessive salt in water, refers to insufficient water availability that limits plant growth and development (Zhu et al., 1997). Osmotic stress has become one of the major abiotic stresses affecting crop growth and production. For high-yield and high-quality production, it is imperative to improve the osmotic tolerance of crops, and some methods had been developed to alleviate osmotic stress through cultural practices, conventional breeding, exogenous regulators and molecular breeding. However, this situation has not substantially changed. To further improve osmotic tolerance, it is necessary to understand the responding mechanism of osmotic resistance in plants. Previous studies in rice, Arabidopsis, and other plants have been performed, including molecular cloning, transgenic studies and high throughput analyses.
Previous studies have primarily focused on molecular cloning and functional analysis of osmotic resistance genes. Many functional genes with high osmotic resistance have been identified. The water loss rate of transgenic Arabidopsis with AtMYB15 over-expression was significantly reduced compared with that in wild-type under drought conditions (Ding et al., 2009). Using cDNA microarray analysis, Hu et al. (2006) observed that SNAC1 was up-regulated in rice under drought stress and the over-expression of SNAC1 enhanced drought tolerance in transgenic rice. Subsequently, Liu et al. (2014) achieved SNAC1 over-expression in cotton and found that the tolerance to drought and salt stresses was significantly improved in these transgenic plants. In addition, many other genes, such as the WRKY (Qiu & Yu, 2009; Ma et al., 2014) transcription factor, DREB (Liu et al., 1998) and AtGAMT1 (Arabidopsis thaliana GA methyl transferase 1) (Nir, Moshelion & Weiss, 2014; Qin & Zeevaart, 2002; Shou, Bordallo & Wang, 2004; Pasquali et al., 2008), have also been implicated in drought or salt tolerance in plants. Based on these osmotic tolerance genes, some gene regulatory networks in response to osmotic stress were also identified in plants, indicating that the mechanism of osmotic resistance is complex with multigenic control (Shinozaki, Yamaguchi-Shinozakiy & Sekiz, 2003; Valliyodan & Nguyen, 2006; Krasensky & Jonak, 2012).
In recent years, high throughput screening platforms have been rapidly developed, providing more comprehensive insights into the cellular and molecular mechanisms of the response to osmotic stress. In Arabidopsis, a gene microarray was performed under drought, high-salinity and cold stresses in 2008, and thousands of stress-related genes were identified, many of which had been previously reported (Matsui et al., 2008). Lenka et al. (2011) performed a transcriptome analysis of drought-tolerant and drought-sensitive rice cultivars, and found that the up-regulation of the α-linolenic acid metabolic pathway was closely associated with drought responses. Many studies on plant responses to osmotic stress have also been performed using RNA-seq or microarray analysis (Zheng et al., 2010; Le et al., 2012; Li et al., 2012). The results of these studies provided a platform for understanding the responses of osmotic stress at the level of gene expression.
However, proteins directly participate in the activities of organisms, and proteomic analysis has become the best strategy for studying the response of organisms to osmotic stress. Many studies have already been performed in this area. Mirzaei et al. (2012) conducted a quantitative label-free shotgun proteomic analysis using the root tissues of rice plants under four different drought treatments, and 1,487 differentially expressed proteins (DEPs) were identified. After further analysis of the DEPs, Mirzaei et al. (2012) found that the proteins involved in transport and reactive oxygen species (ROS) were highly dependent on drought signals. In cotton, Deeba et al. (2012) identified 22 drought-related proteins through two-dimensional gel electrophoresis (2-DE) analysis. In wheat, many studies on osmotic stress were also performed using 2-DE, and some osmotic-related proteins and processes were also identified (Peng et al., 2009; Caruso et al., 2009; Ge et al., 2012). However, these studies could not comprehensively describe the protein expression changes under osmotic stress due to the limitations of the technology.
The isobaric tag for relative and absolute quantification (iTRAQ) system, which uses isotope labeling combined with multidimensional liquid chromatography and tandem mass spectrometry (MS) (Fan et al., 2011), simultaneously identified and quantitatively compared proteins expressed in an organism by analyzing the peak intensities of reporter ions (Lan et al., 2011). It can provide more global information of proteins expression for proteomic analysis. In the present study, we performed proteomic analysis using iTRAQ to analyze the osmotic response in the root of wheat seedlings. A total of 2,228 proteins were identified, among which 81 proteins were found to be related to osmotic stress in wheat.
Materials and Methods
Plant materials and the measurement of relative water content (RWC)
Seeds of Aikang58 were sterilized using 0.1% HgCl2 for 7 min and washed eight times with sterile distilled water. Subsequently, the seeds were cultured in Petri dishes in a chamber under the same conditions according to Li et al. (2013). At the two-leaf stage, the wheat seedlings were transferred into Hoagland solution containing 0%, 5%, 10%, 15% and 20% PEG-6000 to simulate osmotic stress. After cultivation for 24 h, the root tissues from seedlings exposed to the five treatments were collected and frozen in −80 °C for subsequent experiments. RWC was measured according to Gao et al. (2011).
Protein extraction
Frozen root samples were thoroughly ground into powder in liquid nitrogen. Lysis buffer (pH 8.5), containing 2 M thiourea, 7 M urea and 4% CHAPS with protease inhibitor (Sigma, USA), was added to the powder at 1:10 (w/v). The mixture was sonicated for 60 s and extracted for 30 min at room temperature. Subsequently, the mixture was centrifuged at 40,000 g for 1 h at 10 °C, and the supernatant was transferred to a 50 mL tube containing four volumes of 10% (w/v) TAC/acetone. After mixing, the mixture was stored at −20 °C overnight, and the supernatant was removed after centrifugation at 40,000 g for 10 min at 4 °C. The protein was washed three times with acetone and then dried through lyophilization to form a protein powder, and suspended in lysis buffer (2 M thiourea, 7 M urea and 4% CHAPS). The protein concentration was determined using the Bradford assay with BSA as a standard. The remaining samples were stored at −80 °C until further use.
Trypsin digestion and iTRAQ labeling
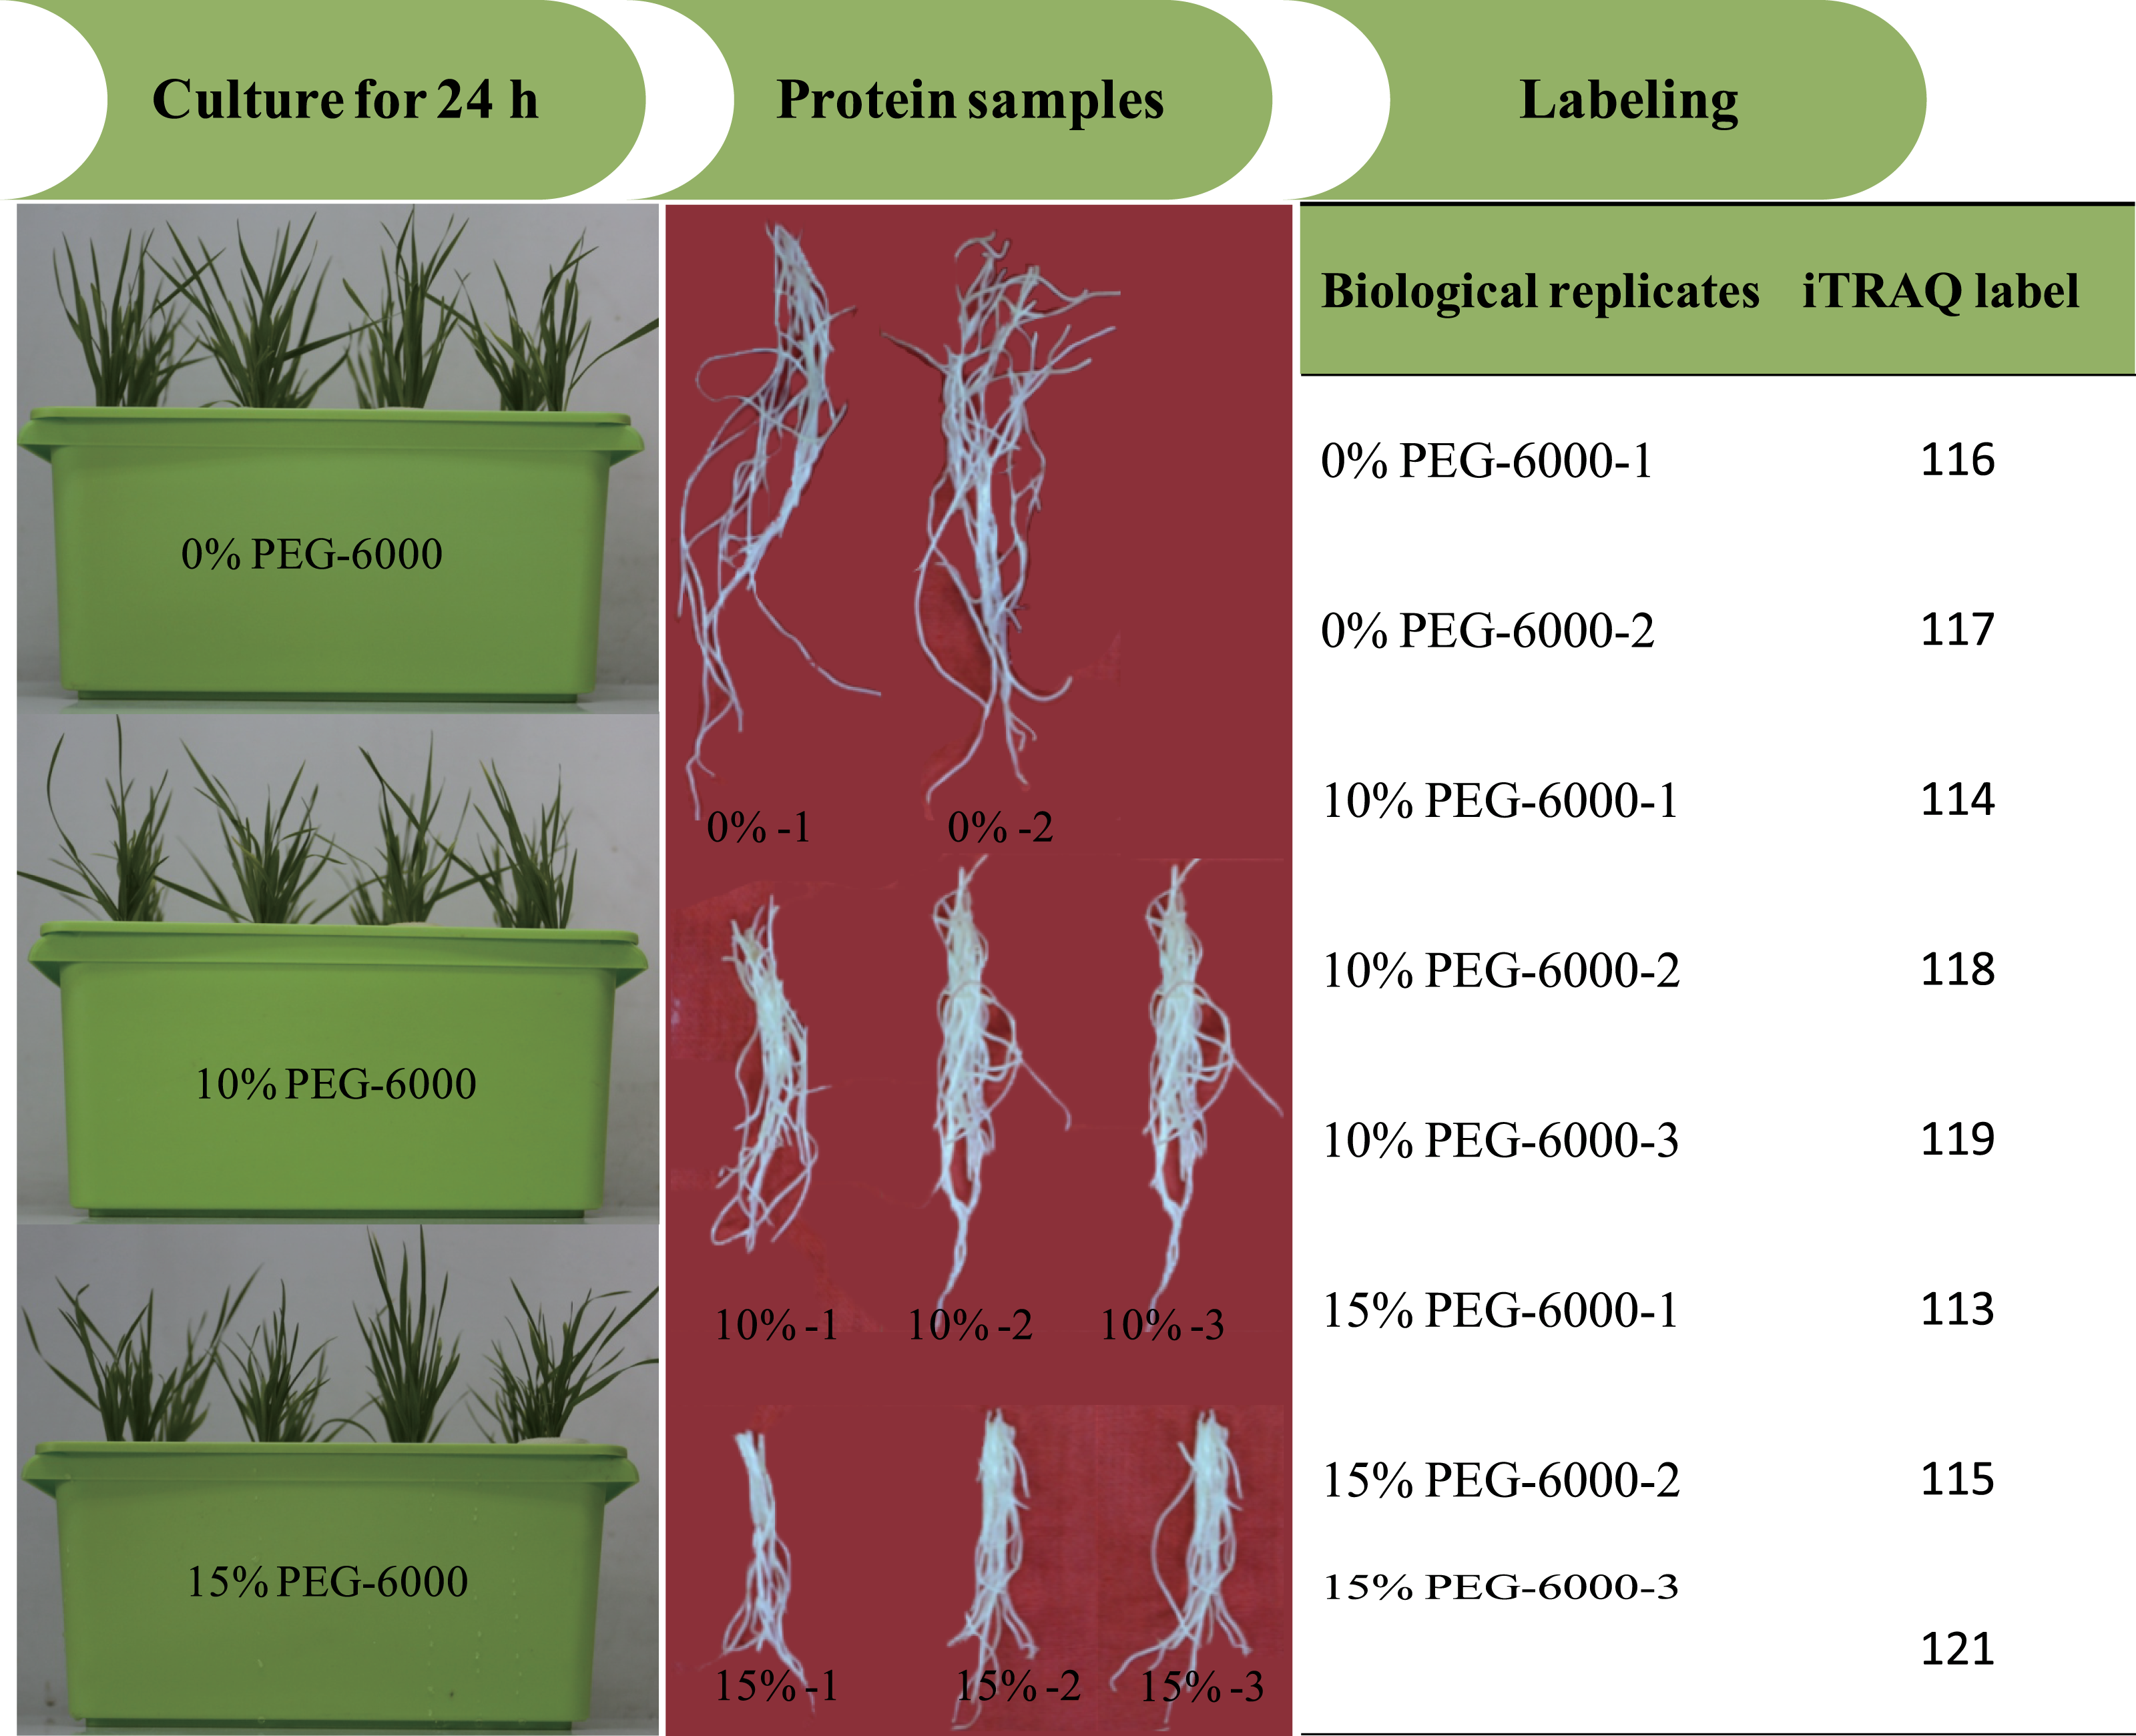
All reagents and buffers for iTRAQ labeling and cleaning were purchased from Applied Biosystems (Foster City, CA, USA). iTRAQ labeling was performed according to the manufacturer’s instructions. The proteins were dissolved, denatured, alkylated and digested with trypsin at 37 °C overnight. And 100 µg of the digestion product were thawed and reconstituted in 150 µL of isopropanol, and subsequently labelled with iTRAQ reagent (Applied Biosystems). The iTRAQ experiment just contained two experiment settings of four-plex and eight-plex, which could only analyze four or eight samples once time respectively. In previous studies, researchers had performed the eight-plex iTRAQ experiments using the setting of 3:3:2 and 3:2 (Longworth et al., 2012; Ge et al., 2014). In the present study, the experiment setting of 3:3:2 (eight-plex) was selected for this analysis. The three biological replicates of roots exposed to 15% PEG-6000 treatment were labeled with 113, 115 and 121 tags, the three biological replicates of roots exposed to 10% PEG-6000 treatment were labeled with 114, 118 and 119 tags, and the two biological replicates of control (0% PEG-6000) were labeled with 116 and 117 tags (Fig. 1). Subsequently, the labeled samples were pooled in equal ratios. The labeled peptide mixture was dissolved in 100 µL mobile of phase A (2% (v/v) acetonitrile, 98% (v/v) ddH2O, pH 10) and subsequently centrifuged at 14,000 g for 20 min. The supernatant was carefully collected and further loaded onto the column for stepwise elution through the injection of mobile phase B (98% acetonitrile, 2% ddH2O, pH 10) with a 700 µl/min flow rate. The fractions were eluted (1.8 min each) and collected using step gradients of mobile phase B.
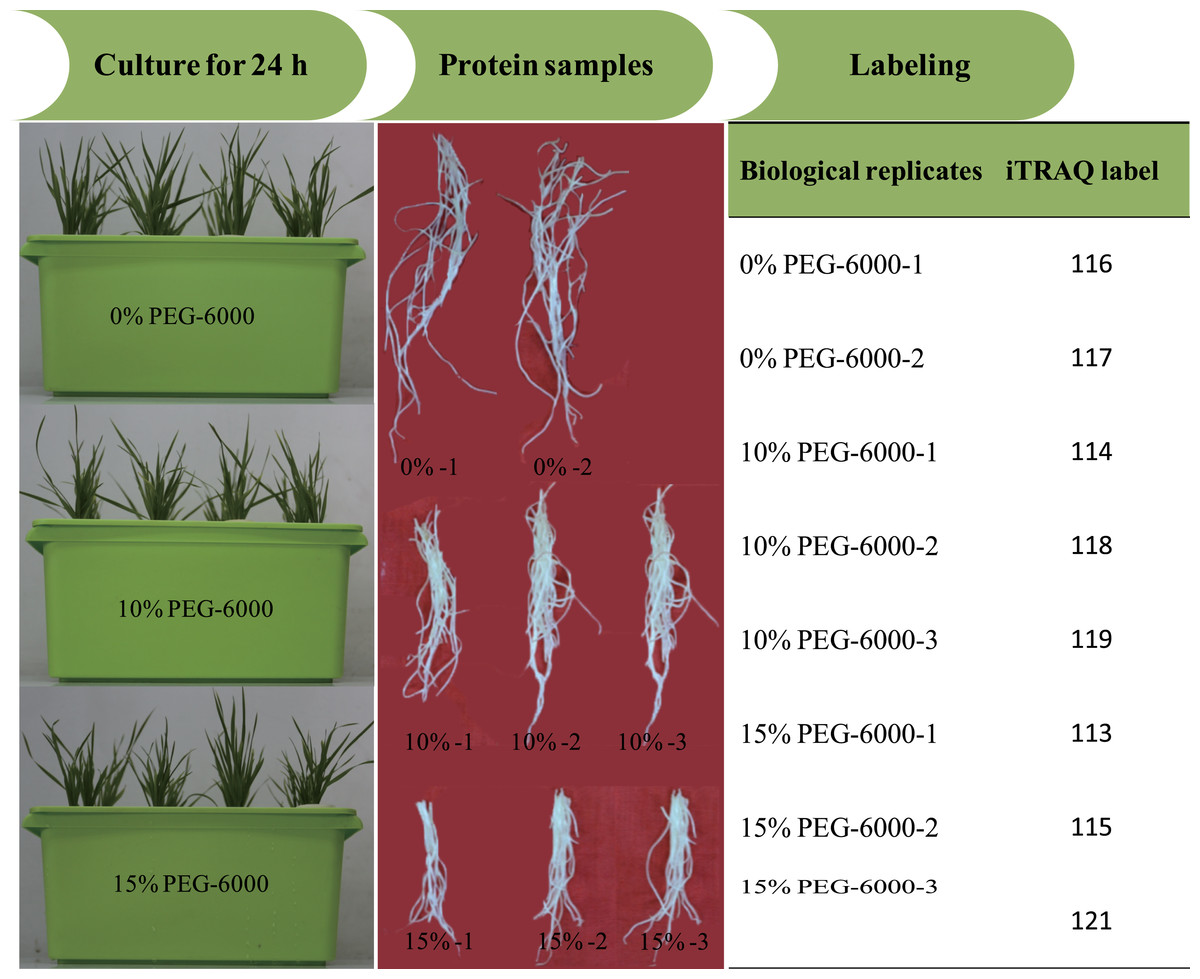
Figure 1: The illustration of the experimental design.
Analysis using Q-Exactive mass spectrometer
The fractionated peptides were analyzed using a Q-Exactive mass spectrometer (Thermo Fisher Scientific, Waltham, MA, USA) fitted with a nano-liquid chromatography system (Thermo Scientific EASY-nLC 1000 System). A binary solvent system comprising 99.9% H2O, 0.1% formic acid (phase A) and 99.9% ACN, 0.1% formic acid (phase B) were used to elute the peptides. The following linear gradient was used: 4–8% B in 5 min, 8–35% B in 35 min, 35–90% B in 5 min, washed at 95% B for 6 min, and equilibrated with 4% B for 8 min at a 350 nL/min flow rate. The eluent was further introduced to a Q-Exactive mass spectrometer via an EASY-Spray ion source. The following source ionization parameters were used: 2.1 kV spray voltage, capillary temperature 250 °C and 100 V declustering potential.
A Top 20 data-dependent mode with automatic switching between MS and MS/MS was used in mass spectrometer. Full-scan MS mode (350–1,800 m/z) was performed at a resolution of 70,000 with 1 × 10⁶ ions automatic gain control (AGC) target and a maximum ion transfer (IT) of 60 ms. The precursor ions were fragmented using high-energy collisional dissociation (HCD) and subjected to MS/MS scans with the following parameters: 17,500 resolution, AGC with 5 × 10⁶ ions, maximum IT with 70 ms, 5,000 intensity threshold and 29% normalized collision energy.
Sequence database searching and data analysis
Mascot 2.2 (Matrix Science, London, UK) and Proteome Discoverer 1.4 (Thermo Electron, San Jose, CA) were used for processing the raw data of MS/MS spectra and completing database search and a quantitative analysis against a non-redundant protein database of hexaploid wheat genome, which had been generated by Mayer et al. (2014) and provided as File S1. For database searching, the following parameters were used: trypsin enzyme, two missed cleavages at maximum, 20 ppm of peptide mass tolerance, 0.1 Da of fragment mass tolerance, carbamidomethylation of cysteine as fixed modification, methionine oxidation and iTRAQ 8 plex labels at the N-termini and at lysine side chains as dynamic modification. For protein identification, only peptides with significant scores (iron score ≥ 35) at 99% confidence interval were used, and 2,228 proteins were finally got, of which 1,391 proteins with two or more peptides were considered for further analysis. The protein fold-change was obtained based on the quantity comparison between each treatment sample and the average level of control. For statistical analysis, the average fold-change ≥ 95% confidence interval and P-values ≤ 0.05, which was got by the t-test with different repeat times in two groups, were considered significant. The sequence data of the DEPs was searched against the UniProt database for protein function, and the BlastKOALA website (http://www.kegg.jp/blastkoala/) was used for the KEGG analysis with an E-value of 1 × 10⁻⁵.
The mass spectrometry data have been deposited to the iProx database with the accession number: IPX00075800.
Phylogenetic analysis of glutathione S-transferases (GSTs)
Multiple amino acid sequence alignment of GSTs was performed using ClastalW. An unrooted phylogenetic tree of these GST protein sequences was constructed using the neighbor-joining method with MEGA 5.10 software, and a bootstrap analysis with 1,000 replicates was performed to assess the significance of each node.
Results and Discussion
The effects of osmotic stress on wheat seedlings
To analyze the effects of osmotic stress, five different osmotic treatments (0%, 5%, 10%, 15% and 20% PEG-6000) were performed on wheat seedlings at the two-leaf stage. After cultivation for 24 h, the plant height and main root length were severely restrained by osmotic stress, declining to 8.76 and 8.74 cm from 11.88 and 10.13 cm, respectively (Figs. 2A and 2B). The RWC of whole plants was measured, and this value was significantly different between the control and osmotic treatment samples. The RWC was 89.92% after a 0% PEG-6000 treatment and decreased to 81.44% after a 15% PEG-6000 treatment. However, when the PEG-6000 treatment increased to 20% from 15%, the RWC only decreased 0.48%, and this difference was not statistically significant (Fig. 2C). Based on these results, we found that treatment with 10% PEG-6000 for 24 h should be considered as mild osmotic stress (MOS), while treatment with 15% PEG-6000 for 24 h should be considered as severe osmotic stress (SOS).
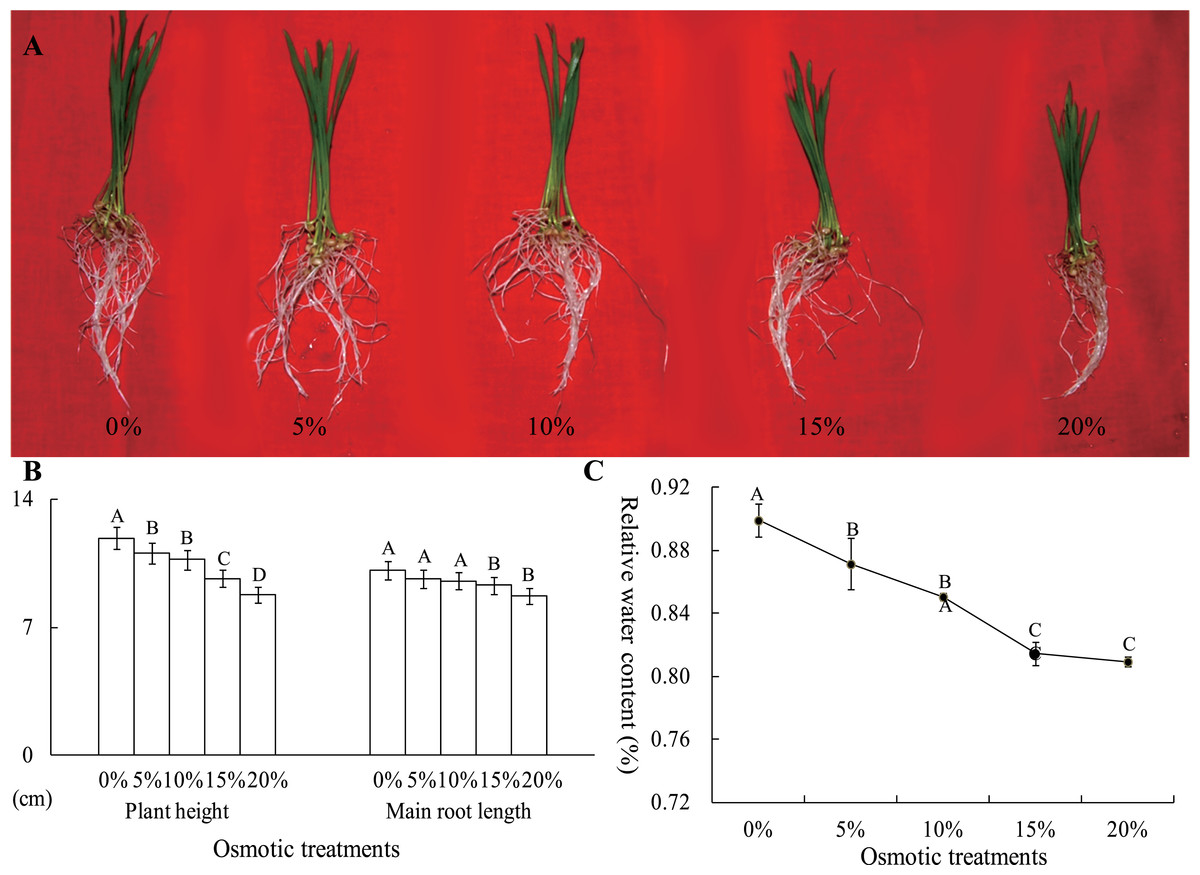
Figure 2: The plant height, main root length (B) and RWC of wheat seedling at the two-leaf stage, which were exposed to five osmotic stresses, were measured to assess the effects of osmotic.
The data was analyzed by one-way ANOVA analysis, and the LSD method was used for multiple comparisons. The significant difference is represented by capital letters at 0.01 level.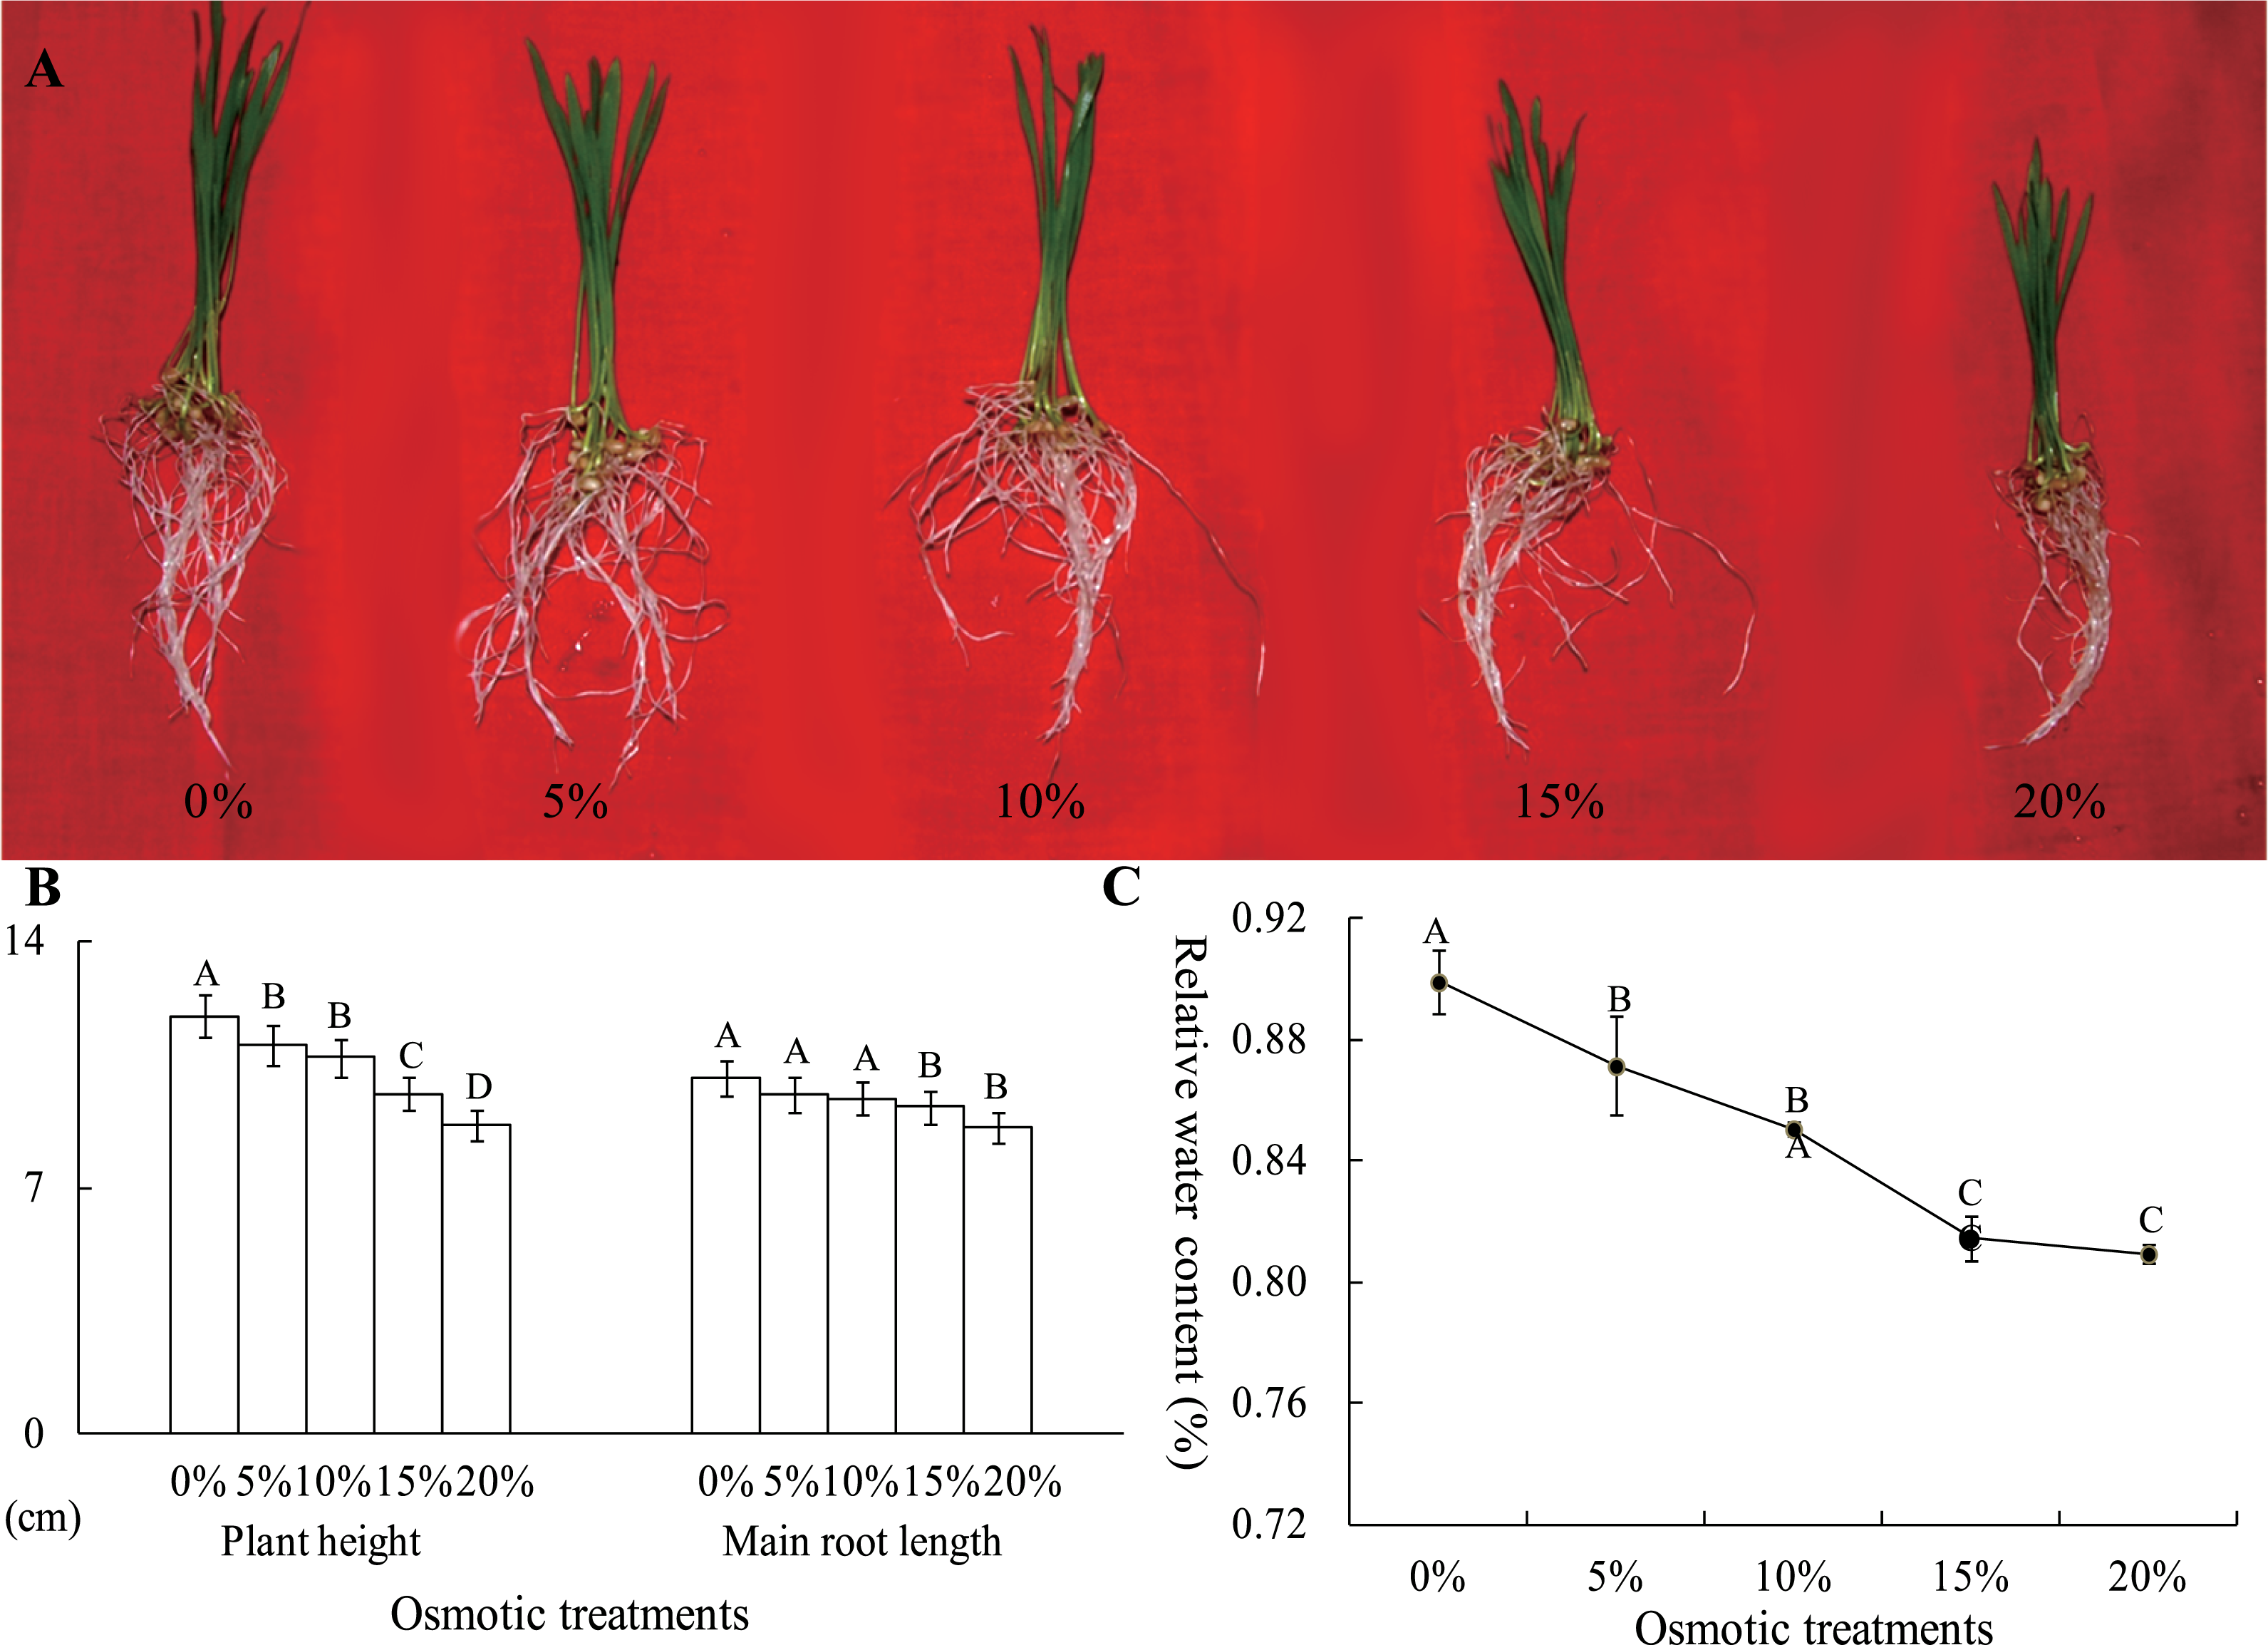
Identification of root proteins under osmotic stress using iTRAQ
As roots directly sense osmotic stress, total protein was extracted from the root samples of wheat plants under control, MOS and SOS conditions (two, three and three replicates, respectively). The protein expression profiles of these eight root samples were analyzed in one 8-plex iTRAQ experiment. A total of 150,440 triggered MS/MS spectra were identified, and 2,228 proteins were identified by 7,392 peptides (File S2), and about 45.17% of the identified proteins included at least two unique peptides.
The DEPs between osmotic stress and control
The 95% confidence interval of each group distribution was constructed to analyze the maximum scope of difference within group, and the results showed that the maximum scope is 0.855–1.17 (File S2). To insure the difference between groups larger than the difference within group, a fold-change of more than 1.2 (more than 1.2 or less than 0.833) was selected as one of the parameters for DEPs selection. To enhance the confidence of DEPs, the following parameters were also considered: each protein with two or more peptides, at least two times differential expression among three repetition and a significance level of p < 0.05. Based on these four parameters, a total of 81 DEPs were identified, including 34 DEPs between the MOS and control samples and 64 DEPs between the SOS and control samples. Among these DEPs, 17 DEPs were common in the MOS and SOS samples compared with the control samples, 30 DEPs were down-regulated, and 51 DEPs were up-regulated under osmotic stress.
Analysis of the DEPs between osmotic stress and control
Among these DEPs, the molecular function information for 69 DEPs was identified. Many proteins had functions in processes, such as carbohydrate metabolism, protein metabolism, phytohormones responsive etc., and the plant protection system played important roles in the wheat roots response to osmotic stress (Tables 1 and 2).
| Protein name | Protein function | Peptides | Coverage | Fold-change between MOS and control | P-value |
|---|---|---|---|---|---|
| Protein Metabolism | |||||
| Traes_2BS_7700613D4 | 40S ribosomal protein | 2 | 22.31 | 1.24 ± 0.05 | 0.012 |
| Traes_7AL_65F481DB9 | 40S ribosomal protein | 2 | 13.82 | 1.40 ± 0.15 | 0.044 |
| Traes_5DL_9D4164773 | 60S ribosomal protein | 2 | 8.20 | 1.21 ± 0.04 | 0.010 |
| Traes_1AL_D20D648FD | 60S ribosomal protein | 4 | 36.17 | 1.29 ± 0.11 | 0.047 |
| Traes_2AL_396E0F5A3 | 60S ribosomal protein | 2 | 15.03 | 1.51 ± 0.14 | 0.025 |
| Histone Protein | |||||
| Traes_1AS_4CA1A835D1 | Histone H2B | 4 | 50.00 | 1.41 ± 0.09 | 0.015 |
| Traes_4BL_96E367077 | Histone H2A | 3 | 21.33 | 1.46 ± 0.17 | 0.042 |
| CarhohydrateMetabolism | |||||
| Traes_7DS_529BAB150 | Sucrose synthase | 15 | 22.00 | 1.27 ± 0.10 | 0.040 |
| Traes_3B_BC152C5D7 | Glycosyltransferase | 2 | 6.18 | 1.23 ± 0.05 | 0.016 |
| Traes_2AL_AEB11A672 | Beta-glucosidase | 7 | 15.93 | 1.26 ± 0.09 | 0.036 |
| Traes_4AL_8845F411B | UDP-glucose 6-dehydrogenase | 12 | 31.03 | 0.70 ± 0.07 | 0.016 |
| Traes_7BS_DE33B2B49 | Fructokinase | 2 | 8.79 | 1.27 ± 0.09 | 0.037 |
| Traes_4AL_4B09F91AE | Alcohol dehydrogenase | 6 | 24.74 | 0.77 ± 0.02 | 0.003 |
| Phytohormones | |||||
| Traes_4DS_E2055C83D | Abscisic stress-ripening protein | 3 | 56.52 | 2.53 ± 0.26 | 0.009 |
| Antioxidant Protection Proteins | |||||
| Traes_1AL_46245C5D5 | Peroxidase | 2 | 42.47 | 0.79 ± 0.04 | 0.010 |
| Traes_2BS_9C71D6F5F | Peroxidase | 2 | 7.81 | 0.80 ± 0.03 | 0.007 |
| Traes_1DL_7BCE5B151 | Glutathione S-transferase | 3 | 20.37 | 1.60 ± 0.16 | 0.023 |
| Traes_1AL_CC4CF4E71 | Glutathione S-transferase | 2 | 11.86 | 1.59 ± 0.15 | 0.020 |
| Traes_4AS_36CB7931F | Glutathione S-transferase | 2 | 14.75 | 1.38 ± 0.08 | 0.015 |
| Traes_XX_BEAB3FB5A | Glutathione S-transferase | 2 | 7.12 | 1.26 ± 0.06 | 0.018 |
| Traes_6BL_8360C77EF | Glutathione peroxidase | 2 | 16.28 | 1.21 ± 0.03 | 0.006 |
| Other drought resistance proteins | |||||
| Traes_XX_B7AF82F34 | ATP synthase subunit beta | 6 | 20.00 | 1.32 ± 0.08 | 0.019 |
| Traes_2AL_B7FC2C090 | Wali7 protein | 3 | 15.81 | 1.24 ± 0.01 | 0.001 |
| Traes_4AL_198AD99FF | Clathrin heavy chain | 9 | 15.15 | 1.27 ± 0.10 | 0.045 |
| Traes_1AL_1538AC680 | Nucleoside diphosphate kinase | 3 | 11.98 | 1.27 ± 0.04 | 0.009 |
| Traes_4BL_B5BF83119 | Hemoglobin Hb1 | 6 | 46.01 | 1.58 ± 0.08 | 0.006 |
| Traes_2DL_47E335BA6 | NAD(P)H-dependent 6′-deoxychalcone synthase | 2 | 24.19 | 1.34 ± 0.10 | 0.028 |
| Traes_XX_F9BB1AA7A | 6-phosphogluconate dehydrogenase | 6 | 21.31 | 0.79 ± 0.06 | 0.031 |
| Traes_1BL_BEEBE83B7 | Cysteine proteinase inhibitor | 2 | 22.06 | 0.69 ± 0.02 | 0.001 |
| Traes_5DL_A6B7B0525 | Peptidyl-prolyl cis-trans isomerase | 2 | 16.07 | 0.81 ± 0.04 | 0.012 |
| Traes_7AS_8E6B88A80 | Pathogenesis-related protein | 4 | 37.27 | 0.80 ± 0.06 | 0.033 |
| Traes_2AL_800303D8D | Pathogenesis-related protein | 5 | 42.24 | 0.80 ± 0.07 | 0.042 |
| Traes_3DL_3D1319ECF | Acyl-(Acyl-carrier-protein) desaturase | 2 | 10.38 | 0.58 ± 0.07 | 0.010 |
| Uncharacterized proteins | |||||
| Traes_7BL_BE36675C8 | Uncharacterized protein | 2 | 8.82 | 0.74 ± 0.01 | 0.001 |
| Protein name | Protein function | Peptides | Coverage | Fold-change between SOS and control | P-value |
|---|---|---|---|---|---|
| Protein Metabolism | |||||
| Traes_2BS_7700613D4 | 40S ribosomal protein | 2 | 22.31 | 1.25 ± 0.05 | 0.013 |
| Traes_7AL_65F481DB9 | 40S ribosomal protein | 2 | 13.82 | 1.45 ± 0.14 | 0.031 |
| Traes_3AL_0A1239316 | Glycine dehydrogenase | 2 | 5.82 | 0.83 ± 0.01 | 0.001 |
| Traes_2DS_64EC7E533 | Eukaryotic translation initiation factor 3 | 3 | 10.53 | 0.82 ± 0.07 | 0.045 |
| Traes_XX_B2924FB2E | Eukaryotic translation initiation factor 3 | 2 | 10.71 | 0.81 ± 0.01 | 0.001 |
| Traes_4BL_E2E2C4E1D | Adenylate kinase 1 | 2 | 13.85 | 0.81 ± 0.03 | 0.006 |
| Traes_XX_7DC2CED29 | E3 ubiquitin-protein ligase | 2 | 13.75 | 1.23 ± 0.07 | 0.031 |
| Histone Protein | |||||
| Traes_4BL_96E367077 | Histone H2A | 3 | 21.33 | 1.49 ± 0.14 | 0.024 |
| CarhohydrateMetabolism | |||||
| Traes_3B_BC152C5D7 | Glycosyltransferase | 2 | 6.18 | 1.38 ± 010 | 0.021 |
| Traes_4AL_82AB2E772 | Beta-fructofuranosidase | 7 | 18.10 | 0.83 ± 0.02 | 0.004 |
| Traes_4DS_084803084 | Beta-glucosidase | 2 | 5.52 | 0.80 ± 0.02 | 0.004 |
| Traes_3B_B8697F82E | Glucan endo-1,3-beta-glucosidase | 4 | 16.87 | 0.82 ± 0.06 | 0.034 |
| Traes_4AL_8845F411B | UDP-glucose 6-dehydrogenase | 12 | 31.03 | 0.73 ± 0.04 | 0.006 |
| Traes_4BS_11DDF29B31 | Xylanase inhibitor protein | 2 | 9.02 | 0.70 ± 0.06 | 0.014 |
| Traes_4DL_A80B33149 | Beta-amylase | 3 | 10.89 | 0.74 ± 0.07 | 0.025 |
| Traes_1DL_FDF182BF9 | Hexokinase | 6 | 20.88 | 1.37 ± 0.07 | 0.012 |
| Traes_4AL_E6D679339 | Alcohol dehydrogenase | 3 | 10.09 | 1.23 ± 0.08 | 0.035 |
| Traes_4AL_4B09F91AE | Alcohol dehydrogenase | 6 | 24.74 | 0.80 ± 0.07 | 0.041 |
| Phytohormones | |||||
| Traes_4BS_BB26E5EE1 | Abscisic stress-ripening protein | 3 | 56.12 | 2.39 ± 0.14 | 0.003 |
| Traes_4DS_E2055C83D | Abscisic stress-ripening protein | 3 | 56.52 | 2.37 ± 0.24 | 0.010 |
| Antioxidant Protection Proteins | |||||
| Traes_2DS_E3F0742FF | Peroxidase | 2 | 24.36 | 0.82 ± 0.04 | 0.018 |
| Traes_2DS_2CCCA54C1 | Peroxidase | 13 | 56.83 | 0.78 ± 0.07 | 0.034 |
| Traes_6AS_621A7A571 | Peroxidase | 4 | 25.71 | 0.78 ± 0.03 | 0.008 |
| Traes_7DL_D99ED7064 | Peroxidase | 7 | 26.39 | 0.77 ± 0.07 | 0.032 |
| Traes_2DS_090AF6B73 | Peroxidase | 3 | 14.86 | 0.78 ± 0.01 | 0.001 |
| Traes_2AL_520618712 | Peroxidase | 7 | 24.85 | 1.20 ± 0.05 | 0.018 |
| Traes_1DL_7BCE5B151 | Glutathione S-transferase | 3 | 20.37 | 2.04 ± 0.02 | 0.000 |
| Traes_1AS_D25875432 | Glutathione S-transferase | 4 | 20.44 | 1.32 ± 0.03 | 0.002 |
| Traes_1AL_CC4CF4E71 | Glutathione S-transferase | 2 | 11.86 | 1.92 ± 0.33 | 0.040 |
| Traes_1DS_FD8511876 | Glutathione S-transferase | 5 | 28.64 | 1.23 ± 0.08 | 0.039 |
| Traes_4AS_36CB7931F | Glutathione S-transferase | 2 | 14.75 | 2.30 ± 0.10 | 0.002 |
| Traes_6AS_A2A2B273C | Glutathione S-transferase | 3 | 12.55 | 1.43 ± 0.07 | 0.009 |
| Traes_1BL_3765A51EC | Glutathione S-transferase | 2 | 10.27 | 1.50 ± 0.15 | 0.030 |
| Traes_XX_BEAB3FB5A | Glutathione S-transferase | 2 | 7.12 | 1.57 ± 0.06 | 0.004 |
| Traes_1DS_EFDF9CB72 | Glutamate-cysteine ligase | 5 | 12.45 | 1.23 ± 0.01 | 0.001 |
| Traes_XX_52CBB24F1 | glutathione reductase (GR) | 6 | 23.10 | 1.25 ± 0.03 | 0.04 |
| Traes_5BL_34593C7D1 | Aldehyde oxidase 3 | 2 | 2.23 | 1.29 ± 0.09 | 0.032 |
| Traes_1AL_5A7E85C4E | Sulfite reductase | 6 | 12.58 | 1.28 ± 0.10 | 0.038 |
| Traes_3B_1962330BB | Oxalate oxidase 2 | 3 | 33.98 | 1.40 ± 0.15 | 0.043 |
| Traes_XX_3D56A9D19 | Monodehydroascorbate reductase | 3 | 11.90 | 0.82 ± 0.01 | 0.001 |
| Other drought resistance proteins | |||||
| Traes_5BL_B92355534 | Germin-like protein | 3 | 26.41 | 1.27 ± 0.03 | 0.004 |
| Traes_4AL_198AD99FF | Clathrin heavy chain | 9 | 15.15 | 1.28 ± 0.11 | 0.049 |
| Traes_4BL_B5BF83119 | Hemoglobin Hb1 | 6 | 46.01 | 1.89 ± 0.11 | 0.005 |
| Traes_2DL_47E335BA6 | NAD(P)H-dependent 6′-deoxychalcone synthase | 2 | 24.19 | 1.46 ± 0.12 | 0.020 |
| Traes_2AL_141C6B5E4 | ATP synthase subunit alpha | 6 | 10.59 | 1.36 ± 0.03 | 0.003 |
| Traes_XX_175EF4A84 | Deoxymugineic acid synthase1 | 2 | 10.49 | 1.28 ± 0.06 | 0.013 |
| Traes_XX_6A9FEF618 | ATP sulfurylase | 5 | 16.17 | 1.28 ± 0.06 | 0.016 |
| Traes_5BL_17F1F28B6 | Wali7 protein | 2 | 13.08 | 1.34 ± 0.09 | 0.024 |
| Traes_XX_F9BB1AA7A | 6-phosphogluconate dehydrogenase | 6 | 21.31 | 0.82 ± 0.03 | 0.010 |
| Traes_1BL_BEEBE83B7 | Cysteine proteinase inhibitor | 2 | 22.06 | 0.82 ± 0.04 | 0.017 |
| Traes_4BS_9F3A928B7 | Low temperature-responsive RNA-binding protein | 2 | 53.03 | 0.76 ± 0.03 | 0.007 |
| Traes_XX_903D8ADBC | Fasciclin-like protein FLA15 | 2 | 14.48 | 0.81 ± 0.04 | 0.013 |
| Uncharacterized proteins | |||||
| Traes_7BL_BE36675C8 | Uncharacterized protein | 2 | 8.82 | 0.75 ± 0.02 | 0.002 |
| Traes_5DL_43046228D | Uncharacterized protein | 5 | 15.97 | 1.22 ± 0.00 | 0.000 |
| Traes_3B_67E790B47 | Uncharacterized protein | 2 | 3.17 | 1.20 ± 0.04 | 0.010 |
| Traes_6BS_4EED05084 | Uncharacterized protein | 3 | 14.91 | 1.74 ± 0.19 | 0.022 |
| Traes_4AL_6A515079C | Uncharacterized protein | 2 | 9.52 | 0.78 ± 0.03 | 0.008 |
| Traes_1BL_BF3813A4B | Uncharacterized protein | 2 | 12.86 | 1.24 ± 0.02 | 0.003 |
| Traes_2BL_B09F6D195 | Uncharacterized protein | 5 | 11.76 | 1.22 ± 0.02 | 0.004 |
| Traes_3B_4490CECAF | Uncharacterized protein | 2 | 6.74 | 1.21 ± 0.03 | 0.006 |
| Traes_7AS_C87C2FF27 | Uncharacterized protein | 3 | 10.40 | 1.24 ± 0.05 | 0.017 |
| Traes_6BS_E96E17B28 | Uncharacterized protein | 2 | 30.00 | 1.47 ± 0.14 | 0.026 |
| Traes_XX_6DDA59584 | Uncharacterized protein | 2 | 5.94 | 1.34 ± 0.03 | 0.050 |
| Traes_XX_7F3775F4C | Uncharacterized protein | 3 | 8.97 | 0.77 ± 0.09 | 0.048 |
Protein metabolism
Osmotic stress greatly impacted the variety and quantity of expressed proteins in plants. The ribosome is a large complex comprising 40S subunit and 60S subunits, and this complex is responsible for protein synthesis from mRNA. Proteome analysis of the wheat roots found three 60S ribosomal proteins and two 40S ribosomal proteins, which are important components of the ribosome, were up-regulated in the roots under osmotic stress compared with control. In addition, the glycine dehydrogenase, which degrade the glycine, showed down-regulate. These results indicate that the process of translation is more active under osmotic stress in response to the adverse environment.
However, two eukaryotic translation initiation factors, which promote the assembly of the ribosome and initiation code for further translation (You, Coghill & Brown, 2013), were down-regulated, and one E3 ubiquitin-protein ligase, which is involved in ubiquitin mediated proteolysis, was up-regulated under drought stress. These factors do not support functional proteins formation.
Based on the identification of DEPs involved in protein metabolism and the dry weight changes under osmotic stress, we speculated that protein synthesis is more active under osmotic stress, thereby produce a greater variety of proteins to increasing the environmental adaptability in wheat, but the protein quantity is inhibited under osmotic stress.
Histone proteins
The nucleosome is the basic unit of chromatin, comprising approximately 147 bp of DNA and a histone octamer composed involving a (Histone3-Histone4)2 tetramer and two (Histone2A-Histone2B) dimmers (Luger et al., 1997). The results of the iTRAQ analysis revealed the up-regulation of two histone proteins in the roots under osmotic stresses. This finding indicates a high level of chromatin condensation in the roots under osmotic stress, generating transcriptional inertness and a significant decrease in total protein. It consistent with the results of the dry weight result and protein metabolism analysis, which speculate the protein variety is increased and the protein quantity is inhibited under osmotic stress.
Carbohydrate metabolism
Carbohydrates are the primary energy resources for organisms and act as small signaling molecules. Under osmotic stress, water-soluble carbohydrates, such as glucose, fructose, sucrose and fructans, are increased in the stems (Foulkes, Scott & Sylvester-Bradley, 2002; Asseng & Herwaarden, 2003; Ruuska et al., 2006), leaves (Roover et al., 2000) and roots (Roover et al., 2000) to impede water loss in plants. Herein, we also found that the enzymes that catalyze the production of small carbohydrate osmolytes, such as sucrose synthase, glucosidase and glycosyltransferase, were up-regulated except Traes_4DS_084803084 and Traes_3B_B8697F82E, and the enzymes that inhibit the formation of small carbohydrate osmolytes, such as UDP-glucose 6-dehydrogenase and xylanase inhibitor protein, was down-regulated under osmotic stress. This finding indicates that small molecular carbohydrates are produced at significant levels to increase osmotic potential in the roots of wheat under osmotic stress.
Glycolysis is an important metabolic pathway, which would produce energy and carbon skeletons for the primary and secondary metabolites biosynthesis (Cramer et al., 2013). And some previous studies had found that the genes or proteins, involved in glycolysis, would be induced (Rizhsky, Liang & Mittler, 2002; Oh & Komatsu, 2015). In this study, fructokinase, hexokinase and alcohol dehydrogenase, which take part in the pathway of glycolysis, were found to be up-regulated for more energy production under osmotic stress.
Phytohormones responsive
Phytohormones play important roles in the adaption of plants to abiotic stresses. The abscisic acid (ABA)-dependent signaling pathway is one of the most important pathways in the resistance to drought stress in plants, and many important drought- or osmotic-related genes, such as AREB1, AREB2, ABF3, SnRK2, and ABF1, are involved in this pathway (Yoshida, Mogami & Yamaguchi-Shinozaki, 2014). In the present study, two abscisic stress-ripening proteins, which can be induced by ABA and abiotic stress (Golan et al., 2014), were up-regulated in the roots under osmotic stress, suggesting that the ABA signaling pathway is important in the resistance of wheat to osmotic stress.
Plant protection system
Many studies have demonstrated that ROS and cytotoxin would significantly increase under osmotic conditions, which would induce cellular damage in plants. To prevent the damages, plants have generated many plant protection systems to remove ROS and cytotoxins. Here, we found that the proteins involved in ROS scavenging and detoxifying were up-regulated, except some peroxidase.
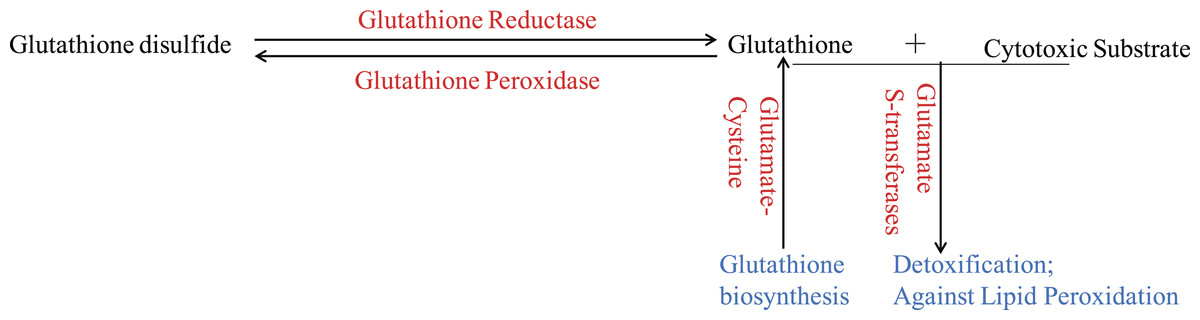
Figure 3: The glutathione system in wheat roots under osmotic stress.
The up-regulated proteins were denoted with red color, and the functions of proteins were denoted with blue color.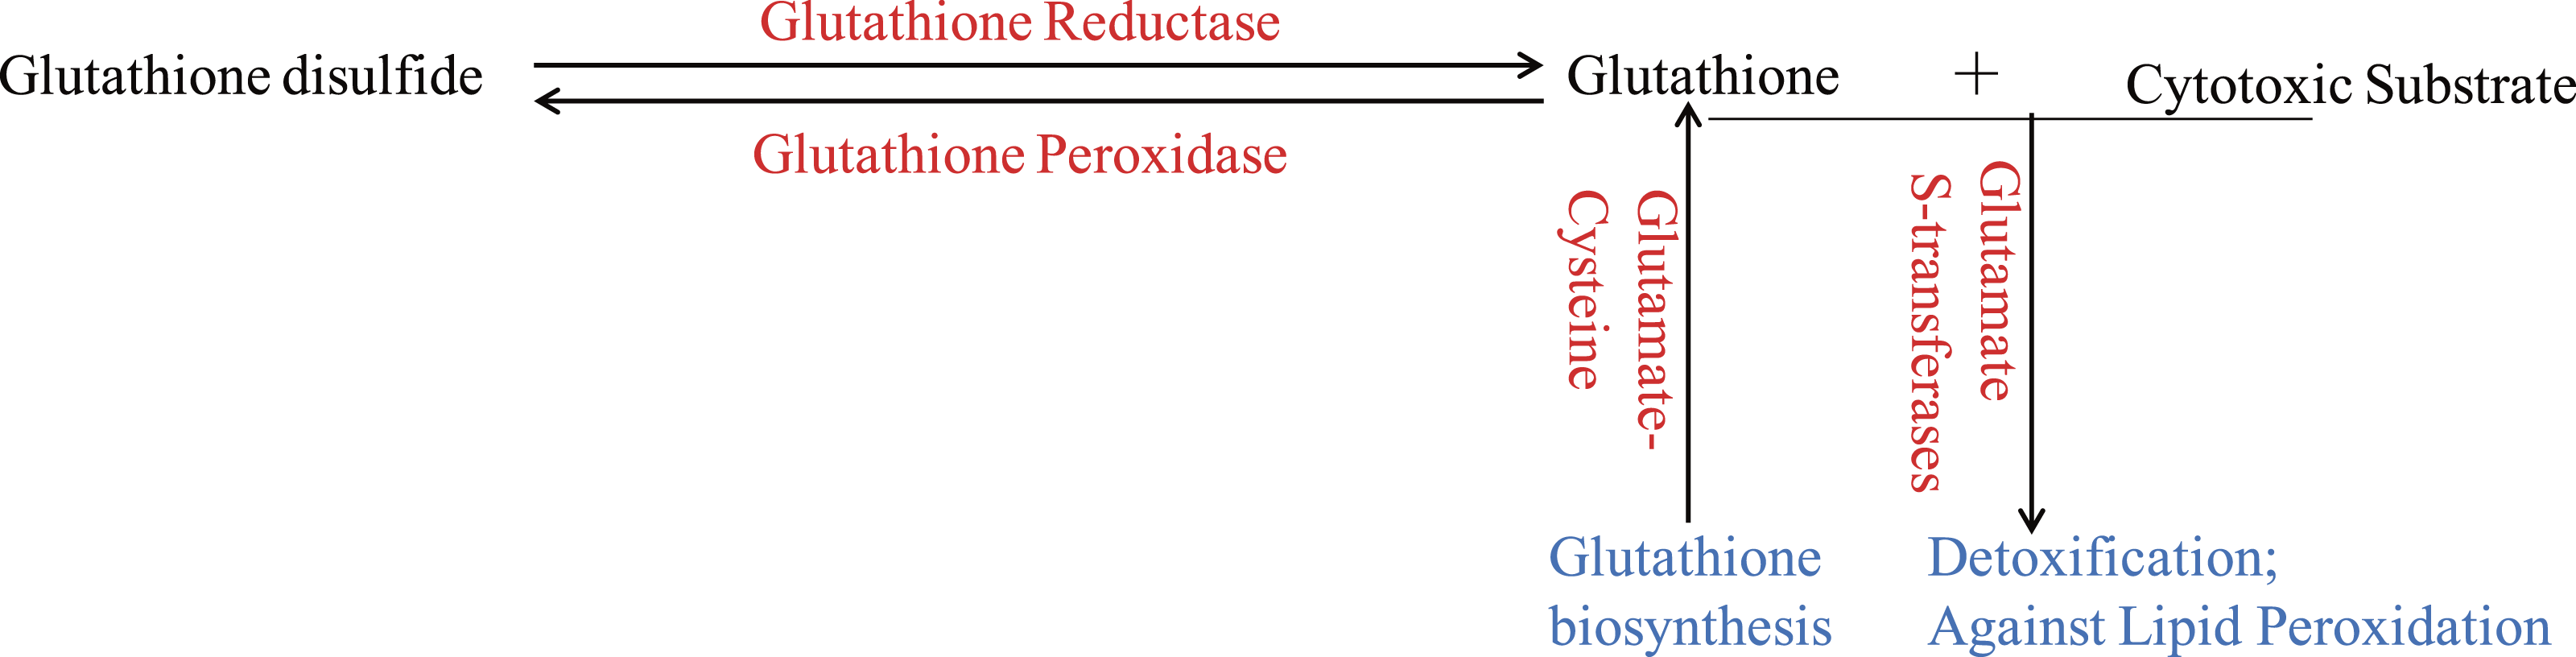
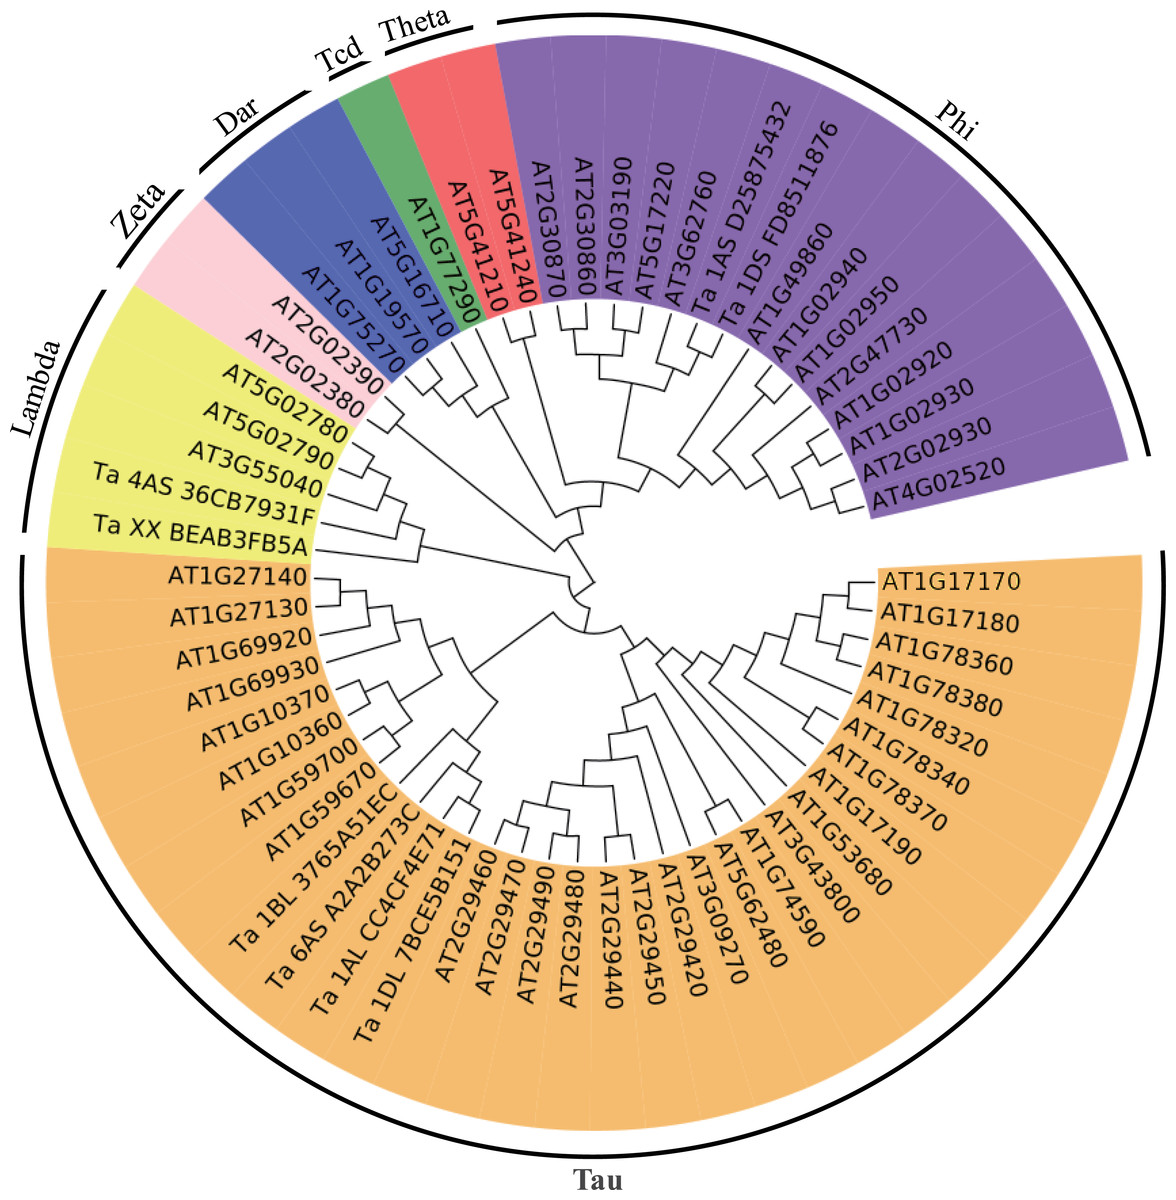
Figure 4: Phylogenetic tree of the GSTs.
The unrooted phylogenetic tree of GSTs from Arabidopsis and the eight differentially expressed GSTs in the current proteome analysis was constructed by the neighbor-joining method using MEGA 5.10 software. The subgroups of the GSTs are distinguished with different colors.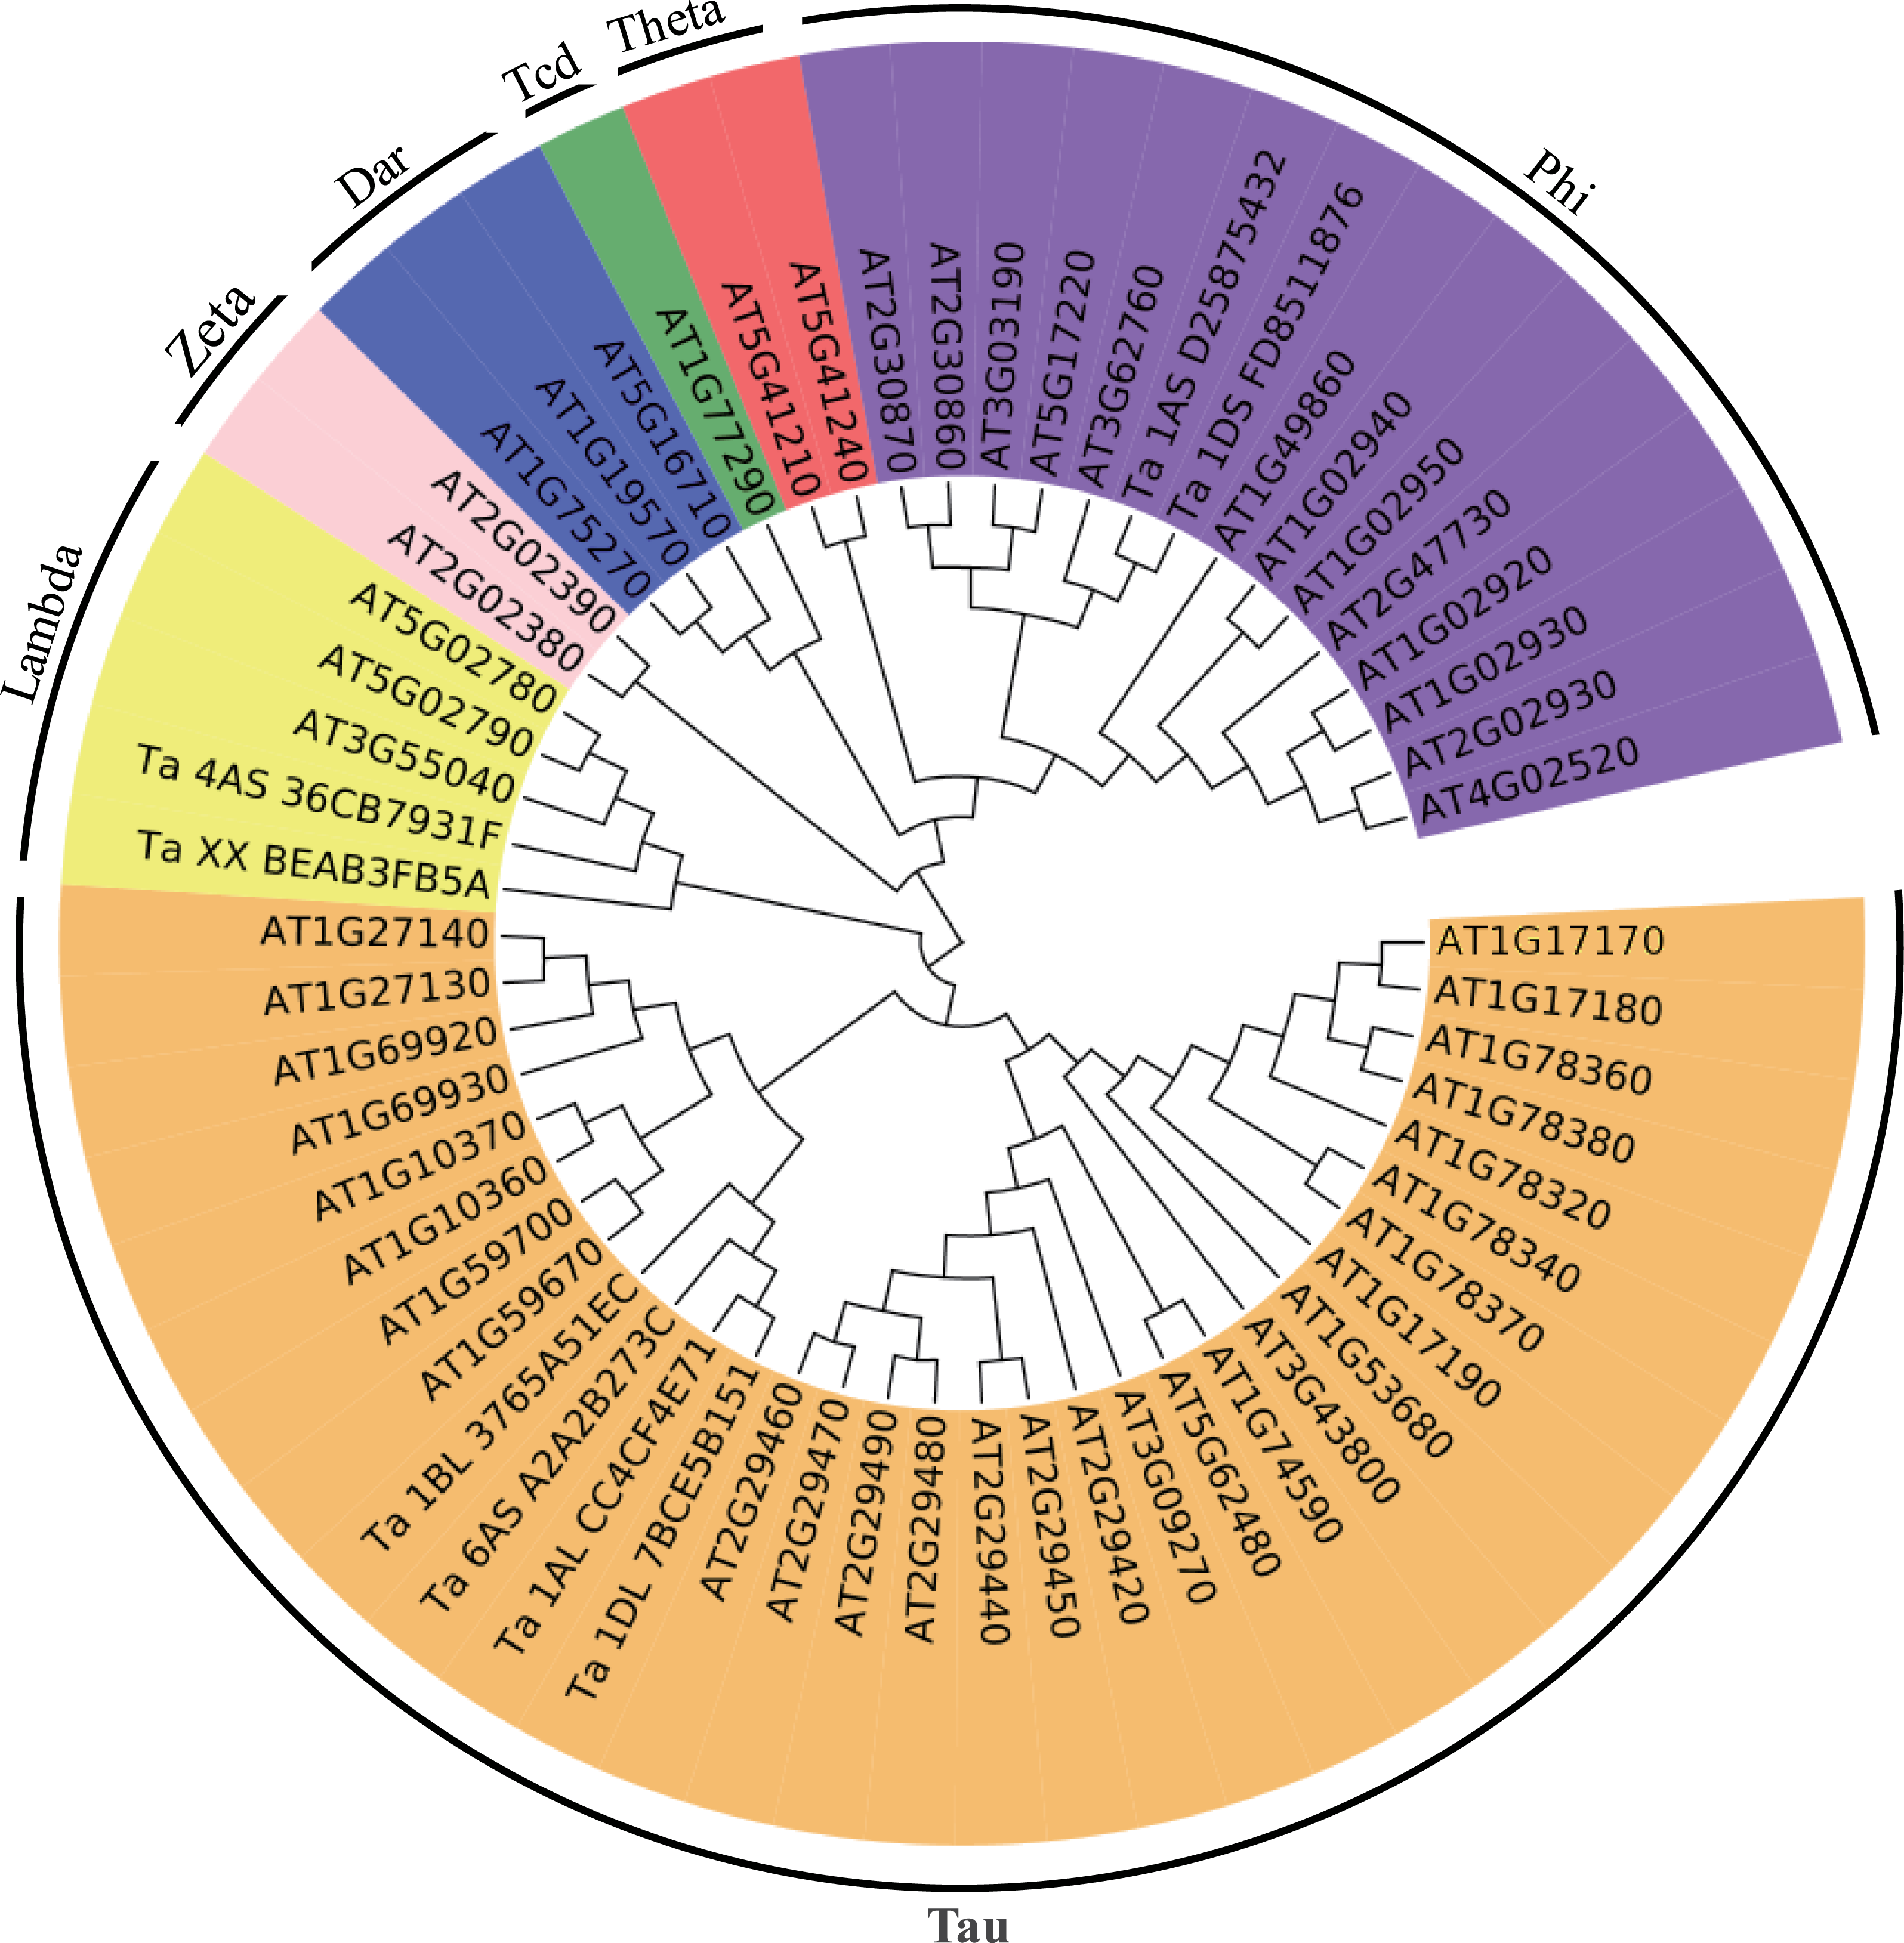
Glutathione (GSH) has multiple functions, such as antioxidant and detoxification, in plants (Noctor et al., 2012). The ROS would be continuous eliminated by GSH-GSSH (Glutathione disulfide) cycle in organism, which depends on glutathione reductase and glutathione peroxidase. And GSTs, which could be induced through different biotic and abiotic stresses, would protect organisms against oxidative damage and lipid peroxidation, and catalyze the conjugation of electrophilic substrates and glutathione to eliminate cytotoxic substrates (Marrs, 1996; Chen et al., 2012; Yang et al., 2001). In the present study, one glutathione reductase and one glutathione peroxidase were found to be up-regulated (Fig. 3), indicating that GSH-GSSH cycle was more active to maintain ROS balance, under osmotic stress. And eight GSTs were also up-regulated to detoxify harmful materials and maintain cell redox homeostasis in plants under osmotic stress (Fig. 3). In addition, one glutamate-cysteine ligase, which catalyzes the first and rate-limiting step of glutathione biosynthesis, was up-regulated (Fig. 3). All these results showed that glutathione system played important roles in protecting organism from damage caused by osmotic stress in wheat roots.
To better understand the evolutionary relationships of these GSTs, an unrooted phylogenetic tree, including AtGSTs and these eight GSTs, was constructed. We identified two GSTs belonging to the Phi family, two GSTs belonging to the Lambda family and four GSTs belonging to the Tau family (Fig. 4). Most GSTs are Phi or Tau, which are plant-specific GSTs and the major phase II enzymes in a common detoxification pathway (Frova, 2003). Transgenic plants over-expressing Tau or Phi GSTs showed high tolerance to herbicides, salt and UV radiation (Karavangeli et al., 2005; Benekos et al., 2010; Jha, Sharma & Mishra, 2011). These results indicate that glutathione play an important role in the detoxification of cytotoxin under osmotic stress in wheat.
In addition, many other DEPs associated with redox reactions, such as reductase and oxidase, were observed under osmotic stress.
Other osmotic resistance proteins
In addition to the proteins mentioned above, twenty DEPs with known functions were also found in this proteome analysis. nine of these DEPs were down-regulated under osmotic stress, including cysteine proteinase inhibitor, adenylate kinase etc. Eleven of these DEPs were up-regulated under osmotic stress, including ATP synthase subunit alpha, Wali7 protein etc.
Conclusions
In the present study, we used iTRAQ to comprehensively study the protein expression profile in the root of wheat under osmotic stress. A total of 2,228 expressed proteins were identified. Among these, 81 were DEPs associated with protein metabolism, carbohydrate metabolism, phytohormones, plant protection system and other functions. These findings help clarify the response to osmotic stress in wheat and provide additional information for future studies of the mechanism of osmotic resistance in wheat.